

Submitted:
10 September 2025
Posted:
11 September 2025
You are already at the latest version
Abstract
This study presents the development of a portable DOBI meter prototype designed for the rapid, low-cost evaluation of crude red palm oil (RPO) quality. The device employs two narrow-spectrum LEDs (UV at 269 nm and visible at 446 nm) as light sources, paired with a broadband photodiode (PD) detector to measure light absorption in a quartz cuvette containing hexane-diluted oil samples. Dedicated LED driver circuits, a PD receiver module, and microcontroller-based data acquisition and display systems were integrated into a compact enclosure. Calibration procedures involved the measurement of LED emission spectra and PD responses, followed by standard curve generation using known RPO concentrations. Results from the DOBI meter were validated against a commercial spectrophotometer (Merck Prove 600), demonstrating high accuracy with less than 5% deviation. Further analysis of RPO extracted from microwave-treated mesocarps showed consistent DOBI values and carotenoid concentrations across both instruments. The developed device offers a reliable, accessible alternative for assessing palm oil quality, particularly in field or small-scale industrial settings.
Keywords:
red palm oil
; LED
; PD
; photometer
; DOBI
; carotenoid concentration
1. Introduction
Red palm oil, as illustrated in Figure 1, is derived from the mesocarp of the oil palm fruit (Elaeis guineensis) [1,2,3,4]. It is a rich source of valuable phytochemicals, including carotenoids, vitamin E, phytosterols, coenzyme Q10, polyphenols, and phenolic acids. Among these, carotenoids are particularly important due to their antioxidant properties and their role as precursors for vitamin A biosynthesis. These compounds support visual health, enhance visual acuity, and help reduce the risk of cardiovascular diseases. Vitamin E, comprising both tocopherols and tocotrienols, also plays a vital role through its anti-inflammatory properties and contributions to neuroprotection, cardioprotection, hepatoprotection, and anticancer activity.
Red palm oil is produced at various scales—industrial, community, and laboratory levels [4,5,6,7,8]. In industrial settings, it is refined from crude palm oil using specialized processes aimed at maximizing the retention of carotenoids and vitamin E. In contrast, community-level production, especially in African countries, typically involves boiling the palm fruit followed by mechanical pounding and oil extraction [8].
Since 2007, laboratory research in Malaysia, Indonesia, and Thailand has explored the use of microwave technology for red palm oil production. This technique employs rapid heating to inactivate lipase enzymes, rupture oil-containing cells, and facilitate the release of triglycerides from the mesocarp fibers. The resulting oil is characterized by low free fatty acid (FFA) content and high concentrations of carotenoids and vitamin E [9,10,11,12,13,14].
The chemical composition of red palm oil is typically analyzed using UV-visible spectrophotometry [15,16,17,18,19,20,21,22,23,24,25], which measures the absorption of light by specific compounds. This method helps determine the deterioration of bleachability index (DOBI) and carotenoid content. Each chemical constituent exhibits characteristic absorbance patterns, and the absorbance level is proportional to its concentration. Traditional UV-visible spectrophotometers, which use gas discharge tubes as light sources and sensors capable of detecting a wide range of wavelengths, are effective but often expensive, complex, and require significant maintenance.
In recent years, light-emitting diode (LED) and photodiode (PD) technologies have emerged as promising alternatives to conventional light sources in spectrophotometry [26,27,28,29,30,31,32,33,34,35,36,37,38,39,40,41,42,43,44,45,46,47,48]. These diode-based systems offer numerous advantages, including compactness, durability, lower energy consumption, extended service life, and the ability to emit or detect specific wavelengths. As a result, LED/PD-based systems have been increasingly adopted in portable instruments for health, environmental, and food safety applications, especially for field use due to their affordability and ease of use.
The Plasmas and Electromagnetic Wave Center of Excellence (PEwave) at Walailak University has been developing microwave heating technologies for diverse applications, such as plasma generation, drying, and extraction of agricultural products, since 2006 [49,50,51,52,53,54,55,56]. In 2020, PEwave initiated the development of microwave-based technologies for small-scale red palm oil production in Thailand [14]. The project aims to construct a prototype facility capable of processing 1–2 tons of fresh fruit bunches and yielding 150–300 kg of red palm oil per day, with a budget under 10 million baht. The effort also focuses on quality monitoring and optimization of production processes to preserve carotenoids and ensure desirable DOBI values.
To support this initiative, a portable DOBI and carotenoid meter has been developed using UV and visible LEDs in combination with photodiodes. This compact, user-friendly, and cost-effective device serves as an alternative to conventional UV-visible spectrophotometers. It demonstrates significant potential for community-level producers, particularly those with limited capital, by enabling rapid, on-site assessment of red palm oil quality.
2. UV and Visible Light Absorption Spectra of Red Palm Oil and It Quality Measurement
Figure 2 presents the absorption spectrum of red palm oil, measured using a spectrophotometer across the ultraviolet (UV) to visible light range. The absorption values correspond to the concentrations of various chemical constituents. According to the Beer–Lambert Law, higher absorbance indicates higher substance concentration. The absorption peak between 210–230 nm is attributed to oleic and linoleic acids, which are unsaturated fatty acids containing one and two double bonds, respectively. These fatty acids account for approximately 50% of crude palm oil content [1,2]. Meanwhile, the absorption range between 260–280 nm is associated with ketones and aldehydes, which are secondary oxidation by-products [58,59].
Carotenoids, key indicators of red palm oil quality, exhibit strong absorption in the range of 400–500 nm [59]. These spectral characteristics form the basis for determining the deterioration of bleachability index (DOBI) and carotenoid concentrations, as shown in Equations (1) and (2) [18,24]:
In these equations, and refer to the absorbance at 446 nm (due to carotenoids) and 269 nm (due to aldehydes), respectively. The value 383 is a diffusion coefficient. V is the volume of hexane in liters (L), and W is the mass of the red palm oil sample in grams (g).
The DOBI value serves as an indicator of oil quality, reflecting the ripeness and freshness of the processed palm fruit. A high DOBI value implies that the fruits are optimally ripe, rich in carotenoids, and have undergone minimal oxidative degradation, resulting in low aldehyde content. Thus, simultaneous analysis of absorbance at 269 nm and 446 nm provides a rapid and effective means of assessing red palm oil quality.
3. Instrumentation
Figure 3 illustrates the working principle of the DOBI meter. The device uses light-emitting diodes (LEDs) to emit light and photodiodes (PDs) to detect the intensity of the transmitted light. It is designed to measure the absorbance properties of red palm oil solutions, which are directly related to their concentration . When a constant electric current is supplied to an LED, it emits light at a specific wavelength and initial intensity . As the light passes through a sample with concentration , part of it is absorbed, reducing the intensity to . This reduction in intensity is detected by the photodiode, which generates an electric current proportional to the transmitted light . A signal conditioning circuit then converts this current into a voltage signal , which is subsequently digitized by an analog-to-digital converter (ADC).
The DOBI meter consists of several key components, as shown in Figure 4. It includes a power supply unit that accepts a 9–12 V DC input and provides regulated voltages of +12 V, +5 V, and −5 V to power the LED circuit, PD circuit, and microcontroller, respectively. The system employs two LEDs—designated LED269 and LED446—emitting light at wavelengths of 269 nm and 446 nm, respectively. When forward biased with a steady current from the LED circuit, each LED generates a consistent light output that increases with the supplied current.
The emitted light passes through a palm oil sample contained within a quartz cuvette. Absorption occurs primarily due to aldehydes (at 269 nm) and carotenoids (at 446 nm), leading to a reduction in light intensity. Two photodiodes—PD269 and PD446—are positioned to measure the transmitted light at the corresponding wavelengths. The signals from the PDs are amplified by the PD circuit to generate suitable voltage levels. These analog signals are then digitized by a 16-bit ADC and processed by a microcontroller. Finally, the calculated DOBI values and carotenoid concentrations are displayed on a digital screen.
3.1. UV and Visible LEDs
Light-emitting diodes (LEDs) are electronic devices composed of semiconductor materials with a P–N junction structure. When an electric current flows through the junction, electron–hole recombination occurs, resulting in the emission of light [60]. LEDs can emit light across a broad spectral range—from deep ultraviolet (UV) to far infrared—spanning wavelengths from approximately 255 to 4600 nm [31,41]. Each diode is characterized by a single emission wavelength with a typical spectral bandwidth or full width at half maximum (FWHM) of 10–20 nm. LEDs that operate in the UV region (λ < 350 nm) tend to be more expensive due to their fabrication using wide bandgap semiconductor materials such as aluminum gallium nitride (AlGaN). LEDs are widely used as light sources in spectrophotometric analysis of chemical components in both liquids and gases, utilizing principles of molecular absorption and fluorescence spectroscopy [31]. Compared to conventional incandescent or discharge lamps, LEDs offer numerous advantages, including compact size, low power consumption, long operational lifespan, cost-effectiveness, and emission at specific wavelengths. Furthermore, because LEDs emit narrowband light, they eliminate the need for a monochromator in many photometric systems. Currently, LEDs are increasingly employed as light sources in high-performance liquid chromatography (HPLC) [28], capillary liquid chromatography, portable field-analysis instruments [30], and compact photometers used for chemical analysis [34].
In this study, we used a UV LED (model SWDC-T306-DNN-U1930) manufactured by Harvatek Corporation [61]. This device emits UV light with a peak wavelength of 269 nm, an optical power density of 0.8 mW/cm2, and a forward voltage of 5–6 V. It has an operational lifespan exceeding 7000 hours and was procured via the online platform AliExpress. Additionally, a visible LED (model MTE4600N), produced by Marktech Optoelectronics [62], was employed. This LED emits at a peak wavelength of 450 nm, delivers an optical output power of 43.2 mW at 50 mA, and has a forward voltage of 2.8 V. It was obtained from Mouser Electronics, an online electronics retailer. These two LEDs are shown in Figure 5(a) and Figure 5(b), respectively.
3.2. Photodiode
Photodiodes (PDs) are used to measure the intensity of light passing through a solution, thereby enabling the determination of light absorption by the sample. As the sample absorbs part of the incident light, the remaining transmitted light intensity is detected by the PD. Photodiodes are widely used as light sensors due to their fast response time, low voltage requirements, compact size, long operational lifespan, and cost-effectiveness [26,31,43]. Structurally, photodiodes are composed of N-type and P-type semiconductor layers, similar to light-emitting diodes, but include a lens that focuses incident light onto the PN junction. When light interacts with the junction, it generates electron–hole pairs, thereby increasing the conductivity of the photodiode. The resulting photocurrent is directly proportional to the intensity of the incident light and varies with the wavelength. Silicon-based photodiodes typically respond to a broad wavelength range, spanning from 190 to 1100 nm.
In this study, we used the PC10-2-TO5 photodiode model, which features an active area of 3.57 mm in diameter and operates across a wavelength range of 200–1100 nm [63]. It supports temperatures from −40 to 100 °C, has a responsivity of 0.17–0.42 A/W depending on the wavelength, and provides up to 10 mA of current output. The photodiode is packaged in a TO-5 metal can as shown in Figure 6(a), which offers mechanical protection and stability for consistent optical performance. Its responsivity characteristics are illustrated in Figure 6(b), where two types of window materials—UV-transmitting glass and fused silica—are compared. The fused silica window exhibits higher responsivity, especially in the UV region, making it suitable for detecting light at the selected wavelengths of 269 nm and 446 nm in this work. These photodiodes, manufactured by TE Connectivity and procured from Mouser Electronics, were used in the DOBI meter to quantify red palm oil quality.
3.3. Power Supply, LED Driver, and PD Receiver Circuits
3.3.1. Power Supply
The power supply circuit of the DOBI meter, shown in Figure 7, operates on a DC voltage input of 9–12 V. The on/off control is managed by switch S1, which activates regulated outputs of −5 V, +5 V, and +9 V to power the LED driver, photodiode (PD) receiver circuits, and the microcontroller. This ensures consistent functionality and stable operation of the device.
To maintain constant light intensity from the LEDs, a stable current source is essential. The LM317 voltage regulator is employed for this purpose. This widely used three-terminal integrated circuit—comprising input (IN), output (OUT), and adjustment (ADJ) terminals—maintains a voltage drop of 3 V between IN and OUT and 1.25 V between OUT and ADJ during operation [64,65]. When configured as an adjustable constant current source, a variable resistor is connected between OUT and ADJ to set the desired current. The LM317 is a proven solution in photometric applications for driving LEDs.
In this work, LM317 regulators (designated as IC10 and IC13) were used to drive LED446 and LED269, respectively, as shown in Figure 8(a) and Figure 8(b) [66]. The power supply provides 12 V, which is sufficient for both LEDs. LED269, with a forward voltage of 6 V, requires a minimum input of 10.25 V (3 + 1.25 + 6 V), while LED446, with a forward voltage of 2.8 V, requires 7.05 V [67]. The current through LED269 is regulated by a combination of resistor R19 and variable resistor R20; likewise, current through LED446 is controlled by resistor R4 and variable resistor R17.
3.3.2. PD Receiver and Signal Conditioning Circuits
Light absorption at 269 nm and 446 nm was measured using photodiodes PD269 and PD446. These were integrated with signal conditioning circuits comprising a transimpedance amplifier (TIA) and a voltage follower (buffer amplifier), as illustrated in Figure 9(a) and Figure 9(b). The photodiodes were operated in photovoltaic mode to maintain zero bias across their terminals, enhancing measurement accuracy [68].
When light of intensity passes through a sample, the PDs generate a photocurrent proportional to I [31]. This current is converted into a voltage signal by the TIA. For 269 nm and 446 nm light, the respective output voltages are and [69,70] where and are variable resistors used to adjust the gain of the TIA. The voltage signals are then buffered using LM358N operational amplifiers in voltage follower configuration, which maintain signal integrity due to their high input impedance and low output impedance, thereby ensuring unity gain [71].
The conditioned analog signals are digitized by an ADS1115 16-bit ADC module (Adafruit), offering a resolution of 0.0078125 mV with 65,536 discrete values. These digital values are processed by an Arduino MEGA 2560 microcontroller, which calculates the DOBI and carotenoid concentration. The results are displayed in real time on a 3.5-inch TFT screen via an I2C interface.
3.3.3. Printed Circuit Board (PCB), Parts and Fabrication of DOBI Meter
Figure 10(a) and Figure 10(b) show the PCB layout and component placement, designed using Eagle PCB software. The LEDs (LED269 and LED446) are mounted orthogonally, with PD269 and PD446 placed opposite them on either side of a cuvette holder. Key electronic components for the TIA and buffer circuits are positioned around the cuvette region. A 3.5-inch LCD and four push buttons are located adjacent to the cuvette for user interface control. A small fan beneath the LCD provides cooling to prevent heat-induced fluctuations in LED intensity and ensures stable device performance.
The assembled system is housed in a custom-designed enclosure as shown in Figure 10(c) and Figure 10(d), modeled using AutoCAD and fabricated via 3D printing with polylactic acid (PLA). The housing measures with 4.5 mm-thick walls. A 3 mm-thick aluminum plate covers the top to shield the interior from external light. The cuvette holder, a square tube with 5.6 mm-thick walls and raised 30 mm from the base, features four optical ports for mounting LEDs and PDs. A 3D-printed black PLA cuvette cap, 4 mm thick, is used to eliminate external light interference during measurements.
3.4. Software and Measurement Procedure
3.4.1. Evaluation of Absorbance
The absorbance of a solution is governed by the Beer–Lambert law [31,43]:
where is absorbance, is the molar absorption coefficient, is the concentration of the absorbing species, and is the optical path length traversed by light of wavelength through the solution. Let represent the light intensity at wavelength after it has passed through a sample of concentration , and be the initial light intensity. The absorbance of the solvent is given by:
When the light interacts with a photodiode (PD), the transmitted intensity produces an electrical current , which is then converted into a voltage signal by a transimpedance amplifier (TIA). The voltage signal is directly proportional to the light intensity and can be described as:
where is a constant determined by the characteristics of the TIA circuit. Using this relationship, the absorbance can be expressed as:
where is the voltage measured for the blank (solvent), and is the voltage measured for the sample. This equation enables precise determination of absorbance at specified wavelengths and forms the basis for calculating DOBI values and carotenoid concentrations in red palm oil.
3.4.2. Measurement Procedure and Software
The measurement process implemented in the DOBI meter is illustrated in Figure 11. The operational algorithm was developed using the Arduino Integrated Development Environment (IDE) and uploaded to the Arduino MEGA 2560 microcontroller. The procedure is as follows:
- Upon startup, the display presents the menu: “Blank Set Enter Exit”. The user selects the “Blank” option using the control button.
- The screen then prompts “Insert cuvette of the blank”. The user inserts a cuvette containing hexane (the solvent) and presses “Enter”.
- The system measures and stores the absorbance values of the blank at 269 nm and 446 nm.
- Next, the user is prompted to “Insert cuvette of the palm oil”. A cuvette containing the red palm oil solution is inserted and confirmed by pressing “Enter”.
- The absorbance of the red palm oil is measured at both wavelengths. Using Equations (1) and (2), the device calculates the DOBI value and carotenoid concentration.
- The results are displayed in real time on the TFT screen.
This automated measurement procedure ensures consistent, accurate, and repeatable assessment of red palm oil quality, using the integrated hardware–software platform of the DOBI meter.
3.5. Calibration
3.5.1. Measurements of LED Emission Spectral and PD Responses
Figure 12 illustrates the experimental setup used to measure the emission spectra of the LEDs and the response characteristics of the photodiodes (PDs). The setup includes the DOBI meter, an Ocean Optics USB4000 fiber optic spectrometer, and a Fluke 8808A benchtop digital multimeter. During LED spectral measurements, both PDs were removed from the DOBI meter, and optical fibers were inserted into their positions. These fibers were aligned within the cuvette holder to collect light emitted by each LED and transmit it to the spectrometer, which was connected to a computer via USB.
Spectral data were acquired using SpectraSuite software and visualized using KaleidaGraph. Each LED was driven by three different constant electrical currents to produce varying emission intensities, and the corresponding currents were recorded using the digital multimeter. To evaluate the PDs’ responses to LED emissions, a procedure similar to that used for spectral measurements was followed, as summarized below:
- Measure the emission spectra of LED269 at .
- Repeat for LED446 at .
- Plot versus normalized peak intensity for each LED and determine the slope (emission intensity response).
- Reinstall PD269 and PD446 to measure their response to the light from LED269 and LED446, respectively.
- Measure the and resulting output voltage for each LED–PD pair.
- Plot voltage versus to determine the photodiode response constants.
- Determine the system gain constants from the slope of these plots, representing the relationship between photocurrent and voltage output for each LED–PD pair
3.5.2. DOBI Meter Calibration
The DOBI meter was calibrated by comparing its measurements with those obtained from a commercial UV-visible spectrophotometer (Merck Prove 600). A series of red palm oil solutions with known concentrations was prepared by weighing between 2.5 and 1000 mg of red palm oil and diluting each sample to a final volume of 25 mL using hexane. Absorbance at 269 nm and 446 nm was measured for all samples using both the DOBI meter and the spectrophotometer to calculate the DOBI values and carotenoid concentrations, as illustrated in Figure 13.
Following calibration with standard solutions, red palm oil extracted from fresh palm fruits was analyzed using both instruments. The extraction was performed using a microwave prototype developed by the Plasma and Electromagnetic Wave Research Laboratory (PEwave) at Walailak University [14]. Fresh fruit bunches were obtained from a local plantation in Tha Sala District, Nakhon Si Thammarat, and separated into spikelets containing fruitlets. These were loaded onto a rotating tray and heated at a constant power of 1000 W for durations of 0, 10, 20, 30, and 40 minutes.
After heating, the mesocarp was manually separated and pressed using a screw press to obtain red palm oil. The samples were then analyzed using both the DOBI meter and the Prove 600 spectrophotometer. Measurements followed the ISO 17932:2011 standard set by the Malaysian Palm Oil Board (MPOB) [71]. Specifically, 0.1 g of each oil sample was filtered and diluted with isooctane or 95% hexane to 25 mL. Absorbance values at 269 nm and 446 nm were used to calculate DOBI and carotenoid contents, as shown in Figure 14.
4. Results and Discussion
4.1. LED Emission Spectral
The UV LED emits most strongly at approximately 277 nm with a full width at half maximum (FWHM) of about 12 nm, while the visible LED has a peak emission around 449 nm and an FWHM of about 10 nm, as shown in Figure 15(a) and Figure 15(b), respectively. The UV LED requires a higher driving current than the visible LED for operation. Additionally, increasing the input current leads to an increase in the peak emission intensity for both LEDs.
4.2. PD Response
As the driving current increases, both the UV and visible LEDs emit more intense light. Figure 16(a) demonstrates that the normalized peak intensity of each LED increases linearly with the driving current . The slope of the UV LED is higher than that of the visible LED due to its wider energy bandgap, which requires more energy for excitation and light emission [60].
When this light interacts with the photodiode (PD), it generates a voltage difference . Figure 16(b) shows the linear relationship between and . The constants 0.696 and 1.1096 represent the responses of PD269 and PD446 to emissions from LED269 and LED446, respectively. These values align with the responsivity characteristics of the PC10-2-TO5 photodiode shown in Figure 6(b), which has nearly twice the responsivity at 446 nm compared to 269 nm.
4.3. DOBI Meter Calibration and Measurements
According to the Beer–Lambert Law, the absorbance of a solution is directly proportional to its concentration and is wavelength-dependent: . Figure 17(a) and Figure 18(a) present standard curves demonstrating a linear correlation between red palm oil concentration and absorbance measured at 269 nm and 446 nm using both the DOBI meter and a commercial spectrophotometer (Prove 600). The DOBI meter exhibited higher sensitivity to concentration changes than the Prove 600, indicating superior responsiveness.
By comparing the slopes of the standard curves from both devices, a correction factor was derived to align the DOBI meter’s readings with those from the Prove 600, as shown in Figure 17(b) and Figure 18(b). This calibration confirms the DOBI meter’s capability to accurately measure DOBI values and carotenoid concentrations in red palm oil, making it suitable for both research and quality control.
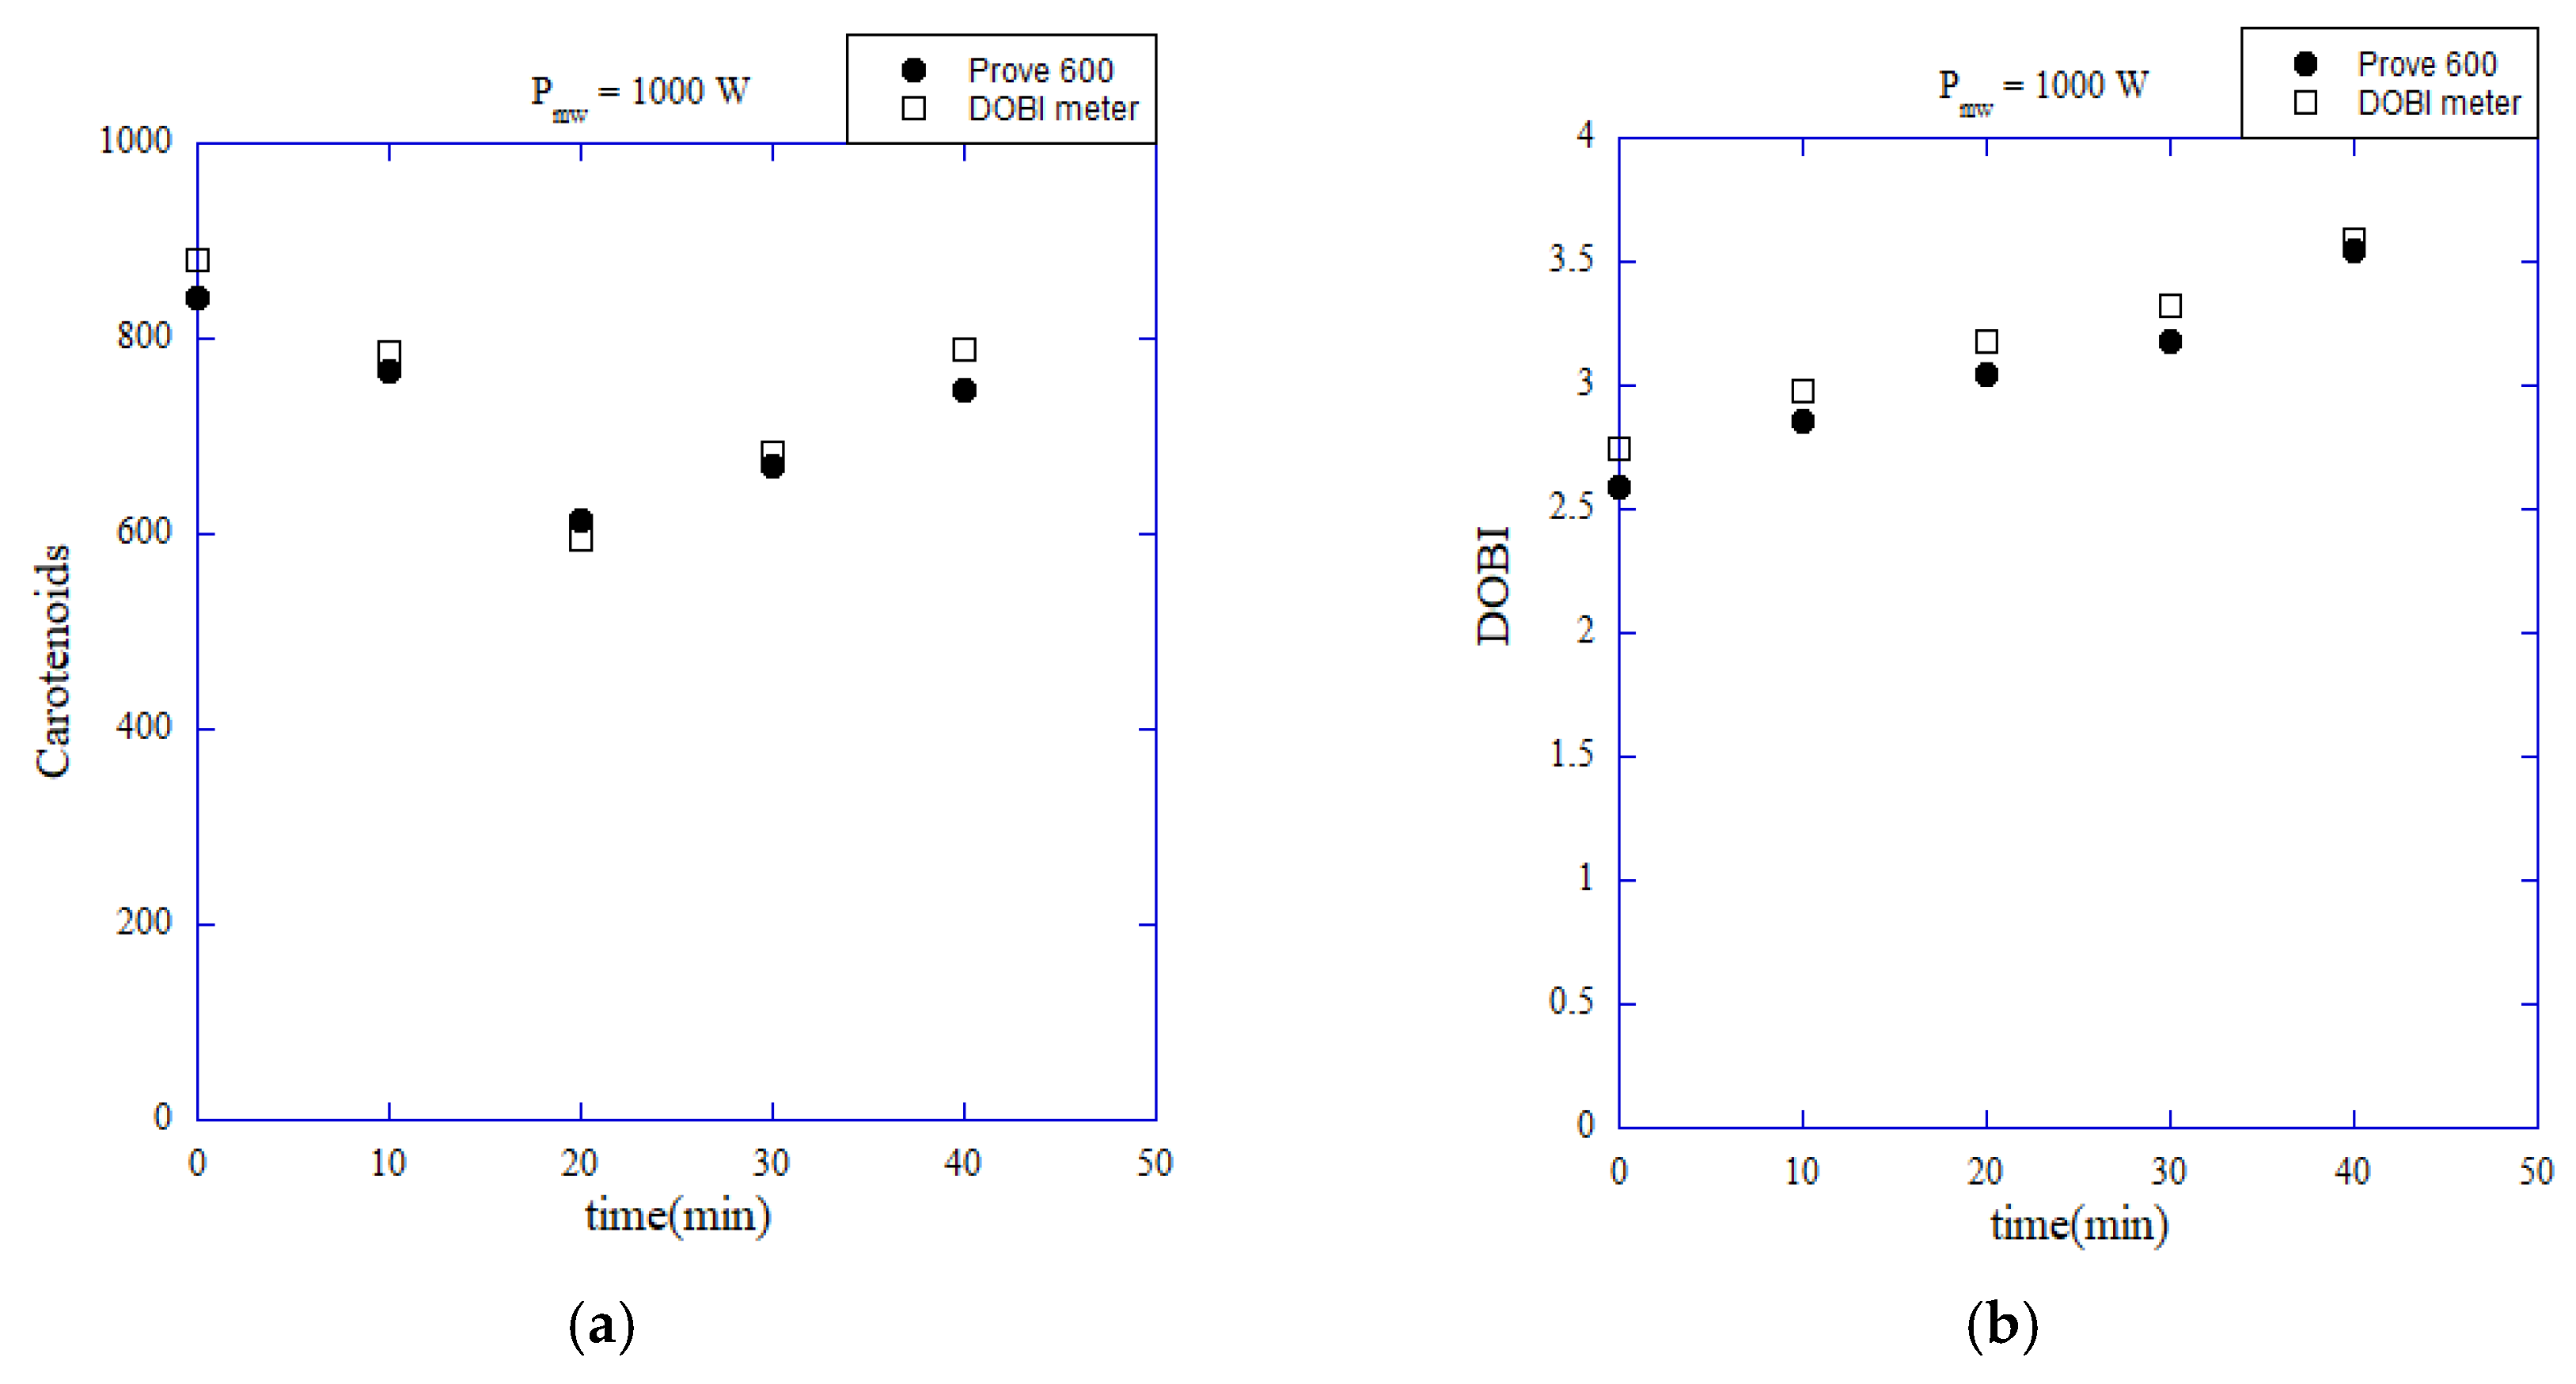
Following calibration, the DOBI meter was used to measure DOBI values and carotenoid concentrations in red palm oil extracted from mesocarp heated using a 1000 W microwave at various durations (0 to 40 minutes). Initially, fresh fruit samples contained approximately 820 ppm of carotenoids. After heating for 10 and 20 minutes, concentrations decreased to 800 ppm and 600 ppm, respectively—likely due to thermal degradation. However, with prolonged heating (30–40 minutes), the carotenoid content increased again to 700 and 800 ppm. This rise is attributed to the enhanced rupture of oil cells, which released more oil and carotenoids.
As shown in Figure 19(a), this trend was consistent in both DOBI meter and spectrophotometer readings. The DOBI value also increased linearly from approximately 2.6 in unheated samples to 3.5 after 40 minutes of heating, as seen in Figure 19(b). The measurement discrepancies between the two devices were less than 5%, demonstrating the reliability of the DOBI meter for practical application in palm oil research and quality assurance.
5. Conclusions
This research successfully developed a portable DOBI meter for evaluating the quality of crude red palm oil based on the determination of DOBI values and carotenoid concentrations. The device utilizes narrow-band UV and visible LEDs at 269 nm and 446 nm, respectively, along with broadband photodiodes to detect light absorption in diluted oil samples. Supporting electronics, including LED driver circuits, a photodiode receiver module, and a microcontroller-based interface, were integrated into a compact system suitable for field applications.
The system was thoroughly calibrated by measuring LED emission characteristics, photodiode responses, and standard curves using known concentrations of red palm oil. The calibration results revealed a linear relationship between absorbance and concentration, with the DOBI meter exhibiting higher sensitivity than a commercial spectrophotometer (Merck Prove 600). After calibration, the DOBI meter was employed to measure red palm oil samples extracted from microwave-treated mesocarps. The results showed good agreement between the DOBI meter and the spectrophotometer, with measurement discrepancies below 5%.
The findings demonstrate that the developed DOBI meter is a reliable, cost-effective, and user-friendly alternative for assessing red palm oil quality, particularly in community-based or small-scale production settings where access to laboratory equipment is limited. Future work may focus on enhancing the device’s spectral selectivity, automating calibration, and expanding its application to other edible oils.
Author Contributions
Conceptualization and methodology, M.N.; fabrication of prototype, S.K. and D.S.; investigation and validation, K.W. and K.Wa, writing—original draft preparation, K.W. and M.N.; writing—review and editing, P.R., A.T and D.B.; visualization, M.N.; supervision, M.N.; funding acquisition, M.N. All authors have read and agreed to the published version of the manuscript.
Funding
This work was supported by Walailak University, Research Assistant Grant Number WU 02.
Data Availability Statement
Data are contained within the article.
Conflicts of Interest
The authors declare that there is no conflict of interest regarding the publication of this article. Authors confirmed that the paper was free of plagiarism.
References
- Tan, C.H.; Lee, C.J.; Tan, S.N.; Poon, D.T.S.; Chong, C.Y.E.; Pui, L.P. Red Palm Oil: A Review on Processing, Health Benefits and Its Application in Food. J. Oleo Sci. 2021, 70, 1201–1210. [Google Scholar] [CrossRef]
- Nagendran, B.; Unnithan, U.R.; Choo, Y.M.; Sundram, K. Characteristics of red palm oil, a carotene- and vitamin E-rich refined oil for food uses. Food Nutr. Bull. 2000, 21, 189–194. [Google Scholar] [CrossRef]
- Loganathan, R.; Subramaniam, K.M.; Radhakrishnan, A.K.; Choo, Y.M.; Teng, K.T. Health-promoting effects of red palm oil: Evidence from animal and human studies. Nutr. Rev. 2017, 75, 98–113. [Google Scholar] [CrossRef] [PubMed]
- Taniwiryono, D.; Hambali, E.; Setyaningsih, D.; Purnama, K.O. Processing, Characteristics, and Potential Application of Red Palm Oil—A review. Int. J. Oil Palm 2020, 3, 40–55. [Google Scholar]
- Nainggolan, M.; Sinaga AG, S. Characteristics of fatty acid composition and minor constituents of red palm olein and palm kernel oil combination. J. Adv. Pharm. Technol. Res. 2021, 12, 22–26. [Google Scholar] [CrossRef] [PubMed]
- Gao, Z.; Zhu, Y.; Jin, J.; Jin, Q.; Wang, X. Chemical-Physical Properties of Red Palm Oils and Their Application in the Manufacture of Aerated Emulsions with Improved Whipping Capabilities. Foods 2023, 12, 2933. [Google Scholar] [CrossRef]
- Nur Sulihatimarsyila, A.W.; Lau, H.L.N.; Nabilah, K.M.; Nur Azreena, I. Production of refined red palm-pressed fibre oil from physical refining pilot plant. Case Stud. Chem. Environ. Eng. 2020, 2, 100035. [Google Scholar] [CrossRef]
- Kapembwa, C.P.; Kalunga, I.K.; Joshi, R.C. Smallholder palm oil for sustainable livelihoods in rural Zambia. Oil Palm Res. Rev. 2021, 2(1), 15–20. [Google Scholar]
- Chow, M.C.; Ma, A.N. Processing of Fresh Palm Fruits Using Microwaves. J. Microw. Power Electromagn. Energy 2016, 40, 165–173. [Google Scholar] [CrossRef]
- Sarah, M.; Taib, M.R. Microwave Sterilization of Oil Palm Fruits: Effect of Power, Temperature and D-value on Oil Quality. J. Med. Bioeng. 2013, 2, 153–156. [Google Scholar] [CrossRef]
- Sarah, M.; Widyastuti, S.; Ningsih, D. Red Palm Oil Production by Microwave Irradiation. In Proceedings of the TALENTA–CEST 2017 (TALENTA Conference on Engineering, Science and Technology); IOP Conference Series: Materials Science and Engineering, Medan, Indonesia, 7–8 September 2017; Volume 309, p. 012091. [Google Scholar]
- Zamanhuri, N.A.; Rahman, N.A.; Bakar NF, A. Effect of Microwave Power and Extraction Time on Crude Palm Oil Quality Using Microwave-Assisted Extraction Process. Int. J. Renew. Energy Dev. 2021, 10, 495–505. [Google Scholar] [CrossRef]
- Sarah, M.; Ramadhan, M.R.; Zahra, A.; Madinah, I.; Maulina, S.; Misran, E. Sterilization of oil palm fruit utilizing continuous microwave sterilizer. Case Stud. Therm. Eng. 2023, 52, 103698. [Google Scholar] [CrossRef]
- Wongyai, K.; Kaewpawong, S.; Srinoum, D.; Kongsawat, W.; Polprasarn, K.; Rathore, V.; Nisoa, M. Scale-Up and Development of a Community Industrial Prototype for Red Palm Oil Production Using Advanced Microwave Technology. AgriEngineering 2025, 7, 113. [Google Scholar] [CrossRef]
- Tan, C.H.; Kuntom, A.; Lee, C.K.; Low, K.S. Comparative evaluation of palm oil color measurement using a prototype palm oil colorimeter. J. Am. Oil Chem. Soc. 2004, 81, 733–736. [Google Scholar] [CrossRef]
- Neo, Y.P.; Ariffin, A.; Tan, C.P.; Tan, Y.A. Determination of oil palm fruit phenolic compounds and their antioxidant activities using spectrophotometric methods. Int. J. Food Sci. Technol. 2008, 43, 1832–1837. [Google Scholar] [CrossRef]
- Saad, B.; Ling, C.W.; Jab, M.S.; Lim, B.P.; Mohamad Ali, A.S.; Wai, W.T.; Saleh, M.I. Determination of free fatty acids in palm oil samples using non-aqueous flow injection titrimetric method. Food Chem. 2007, 102, 1407–1414. [Google Scholar] [CrossRef]
- Azeman, N.H.; Yusof, N.A.; Abdullah, J.; Yunus, R.; Hamidon, M.N.; Hajian, R. Study on the spectrophotometric detection of free fatty acids in palm oil utilizing enzymatic reactions. Molecules 2015, 20, 12328–12340. [Google Scholar] [CrossRef]
- Nokkaew, R.; Punsuvon, V.; Inagaki, T.; Tsuchikawa, S. Determination of Carotenoids and Dobi Content in Crude Palm Oil by Spectroscopy Techniques: Comparison of Raman and Ft-Nir Spectroscopy. Int. J. GEOMATE 2019, 16, 92–98. [Google Scholar] [CrossRef]
- Edo, G.I.; Makinde, M.G.; Nwosu, L.C.; Ozgor, E.; Akhayere, E. Physicochemical and Pharmacological Properties of Palm Oil: An Approach for Quality, Safety, and Nutrition Evaluation of Palm Oil. Food Anal. Methods 2022, 15, 2290–2305. [Google Scholar] [CrossRef]
- Puteh, A.Q.; Mohd Shahrome, A.A.; Haji Razali, M.H.; Sulaiman, A. Comparative Study of Carotenoids Content in Ripe and Unripe Oil Palm Fresh Fruit Bunches. Int. J. Integr. Eng. 2022, 14, 240–246. [Google Scholar] [CrossRef]
- Syamsuddin, J. Determination of Bleachability Index (DOBI) Olein Fraction Crude Palm Oil Using Spectrophotometer UV-VIS. Int. J. Res. Publ. Rev. 2023, 4, 3411–3412. [Google Scholar] [CrossRef]
- Muangpratoom, P.; Suriyasakulpong, C.; Maneerot, S.; Vittayakorn, W.; Pattanadech, N. Experimental Study of the Electrical and Physiochemical Properties of Different Types of Crude Palm Oils as Dielectric Insulating Fluids in Transformers. Sustainability 2023, 15, 14269. [Google Scholar] [CrossRef]
- Susik, J.; Ptasznik, S. The first stage of refining of post-fermentation corn oil with a high content of free fatty acids and phytosterols—Comparison of neutralisation by an ion-exchange resin without solvent and base neutralisation. Food Res. Int. 2023, 164, 112302. [Google Scholar] [CrossRef] [PubMed]
- Putri, G.S.; Saudia, T.N.; Paramita, V.; Ariyanto, H.D. Effect of different composition and emulsifier types on the stability of red palm oil emulsified powder. Malays. J. Chem. Eng. Technol. 2023, 6, 160–173. [Google Scholar] [CrossRef]
- Toole, M.O.; Diamond, D. Absorbance Based Light Emitting Diode Optical Sensors and Sensing Devices. Sensors 2008, 8, 2453–2479. [Google Scholar] [CrossRef]
- da Silva, M.B.; Crispino, C.C.; Reis, B.F. Automatic photometric titration procedure based on multicommutation and flow-batch approaches employing a photometer based on twin LEDs. J. Braz. Chem. Soc. 2010, 21, 1854–1860. [Google Scholar] [CrossRef]
- Bomastyk, B.; Petrovic, I.; Hauser, P.C. Absorbance detector for high-performance liquid chromatography based on light-emitting diodes for the deep-ultraviolet range. J. Chromatogr. A 2011, 1218, 3750–3756. [Google Scholar] [CrossRef]
- Zhang, M.; Zhang, Z.; Yuan, D.; Feng, S.; Liu, B. An automatic gas-phase molecular absorption spectrometric system using a UV-LED photodiode based detector for determination of nitrite and total nitrate. Talanta 2011, 84, 443–450. [Google Scholar] [CrossRef]
- de Lima KM, G. A portable photometer based on LED for the determination of aromatic hydrocarbons in water. Microchem. J. 2012, 103, 62–67. [Google Scholar] [CrossRef]
- Bui, D.A.; Hauser, P.C. Analytical devices based on light-emitting diodes--a review of the state-of-the-art. Anal. Chim. Acta 2015, 853, 46–58. [Google Scholar] [CrossRef] [PubMed]
- Macka, M.; Piasecki, T.; Dasgupta, P.K. Light-emitting diodes for analytical chemistry. Annu. Rev. Anal. Chem. 2014, 7, 183–207. [Google Scholar] [CrossRef]
- Bui, D.A.; Hauser, P.C. Absorbance detector for capillary electrophoresis based on light-emitting diodes and photodiodes for the deep-ultraviolet range. J. Chromatogr. A 2015, 1421, 203–208. [Google Scholar] [CrossRef]
- Kvittingen, E.V.; Kvittingen, L.; Sjursnes, B.J.; Verley, R. Simple and Inexpensive UV-Photometer Using LEDs as Both Light Source and Detector. J. Chem. Educ. 2016, 93, 1814–1817. [Google Scholar] [CrossRef]
- Noori, A.; Mahbub, P.; Dvorak, M.; Lucieer, A.; Macka, M. Radiometric analysis of UV to near infrared LEDs for optical sensing and radiometric measurements in photochemical systems. Sens. Actuators B Chem. 2018, 262, 171–179. [Google Scholar] [CrossRef]
- Murray, E.; Roche, P.; Harrington, K.; McCaul, M.; Moore, B.; Morrin, A.; Diamond, D.; Paull, B. Low cost 235 nm ultra-violet light-emitting diode-based absorbance detector for application in a portable ion chromatography system for nitrite and nitrate monitoring. J. Chromatogr. A 2019, 1603, 8–14. [Google Scholar] [CrossRef] [PubMed]
- Grazioli, C.; Faura, G.; Dossi, N.; Toniolo, R.; Abate, M.; Terzi, F.; Bontempelli, G. 3D printed portable instruments based on affordable electronics, smartphones and open-source microcontrollers suitable for monitoring food quality. Microchem. J. 2020, 159, 105584. [Google Scholar] [CrossRef]
- Al-Ameri, T.; Prairie, M.W.; Frisbie, S.H.; Rao, K.K.; Saksri, A.H.; Parbat, S.; Mitchell, E.J. An accurate, precise, and affordable light emitting diode spectrophotometer for drinking water and other testing with limited resources. PLoS ONE 2020, 15, e0226761. [Google Scholar]
- Gonzalez-Morales, D.; Valencia, A.; Díaz-Nunez, A.; Fuentes-Estrada, M.; Lopez-Santos, O.; Garcia-Beltran, O. Development of a Low-Cost UV-Vis Spectrophotometer and Its Application for the Detection of Mercuric Ions Assisted by Chemosensors. Sensors 2020, 20, 906. [Google Scholar] [CrossRef]
- Li, Y.; Dvorak, M.; Nesterenko, P.N.; Nuchtavorn, N.; Macka, M. High power deep UV-LEDs for analytical optical instrumentation. Sens. Actuators B Chem. 2018, 255, 1238–1243. [Google Scholar] [CrossRef]
- Mukunda, D.C.; Joshi, V.K.; Mahato, K.K. Light emitting diodes (LEDs) in fluorescence-based analytical applications: A review. Appl. Spectrosc. Rev. 2020, 57, 1–38. [Google Scholar] [CrossRef]
- Lam, S.C.; Coates, L.J.; Gupta, V.; Wirth, H.J.; Gooley, A.A.; Haddad, P.R.; Paull, B. Ultraviolet absorbance detector based on a high output power 235 nm surface mounted device-type light-emitting diode. J. Chromatogr. A 2020, 1631, 461540. [Google Scholar] [CrossRef] [PubMed]
- Poh, J.-J.; Wu, W.-L.; Goh, N.W.-J.; Tan, S.M.-X.; Gan, S.K.-E. Spectrophotometer on-the-go: The development of a 2-in-1 UV–Vis portable Arduino-based spectrophotometer. Sens. Actuators A Phys. 2021, 325, 112698. [Google Scholar] [CrossRef]
- Al-Sabbagh, B.; Abdulrazzaq, N.N. Measuring Dyes Concentration Using a Low-Cost Visible-Light Spectrophotometer. Iraqi J. Chem. Pet. Eng. 2022, 23, 27–33. [Google Scholar] [CrossRef]
- Ye, Z.T.; Kuo, H.-C.; Tseng, S.F.; Chung, S.-R.; Tsou, S.-X. Using Blue Mini-LEDs as a Light Source Designed a Miniaturized Optomechanical Device for the Detection of Direct Bilirubin. Nanoscale Res. Lett. 2022, 17, 111. [Google Scholar] [CrossRef]
- Bastan, N.; Ahmadi, M.; Madrakian, T.; Afkhami, A.; Khalili, S.; Majidi, M.; Moradi, M. A paired emitter-detector diode-based photometer for the determination of sodium hypochlorite adulteration in milk. Sci. Rep. 2023, 13, 6217. [Google Scholar] [CrossRef]
- Dangkulwanich, M.; Thitaparun, P.; Yimkosol, W.; Chalermsongsak, T. Characterization of factors influencing absorbance measurements in LED-based colorimeters. Eur. J. Phys. 2023, 44, 025801. [Google Scholar] [CrossRef]
- Mikhail, I.E.; Hemida, M.; Lebanov, L.; Astrakhantseva, S.; Gupta, V.; Hortin, P.; Parry, J.S.; Macka, M.; Paull, B. Multi-wavelength deep-ultraviolet absorbance detector based upon program-controlled pulsing light-emitting diodes. J. Chromatogr. A 2023, 1709, 464382. [Google Scholar] [CrossRef]
- Nisoa, M.; Wattanasit, K.; Tamman, A.; Sirisathitkul, Y.; Sirisathitkul, C. Microwave Drying for Production of Rehydrated Foods: A Case Study of Stink Bean (Parkia speciosa) Seed. Appl. Sci. 2021, 11, 2918. [Google Scholar] [CrossRef]
- Pianroj, Y.; Kerdthongmee, M.N.; Kerdthongmee, J.G. Davelopment of a microwave system for highly-efficient drying of fish. Walailak J. Sci. Technol. 2006, 3, 237–250. [Google Scholar]
- Kerdtongmee, P.; Srinoum, D.; Nisoa, M. Development of compact high voltage switched mode power supply for microwave plasma sources supply for low pressure plasma. J. Instrum. 2011, 6, P08014. [Google Scholar] [CrossRef]
- Suwanchote, C.; Weerakul, J.; Sirisathitkul, C.; Nisoa, M. Color and hardness of durian chips irradiated by controlled low power microwave. Food Sci. Biotechnol. 2012, 21, 1767–1770. [Google Scholar] [CrossRef]
- Jaroenkit, P.; Matan, N.; Nisoa, M. Microwave drying of cooked brown rice and the effect on the nutrient composition and trace elements. Int. Food Res. J. 2013, 20, 351–355. [Google Scholar]
- Chaijan, M.; Panpipat, W.; Nisoa, M. Chemical deterioration and discoloration of semi-dried tilapia processed by sun drying and microwave drying. Dry. Technol. 2016, 35, 642–649. [Google Scholar] [CrossRef]
- Choopan, W.; Panpipat, W.; Nisoa, M.; Cheong, L.Z.; Chaijan, M. Physico-chemical aspects of Thai fermented fish viscera, Tai-Pla, curry powder processed by hot air drying and hybrid microwave-infrared drying. PLoS ONE 2021, 16, e0253834. [Google Scholar] [CrossRef]
- Nisoa, M.; Plodkaew, A.; Sirisathitkul, C.; Wattanasit, K.; Somjit, B.; Pacdeepin, P.; Sirisathitkul, Y. Simulation and experimentation on parameters influencing microwave-assisted extraction of bioactive compounds from Kaempferia parviflora rhizomes. Alex. Eng. J. 2023, 65, 357–366. [Google Scholar] [CrossRef]
- Tan, C.H.; Ariffin, A.A.; Ghazali, H.M.; Tan, C.P.; Kuntom, A.; Choo, A.C. Changes in oxidation indices and minor components of low free fatty acid and freshly extracted crude palm oils under two different storage conditions. J. Food Sci. Technol. 2017, 54, 1757–1764. [Google Scholar] [CrossRef]
- Loganathan, R.; Tarmizi, A.H.A.; Vethakkan, S.R.; Teng, K.T. A review on lipid oxidation in edible oils. Malaysian Journal of Analytical Sciences 2022, 26, 1378–1393. [Google Scholar]
- Sundalian, M.; Zainuddin, A.; Anita. Analysis of Carotenoid Composition in Oil Palm Fruits (Elaeis guineensis Jacq.) from several Varieties: A Review. Biointerface Res. Appl. Chem. 2021, 12, 1470–1479. [Google Scholar] [CrossRef]
- Schubert, E.F. Light-Emitting Diodes, 3rd ed.; 2018.
- Harvatek Corporation. SWDC-T306-DNN-U1930: UV-C LED Sterilization Module for Water Tank. Technical Datasheet, Version 1.0, Harvatek Corporation, Hsinchu, Taiwan, 2020–2023.
- Marktech Optoelectronics. (2019). Visible Emitter Product No: MTE4600N – 450nm LED Datasheet. Marktech Optoelectronics.
- Pacific Silicon Sensor. PC10-2-TO5 Silicon Photodiode Data Sheet; Pacific Silicon Sensor Inc.: Westlake Village, CA, USA, 2010. [Google Scholar]
- Singh, B.P.; Singh, R. Electronic Devices and Integrated Circuits; Pearson Education: New Delhi, India, 2009. [Google Scholar]
- Winder, S. Power Supplies for LED Driving; Newnes (Elsevier): Burlington, MA, USA, 2008. [Google Scholar]
- Texas Instruments. (2021). LM317: 3-Terminal Adjustable Regulator (Rev. AB).
- Chen, Y.; Su, Y.; Chang, C.; Liang, S. A practical portable photometer using LEDs as inspection light source. Sensors and Actuators A Physical 2017, 263, 579–588. [Google Scholar]
- Wei, Y.; Lehmann, T.; Silvestri, L.; Wang, H.; Ladouceur, F. Photodiode Working in Zero-Mode: Detecting Light Power Change with DC Rejection and AC Amplification. Opt. Express 2021, 29, 18915–18931. [Google Scholar] [CrossRef]
- Cretu, V.F.; Kehl, F.; Metz, B.C.; Willis, P.A. Open-Source Lab Hardware: Low Noise Adjustable Two-Stage Gain Transimpedance Amplifier with DC Offset for Low-Light Detection. HardwareX 2021, 10, e00233. [Google Scholar] [CrossRef] [PubMed]
- Bielecki, Z.; Achtenberg, K.; Kopytko, M.; Mikołajczyk, J.; Wojtas, J.; Rogalski, A. Review of photodetectors characterization methods. Bull. Pol. Acad. Sci. Tech. Sci. 2022, 70, e140534. [Google Scholar] [CrossRef]
- Fang, L.H.; Rahim, R.B.A.; Isa, M.; Syed Hasan, S.I.; Ismail, B.B. The Design of Operational Amplifier for Low Voltage and Low Current Sound Energy Harvesting System. IOP Conf. Ser.: Mater. Sci. Eng. 2018, 318, 012035. [Google Scholar] [CrossRef]
- ISO 17932:2011; Palm oil—Determination of the deterioration of bleachability index (DOBI) and carotene content. International Organization for Standardization: Geneva, Switzerland, 2011.
Figure 1.
Red palm oil which is obtained from mesocarp of palm oil fruits.
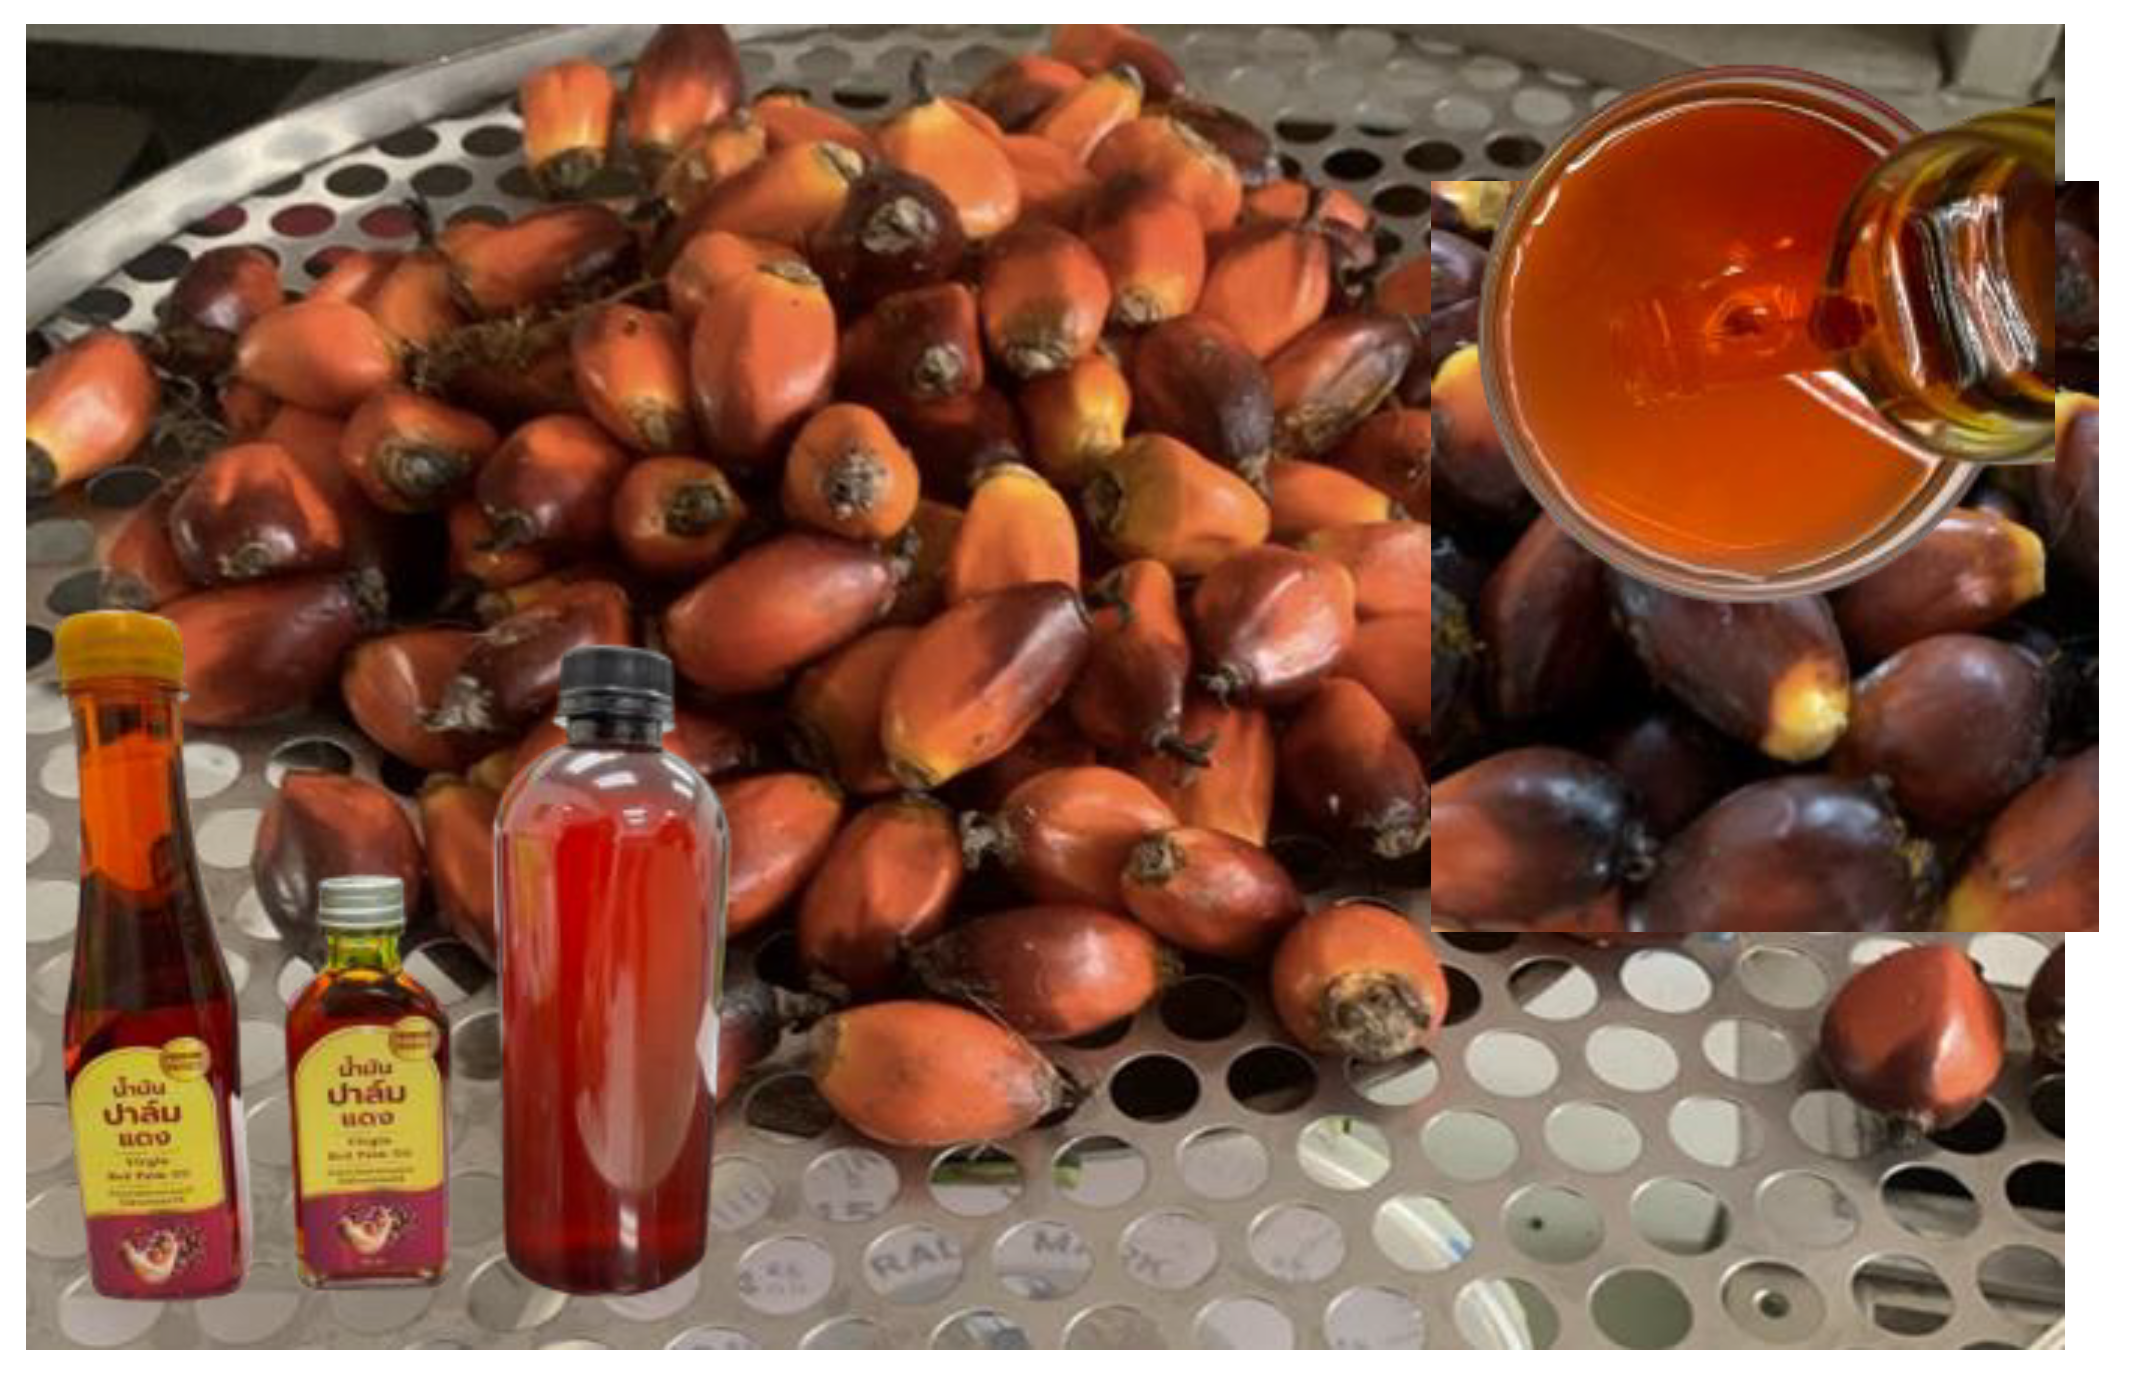
Figure 2.
Absorption spectra of red palm oil.
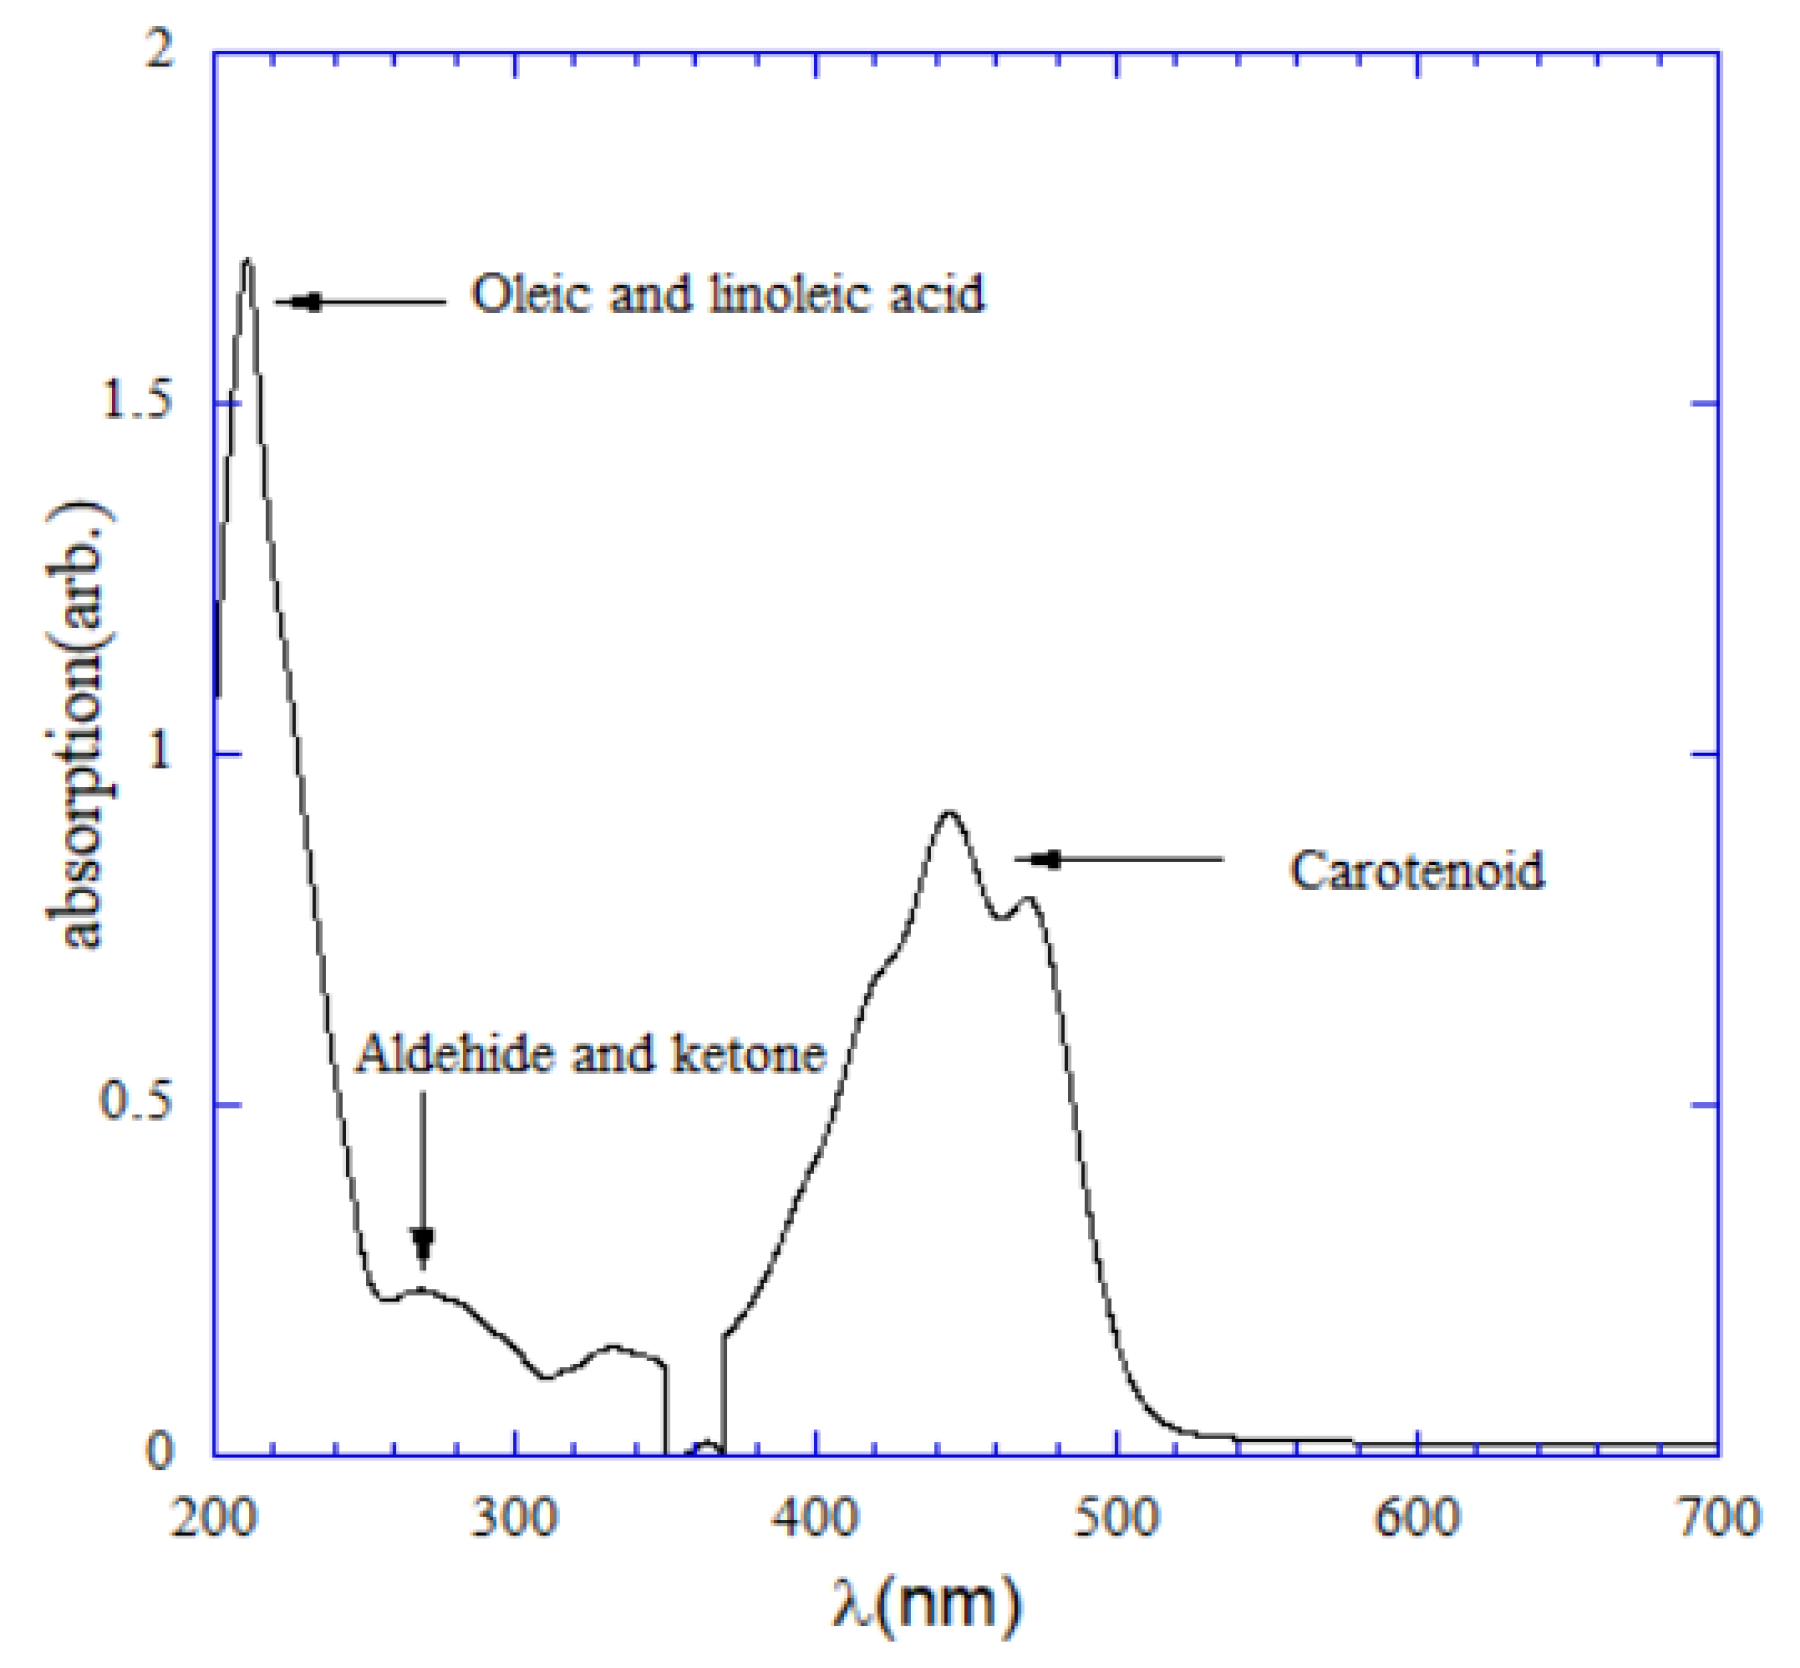
Figure 3.
Principles of LED and PD based DOBI meter.
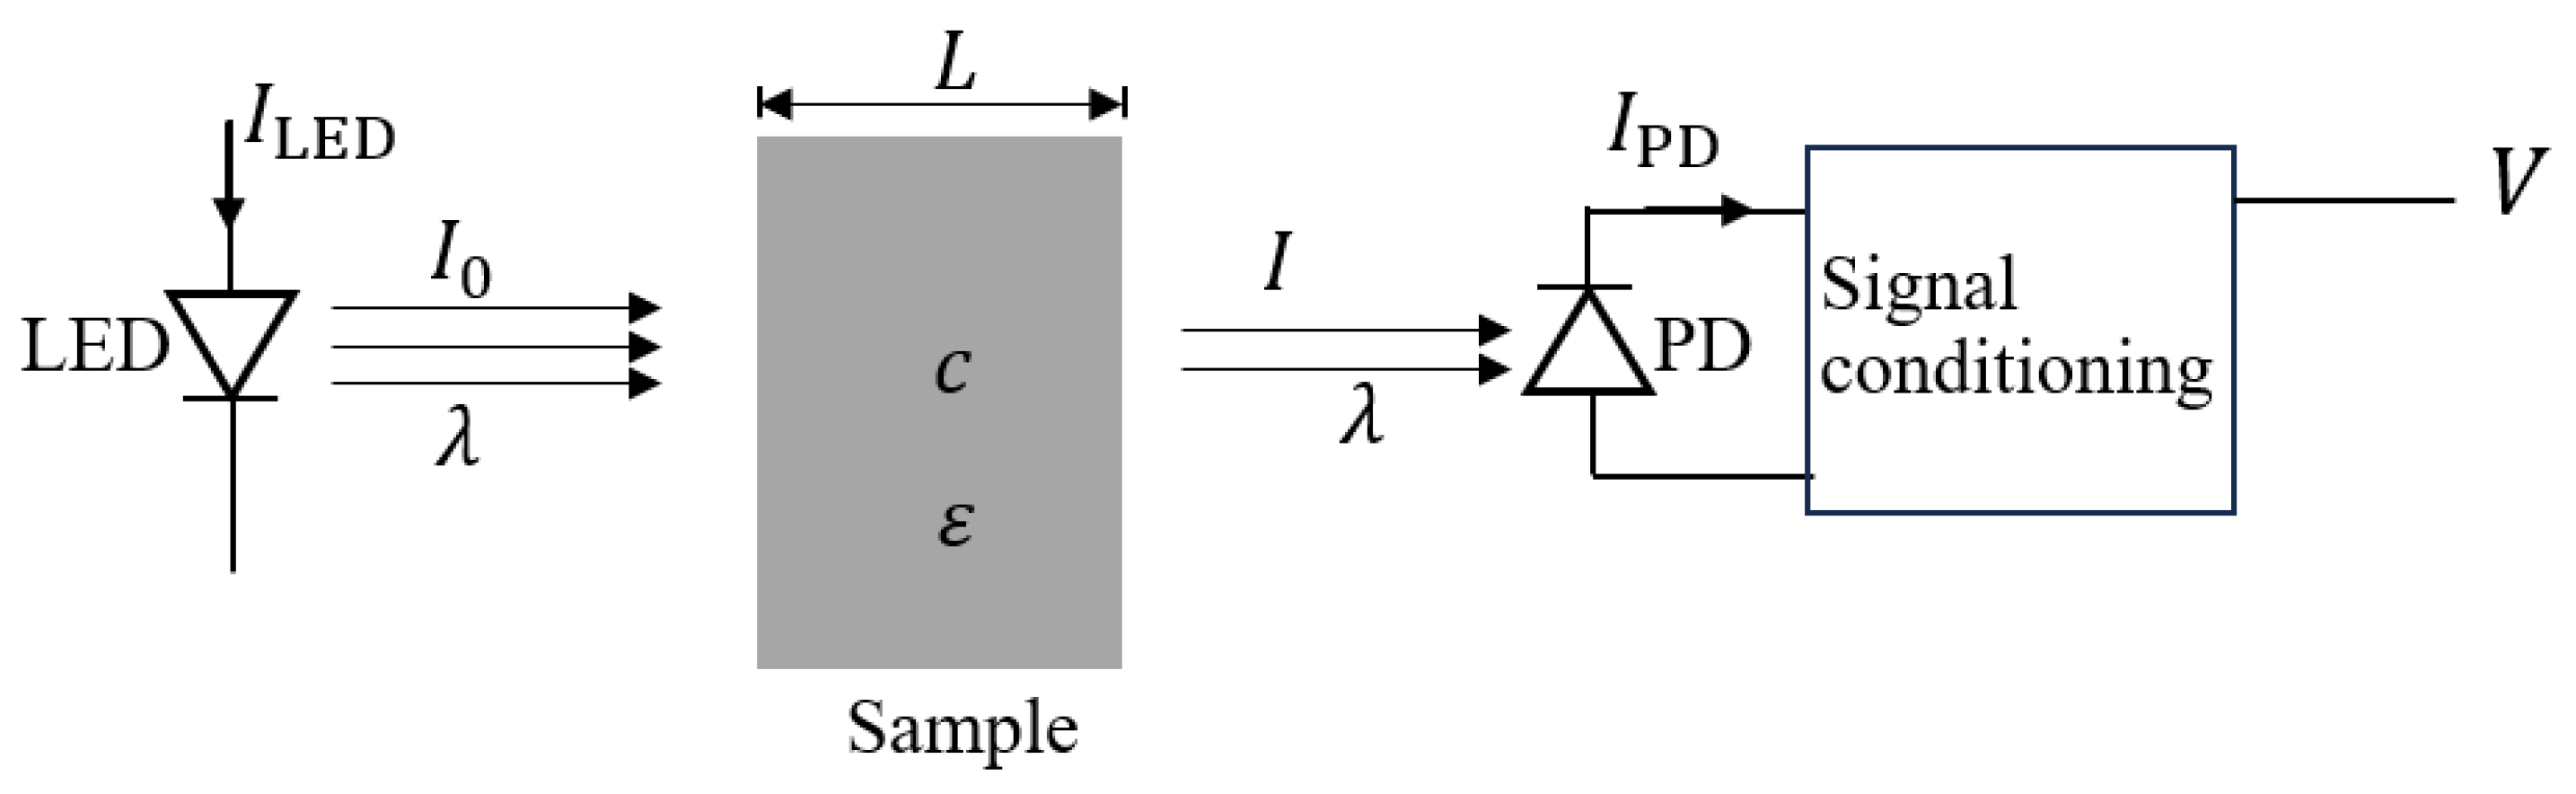
Figure 4.
Schematic diagram of DOBI meter.
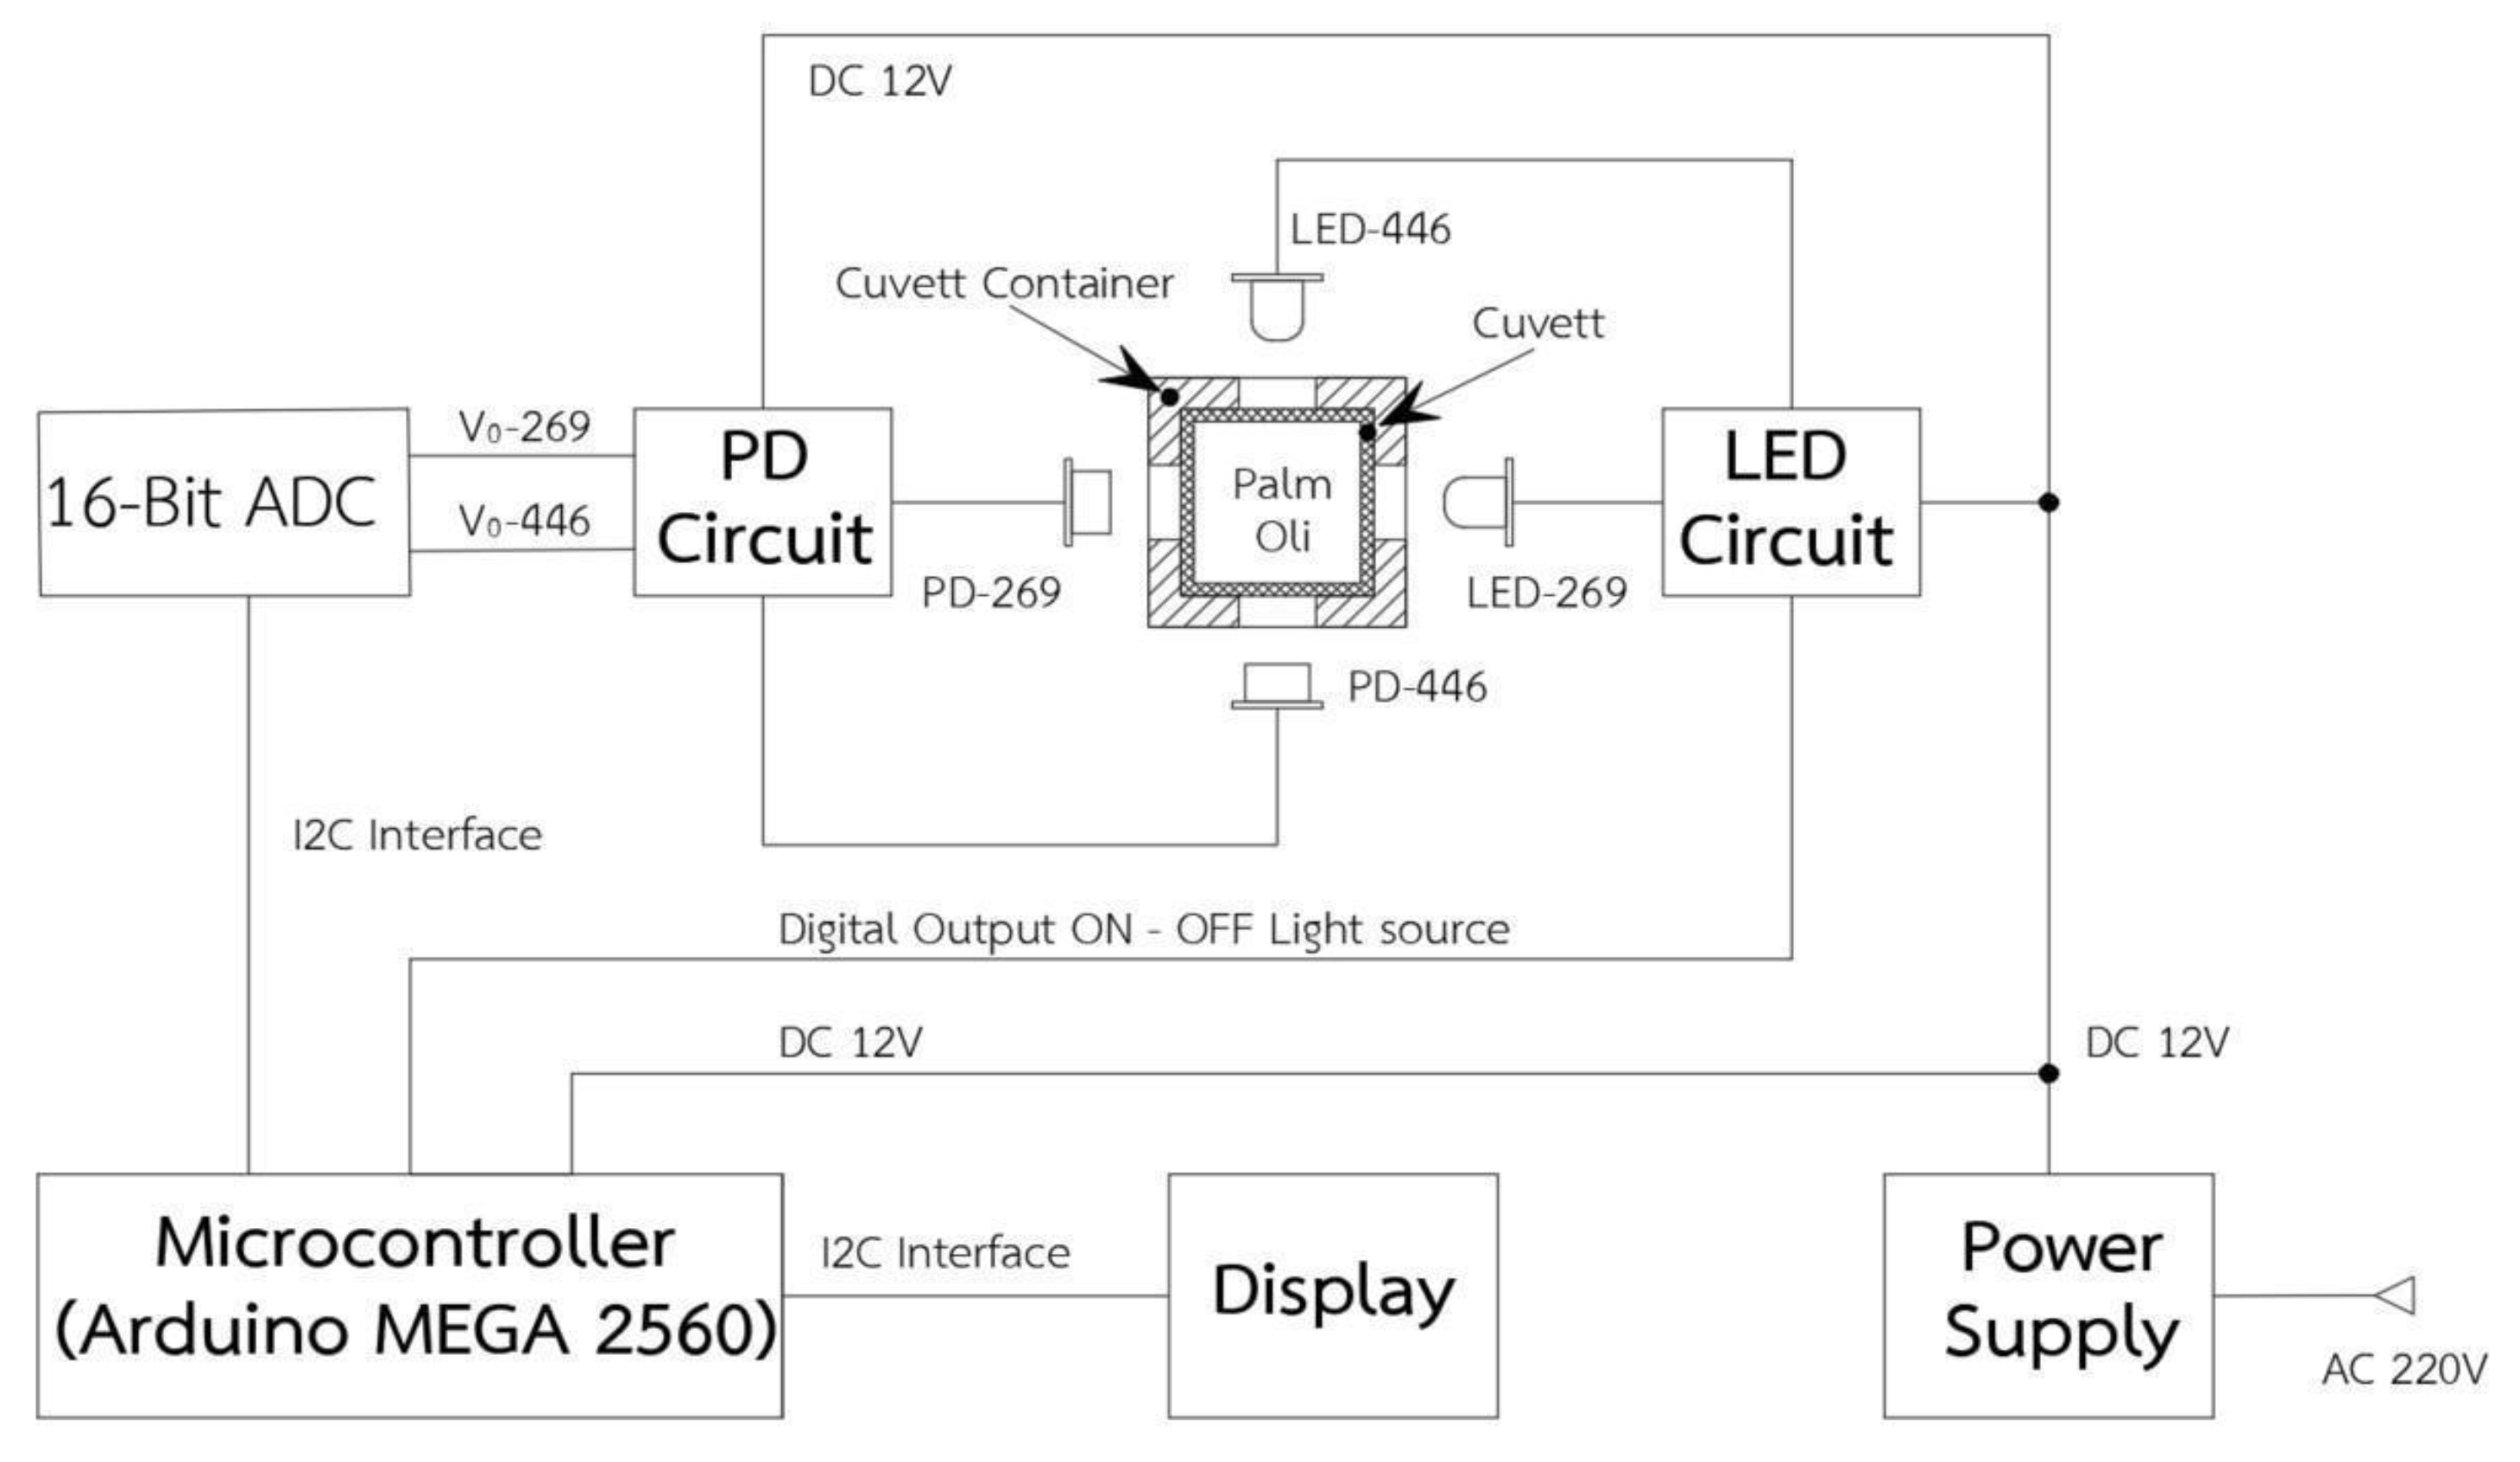
Figure 5.
(a) UV LED and (b) visible LED.
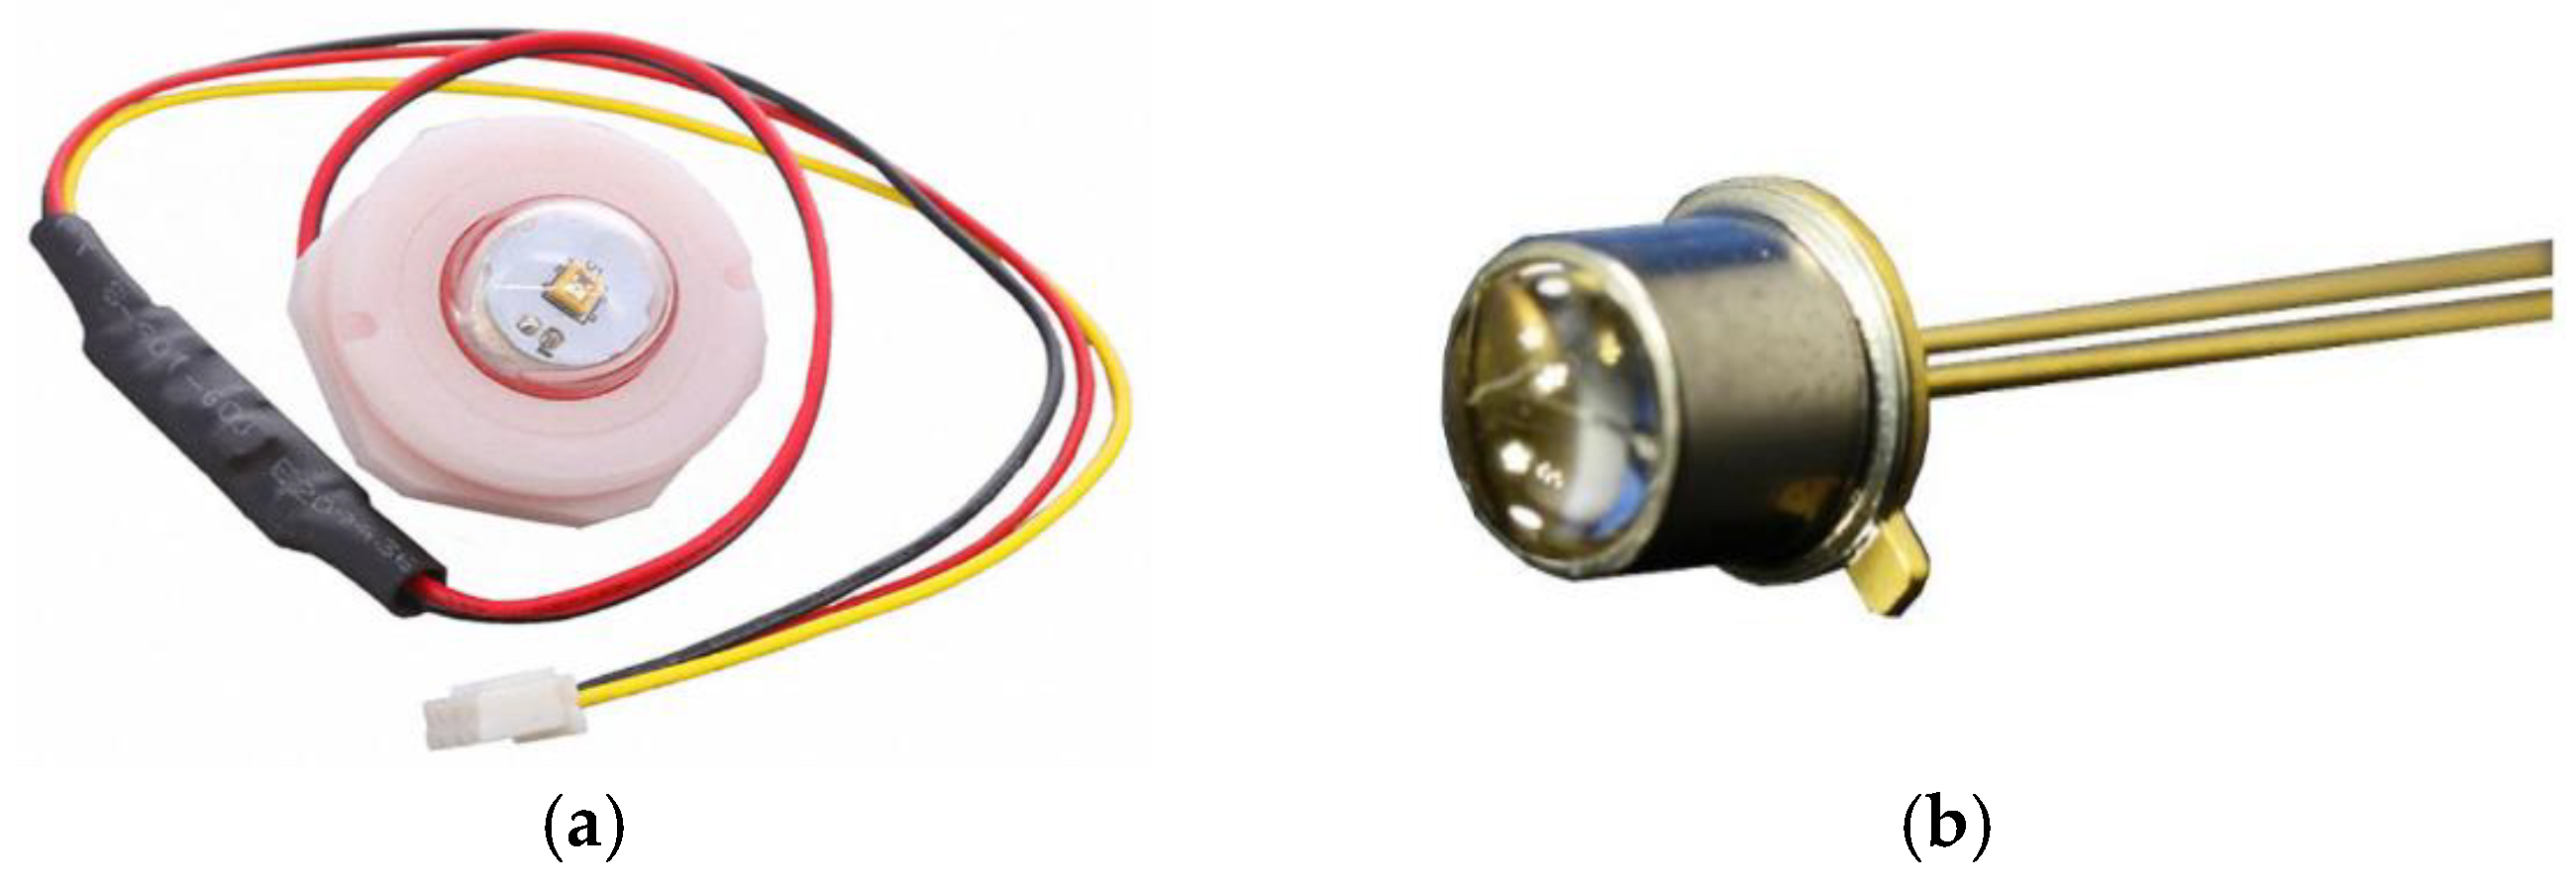
Figure 6.
(a) Photodiode and (b) UV and its responsivity for different wavelength.
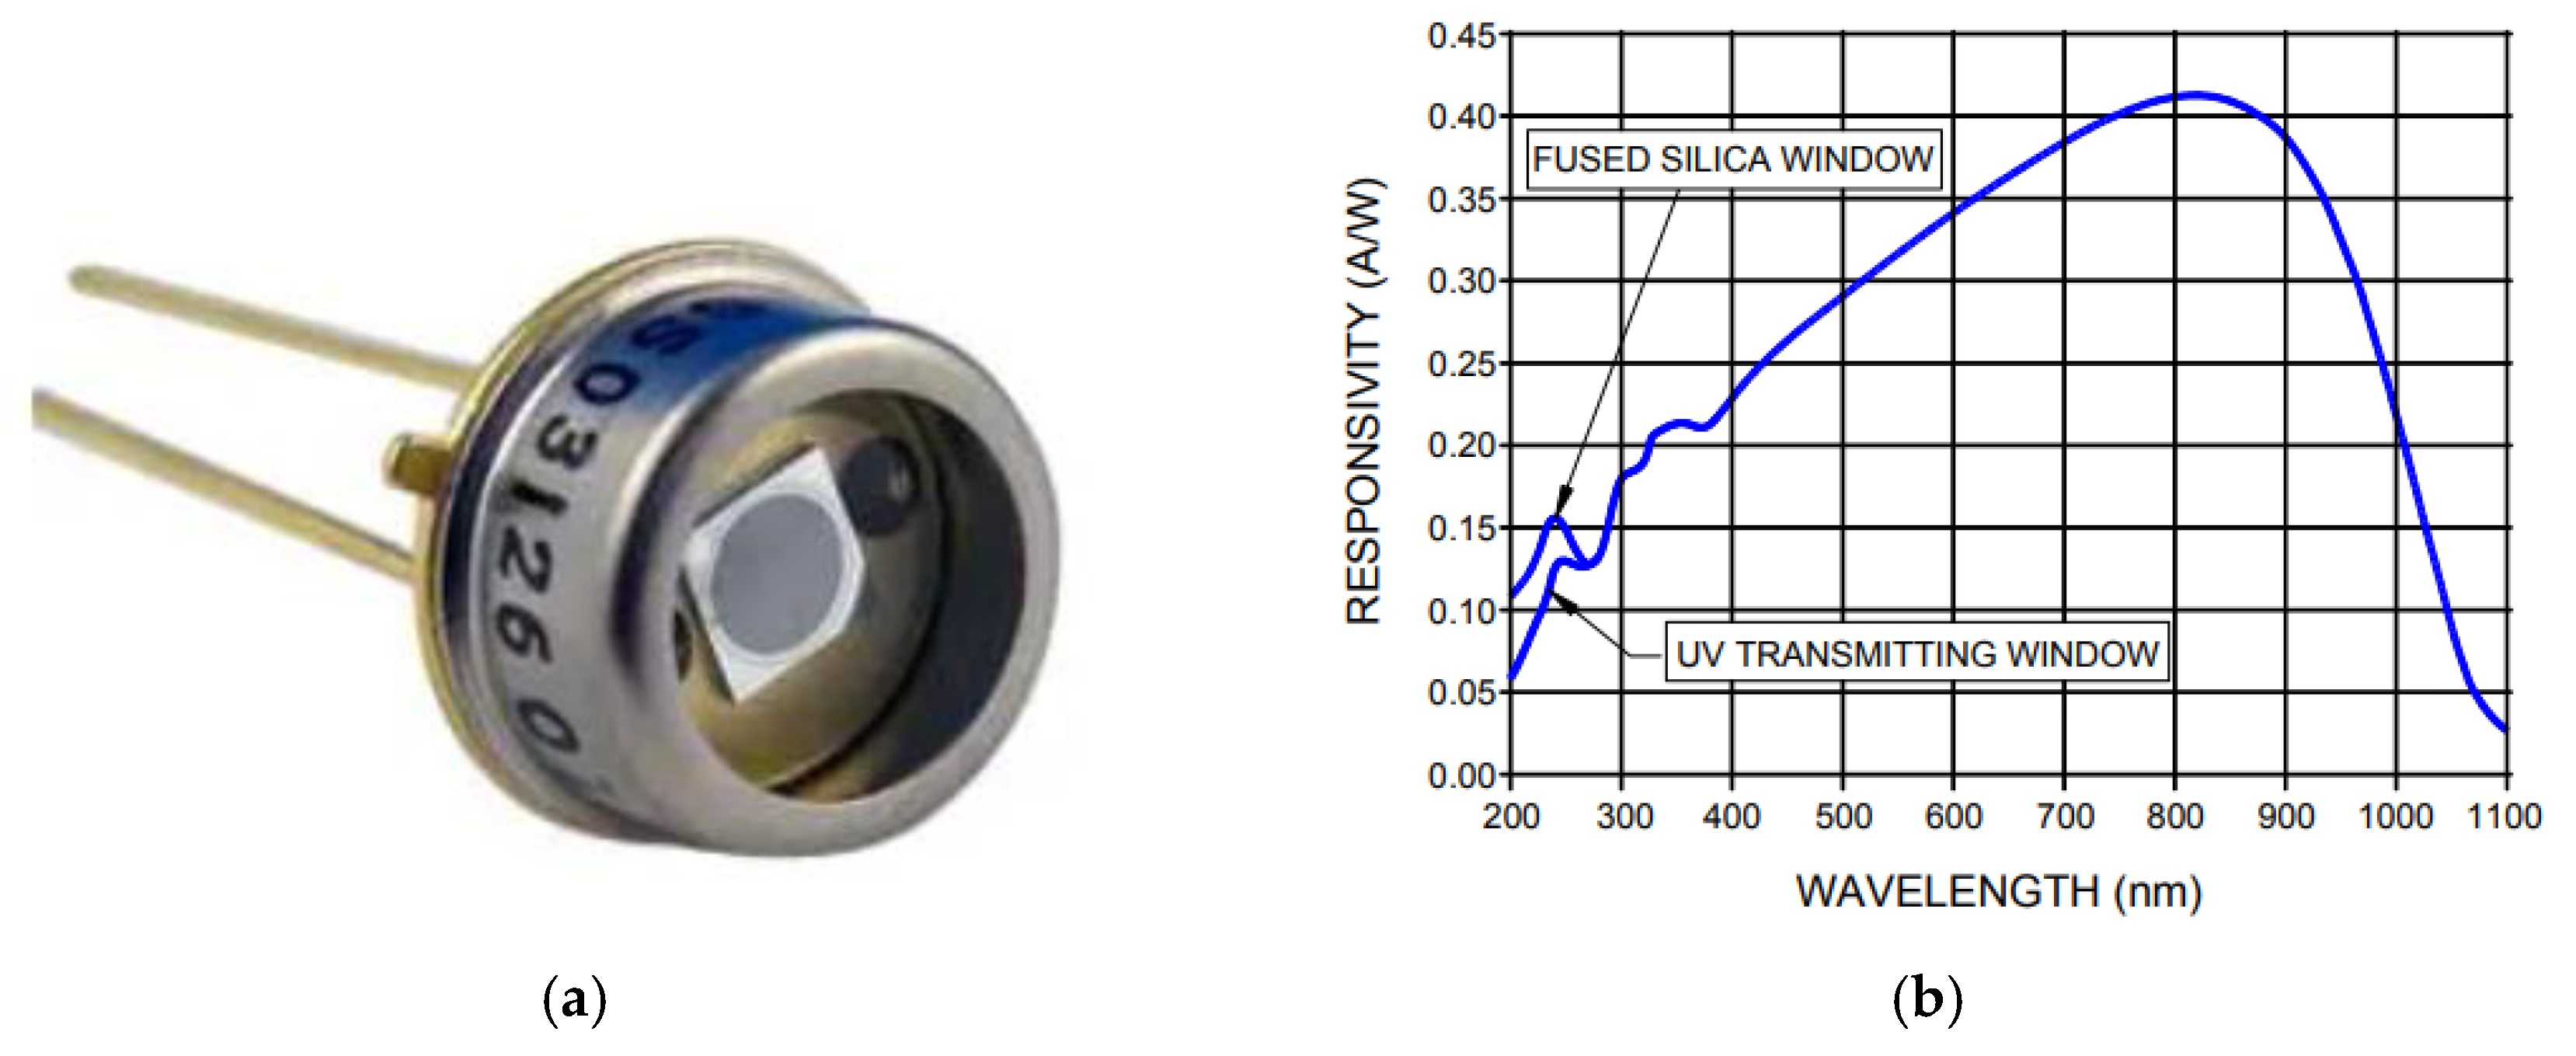
Figure 7.
Schematic diagram of the power supply circuit.
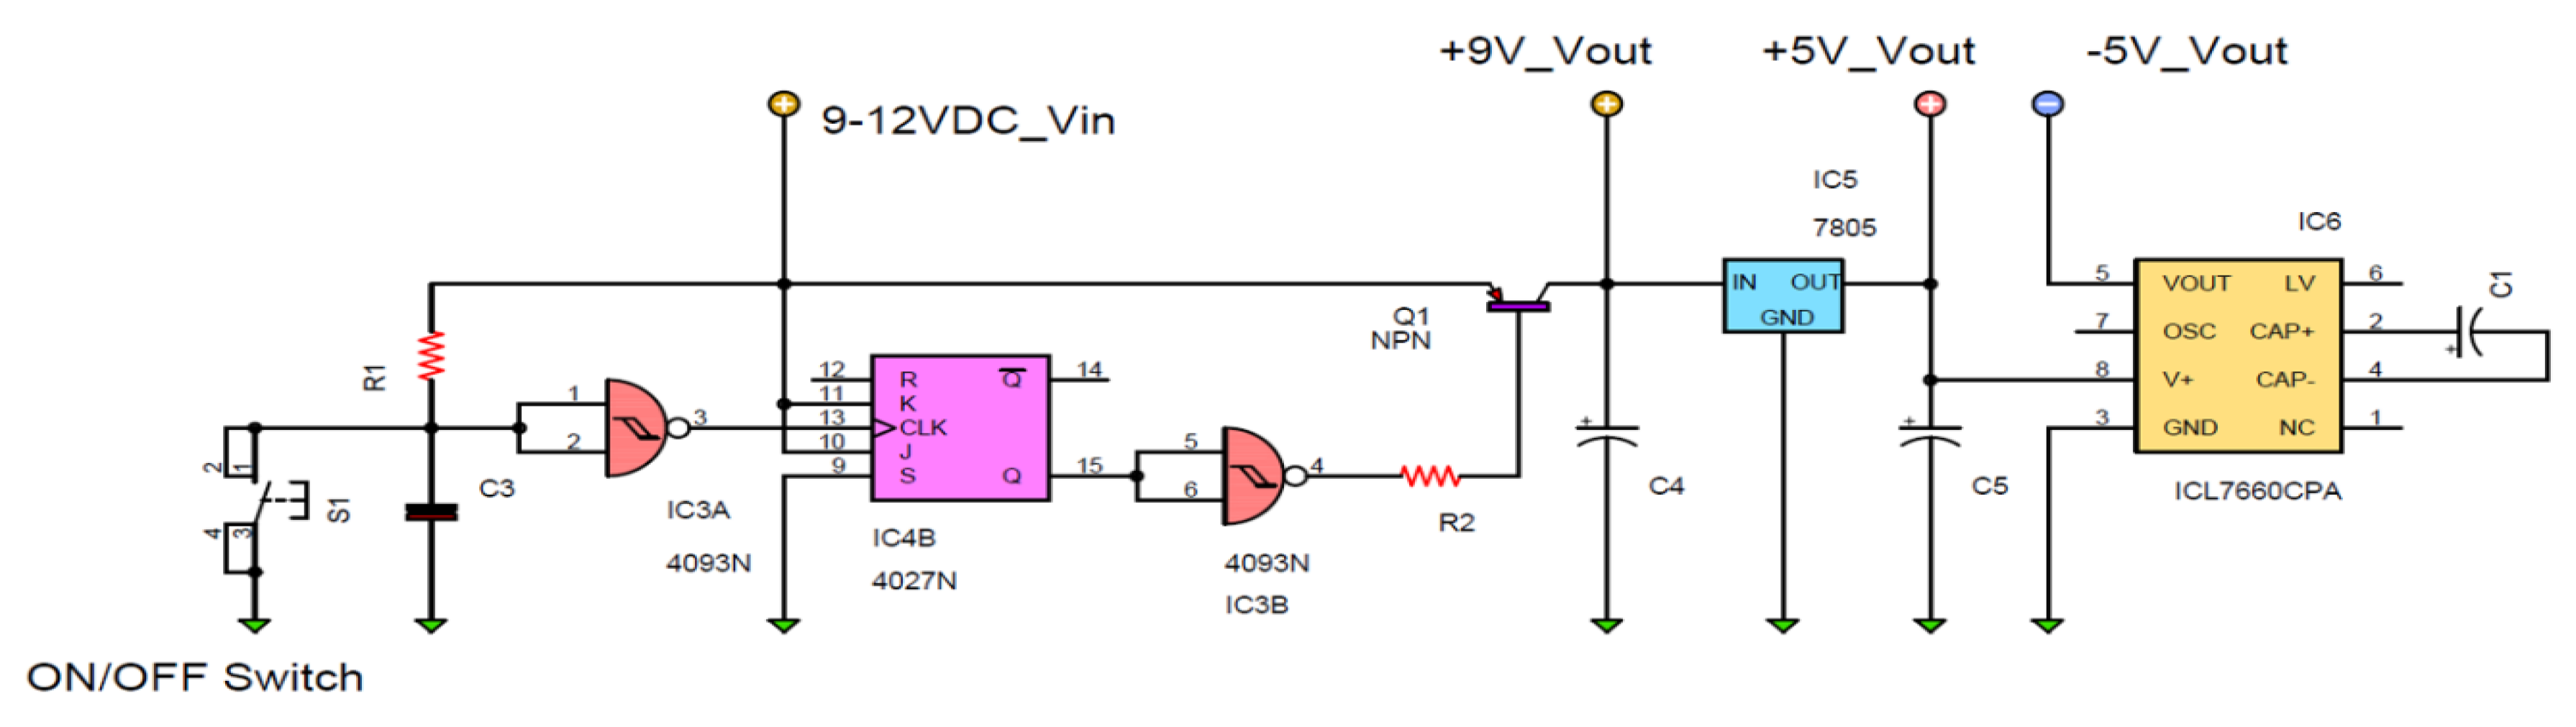
Figure 8.
Schematic diagram of the LED driver circuits (a) for LED 446 nm and (b) for LED 269 nm.
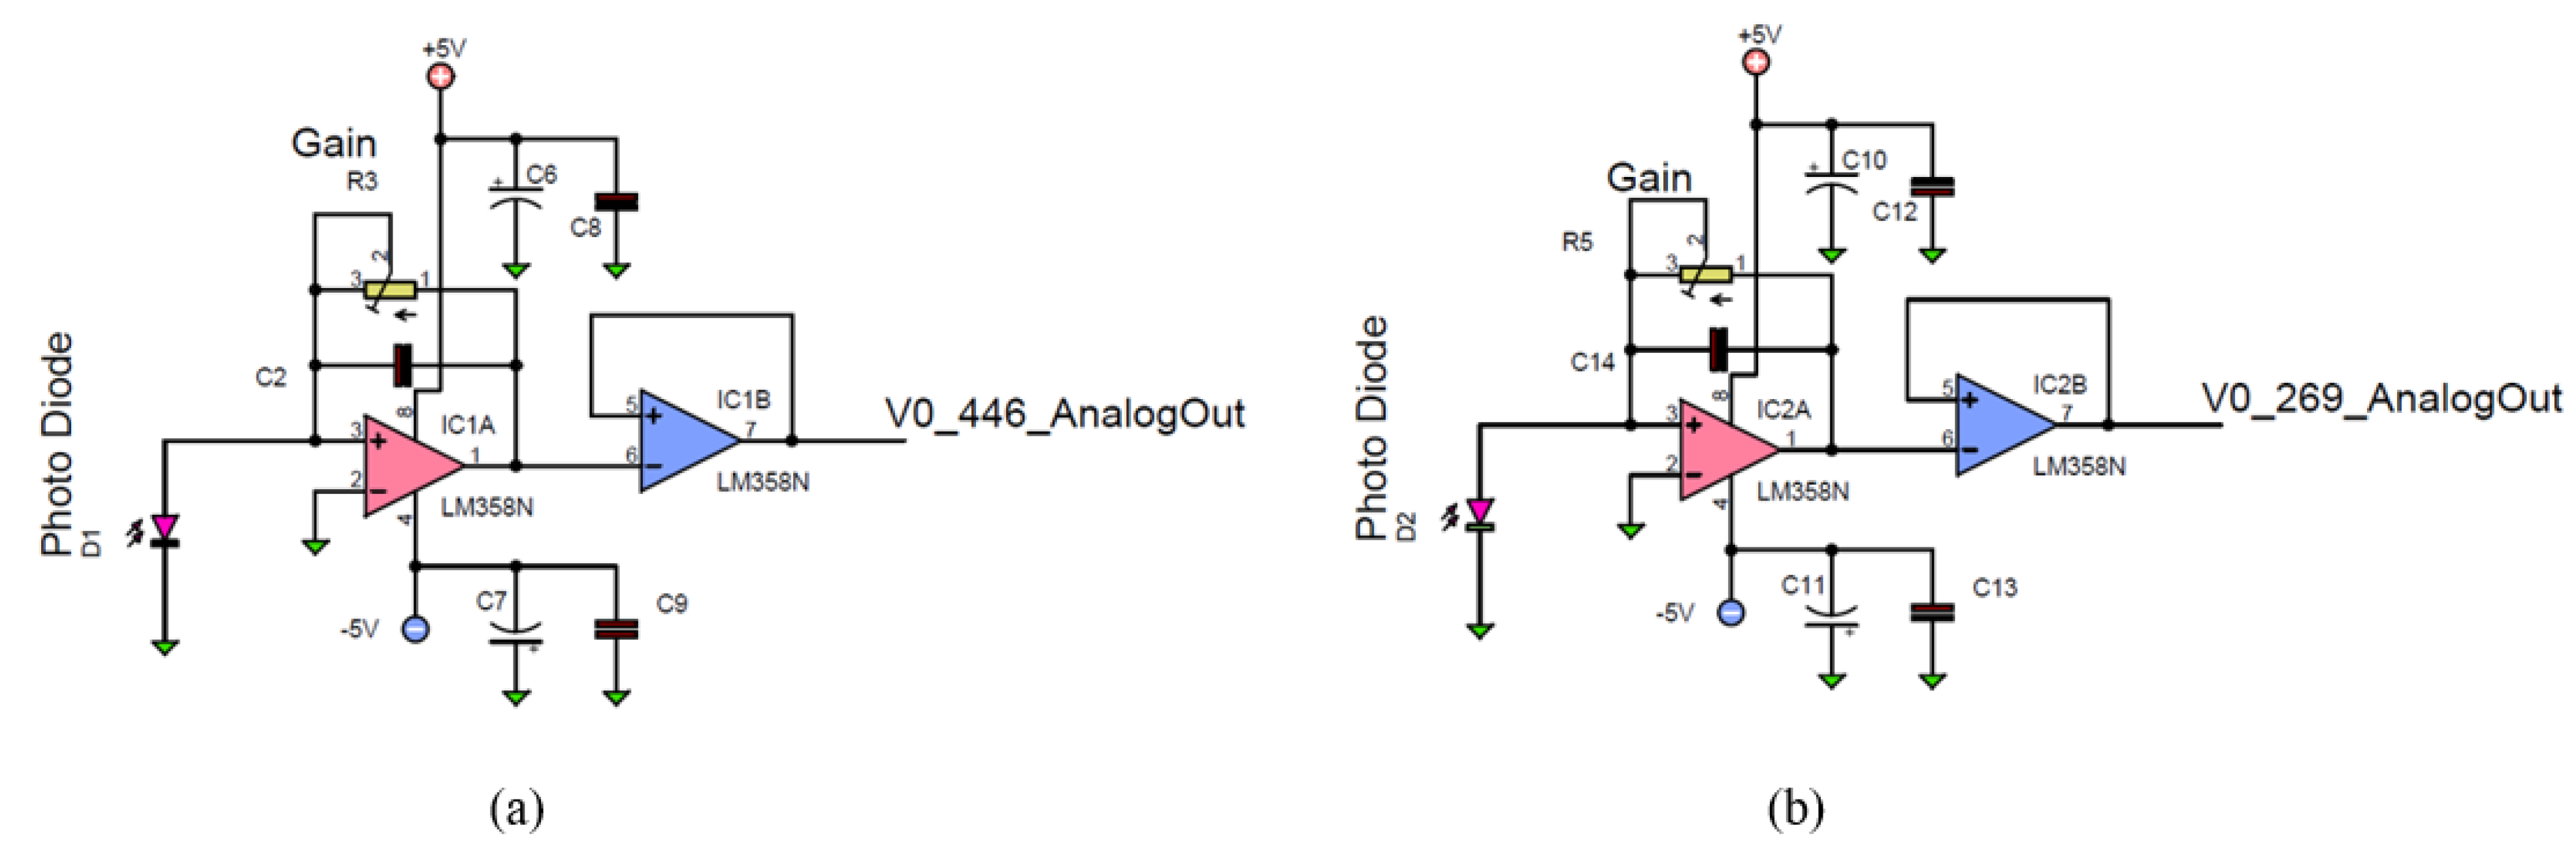
Figure 9.
Schematic diagram of the PD receiver circuits (a) for and (b) for .
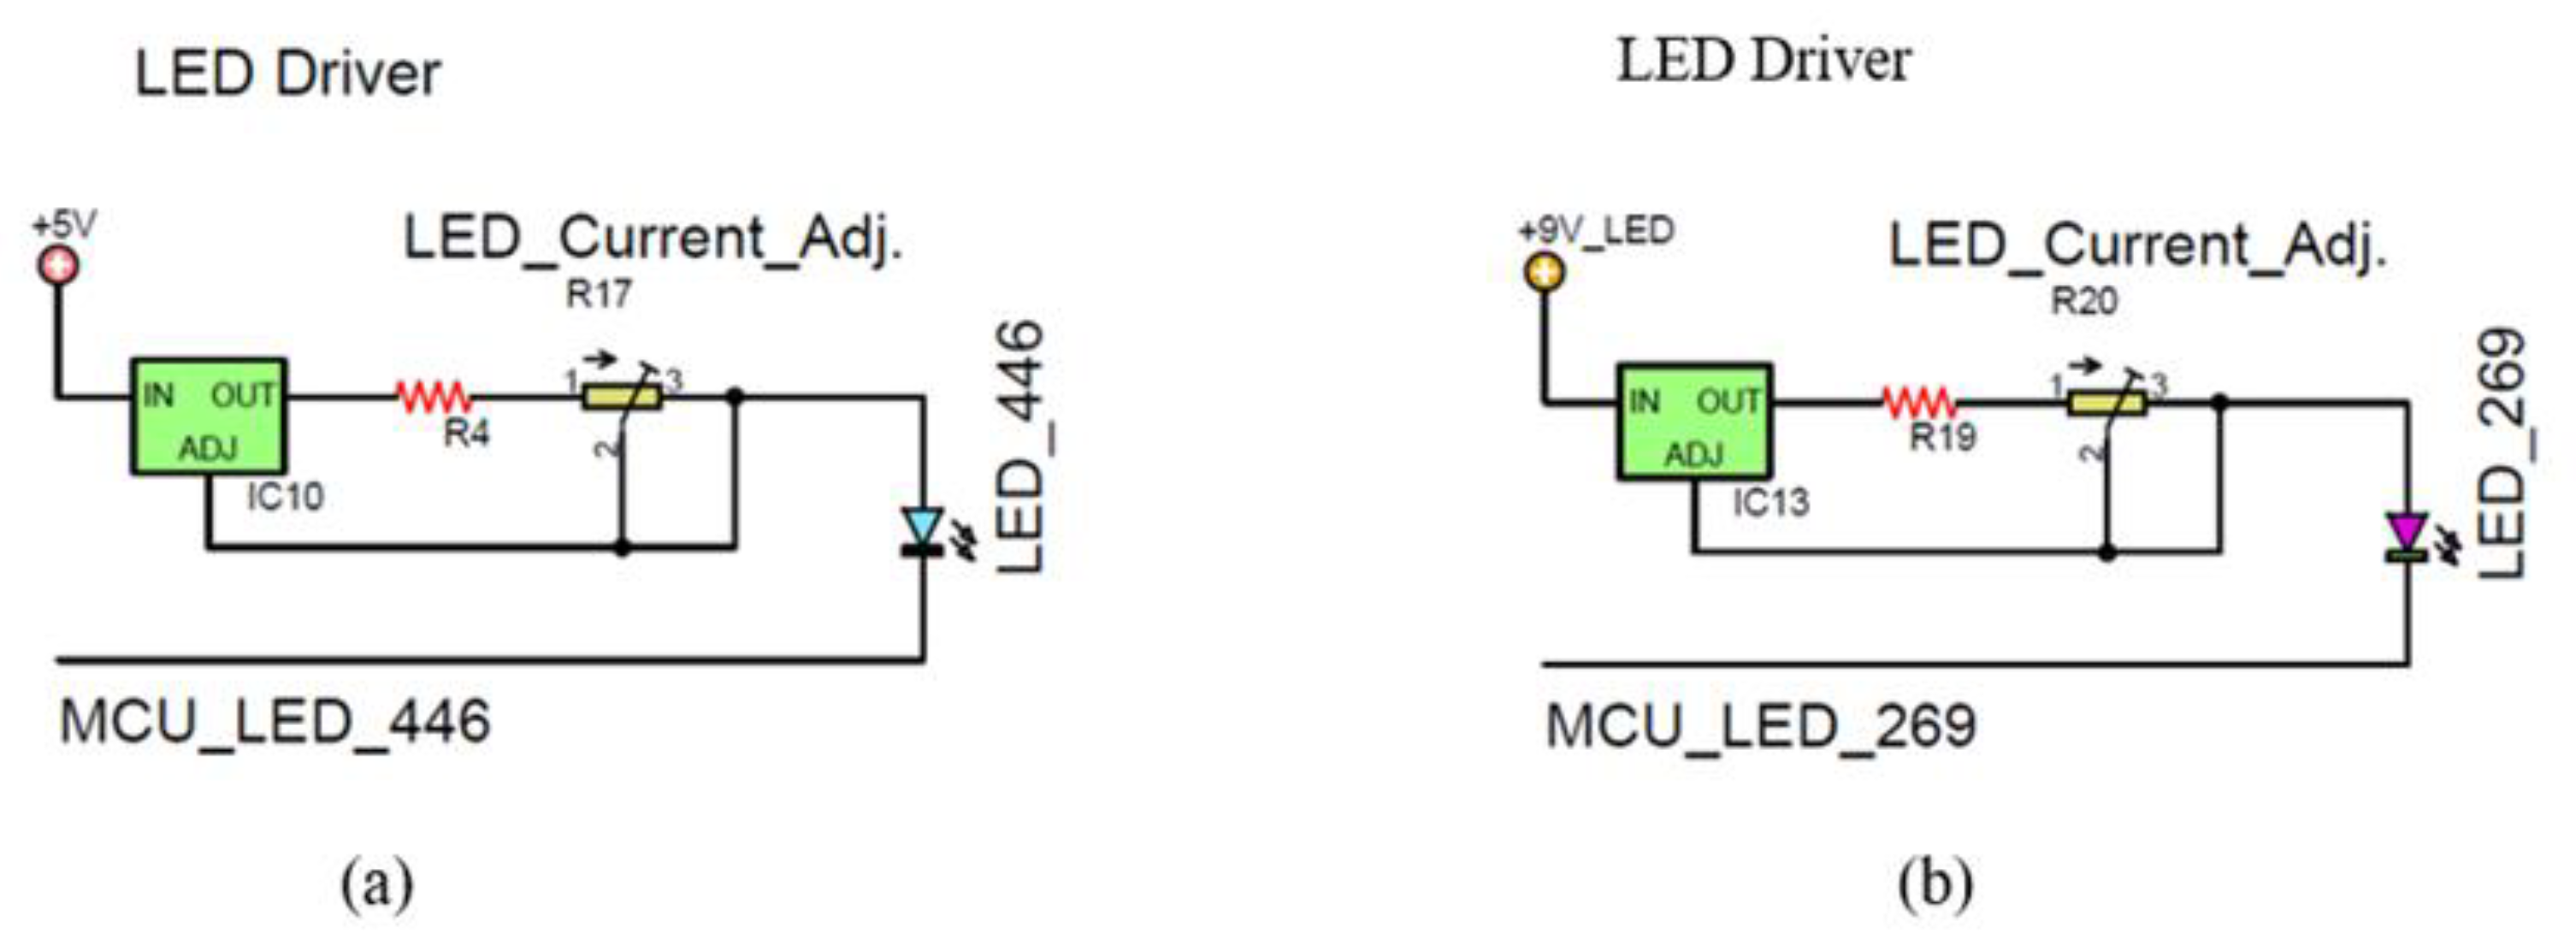
Figure 10.
(a) Printed circuit board (PCB), (b) PCB layout, (c) assembled PCB, LCD display and control button in the DOBI meter’s housing and (d) completely assembled DOBI meter.
Figure 10.
(a) Printed circuit board (PCB), (b) PCB layout, (c) assembled PCB, LCD display and control button in the DOBI meter’s housing and (d) completely assembled DOBI meter.
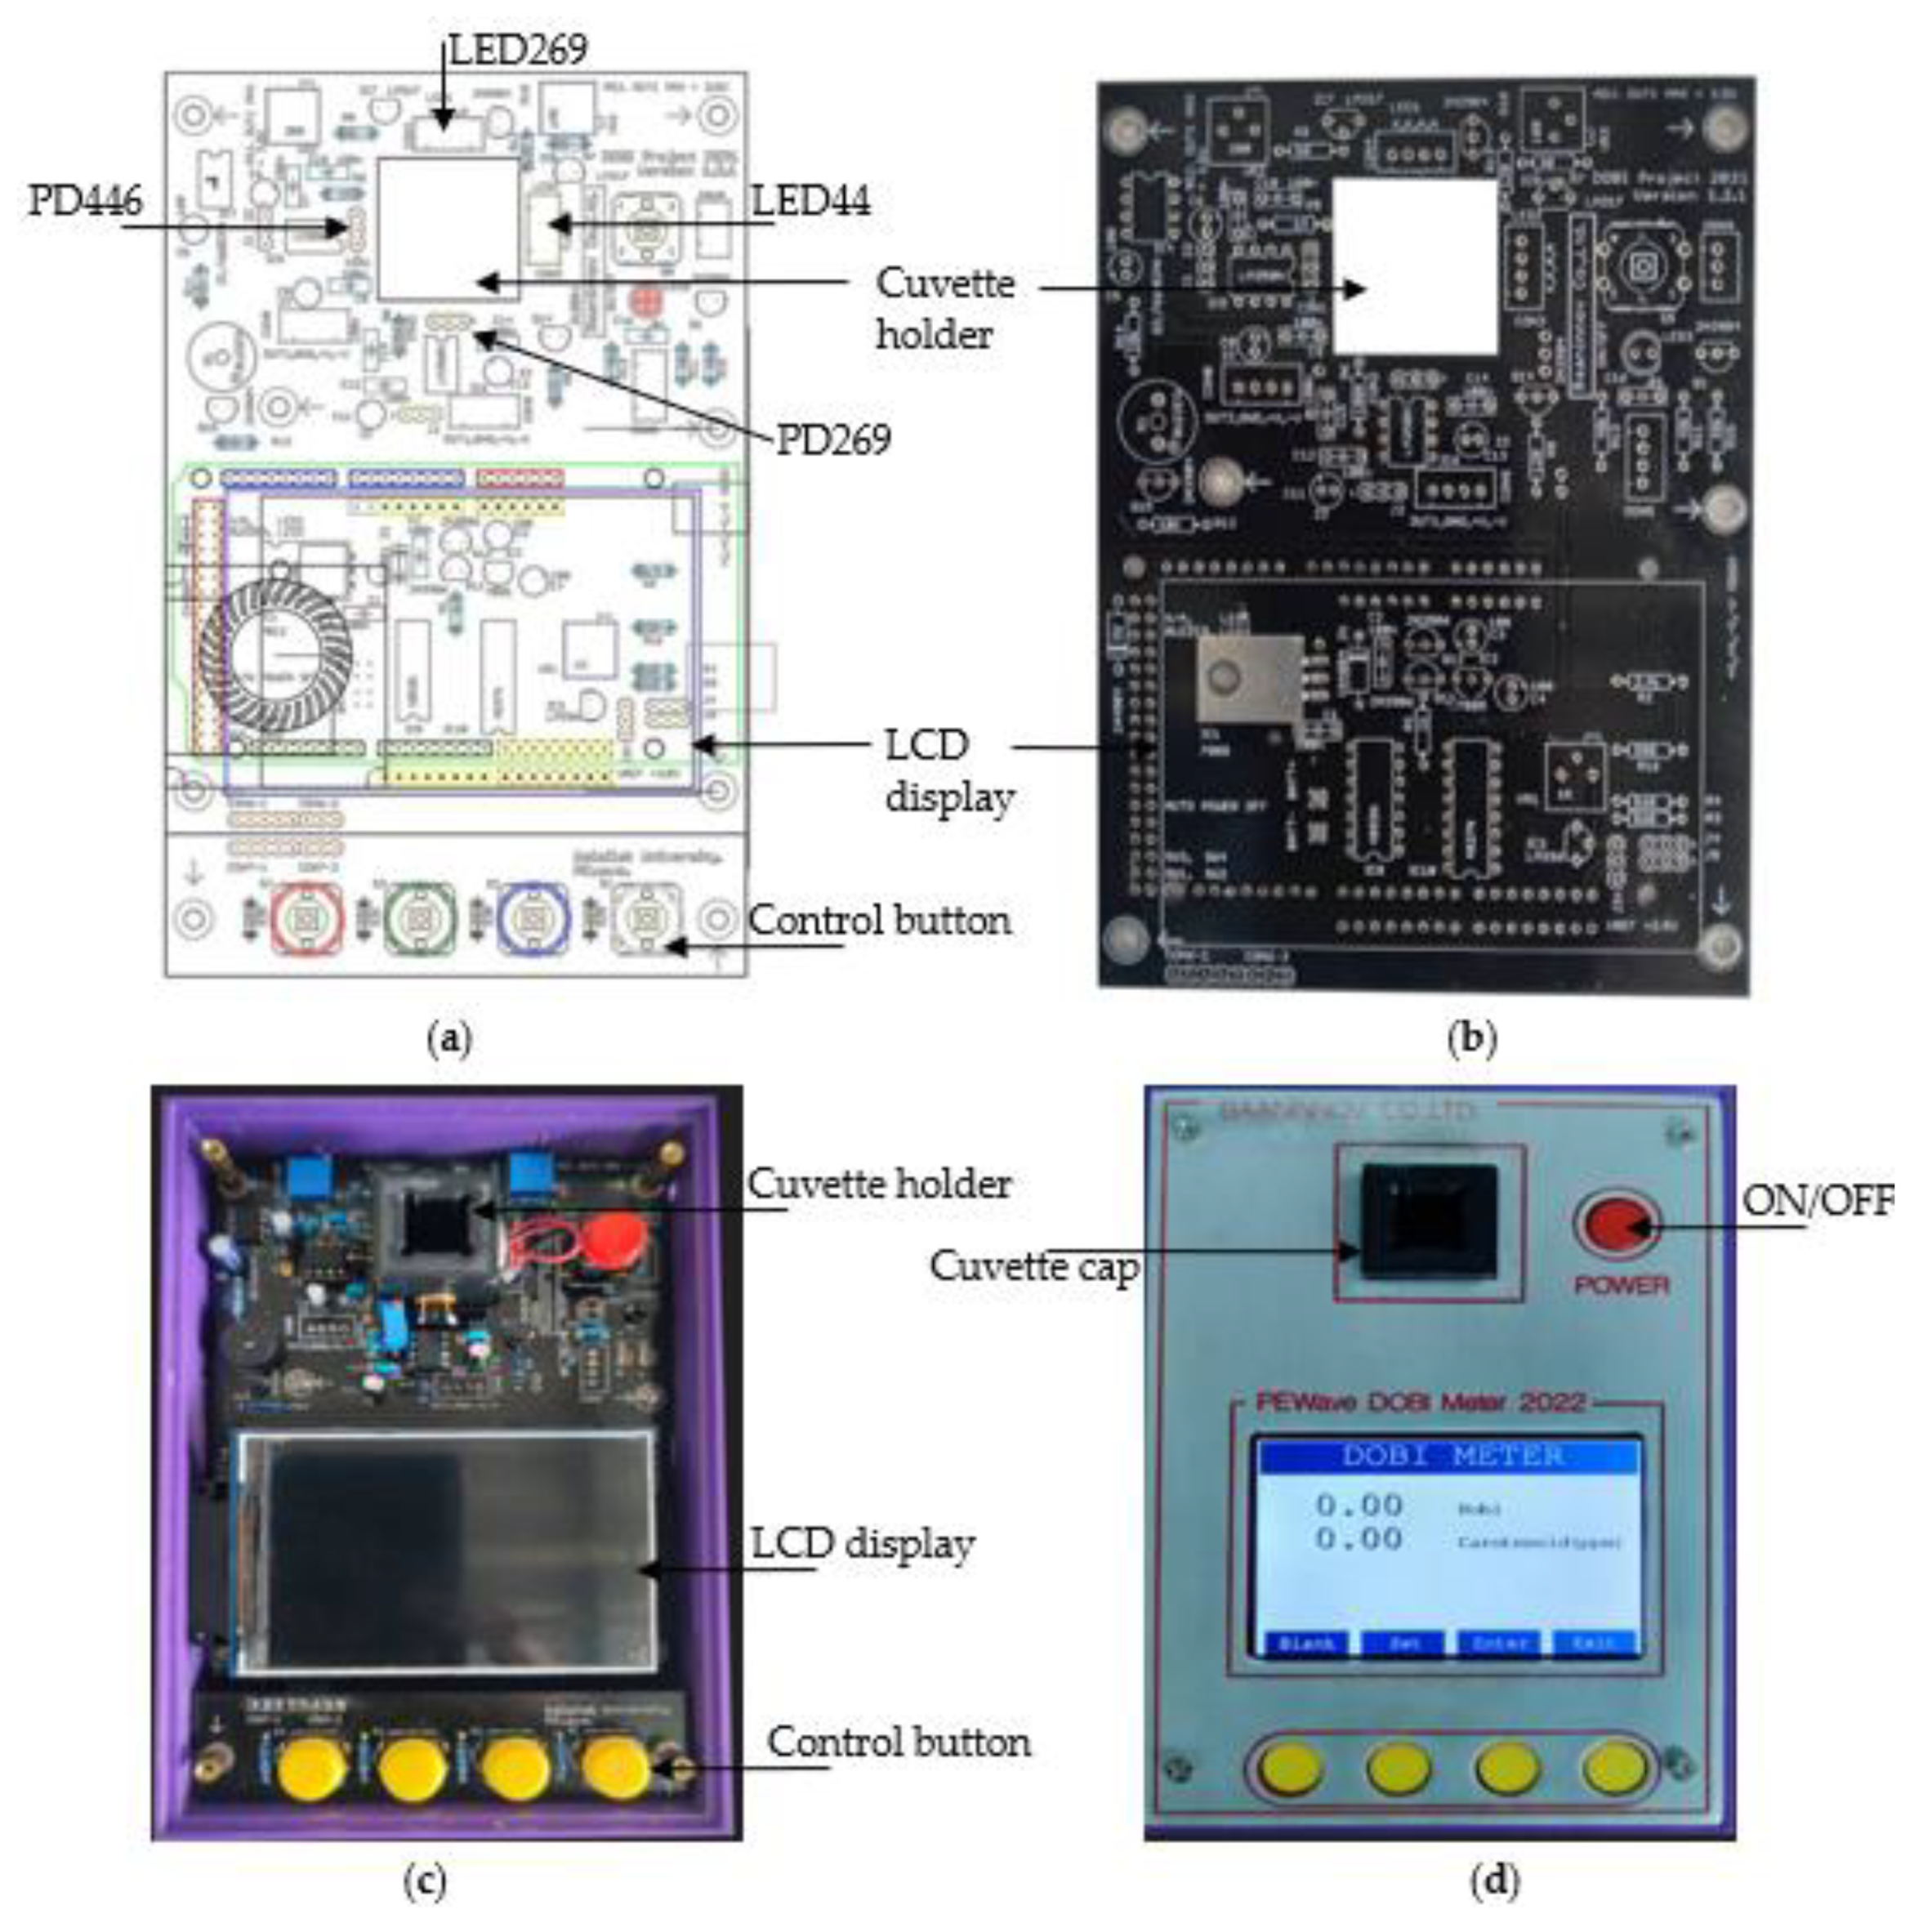
Figure 11.
Flowchart of the software DOBI meter.
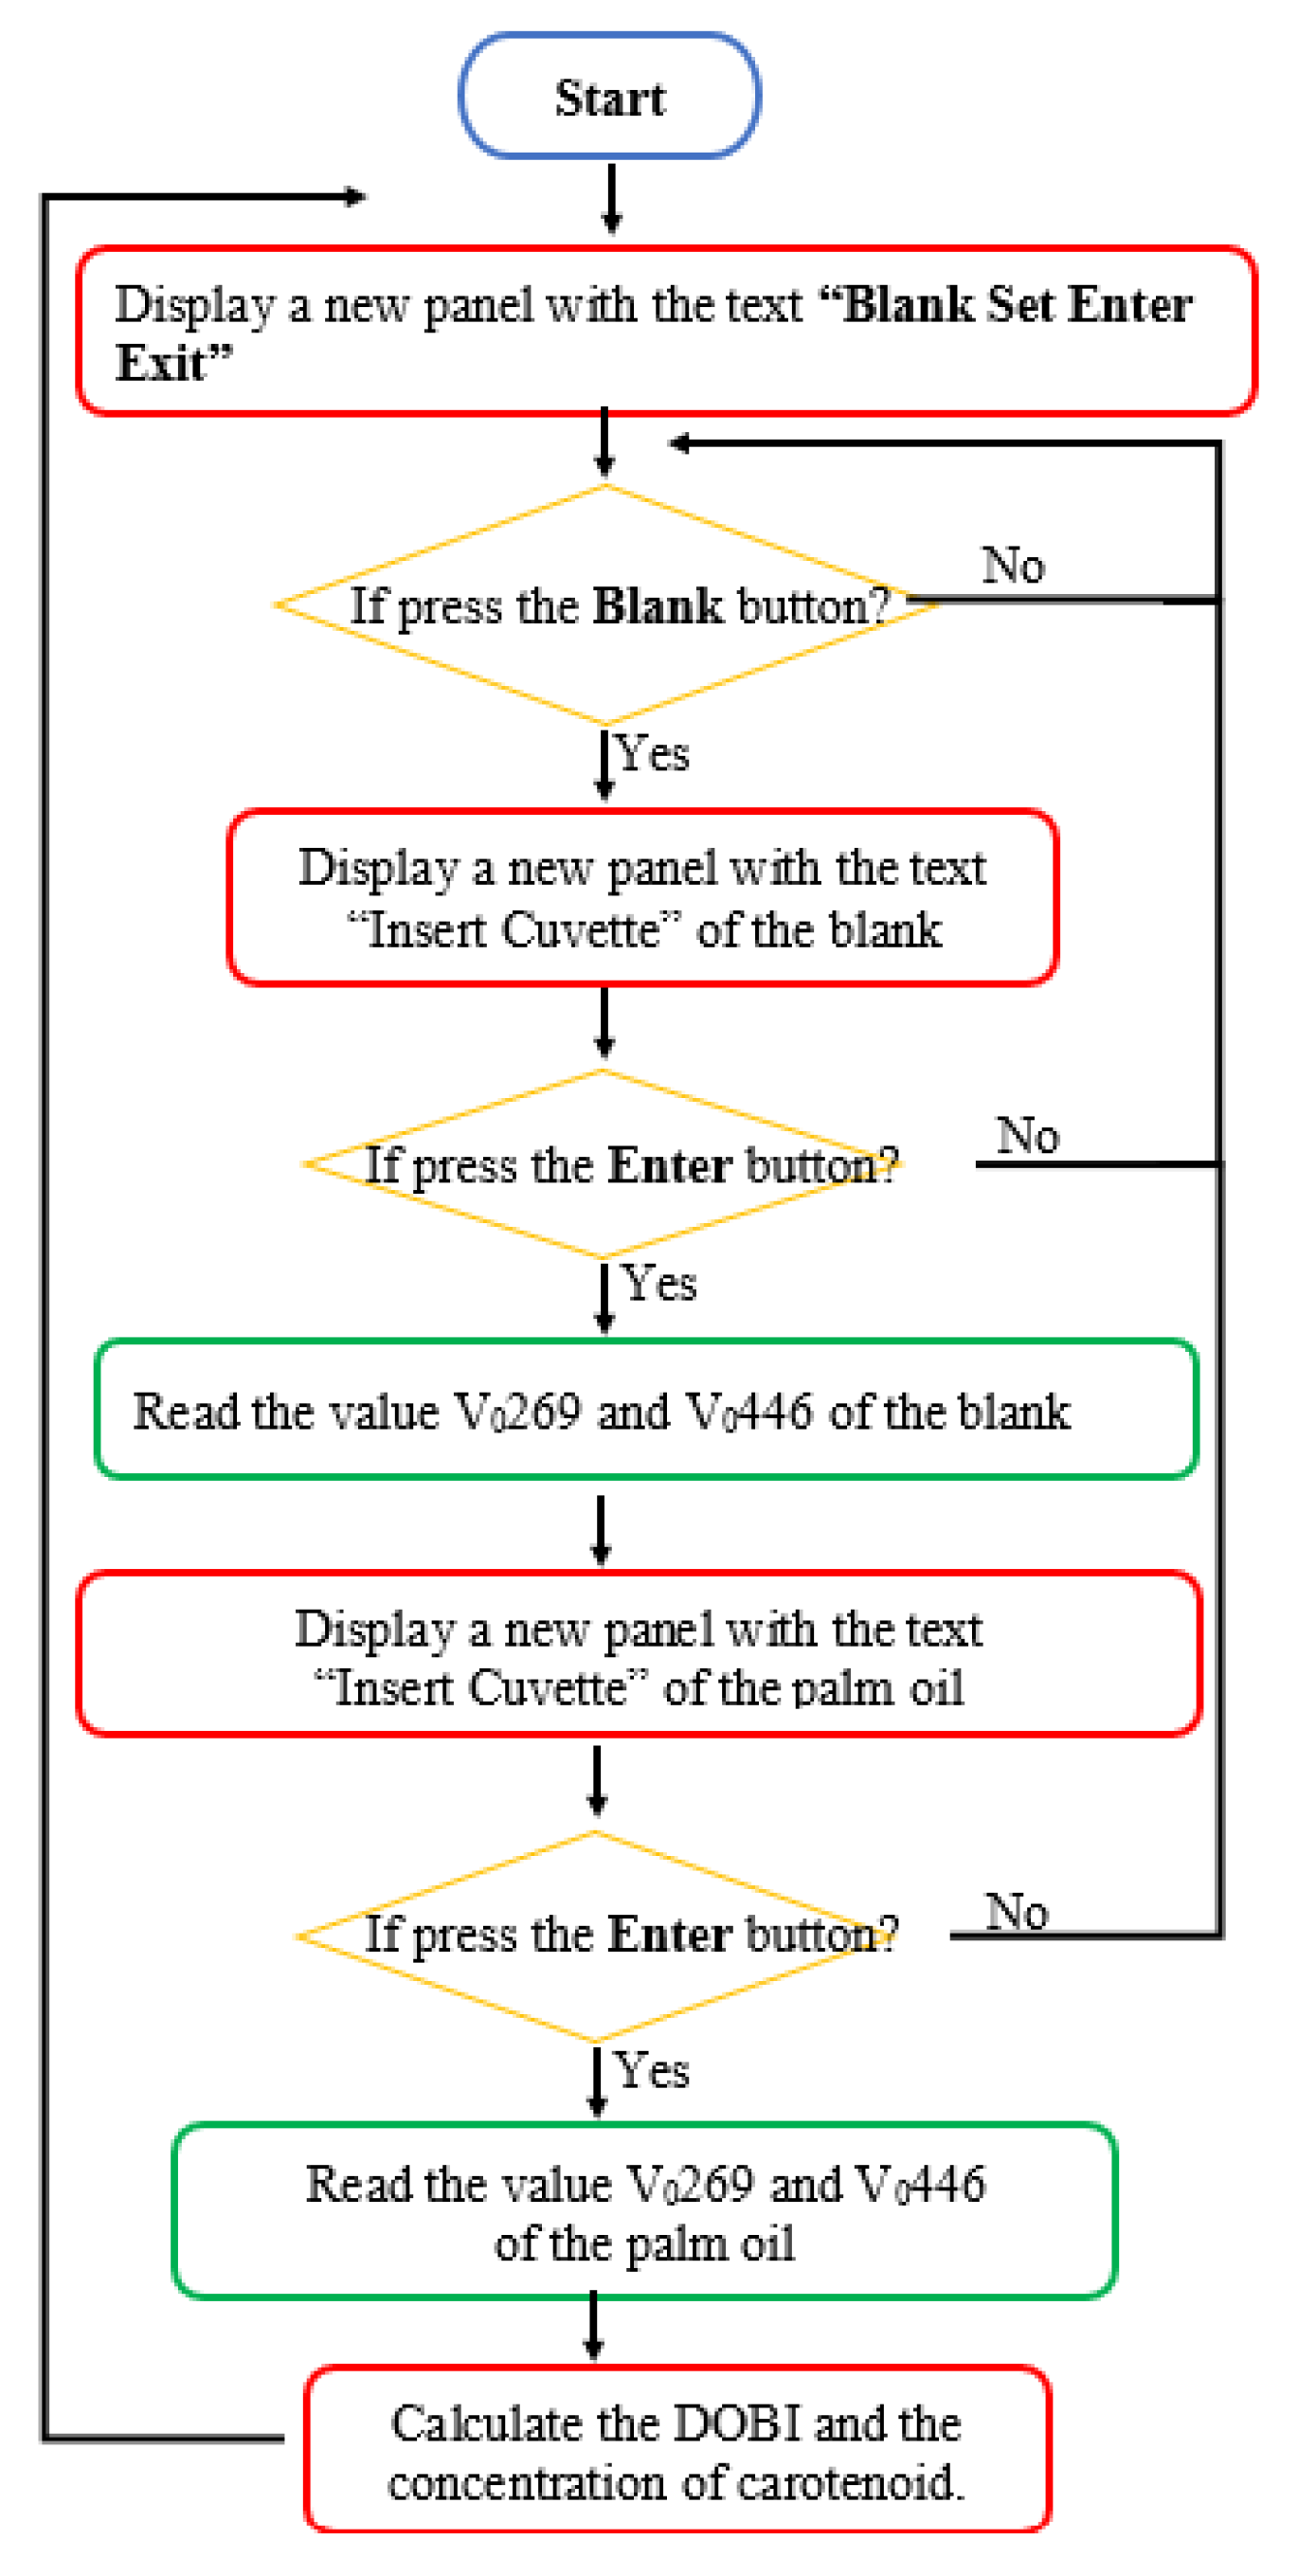
Figure 12.
Experimental setup for measurements of LED spectral and PD response.
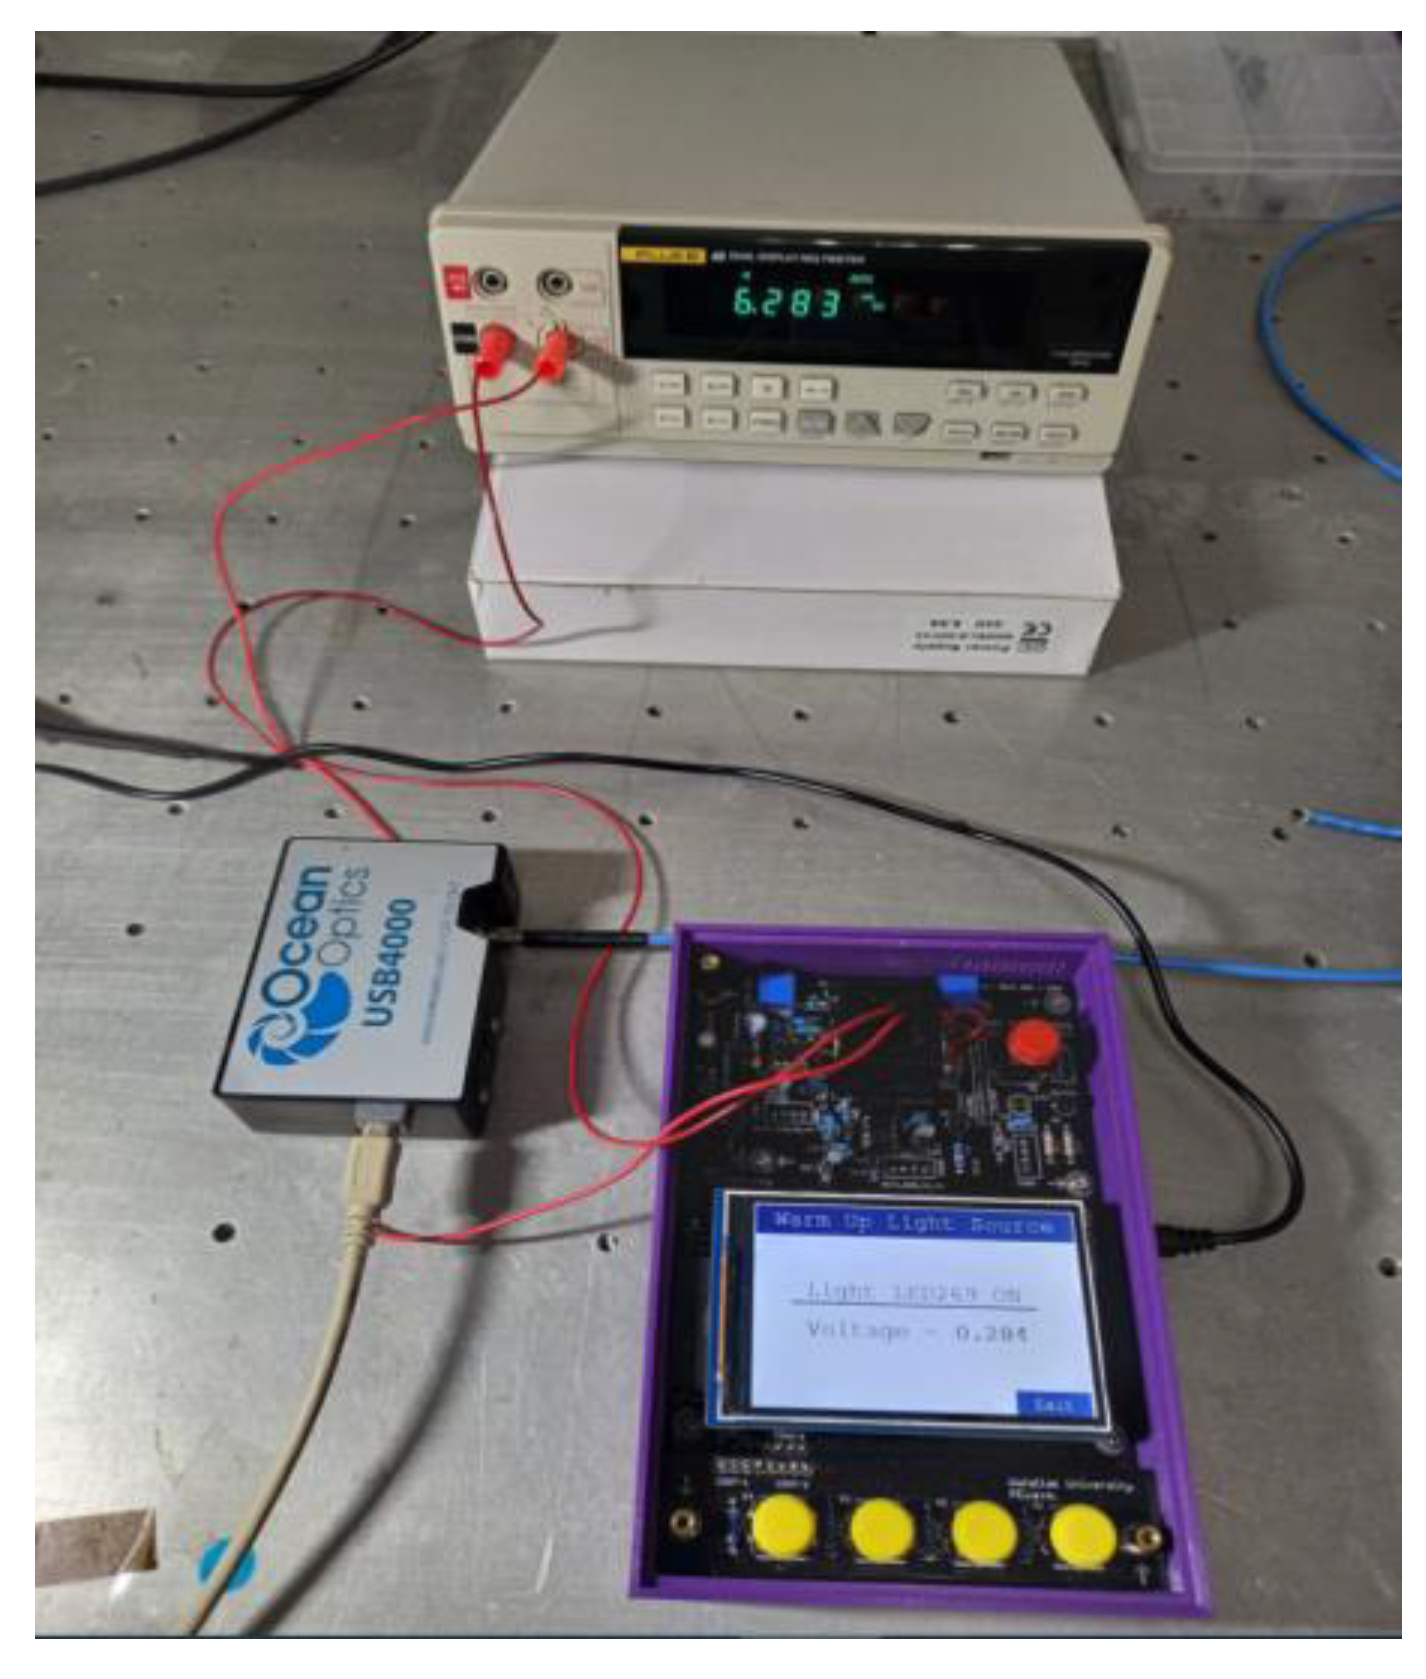
Figure 13.
The calibration procedure of the DOBI meter.
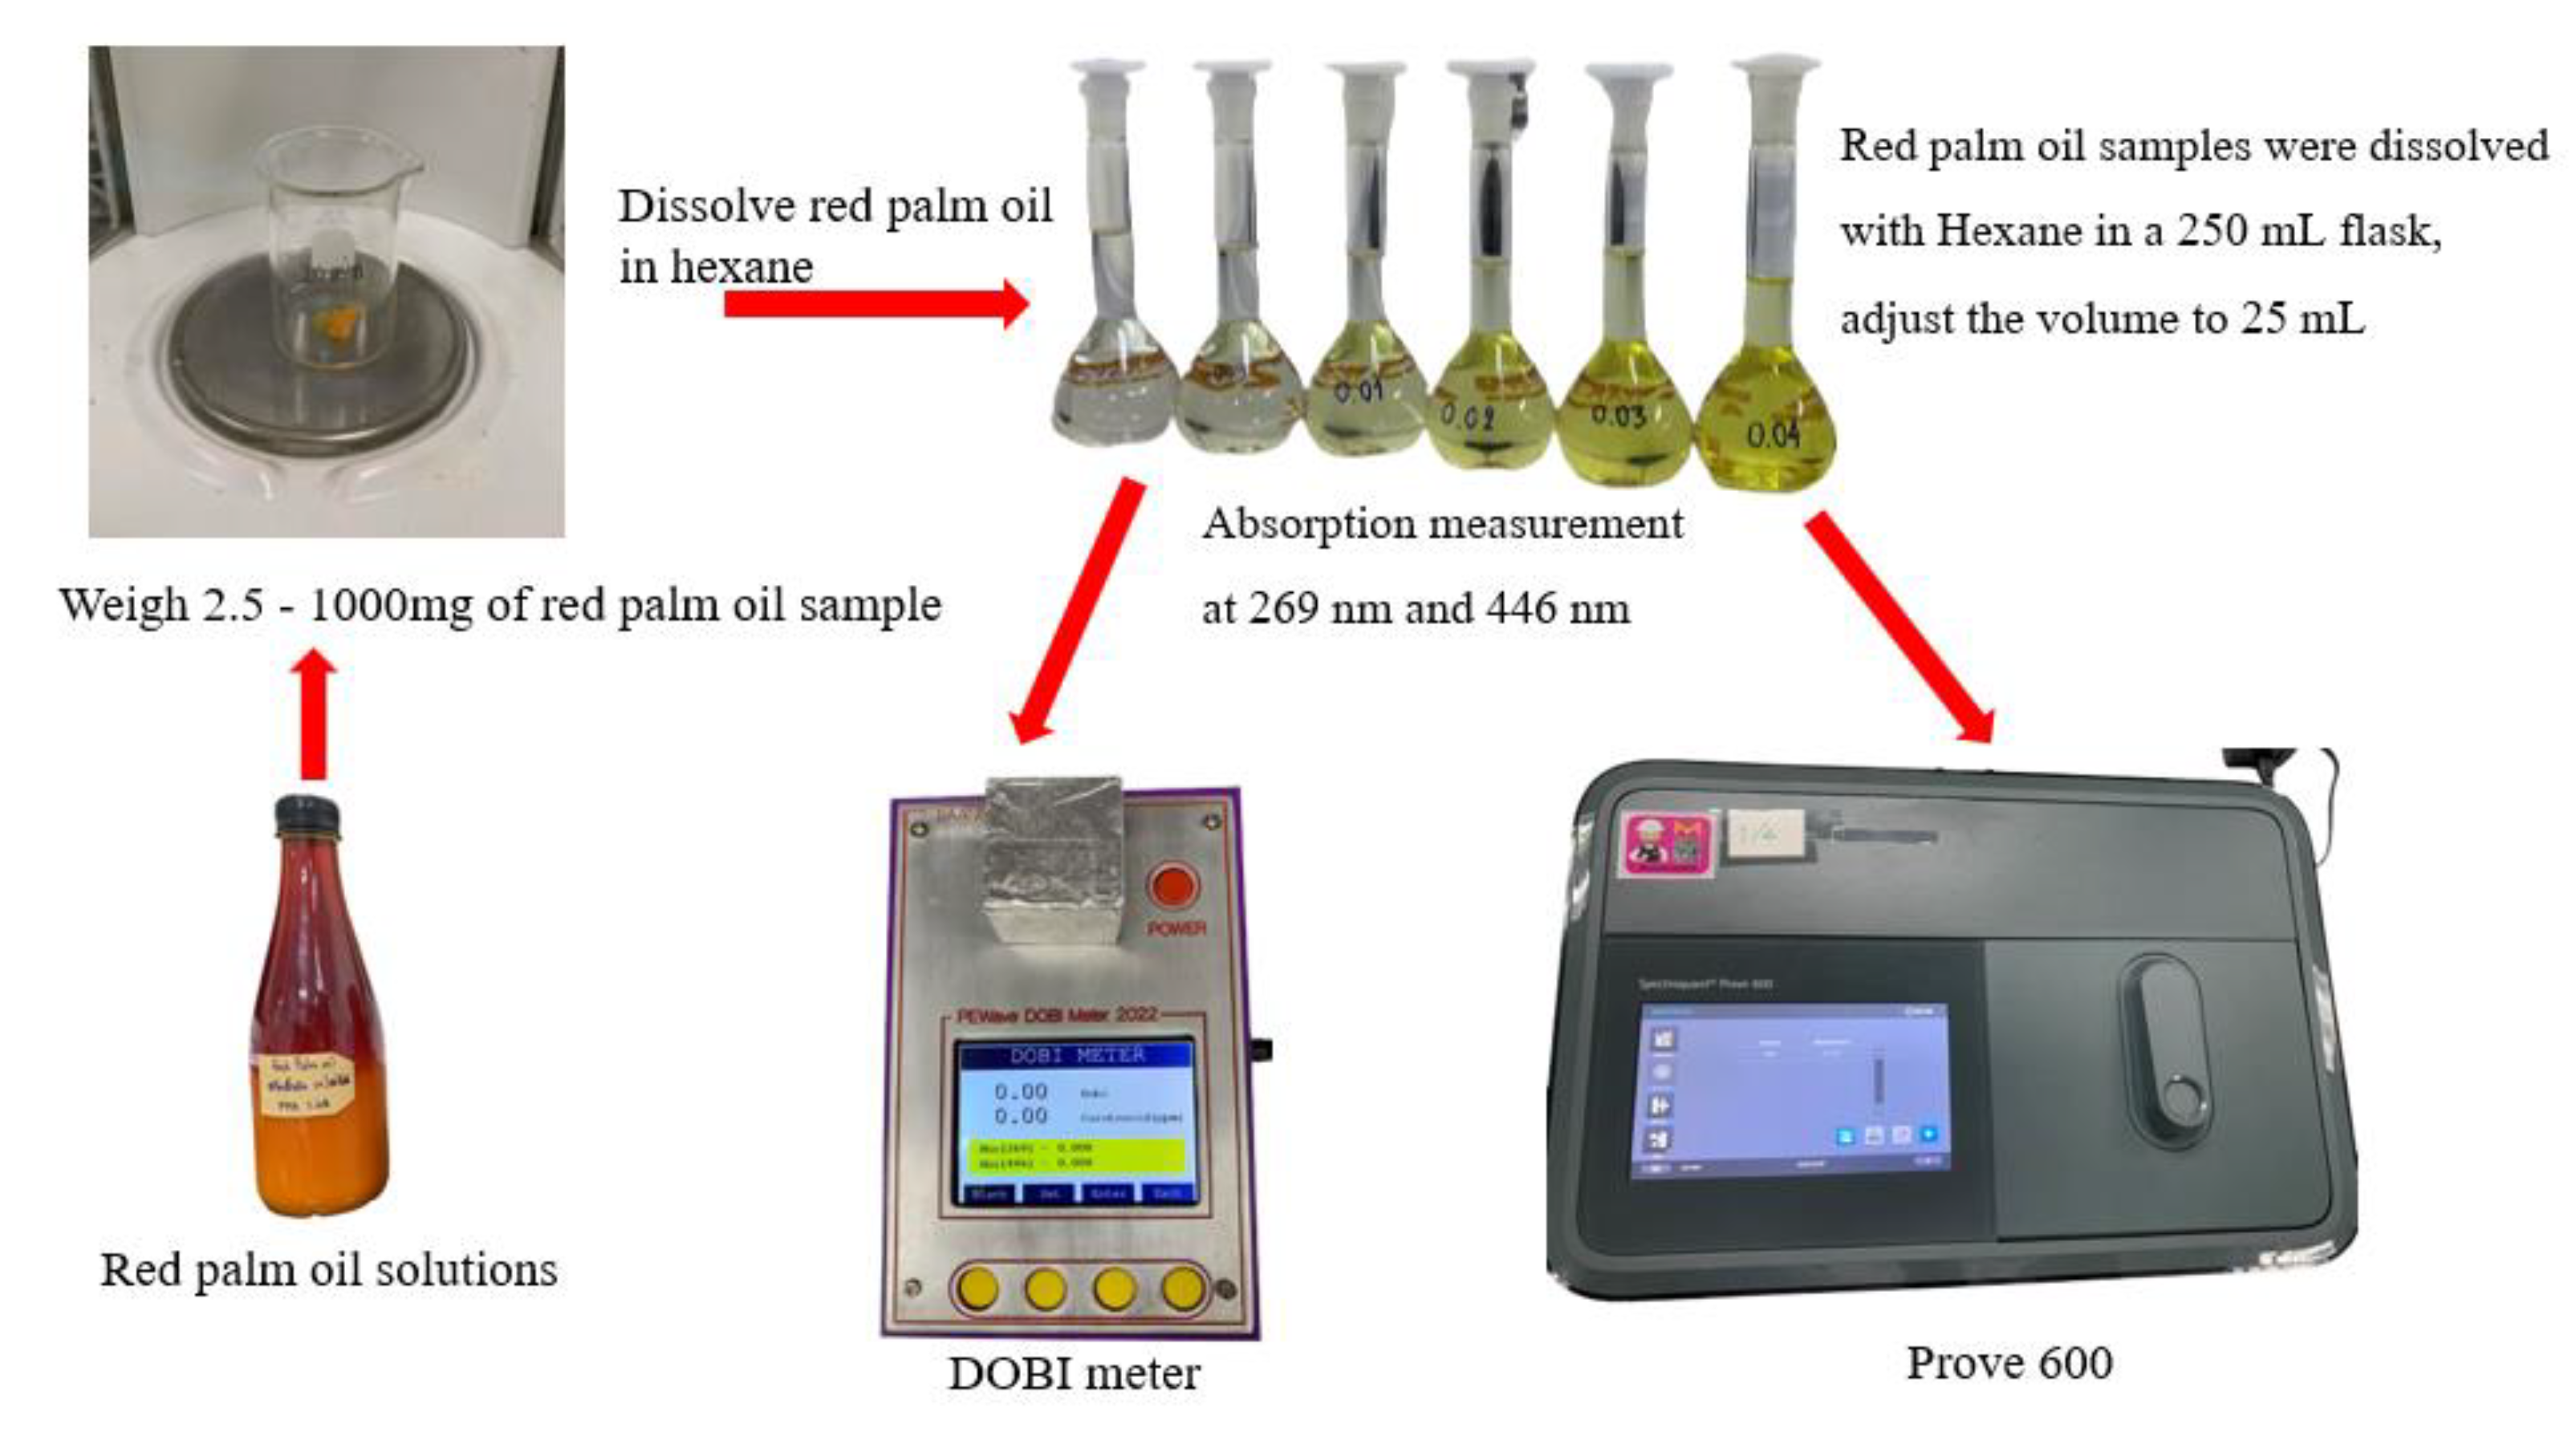
Figure 14.
The calibration procedure of the DOBI meter.
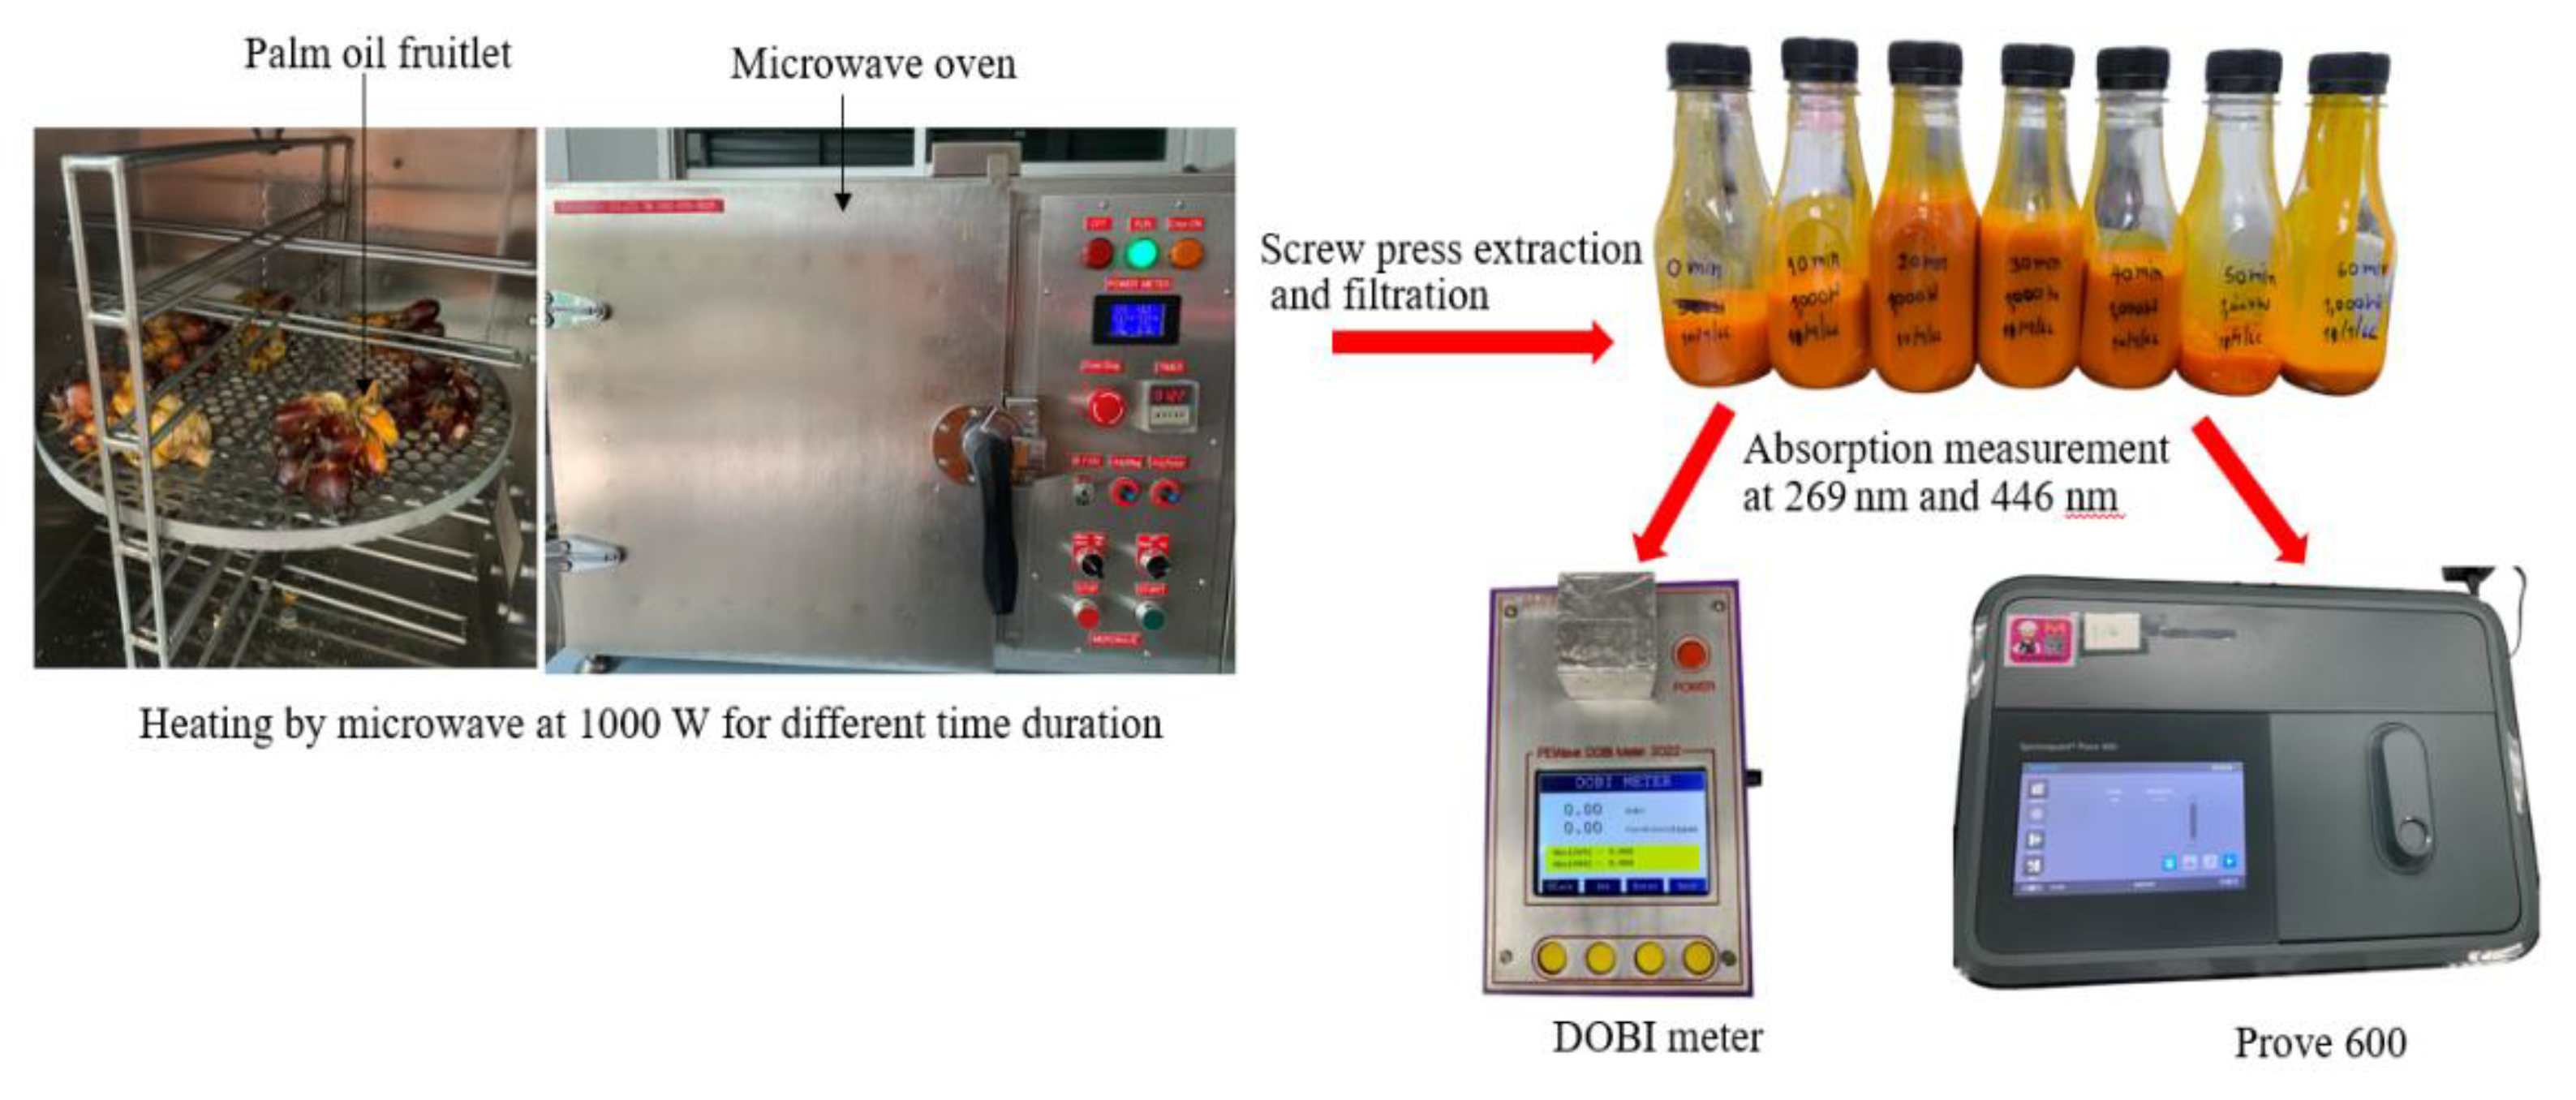
Figure 15.
(a,b) show the relative emission spectra of UV and Visible LEDs.
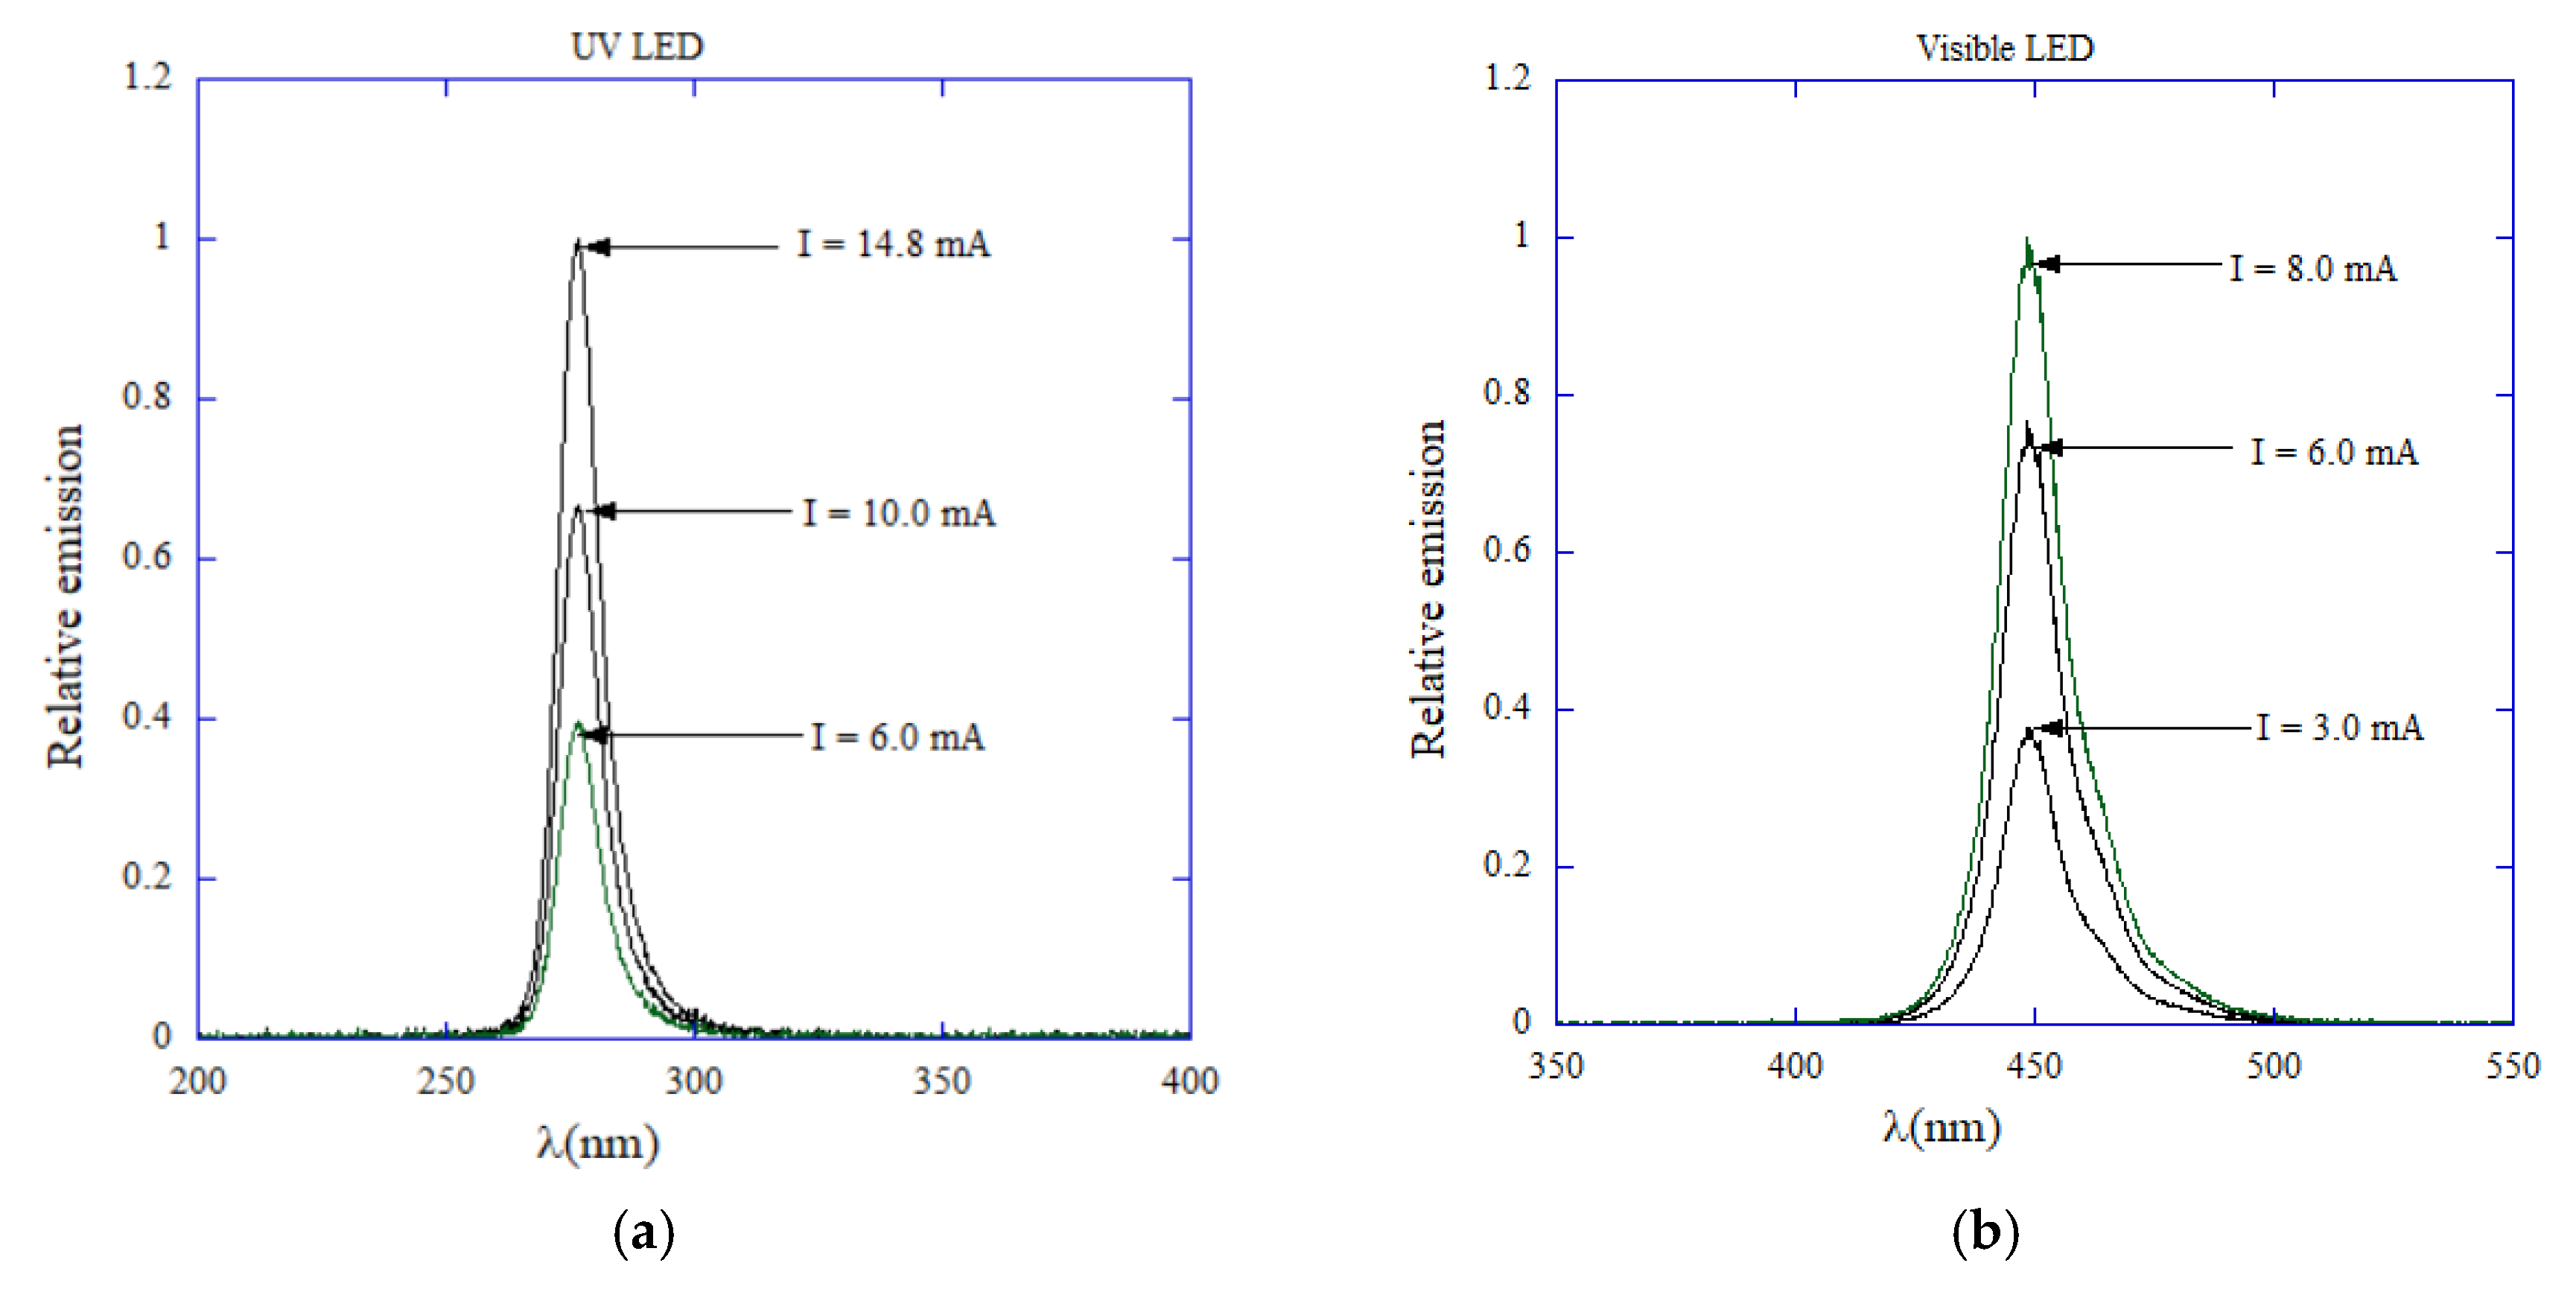
Figure 16.
(a) Linear dependence of peak intensities I0 on driving current I for LED-269 and LED-446, and (b) linear dependence of voltage difference Vabs on I0 for PD-269 and PD-446.
Figure 16.
(a) Linear dependence of peak intensities I0 on driving current I for LED-269 and LED-446, and (b) linear dependence of voltage difference Vabs on I0 for PD-269 and PD-446.
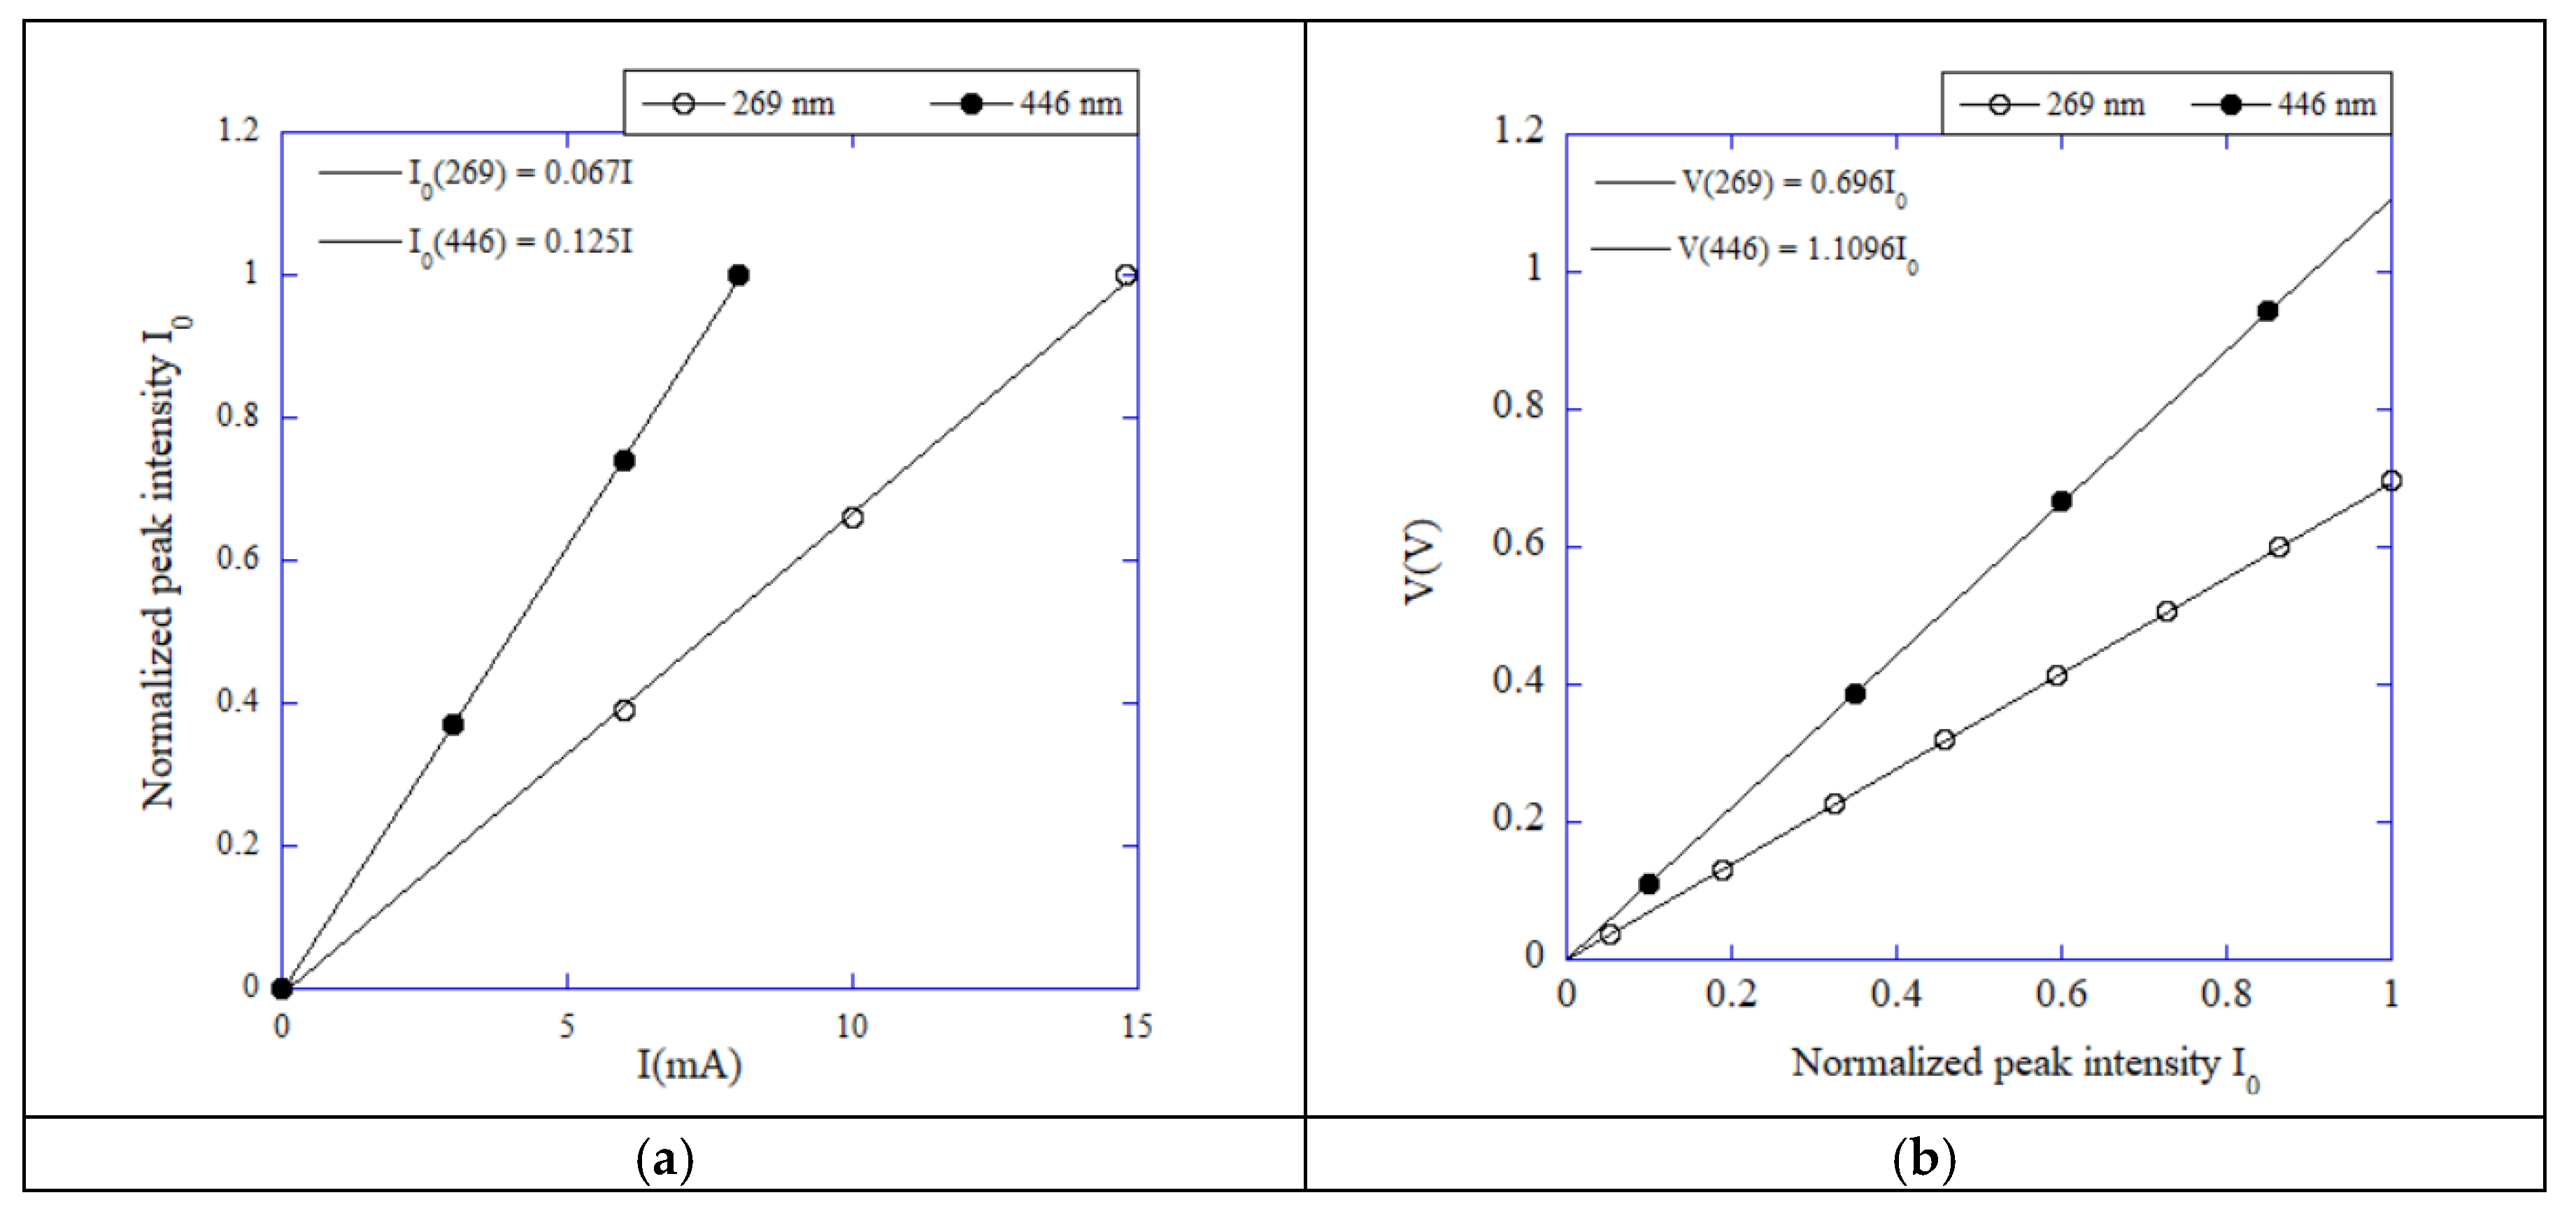
Figure 17.
UV (a) The linear dependence of absorbance on concentration (standard curve) obtained by DOBI meter and spectrophotometer Prove 600 for λ = 269 nm and (b) the modified standard curves obtained by the ratio between the slopes in (a).
Figure 17.
UV (a) The linear dependence of absorbance on concentration (standard curve) obtained by DOBI meter and spectrophotometer Prove 600 for λ = 269 nm and (b) the modified standard curves obtained by the ratio between the slopes in (a).
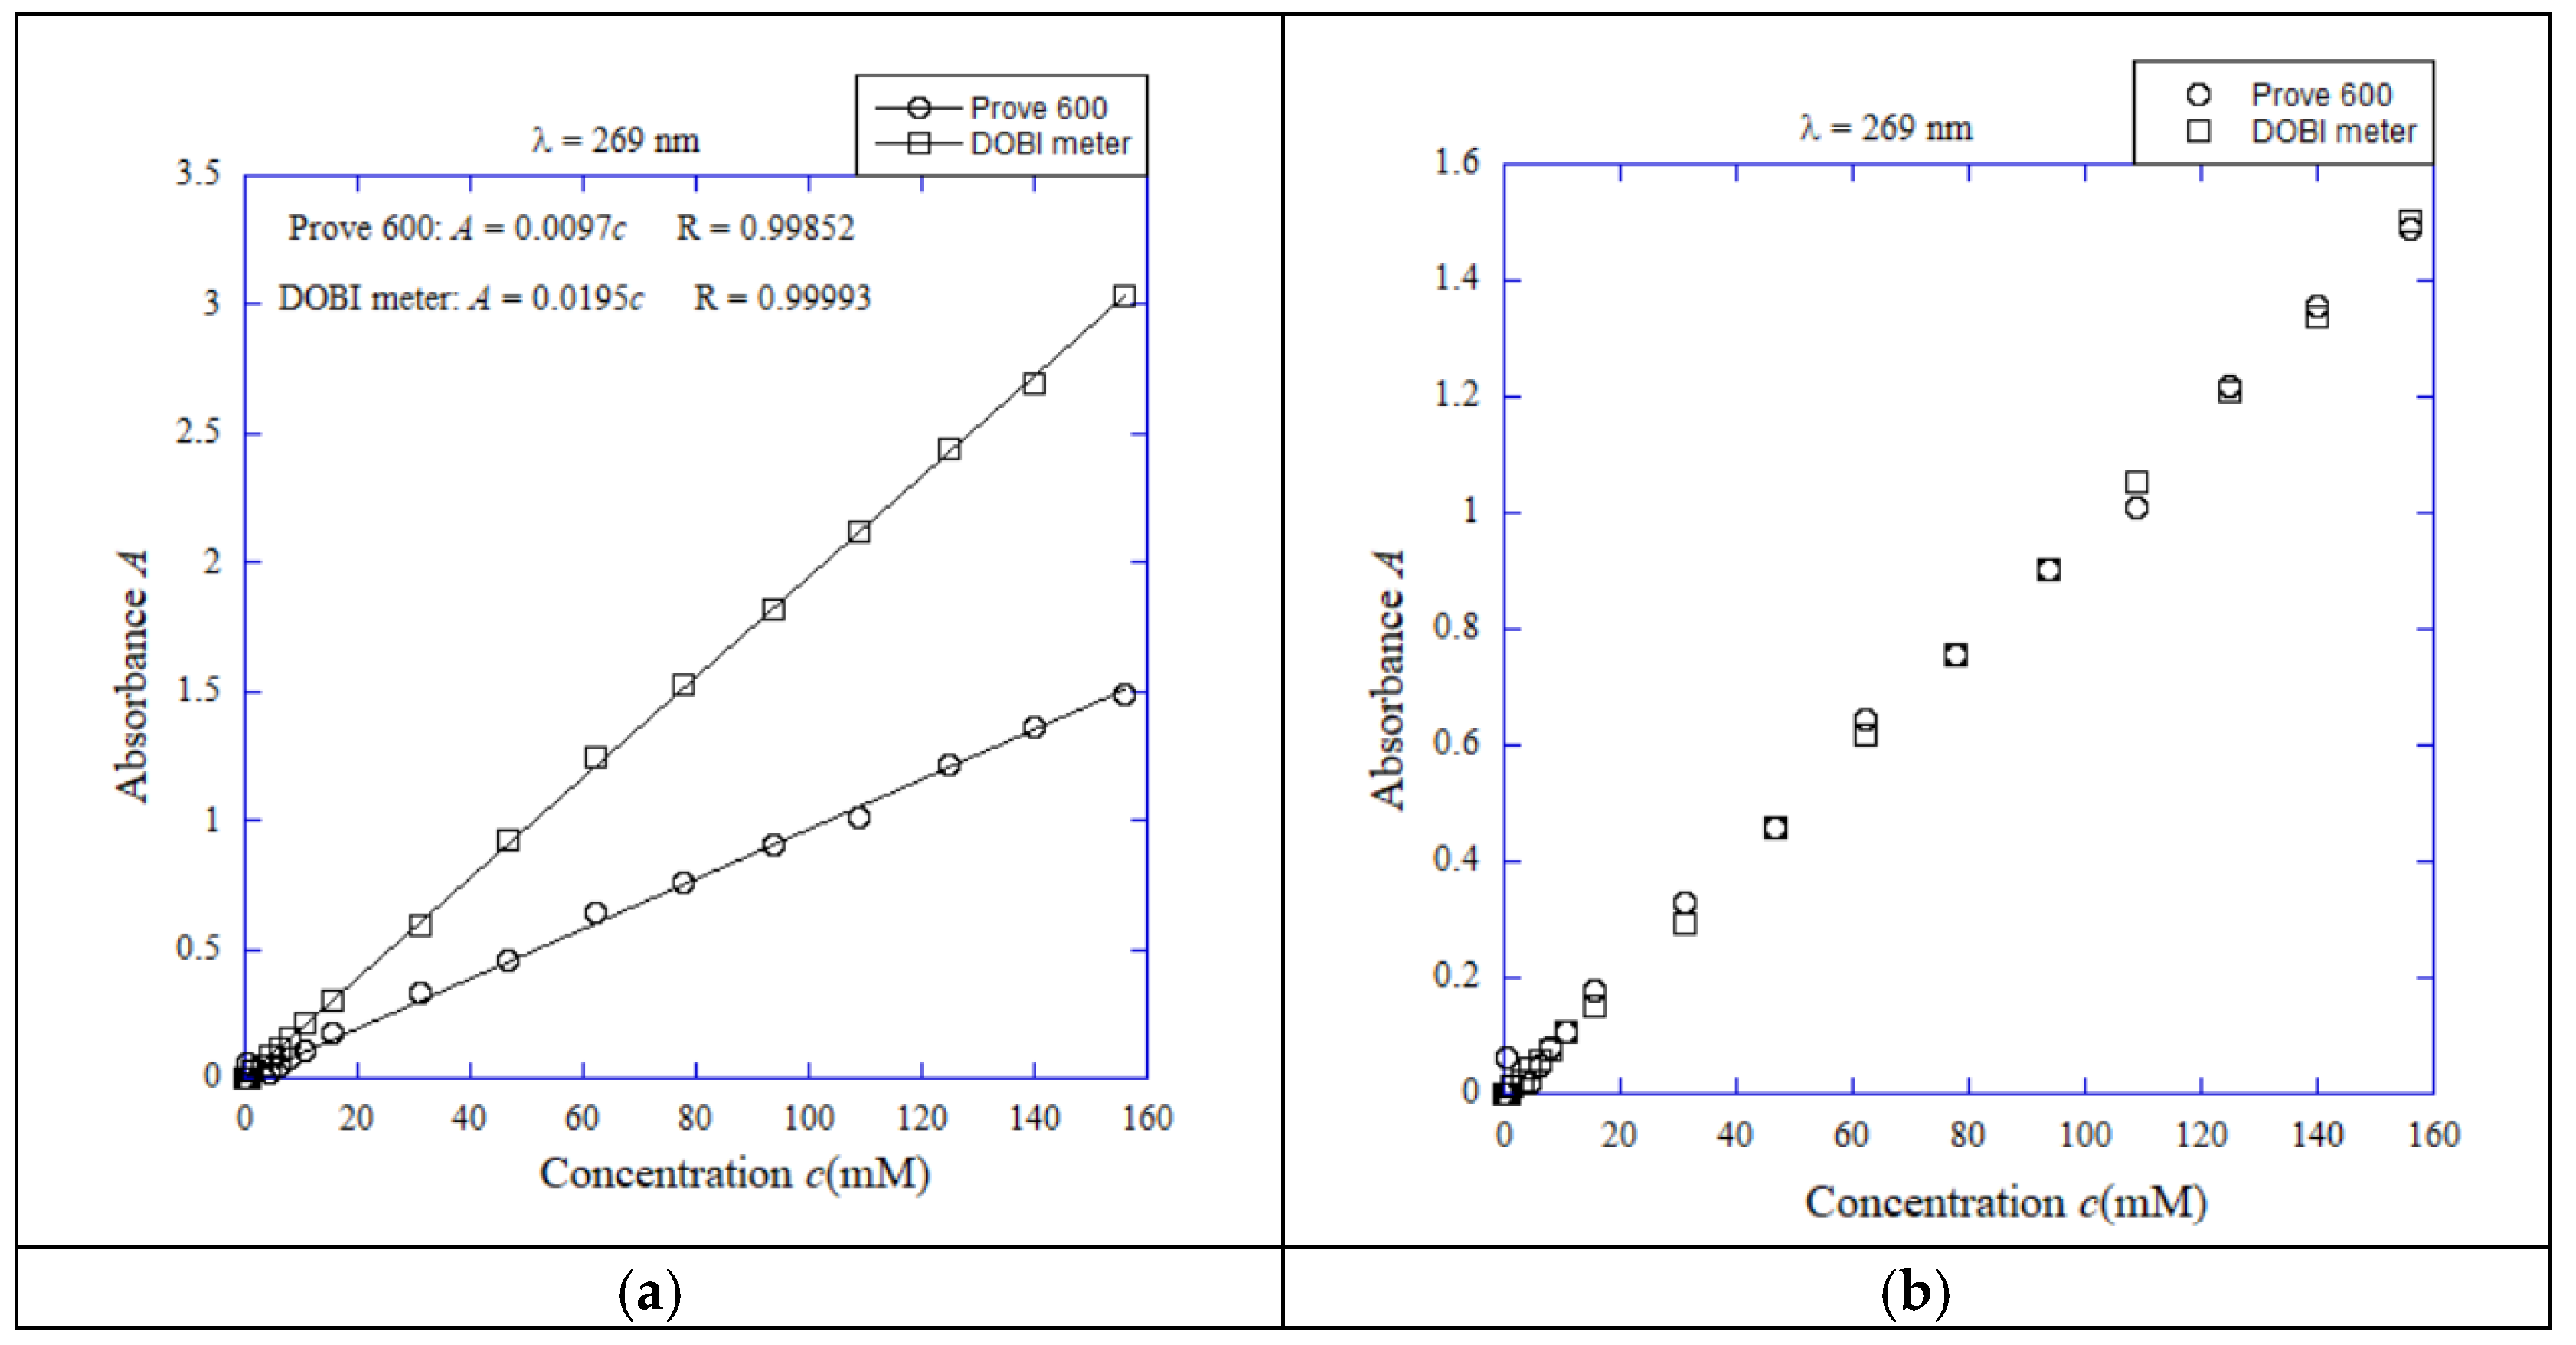
Figure 18.
UV (a) The linear dependence of absorbance on concentration (standard curve) obtained by DOBI meter and spectrophotometer Prove 600 for λ = 269 nm and (b) the modified standard curves obtained by the ratio between the slopes in (a).
Figure 18.
UV (a) The linear dependence of absorbance on concentration (standard curve) obtained by DOBI meter and spectrophotometer Prove 600 for λ = 269 nm and (b) the modified standard curves obtained by the ratio between the slopes in (a).
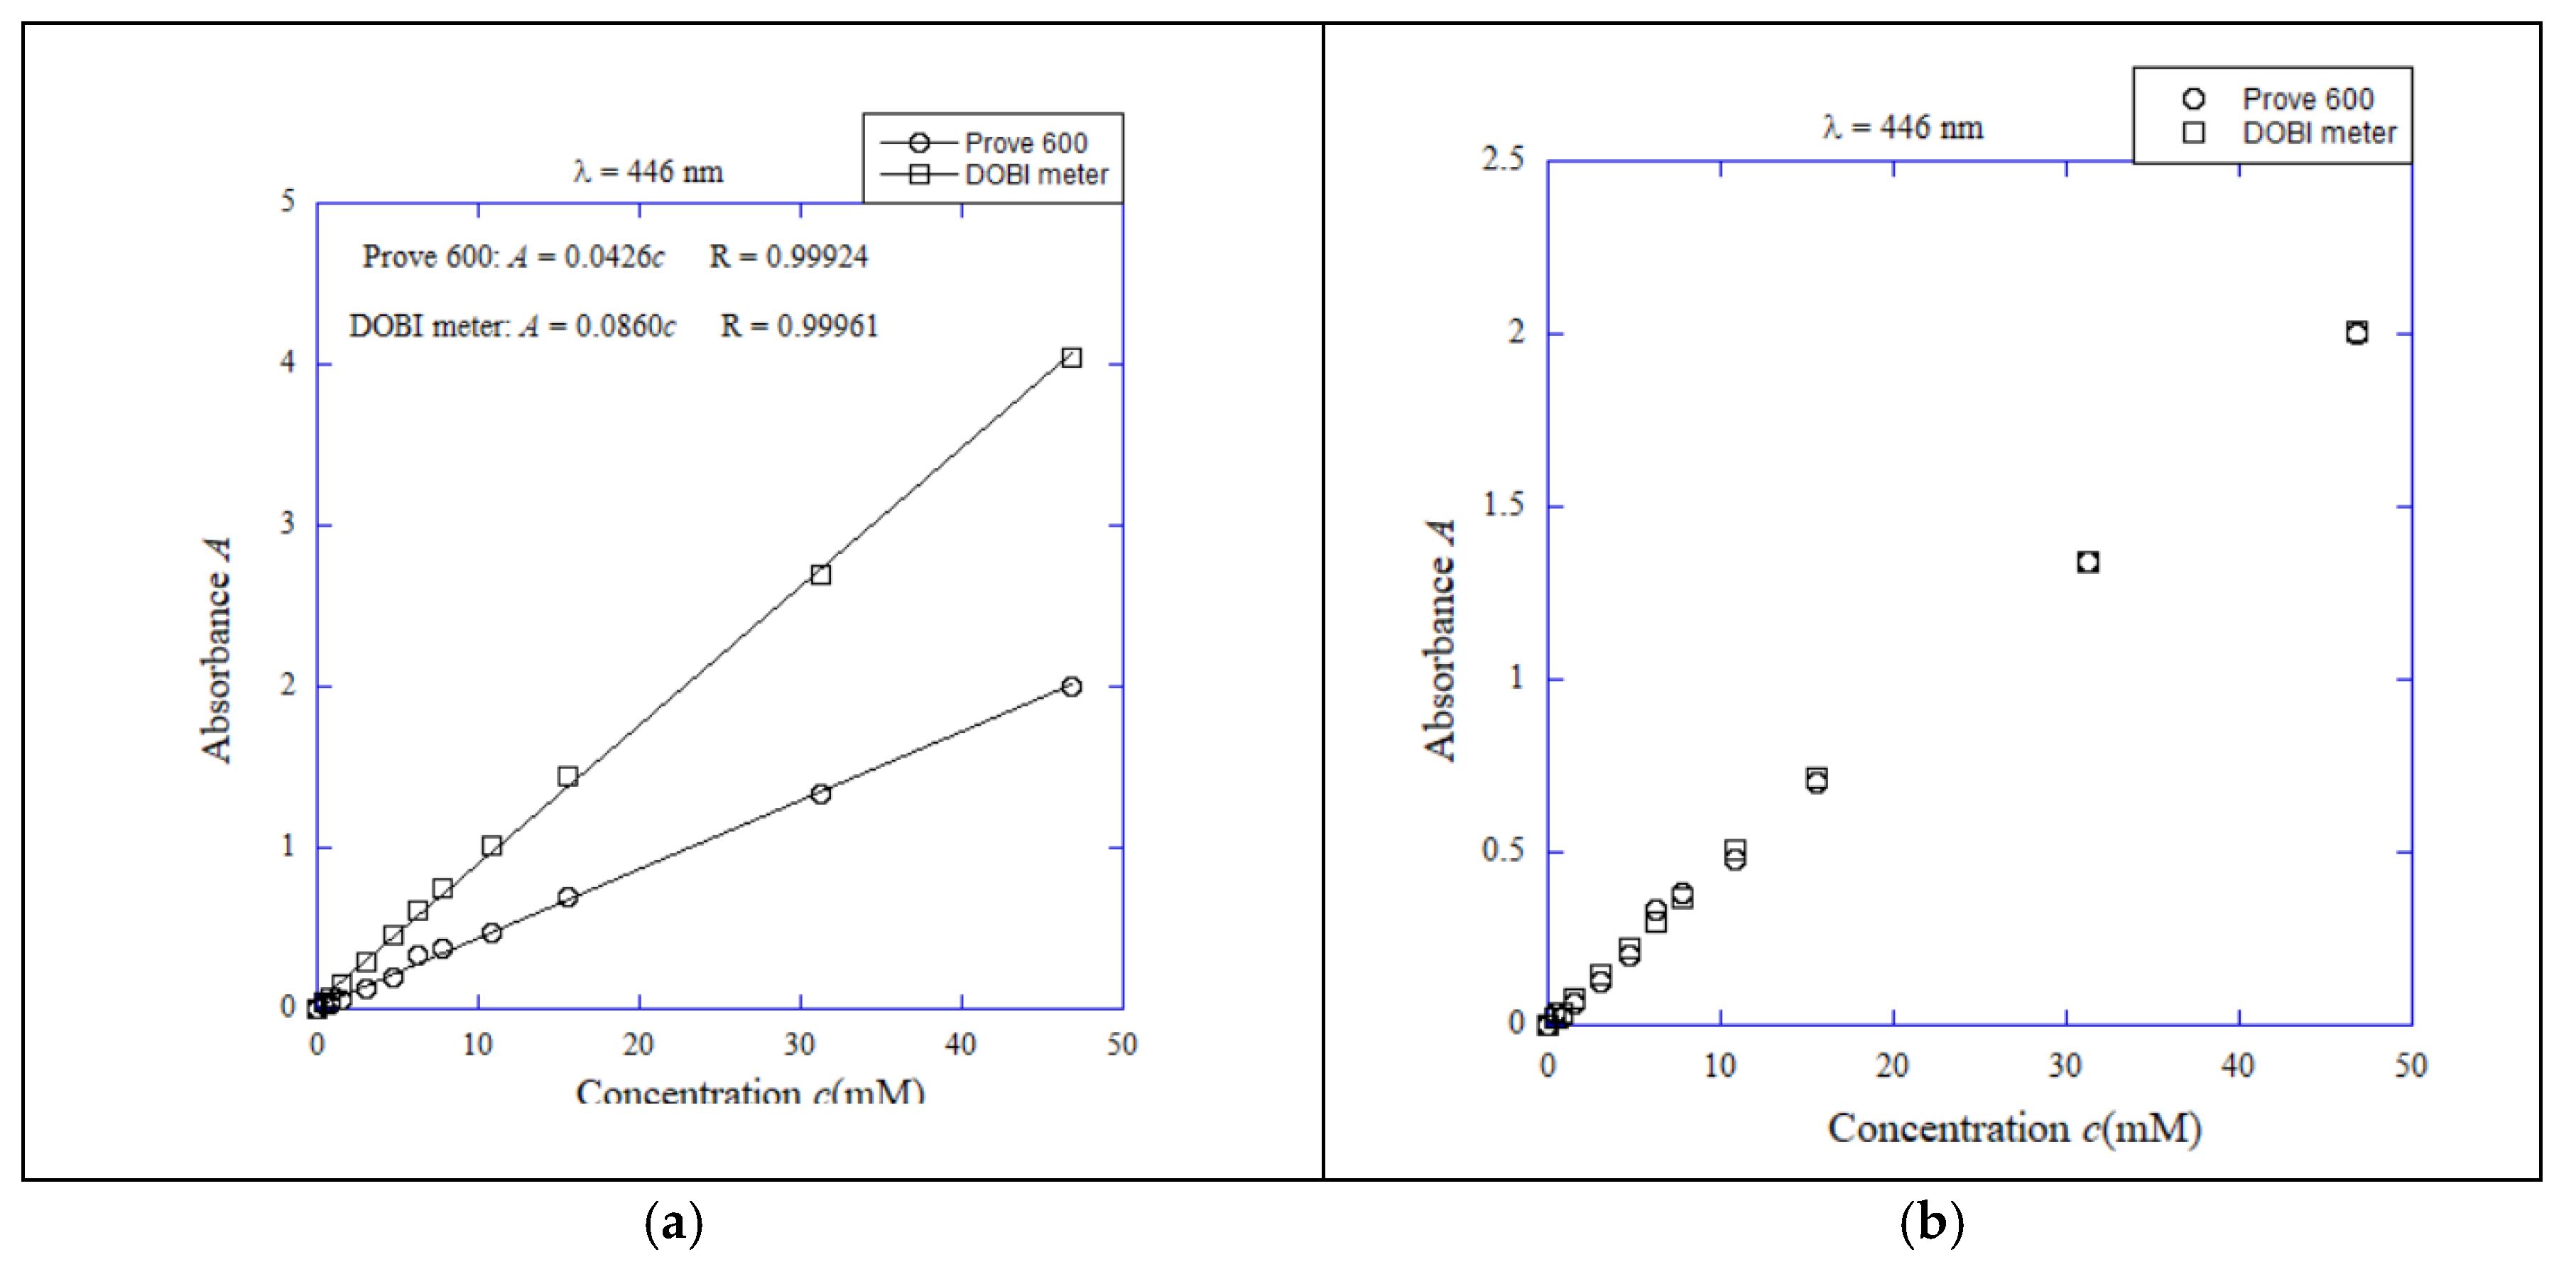
Figure 19.
(a) The concentration of carotenoids and (b) DOBI value measured in red palm oil heated using a 1000 W microwave for varying durations using Prove 600 and DOBI meter.
Figure 19.
(a) The concentration of carotenoids and (b) DOBI value measured in red palm oil heated using a 1000 W microwave for varying durations using Prove 600 and DOBI meter.
Disclaimer/Publisher’s Note: The statements, opinions and data contained in all publications are solely those of the individual author(s) and contributor(s) and not of MDPI and/or the editor(s). MDPI and/or the editor(s) disclaim responsibility for any injury to people or property resulting from any ideas, methods, instructions or products referred to in the content. |
© 2025 by the authors. Licensee MDPI, Basel, Switzerland. This article is an open access article distributed under the terms and conditions of the Creative Commons Attribution (CC BY) license (http://creativecommons.org/licenses/by/4.0/).
Copyright: This open access article is published under a Creative Commons CC BY 4.0 license, which permit the free download, distribution, and reuse, provided that the author and preprint are cited in any reuse.