
Submitted:
10 September 2025
Posted:
11 September 2025
You are already at the latest version
Abstract
Background/Objectives: The purpose of this study was to evaluate the nutrient compo-sition of selected arthropods (insects and crustaceans) and lentil, and to investigate their effects as dietary protein sources on gut microbiota, host metabolism, and associated metabolites. Methods: A total of 63 male Wistar rats were randomly assigned to eight experimental groups and fed diets adjusted to 20% protein from different sources: control (C), cricket (CR), acocil (AC), chinicuil (CHI), beef (B), picanha (P), egg (E), and lentil (L). Diets were administered for 45 days. At the end of the intervention, serum was collected to assess biochemical parameters and microbiota-derived metabolites, liver samples were obtained for histological analysis, and feces were collected for intestinal microbiota pro-filing. Results: Nutritional analysis revealed that L, CR, AC, and CHI contained signif-icantly lower concentrations of choline, carnitine, and phosphatidylcholine—precursors of trimethylamine-N-oxide—than animal-derived sources (E, B, P). CHI was enriched in oleic acid, CR in linolenic acid, and L in linoleic acid, while L also displayed significantly lower cholesterol levels than E. CR, AC, and CHI had the highest chitin contents, followed by L. Consumption of CR or L significantly reduced fat mass, improved glucose sensi-tivity, and lowered hepatic cholesterol and triglycerides compared with E. CHI enhanced hepatic fatty acid β-oxidation. Gut microbiota analysis showed comparable α-diversity after CR, AC, L, and B diets, while high-fat sources (CHI, P, E) reduced diversity. CR increased Faecalibacterium prausnitzii, associated with antioxidant activity, whereas L promoted Bifidobacterium bifidum, inversely related to liver lipids. Both CR and L reduced circulating LPS and glucose AUC. Conclusions: These findings suggest that CR and L represent sustainable and health-promoting protein sources.
Keywords:
insects
; lentil
; gut microbiota
; sustainable food
; chitin
; LPS
1. Introduction
According to United Nations, the global population is expected to reach 9.7 billion in 2050(1). Consequently, it is expected that the demand for food will increase by about 60% in the coming decades [1]. Also, climate change, high CO2 emissions, land availability and rising levels of urbanization will continue to threaten food production. According to the Food and Agriculture Organization of the United Nations, it is expected a progressive decline in global agricultural productivity of about 1% per year [2]. Hence, a change in food consumption patterns has been described as inevitable. In general, the production of plant foods is more efficient than animal foods [3]. The livestock mainly ruminants produce large amounts of greenhouse gas emissions and about 70 % of agricultural land and 30 % of the global land surface is used for livestock production [4]. One kg production of insects requires 94% less land, 90% less water and 88% less fuel than one kg of beef [5,6]. In addition, one of the food components that are usually ingested in a lesser proportion than recommended is dietary fiber. Chitin is a polysaccharide composed of N-acetyl-2-deoxyglucose (GlcNAc) units linked by -(1-4) bonds and is found in in some insects [7] and could be a good source of fiber. In recent years the consumption of adequate amounts of fiber has been studied because of their effect on the gut microbiota as prebiotics. The fatty acid profile of edible insects has less explored and its possible effect on biochemical parameters has been less studied. On the other hand, 2 billion people around the world already eat insects to supplement their diet [8], however there is no much information about the effect of insects consumption on gut microbiota and whether the type of insects play a role in health. Insects are a staple in diets in parts of Asia, Africa and Latin America [9,10,11,12] and are consumed because of their taste, however there is not much information about of its possible beneficial effects on health. Therefore, the purpose of the present work was to study the different components of the insects and other different sources of proteins to compare their effect on gut microbiota, metabolites derived of gut microbiota and its effect on different biochemical parameters to understand the possible beneficial effect on health.
2. Materials and Methods
2.1. Proximal Chemical Analysis in Food
The different foods used in the study were cooked, dehydrated in an oven at 55 °C for 12 hours. Subsequently, they were ground and samples were taken for proximal chemical analysis. Protein, total ash, fat, fiber and carbohydrate content of the powdered foods were determined in duplicate for each food. The Kjeldahl method was employed to evaluate the protein composition of 2.0 g of the dried samples with a catalyst [13]. The protein content was calculated by multiplying the nitrogen content by 6.25. The soxhlet extraction apparatus was used in the determination of crude fat. The fat was thoroughly extracted from about 2 g of each dried sample, using petroleum ether as a solvent for the extraction. Crude fiber content was determined from the defatted samples by acid hydrolysis (1.25 % H2SO4) followed by base hydrolysis (1.25 % NaOH). The residue was then dried at 100 °C and weighed (W1). For 30 min, the dried sample was ignited in a muffle furnace at 600 °C. The resulting ash was weighed, cooled in a desiccator. The loss in weight of the crucible following ignition was expressed as percentage crude fiber (CF). The percentage crude fiber was calculated as indicated [14]. The ash composition was determined by incineration at 600 °C for 2 h in a muffle furnace and the weight of the sample remained was calculated as percentage ash content according NMX-F607-NORMEX-2013. The carbohydrate content was calculated by subtracting 100 from the total of all the other proximate measurements (protein, fat, fiber and ash).
2.2. Determination of Chitin in Food
Chitin was determined as previously described [15]. A chitosan curve of 5 to 60 µg/mL was performed. Approximately 30 mg of each sample was weighed. A sample of 100 µL of 0.5 M NaNO2 was added to each sample and incubated at 80 °C for 30 min. The pH was adjusted to 8 with 0.1M NaOH and 540 µL of thiobarbituric acid 0.04 M was added and incubated at 80 °C for 10 min, incubated at room temperature and read at 555 nm in the BIORAD microplate reader. Results were expressed as mg chitin per g of food.
2.3. Amino Acid Profile in Food
Food amino acid profile was determined by HPLC. To 150 μl of hydrolyzed sample, 38 μl of 10% sulfosalicylic acid was added to deproteinize the sample. The samples were mixed and incubated for 30 min at 4 °C. Subsequently, they were centrifuged at 14,000 rpm for 10 min to separate the supernatant. A sample of 99 μl of the supernatant was taken and 1 μl of the internal standard (norvaline, 15 mM) was added. The sample was derivatized and injected. The procedure was performed using a sampling device (Agilent G1367F) coupled to an HPLC system (Agilent 1260 Infiniti) and a fluorescence detector (Agilent G1321B). A ZORBAX Eclipse AAA column (150 mm and 4.6 mm inner diameter with 3.5 um film thickness) was used and maintained at 40 °C. Chromatographic conditions were maintained according to the column technical instructions.
2.4. Extraction of Lipids in Food
2.5. Determination of Fatty Acids in Food
The concentration of fatty acids was determined by gas chromatography after an organic extraction and its derivatization to methyl esters. The samples were injected into an Agilent DB-225MS 30 m x 0.25 mm x 0.25 um analytical column, coupled to a flame detector (FID) for analysis. An Agilent 6850 Series II gas chromatograph coupled to an auto-sampler was used. The injection of 1 μl of sample solution was carried out in split mode (1:6.8) at 250 °C. Hydrogen was used as a mobile phase, with a constant flux of 17 mL/min, and the interface temperature was maintained at 250 °C. The oven temperature was raised 80 °C to 150 °C (1 min at 80 °C, increased to 150 °C [10 °C/min] and 8 min at 190°C). Quantification of the samples was carried out using fatty acids standards, and the peak areas were obtained from the generated chromatograms.
2.6. Determination of Cholesterol and Triglycerides in Food
Lipid extraction was performed using the Folch method [18], subsequently, the DiaSys FS Cholesterol or FS Triglyceride kit was used. To a sample of 10 µL, 1000 µL of the reagent containing the enzymes was added to generate the reaction and incubated for 20 min at room temperature and read at 500 nm in the BIORAD microplate reader.
2.7. Resistant Starch in Food
The samples were analyzed employing the AACC methods 32-40.01 (2000) with the Resistant Starch Assay Kit from Megazyme International (Bray, Wicklow, Ireland).
2.8. Determination of Total Polyphenols in Food
Total phenolic content was estimated as described previously [18]. Briefly, 50 μL of different food extracts were mixed with 50 μL of Folin- Ciocalteau reagent. This mixture was incubated at room temperature for 5 min, and 100 μL of sodium carbonate (8%) was added. The mixture was incubated at room temperature for 20 min. The optical density was determined at 760 nm in the BIORAD microplate reader. Total polyphenols were expressed as mg of gallic acid equivalents (GAE) per gram of food.
2.9. Determination of Antioxidant Activity in Food
Antioxidant activity was determined by Oxygen Radical Absorbance Capacity assay (ORAC) [19]. Briefly, 25 μL of different food extracts were mixed with 150 μL of fluorescein solution (40 nM) and 25 μL of AAPH (153 mM). The fluorescence signal was measured at 535 nm (emission) and at 485 nm (excitation) with intervals of 1 min for 90 min. The area under the fluorescence decay curve (AUC) was calculated by point-to-point integration. All antioxidant capacity data were calculated based on Trolox as a standard and expressed as Trolox equivalents per gram of food.
2.10. Animal Study Design
The protocol of this study was approved by the Bioethics Committee of the Instituto Nacional de Ciencias Médicas y Nutrición Salvador Zubirán, Mexico City (CICUAL-FNU-1964-19-23-1). Sixty-three male Wistar rats, 3–4 weeks old and weighing 180–220 g at baseline, were randomly assigned to eight dietary groups (n = 8–9 per group). The sample size was determined based on feasibility and previous studies with similar designs. No specific strategy was applied to minimise potential confounders related to cage location or 188order of measurements. All groups were housed under controlled environmental conditions (temperature, humidity, and 12 h/12 h light–dark cycle) in individual cages. The experimental unit was a single male Wistar rat. The experimental groups were as follows: (1) 20% casein (C), as recommended by the American Institute of Nutrition (AIN-93) [20]; (2) cricket (CR); (3) acocil (AC); (4) chinicuil (CHI); (5) beef (B); (6) picanha (P); (7) egg (E); and (8) lentil (L) (Figure 2A). The detailed composition of all diets is shown in Supplementary Table 1. Rats were fed their respective diets for 45 days. Food and water were available ad libitum during the experimental time period. Animal weight, food and water consumption were also determined during the experimental period. No animals or data points were excluded from the study, and all animals were included in the final analysis. No pre-established exclusion criteria were applied. No blinding was implemented. The same researcher (M.V.R.) was involved in all stages of the study, including group allocation, conduct of the experiment, outcome assessment, and data analysis.
2.11. Energy expenditure
Energy expenditure Rats were placed in a non-invasive in vivo calorimetric chamber of an Oxymax open circuit indirect calorimeter (Oxymax, Columbus Instruments, OH, USA) to assess energy expenditure using measurements of oxygen consumption and carbon dioxide production for 24 h. Rats were previously adapted to the chambers for at least 12 h. From the measurements of VO2 and VCO2, the respiratory exchange ratio (RER) can be calculated to assess energy fuel utilization and energy expenditure. The RER is the ratio between the amount of CO2 produced in metabolism and oxygen used to indicate which fuel is been metabolized to supply the body with energy. A low RER (0.70) reflects, predominantly fat oxidation, whereas a high RER (1.00) is indicative of glucose oxidation.
2.12. Body Composition
Body composition was measured by a quantitative magnetic resonance imaging system (Echo MRI, Houston, TX, USA). Rats were placed into a plastic cylinder with a cylindrical plastic insert added to limit movement. While in the tube, animals were briefly subjected to a low-intensity (0.05 Tesla) electromagnetic field to measure body fat and lean mass. Measurements were conducted at the beginning of the experiment, at 30 days and at the end of the study with nuclear magnetic resonance equipment.
2.13. Determination of the Glucose Tolerance Curve (GTC)page
At the end of the 45 days of feeding with the different types of diets, the animals were fasted for 7 hours prior to the test, weighed and with a sterile lancet, an incision was made at the tip of the tail to obtain a drop of blood which was deposited on a test strip in order to determine the concentration of basal glucose by using a FreeStyle brand glucometer Optium (Abbot Laboratories, AbbotPark, IL, USA). After that, a 35% glucose solution was administered intraperitoneally, at a dose of 2g/kg and blood samples were taken to quantify glucose concentration at minute 15, 30, 60, 90 and 120 after administration Glucose tolerance test (GTT). Calculation of the area under the curve was performed by the trapezium method.
2.14. Biochemical Parameters
Serum glucose, total cholesterol, and triglycerides were determined by colorimetric enzymatic assay with the COBAS C111 Analyzer (Roche, Basel, Switzerland). Serum lipopolysaccharide and insulin were determined according to the instructions of commercial ELISA kits (Cloud-Clone Corp, Houston, TX, USA, cat. CEB526Ge and Alpco Diagnostics, cat. 80-INSRT-E10 Salem, NH, USA).
2.15. Histological Analysis
Liver samples were fixed in 10% phosphate-buffered formalin and embedded in melted paraffin blocks. After the paraffin solidified, the blocks were cut to a thickness of 4 µm, which were stained with 95% hematoxylin-eosin. The histological sections were observed under a Leica microscope stained with hematoxylin and eosin (Leica DM750 Wetzlar, Germany).
2.16. Western Blot Analysis
Liver samples were collected after 8 h of fasting. Total liver protein was extracted with a lysis buffer (RIPA), quantified by Bradford assay (Bio-Rad, Hercules, CA, USA) and stored at −70 °C. Protein samples from liver were separated on acrylamide gels and blotted onto PVDF membranes. Membranes were blocked in a blocking buffer consisting of 2% BSA in TBS tween and incubated overnight at 4 °C with the primary antibody. The blots were incubated with secondary antibodies conjugated with horseradish peroxidase. GAPDH was used to normalize the data. Images were analyzed with a ChemiDocTM XRS + System Image LabTM Software 6.1 (Bio-Rad, Hercules, CA, USA). The membranes were incubated with specific antibodies against FAS (sc-20140 1:1000), Santa Cruz, CA, USA; CPT1 (ab128568 1:2000), GAPDH (ab201822 1: 20,000), Abcam, Cambridge, UK, HMGCoA reductase (07-4571:2500) UP State, NY, USA. The proteins of interest were detected with goat anti-mouse IgG-H&L antibody (ab6789 1:20,000), or goat anti-rabbit IgG-H&L (ab6721 1:20,000).
2.17. TMAO Determination
The serum samples to be analyzed were centrifuged at 14000 × g at 4 °C for 10 min. Subsequently, 100µL of serum were transferred to a test tube and 800µL of mass-grade frozen methanol (JT Baker) was added. Samples were incubated for 30 min in ice to promote deproteinization of samples. After the incubation, samples were centrifuged a second time under the aforementioned conditions. The supernatant was transferred to a test tube and dried and concentrated by vacuum centrifugation. Once concentrated, the sample was resuspended in 200 µL of methanol.
Multi-Reaction Monitoring (MRM) analyses was performed on a liquid chromatography platform coupled to a 6500+ QTRAP SelexION (AB Sciex) equipped with a Turbo V ionization source (Framingham, MA, USA). Chromatographic separation was performed by injecting 1µL of the biological extract into a HILIC 100 Ă Kinetex Core-Shell column, 2.6um x 30mmx 2.1mm of Phenomenex at 40°C. Mass grade water (JT Baker) with 40mM acetic acid (Sigma Aldrich) and methanol (JT Baker) was used as mobile phases A and B respectively. The gradient used for the separation of the compound was, 1–5 min 90 - 10 % B; 5 - 6.5 min 10 % B; 6.50 – 6.60 min 10 – 90 % B; and 6.60 – 7 90 % B at a flow rate of 0.4 ml/min. The mass spectrometer parameters for TMAO MRM analysis were, Electrospray Ionization (IS) 300eV, Ionization Temperature (TEM) 300°C, Gas Nebulizer (GS1) 40 psi, Gas 2 (GS2) 40 psi, Gas Curtain (CUR) 20 psi, CAD Low. As for the transitions, m/z 76.05 58.0 and 76.05 to 59.1 was used as the quantitation and confirmation transitions respectively.
2.18. 16S rRNA Sequencing
Fresh fecal samples were collected at the end of the study and were immediately frozen and stored at −70 °C until use. Bacterial DNA content was extracted using the QIAamp DNA Mini Kit (Qiagen, Valencia, CA, USA) according to the manufacturer’s instructions. DNA samples were amplified using V3 and V4 regions and overhang adapters attached. After a capillary electrophoresis, the size of the fragment was checked and purified. The Nextera XT index kit was used to add indices and Illumina sequencing adapters. After the validation of the library, the samples were pooled and injected into the MiSeq system according to the manufacturer’s instructions. At the end of the run, the MiSeq system generates FASTQ files for downstream analysis. Raw data are available under request.
2.19. Statistical Analysis
Results are expressed and plotted as mean ± SEM. Differences were considered significant when p < 0.05. One way ANOVA was used to compare all groups. The statistical analysis was performed using Graph Path 10.0 (Graph Pad, San Diego, CA, USA)
2.20. Bioinformatic Analysis
The bioinformatic analysis starts with the FASTQ files that contain the sequence data from the clusters that pass the filter on a flow cell. The first step in FASTQ file generation was demultiplexing to assign clusters to a sample based on the cluster’s index sequence. The next step was clustering the pre-processed sequences into ASVs. Alpha diversity was calculated to determine the observed richness (number of taxa) of an average sample. Beta-diversity was determined using The Bray-Curtis distance to measure how different samples are among groups. Principal coordinates analysis (PCoA) was used to identify factors explaining differences among groups using QIIME 2 software v.2022.2. Permutational multivariate analysis of variance (PERMANOVA) was carried out to determine differences among groups. ASVs were assigned to the phylum, class, order, family, genus and species level, respectively using SILVA database.
3. Results
This section may be divided by subheadings. It should provide a concise and precise description of the experimental results, their interpretation, as well as the experimental conclusions that can be drawn.
3.1. Nutritional Profile of Different Source of Proteins
As a result of the proximal chemical analysis, we observed that cricket and acocil had 51.8% and 43% protein, respectively, which is comparable to other sources of protein as picahna and egg. Chinicuil and lentil showed the lowest concentration of protein. With respect to lipids, the food with the highest concentration of fat was chinicuil and with the lowest was lentil. The food with the highest concentration of carbohydrates was lentil and the foods with the presence of soluble fiber was chinicuil, lentil and cricket and with insoluble fiber was cricket, acocil and chinicuil. Finally, food rich in inorganic substances (ashes) were acocil and cricket (Table 1). Regarding to the amino acids content in the foods, we observed that cricket, acocil and chinicuil have a profile comparable to beef, which is known as a protein with a complete amino acid profile. Interestingly, chinicuil has significantly higher concentration of valine, leucine, isoleucine, phenylalanine, tyrosine, lysine, aspartate, serine, glycine, alanine and proline than beef (Table S2).
3.2. Fatty Acid Profile in Different Source of Proteins
Cricket and lentils had the highest amount of polyunsaturated fatty acids, 57% and 61% respectively, with linolenic and linoleic acid being the most abundant. Picanha and chinicuil showed 47% and 43 % of monounsaturated fatty acids, mainly oleic acid. Acocil showed the highest variety of fatty acids including long chain fatty acids EPA and DHA. Picanha showed the highest amount of the saturated palmitic acid (25%). Beef also contained a different types of fatty acids mainly oleic, linoleic and palmitic acid and small amounts of DHA and EPA. Egg contained mainly palmitoleic acid, oleic and linoleic acids (Figure 1A, B).
3.3. Cholesterol and Triglycerides Concentration in Different Sources of Dietary Protein
Chinicuil and picanha had the highest concentration of triglycerides, 18 g/100 g and 17 g/100 g, respectively and the lowest concentrations were observed in cricket, acocil and lentil, (Figure 1C). Egg and picanha showed the highest concentration of cholesterol, 1.0 and 0.95 g/100 g respectively, whereas cricket and lentil showed the lowest concentrations, 0.15 and 0.08 g/100 g, (Figure 1D).
3.4. Chitin Concentrations in Different Source of Proteins
Since some arthropods shows an exoskeleton formed of chitin considered insoluble fiber, this compound was measured in the different foods. Chinicuil, cricket and acocil showed the highest concentration of chitin and egg the lowest. Interestingly lentil showed the presence of chitin, (Figure 1E).
3.5. Total Polyphenols and Antioxidant Activity in Different Source of Proteins
Interestingly we found that cricket showed the highest concentration of total polyphenols followed by lentil and acocil. These results were accompanied by similar high antioxidant activity in cricket, followed by lentil and acocil, (Figure 1F, G).
3.6. Choline, Carnitine and Phosphatidylcholine Concentrations in Different source of Protein
Considering that arthropods are source of animal protein and potentially containing TMA precursors, choline, carnitine and phosphatidylcholine, these compounds were measured in all source of proteins. Egg showed the highest concentration of choline and phosphatidylcholine, while meat and picanha had the highest concentration of carnitine. Interestingly cricket, acocil, chinicuil and lentil showed the lowest concentration of these compounds (Figure 1H-J).
3.7 Effect of Different Sources of Protein on Weight Gain and Body Composition
After rats were fed different types of protein for 45 days, body weight gain was assessed. Rats fed casein, beef, acocil, picahna and egg had similar weight gain and the groups fed cricket, chinicuil and lentil showed significantly less weight gain 12%, 31% and 6% respectively compared to the casein group (Figure 2 B), however when body composition was assessed, lentil, cricket, acocil and chinicuil gained less fat mass than the groups fed casein diet. Interestingly, the groups fed lentil and cricket lost less lean mass than the group fed casein and beef, indicating that less weight gain observed in the lentil and cricket groups was due to a less fat mass (Figure 2C). The amino acid profile of the cricket and lentil met the amino acid requirement of FAO/WHO (18) of almost all the indispensable amino acid with the exception of methionine. Acocil met the amino acid requirement of almost all the amino acids with exception of the branched chain amino acids valine, leucine and isoleucine. These results indicate that other components of the food play an important role in weight gain and body composition.
3.8. Effect of Different Sources of Protein on Energy Expenditure
Respiratory exchange ratio (RER) was measured to evaluate the type of energy substrate used for energy expenditure. RER is the ratio between the metabolic production of carbon dioxide (CO2) and the uptake of oxygen (O2). Interestingly, during the fasting period, RER was similar among all groups indicating that consumption of the different sources of protein stimulate energy expenditure when consumed (Figure 2E) and that the main substrate was fat producing a low RER with a value of 0.75 ± 0.010. However, during the feeding period the RER changed to 0.96 ± 0.006 that indicate that the main substrate for oxidation were carbohydrates in groups fed casein, cricket, acocil, beef, picanha, egg and lentil (Figure 2D), whereas the group fed chinicuil showed similar value that in the fasting state indicating metabolic inflexibility due to the high fat content in the chinicuil, (Figure 2D).
3.9. Effect of Different Sources of Protein on Glucose Tolerance and Biochemical Parameters
After 40 days of consumption of different sources of proteins, a glucose tolerance test was carried out in all groups. The area under the curve (AUC) was similar in all groups with respect to the control groups with the exception to the cricket and lentil group, these groups showed significantly lower area under the curve indicating that the consumption of cricket and lentil showed higher glucose uptake capacity, (Figure 2 F). All groups showed similar and normal serum glucose than the control group (Figure 2G). Also, all groups showed serum insulin concentrations in the normal range (Figure 2H). With respect to the serum triglycerides, the picanha group showed significantly higher concentrations (2.04-fold) with respect to the control group probably due to the high concentration of fat in the picanha. Serum cholesterol concentration in all groups was in the normal range. With respect to serum LDL-cholesterol, the group fed egg showed significantly higher concentration than the control group (1.35-fold) due to egg showed the highest concentration of cholesterol.
3.10. Effect of Different Food Sources of Protein on Liver Morphology and Liver Triglycerides and Cholesterol
At the end of the study, rats that consumed picahna, egg and chinicuil presented an accumulation of fat in the liver as lipidic microvesicles (Figure 3A). To determine the fat content in the liver, the concentration of triglycerides and cholesterol was determined. The group that consumed egg showed the highest cholesterol concentration compared to the control group (5.5-fold), while the group that consumed chinicuil, picanha and egg showed the highest triglyceride concentrations (1.5, 1.2, and 1.5-fold, respectively) compared to the control group (Figure 3B, C), whereas the consumption of cricket, lentil, acocil and beef showed similar hepatic triglycerides and cholesterol concentrations than the control group.
3.11. Consumption of Different Food Sources of Protein on Hepatic Lipogenesis and Beta Oxidation
Since we observed accumulation of fat in the liver with different sources of dietary proteins, we measured the abundance of proteins involved in lipogenesis (FAS), beta oxidation (CPT-1) and cholesterol synthesis (HMGCoAr). Due to the high concentration of oleic acid in chinicuil, the group that consumed this insect presented the highest abundance of CPT 1 protein. This enzyme participates in the transport of medium and long chain lipids in the mitochondria which promotes lipid oxidation. For this reason, the group fed with chinicuil showed the lower weight gain than the control group. On the other hand, the group that consumed egg, cricket, acocil and lentil showed significant lower abundance of fatty acid synthase (FAS), enzyme involved in fatty acid synthesis with respect to the control group. Finally, it was observed that the abundance of the HMGCoA reductase, a key enzyme in cholesterol synthesis, was significantly higher in the groups acocil and chinicuil with respect to the control group (Figure 3D).
3.12. Effect of Different Sources of Protein on Gut Microbiota
To investigate whether the changes observed in the gut microbiota were associated with the type of protein in the food, mainly in the insects, the alpha and beta diversity as well as taxonomic assignment to different levels were evaluated. Shannon index indicated that the alpha diversity was significantly higher in the groups fed casein, cricket, acocil, beef followed by lentil and chinicuil and the lowest alpha diversity was seen in the group fed egg (Figure 4A). Interestingly, the beta diversity indicated that the gut microbiota of animals fed protein with moderate amount of fat in the protein (picanha) was different from those containing high concentration of fat (egg and chinicuil) and the type of fat (egg, chinicuil vs picanha) (Figure 4B). The gut microbiota of rats fed egg and chinicuil containing mainly oleic and palmitoleic acid was different from the group fed picanha that contains mainly palmitic and stearic acids (Figure 4B). The reads per sample were 97215±23785. Thus, 99.2 %, 83.14 % and 53.48% of the reads were assigned to phylum, genus and species level. The group fed picanha showed the highest relative abundance of Firmicutes and the egg group the lowest (Figure 4C). With respect to Bacteroidetes, the group fed cricket, acocil and egg has the highest abundance of Bacteroidetes (Figure 4C). At the genus level, 13 genus were significantly different among groups. Cricket consumption was primarily associated with increased abundance of Flavobacterium, Lactobacillus, Enterococcus, Faecalibacterium, and Parabacteroides. Lentil intake promoted Bifidobacterium, Anaerobium and Akkermansia. Chinicuil consumption favored Gallionella, Enterococcus and Subdoligranulum, while egg intake increased Alistipes, Gallionella, and Clostridium. Acocil consumption was linked to higher levels of Clostridium, Lactobacillus, and Enterococcus. Beef and picanha intake promoted Lactobacillus and Ruminococcus, respectively (Figure 4 D-P).
At the species level, the consumption of cricket was associated with an increase in Faecalibacterium prausnitzii and Clostridium ruminantium, while lentil intake promoted the growth of Bifidobacterium bifidum and Clostridium ruminantium. Acocil consumption led to an increase in Alistipes onderdonkii, whereas chinicuil consumption enhanced the abundance of Clostridium paraputrificum, Alistipes onderdonkii, and Subdoligranulum variabile. Egg intake was also linked to higher levels of Alistipes onderdonkii. In contrast, beef consumption favored the proliferation of Cytophaga xylanolytica, Clostridium formicaceticum, Subdoligranulum variabile, and Ruminococcus lactaris. Finally, the consumption of picanha increased the abundance of Clostridium formicaceticum, Ruminococcus lactaris, and Shuttleworthia satelles (Figure 5A-K).
3.13. Effect of Different Source of Protein on Gut Microbiota-Derived Metabolites
Gut microbiota-derived metabolites are crucial for host health, influencing metabolism. Specifically, metabolites like short-chain fatty acids (SCFA), bile acids, lipopolysaccharide (LPS) and N-oxide trimethylamine (TMAO) were measured due to its role in the integrity of the intestinal barrier and intestinal inflammation. As observed in Figure 6A, the groups fed with chinicuil and egg had the highest concentration of serum trimethyl amine oxide (TMAO) probably due to the significant amount of phosphatidylcholine and choline in egg. However, the concentrations of choline, carnitine and phosphatidylcholine in chinicuil were low indicating that while chinicuil is an insect and therefore not strictly an animal-based food in the traditional sense, insects do have a unique metabolic profile and gut microbiome, and it is possible that they also produce TMAO. Cricket, acocil, beef, picanha and lentil showed similar concentration of TMAO than control group (Figure 6A).
With respect to LPS, the group fed picanha had the highest serum LPS concentration whereas those fed cricket or lentil showed the lowest circulating levels of LPS. These results can be in part associated with the high fiber/ low fat content, (Figure 6B).
Fecal short chain fatty acids (SCFA) acetate, propionate and butyrate were measured at the end of the study. Acetate was significantly higher in the group fed egg followed by the group fed chinicuil, beef and lentil, whereas propionate was significantly higher in egg with respect to the control group. Butyrate was significantly higher in the group fed lentil with respect to the control group (Figure 6C-D).
4. Discussion
Insects as a good source of protein emerge as a relevant issue in the twenty-first century due to the rising cost of animal protein, food insecurity, and an increase in environmental greenhouse emissions [21]. By 2050, the demand for food is expected to increase significantly due to population growth [22]. Faced with this challenge, the Food and Agriculture Organization of the United Nations (FAO) has proposed strategies to develop sustainable production systems that guarantee access to nutritious and affordable food for the world’s population [1]. Among the emerging alternatives to meet this need and new food trends, the consumption of insects and legumes has gained great importance, which are not only healthy but also have a lower environmental impact compared to other sources of animal protein. Insects produce 80 and lentils 35 times less greenhouse gases than livestock [2,23]. Pulses require less water to grow than many crops, fix nitrogen in the soil, and offer a good source of protein and fiber [24]. It is estimated that insects form part of the traditional diets of at least 2 billion people, and more than 1900 species have been used as food [25]. Interestingly, in this study, we found that cricket contains a similar amount of protein as picanha or egg, with the advantage that cricket, chinicuil, and lentil contain soluble and insoluble fiber. Most insect studies have focused on the concentration of proteins in insects, however, chinicuil, acocil, cricket, and lentil contain oleic acid, and acocil contain linolenic acid, arachidonic acid, EPA, and DHA. Cricket and lentil contain oleic, linoleic and linolenic acids, whereas egg, picanha, and beef contain more saturated fat, mainly myristic acid, oleic acid and cholesterol. Although chinicuil contains high concentrations of oleic acid, also contains triglycerides similar to picanha. One interesting finding was that cricket, acocil, chinicuil, and lentil contain chitin, that is a structural component in the exoskeletons of arthropods (insects and crustaceans) [26]. When consumed, chitin can be broken down by enzymes, promoting the growth of beneficial bacteria in the gut microbiota [27]. Due to the vibrant color of the insects, we measured whether they contain polyphenols with antioxidant activity. Cricket, lentil and acocil showed the highest content of polyphenols and antioxidant activity. Consumption of cricket increased F. prausnitzii and this was positively associated with higher chitin and antioxidant activity and negatively associated with lower concentration of phosphatidyl choline. Egg contained the highest concentration of choline and phosphatidylcholine, leading to an increase of TMAO, a compound known for its proatherogenic potential [28]. High concentrations of TMAO were related to a significant increase in liver cholesterol and serum total and LDL-cholesterol and Alistipes onderdonkii. The genus Alistipes has been associated with a high concentration of TMAO [29]. Interestingly, the consumption of lentil was positively associated with the presence of Clostridium ruminantium and antioxidant activity, also, there was a significant negatively association of Bifidobacterium bifidum with the area under the curve of glucose and fat mass, and positively with the concentration of butyrate.
On the other hand, consumption of beef and picanha was associated with fat mass, carnitine, and LPS. Consumption of chinicuil with high content of triglycerides had the highest abundance of Clostridium paraputrificum that was associated with high concentration of serum TMAO. In addition, consumption of eggs was associated with high content of liver cholesterol.
Consumption of Acocil, a type of Mexican freshwater crayfish, was not significantly associated with a specific type of bacteria; however, there was a significant positive association with chitin, polyphenols, antioxidant activity, and lean mass. These results indicate that the consumption of cricket and lentil could be considered as healthy and sustainable foods due to they are a good sources of protein, fiber, mono and polyunsaturated fatty acids, antioxidants and have a beneficial effect on the area under the curve for glucose, gut microbiota by increasing F. prausnitzii associated with antioxidant activity and Bifidobacterium bifidum with lean mass.
Supplementary Materials
The following supporting information can be downloaded at: https://www.mdpi.com/article/doi/s1.
Author Contributions
Conceptualization, N.T.; methodology, M.V-R, M.S-T., J.H-A., N.V.-M., D.C.-H., O.G.-P., I.G-C., MA. H-A.; formal analysis, M.V-R. and N.T.; investigation, M.V-R., and N.T.; data curation, M.V.R.; writing—original draft preparation, N.T.; writing—review and editing, A.R.T.; visualization, N.T.; project administration, N.T. All authors have read and agreed to the published version of the manuscript.
Institutional Review Board Statement
The study was approved by the Institutional Ethics Committee of Instituto Nacional de Ciencias Médicas y Nutrición Salvador Zubirán (CICUAL-FNU-1964-19-23-1 and Research Ethics Committee of the Institution, approved on august 2019).
Data Availability Statement
FASTQ raw data are available under request.
Conflicts of Interest
“The authors declare no conflicts of interest”.
Abbreviations
The following abbreviations are used in this manuscript:
| C | Control |
| CR | Cricket |
| L | Lentil |
| AC | Acocil |
| CHI | Chinicuil |
| E | Egg |
| B | Beef |
| P | Picanha |
References
- FAO, F. , OMS, PMA, UNICEF. El estado de la seguridad alimentaria y la nutrición en el mundo; 2017; pp 1-144.
- Huis, A.; Itterbeeck, J.; Klunder, H.; Mertens, E.; Halloran, A.; Muir, G.; Vantonne, P. Edible insects: Future prospects for food and feed security. In Forestry paper, FAO, Ed. FAO: Rome, 2013; Vol. 171, pp. 1-187.
- Sranacharoenpong, K.; Soret, S.; Harwatt, H.; Wien, M.; Sabate, J. The environmental cost of protein food choices. Public Health Nutr 2015, 18, 2067–2073. [Google Scholar] [CrossRef] [PubMed]
- Sakadevan, K.; Nguyen, M.L. Lifestock production and its impact on nutrient. pollution and greenhouse gas emissions. In Advances in Agronomy, ELSEVIER: Newark, USA, 2017; Vol. 141, pp. 147-184.
- de Vries, M.; de Boer, I.J.M. Comparing environmental impacts for livestock products: A review of life cycle assessments. In Livestock Science, 2010; Vol. 128, pp 1-11.
- Vinci, G.; Prencipe, S.A.; Masiello, L.; Zaki, M.G. The Application of Life Cycle Assessment to Evaluate the Environmental Impacts of Edible Insects as a Protein Source. Earth (Switzerland) 2022, 3, 925–938. [Google Scholar] [CrossRef]
- Imatiu, S. Benefits and food safety concerns associated with consumption of edible insects. NFS Journal 2019, 18, 1–11. [Google Scholar] [CrossRef]
- Ramos-Elorduy, J. La etnoentomologia en la alimentación, la medicina y recicleje. In Biodiversidad, Taxonomia y Biogeogafia de artropodos de México, Ciencias, F.d., Ed. México, 2004; pp. 329-413.
- Abril, S.; Pinzón, M.; Hernández-Carrión, M.; Sánchez-Camargo, A.d.P. Edible Insects in Latin America: A Sustainable Alternative for Our Food Security. In Frontiers in Nutrition, Frontiers Media S.A.: 2022; Vol. 9.
- Krongdang, S.; Phokasem, P.; Venkatachalam, K.; Charoenphun, N. Edible Insects in Thailand: An Overview of Status, Properties, Processing, and Utilization in the Food Industry. In Foods, MDPI: 2023; Vol. 12.
- Matandirotya, N.R.; Filho, W.L.; Mahed, G.; Maseko, B.; Murandu, C.V. Edible Insects Consumption in Africa towards Environmental Health and Sustainable Food Systems: A Bibliometric Study. In International Journal of Environmental Research and Public Health, MDPI: 2022; Vol. 19.
- Raheem, D.; Carrascosa, C.; Oluwole, O.B.; Nieuwland, M.; Saraiva, A.; Millán, R.; Raposo, A. Traditional consumption of and rearing edible insects in Africa, Asia and Europe. In Critical Reviews in Food Science and Nutrition, Taylor and Francis Inc.: 2019; Vol. 59, pp 2169-2188.
- Kjeldahl, J. A new method for the determination of nirogen in organic matter. Zeitschrift für Analytische Chemie 1883, 22, 366–382. [Google Scholar] [CrossRef]
- Ezegbe, C.C.; Nwosu, J.N.; Owuamanam, C.I.; Victor-Aduloju, T.A.; Nkhata, S.G. Proximate composition and anti-nutritional factors in Mucuna pruriens (velvet bean) seed flour as affected by several processing methods. Heliyon 2023, 9, e18728. [Google Scholar] [CrossRef] [PubMed]
- Badawy, M.E. A New Rapid and Sensitive SpectrophotometricMethod for Determination of a Biopolymer Chitosan. International Journal of Carbohydrate Chemistry 2012, 2012. [Google Scholar] [CrossRef]
- Folch, J.; Lees, M.; Sloane Stanley, G.H. A simple method for the isolation and purification of total lipides from animal tissues. J Biol Chem 1957, 226, 497–509. [Google Scholar] [CrossRef] [PubMed]
- Barakat, H.A.; Dohm, G.L.; Loesche, P.; Tapscott, E.B.; Smith, C. Lipid content and fatty acid composition of heart and muscle of the BIO 82. 62 cardiomyopathic hamster. Lipids 1976, 11, 747–751. [Google Scholar] [CrossRef] [PubMed]
- Magalhaes, L.M.; Santos, F.; Segundo, M.A.; Reis, S.; Lima, J.L. Rapid microplate high-throughput methodology for assessment of Folin-Ciocalteu reducing capacity. Talanta 2010, 83, 441–447. [Google Scholar] [CrossRef] [PubMed]
- Ou, B.; Hampsch-Woodill, M.; Flanagan, J.; Deemer, E.K.; Prior, R.L.; Huang, D. Novel fluorometric assay for hydroxyl radical prevention capacity using fluorescein as the probe. J Agric Food Chem 2002, 50, 2772–2777. [Google Scholar] [CrossRef] [PubMed]
- Reeves, P.G. Components of the AIN-93 diets as improvements in the AIN-76A diet. J Nutr 1997, 127, 838S–841S. [Google Scholar] [CrossRef] [PubMed]
- Joint, W.H.O.F.A.O.U.N.U.E.C. Protein and amino acid requirements in human nutrition. World Health Organ Tech Rep Ser 2007, 1-265, back cover.
- Alexandratos, N.; Bruinsma, J. World agriculture towards 2030/2050; Rome, 2012; pp 1-155.
- Poore, J.; Nemecek, T. Reducing food's environmental impacts through producers and consumers. Sustainability, Science 2018, 360, 987–992. [Google Scholar] [CrossRef] [PubMed]
- Siva, N.; Johnson, C.R.; Richard, V.; Jesch, E.D.; Whiteside, W.; Abood, A.A.; Thavarajah, P.; Duckett, S.; Thavarajah, D. Lentil ( Lens culinaris Medikus) Diet Affects the Gut Microbiome and Obesity Markers in Rat. J Agric Food Chem 2018, 66, 8805–8813. [Google Scholar] [CrossRef] [PubMed]
- Insect | Definition, Characteristics, Types, Beneficial, Pest, Classification, & Facts | Britannica.
- Izadi, H.; Asadi, H.; Bemani, M. Chitin: A comparison between its main sources. Frontiers in Materials 2025, 12, 1–23. [Google Scholar] [CrossRef]
- Neyrinck, A.M.; Possemiers, S.; Verstraete, W.; De Backer, F.; Cani, P.D.; Delzenne, N.M. Dietary modulation of clostridial cluster XIVa gut bacteria (Roseburia spp.) by chitin-glucan fiber improves host metabolic alterations induced by high-fat diet in mice. Journal of Nutritional Biochemistry 2012, 23, 51–59. [Google Scholar] [CrossRef] [PubMed]
- Zhu, W.; Gregory, J.C.; Org, E.; Buffa, J.A.; Gupta, N.; Wang, Z.; Li, L.; Fu, X.; Wu, Y.; Mehrabian, M. , et al. Gut Microbial Metabolite TMAO Enhances Platelet Hyperreactivity and Thrombosis Risk. Cell 2016, 165, 111–124. [Google Scholar] [CrossRef] [PubMed]
- Cho, C.E.; Aardema, N.D.J.; Bunnell, M.L.; Larson, D.P.; Aguilar, S.S.; Bergeson, J.R.; Malysheva, O.V.; Caudill, M.A.; Lefevre, M. Effect of Choline Forms and Gut Microbiota Composition on Trimethylamine-N-Oxide Response in Healthy Men. Nutrients 2020, 12. [Google Scholar] [CrossRef] [PubMed]
Figure 1.
Fatty acid profile, chitin, choline, carnitine and phosphatidylcholine in different protein sources. A-B) Fatty acid profile, Concentration of: C) Triglycerides D) Cholesterol E) Chitin, F) Total polyphenols G) Antioxidant activity, Concentration of H) Choline I) Carnitine J) Phosphatidylcholine. The samples were processed in technical duplicate. The data are expressed as mean ± SEM. Results were considered statistically significant at p < 0.05. Data were analyzed by one-way ANOVA followed by Tukey’s multiple comparisons test. The differences between groups are indicated by letters, where a > b > c > d.
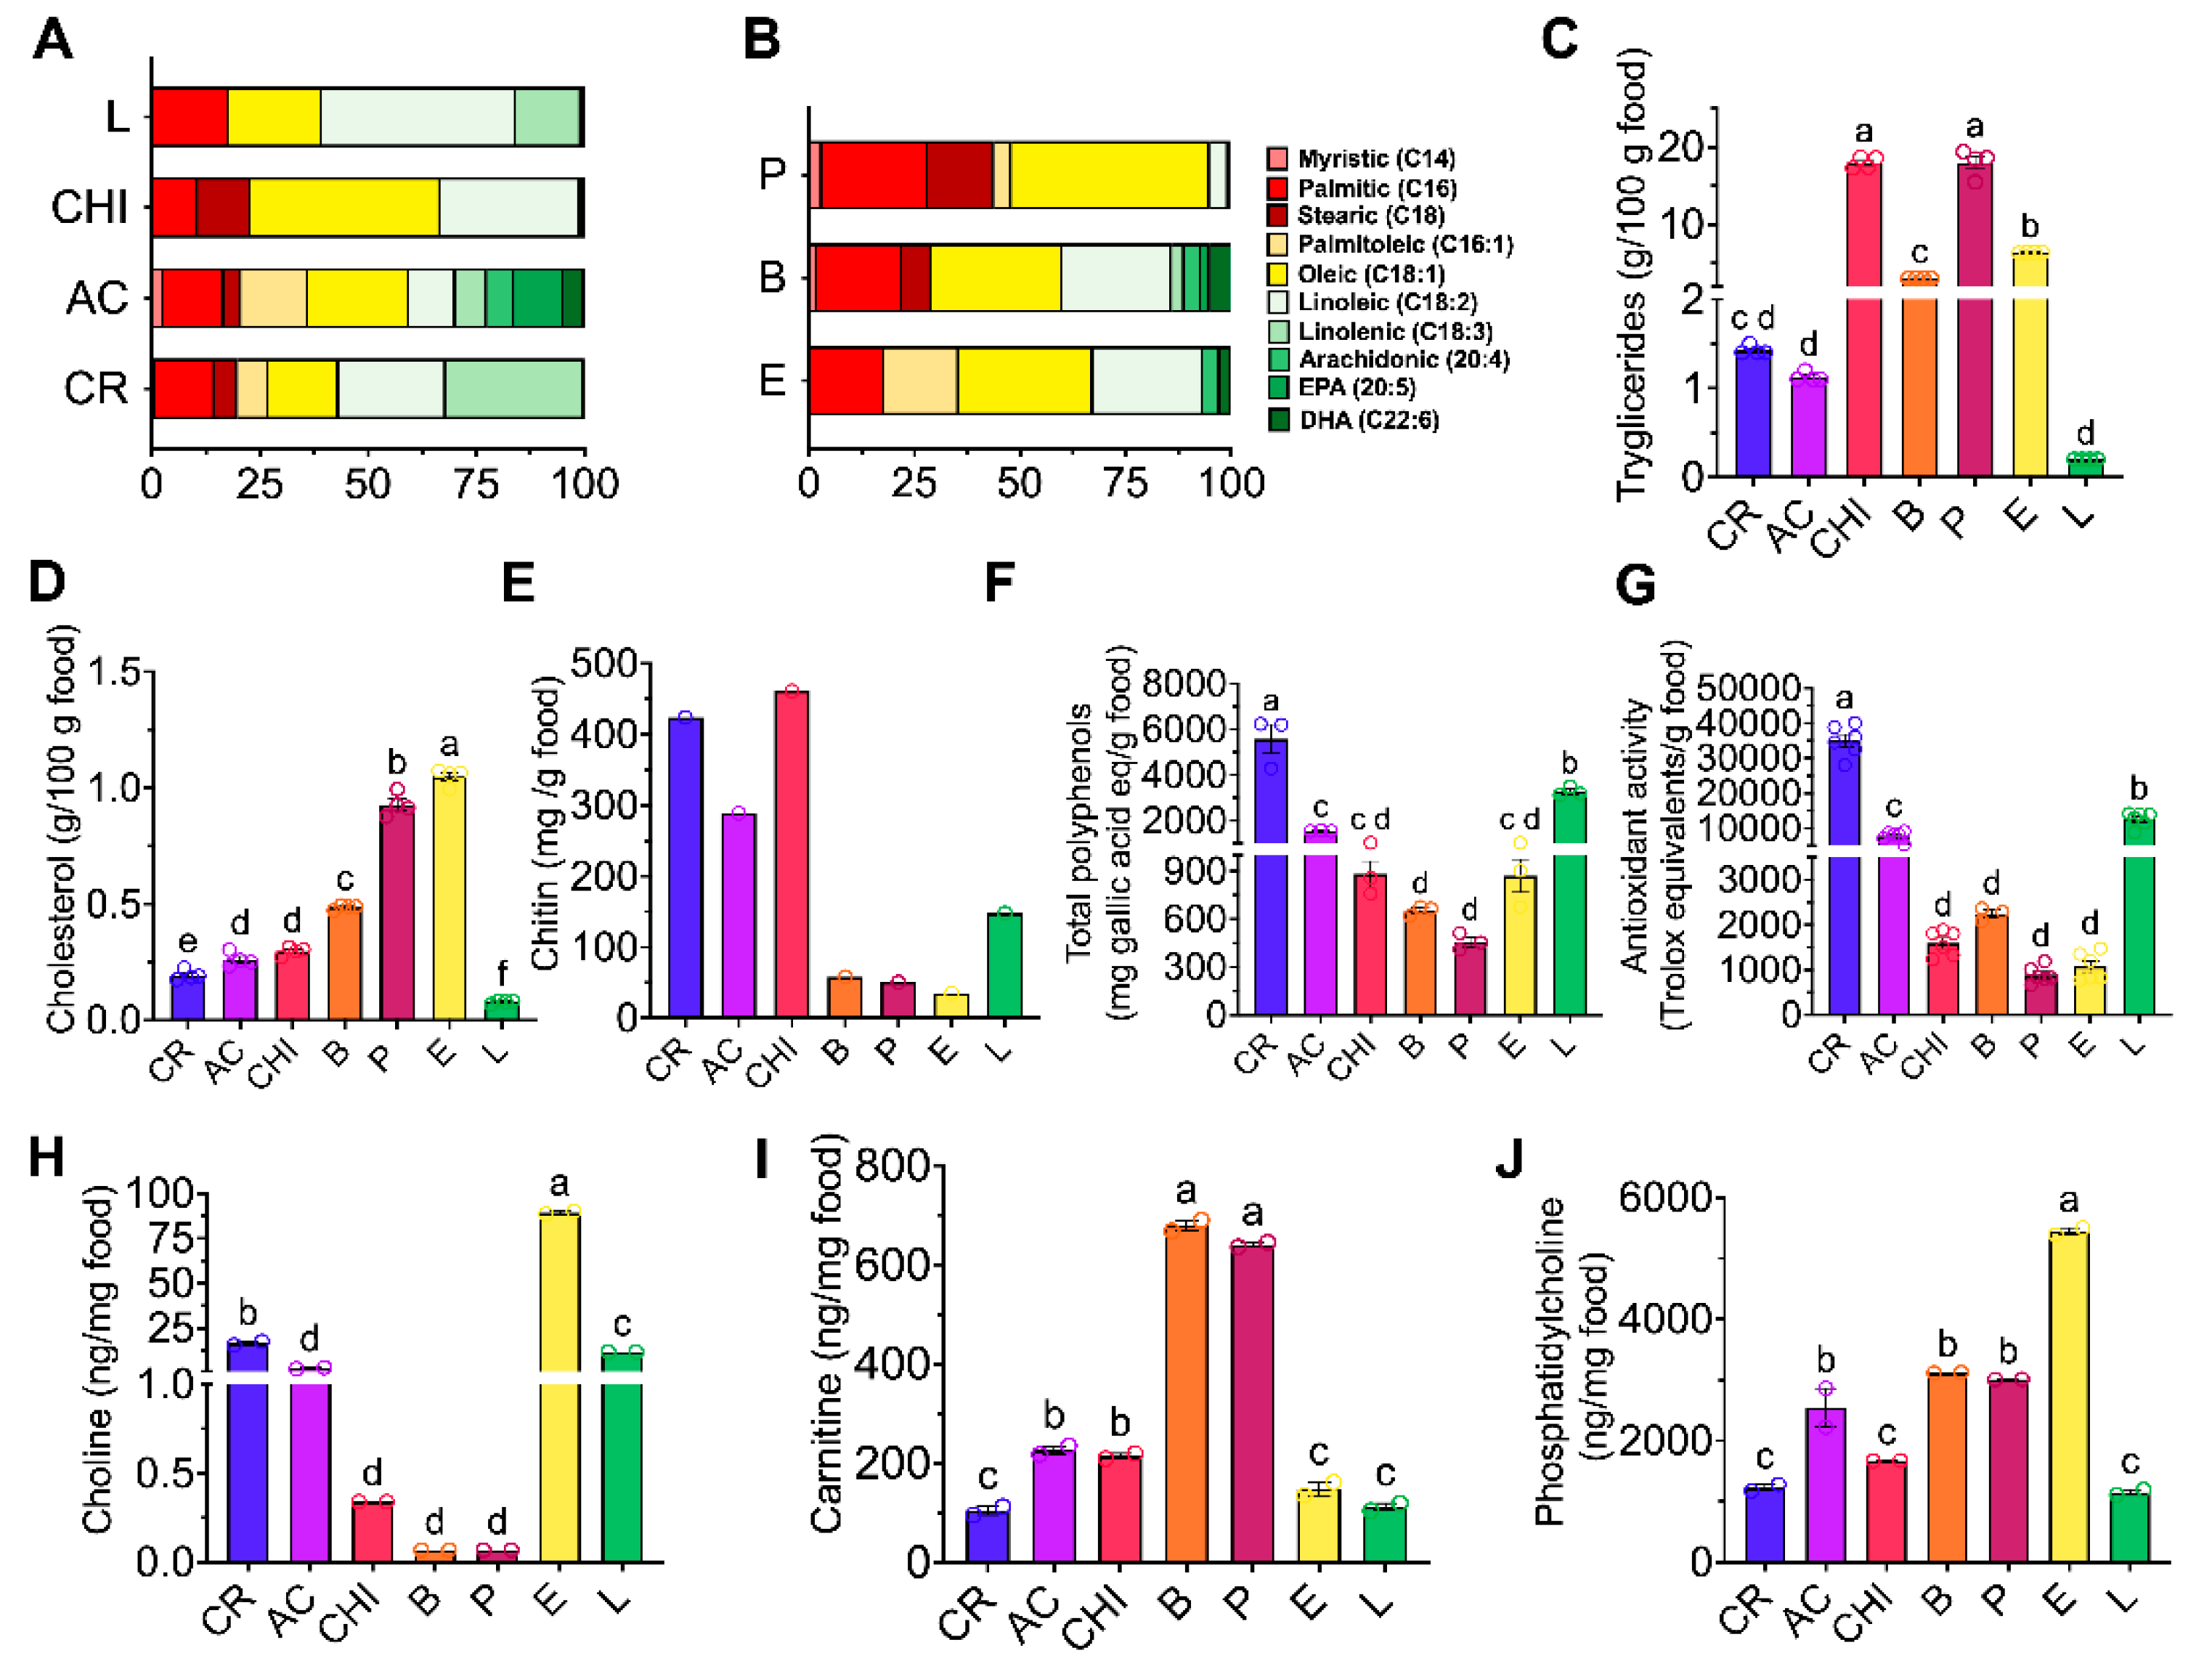
Figure 2.
Body composition, energy expenditure, glucose tolerance test and biochemical parameters. A) Experimental design B) Body weight gain C) Body composition, D) Respiratory exchange ratio, E) Energy expenditure, F) Glucose tolerant test and area under curve (AUC). Serum concentration of: G) Glucose, H) Insulin, I) Triglycerides, J) Total cholesterol and K) LDL cholesterol. The data are expressed as mean ± SEM, n=8-9. Results were considered statistically significant at p < 0.05. Data was analyzed by one-way ANOVA followed by Tukey’s multiple comparisons test. The differences between groups are indicated by letters, where a > b > c.
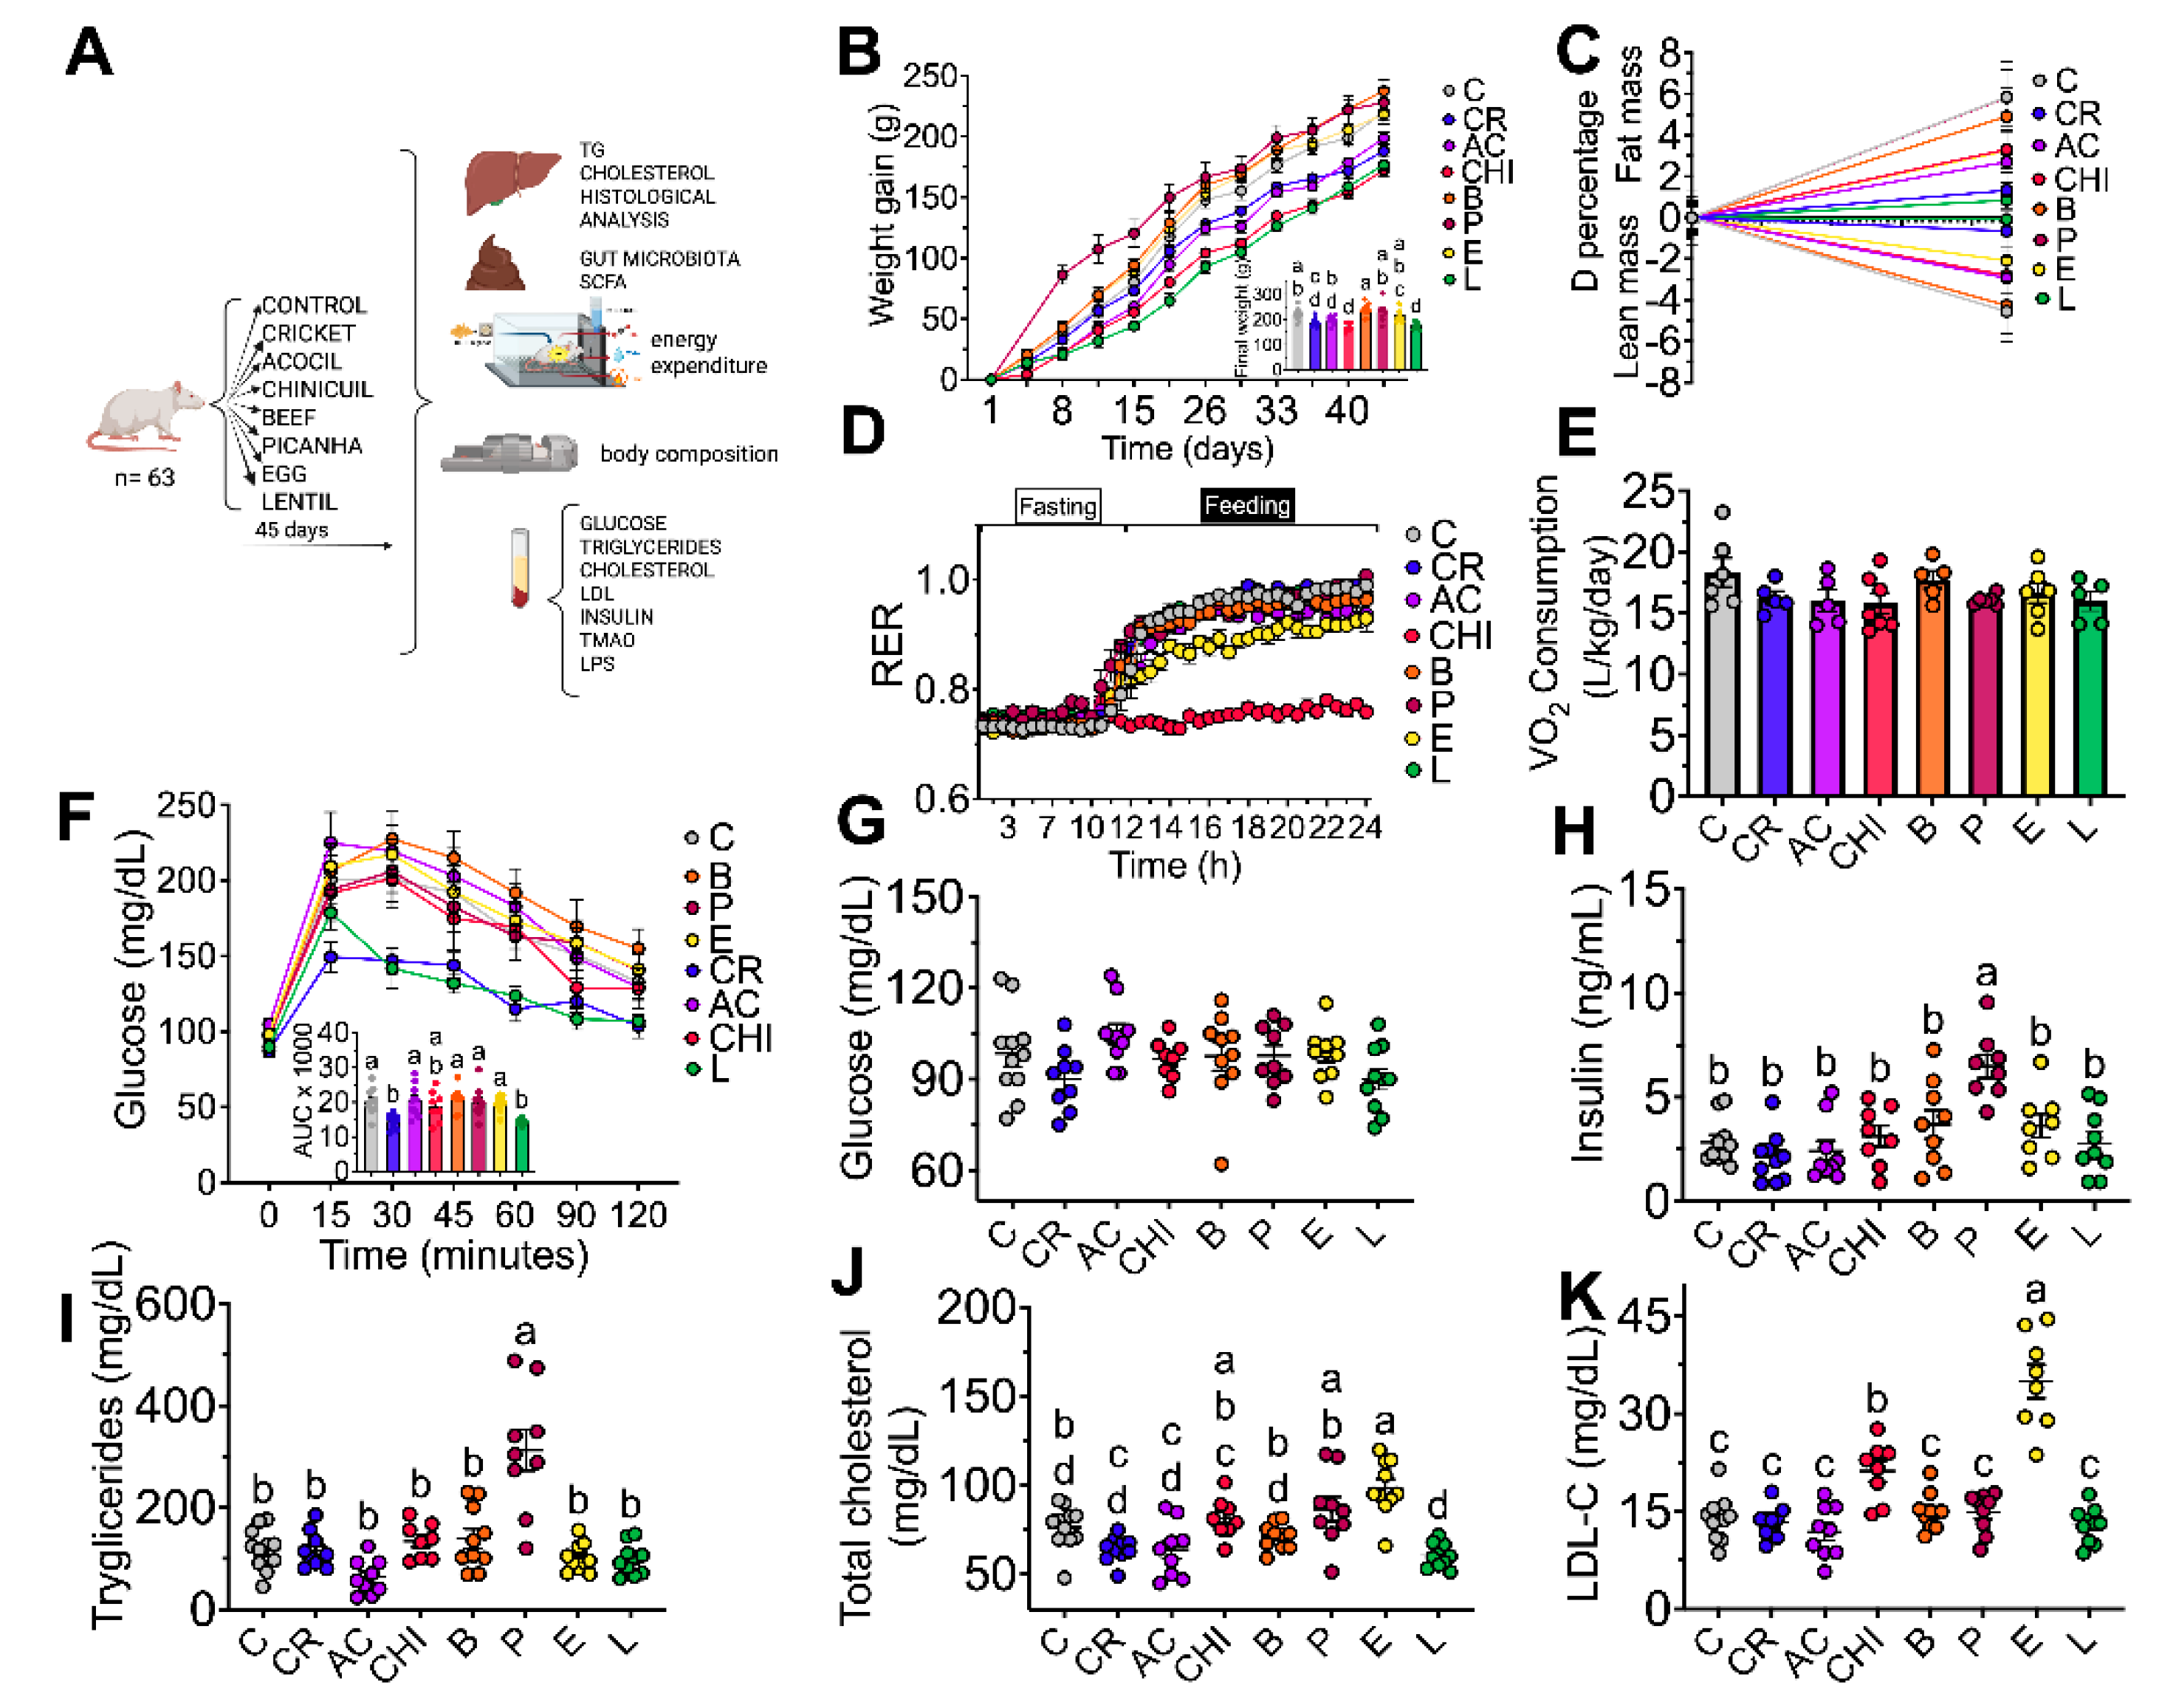
Figure 3.
Fat liver accumulation. A) Representative H&E stain liver sections Hepatic B) Cholesterol and C) Triglycerides levels D) Western blot analysis and densitometric analysis of CPT1, HMGCoA reductase, and FAS. The data are expressed as mean ± SEM. Results were considered statistically significant at p < 0.05. Data was analyzed by one-way ANOVA followed by Tukey’s multiple comparisons test. The differences between groups are indicated by letters, where a > b > c > d.
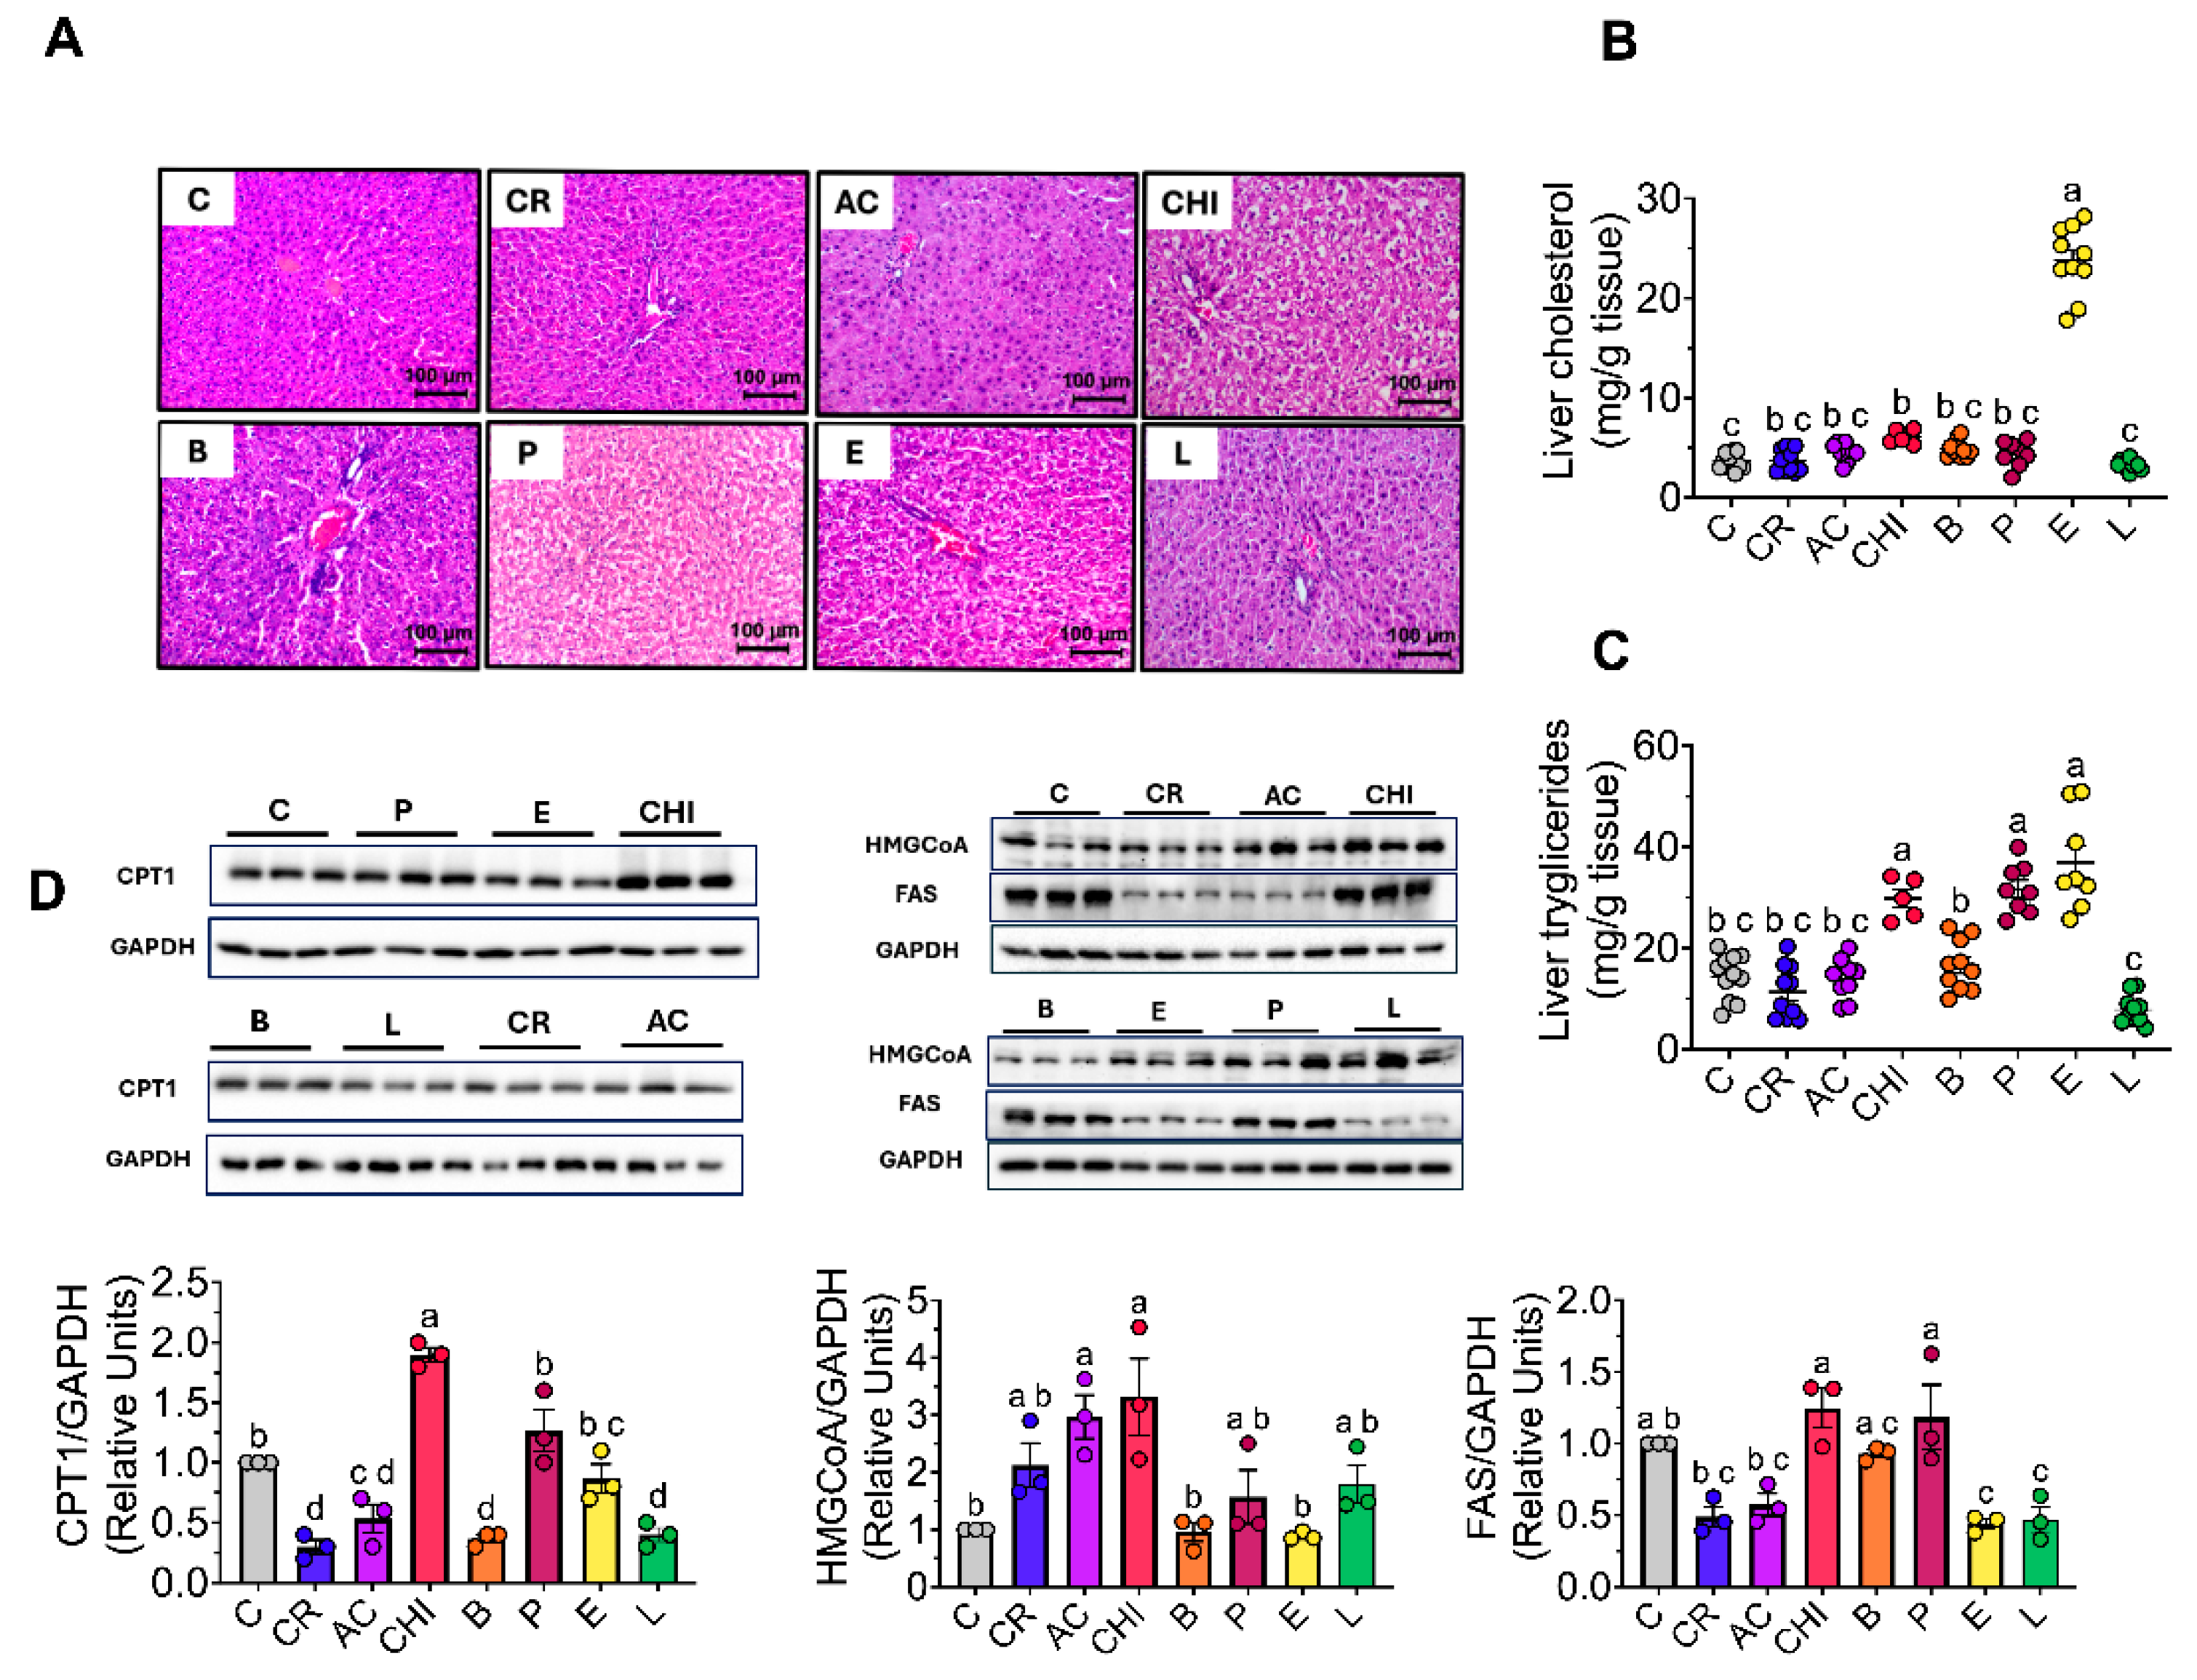
Figure 4.
Consumption of different foods of protein sources modifies gut microbiota profile. A) Shannon index, B) Principal component analysis of Bray–Curtis dissimilarity, C) Relative abundance of phylum levels. Relative abundance of the most dominant at the genus level D) Anaerobium, E) Alistipes, F) Flavobacterium, G) Gallionella, H) Parabacteroides, I) Clostridium, J) Lactobacillus, K) Enterococcus, L) Faecalibacterium, M) Ruminococcus, N) Subdonigranulum, O) Bifidobacterium, P) Akkermansia. The data are expressed as mean ± SEM. n= 8-9 Results were considered statistically significant at p < 0.05. Data was analyzed by one-way ANOVA followed by Tukey’s multiple comparisons test. The differences between groups are indicated by letters, where a > b > c > d.
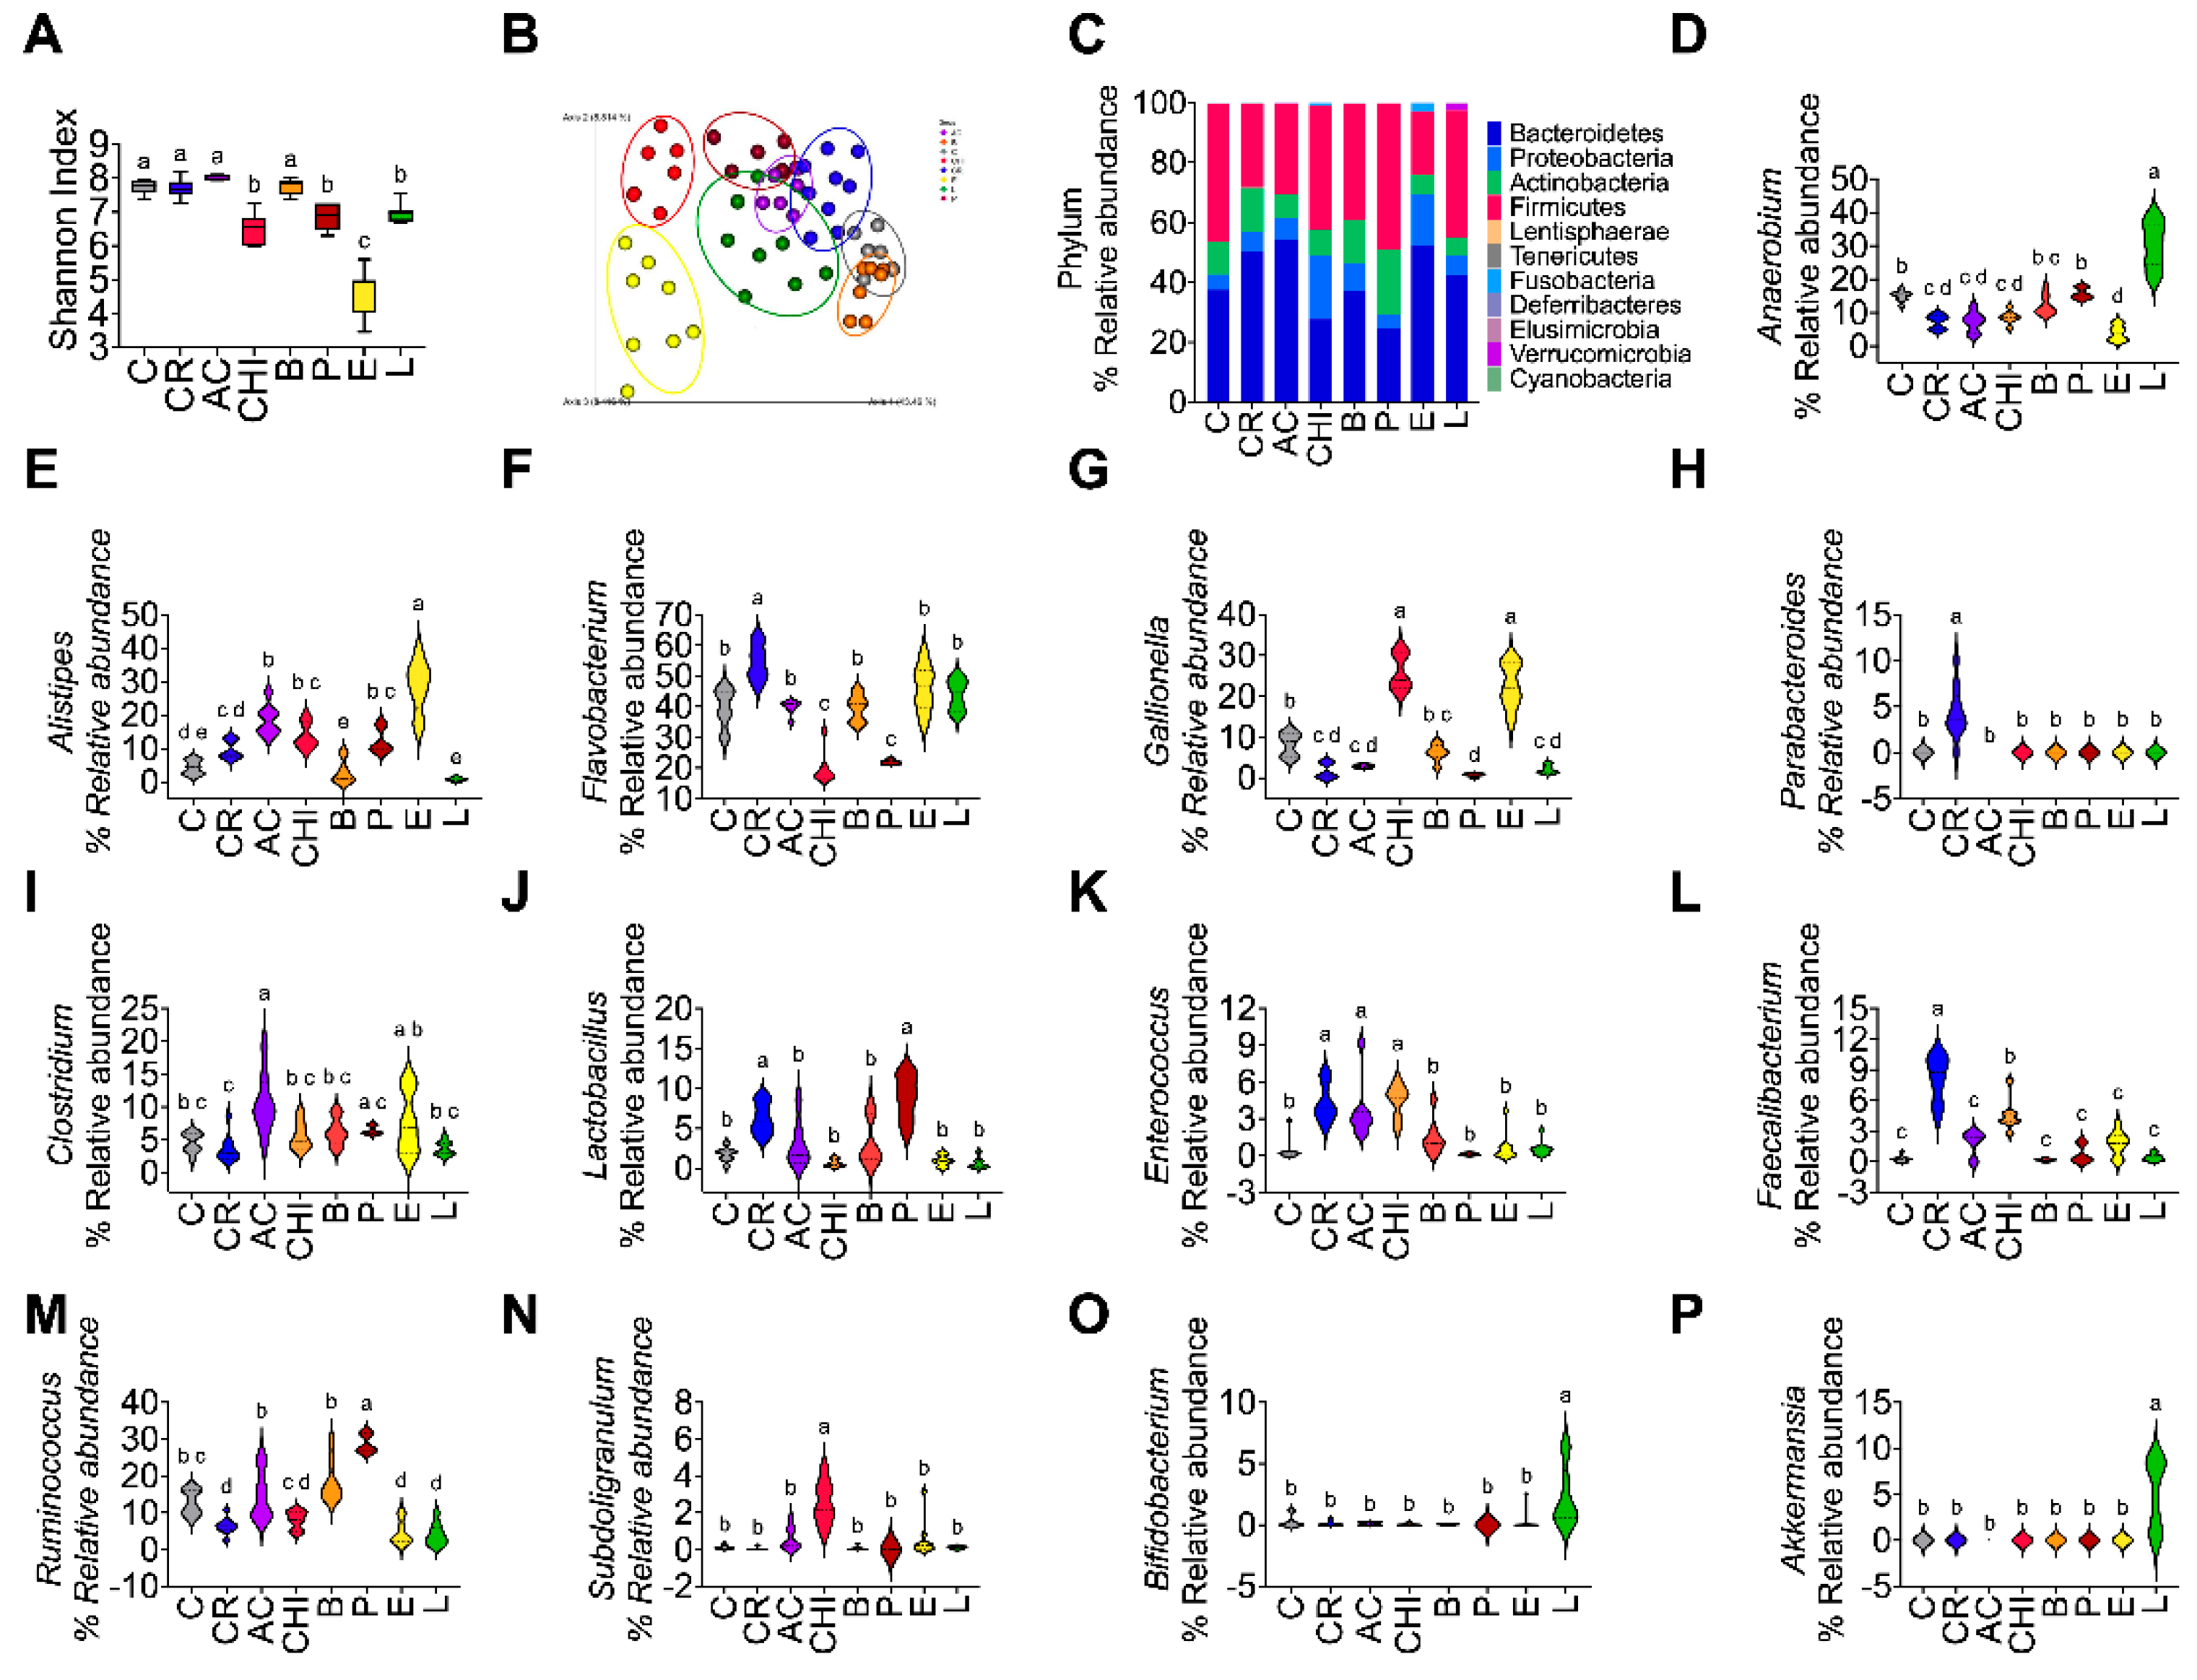
Figure 5.
Relative abundance of the most dominant bacterial species in the gut microbiota of rats fed with different protein sources. A) Alistipes onderdonkii, B) Clostridium paraputrificum, C) Clostridium ruminantium, D) Faecalibacterium prausnitzzi, E) Cytophaga xylanolytica, F) Clostridium formicaceticum, G) Subdoligranulum variabile, H) Bifidobacterium bifidum, I) Ruminococcus lactaris, J) Dorea longicatena, and K) Shuttleworthia satelles. The data are expressed as mean ± SEM. n= 8-9 Results were considered statistically significant at p < 0.05. Data was analyzed by one-way ANOVA followed by Tukey’s multiple comparisons test. The differences between groups are indicated by letters, where a > b > c > d.
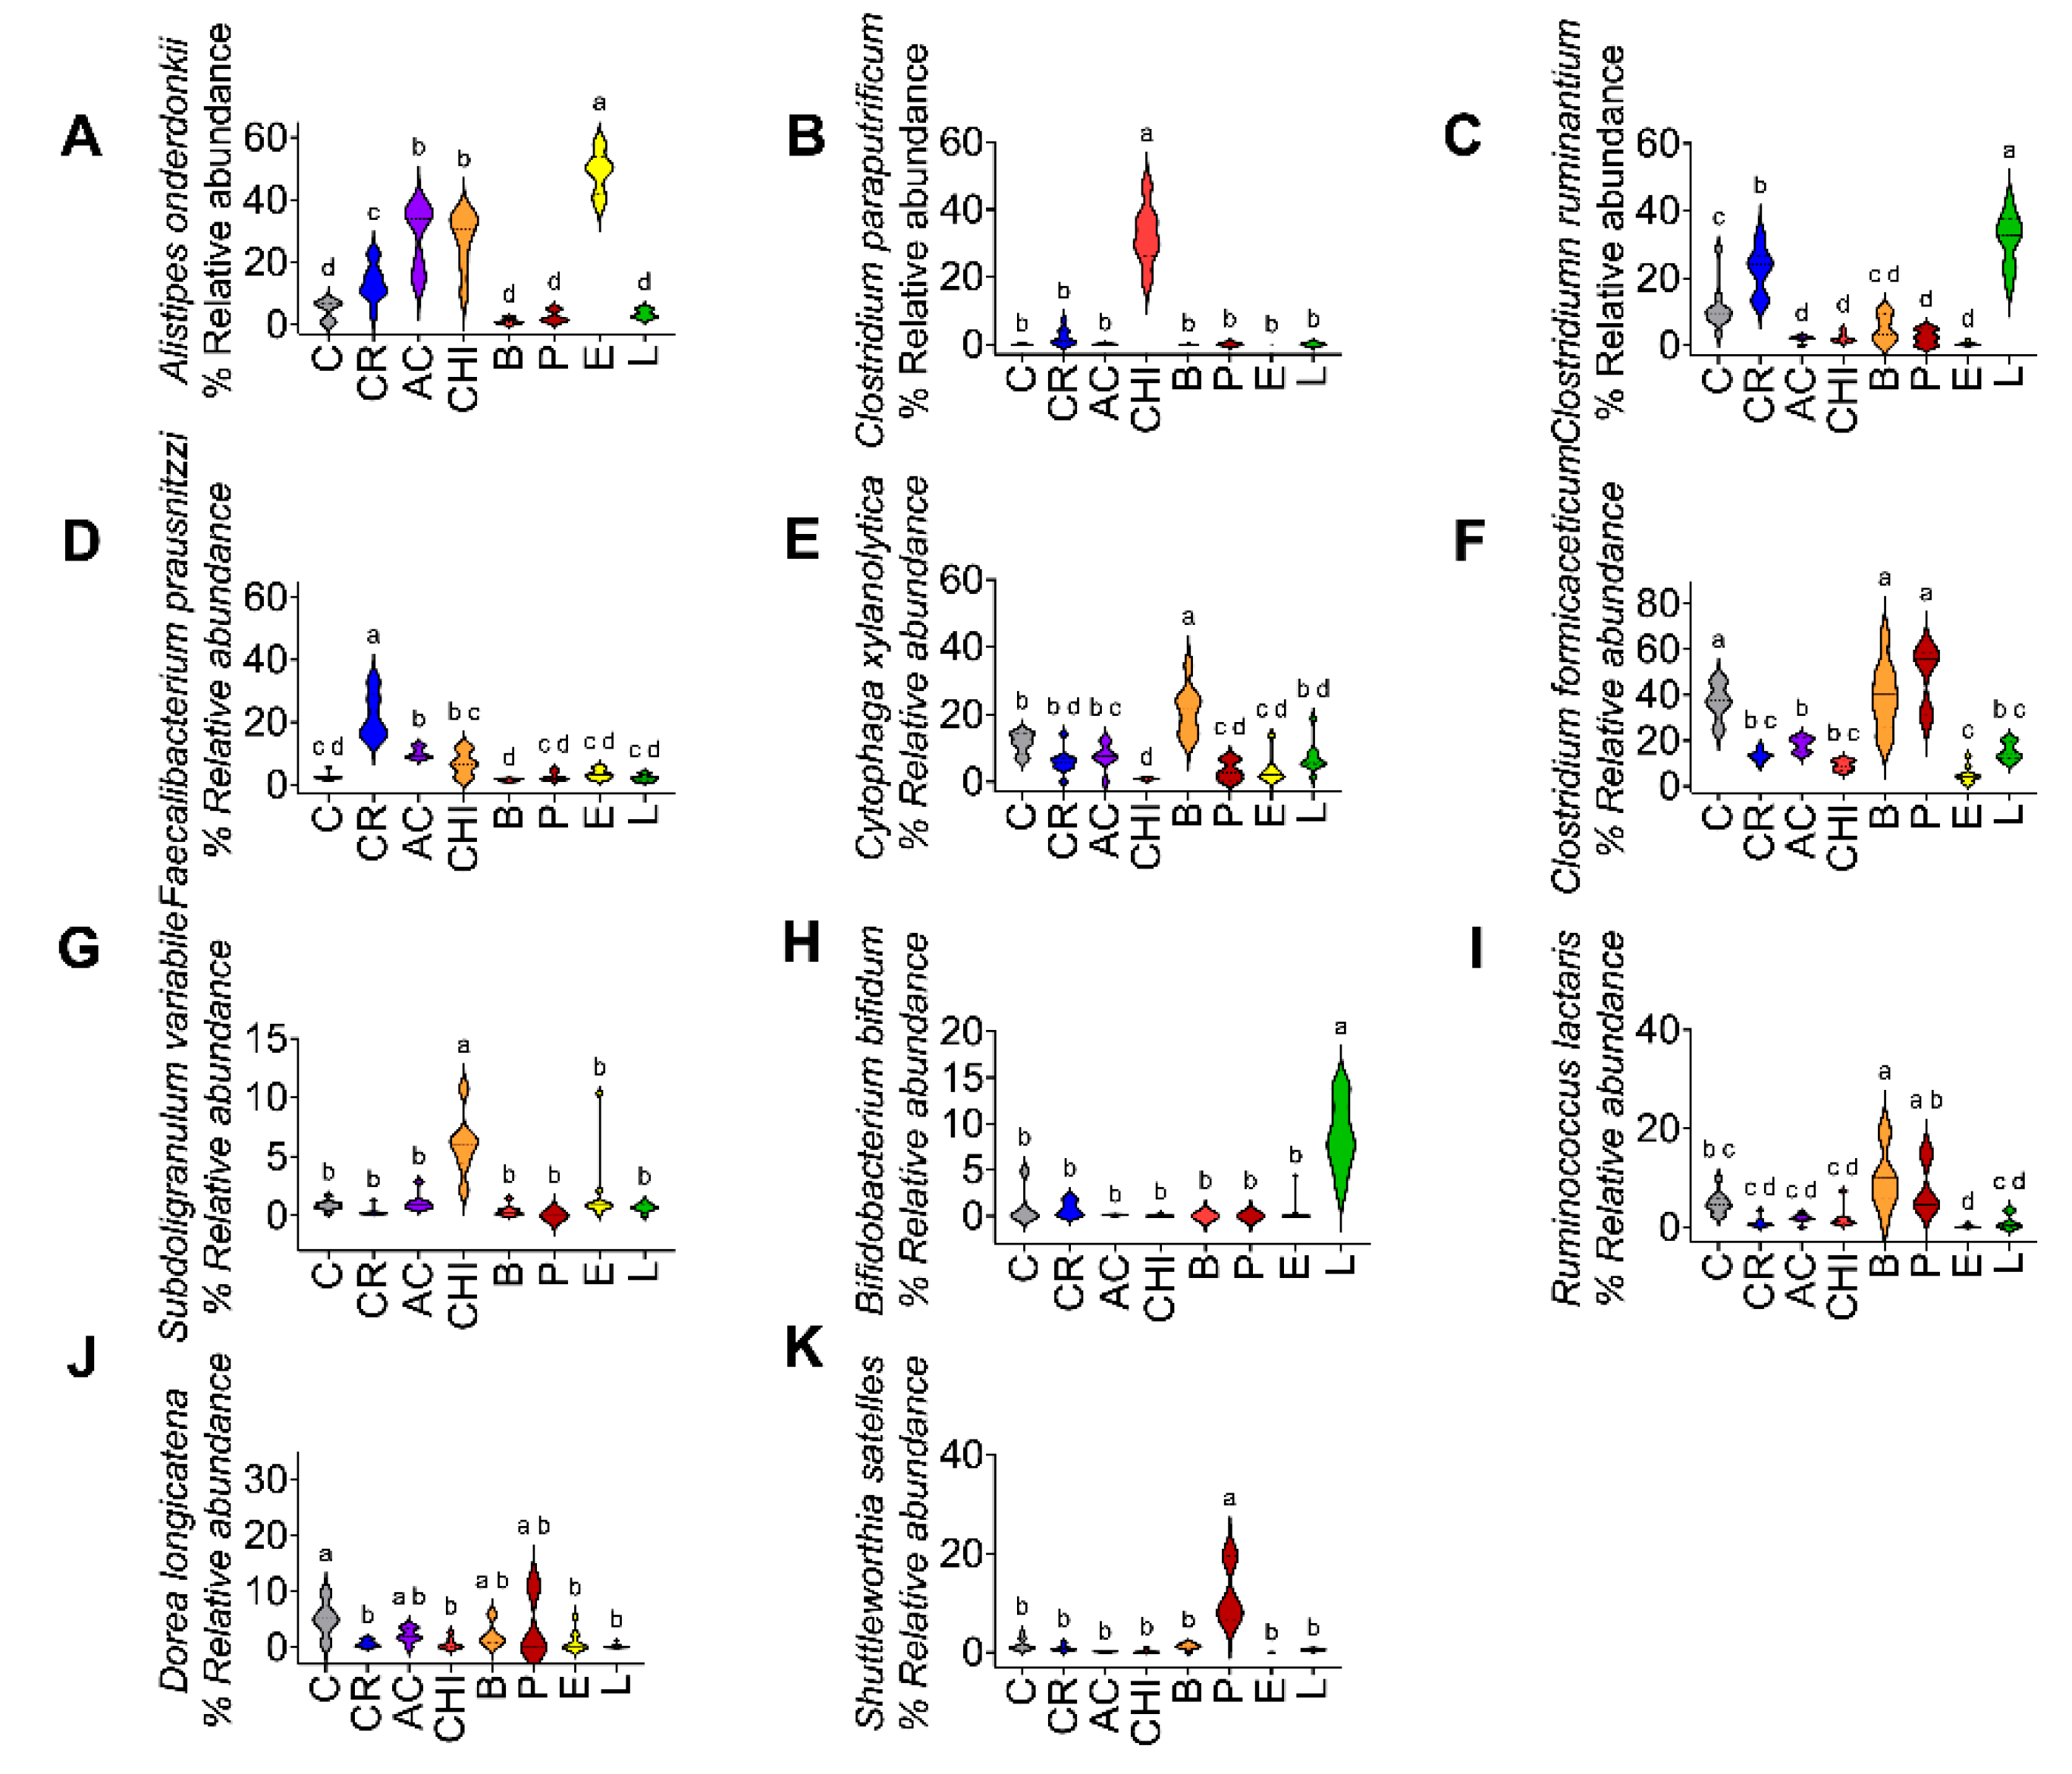
Figure 6.
Consumption of different protein sources alters serum and fecal metabolites. Concentration in serum of A) trimethylamine N-oxide (TMAO), B) lipopolysaccharide (LPS), Concentrations of fecal short-chain fatty acids (SCFAs): C) acetate, D) propionate, and E) butyrate. Data are expressed as mean ± SEM. n= 8-9 Results were considered statistically significant at p < 0.05. Data was analyzed by one-way ANOVA followed by Tukey’s multiple comparisons test. The differences between groups are indicated by letters, where a > b > c > d > e > f.
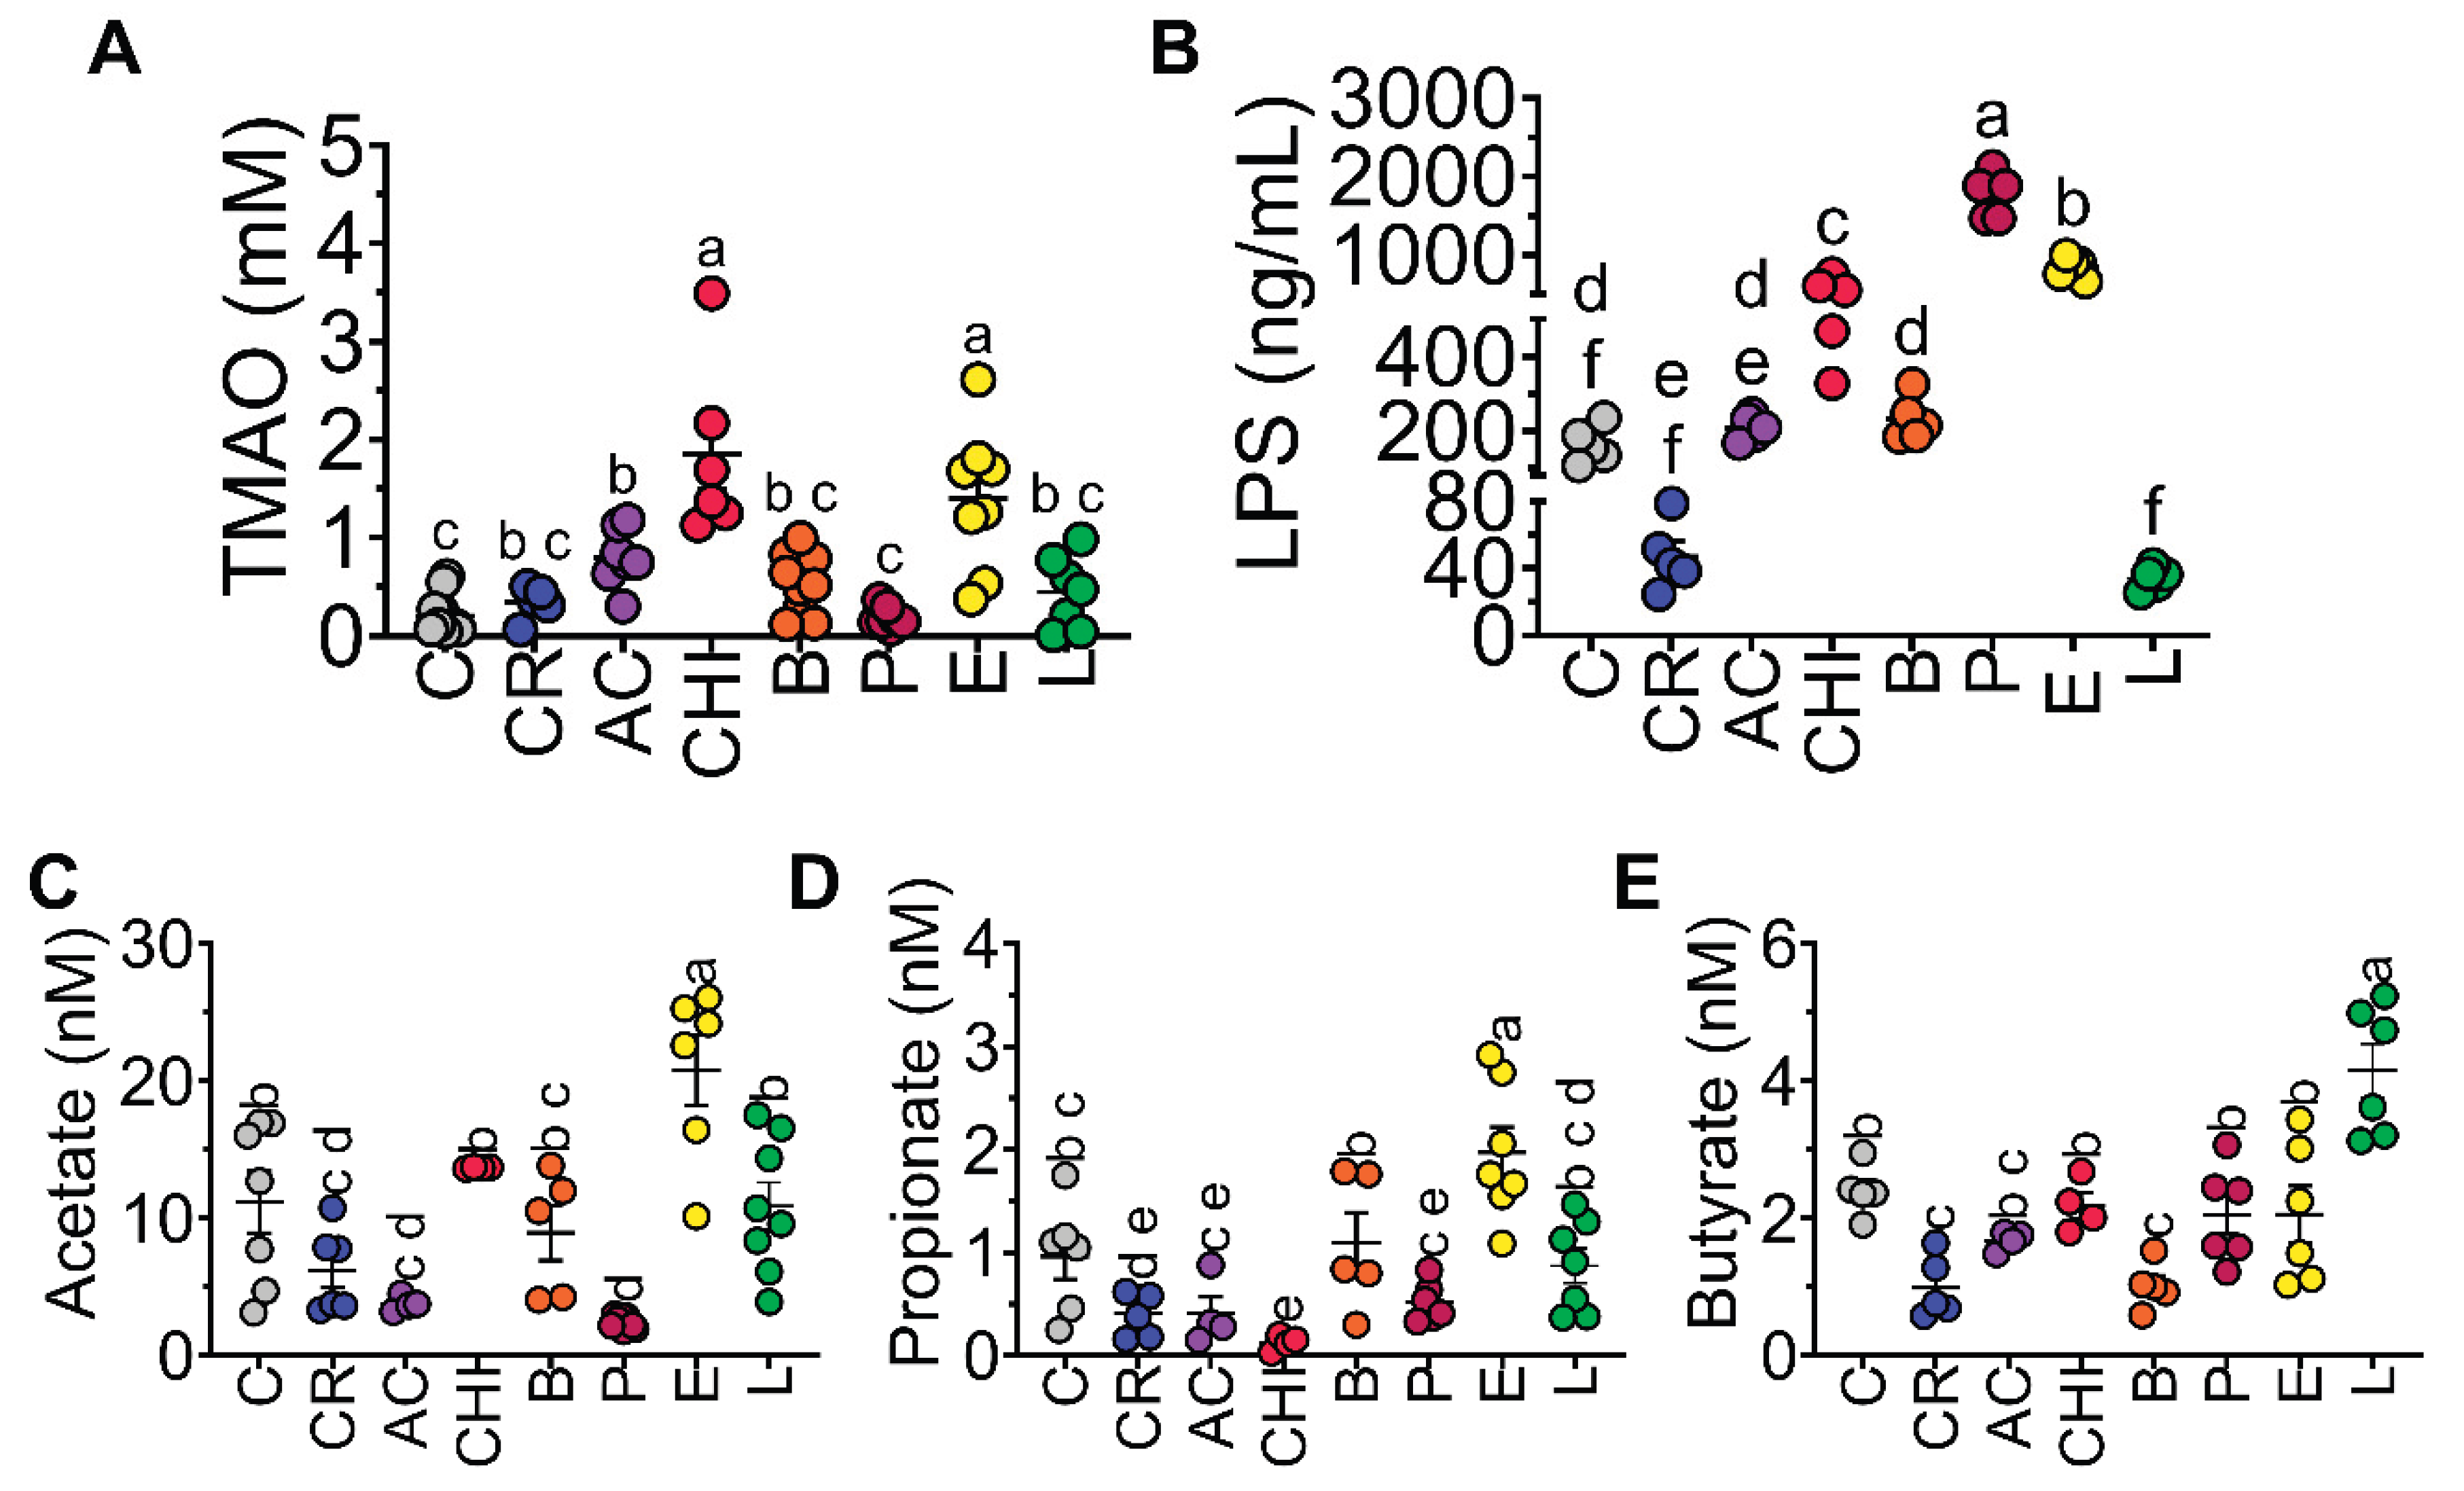

Table 1.
Chemical composition in different sources of food.
| Chemical composition (g/100g food) | Cricket | Acocil | Chinicuil | Beef | Picanha | Egg | Lentil |
|---|---|---|---|---|---|---|---|
| Protein | 51.84 | 43.3 | 28.7 | 75.0 | 57.1 | 50.6 | 25.3 |
| Lipids | 6.73 | 4.54 | 63.0 | 2.97 | 21.0 | 30.3 | 0.63 |
| Carbohydrates | 4.84 | 2.12 | 0.93 | 3.40 | 1.97 | 11.4 | 53.9 |
| Soluble fiber | 8.90 | 0.00 | 14.8 | 0.00 | 0.00 | 0.00 | 13.2 |
| Insoluble fiber | 5.36 | 7.12 | 4.51 | 0.00 | 0.00 | 0.00 | 1.81 |
| Ashes | 22.0 | 34.2 | 1.13 | 3.02 | 3.72 | 4.20 | 2.05 |
| Resistant starch | ND | ND | ND | ND | ND | ND | 3.25 |
Values are expressed as mean. The samples were processed in technical duplicate. ND: not detected.
Disclaimer/Publisher’s Note: The statements, opinions and data contained in all publications are solely those of the individual author(s) and contributor(s) and not of MDPI and/or the editor(s). MDPI and/or the editor(s) disclaim responsibility for any injury to people or property resulting from any ideas, methods, instructions or products referred to in the content. |
© 2025 by the authors. Licensee MDPI, Basel, Switzerland. This article is an open access article distributed under the terms and conditions of the Creative Commons Attribution (CC BY) license (http://creativecommons.org/licenses/by/4.0/).
Copyright: This open access article is published under a Creative Commons CC BY 4.0 license, which permit the free download, distribution, and reuse, provided that the author and preprint are cited in any reuse.


