Submitted:
08 September 2025
Posted:
11 September 2025
You are already at the latest version
Abstract
Econometrics unifies statistics (and mathematics) with economics to quantitatively analyze economic phenomena based on the concurrent development of theory and observation. A very popular statistical software is \textit{R} that offers packages related to econometrics, and the evolution of \textit{R} has also led to the growth of econometrics related packages. A systematic review of these packages is presented in this paper. Further, statistical analyses are performed including descriptive and inferential statistics, along with text mining to compute the word frequency, association among words (n-grams \& correlations) and topic modelling.
Keywords:
economics
; econometrics
; R statistical software
1. Introduction
As Ragnar Frisch [1] explains in the first issue of Econometrica in 1993, is the unification of statistics, economic theory, and mathematics that constitutes econometrics. Each viewpoint, by itself, is necessary but not sufficient for a real understanding of quantitative relations in modern economic life. Econometrics aims at giving empirical content to economic relationships. The three key ingredients are economic theory, economic data, and statistical methods. Neither ‘theory without measurement’ nor ‘measurement without theory’ is sufficient for explaining economic phenomena. It is, as Frisch emphasized, their union that is the key to success in the future development of econometrics [2].
It is difficult to define what R is clearly. On the one hand, it is software for quantitative analyses in various fields. On the other hand, R is also a programming language that is oriented towards data analysis. What is more, it is also a development of the S language developed at Bell Laboratories, which is also intended for quantitative analyses. The most appropriate description seems to be the statement that R is an environment (actually a programming language) which is focused on the processing of data and their (statistical) analysis, along with wide visualization (graphic) possibilities. An important feature of the R environment is its flexibility and the possibility of constantly expanding applications. This is best seen by the number of additional packages available in the official repository.
The only systematic reviews previously conducted on R packages have been in fields distinct from the present study. One review focused on the application of exploratory factor analysis (EFA), examining the implementation and methodological aspects of this statistical technique within R [3]. The other review pertained to sports statistics and sports analytics, evaluating R packages designed for analyzing and interpreting data in the context of sports performance and related metrics [4].
Despite R’s increasing adoption in econometrics, a systematic evaluation of econometrics-related R packages remains largely unexplored. This paper addresses that gap by offering a structured overview of R packages relevant to econometric analysis. The objective is to classify, summarize, and analyze these packages with respect to their statistical features, metadata, and publication profiles. Moreover, we assess trends in package development, identify methodological concentrations (e.g., Bayesian vs. frequentist), and explore regional contributions to the software ecosystem.
The structure of the paper is as follows. Section 2 outlines the methodology used to identify and select relevant R packages from CRAN and the Econometrics Task View. Section 3 presents the results of the statistical analyses, including descriptive summaries and inferential relationships. Subsections investigate author profiles, update behaviors, documentation practices, and citation networks. Subsection 3.11, specifically, highlights key findings from a text mining analysis of package descriptions. Finally, Section 4 concludes with a summary of contributions and potential directions for future work.
2. Methods
To systematically identify econometrics-related R packages, a structured and reproducible search strategy was employed. The goal was to compile a comprehensive set of packages that are actively used in econometric analysis, ensuring relevance across multiple subfields such as time series analysis, panel data modeling, causal inference, regression methods, Bayesian econometrics, and data collection through web scraping.
The search process began with a keyword-based query on CRAN, using the term "econom" to capture packages explicitly associated with econometrics. This approach ensured the inclusion of packages whose titles, descriptions, or metadata referenced econometric applications. Next, the scope was expanded to include additional relevant areas, incorporating packages that contribute to econometric modeling, statistical inference, and computational methods widely used in the discipline. Specifically, any package related to time series, panel data, causal inference, regression models, Bayesian econometrics, and web scraping was considered for inclusion. A total of 64 packages were included in this process.
To further refine the selection, the CRAN Task View on Econometrics was reviewed. All packages listed under this category were included in the dataset, except for one package that was deemed irrelevant to econometrics. The Task View provided a curated collection of tools recommended by domain experts, ensuring that the dataset covered key methodologies and widely used econometric techniques. After this process, 145 packages were also included.
The search process commenced on January 1, 2025, and concluded on January 31, 2025. A total of 209 packages were identified; however, two packages were excluded from the analysis. The first, lotterybr, was omitted as it contains data related to Brazilian lottery games, focusing on the exploration of their dynamics and outcomes. The second, xts, was excluded due to its primary function of facilitating the uniform handling of R’s various time-based data classes by extending the zoo package. This extension preserves native format information, enables user-level customization and extension, and enhances cross-class interoperability. Following these exclusions, a total of 207 packages remained for further analysis. This process is visually depicted in Figure 1, illustrating the systematic approach adopted for this overview.
Once the relevant packages were identified, detailed metadata were recorded for each package to facilitate subsequent analysis. The extracted metadata included package name, first release year, creator country, number of authors, number of updates, availability of vignettes, presence of built-in datasets, and references in journal and book publications. Additionally, to assess the broader impact and usage of each package, reverse dependencies (imports, suggests, enhances) were documented, along with whether the package was specifically designed for Bayesian analysis or web scraping. Lastly, the gender of the package creator was noted where possible, allowing for demographic insights into the development community.
By implementing this structured search strategy, a total of 207 R packages were identified and systematically analyzed. This methodology ensures that the selection is both comprehensive and relevant, providing a solid foundation for evaluating the role of R in contemporary econometric research.
3. Statistical Analysis
3.1. Main Characteristics
Table 1 shows the main characteristics of the items in the dataset that were collected. In terms of time period, most are produced between 2009-2018 (46%), less so in recent years (2019-2024) (28%), and much less so between 1999-2008 (26%). Most creators are based in Europe (56% of the total) and North America (27%), whereas the other continents are fewer in representation.
Most items are created by small teams. 56% of course items have one or two authors, whereas only 4% percent of course items have more than ten authors. The update frequency is similar to the over-all trend, 54% of the items have undergone between one and ten updates and 9% of the items were updated extensively (51–216 updates). In terms of content and documentation, 68% of the items contain data, while 46% include vignettes, indicating a moderate level of user support and reproducibility. In relation to their publication types, approximately 45% have been linked to journals and not so much to books, seeing that only 19% were linked to book publication. Thus, journal-based dissemination has a stronger connection than book-based dissemination.
Most items (93%) are reverse imported by another packaging – suggested by or enhanced by another item. Furthermore, 94% of the creators in the dataset are male. Only 7% of the items are ‘dataset-only’, the same percentage uses Bayesian methods and 8% involves web scraping. Finally, a significant portion (73%) of the items are categorized under the CRAN Task View for Econometrics, emphasizing a strong orientation toward econometric applications.
3.2. Journal Publication and Author Group
In contrast to just 36 (31.9%) of the 113 unpublished packages, 46 (48.9%) of the 94 packages with a corresponding journal publication were created by teams of three to ten authors, as indicated in Table 2. Packages created by smaller groups of one or two authors, on the other hand, were more likely to go unpublished (n = 73, 64.6%) than to be published (n = 44, 46.8%). Only 8 packages, evenly divided between published and unpublished, were created by large teams of 11–26 authors.
The test of independence was used to formally assess the relationship between author group size and publication status. The test suggested () that the size of the authoring team affects the likelihood of journal publication. Notably, mid-sized collaborations (3–10 authors) appear to be associated with a higher probability of academic publication compared to smaller or larger groups.
This suggests that author group size may reflect not only the scope of collaboration but also the professional networks and institutional support often necessary for achieving publication in peer-reviewed journals. In the context of computational econometrics, collaborative teams may benefit from the division of labor in package development, increased methodological rigor, and improved documentation—factors that align with academic standards emphasizing transparency, replicability, and the collective vetting of analytical tools [5,6,7]. Thus, the composition of author teams could serve as an indirect indicator of both the scholarly orientation and the publication potential of econometrics related R packages.
3.3. Vignettes and Journal Publication
An analysis of the relationship between the inclusion of vignettes and the presence of a journal publication reveals notable differences among R packages developed for econometrics. As shown in Table 3, of the 94 packages associated with a peer-reviewed journal publication, 59 (62.8%) included a vignette. In contrast, among the 113 packages without a related publication, only 37 (32.7%) contained a vignette. According to this distribution, vignettes—which frequently function as extended documentation or usage tutorials that improve reproducibility, usability, and adoption—are more likely to be included in packages with academic support [7,8].
The test revealed a significant correlation between publication status and vignette inclusion (). This finding implies that the creation of vignettes might be impacted by academic standards, which place a greater emphasis on transparency and reproducibility in quantitative research, in addition to sound software engineering practices [6,9].
Vignettes can be viewed as a sign of methodological robustness in the field of econometrics, where the reproducibility of empirical models and procedures is essential to both validation and extension. Packages accompanied by vignettes are thus more likely to be published, possibly because they align with evolving norms in computational social sciences that value openness and replicability [10].
3.4. Reverse Imports/Suggests/Enhances and Journal Publication
Out of the 94 published packages, 90 (95.7%), had reverse citations, and only 4 (4.3%) did not have such reverse links, as obsereved in Table 4. Similarly, among the 113 unpublished packages, 103 (91.2%) had at least one reverse reference, while 10 (8.8%) did not. Although published packages do seem to have a slightly higher proportion of cited packages, the difference is quite insignificant.
There was no evidence () of a significant association between being referenced by other packages and having a journal publication. This indicates that network-based popularity or reuse, operationalized through reverse dependencies, does not seem to affect or predict whether an R econometrics package has been published in an academic journal. It may also suggest that scholarly publication and community membership follow two partially orthogonal logics: one academically focused, based on scholarly evaluation and peer review, and the other practically driven, rooted in utility and modular reuse within the R ecosystem [11,12]. While reverse dependencies are often regarded as capturing a package’s importance or influence within a software ecosystem, their lack of relationship with publication status could point to differing incentives or audiences between academic and developer communities.
3.5. Reverse Imports/Suggests/Enhances and Updates
The econometrics related packages ecosystem is particularly striking when observing the pattern concerning a package’s interconnectedness, as both suggested and reverse imports form new connections or dependencies, along with updates enabled through sophisticated updates, in contrast to the number of updates made to the package. As documented in Table 5, of the 195 packages that had at least one reverse dependency (suggests or enhances), 100 (51.3%) of those incorporated had a low (1–10) number of updates, while 75 (38.5%) had a moderate number (11–50) and 18 (9.2%) had frequent updates (51–216). In reverse, for the 14 packages without any reverse dependencies, 12 (85.7%) had only 1-10 updates, and none exceeded 50 updates.
A statistically significant association was detected (), suggesting that the update behavior of packages is related to how much it is connected to the rest of the R system. This indicates that packages with reverse dependencies have updates more often, maybe because are higher user-demand, visible, or are pushed by the need for backward compatibility. In econometric software, which requires great care for reliable and stable computation, the closely connected packages may be used as infrastructural software of other packages. The general tendency of updating these packages sooner also follows general best practices for software engineering and likely reflects the impact of community dynamics, where release schedules are dictated by user feedback and inter-package dependencies influence the cycle of improvement and responsiveness [5,6,13].
3.6. Continent of Creator and Year of Creation
Temporal and geographic perspectives on the pattern of existence of R packages for econometrics show evolution in the distribution map of contributors across time stretches. According to Table 6 the first packages (1999–2008) were primarily developed in Europe (n = 29) and North America (n = 19), with almost no representation from any other continent. In the period 2009–2018, the number of packages coming from Europe saw a drastic rise (n = 55), and the geographic diversity branched out to have considerable contribution from Asia (n = 7), Oceania (n = 4), and South America (n = 8). The more recent period (2019–2024) continues to show European predominance (n = 33), albeit the other continents persist at lower levels.
No statistically significant association between release period and geographic origin was detected (). This suggests that although Europe has remained the dominant contributor over time, the relative proportions of regional contributions have not shifted in a statistically meaningful way across the observed time spans. This reveals the gradual globalizing effect on open-source development, especially in more technical disciplines such as econometrics. While Europe and North America remain centers for statistical software production, increasing contributions from Asia and South America show a growing spirit of inclusion in the global organization of the R ecosystem. Inasmuch as open-source avenues drop barriers to participation, the geographic diversity of software development may increase even more with the general wave toward democratization in scientific computing.
3.7. Year of Creation and Updates
An investigation into the relationship between the release period of econometrics R packages and their frequency of updates reveals a striking pattern in software maintenance behavior over time. As shown in Table 7, packages released between 1999 and 2008 tended to receive substantially more updates, with 36 (58.1%) falling into the moderate update range (11–50 updates) and 14 (22.6%) into the high range (51–216 updates). In contrast, packages released between 2009 and 2018 display a different profile: the majority (n = 64, 66.7%) received only 1–10 updates, with fewer packages undergoing moderate (n = 28, 29.2%) or high (n = 4, 4.2%) levels of revision. More recent packages (2019–2024) are even more skewed toward infrequent updates, with 44 out of 57 (77.2%) having received only minimal maintenance and none exceeding 50 updates.
There seems to be a strong and systematic association between the age of the package with maintenance intensity (). On the one hand, older packages tend to enjoy more consistent long-term updates, probably owing to established user bases, workflows adopting them for analytics, and feedback. This trend also reflects a few generalized principles in software lifecycle for scientific software, where the maintenance over the longer term, community effort, and adaptability weigh heavily in evaluating longevity and impact [14,15]. On the other hand, newer packages may still be in early adoption phases or made for niches and hence see little activity post-release. The gap thus also brings into question the long-term sustainability of newer software projects while weighing the institutional incentives for maintenance of research code [16,17].
3.8. Continent of Creator and Bayesian Analysis
Investigation on a relation between including Bayesian analysis feature and the geographical location of package authors resulted in slight differences across the regions. According to Table 8, Bayesian techniques were found in a small number of R packages in every region, specifically in only 15 packages. In North America, for example, the method was present in 3 out of 55 packages (5.5%), while in Europe the percentage was slightly higher, with 10 out of 117 packages (8.5%) having Bayesian analysis capabilities. Asia, Oceania, and South America were barely represented, as they had only one or none of the packages with support for Bayesian tools.
The regional disparities in the adherence to Bayesian methods observed were not statistically significant, , suggesting that there was no significant relationship between the incorporation of Bayesian features in a software package and the region of the creator. This implies that although the use of Bayesian analysis in econometric software development in R is on the periphery, it is not particularly localized to a specific part of the world.
Looking at the bigger picture of econometrics, the reason behind the slow acceptance of Bayesian methods could be the persistent disciplinary bias in favor of the frequentist approach, or the general belief in the complexity and high computational burden associated with Bayesian inference [18,19]. However, with the increased availability of computational resources and the mainstreaming of Bayesian methods in empirical studies, future research can re-examine this issue to track the changing regional trends in methodological adoption.
3.9. Dataset Availability and Journal Publication
To assess whether R econometrics related packages that consist solely of datasets—without accompanying analytical functions or methodological implementations—are more or less likely to be published in academic journals, a contingency table was created. As shown in Table 9, among the 14 packages identified as “datasets only,” only 2 (14.3%) had been published, while 12 (85.7%) had not. In contrast, among the 193 packages that offered more than just datasets (e.g., containing functions, models, or estimation routines), a much higher 92 (47.7%) had associated journal publications.
There is a statistically significant association between dataset-only status and publication, . These results suggest that dataset-only packages are significantly less likely to be published in peer-reviewed journals. This reflects the dominant norms in academic econometrics, where methodological innovation, algorithmic development, or model implementation is often a prerequisite for publication [20,21]. While dataset packages may serve important pedagogical or empirical roles, they often do not meet the innovation threshold required by scholarly journals. Moreover, it aligns with broader trends in computational social science, where the publication incentives tend to prioritize methodological contribution over data curation alone, despite the recognized value of open data [22].
3.10. Growth of Packages
Figure 2 contains two cumulative line plots that collectively illustrate the temporal and geographic evolution of the econometrics related packages from 2000 to approximately 2025. These visualizations provide insight into both the overall growth of the field and the global distribution of its development. This pattern mirrors broader trends in international scientific collaboration and knowledge production, where once-dominant regions are increasingly joined by emerging contributors across the Global South [23,24].
Figure 2(a) presents the cumulative number of packages created over time. The horizontal axis provides information about Year of Creation while vertical axis provide the information of the Cumulative Count. The curve is evidently exponential: The increase starts in early 2000, growth accelerates after 2010 and continues steeply in 2020s. This indicates that the ecosystem of econometric tools in R is maturing and rapidly expanding. Also, there is a growing dependence on R as a key computational platform in academic and applied econometrics [25,26]. The sharp growth demonstrates how R has become an essential platform for the distribution of econometric tools within the open-source community.
Figure 2(b) disaggregates the cumulative count by continent—Asia, Europe, North America, Oceania, and South America—revealing important regional dynamics in the development of econometrics packages. North America and Europe dominate the landscape, contributing the largest number of packages and showing strong growth, particularly in the post-2010 period. Asia demonstrates a growing presence, with a consistent rise in contributions that points to an expanding research and development capacity in econometrics. Oceania and South America, while contributing fewer packages overall, show steady and meaningful growth, highlighting the global diffusion of econometric expertise and the R programming environment.
When examined together, the two panels suggest a globalization of econometric practice through open-source development, anchored by a few leading regions but increasingly inclusive over time. The steep overall trajectory in the left panel is primarily driven by North America and Europe, as shown in the right panel, but the emergence of contributions from Asia and other regions signifies a broadening base of participation.
This combination implies two key outcomes: Democratization of Econometric Tools: The open-source nature of R enables researchers and practitioners worldwide to contribute and access sophisticated econometric methods, reducing traditional barriers associated with proprietary software [27,28]. Decentralization of Innovation: While historical hubs remain influential, the growth in contributions from underrepresented regions reflects a shift toward a more decentralized model of methodological innovation and software dissemination in the econometrics community [24].
Figure 2, therefore, not only documents the growth of R packages but also narrates a deeper story about the changing geography of knowledge production in quantitative economics, made possible by the open-source ethos and collaborative structures of the R ecosystem.
3.11. Text Analysis of Descriptions
Textual analysis of the descriptions of these 207 R packages is performed. These descriptions were preprocessed by being transformed to lowercase, cleaned from punctuations, stop and non-informative words, hyperlinks, numbers and references. The lemmatization of these words was performed using the TreeTagger tool [29,30] via the koRpus package [31]. The purpose of lemmatization is to transform the words to their base or dictionary form and to produce valid words that facilitate the organization and the analysis of the text. The lemmatization for this TreeTagger software version is well-used and trained on the Decision Trees model. Then, wordclouds of both the most frequent words and phrases are produced [32]. The extraction of the most frequent phrases is achieved utilizing the phm R package [33]. The phm method is based on inputing a corpus of text, block splitting according to punctuation, and extracting and sorting unique n-grams of words, given words to avoid starting/ending with (like stop words) and phrases to be excluded, a minimum threshold frequency and avoidance of overlapping for each phrase. Thus, a series of unique most frequent phrases is the output of this phm tool.
The wordclouds produced from the above procedures are illustrated in Figure 3 and the frequencies of the most frequent 20 words (Table 10) and phrases (Table 11). According to Figure 3a and Table 10, the main purposes of the packages found at the word level are estimation and fitting (estimate, likelihood, fit), regression models (linear, probit, logit), inference and testing (test, statistic, inference) and data management (data, variable, testing). Regarding Figure 3b and Table 11, the main categories at phrase level are time series (time series, impulse response), classical estimation (maximum likelihood estimation, least square, two step), linear and generalized regression (linear regression, generalized linear, beta regression, quantile regression), panel analysis (panel data, fixed effect, random effect), causal inference and policy evaluation (instrumental variable, synthetic control, treatment effect) and system/simultaneous equations (discrete choice, multinomial probit).
4. Conclusions
This overview provides a comprehensive analysis of 207 R packages related to econometrics, offering new insights into the structure, development patterns, and dissemination of econometric tools within the R ecosystem. By integrating descriptive statistics, inferential analyses, and text mining techniques, this study contributes to a clearer understanding of the current state of computational econometrics in R.
Several key findings emerge. First, the majority of packages are created by small to medium-sized teams, with those developed by mid-sized groups being more likely to appear in academic journals. Second, packages with thorough documentation—especially those including vignettes—are significantly more likely to be published, underscoring the role of reproducibility and usability in scholarly dissemination. Third, although the presence of reverse dependencies is high across packages, this network connectivity does not predict publication, suggesting divergent academic and practical incentives. Moreover, while most packages originate from Europe and North America, there is a growing, though still modest, contribution from other regions, indicating an ongoing globalization of econometric software development.
The text mining analysis further reveals that R packages cover a broad range of econometric techniques, including time series, panel data, causal inference, and estimation procedures, confirming the versatility and methodological richness of the R ecosystem. Yet, Bayesian methods and dataset-only packages remain underrepresented, and recent packages tend to be updated less frequently, raising questions about sustainability and support for newer tools.
Future research can build on this work in several ways. First, a deeper functional benchmarking of package performance beyond metadata and description analysis would enhance practical decision making for users. Second, more attention could be given to the role of community dynamics and user feedback in shaping the development of packages. Finally, extending the overview to include GitHub-hosted packages and those not yet available on CRAN would provide a fuller picture of innovation and experimentation in computational econometrics.
References
- Kopczewska, K. Applied spatial statistics and econometrics: data analysis in R; Routledge, 2020.
- Frisch, R. Editorial. Econometrica 1933, 1, 1–4. [Google Scholar] [CrossRef]
- Govindasamy, P.; Isa, N.J.M.; Mohamed, N.F.; Noor, A.M.; Ma, L.; Olmos, A.; Green, K. A systematic review of exploratory factor analysis packages in R software. Wiley Interdisciplinary Reviews: Computational Statistics 2024, 16, e1630. [Google Scholar] [CrossRef]
- Casals, M.; Fernández, J.; Martínez, V.; Lopez, M.; Langohr, K.; Cortés, J. A systematic review of sport-related packages within the R CRAN repository. International Journal of Sports Science & Coaching 2023, 18, 621–629. [Google Scholar]
- Gentzkow, M.; Shapiro, J.M. Code and Data for the Social Sciences: A Practitioner’s Guide. Journal of Economic Perspectives 2014, 28, 191–206. [Google Scholar] [CrossRef]
- Marwick, B.; Boettiger, C.; Mullen, L. Packaging Data Analytical Work Reproducibly Using R (and Friends). The American Statistician 2018, 72, 80–88. [Google Scholar] [CrossRef]
- Bartoń, K. Why You Should Write a Vignette: Documentation Practices in R. The R Journal 2023. [Google Scholar]
- Stodden, V. Reproducible Research: Addressing the Need for Data and Code Sharing in Computational Science. Computing in Science & Engineering 2010, 12, 8–12. [Google Scholar]
- Gentzkow, M.; Shapiro, J.M. Code and Data for the Social Sciences: A Practitioner’s Guide. Technical report, University of Chicago, 2014.
- Peng, R.D. Reproducible Research in Computational Science. Science 2011, 334, 1226–1227. [Google Scholar] [CrossRef] [PubMed]
- Eghbal, N. Roads and Bridges: The Unseen Labor Behind Our Digital Infrastructure. Ford Foundation, 2016.
- Decan, A.; Mens, T.; Claes, M. Package Dependencies and Upstream Health in Open Source Software. Empirical Software Engineering 2019, 24, 881–919. [Google Scholar]
- Bartoń, K. Package ’MuMIn’: Multi-Model Inference, 2023. R package version 1.47.1.
- Wilson, G.; Aruliah, D.A.; Brown, C.T.; Hong, N.P.C.; Davis, M.; Guy, R.T.; Haddock, S.H.D.; Huff, K.D.; Mitchell, I.M.; Plumbley, M.D.; et al. Best Practices for Scientific Computing. PLoS Biology 2014, 12, e1001745. [Google Scholar] [CrossRef] [PubMed]
- Hinsen, K. Dealing with software collapse in computational science: The need for software engineering education and training. Computing in Science & Engineering 2019, 21, 104–109. [Google Scholar] [CrossRef]
- Baker, M. 1,500 scientists lift the lid on reproducibility. Nature 2016, 533, 452–454. [Google Scholar] [CrossRef]
- Katz, D.S.; Hong, N.P.C.; Howison, J.; Löffler, F.; Hwang, L.; Crick, T.; Turk, M. Recognizing the Value of Software: A Software Citation Guide. F1000Research 2021, 9, 1257. [Google Scholar] [CrossRef]
- Koop, G. Bayesian Econometrics; Wiley, 2003.
- Rossi, P.E.; Allenby, G.M.; McCulloch, R. Bayesian Statistics and Marketing; John Wiley & Sons, 2005.
- Leamer, E.E. Let’s Take the Con out of Econometrics. The American Economic Review 1983, 73, 31–43. [Google Scholar]
- Koenker, R.; Zeileis, A. On Quantile Regression in Econometrics. Journal of Statistical Software 2009, 27, 1–5. [Google Scholar]
- Tenopir, C.; Allard, S.; Douglass, K.; Aydinoglu, A.; Wu, L.; Read, E.; Manoff, M.; Frame, M. Data Sharing by Scientists: Practices and Perceptions. PLoS ONE 2011, 6, e21101. [Google Scholar] [CrossRef] [PubMed]
- Wagner, C.S.; Leydesdorff, L. Network structure, self-organization, and the growth of international collaboration in science. Research Policy 2005, 34, 1608–1618. [Google Scholar] [CrossRef]
- Chen, K.; Zhang, Y.; Fu, X. International research collaboration: An emerging domain of innovation studies? Research Policy 2019, 48, 149–168. [Google Scholar] [CrossRef]
- Zeileis, A.; Kleiber, C.; Jackman, S. Regression models for count data in R. Journal of Statistical Software 2008, 27, 1–25. [Google Scholar] [CrossRef]
- Croissant, Y.; Millo, G. Panel data econometrics in R: The plm package. Journal of Statistical Software 2008, 27, 1–43. [Google Scholar] [CrossRef]
- Stallman, R.M. Free Software, Free Society: Selected Essays of Richard M. Stallman; GNU Press: Boston, MA, 2002. [Google Scholar]
- Von Hippel, E. Democratizing Innovation; MIT Press: Cambridge, MA, 2005. [Google Scholar]
- Schmid, H. Improvements in Part-of-Speech Tagging with an Application to German. In Natural Language Processing Using Very Large Corpora; Springer Netherlands: Dordrecht, 1999; pp. 13–25. [Google Scholar] [CrossRef]
- Schmid, H. Probabilistic Part-of-Speech Tagging Using Decision Trees. In Proceedings of the Proceedings of the International Conference on New Methods in Language Processing, 1994, Vol. 12, pp. 1–9.
- Michalke, M. koRpus: Text Analysis with Emphasis on POS Tagging, Readability, and Lexical Diversity, 2021. R package version 0.13-8. [CrossRef]
- Fellows, I. wordcloud: Word Clouds, 2018. R package version 2.6. [CrossRef]
- Small, E.; Cabrera, J. Principal phrase mining: an automated method for extracting meaningful phrases from text. International Journal of Computers and Applications 2025, 47, 84–92. [Google Scholar] [CrossRef]
Figure 1.
Flowchart of the selection of the R packages for overview.
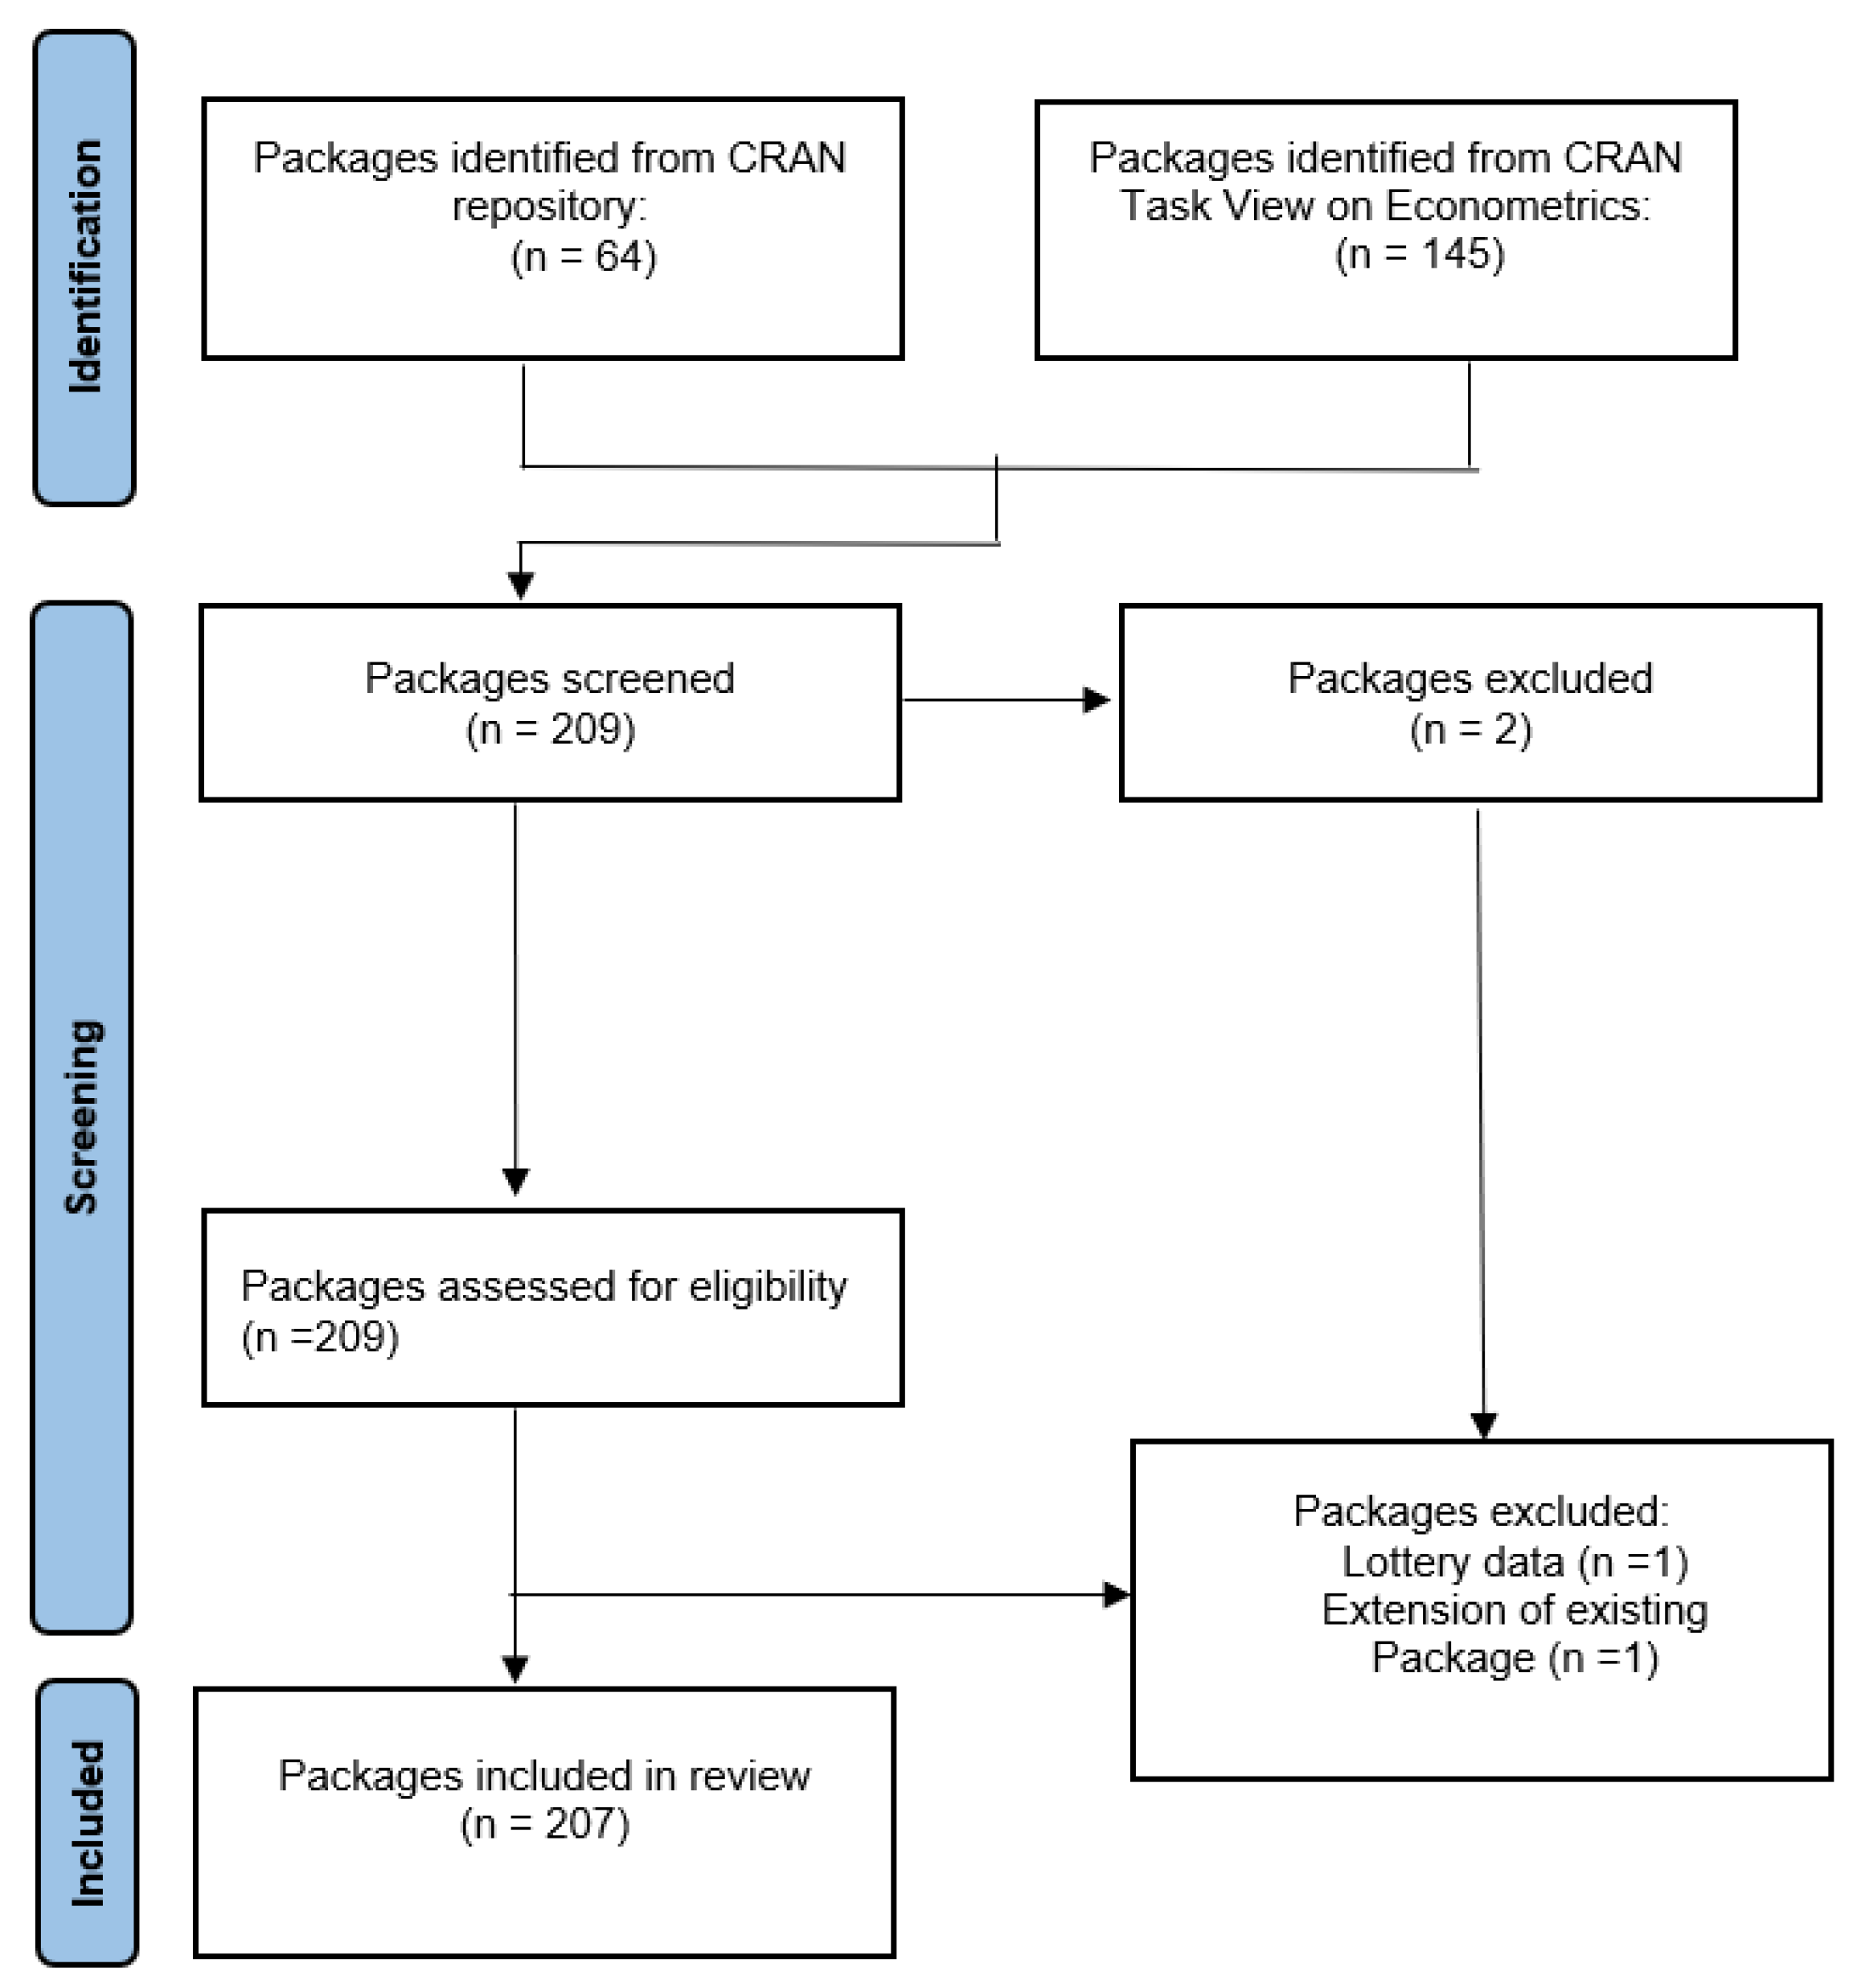
Figure 2.
Cumulative growth of R packages.
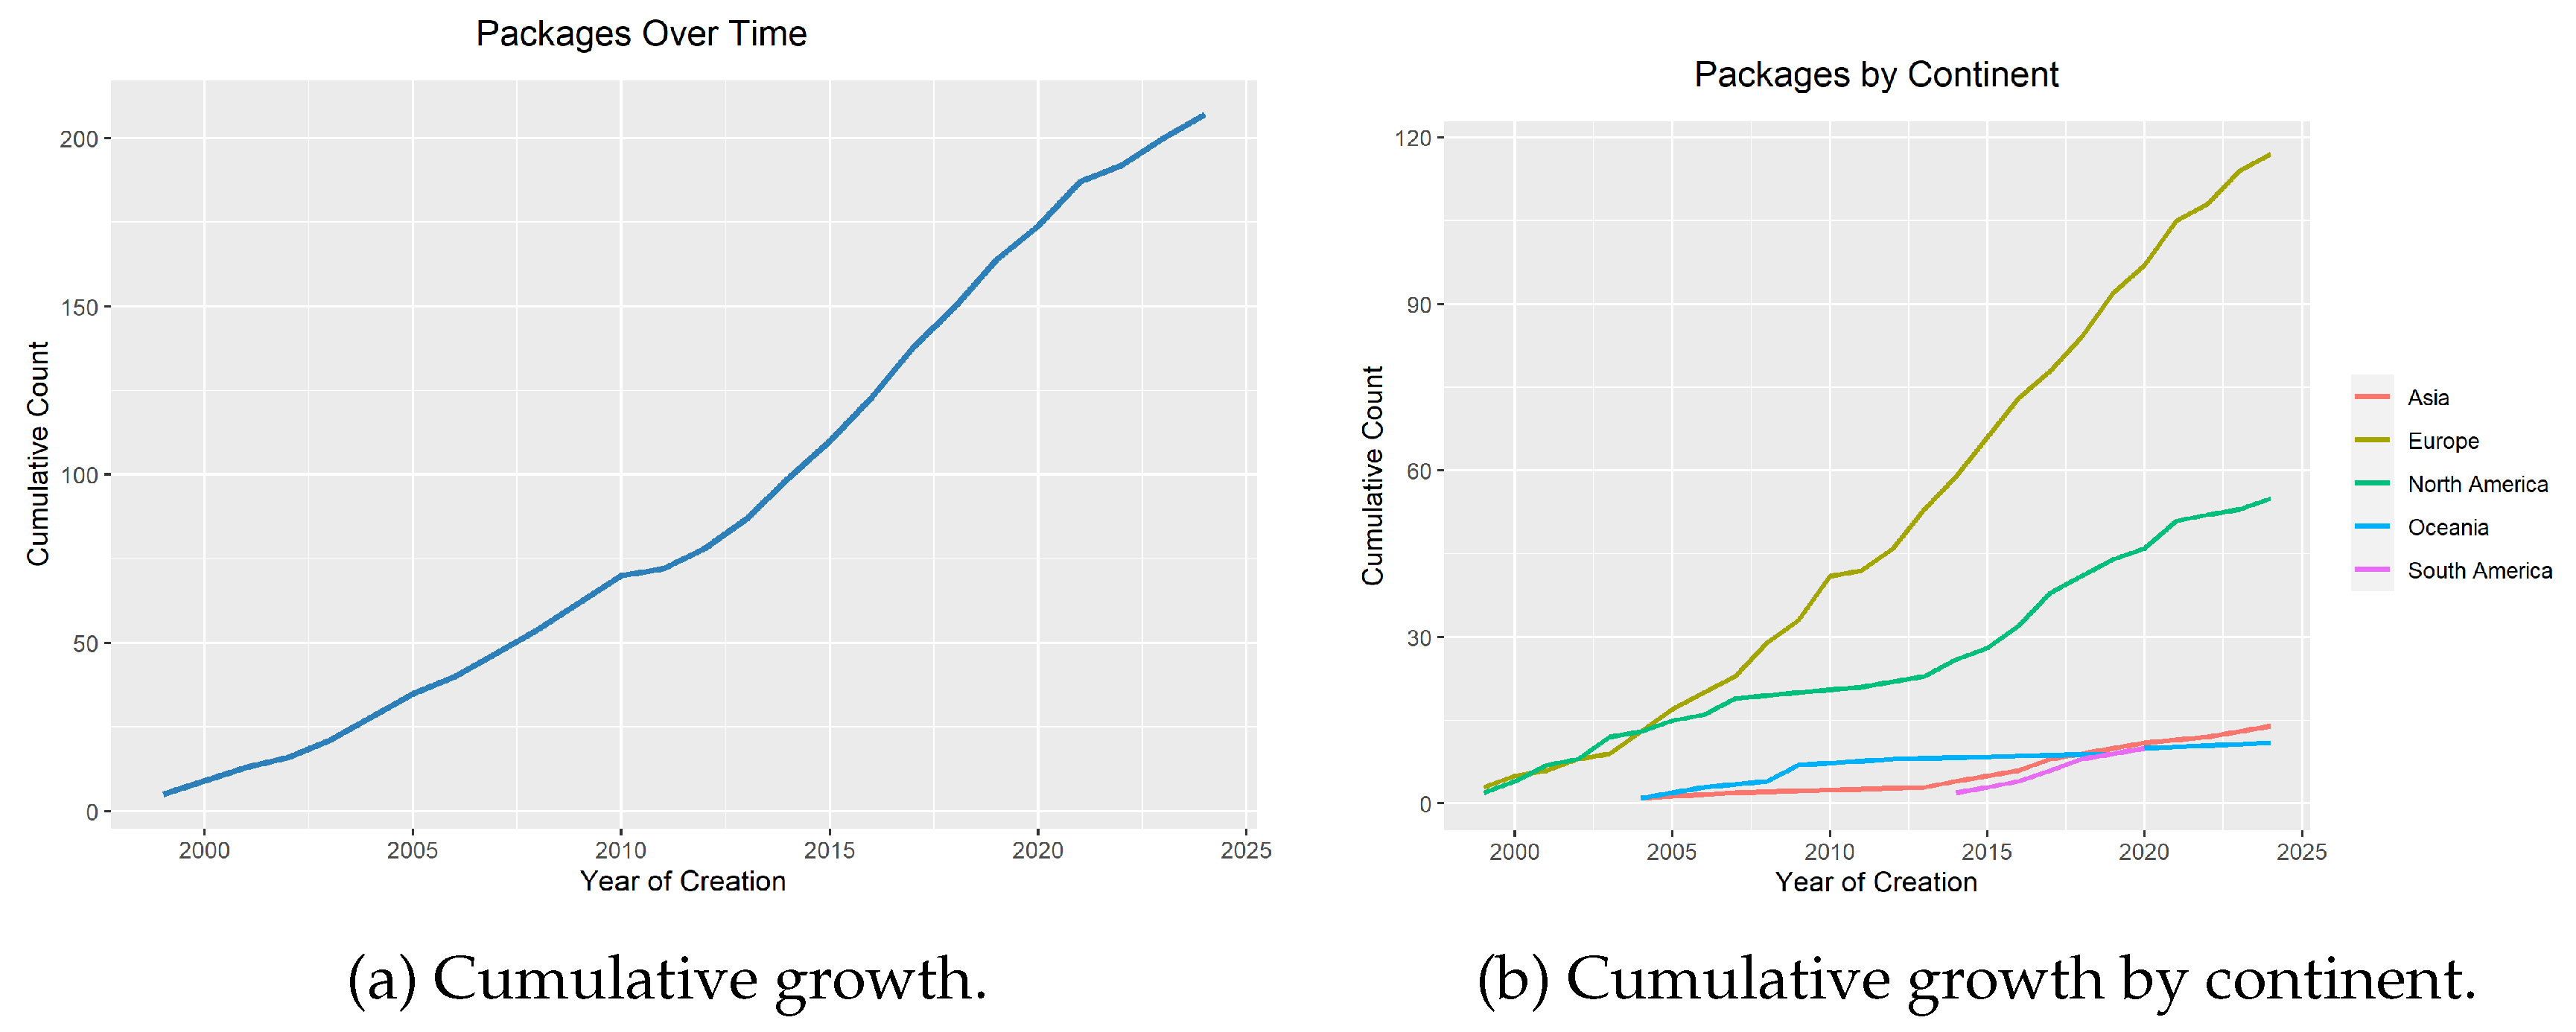
Figure 3.
Most frequent words and phrases in R package descriptions.
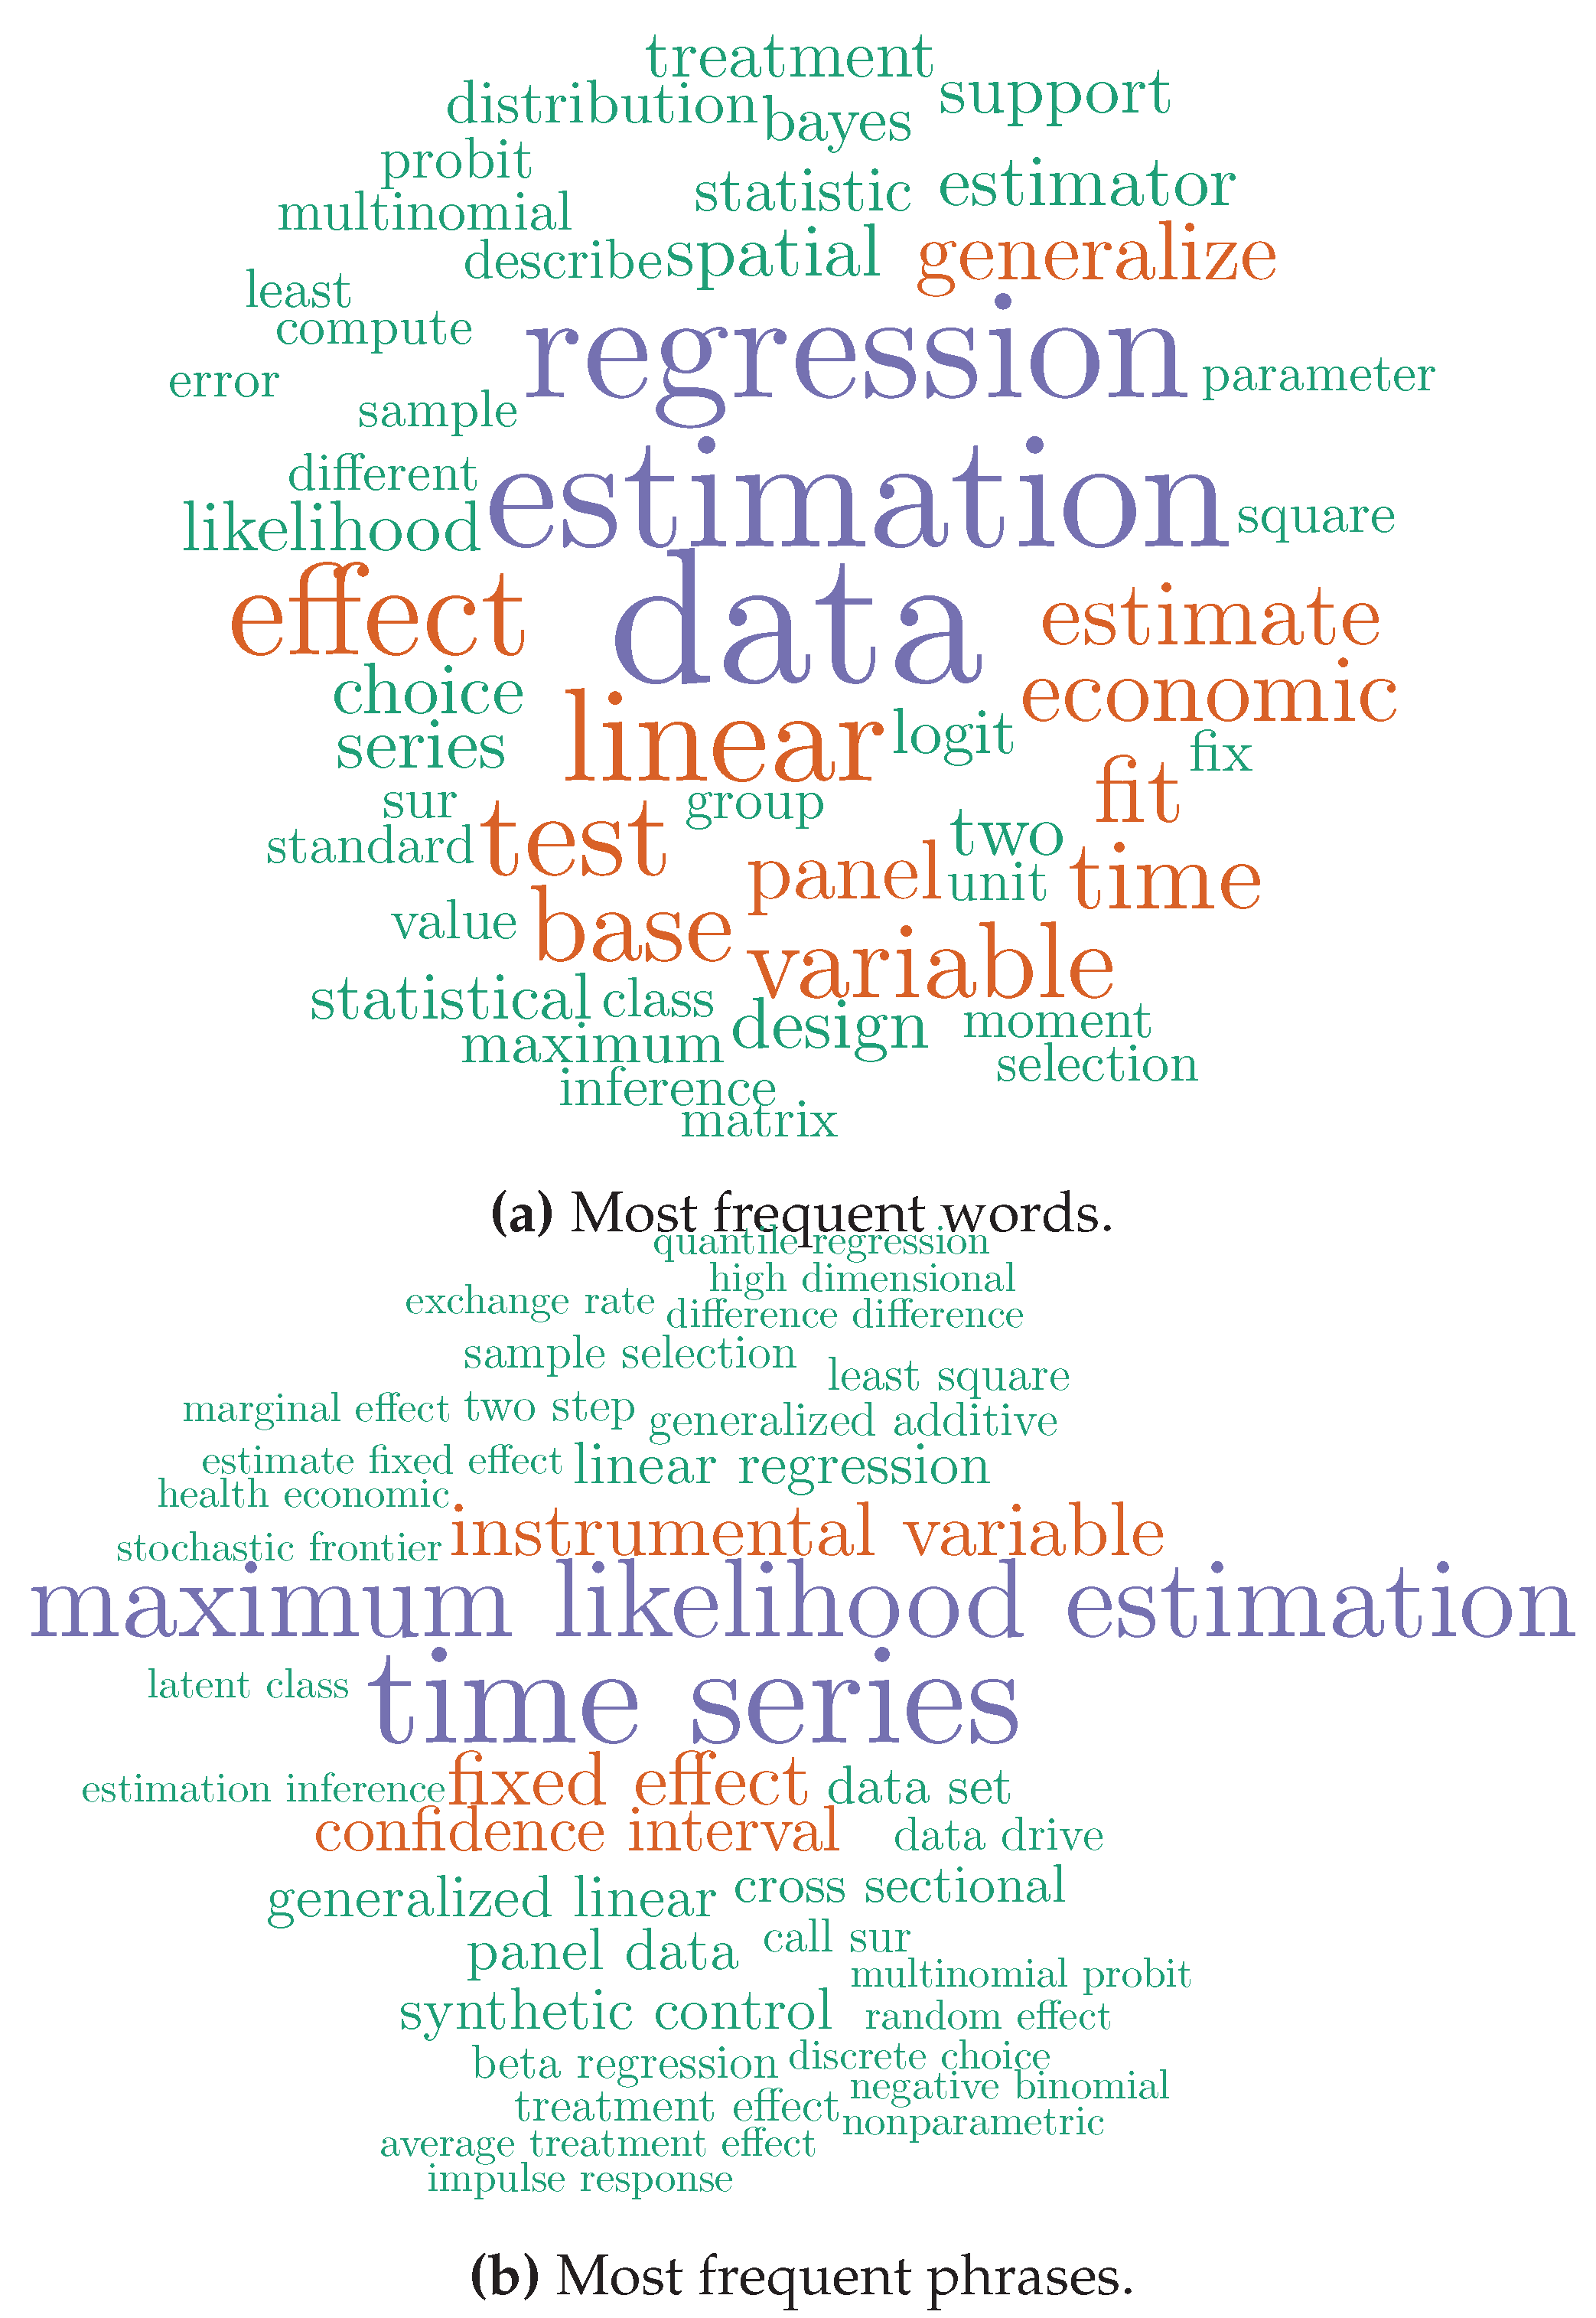

Table 1.
Description of the collected variables.
| Variable | Category | Percentage |
|---|---|---|
| Year of creation | 1999 - 2008 | 26% |
| 2009 - 2018 | 46% | |
| 2019 - 2024 | 28% | |
| Continent of creator | Europe | 56% |
| North America | 27% | |
| South America | 5% | |
| Asia | 7% | |
| Oceania | 5% | |
| Number of authors | 1 - 2 | 56% |
| 3 - 10 | 40% | |
| 11 - 26 | 4% | |
| Number of updates | 1 - 10 | 54% |
| 11 - 50 | 37% | |
| 51 - 216 | 9% | |
| Contains data | Yes | 68% |
| No | 32% | |
| Contains vignette | Yes | 46% |
| No | 54% | |
| Journal publication | Yes | 45% |
| No | 55% | |
| Book publication | Yes | 19% |
| No | 81% | |
| Reverse imports/suggests/enhances | Yes | 93% |
| No | 7% | |
| Gender of the creator | Male | 94% |
| Female | 6% | |
| Datasets only | Yes | 7% |
| No | 93% | |
| Bayesian analysis | Yes | 7% |
| No | 93% | |
| Web scrapping | Yes | 8% |
| No | 92% | |
| CTV Econometrics | Yes | 73% |
| No | 27% |
Table 2.
Journal publication by author group.
| Journal Publication | ||
|---|---|---|
| Author group | No Publication | Publication |
| 1–2 | 73 | 44 |
| 3–10 | 36 | 46 |
| 11–26 | 4 | 4 |
Table 3.
Vignette presence by journal publication.
| Vignette | ||
|---|---|---|
| Journal publication | No | Yes |
| No | 76 | 37 |
| Yes | 35 | 59 |
Table 4.
Reverse imports/suggests/enhances by journal publication.
| Reverse Imports/Suggests/Enhances | ||
|---|---|---|
| Journal publication | No | Yes |
| No | 10 | 103 |
| Yes | 4 | 90 |
Table 5.
Updates by reverse imports/suggests/enhances.
| Updates | |||
|---|---|---|---|
| Reverse imports | 1-10 | 11-50 | 51-216 |
| No | 12 | 2 | 0 |
| Yes | 100 | 75 | 18 |
Table 6.
Continent of creator by year of creation.
| Continent of creator | |||||
|---|---|---|---|---|---|
| First year | Asia | Europe | North America | Oceania | South America |
| 1999–2008 | 2 | 29 | 19 | 4 | 0 |
| 2009–2018 | 7 | 55 | 22 | 4 | 8 |
| 2019–2024 | 5 | 33 | 14 | 3 | 2 |
Table 7.
Updates by year of creation.
| Number of Updates | |||
|---|---|---|---|
| Year of creation | 1-10 | 11-50 | 51-216 |
| 1999–2008 | 4 | 36 | 14 |
| 2009–2018 | 64 | 28 | 4 |
| 2019–2024 | 44 | 13 | 0 |
Table 8.
Bayesian analysis by continent of creator.
| Bayesian Analysis | ||
|---|---|---|
| Creator Continent | No | Yes |
| Europe | 107 | 10 |
| North America | 52 | 3 |
| South America | 10 | 0 |
| Asia | 13 | 1 |
| Oceania | 10 | 1 |
Table 9.
Journal publication by dataset availability.
| Journal publication | ||
|---|---|---|
| Datasets only | No | Yes |
| No | 101 | 92 |
| Yes | 12 | 2 |
Table 10.
20 most frequent words.
| Word | Frequency | |
|---|---|---|
| 1 | data | 100 |
| 2 | estimation | 83 |
| 3 | regression | 78 |
| 4 | linear | 65 |
| 5 | effect | 64 |
| 6 | test | 57 |
| 7 | base | 50 |
| 8 | variable | 50 |
| 9 | time | 45 |
| 10 | fit | 43 |
| 11 | economic | 42 |
| 12 | estimate | 41 |
| 13 | generalize | 36 |
| 14 | panel | 36 |
| 15 | spatial | 30 |
| 16 | two | 30 |
| 17 | choice | 29 |
| 18 | design | 29 |
| 19 | estimator | 29 |
| 20 | series | 29 |
Table 11.
20 most frequent phrases.
| Phrase | Frequency | |
|---|---|---|
| 1 | time series | 21 |
| 2 | maximum likelihood estimation | 16 |
| 3 | fixed effect | 10 |
| 4 | instrumental variable | 10 |
| 5 | confidence interval | 8 |
| 6 | generalized linear | 7 |
| 7 | linear regression | 7 |
| 8 | panel data | 7 |
| 9 | synthetic control | 7 |
| 10 | cross sectional | 6 |
| 11 | data set | 6 |
| 12 | beta regression | 5 |
| 13 | call sur | 5 |
| 14 | data drive | 5 |
| 15 | generalized additive | 5 |
| 16 | least square | 5 |
| 17 | sample selection | 5 |
| 18 | treatment effect | 5 |
| 19 | two step | 5 |
| 20 | average treatment effect | 4 |
Disclaimer/Publisher’s Note: The statements, opinions and data contained in all publications are solely those of the individual author(s) and contributor(s) and not of MDPI and/or the editor(s). MDPI and/or the editor(s) disclaim responsibility for any injury to people or property resulting from any ideas, methods, instructions or products referred to in the content. |
© 2025 by the authors. Licensee MDPI, Basel, Switzerland. This article is an open access article distributed under the terms and conditions of the Creative Commons Attribution (CC BY) license (http://creativecommons.org/licenses/by/4.0/).
Copyright: This open access article is published under a Creative Commons CC BY 4.0 license, which permit the free download, distribution, and reuse, provided that the author and preprint are cited in any reuse.


