
Submitted:
09 September 2025
Posted:
10 September 2025
You are already at the latest version
Abstract
Plasticized polyvinyl chloride (PVC) gels are a fascinating dielectric elastomer actuator showing promise in soft robotics. When actuated with high voltages, the gel deforms towards the anode. A recent application into electrohydraulic actuators requires PVC gels to be analyzed in tensile testing modes driving the need of elastic and hyperelastic constitutive relationships. A linear elastic region was found up to 25% strain and the elastic modulus and Poisson’s ratio were determined. Analyzing the PVC network was used to justify lower Poisson’s ratios as plasticizer content increased, suggesting the nature of the polymer network at low strains. Our work suggests PVC gels can be treated as isotropic and incompressible; however, higher plasticized gels tend to act less incompressible at small strains. A relationship between the elastic modulus and plasticizer weight ratio showed high agreement making it deterministic for any plasticizer content. Neo-Hookean, Mooney Rivlin, Yeoh, Gent, Odgen and extended tube constitute models are investigated. The Yeoh model shows the highest feasibility in electrohydraulic actuation and tensile modeling. Together, these findings establish a constitutive basis for PVC gels with DBA plasticizer, incorporating small strain elasticity, large strain nonlinear behavior, and network analysis while providing suggestive insight into the network structure required for accurately modeling the EPIC.
Keywords:
EPIC actuator
; PVC gel tensile modeling
; dielectric elastomer actuator
; elastic modulus
; Poisson’s ratio
; hyperelastic modeling
; PVC modeling
; PVC-DBA
1. Introduction
Polyvinyl chloride (PVC) gels are a promising class of dielectric elastomer actuators (DEAs) possessing a unique actuation mechanism known as anodophilic attraction or creep deformation towards the anode. First reported by the Harai group [1], this mechanism originates from polymer–solvent interactions coupled with variations in space charge density when an external electric field is applied. Charges carried by the plasticizer form a saturated plasticizer layer near the anode electrode interface. This localized enrichment reduces the modulus in the affected region, thereby enabling enhanced electrostatic attraction towards the anode that creates anodophilic deformation [2,3,4]. Many applications and systems have been developed using this DEA. Li et al. has applied PVC gels to artificial muscles by creating an exoskeleton used to improve gait in older individuals with muscular atrophy [5,6,7,8]. Their wearable utilizes deactivation to generate force for the offending leg. By similar process, PVC gels have been used in rotary brakes. In the event of power loss, relaxation back to the starting configuration applies to a brake pad to stop a rotor [9,10]. Since the discovery of bending actuation, several contractual gripping actuators have been developed [11,12,13] among many other actuators.
Recently, PVC gels have shown promise in electrohydraulic actuation when researchers at KAIST developed the electrohydraulic actuator powered by induced interfacial charges (EPIC) [14]. This novel approach is reminiscent of hydraulically amplified self-healing electrostatic (HASEL) actuators which use Maxwell pressure to compress an elastomeric shell containing dielectric fluid. Fluid displacement pressurizes non-electrode regions creating displacement and force output [15], [16,17,18,19]. The EPIC diverges from HASELs by using PVC film in a round rigid frame that contains dielectric (DE) fluid. Anodophilic attraction zips the gel onto the anode attached to the frame, generating hydraulic pressure and monodirectional hydraulic actuation. Since the PVC gels are softer than the elastomers in HASELs, such as BOPP and Ecoflex 00-30 [20], less energy is expended in material stretching so large displacements can be achieved at voltages around 3 kV [21]. The compliant electrodes allow the gel to zip which has been shown to enhance actuation in HASELs [22].
The present work investigates elastic and hyperelastic tensile constitutive relationships of PVC gels made with DBA plasticizer. A primary objective in developing these relationships is to describe the EPIC’s dominant mechanical response during auction which is biaxial tension from spherical deformation. Studies have analyzed tensile properties of PVC gels with various plasticizers [3,23,24,25] or for their anodophilic actuation behavior [26,27,28,29]. Different polymer-solvent combinations produce unique mechanical response behavior which has not been determined for PVC-DBA. The EPIC requires tensile constitutive models to describe the mechanical behavior of non-actuated gel segments. We note that PVC gels are highly viscoelastic based on their large liquid plasticizer content and preliminary analysis. Pure elastic and hyperelastic models are only strictly valid under steady-state conditions when the material has fully relaxed. Viscoelastic properties will be evaluated in part of a future study.
Secondary objectives are to develop a relationship between elastic modulus and plasticizer content and to validate isotropic and incompressibility assumptions. The linear elastic region provides a useful basis for correlating the elastic modulus with plasticizer content. This work demonstrates an empirical relationship through power scaling law. The large liquid plasticizer content suggests PVC gels are nearly incompressible and can be treated as incompressible materials to simplify modeling. This assumption is subjected to validation; however, it was found to not apply to highly plasticized gels at small strains. The reason is explored with polymer network analysis.
2. Elastic and Hyperelastic Constitutive Equations
2.1. Consitutive Equations
An elastic material is an object that returns to its undeformed configuration when the load is removed. It is defined within a region of strain appropriately named the elastic region. Linear elastic materials have a linear stress-strain relationship, known as the elastic modulus in the elastic region. It represents the sensitivity of stress due to strain. A linear relationship also exists between strains along orthogonal axis. The Poisson’s ratio is the transverse strain by the axial strain or strain in the direction of loading. Poisson’s ratio is a dimensionless quantity that only exists within the elastic region.
Power scaling laws have been applied to PVC gels for storage modulus, shear modulus, and elastic modulus [30,31,32]. Walter showed the power law between elastic modulus and polymer volume concentration percentage in 1954 [23]. We continue evaluating this relationship between the elastic modulus and PVC volume concentration percentage . A linear relationship is obtained when using logarithmic conversions, allowing simple linear fitment. and are the elastic modulus of pure PVC and the power law exponential, respectively.
(2.a)
(2.b)
Hyperelastic models approach large deformations using Helmholtz free energy , a thermodynamic potential expressing strain energy as a function of stretch and temperature. In an isothermal application, strain energy is expressed as a function of the deformation gradient . To isolate deformation from rigid body motion, the deformation gradient is converted to right Cauchy-Green deformation tensor and further to the right stretch tensor . Isotropic and homogenous materials under uniaxial loading have a diagonalized deformation gradient representing stretch under principle directions. is axial stretch in the uniaxial loading.
Since deformation gradient is diagonalized, strain energy can simplify further to be a function of principle scalar invariants . The first invariant represents isochoric total shape change through elongation. The second scalar invariant is the sum of principle minor determinants, encapsulating shear deformation and distortional effects. The third scalar invariant describes changes to volume or volumetric stretch.
Assumptions can be made to correlate the axial and transverse stretches. Isotropic materials exhibit equivalent transverse stretches i.e. . Incompressible materials exhibit no changes to volume. This makes the , which is used in conjunction with equation 4c to formalize a direct relationship between transverse and axial stretches. We presently treat PVC gels as isotropic and incompressible materials, which is subject to validation with equation 5. It also reduces modified invariants to their standard form.
And applying into the principle scalar invariants:
where is axial stretch Cauchy or true stress is the derivative of strain energy with respect to the scalar invariants. i.e. The hyperelastic equations are expressed in incompressibility strain energy form and converted to Cauchy stress in terms of axial stretch ratio using equation 6a through 6c. This allows direct measurements to be used in fitment.
The Neo-Hookean model (equation 7) is a simple hyperelastic model derived from statistical mechanics of Gaussian chains. It uses the shear modulus and bulk modulus , if the material is compressible [33,34]. The linearity of the first invariant limits this model for large deformations and is preferentially used in small strain measurements. The lack of the second invariant tends to underpredict strain energy and therefore stress. The shear and bulk modulus can be determined prior to the model’s use, making it easier to implement.
The Mooney-Rivlin model (equation 8) improves on the Neo-Hookean model by incorporating a linear dependance of the second invariant. Since both invariants are linear, this model may not capture higher deformations with high accuracy. The model fits stress-strain data to get the coefficient. These parameters balance the contributions of the first and second invariant [33,34]. The issue lies in the second coefficient which can be negative, leading to instabilities in FEM if the loading is different from the testing load mode [34].
The Yeoh model (equation 9) is a third order polynomial that depends on higher orders of the first invariant while ignoring the second invariant. It uses parameters and as smoothening factors for scaling. Unlike the previous two models, the Yeoh model tends to accurately capture large deformations due to its nonlinearities. The lack of means distortional deformations are not accounted and can potentially fail to accurately describe large shear and biaxial behaviors [33,34]. Modern modifications like the Power-Yeoh model can be used if the fitment is insufficient [35] but Yeoh model tends to fit well across uniaxial, biaxial, and pure shear.
The Gent model (equation 10) is a simple hyperelastic model built on the Neo-Hookean model to incorporate strain hardening effects. It does so by including a non-dimensional parameter which limits chain extensibility in a uniform network under large deformation and making this model effective at capturing sharp stress inflections [36]. The Gent model also places more emphasis on the first invariant’s influence and uses shear modulus [33,34]. There is still no second invariant so distortional deformation may not be accurately described, but the first invariant is now non-linear.
The Ogden model (equation 11) is a popular highly flexible hyperelastic model. It uses stretch ratios directly rather than principle scalar invariants. Because of this, the model cannot be constrained by the isotropic and incompressibility assumptions listed in equation 5 and implemented in scalar invariants as in equation 6. The Odgen models uses shear modulus terms with a dimensionless exponential that controls stiffening along the uniaxial stretch direction. The high non-linearity of the model with only uniaxial testing data makes it prone to parameter non-uniqueness. Many different parameter values can reproduce the same uniaxial response that may fail to describe biaxial and shear loadings. The best fit for only uniaxial data should be used with caution until another testing mode can verify if the parameters are valid.
The extended tube model (equation 12) is one of the most physically realistic hyperelastic models based on statistical micro-mechanism models. It considers the cross-linking of the network, confining tube constraints, and volumetric deformations, creating a comprehensive model based around the molecular chains and their interactions. It is highly non-linear but uses higher orders of the first scalar invariant. The extended tube model uses four parameters: is the cross-linking contribution; is the constraint contribution; represents chain or tube constraints; represents the rearrangement of crosslinks upon deformation [37]. Like the Ogden model, fitting with uniaxial data does not provide unique parameters. Different parameter combinations can reproduce the same uniaxial response.
Engineering stress, or First Piola-Kirchhoff stress , is measured in the experiment. It uses the undeformed area; however large deformations have significant effects on area. First Piola-Kirchhoff stress is related to Cauchy stress with the Jacobian and deformation gradient F. The assumptions outlined in equation 5 simplify the conversion so Cauchy stress is the First Piola-Kirchhoff stress scaled by axial stretch in equation 3.
2.2. Determination of Hyperelastic Material Parameters
Hyperelastic models, such as Neo-Hookean and Gent, use parameters attributed to mechanical properties. Many others have parameters that are more abstract, being used as smoothening or scaling factors. It is difficult to justify the interpretation of each model’s parameter when attempting to fit the optimal solution and tensile hyperelastic models for PVC-DBA gels have yet to be established in literature. To facilitate optimal parameters during fitment, the genetic algorithm is employed with the Levenberg–Marquardt algorithm. The genetic algorithm uses a random selection of parameters to analyze fitment against an objective function. The process is evolutionary with the best parameters of each iteration influencing the next generation. It is used to establish an initial guess for the Levenberg–Marquardt (LM) algorithm which is a damped least-squares algorithm popularly employed in nonlinear fitting. This algorithm is influenced by its initial guess and can converge on a local minimum or suboptimal parameters. To minimize this, the genetic algorithm is performed five times with the normalized-root-mean-squares as the objective function and a population size of 500. The average value for each parameter is passed to the LM algorithm as the initial guess. 5 data sets were used in the parameter fitment.
3. Materials and Methods
3.1. EPIC Actuator
The EPIC uses a rigid frame consisting of an acrylic substrate and resin printed cover plate. These are the bottoms and tops, respectively. They seal the PVC gel to encapsulate the dielectric fluid with the bottom substrate. An annular copper electrode fixed to the acrylic functions as the anode. The cover print incorporates a round opening to allow out-of-plane deformation during activation and integrated threads to secure the acrylic bottom plate. Figure 1 shows the actuator components and fully assembled.
The PVC gel is first fixed into the frame. A dedicated injection port, integrated in the acrylic bottom plate, enables precise controlled dielectric fluid filling. Carbon grease applied to the gel surface directly above the anode serves as the cathode. During actuation, anodophilic attraction zips the gel along the anode inwardly. It results in spherical deformation at the center of the round opening in the cover plate. Varying the voltage controls the magnitude of deformation.
3.2. Material Preparation of PVC Gel Samples
Polyvinyl chloride (PVC) resin, with a weight-average molecular weight = 233,000 and a number-average molecular weight = 99,000 , was used without further purification. The resin was dissolved in a mixed solvent system consisting of dibutyl adipate (DBA) and tetrahydrofuran (THF) and stirred for 24 h at 60. The solvent-to-polymer ratio used was 30 mL THF per gram of PVC. All materials were sourced from Sigma-Aldrich Co. PVC gels were prepared with various plasticizer-to-resin weight ratios denoted as PX where X represents the parts by weight of DBA per part PVC. Samples designated P2, P4, P6, and P8 correspond to DBA-to-PVC weight ratios of 2:1, 4:1, 6:1, and 8:1, respectively. Gels were cast in a loosely covered flat bottomed glass dish, curing at 22 for three weeks. Thickness across casts ranged from 2-3.75 mm.
3.3. Tensile Testing
Quasi-static tensile testing was performed on an Instron 5565 Tensile Tester with a permanently attached camera system to measure strain. The setup is depicted in Figure 2. The Instron was installed with a 100 N load cell, accurate to 10 mN, and set to a monotonic displacement rate of 1 PVC gels were attached with custom fixtures made of Form Labs BioMed Amber resin. An integrated mechanical stop compressed the gels to 50 microns to prevent bursting. Mimicking ASTM D638, gels were cut into type-4 dog bones with a gauge length shortened by 8 mm. Strain was measured using a camera system with digital image processing. The shorter gauge length allowed the camera to be closer to the specimen, providing higher pixel-spatial resolution and shortening test time. The camera system included a raspberry pi 4 attached with the Pi HD 12.3 MP senor at 4k resolution and Theia SL410m lens. It was programmed with an ISO of 1 to reduce noise and 31 exposure time to limit motion blur. The aperture was adjusted based on the lighting conditions within the lab space. Once aligned within of the Instron’s centerline and the zoon set, the camera was geometrically calibrated. Data was sampled at 1 Hz.
Strain was measured through digital image processing tracking blue sharpie marks on the gel surface as shown in Figure 3. Markers were placed with a position template. Two marks 20 mm apart along the specimen’s centerline were used for axial strain measurements. Two more marks placed 6 mm apart along the midline were used for transverse strain measurements. The marks were between 1 – 2.5 in diameter.
Thickness is the average of the four sharpie marks measured with Epsilon 1401-10 laser displacement sensor. Mitutoyo digital calipers measured the width.
4. Results and Discussion
4.1. Elastic Modeling
PVC gels are linearly elastic materials up to 25% strain under quasi-static conditions. Linear regression in this region attains coefficient of determinations above 0.966, which indicates high agreeability. Beyond 25% strain, gels show an upward stress inflection, indicating the beginning of strain hardening and thus establishing the limits of the linear elastic region. Figure 4 shows stress-strain data for P2, P4, P6, and P8 gels using 5 datasets each. Table 1 lists the average elastic modulus for each plasticizer’s content. The elastic modulus is inversely proportional to plasticizer content, decreasing with increased plasticizer. These results and their magnitudes are consistent with Ali et al. [38] for PVC-DBA gels who performed elasticity measurements for P1, P2, P3, P5, P7, and P9 gels. A gel that’s loaded or strained can use equation 1 to find its conjugated strain or stress once steady-state conditions have been met. As previously mentioned, linear elasticity does not consider viscoelastic time dependance, which is expected given the gel bulk is majority liquid plasticizer. Further studies on stress relaxation modulus and relaxation times will establish a time frame to which linear elasticity is valid.
The increasing modulus as the plasticizer content decreasing can be explained with the molecular structure of the gels. Many studies suggest polymer chain segments connect to physical crosslinks, creating a network spanning throughout the bulk that provides structure and rigidity to the gel [39,40,41]. The chains are coiled and entanglements in the amorphous regions promote interactions with crosslinks [39,42]. Deformation pulls the chain segments from their coiled configuration which act with entanglements and crosslinks in a restorative capacity. Gels with higher polymer concentrations readily entangle due to the smaller molecular spacing between chains. The sequence length is also shorted between crosslinks. The higher entanglement density reenforces the reactionary mechanical behavior by allowing minimal chain extension in conjunction with enhancing junction site interactions. Decreasing polymer concentration by increasing plasticizer content increases molecular separation. The network becomes connected by fewer, longer chain sequences so less chains are capable of entangling, and the crosslinks are spatially further apart. The combination of fewer chains with less entanglement lowers the modulus as seen in the P8 gel.
A correlation between the modulus and gel composition can be described by power law. The elastic modulus versus PVC volume concentration percentage yields a linear relationship in log space with Figure 5a showing fitting result. This relationship using the equation 2a is particularly useful because the elastic modulus of pure PVC can be readily determined. The calculated modulus of 11.84 MPa is close to 14 MPa in the previous study by Gent et al. [30] using a similar strain rate of 0.2%. As the polymer volume concentration approaches zero, the modulus vanishes since the polymer network provides the mechanical response characterized by the elastic modulus.
Using the power law provides an empirical relationship between material properties and polymer concentration. Li and Aoki have thoroughly applied power law to equasi-equiliibirum modulus and distance from the gel point (relative distance ) [43,44,45,46,47]. Through percolation theory, they’ve suggested the strength of the gel is governed by network sequence length and the networks are similar as PVC concentration changes post gellation. From their work, we extrapolate the nature of of the linear slope as a description of the similar network structure in PVC-DBA gels; however, this only applies to PVC-DBA gels as solvent-polymer interactions and bonds affects the formation and alters structure.
PVC gels are typically characterized by their plasticizer weight ratio rather than by the PVC volume concentration. For convenience, the power-law relationship was applied using the plasticizer weight ratio to determine the corresponding elastic modulus (equation 14). As with the previous case, curve fitting revealed an additional linear trend as shown in Figure 5b. From any DBA-to-PVC plasticizer weight ratio the elastic modulus can be determined.
It should be noted that this modulus vs. plasticizer weight ratio should only be used within the fitment range. Low weight ratios like P0 approaches infinity due to the negative exponential but higher ratios such as P1000 approach zero. This alternative formulation does not explicitly relate to the polymer network, but it is particularly useful for estimating the elastic modulus within the range of P2 to P8 weight ratios, providing guidance for tailoring mechanical properties of PVC gels in tensile applications.
Figure 6 presents transverse and axial strain data for 5 data sets of P2, P4, P6 and P8 gels in the established linear elastic region. Poisson’s ratio is the linear slope in this figure. Transverse strain data tended to a constant value, creating horizontal groupings. This is due to the camera resolution being insufficient to capture transverse deformation. The camera system was tailored to measure axial strain up to 400. It used 2x zoom to limit the effects of geometric calibration. This led to a wide FOV with a spatial-pixel resolution of 47.2 . Changes in transverse strain were too small to be precisely recorded with this camera system. Despite this, all gels had decent linear fitments, if considering the transverse strain data is discretized, with the lowest coefficient of determination being 0.908. An immediate trend can be observed with respect to the plasticizer content. The P2 and P4 gels had nearly the same slopes with a Poisson’s ratio of 0.42 and 0.43 but decreased with the P6 and further with the P8 to 0.37 and 0.34, respectively.
Poisson’s ratio for each gel is summarized in Table 2. The variability of Poisson’s ratio with plasticizer content was unexpected. It was believed that PVC gels are nearly incompressible materials so Poisson’s ratio would be closer to 0.49 and independent of plasticizer content as the networks were strong and interconnected. The deviation is believed to be intrinsic material behavior due to plasticizer content.
PVC gels get their structure from the polymer chains that span the gel. Physical crosslinks attach chains and entanglements in the amorphous regions promote interactions between crosslinks and network. As plasticizer content increases, the polymer concentration decreases. This leads to fewer crosslinks, a decrease in entanglement density, and longer connective chains. During axial deformation, chains more readily slip in the entanglements and require more elongation before becoming influential to the surrounding crosslinks. P6 and P8 have lower transverse strains, and therefore Poisson’s ratios, because the molecular motion and elongation do not generate large transverse deformations like in the lower plasticized gels. P2 and P4 gels have tight networks that are highly interconnected by entanglements. They’re less prone to slippage and chain elongation so the network has a larger transverse response. These conclusions can be supported by analyzing isotropic and incompressibility from the continuum mechanics approach (equation 5) with further validation using large strain stress measurements in Figure 8.
Figure 7 shows experimental transverse stretch plotted against axial stretch and compared to theoretical transverse stretch predictions in isotropic and incompressible materials using equation 5. All the gels had coefficient of determination above 0.945, which indicates high agreeability with theoretical predictions. Transverse stretches appear discretized due to the camera resolution being insufficient as explained in the Poisson’s ratio section. A P6 and P8 gel dataset showed odd deviation due to lighting changes later in the experiments. Efforts were made to minimize the deviation.
The high agreeability in Figure 7 implies PVC gels can be treated as isotropic and incompressible; however, the P6 and P8 data are not as evenly dispersed. They have smaller transverse stretches for the same axial stretch which is apparent from the data sitting above the theoretical curve. Interestingly, the experimental data of both follows the theoretical prediction albeit with an offset and the P8 is more offset than the P6. These observations are consistent with the P6 and P8 gels having smaller Poisson’s ratios.
The P8 has the lowest polymer concentration. This extends to also having the lowest entanglement density and longest network chains. At small deformations the chains predominately slip in the entanglements and uncoil. The expanded network in conjunction with weakly interconnected crosslinks through entanglements has an overall reduction in network response so transverse deformation is small. This is the offset that is seen in Figure 7. Larger deformations pull the chains taut which have also stopped slipping, making the network response stronger. As a result, the P6 and P8 gels follow the theoretical curve although offset. As PVC concentration increases, higher entanglement densities with shorter chain sequences strengthen the network response further. Poisson’s ratio doesn’t satisfy nearly incompressible conditions i.e. at low strains because the network chains are stretching and slipping which reduces the mechanical response behavior. Gels follow isotropic and incompressible predictions at large strains because chain stretching and slipping has ceased, which reenforces the mechanical response. This can be validated when showing strain hardening in Figure 8.
While the stress-strain curves of the gels show linearity in small strain range as shown in Figure 4, they exhibit nonlinear mechanical behaviors at large strains as shown in Figure 8a. Nonlinear behavior is a result of strain hardening, the point at which chains have reached finite extensibility so the response is dominated by entanglements and crosslinks resisting unravelment, and strain softening, the points where they being unraveling. By strain hardening, many chains are aligned and uncoiled, producing a characteristic increase in stress response. After sufficient deformation, there stress response decreases, indicating chain separation from entanglements or ruptured crosslinks.
Strain hardening occurs in P2 gels around 30% strain. This is seen in Figure 8b where the change in modulus begins to increase. It occurs later in P4, P6, and P8 gels around 40%, 60% and 110% strain, respectively. At the same time, the strain hardening regime is longer with smaller modulus change. This suggests the network chains in the P2 are much shorter and slip minimally. The network is more responsive from the interconnectedness of the entanglements so the mechanical response in the strain hardening regime is a change in modulus around 1500 Pa. As plasticizer content increases, the entanglements weaken due to slippage and chains need more elongation before having the same influence. The overall network response is ultimately reduced, which is apparent in the P8 gel. This gel had a modulus change of around 300 Pa which indicates a lack of interconnectedness. This, with the isotropic and incompressible assumptions, justify the reasonings behind the decrease in elastic modulus and Poisson’s ratio with increasing plasticizer content. It stems from entanglement interactions which depend on the polymer concentration. Gels with high polymer concentrations have strong networks with higher entanglement densities, low slippage, and small network links. This makes the material more responsive through its interconnectedness. Decreasing the polymer concentration reduces the network strength and interconnectedness, so it has a weaker mechanical behavior.
4.2. Hyperelastic Modeling
Figure 9 shows true stress-stretch relationship for 5 datasets of each plasticizer content. The change to stretch comes from hyperelastic models being derived in terms of stretch. True stress is calculated using equation 13. Due to data point overlap, every 25th data point was plotted but the full datasets were used in the fitment. Gels were stretched until failure which occurred around 3.5 – 4 stretches for most samples. As the EPIC is not expected to stretch PVC gels beyond 3.5 stretch (250% strain), this was the upper stretch limit for fitting. That also helps motivate fitment in simpler models with preference to lower stretch regimes.
Figure 10 shows the optimal fitments for each hyperelastic model listed in section 2.1. These are among the most popular models and have yet to be evaluated for PVC-DBA gels up to 3.5 stretch. Simpler models like Neo-Hookean, Mooney Rivlin, and Gent did not fit well with P4, P6, and P8 gels. These models were sufficient for P2 gels which behave most like a Gaussian chain network. The fitments didn’t accurately follow experimental data throughout the full deformation range or only described a small data segment due to their linear dependance on the first invariance. The Yeoh, Ogden, and extended tube models performed well for all gels. The universality of each comes from higher order dependance of the invariants or the approach taken for their derivation.
The Neo-Hookean model has a linear dependence on the first invariant for its strain energy function as stated in equation 7. This prevents it from capturing strain hardening and softening at large deformations for the P4, P6, and P8 gels. It is derived from statical mechanics of Gaussian chains, which does not account for entanglement slippage and assumes chain lengths are fixed. P2 gels are closest to Gaussian chains; hence, the model fits well.
The Mooney-Rivlin model in equation 8 follows suite in linearity for the first and second invariant in its strain energy function. It too is unable to capture strain stiffening for P4, P6, and P8 gels. During fitment, the genetic algorithm favored data after hardening so small stretch data was grossly underpredicted. As a result, the second coefficient was made negative which led to predicting compressive stress response.
For each gel, the Yeoh model provides good fitment indicated by high coefficient of determination and the fitted curve following experimental data throughout stretching region. It does so by the higher-order first invariant in the energy function as shown in equation 9. Because of this, distortional deformations are not accounted and may potentially fail to encompass the shear and biaxial behaviors. It can extrapolate poorly outside the fitted stretch range due to polynomial scaling. The P2 gel showed slight downwards curve at the end of the fitted curve but fully follows the experimental data.
The Gent model fit well for the P2 gel, but its curve didn’t accurately follow the experimental data. It uses the natural logarithm of first invariant (equation 10) and a parameter to limit chain extensibility [36]. It assumes a uniform network with finite extensibility whereas the P4, P6 and P8 gels have more chain mobility through slippage and weaker junction sites. This is not featured in the locking parameter. As a result, the model appreciably follows the experimental data as shown in Figure 10. and concludes with a visible upwards inflection at large stretches.
The Ogden model and extended tube models fit the experimental data extremely well. They consistently achieved the best coefficient of determinations for each gel and followed the experimental data extremely well. These models are derived differently from the others, using direct stretch ratios and statistical micro-mechanism theory, respective. Despite this, these models are the least acceptable outside uniaxial data and require additional testing. Each model is highly non-linear with 6 and 4 parameters respectively. The optimal parameters for each model and plasticizer content changed dramatically across several fitment iterations. For example, it is expected to have variable exponential signs in the Ogden model to account for strain hardening and softening. In a few convergences, they were all positive with a single negative shear term. The extended tube model followed suite with the tube constraint parameter being negative or zero and the crosslink rearrangement parameter being higher in P2 gels rather than the P8. This is a consequence of parameter non-uniqueness. Additional data in biaxial or shear is needed to facilitate accurate distortion modeling.
Of the models, the Yeoh model is proposed for use in describing the hyperelastic mechanical behavior in PVC gels. The higher order dependance on the first invariant is sufficient to describe axial deformation through stretches up to 3.5. It may suffer when applied to shearing; however, the EPIC uses PVC gels around 0.5 mm thick. This allows thin elastic shell assumptions when considering the mechanical analysis during actuation. In addition, this model does not suffer from non-uniqueness as in the Ogden and extended tube models while maintaining simplicity. This latter point helps in solution convergence for multiphysics modeling. The parameters for the Yeoh model are listed in Table 3 for each gel with the corresponding coefficient of determination.
5. Conclusion
In present study, tensile mechanical properties of PVC gels with various DBA contents are analyzed. The elastic modulus and Poisson’s ratio were found within a linear elastic region that exists up to 25% strain. It’s believed that both are influenced by the intermolecular connectiveness of the network which changes with plasticizer content. Low plasticizer contents allow tight networks with many entanglements that limit chain slippage. This results in an immediate influence on surrounding chains for a larger stress response and transverse strain. Increasing plasticizer content promotes a weakly connected network which reduces the elastic modulus and Poisson’s ratio. A relationship between plasticizer content and elastic modulus was determined through power scaling law. It is believed that P2 and P4 gels can be treated as isotropic and incompressible materials with minor errors at small deformations. Nearly incompressible doesn’t accurately describe P6 and P8 since their weakly interconnected networks produces a delay in transverse deformation. This stems from weakened network response in low strains due to molecular interactions such as slippage and longer chain extensibility in a weakly entangled network.
Through analyzing several hyperelastic models, with emphasis on determining ideal initial guesses using the genetic algorithm, the Yeoh model is suggested to be used in hyperelastic tensile applications. It can accurately capture strain hardening; however, it is lack of the second invariant may not adequately capture distortions. Together, these findings establish a constitutive basis for PVC gels with DBA plasticizer, incorporating small strain elasticity, large strain nonlinear behavior, and network analysis while providing suggestive insight into the network structure required for accurately modeling the EPIC.
Author Contributions
Conceptualization, J.A.F. and J.L.; software, J.A.F.; formal analysis, J.A.F.; investigation, J.A.F and J.L.; writing—original draft preparation, J.A.F.; writing—review and editing, J.L.; supervision, K.K. All authors have read and agreed to the published version of the manuscript.
Funding
This work was supported in part by the U.S. Department of Energy and the Savannah River National Laboratory under BSRA TOA #0000658475 and #800002034. We also acknowledge partial financial support from the Army Research Office under award number W911NF2310180.
Institutional Review Board Statement
Not applicable.
Data Availability Statement
The original contributions presented in this study are included in the article. Further inquiries can be directed at the corresponding author.
Conflicts of Interest
The authors declare no conflicts of interest.
Abbreviations
The following abbreviations are used in this manuscript:
| PVC | Polyvinyl chloride |
| PX | Plasticizer to PVC weight ratio (X:1) |
| DBA | Dibutyl adipate plasticizer |
| THF | Tetrahydrofuran |
| DEA | Dielectric elastomer actuator |
| EPIC | Electrohydraulic actuator powered by induced interfacial charges |
| HASEL | Hydraulically amplified self-healing electrostatic |
| DE | Dielectric |
| KAIST | Korea Advanced Institute of Science & Technology |
| BOPP | Biaxially oriented polypropylene |
| LM | Levenberg–Marquardt |
References
- M. Z. Uddin, M. Yamaguchi, M. Watanabe, H. Shirai, and T. Hirai, “Electrically induced creeping and bending deformation of plasticized poly(vinyl chloride),” Chem Lett, no. 4, 2001. [CrossRef]
- M. Z. Uddin, M. Watanabe, H. Shirai, and T. Hirai, “Effects of plasticizers on novel electromechanical actuations with different poly(vinyl chloride) gels,” J Polym Sci B Polym Phys, vol. 41, no. 18, 2003. [CrossRef]
- H. Xia, T. Ueki, and T. Hirai, “Electrical response and mechanical behavior of plasticized PVC actuators,” in Advanced Materials Research, 2009. [CrossRef]
- H. Xia and T. Hirai, “Space charge distribution and mechanical properties in plasticized PVC actuators,” in 2009 IEEE International Conference on Mechatronics and Automation, ICMA 2009, 2009. [CrossRef]
- Y. Li and M. Hashimoto, “PVC gel based artificial muscles: Characterizations and actuation modular constructions,” Sens Actuators A Phys, vol. 233, 2015. [CrossRef]
- Y. Li and M. Hashimoto, “PVC gel soft actuator-based wearable assist wear for hip joint support during walking,” Smart Mater Struct, vol. 26, no. 12, 2017. [CrossRef]
- Y. Li and M. Hashimoto, “Design and prototyping of a novel lightweight walking assist wear using PVC gel soft actuators,” Sens Actuators A Phys, vol. 239, 2016. [CrossRef]
- Y. Li, Y. Maeda, and M. Hashimoto, “Lightweight, Soft Variable Stiffness Gel Spats for Walking Assistance,” Int J Adv Robot Syst, vol. 12, no. 12, 2015. [CrossRef]
- M. Shibagaki, T. M. Shibagaki, T. Matsuki, M. Hashimoto, and T. Hirai, “Application of a contraction type PVC gel actuator to brakes,” in 2010 IEEE International Conference on Mechatronics and Automation, ICMA 2010, 2010. [CrossRef]
- M. Hashimoto, M. Shibagaki, and T. Hirai, “Development of a Negative Type Polymer Brake Using a Contraction Type PVC Gel Actuator,” Journal of the Robotics Society of Japan, vol. 29, no. 8, 2011. [CrossRef]
- Y. Li, B. Sun, T. Chen, B. Hu, M. Guo, and Y. Li, “Design and prototyping of a novel gripper using PVC gel soft actuators,” Jpn J Appl Phys, vol. 60, no. 8, 2021. [CrossRef]
- Z. Frank, Z. Z. Frank, Z. Olsen, T. Hwang, and K. J. Kim, “A multi-degree of freedom bending actuator based on a novel cylindrical polyvinyl chloride gel,” 2021. [CrossRef]
- M. Ali and T. Hirai, “Characteristics of the creep-induced bending deformation of a PVC gel actuator by an electric field,” J Mater Sci, vol. 46, no. 24, 2011. [CrossRef]
- H. Kim, J. Ma, M. Kim, J. Nam, and K.-U. Kyung, “High-Output Force Electrohydraulic Actuator Powered by Induced Interfacial Charges,” Advanced Intelligent Systems, vol. 3, no. 5, 2021. [CrossRef]
- S. Kirkman, P. Rothemund, E. Acome, and C. Keplinger, “Electromechanics of planar HASEL actuators,” Extreme Mech Lett, vol. 48, 2021, doi: 10.1016/j.eml.2021.101408. [CrossRef]
- X. Wang, S. K. Mitchell, E. H. Rumley, P. Rothemund, and C. Keplinger, “High-Strain Peano-HASEL Actuators,” Adv Funct Mater, vol. 30, no. 7, 2020. [CrossRef]
- N. Kellaris, V. G. Venkata, G. M. Smith, S. K. Mitchell, and C. Keplinger, “Peano-HASEL actuators: Muscle-mimetic, electrohydraulic transducers that linearly contract on activation,” Sci Robot, vol. 3, no. 14, 2018. [CrossRef]
- E. Acome et al., “Hydraulically amplified self-healing electrostatic actuators with muscle-like performance,” Science (1979), vol. 359, no. 6371, 2018. [CrossRef]
- J. Kang, S. Kim, and Y. Cha, “Multimodal motion of soft origami tripod using electrohydraulic actuator,” p. 1294809, May 2024. [CrossRef]
- Washington, J. Su, and K. J. Kim, “Actuation Behavior of Hydraulically Amplified Self-Healing Electrostatic (HASEL) Actuator via Dimensional Analysis,” Actuators, vol. 12, no. 5, 2023. [CrossRef]
- J. Faccinto, D. J. Faccinto, D. Fisher, A. Sennain, J. Neubauer, and K. J. Kim, “Electromechanical applications of PVC gels and EPIC actuators in varifocal lenses,” 2023. [CrossRef]
- P. Rothemund, N. Kellaris, and C. Keplinger, “How inhomogeneous zipping increases the force output of Peano-HASEL actuators,” Extreme Mech Lett, vol. 31, 2019. [CrossRef]
- T. Walter, “Elastic properties of polvinyl chloride gels,” Journal of Polymer Science, vol. 13, no. 69, 1954. [CrossRef]
- M. Yamano, N. M. Yamano, N. Ogawa, M. Hashimoto, M. Takasaki, and T. Hirai, “A contraction type soft actuator using poly vinyl chloride gel,” in 2008 IEEE International Conference on Robotics and Biomimetics, ROBIO 2008, 2009. [CrossRef]
- H. Xia and T. Hirai, “Electric-field-induced local layer structure in plasticized PVC actuator,” Journal of Physical Chemistry B, vol. 114, no. 33, 2010. [CrossRef]
- Z. Frank and K. J. Kim, “On the mechanism of performance improvement of electroactive polyvinyl chloride (PVC) gel actuators via conductive fillers,” Sci Rep, vol. 12, no. 1, 2022. [CrossRef]
- T. Hwang, Z. Frank, J. Neubauer, and K. J. Kim, “High-performance polyvinyl chloride gel artificial muscle actuator with graphene oxide and plasticizer,” Sci Rep, vol. 9, no. 1, Dec. 2019. [CrossRef]
- Y. Li, Y. Y. Li, Y. Tsuchiya, A. Suzuki, Y. Shirai, and M. Hashimoto, “Influence of the number of stacked layers on the performance of PVC gel actuators,” in IEEE/ASME International Conference on Advanced Intelligent Mechatronics, AIM, 2014. [CrossRef]
- Y. TSUCHIYA and M. HASHIMOTO, “Development of contraction type sheets using PVC gel,” The Proceedings of JSME annual Conference on Robotics and Mechatronics (Robomec), vol. 2015, no. 0, 2015. [CrossRef]
- N. Gent and N. Shimizu, “Elasticity, tear strength, and strength of adhesion of soft PVC gels,” J Appl Polym Sci, vol. 32, no. 6, 1986. [CrossRef]
- F. Gallego, M. E. Muñoz, J. J. Peña, and A. Santamaría, “Dynamic viscoelastic measurements of pvc gels,” Eur Polym J, vol. 24, no. 4, 1988. [CrossRef]
- D. López, C. Mijangos, M. E. Muñoz, and A. Santamaría, “Viscoelastic properties of thermoreversible gels from chemically modified PVCs,” Macromolecules, vol. 29, no. 22, 1996. [CrossRef]
- G. Youssef, “Hyperelastic behavior of polymers,” Applied Mechanics of Polymers, pp. 117–144, 2022. [CrossRef]
- J. Bergström, “Elasticity/Hyperelasticity,” Mechanics of Solid Polymers, pp. 209–307, 2015. [CrossRef]
- S. K. Bhat and A. Keerthan, “Power-Yeoh: A Yeoh-Type Hyperelastic Model with Invariant I2 for Rubber-like Materials,” Engineering Proceedings, vol. 59, no. 1, 2023. [CrossRef]
- G. Puglisi and G. Saccomandi, “The Gent model for rubber-like materials: An appraisal for an ingenious and simple idea,” Int J Non Linear Mech, vol. 68, 2015. [CrossRef]
- M. Kaliske and G. Heinrich, “An extended tube-model for rubber elasticity: Statistical-mechanical theory and finite element implementation,” Rubber Chemistry and Technology, vol. 72, no. 4, 1999. [CrossRef]
- M. Ali, T. Ueki, D. Tsurumi, and T. Hirai, “Influence of plasticizer content on the transition of electromechanical behavior of PVC gel actuator,” Langmuir, vol. 27, no. 12, pp. 7902–7908, Jun. 2011. [CrossRef]
- Y. C. Yang and P. H. Geil, “Morphology and Properties of PVC/Solvent Gels,” Journal of Macromolecular Science, Part B, vol. 22, no. 3, 1983. [CrossRef]
- Y. Bao, Z. Weng, Z. Huang, and Z. Pan, “The crystallinity of PVC and its effect on physical properties,” International Polymer Processing, vol. 11, no. 4, 1996. [CrossRef]
- M. Seki, S. Yamamoto, Y. Aoki, K. Takagi, Y. Izumi, and S. Nojima, “Small-angle x-ray scattering study of thermoreversible poly(vinyl chloride) gels,” J Polym Sci B Polym Phys, vol. 39, no. 20, 2001. [CrossRef]
- H. -K Boo and M. T. Shaw, “Gelation and interaction in plasticizer/PVC solutions,” Journal of Vinyl Technology, vol. 11, no. 4, 1989. [CrossRef]
- Y. Aoki, L. Li, H. Uchida, M. Kakiuchi, and H. Watanabe, “Rheological images of poly(vinyl chloride) gels. 5. Effect of molecular weight distribution,” Macromolecules, vol. 31, no. 21, 1998. [CrossRef]
- L. Li and Y. Aoki, “Rheological images of poly(vinyl chloride) gels. 3. Elasticity evolution and the scaling law beyond the sol-gel transition,” Macromolecules, vol. 31, no. 3, 1998. [CrossRef]
- Y. Aoki, L. Li, and M. Kakiuchi, “Rheological images of poly(vinyl chloride) Gels. 6. Effect of temperature,” Macromolecules, vol. 31, no. 23, 1998. [CrossRef]
- M. Kakiuchi, Y. Aoki, H. Watanabe, and K. Osaki, “Viscoelastic properties of poly(vinyl chloride) gels: Universality of gel elasticity,” Macromolecules, vol. 34, no. 9, 2001. [CrossRef]
- L. Li and Y. Aoki, “Rheological images of poly(vinyl chloride) gels. 1. The dependence of sol-gel transition on concentation,” Macromolecules, vol. 30, no. 25, 1997. [CrossRef]
Figure 1.
Figure 1. (a) A schematic diagram of the EPIC assembly and (b) an assembled EPIC ready for actuation.
Figure 1.
Figure 1. (a) A schematic diagram of the EPIC assembly and (b) an assembled EPIC ready for actuation.
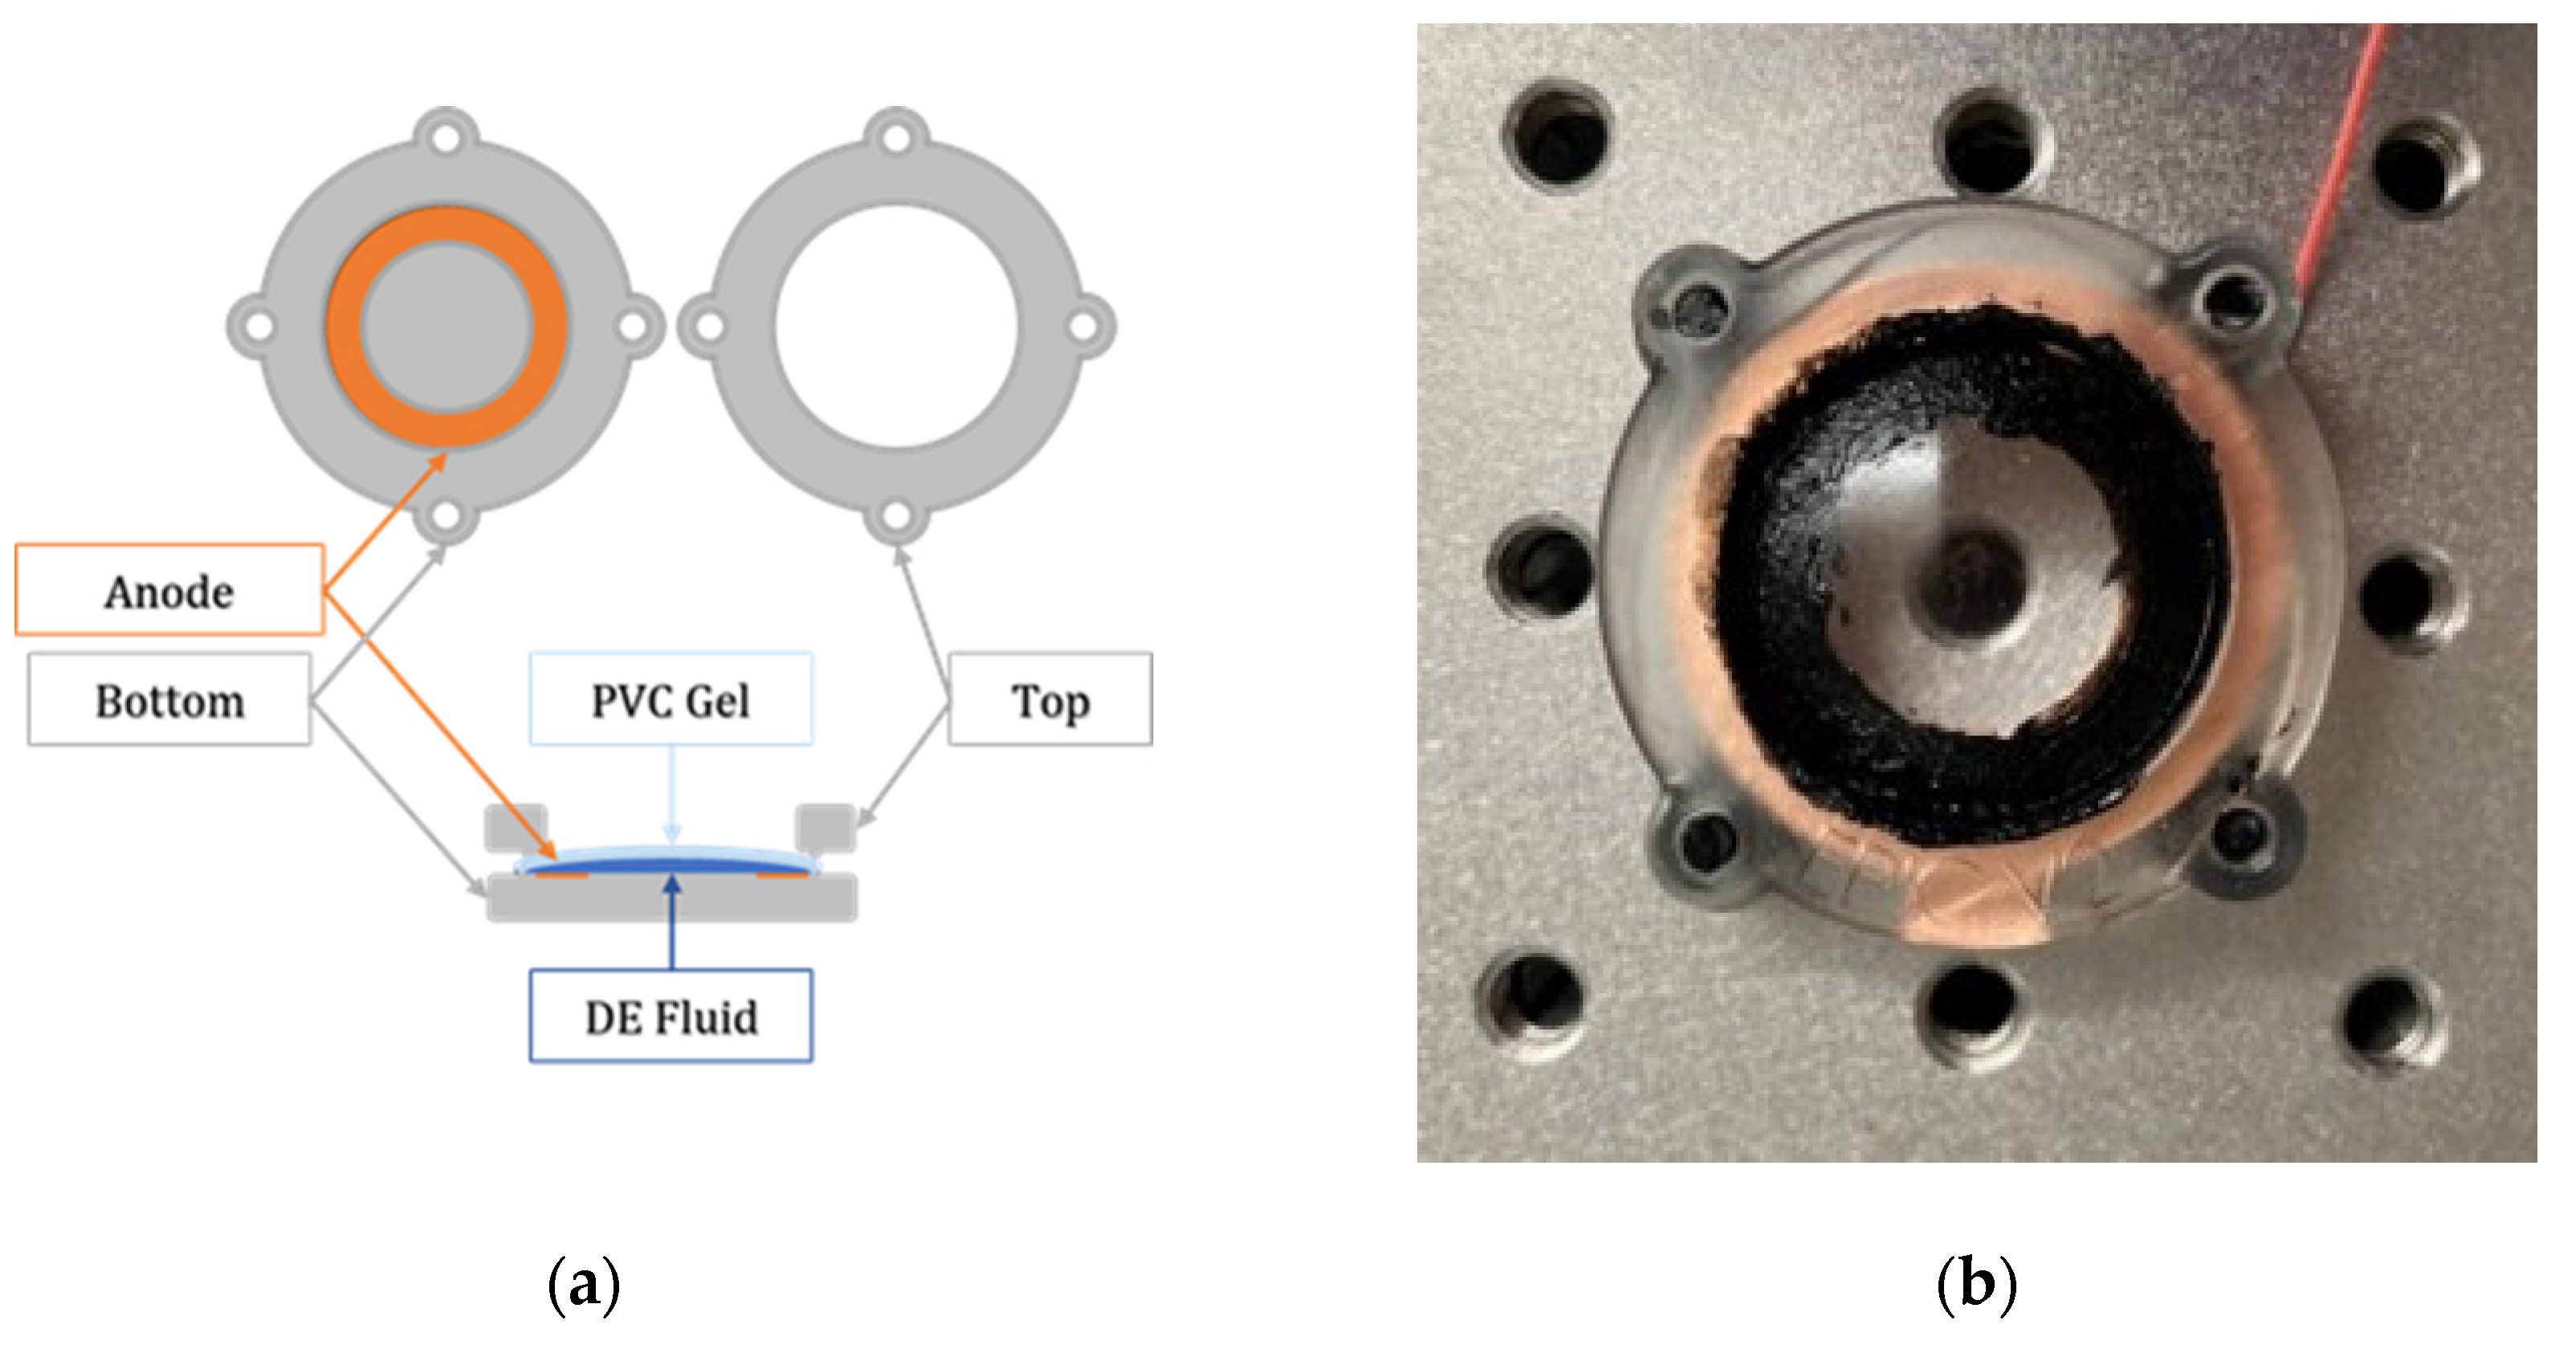
Figure 2.
Diagram of the Instron 5565 and raspberry pi camera setup.
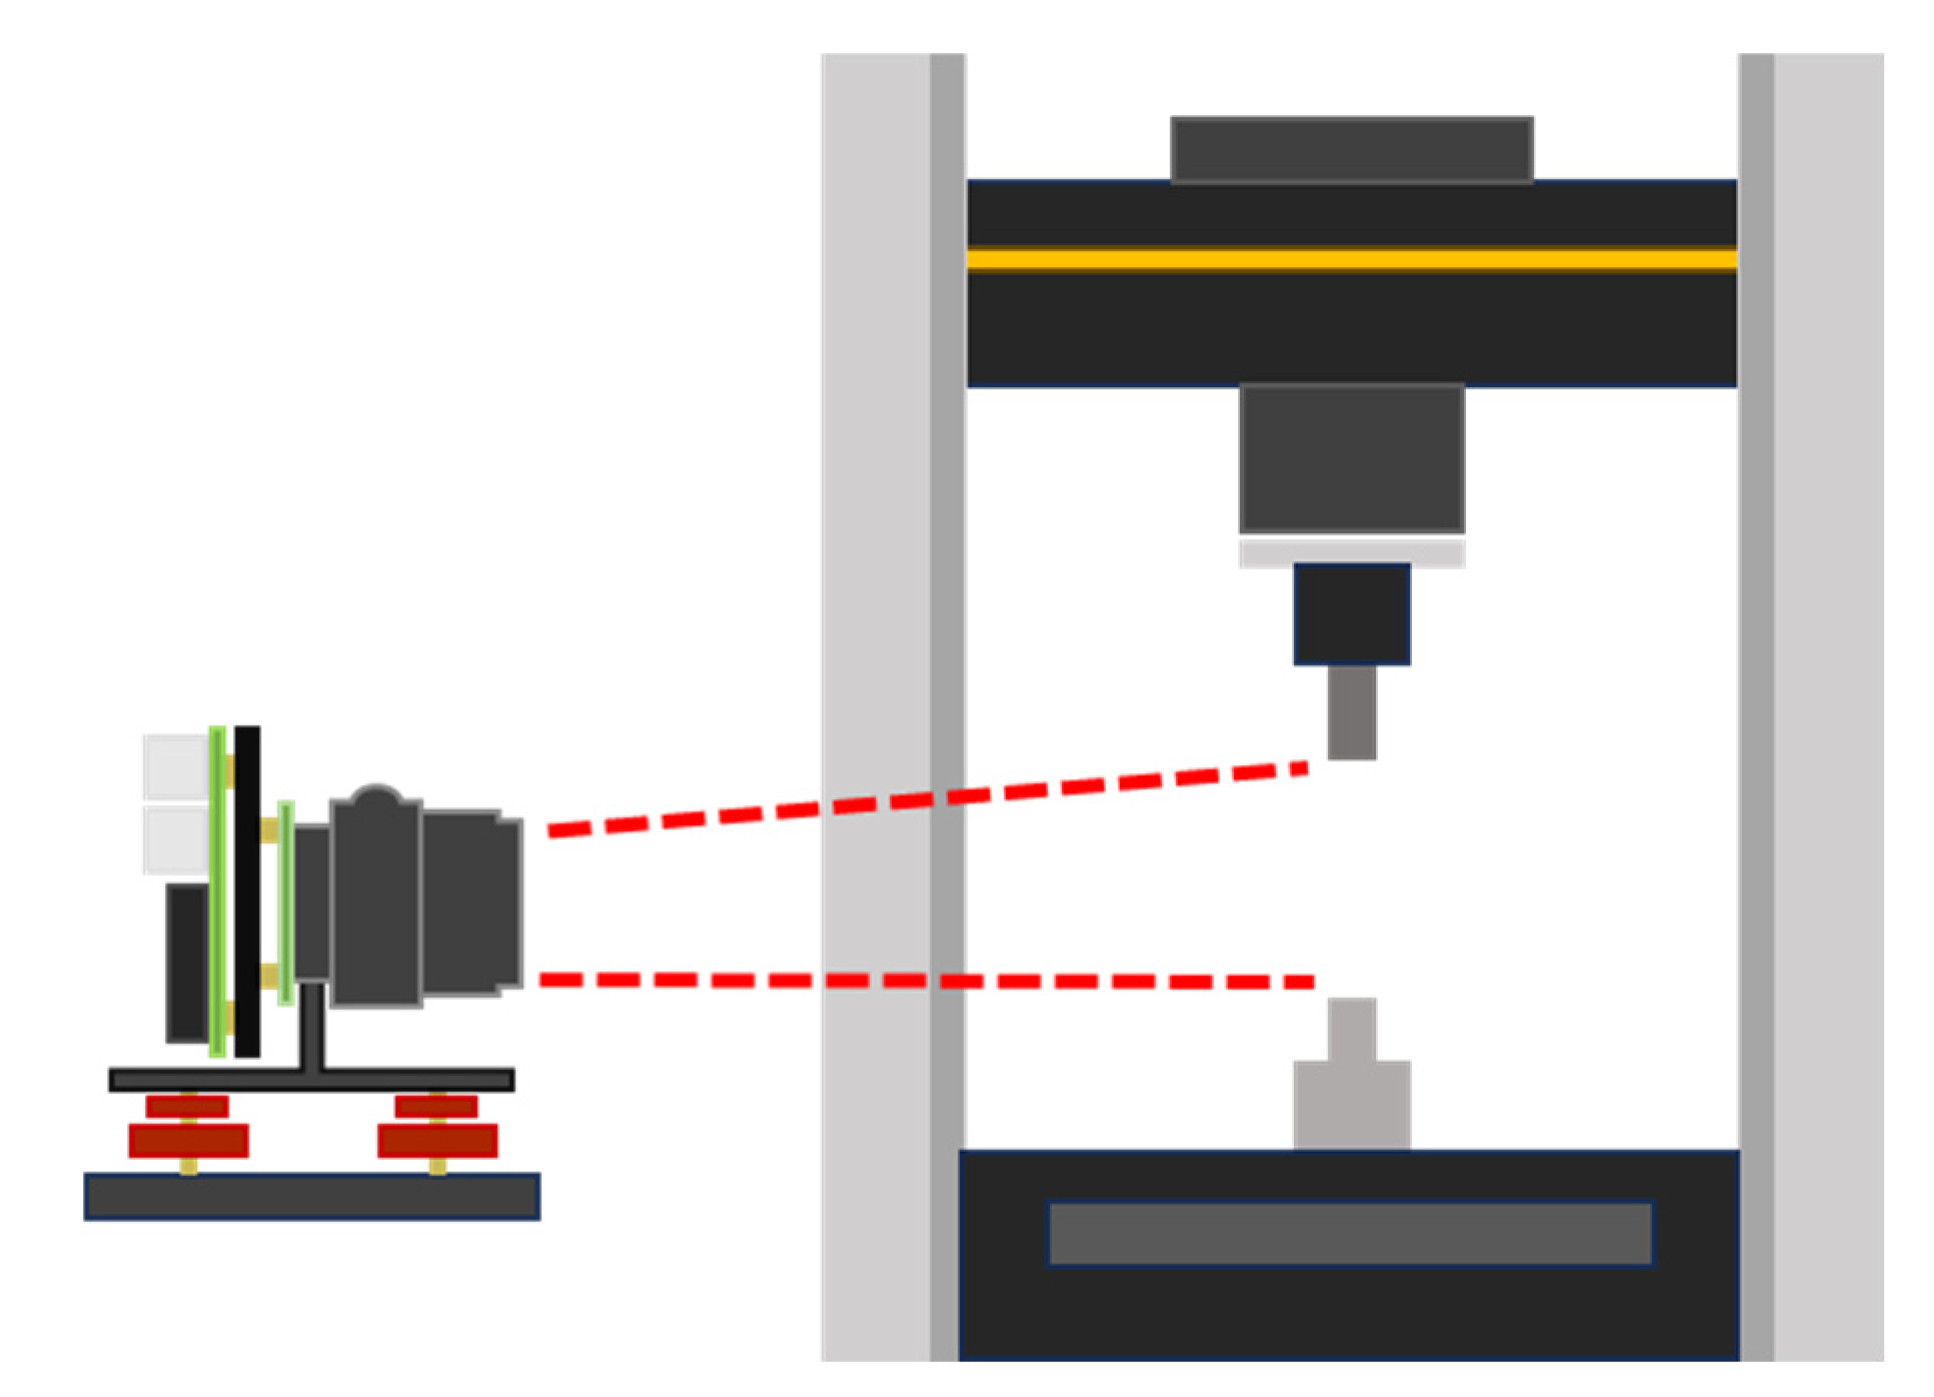
Figure 3.
P2 test 5 test image 156 showing the markers in the gauge length region.
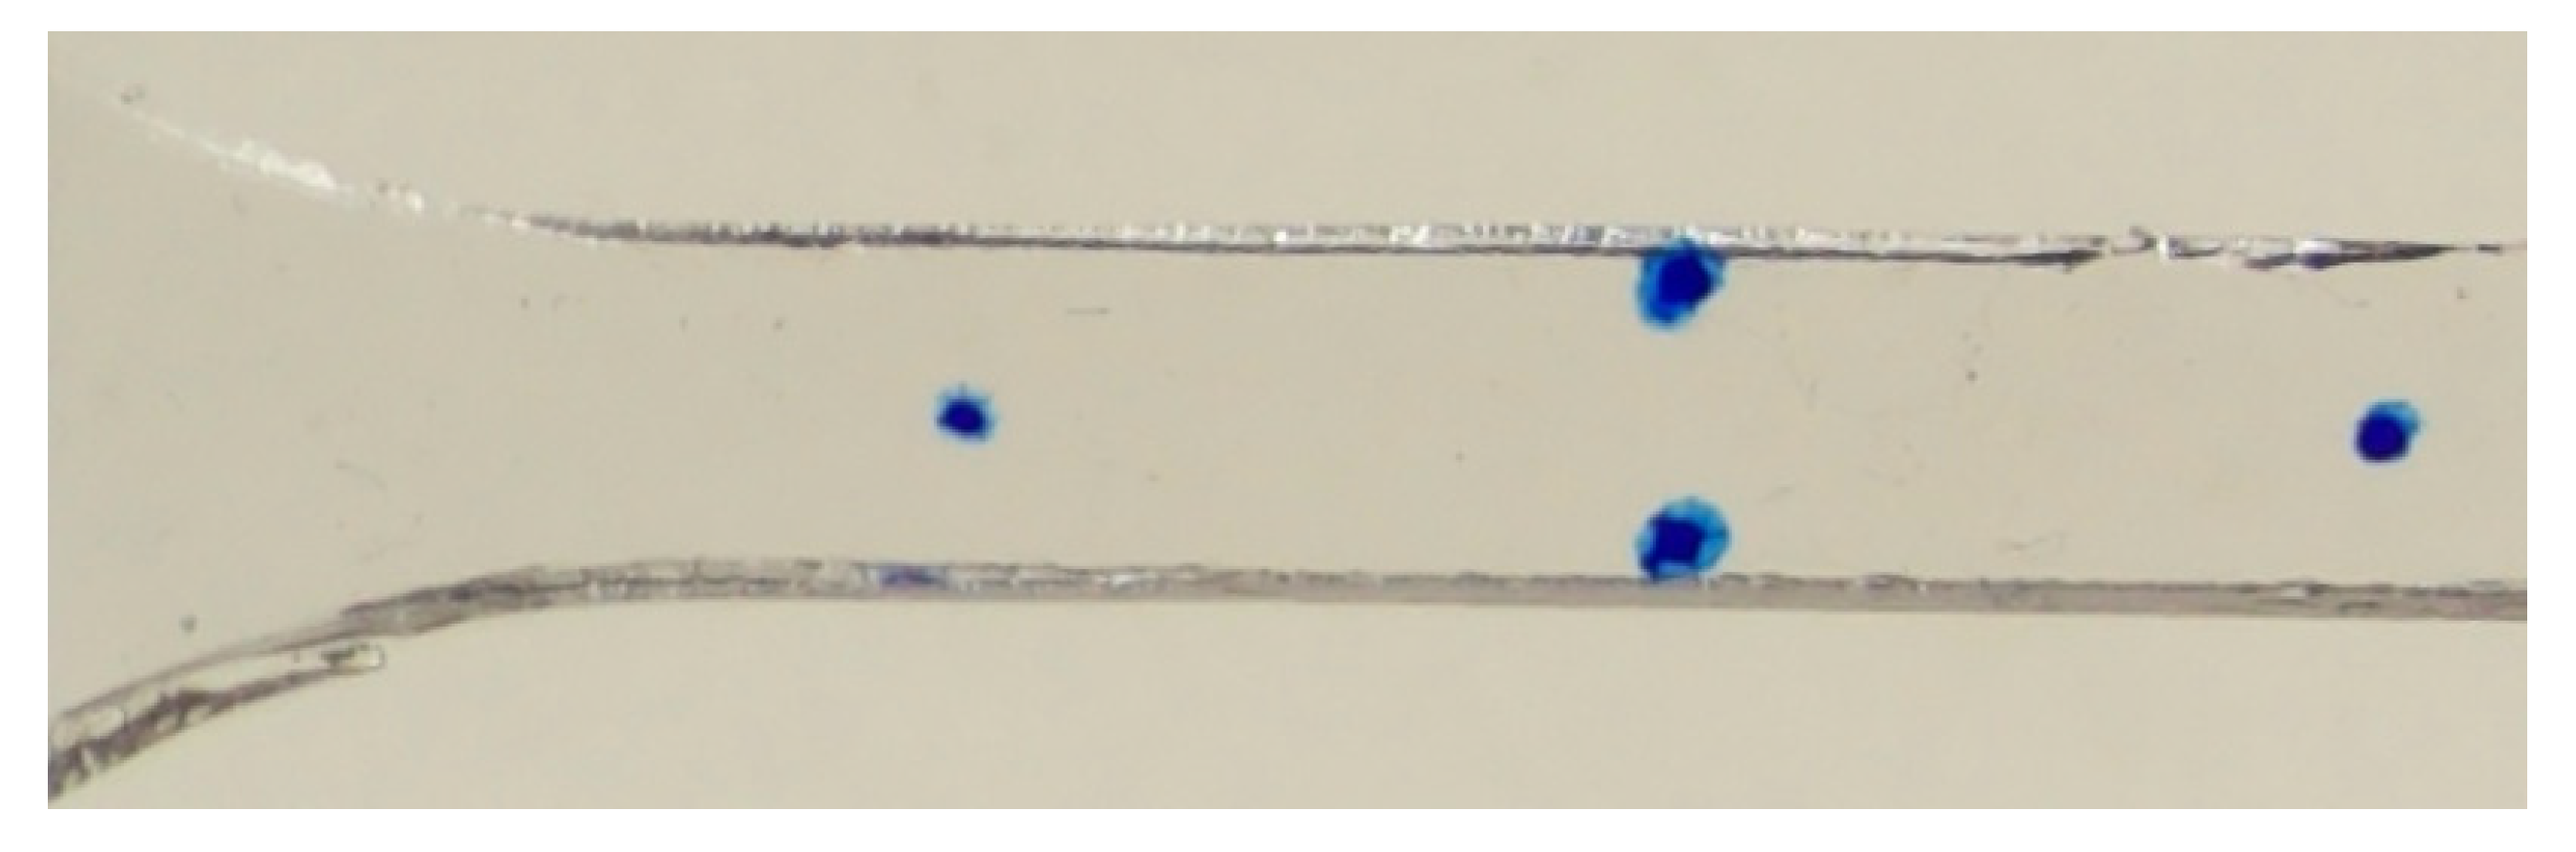
Figure 4.
PVC gel elastic modulus for various plasticizer contents.
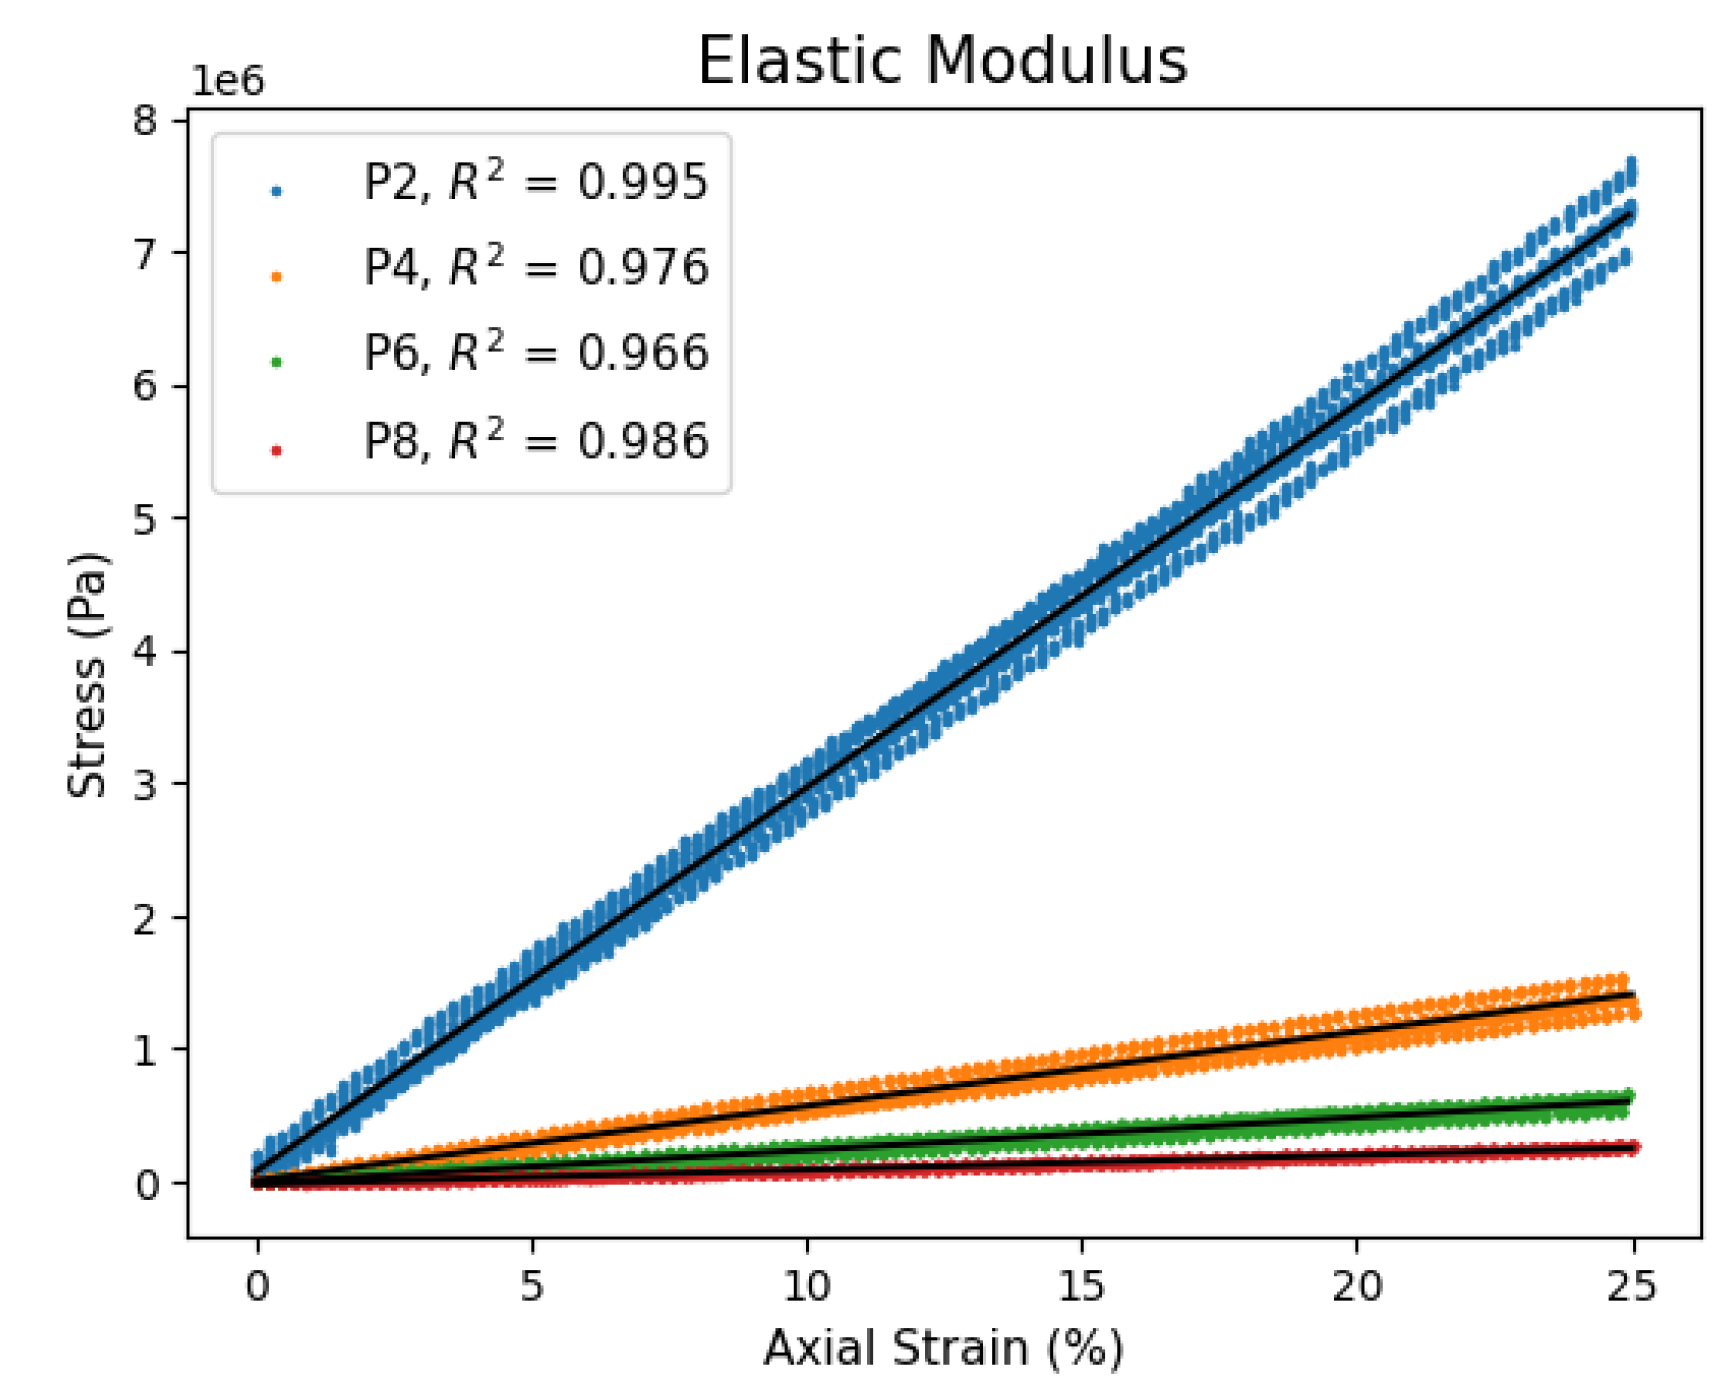
Figure 5.
Elastic modulus related to PVC volume fraction concentration (a) and plasticizer weight ratio (b).
Figure 5.
Elastic modulus related to PVC volume fraction concentration (a) and plasticizer weight ratio (b).
Figure 6.
PVC gel Poisson’s ratio for various plasticizer contents. .
Figure 7.
Validation of isotropic incompressibility conditions.
Figure 8.
Figure 8. (a) Engineering stress-strain for all plasticizer contents and (b) modulus comparison showing the change in strain hardening.
Figure 8.
Figure 8. (a) Engineering stress-strain for all plasticizer contents and (b) modulus comparison showing the change in strain hardening.
Figure 9.
True stress-stretch relationship for each plasticizer content.
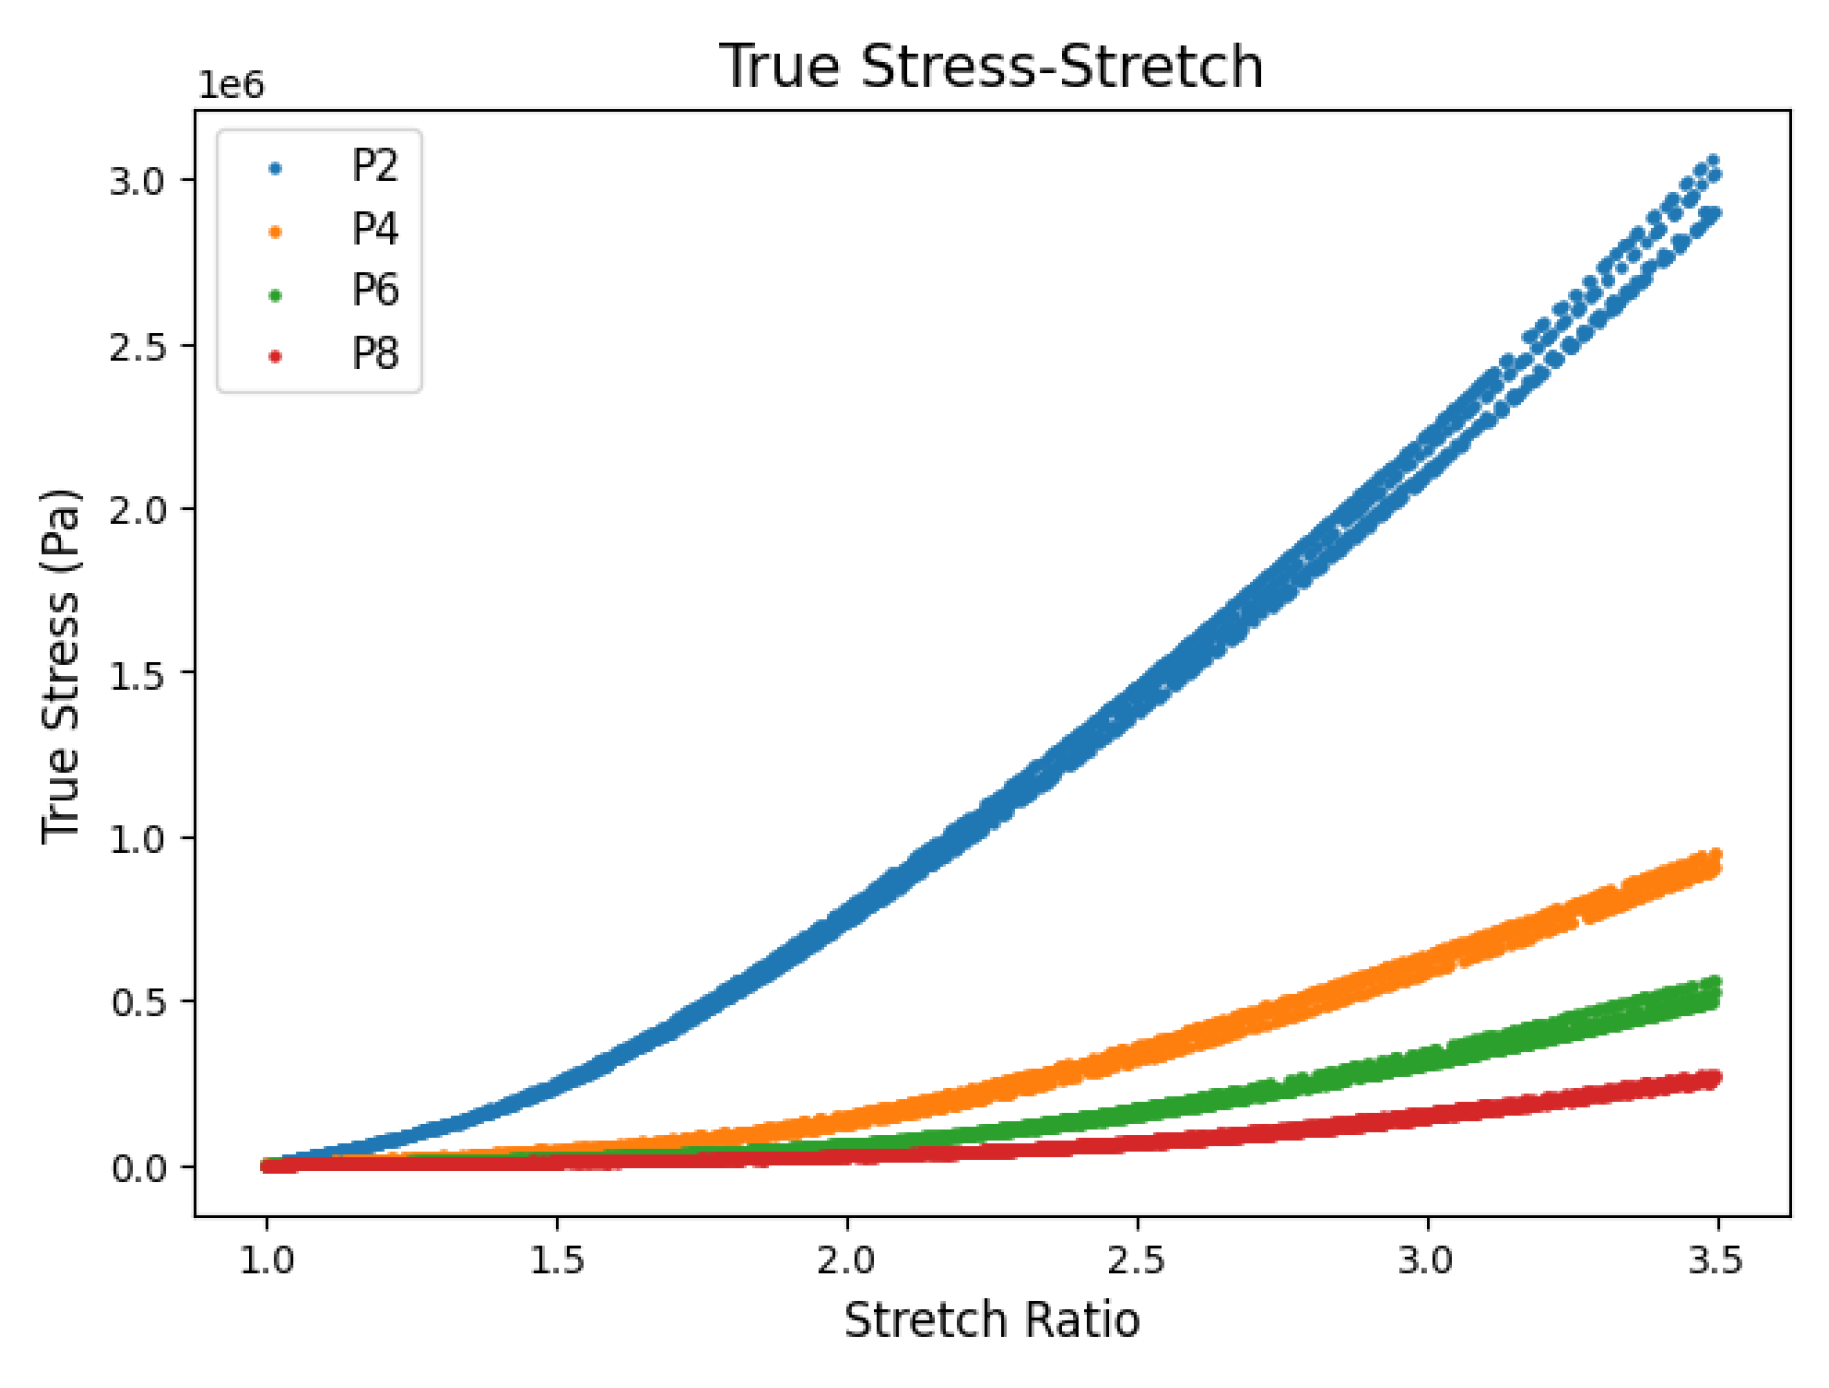
Figure 10.
Hyperelastic fitting for (a) P2, (b) P4, (c) P6, and (d) P8 plasticizer contents.
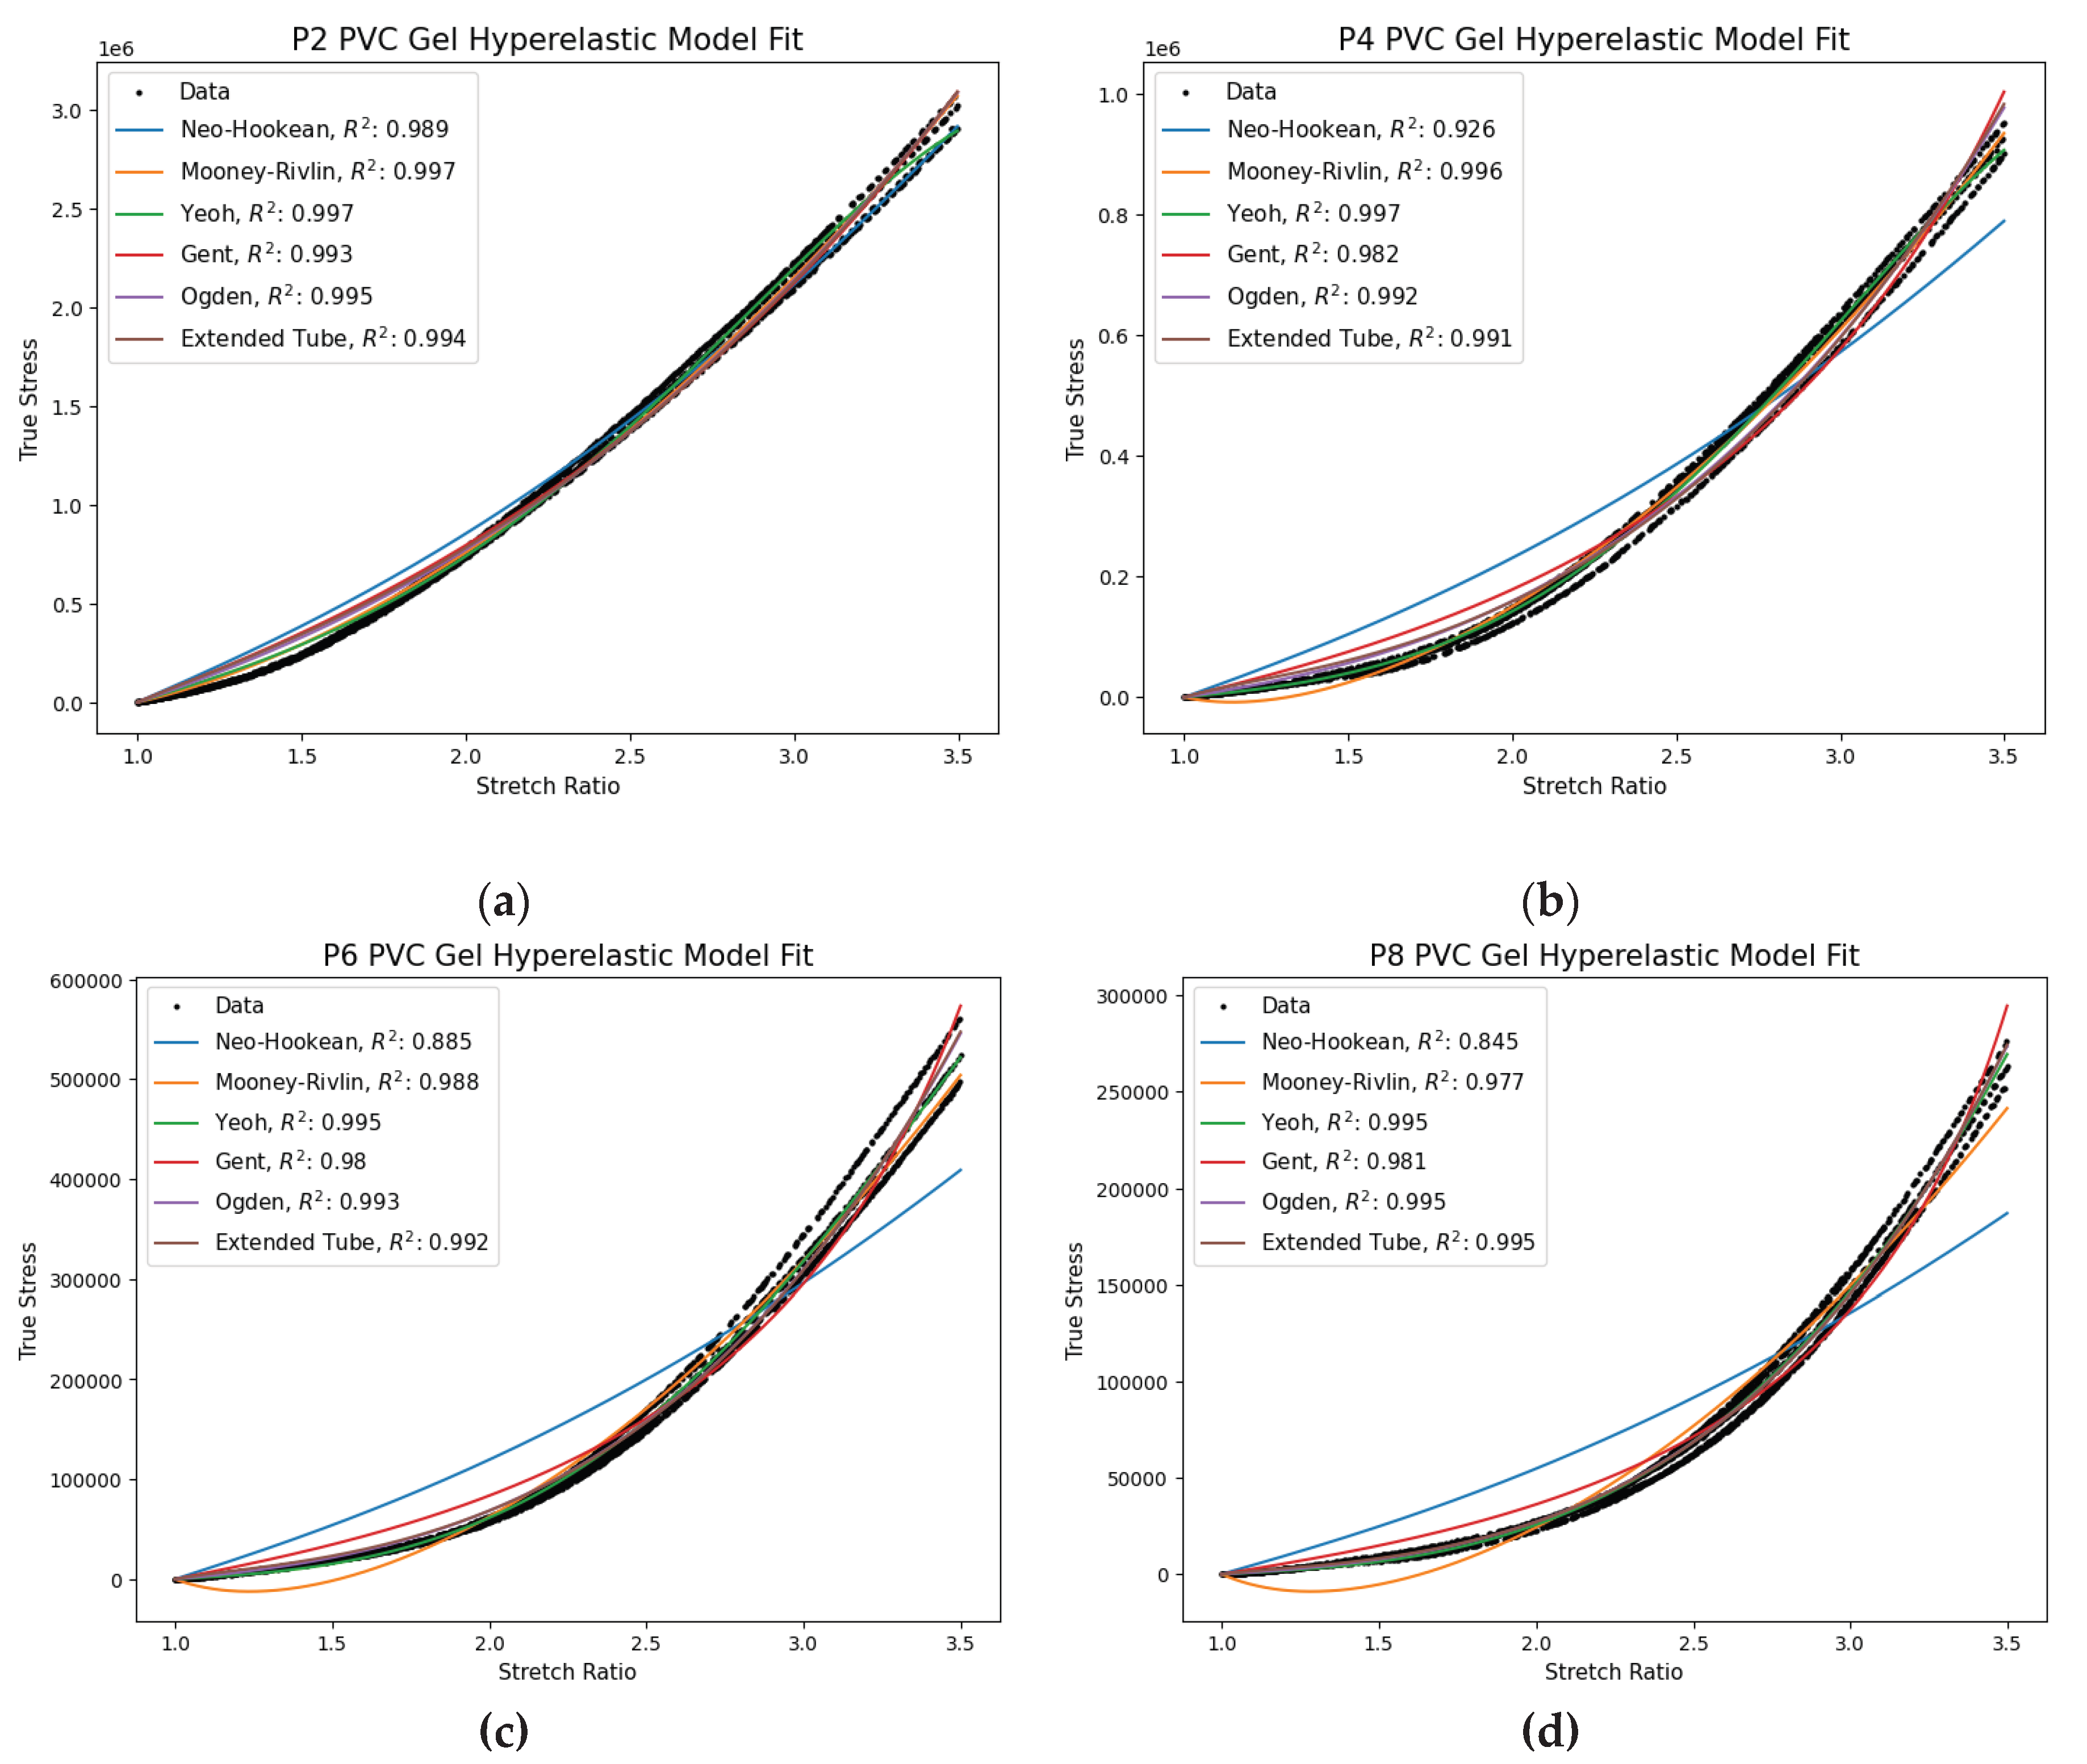

Table 1.
Table 1. Elastic modulus for each plasticizer content up to 25% strain.
| Plasticizer Ratio |
Elastic Modulus (Pa) |
|---|---|
| P2 | 288751 |
| P4 | 56058 |
| P6 | 24707 |
| P8 | 11047 |
Table 2.
Poisson's ratio for various plasticizer contents.
| Plasticizer Ratio |
Poisson’s Ratio |
|---|---|
| P2 | 0.42 |
| P4 | 0.43 |
| P6 | 0.37 |
| P8 | 0.35 |
Table 3.
Yeoh parameters and coefficient of determination for each plasticizer content.
| Plasticizer Ratio | Coefficient of Determination | |
|---|---|---|
| P2 | 0.9972 | [85622, 5800, -272] |
| P4 | 0.9971 | [9061, 3175, -116] |
| P6 | 0.9946 | [3106, 1545, -40] |
| P8 | 0.9952 | [1365, 593, -5.99] |
Disclaimer/Publisher’s Note: The statements, opinions and data contained in all publications are solely those of the individual author(s) and contributor(s) and not of MDPI and/or the editor(s). MDPI and/or the editor(s) disclaim responsibility for any injury to people or property resulting from any ideas, methods, instructions or products referred to in the content. |
© 2025 by the authors. Licensee MDPI, Basel, Switzerland. This article is an open access article distributed under the terms and conditions of the Creative Commons Attribution (CC BY) license (http://creativecommons.org/licenses/by/4.0/).
Copyright: This open access article is published under a Creative Commons CC BY 4.0 license, which permit the free download, distribution, and reuse, provided that the author and preprint are cited in any reuse.


