Submitted:
09 September 2025
Posted:
09 September 2025
You are already at the latest version
Abstract
We present the first dark sky map of Thailand using calibrated zenith artificial night-sky brightness from VIIRS satellite data covering 2012–2023. Results were compared with the United Kingdom, Chile, and Botswana to provide international context. Maps identified 14 classes of dark-sky areas, ranging from pristine sky to cone cell stimulation, with classes 1–9 designated as “potential” dark sky. Influencing factors—including population, GDP, inflation rate, unemployment, time, and country name—were analyzed using mathematical models. The number of potential dark-sky areas was best predicted by a Decision Tree model with a relative error of 0.4% ± 0.3%. Risk assessment suggests that Thailand’s potential dark-sky areas are significantly threatened and could disappear by 2068 without conservation. Since 2012, Thailand has lost 15.4% of its pristine skies, while the UK gained 0.8%. Botswana remained nearly stable (–0.7%), outperforming Chile (–5.3%). By 2023, ~60% of Thai residents had lost naked-eye visibility of the Milky Way, and one-fifth were exposed to very high nighttime light intensities, preventing dark adaptation. These findings highlight Thailand’s rapid dark-sky degradation and emphasize the value of satellite-based monitoring for conservation strategies, sustainable development policies, and international efforts to protect the natural night environment.
Keywords:
dark sky conservation
; environmental astronomy
; light pollution
; night sky brightness
; satellite-based monitoring
; sustainable development
; sustainability policy
; Thailand
; VIIRS DNB
1. Introduction
Artificial light at night (ALAN) has become one of the most significant and fastest-growing forms of environmental pollution. It affects not only the visibility of the night sky but also ecological systems and human health [1,2]. A number of studies have demonstrated the increasing radiance and extent of night-time lighting globally, with satellite-based observations revealing year-on-year increases, particularly in developing regions [3].
In 2016, Falchi et al. [4] introduced the New World Atlas of Artificial Night Sky Brightness, providing a global classification of sky brightness levels using a 14-class scale based on the ratio of artificial light to natural night sky background. This framework has since been widely adopted for characterizing dark sky conditions in both global and regional studies [5,6]. The atlas revealed that a significant fraction of the world’s population now lives under skies too bright to observe the Milky Way, raising concerns for both astronomy and conservation. Despite these advancements, relatively few studies have focused on the Southeast Asian region, and none have systematically mapped sky brightness conditions across Thailand.
In this work, we produce the first dark sky map of Thailand using VIIRS Day/Night Band data from 2012–2023. The data are processed to align with the classification scheme of Falchi et al. [4] to facilitate international comparison. We analyze both spatial and temporal patterns of sky brightness and compare Thailand’s situation with countries known for varying light pollution profiles: Chile, Botswana, and the United Kingdom. By ranking Thailand’s 77 provinces based on their potential dark sky areas, we aim to provide data-driven insights for both policy and the promotion of dark sky tourism. Our work also sets the stage for integrating night sky quality into broader environmental and economic planning.
2. Materials and Methods
To create a dark sky map, the measurements of the calibrated zenith artificial night sky brightness collected from the Suomi National Polar-orbiting Partnership with the Visible Infrared Imaging Radiometer Suite (NPP-VIIRS) from 2012–2023 of the four countries studied were acquired; therefore, mathematical models were carried out to find the significant factors affecting the sky brightness.
2.1. Data acquisition
Data were collected on electric lighting present on the Earth’s surface observed by the Visible Infrared Imaging Radiometer Suite (VIIRS) Day/Night Band (DNB) [7] over Thailand, the UK, Chile, and Botswana during 2012–2023. The cloud, background noise, solar and lunar contamination, and features unrelated to electric lighting (e.g., fires, flares, volcanoes) were first reduced by adopting the data in extention (stands for VIIRS cloud mask, stray light, lunar correction. The NPP-VIIRS data provided the ratio of artificial light to natural light [8]. Natural lighting levels are governed by natural celestial sources, mainly the Moon, natural atmospheric emission (airglow), starlight, the Milky Way light, and zodiacal light. Meanwhile, the artificial light levels are from man-made light (predominantly electrical).
The raster file of each year in an average masked data extension covering Thailand, the UK, Chile, and Botswana from NPP-VIIRS1 between 2012 and 2023 was collected and clipped according to the shape of each country. This extension contains the lights from cities, towns, and other sites with persistent lighting, including gas flares (which are not included in the other data extension), provided in the average value of the most suitable data and masked average radiance, with background, biomass burning, and aurora zeroed out. Ephemeral events, such as fires, have been discarded; the background noise was also identified and replaced with values of zero, yielding the output data to range from 1-63. The resulting artificial/natural light ratios from imagery were then grouped into 14 classes as presented in Table 1.
Table 1 presents 14 classes of sky brightness classified by the ratio between the artificial brightness and the natural background sky brightness given by Falchi et al. [4], where the natural background sky of 174 µcd m2 (or 22 mag arcsec−2) was assumed. We noted here that the up-to-date value of 271.28 µcd m-2 (or 21.5±0.4 mag arcsec−2) was reported in Grauer et al. [9], Alarcon et al. [10].
2.2. Modelling
The “potential” dark sky was designated as sky class 1–9 due to the visibility of the Milky Way and was modelled to determine factors that affect the evolution of night sky brightness. We studied six attributes of each country, including population, GDP, inflation rate, unemployment rate, time, and country name, using several mathematical models.
Light pollution levels have often been suspected to have a positive correlation with the gross domestic product (GDP), a measure of a nation’s economic output. As economies expand, urbanisation accelerates and energy consumption increases, leading to a greater demand for artificial lighting. Studies have shown that countries with higher GDPs tend to exhibit higher levels of light pollution [11]. Population growth, particularly in urban areas, is another key driver of light pollution. Densely populated regions typically have higher levels of artificial lighting due to increased residential, commercial, and industrial activity. Research has consistently demonstrated a strong correlation between population density and light pollution [12]. The relationship between inflation, unemployment, and light pollution is more complex. Other economic factors often mitigate the impact of high inflation, which theoretically could lead to reduced energy consumption and consequently, lower light pollution. Unemployment rates can indirectly influence light pollution by altering urban development and energy consumption patterns [3,4,13,14]. However, it is essential to note that this relationship is not strictly linear, as factors like energy efficiency policies and technological advancements in individual countries can influence the impact of economic growth on light pollution.
To effectively predict spatial data, various machine learning models are commonly used due to their capability of capturing complex relationships within the data. Among these models are the Decision Tree model, which is easy to interpret but prone to overfitting; the Gradient Boosted Trees model, which sequentially builds trees to improve accuracy; the Random Forest model, which reduces overfitting by using multiple trees; the General Linear Model, which extends linear regression for different types of dependent variables; and Deep Learning models, such as convolutional neural networks and recurrent neural networks, which excel at handling high-dimensional data and extracting complex features. Each of these models offers unique advantages, making them suitable for different aspects of spatial data prediction [12,15,16,17,18].
Rapid Miner was used for modelling to predict the dark sky potential areas using the General Linear Model (GLM), Deep Learning, Decision Tree, Random Forest, and Gradient Boosted Trees (GBT) models. The process was started by importing a dataset from 2012–2023 with six variables: GDP, population, unemployment rate, year, and country name. Each model type was created, and the weights of the factors affecting the forecast were extracted using operator-extracted coefficients for GLM, deep learning, decision trees, gradient-boosted trees, and random forests, respectively. The models were evaluated with operator performance to ensure their accuracy. These operations helped in analysing and interpreting the results efficiently, as well as understanding the weight of factors affecting the prediction as the relative error defined by Equation 1. The relative error, as a proportion of the true value, provided a comparative understanding of how close the measured value is to the actual value [19].
3. Results
Dark sky maps of Thailand during 2012–2023 are presented in Figure 1 with colour codes defined in Table 1. We can see that the sky has become brighter over time, with major cities like Bangkok and its surrounding areas already experiencing sky classes 13–14 in 2012. However, the high level of development in the city turned out not to be the reason for the brighter nighttime sky, which will be explained later in the Discussion section.
The dark sky map for 2023, labelled with ranking numbers for 77 provinces of Thailand based on the number of potential dark sky (class 1–9) areas, is presented in Figure 2. Meanwhile, Table 2 reveals the number of areas of 14 sky classes in each province of Thailand, filed in alphabetical order with ranking by the number of potential dark sky areas in the last column. Future dark-sky tourism could benefit from these ranking numbers. With the exception of cities ranked number 2 (Nakhon Ratchasima), number 5 (Ubon Ratchthani), and number 7 (Chaiyaphum), which were known as the largest area provinces, we might notice that the first ten ranked cities appeared to be the western border cities with the Tanaosri mountain range, which extends in a north–south direction in the western provinces of Thailand.
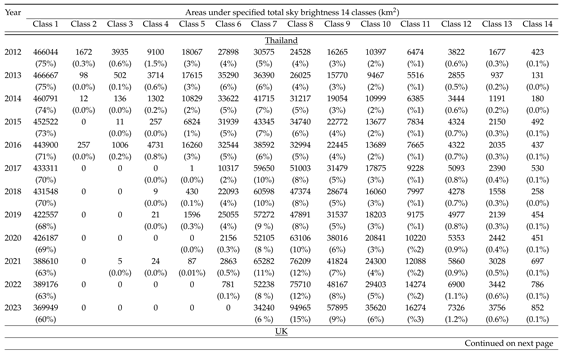
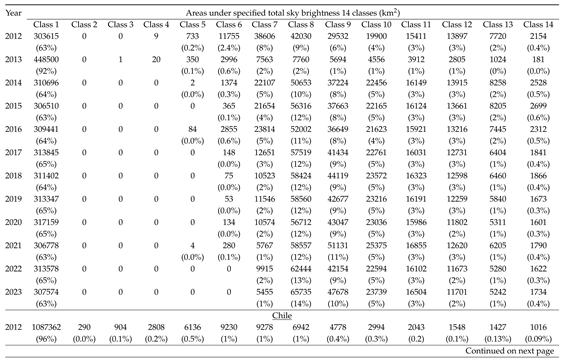
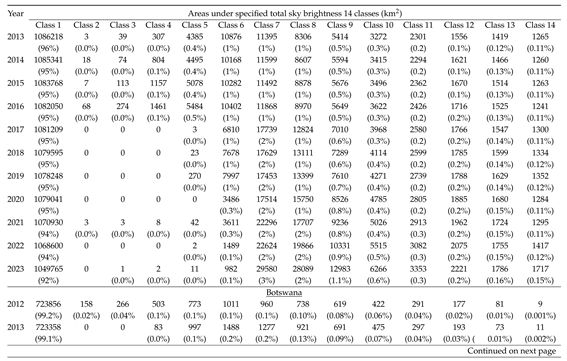
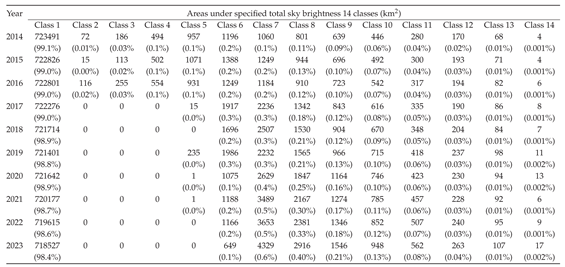
The changes in sky brightness classes 1–14 over Thailand, the UK, Chile, and Botswana during 2012 – 2023 are presented in Table 3. It was found that the number of potential dark sky areas among the three countries (except Botswana due to its almost unchanged area of dark sky) was best predicted by a decision tree model, as shown in Figure 3, with a relative error (e) of 0.4% ± 0.3%. While Gradient Boosted Trees (e = 0.9% ± 0.4%), a Random Forest (e = 1.1% ± 0.5%), a General Linear Model (e = 1.2% ± 0.3%), and a Deep Learning (e = 2.3% ± 0.8%) all made small errors, they all agreed that the country name attribute has the most significant effect on the rate of change, with an average weight of 0.24 ± 0.01 as shown in Table 4. This implies that neither higher population, wealth, nor other economic factors are the reasons for creating more light pollution, but the country’s dark sky reserve policy appears significant, as we discuss below.
Figure 4 and Figure 5 show the percent of area of the potential dark sky (class 1-9) of the four countries during 2012-2023. In comparison with other countries, Thailand has been losing pristine dark sky at a much higher rate (75.0% in 2012 - 59.6% in 2023) compared with the UK, whose dark sky area remained almost unchanged also (62.6% in 2012 - 63.4% in 2023). Meanwhile, the percentage of pristine dark sky sites in Botswana remains almost unchanged (99.1% in 2012 to 98.4% in 2023), and light pollution seems to be one of the least in the world and even better than Chile’s (97.6% in 2012 to 92.3% in 2023), where major international observatories are located.

Table 4.
Relative errors and weights delivered from mathematical models.
| Model | Relative | Attribute weight | |||||
| error (%) | Name | Time | Population | Inflation* | GDP | Unemployment* | |
| GLM | 1.2±0.3 | 0.257 | 0.022 | 0 | 0 | 0 | 0 |
| Random forest | 1.1±0.5 | 0.232 | 0.030 | 0.019 | 0 | 0.004 | 0 |
| Decision trees | 0.4±0.3 | 0.237 | 0.012 | 0.005 | 0 | 0 | 0 |
| Deep Learning | 2.3±0.8 | 0.242 | 0.018 | 0 | 0.019 | 0 | 0 |
| GBT | 0.9±0.4 | 0.251 | 0.025 | 0.016 | 0 | 0 | 0 |
| Average | 0.24±0.01 | 0.021±0.007 | 0.008±0.009 | 0.004±0.008 | 0.001±0.002 | 0 | |
*rate
4. Discussion
Our findings indicate that neither population size, GDP, nor other economic factors explain national trends in sky brightness. Instead, country-level policy on dark sky reserves and lighting regulations appear decisive. For example, while Bangkok and its surrounding provinces rapidly deteriorated, other countries with active policies (e.g., the UK) have stabilized their skies despite comparable urbanization.
We also noted that VIIRS data for the UK in 2013 were incomplete, detecting only the southern part of the country. This limitation suggests that caution should be applied when interpreting that year’s results.
Although time itself was not a strong predictor in our machine learning models, we found Thailand could lose all potential dark skies by 2068 if no conservation policies are implemented. Risk assessments therefore highlight an urgent need for immediate conservation action.
Overlaying our maps with Thailand’s 2023 population census reveals that more than 60% of the Thai population (living in 4.5% of land area) have already lost naked-eye visibility of the Milky Way. Within this group, over one-fifth of the population (living in less than 1% of land area) are exposed to extremely high nighttime light intensities that prevent dark adaptation. These findings emphasize the societal relevance of dark sky degradation.
Limitations of VIIRS Sensitivity to LED Wavelengths
One limitation of the VIIRS Day/Night Band (DNB) sensor is its reduced sensitivity to short-wavelength (blue-rich) emissions from white LEDs [20]. As Thailand increasingly adopted LED lighting during the study period, VIIRS may underestimate actual upward-directed light. This could explain why VIIRS-derived trends sometimes appear stable even when ground observations indicate worsening conditions [3,6]. Future work should combine VIIRS data with ground-based photometry or new sensors with broader spectral response.
5. Conclusions
In this study, we have introduced the first comprehensive dark sky map of Thailand, utilising data from the Suomi National Polar-orbiting Partnership’s Visible Infrared Imaging Radiometer Suite (NPP-VIIRS), spanning from 2012 to 2023. Our analysis of artificial night sky brightness relative to natural light has highlighted significant trends in the degradation of Thailand’s nocturnal environment compared to the UK, Chile, and Botswana.
The findings indicate a troubling decline in the number of pristine dark sky areas in Thailand, with a loss rate of 15.4% since 2012; a stark contrast to the slight increase in the UK’s pristine skies by 0.8% over the same period. This discrepancy underscores the critical impact of dark sky conservation policies, which are notably absent in Thailand. The data also reveal that while Botswana and Chile have managed to retain relatively stable levels of dark sky, Thailand’s potential dark sky areas are projected to diminish significantly by 2068 if no intervention is made.
Our tests of different models show that the Decision Tree model, with the lowest error, is the best at predicting the number of possible dark sky areas. However, all of the models agree that country-specific dark sky conservation practices are a big part of how much light pollution there is. This suggests that the observed increase in light pollution is not solely due to population or economic growth but rather to the absence of effective conservation measures.
The risk to Thailand’s dark skies is further highlighted by the fact that over 60% of its residents have lost the ability to view the Milky Way with the naked eye, and more than 20% are exposed to very high nighttime light intensities. These findings call for immediate and robust dark sky conservation strategies to prevent further deterioration of Thailand’s night sky and preserve its remaining natural nocturnal heritage.
A dramatic increase in nighttime sky brightness in Thailand could be due to the introduction of new street lighting technologies. The country began to replace older, conventional street lamps with more energy-efficient LED lights around 2015. The government launched several initiatives aimed at modernising street lighting to reduce energy consumption and maintenance costs since then. The move was part of a broader push towards sustainability and efficiency in public infrastructure. Over the years, this initiative has expanded to include more cities and rural areas, reflecting a growing commitment to energy conservation. However, these LEDs usually have a different colour temperature and brightness compared to the older high-pressure sodium lamps they replaced. The transition to LED lighting resulted in a rise in skyglow, a phenomenon where atmospheric particles scatter artificial light, brightening the night sky. This change in lighting technology significantly altered the nighttime sky’s brightness.
This paper suggests that the only significant factor that affected sky brightness over time was public policy. In the UK for example, overall sky brightness decreased during the past decade. The United Kingdom addresses light pollution through various policies aimed at reducing its environmental and social impacts. The UK has implemented laws and regulations to address light pollution issues, although there are some gaps in the existing policies. The Clean Neighbourhoods and Environment Act 2005 brought certain forms of exterior lighting under statutory nuisance control, indicating a step towards managing light pollution. Furthermore, the UK government recognises the detrimental effects of light pollution on wildlife, human health, and astronomy [21]. Policies emphasise the adoption of energy-efficient lighting technologies, such as LEDs, to minimise light spill and glare while conserving energy [22].
There has been a trend in the UK towards increasing the number of dark sky areas, and this could be primarily driven by a growing awareness of light pollution and its effects. We might suspect here a few reasons behind this trend: 1.) Environmental Concerns: Light pollution affects not only stargazing but also wildlife and ecosystems. Increased awareness of these impacts has led to efforts to reduce artificial light in natural areas. 2.) Public Awareness and Interest: There’s a growing public interest in astronomy and dark sky experiences. As more people become aware of the beauty of dark skies and the effects of light pollution, there’s more support for preserving these areas. 3.) Dark Sky Reserves and Parks: Organisations like the International Dark-Sky Association (IDA) work to designate and protect dark sky reserves and parks. 4.) Community and Local Government Initiatives: Local communities and governments are increasingly involved in initiatives to reduce light pollution. This includes adopting better lighting practices, such as using shielded fixtures and lowering light levels during the night. 5.) Tourism: There’s also an economic incentive. Dark sky areas attract tourists interested in stargazing and astrophotography, which can benefit local economies.
We encourage local authorities in Thailand and other countries without such policies to implement lighting strategies and planning policies to mitigate light pollution in sensitive areas, such as Dark Sky Reserves. People would realise that the implementation of lamp shields alone can lead to significant reductions in electricity consumption of over 30%, as proposed in [23]. Public awareness campaigns could promote responsible lighting practices among businesses and individuals.
These findings demonstrate that dark-sky conservation should be considered not only an astronomical or environmental concern but also a pillar of sustainable development. Protecting dark skies directly supports SDG 11 by promoting sustainable cities and communities, while also contributing to SDG 7 through more efficient energy use and SDG 15 by reducing ecological disruption to nocturnal species. Remote-sensing approaches provide a scalable monitoring framework for policymakers to evaluate progress and adjust strategies. Beyond environmental protection, reducing light pollution can lower electricity costs, improve human health, and foster eco-tourism opportunities such as dark-sky tourism. Therefore, integrating dark-sky policies into national sustainability agendas represents a cost-effective and multi-benefit pathway toward a more resilient and sustainable future.
Author Contributions
Conceptualization: F.S.; M.F.B. Methodology: F.S.; T.C. Data curation: J.W. Data visualisation: T.C.; S.N. Writing original draft: F.S.; S.P.; B.S.; M.F.B. All authors approved the final submitted draft.
Funding
This research was funded by the National Astronomical Research Institute of Thailand (NARIT) grant number FFB680072/0269.” and Chiang Rai Rajabhat University grant number B367019. The APC was funded by NARIT.
Institutional Review Board Statement
Not applicable.
Informed Consent Statement
Not applicable.
Data Availability Statement
The original data presented in the study are openly available at https://science.crru.ac.th/download/fahrung/thailanddarkskymap.zip
Acknowledgments
We acknowledge the use of data from the Visible Infrared Imaging Radiometer Suite (VIIRS) nighttime lights provided by the Earth Observation Group (EOG), Payne Institute for Public Policy, Colorado School of Mines for making the datasets publicly available under the Creative Commons Attribution 4.0 International license (CC-BY 4.0). During the preparation of this manuscript, the authors used the SciSpace for the purposes of literature review and used the ChatGPT5 for the purposes of paraphrasing and language re-arangment. The authors have reviewed and edited the output and take full responsibility for the content of this publication.
Conflicts of Interest
The authors declare no conflicts of interest.The funders had no role in the design of the study; in the collection, analyses, or interpretation of data; in the writing of the manuscript; or in the decision to publish the results.
References
- Longcore, T.; Rich, C. Ecological light pollution. Front. Ecol. Evol. 2004, 2, 191–198. [Google Scholar] [CrossRef]
- Gaston, K.; Visser, M.; Hölker, F. The biological impacts of artificial light at night: The research challenge. Philos. Trans. R. Soc. B: Biol. Sci. 2015, 370, 20140133. [Google Scholar] [CrossRef]
- Kyba, C.C.M.; Kuester, T.; de Miguel, A.S.; Baugh, K.; Jechow, A.; Hölker, F.; Bennie, J.; Elvidge, C.D.; Gaston, K.J.; Guanter, L. Artificially lit surface of Earth at night increasing in radiance and extent. Sci. Adv. 2017, 3, e1701528. [Google Scholar] [CrossRef]
- Falchi, F.; Cinzano, P.; Duriscoe, D.; Kyba, C.C.M.; Elvidge, C.D.; Baugh, K.; Portnov, B.A.; Rybnikova, N.A.; Furgoni, R. The new world atlas of artificial night sky brightness. Sci. Adv. 2016, arXiv:astro-ph.IM/1609.01041]2, e1600377–e1600377. [Google Scholar] [CrossRef]
- Bará, S. Local and global contributions to the artificial sky brightness. MNRAS 2021, 500, 5393–5403. [Google Scholar] [CrossRef]
- Barentine, J.C. Trends in light pollution: A comparative review of recent developments in measurement and policy. JQSRT 2022, 278, 108090. [Google Scholar] [CrossRef]
- Elvidge, C.D.; Baugh, K.; Zhizhin, M.; Hsu, F.; Ghosh, T. VIIRS night-time lights. Int. J. Remote Sens. 2017, 38, 5860–5879. [Google Scholar] [CrossRef]
- Cinzano, P.; Falchi, F.; Elvidge, C.D. The first World Atlas of the artificial night sky brightness. MNRAS 2001, 328, 689–707. [Google Scholar] [CrossRef]
- Grauer, A.D.; Grauer, P.A.; Davies, N.; Davies, G. Impact of Space Weather on the Natural Night Sky. PASP 2019, 131, 114508. [Google Scholar] [CrossRef]
- Alarcon, M.R.; Serra-Ricart, M.; Lemes-Perera, S.; Mallorquín, M. Natural Night Sky Brightness during Solar Minimum. AJ 2021, 162, 25, [astro-ph.IM/2105.01066]. [Google Scholar] [CrossRef]
- Gallaway, T.; Olsen, R.N.; Mitchell, D.M. The economics of global light pollution. Ecol. Econ. 2010, 69, 658–665. [Google Scholar] [CrossRef]
- Borth, D.J.; Hopp, M.E. Human influence on light levels in the terrestrial environment. Environ. Rev. 2008, 16, 329–341. [Google Scholar]
- Hölker, F.; Wolter, C.; Perkin, E.K.; Tockner, K. Light pollution as a biodiversity threat. Trends Ecol. Evol. 2010, 25, 681–2. [Google Scholar] [CrossRef]
- Zhang, J.; Fan, Z.; Yan, J.; Bharat Kumar, Y.; Li, H.; Gao, D.Y.; Jiang, X.J. The Night Sky Spectrum of Xinglong Observatory: Changes from 2004 to 2015. PASP 2016, 128, 105004, [astro-ph.IM/1609.00137]. [Google Scholar] [CrossRef]
- Nelder, J.A.; Wedderburn, R.W.M. Generalized Linear Models. J. R. Stat. Soc. A 1972, 135, 370–384. [Google Scholar] [CrossRef]
- Breiman, L. Data Mining with Decision Trees. Mach. Learn. 2001, 45, 5–32. [Google Scholar] [CrossRef]
- LeCun, Y.; Bengio, Y.; Hinton, G. Deep learning. Nature 2015, 521, 436. [Google Scholar] [CrossRef]
- Chen, T.; Guestrin, C. XGBoost: A Scalable Tree Boosting System. In Proceedings of the Proceedings of the 22nd ACM SIGKDD International Conference on Knowledge Discovery and Data Mining, New York, NY, USA, 2016; KDD ’16, p. 785–794. [CrossRef]
- Mahmood, Y.; Kama, N.; Azmi, A.; Khan, A.S.; Ali, M. Software effort estimation accuracy prediction of machine learning techniques: A systematic performance evaluation. Softw. Pract. Exp. 2022, 52, 39–65. [Google Scholar] [CrossRef]
- Cao, C.; Bai, Y. Evaluation of VIIRS night-time light data for mapping global urban lighting and its environmental impacts. Remote Sens. 2014, 6, 9129–9158. [Google Scholar] [CrossRef]
- CPRE. Campaign to Protect Rural England - Shedding light on light pollution: tackling artificial light at night. 2020.
- Department for Business Energy and Industrial Strategy. Guidance on lighting and minimising light pollution. 2019.
- Ozawa, L. Operation of FL Lamps with ±3G Electron Sources in Ar Gas Space as a Most Clean Energy Light Source. Int. J. Adv. Res. Phys. Sci. 2019, 6, 10–23. [Google Scholar]
Figure 1.
Changes in sky brightness of Thailand from 2012–2023 presented in 14 color classes defined in Table 1. The figure was generated using public domain data extracted from NASA Earth Observatory by this paper. Generated from Elvidge et al. [7] under a CC BY license, with permission from the Earth Observation Group (EOG), original copyright 2017.
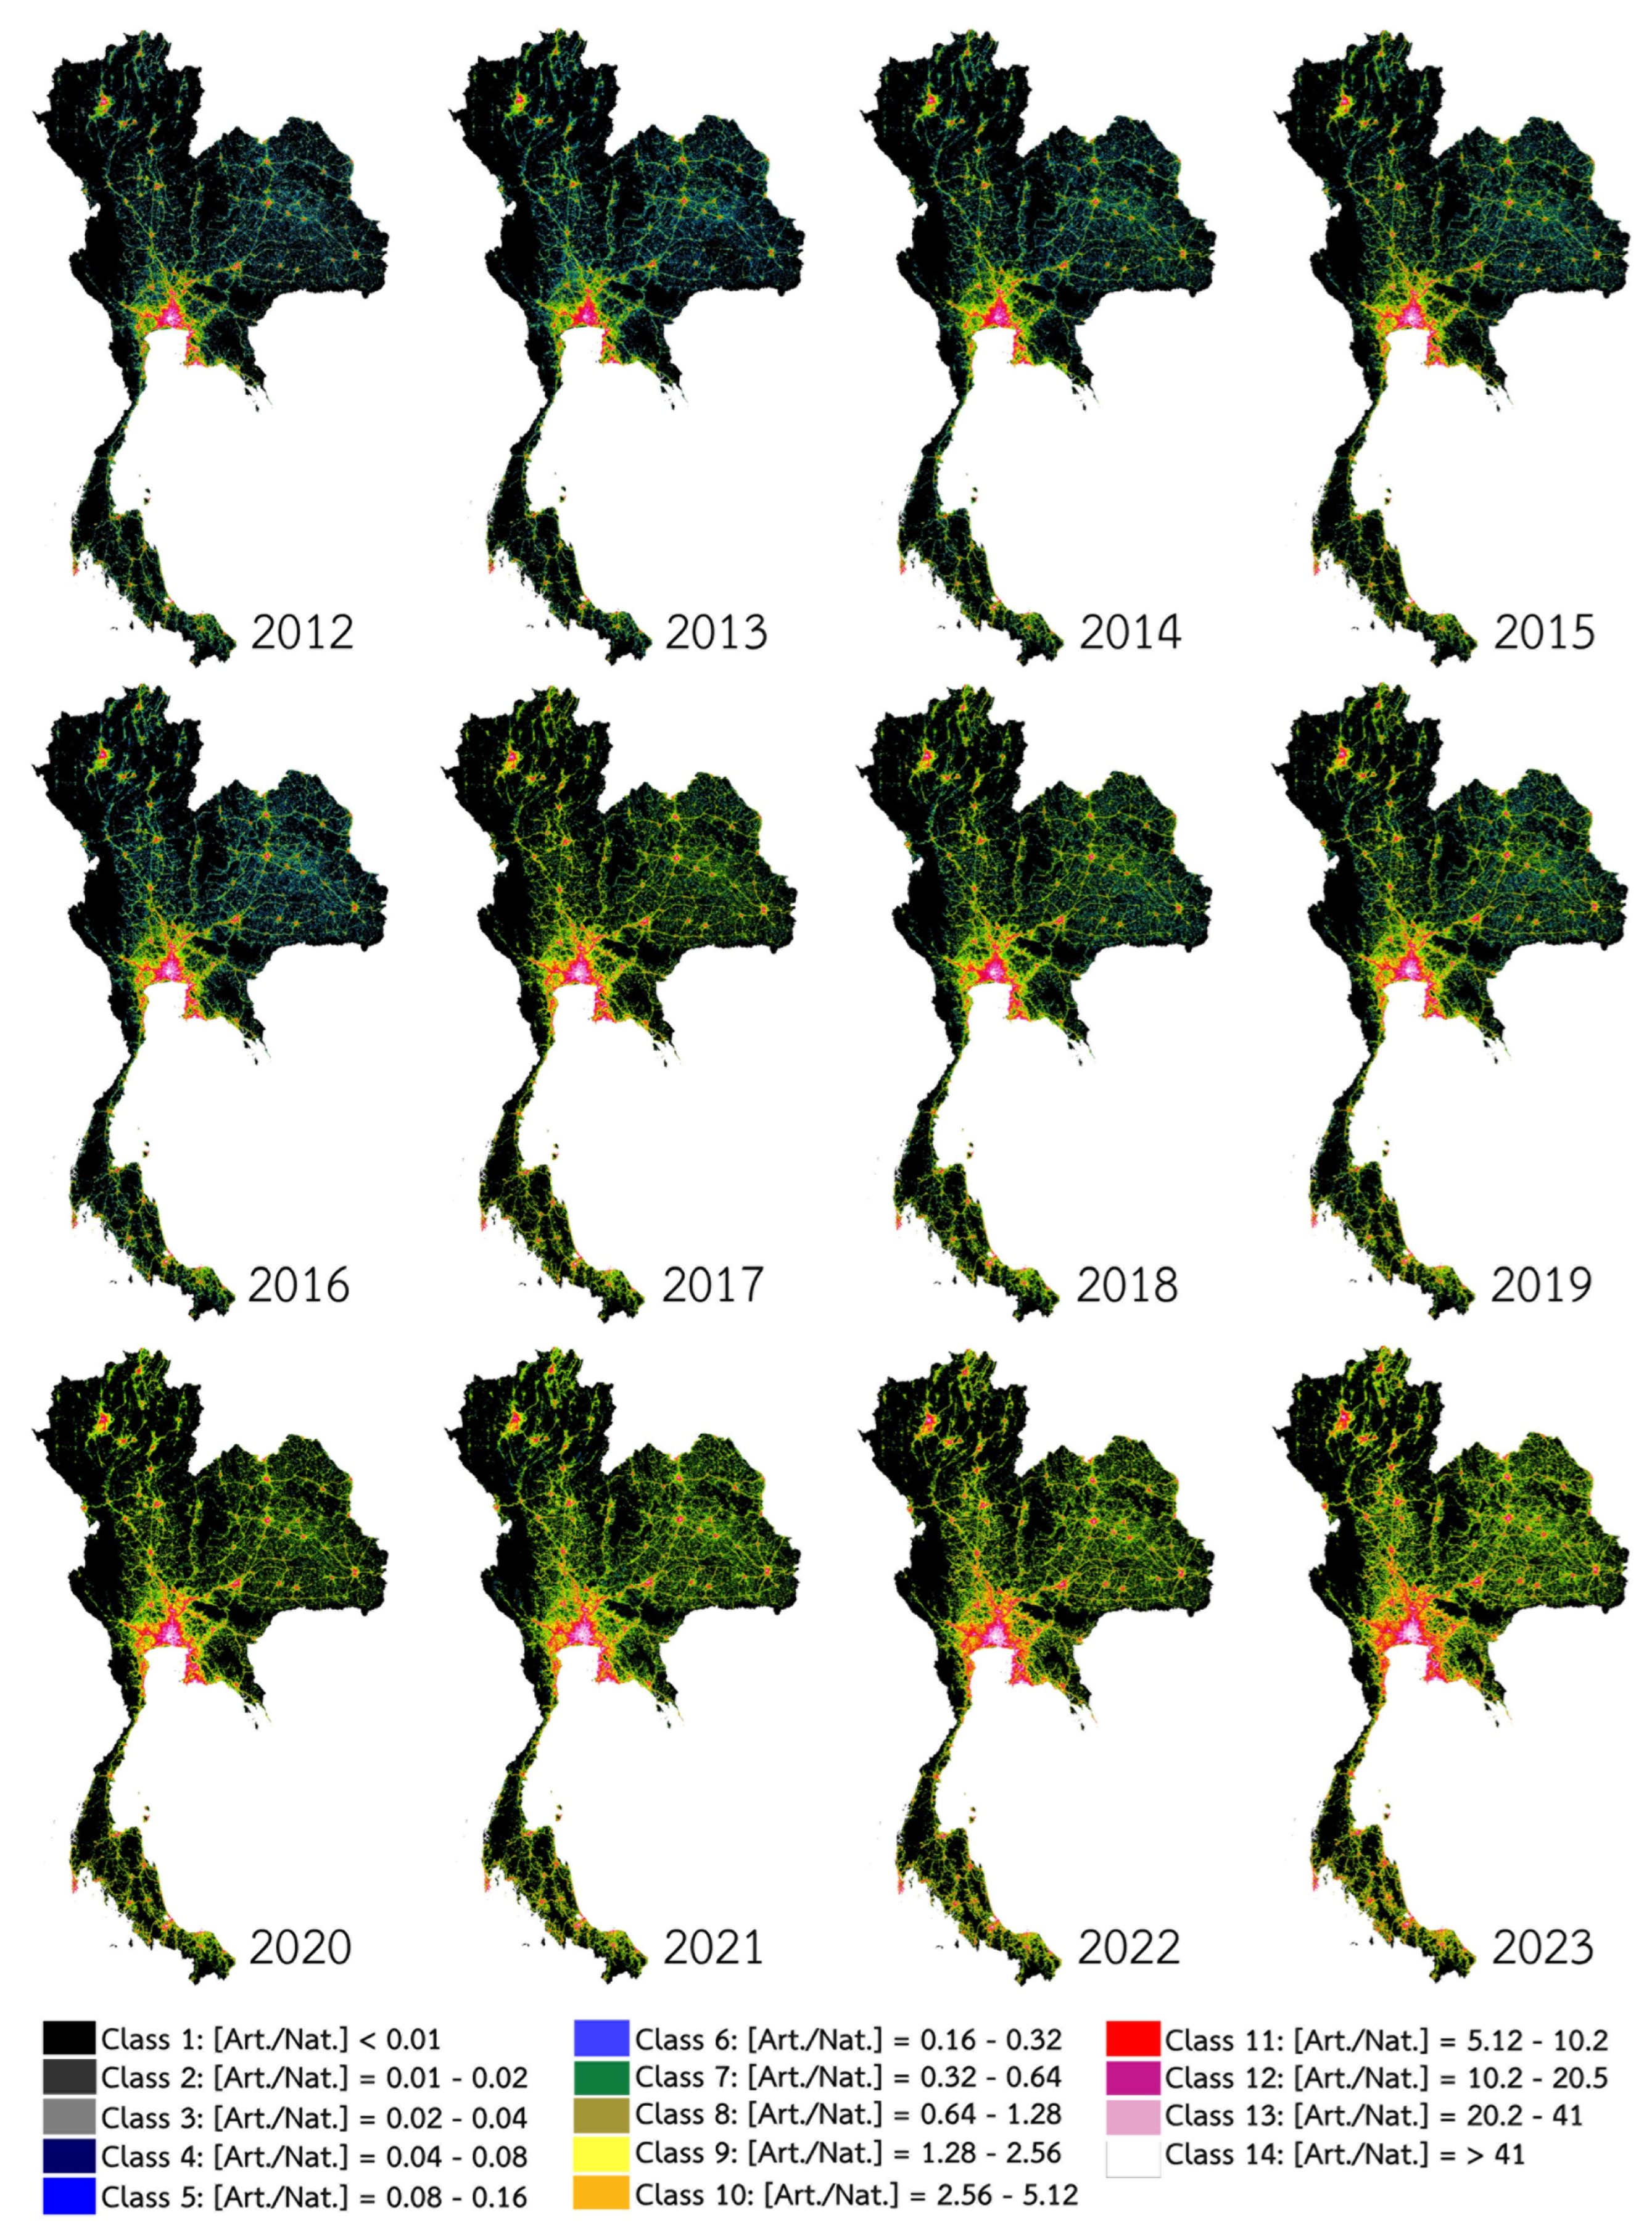
Figure 2.
Dark sky map of Thailand in 2023. The 77 provincial ranking numbers correspond to the ranks presented in Table 2. Data from NASA Earth Observatory public domain.
Figure 2.
Dark sky map of Thailand in 2023. The 77 provincial ranking numbers correspond to the ranks presented in Table 2. Data from NASA Earth Observatory public domain.
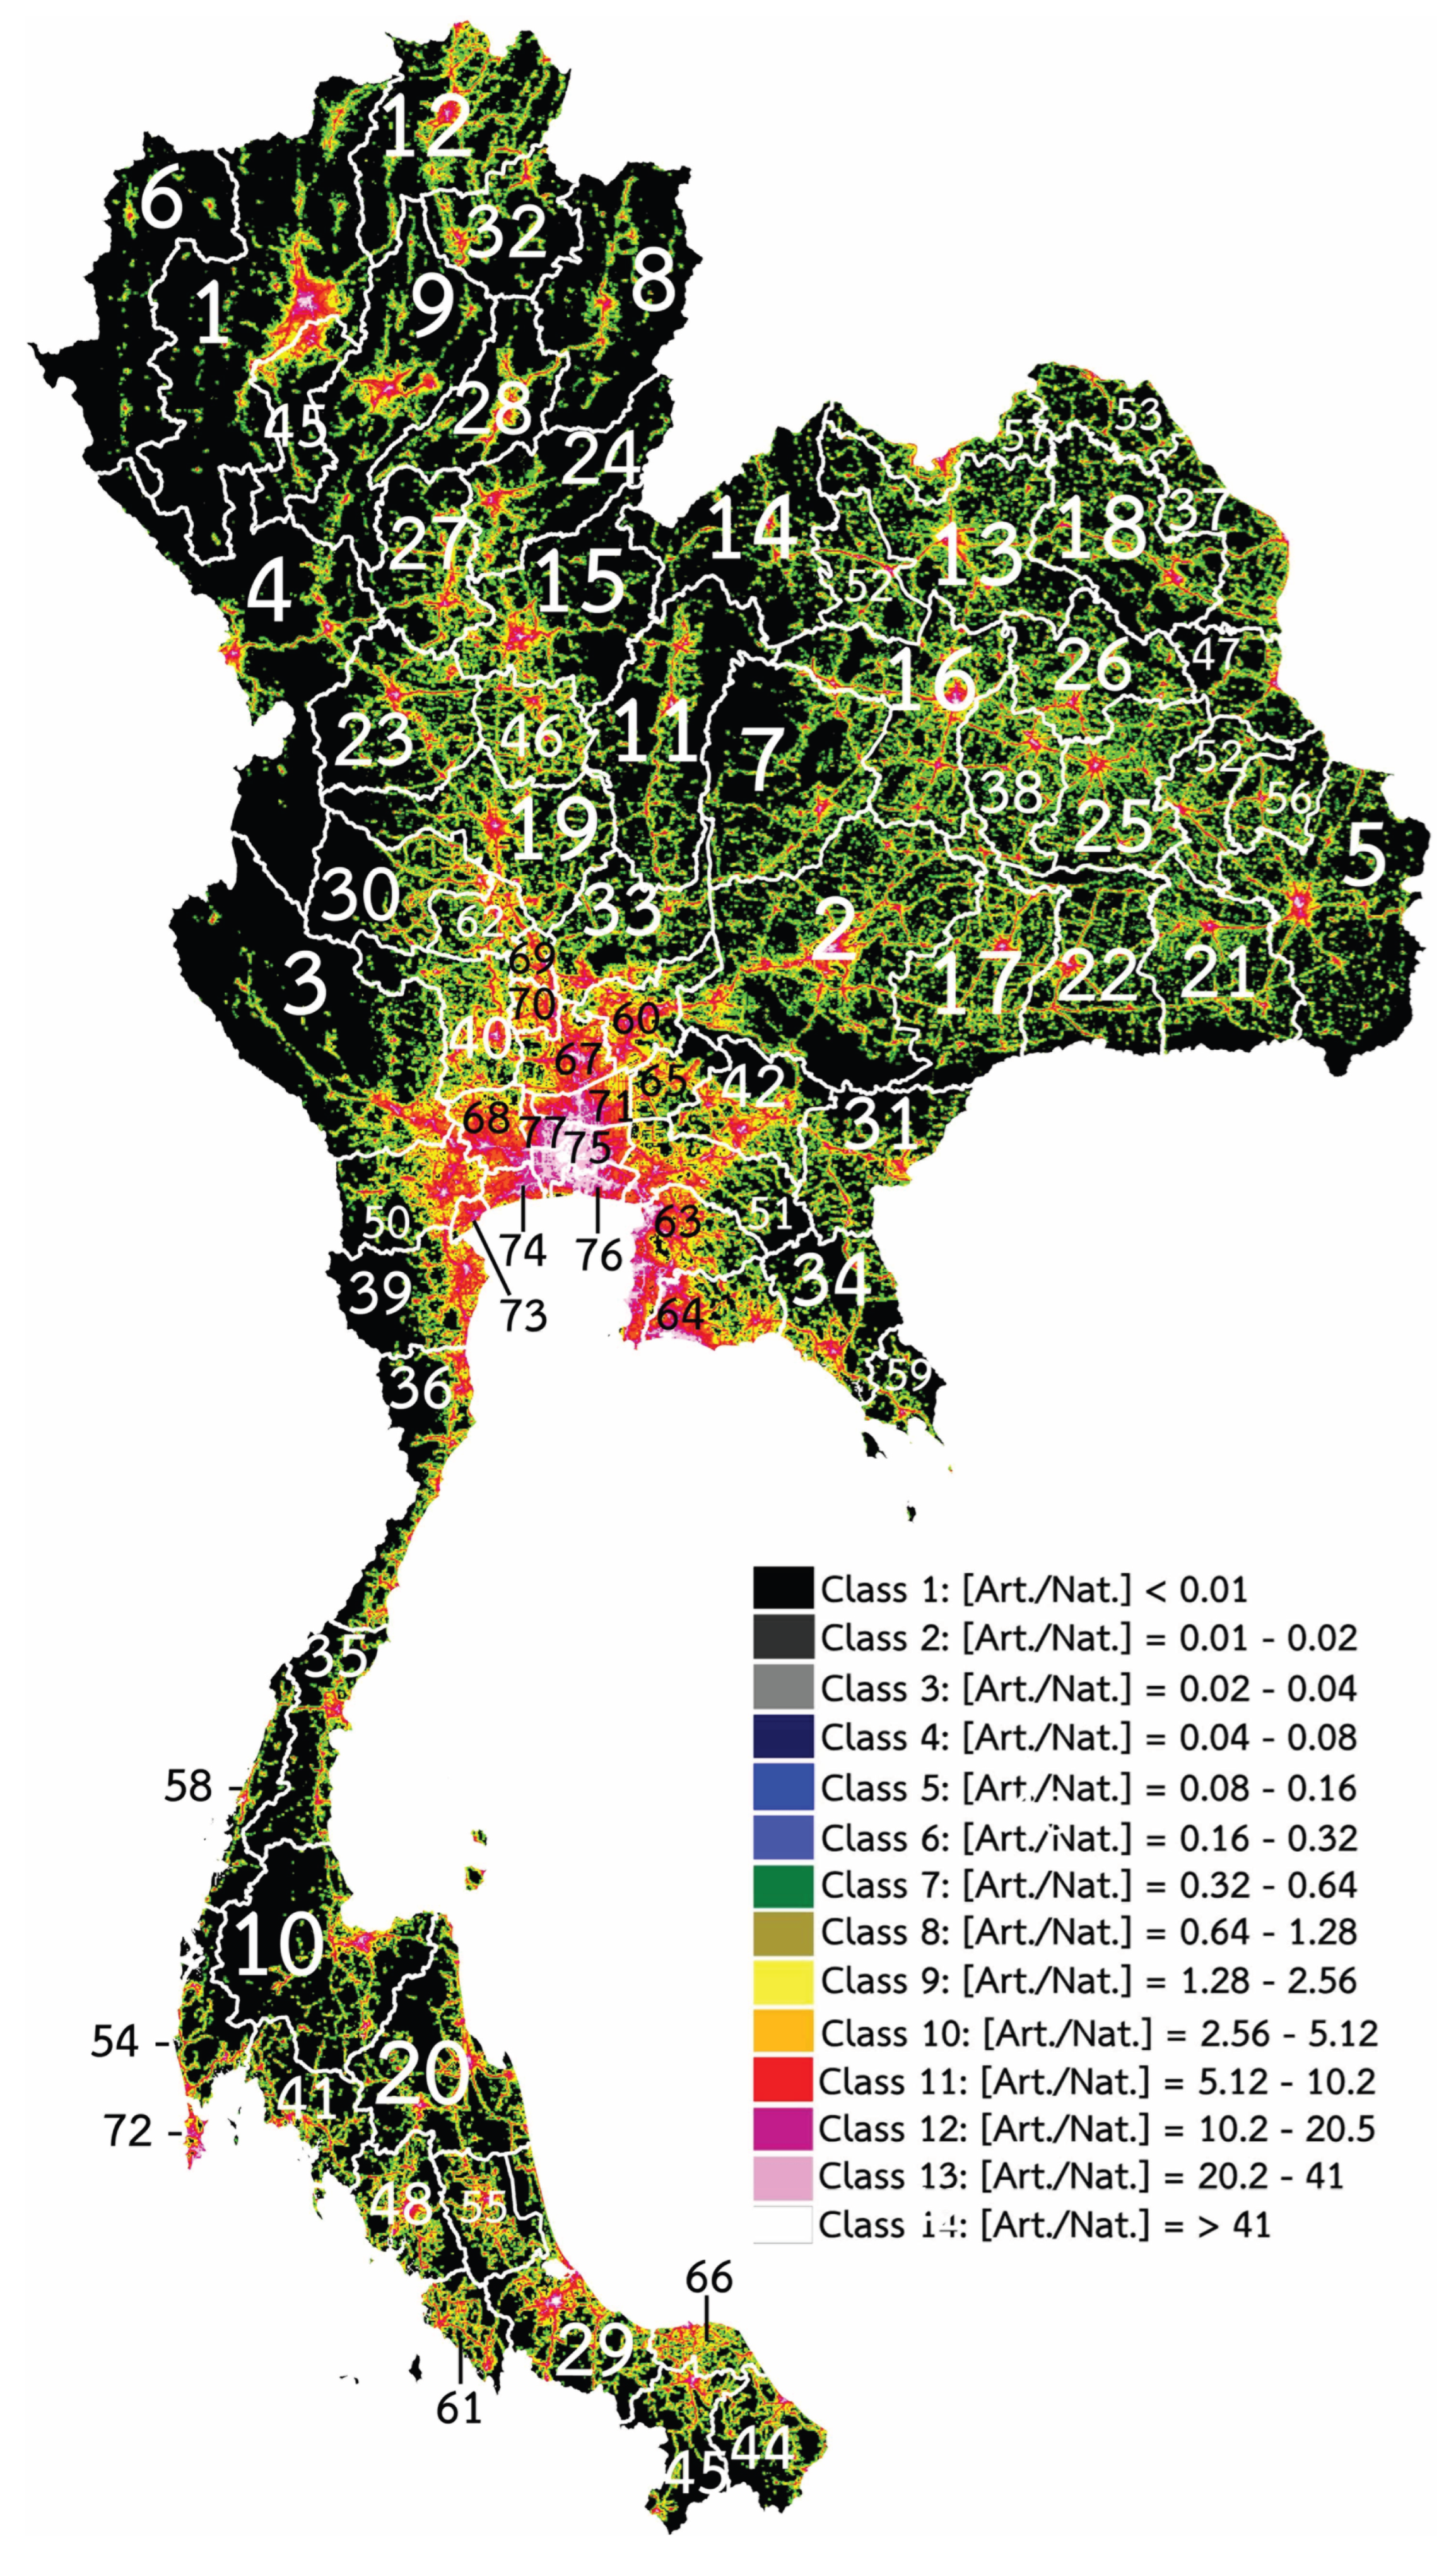
Figure 3.
Decision Tree model diagram.
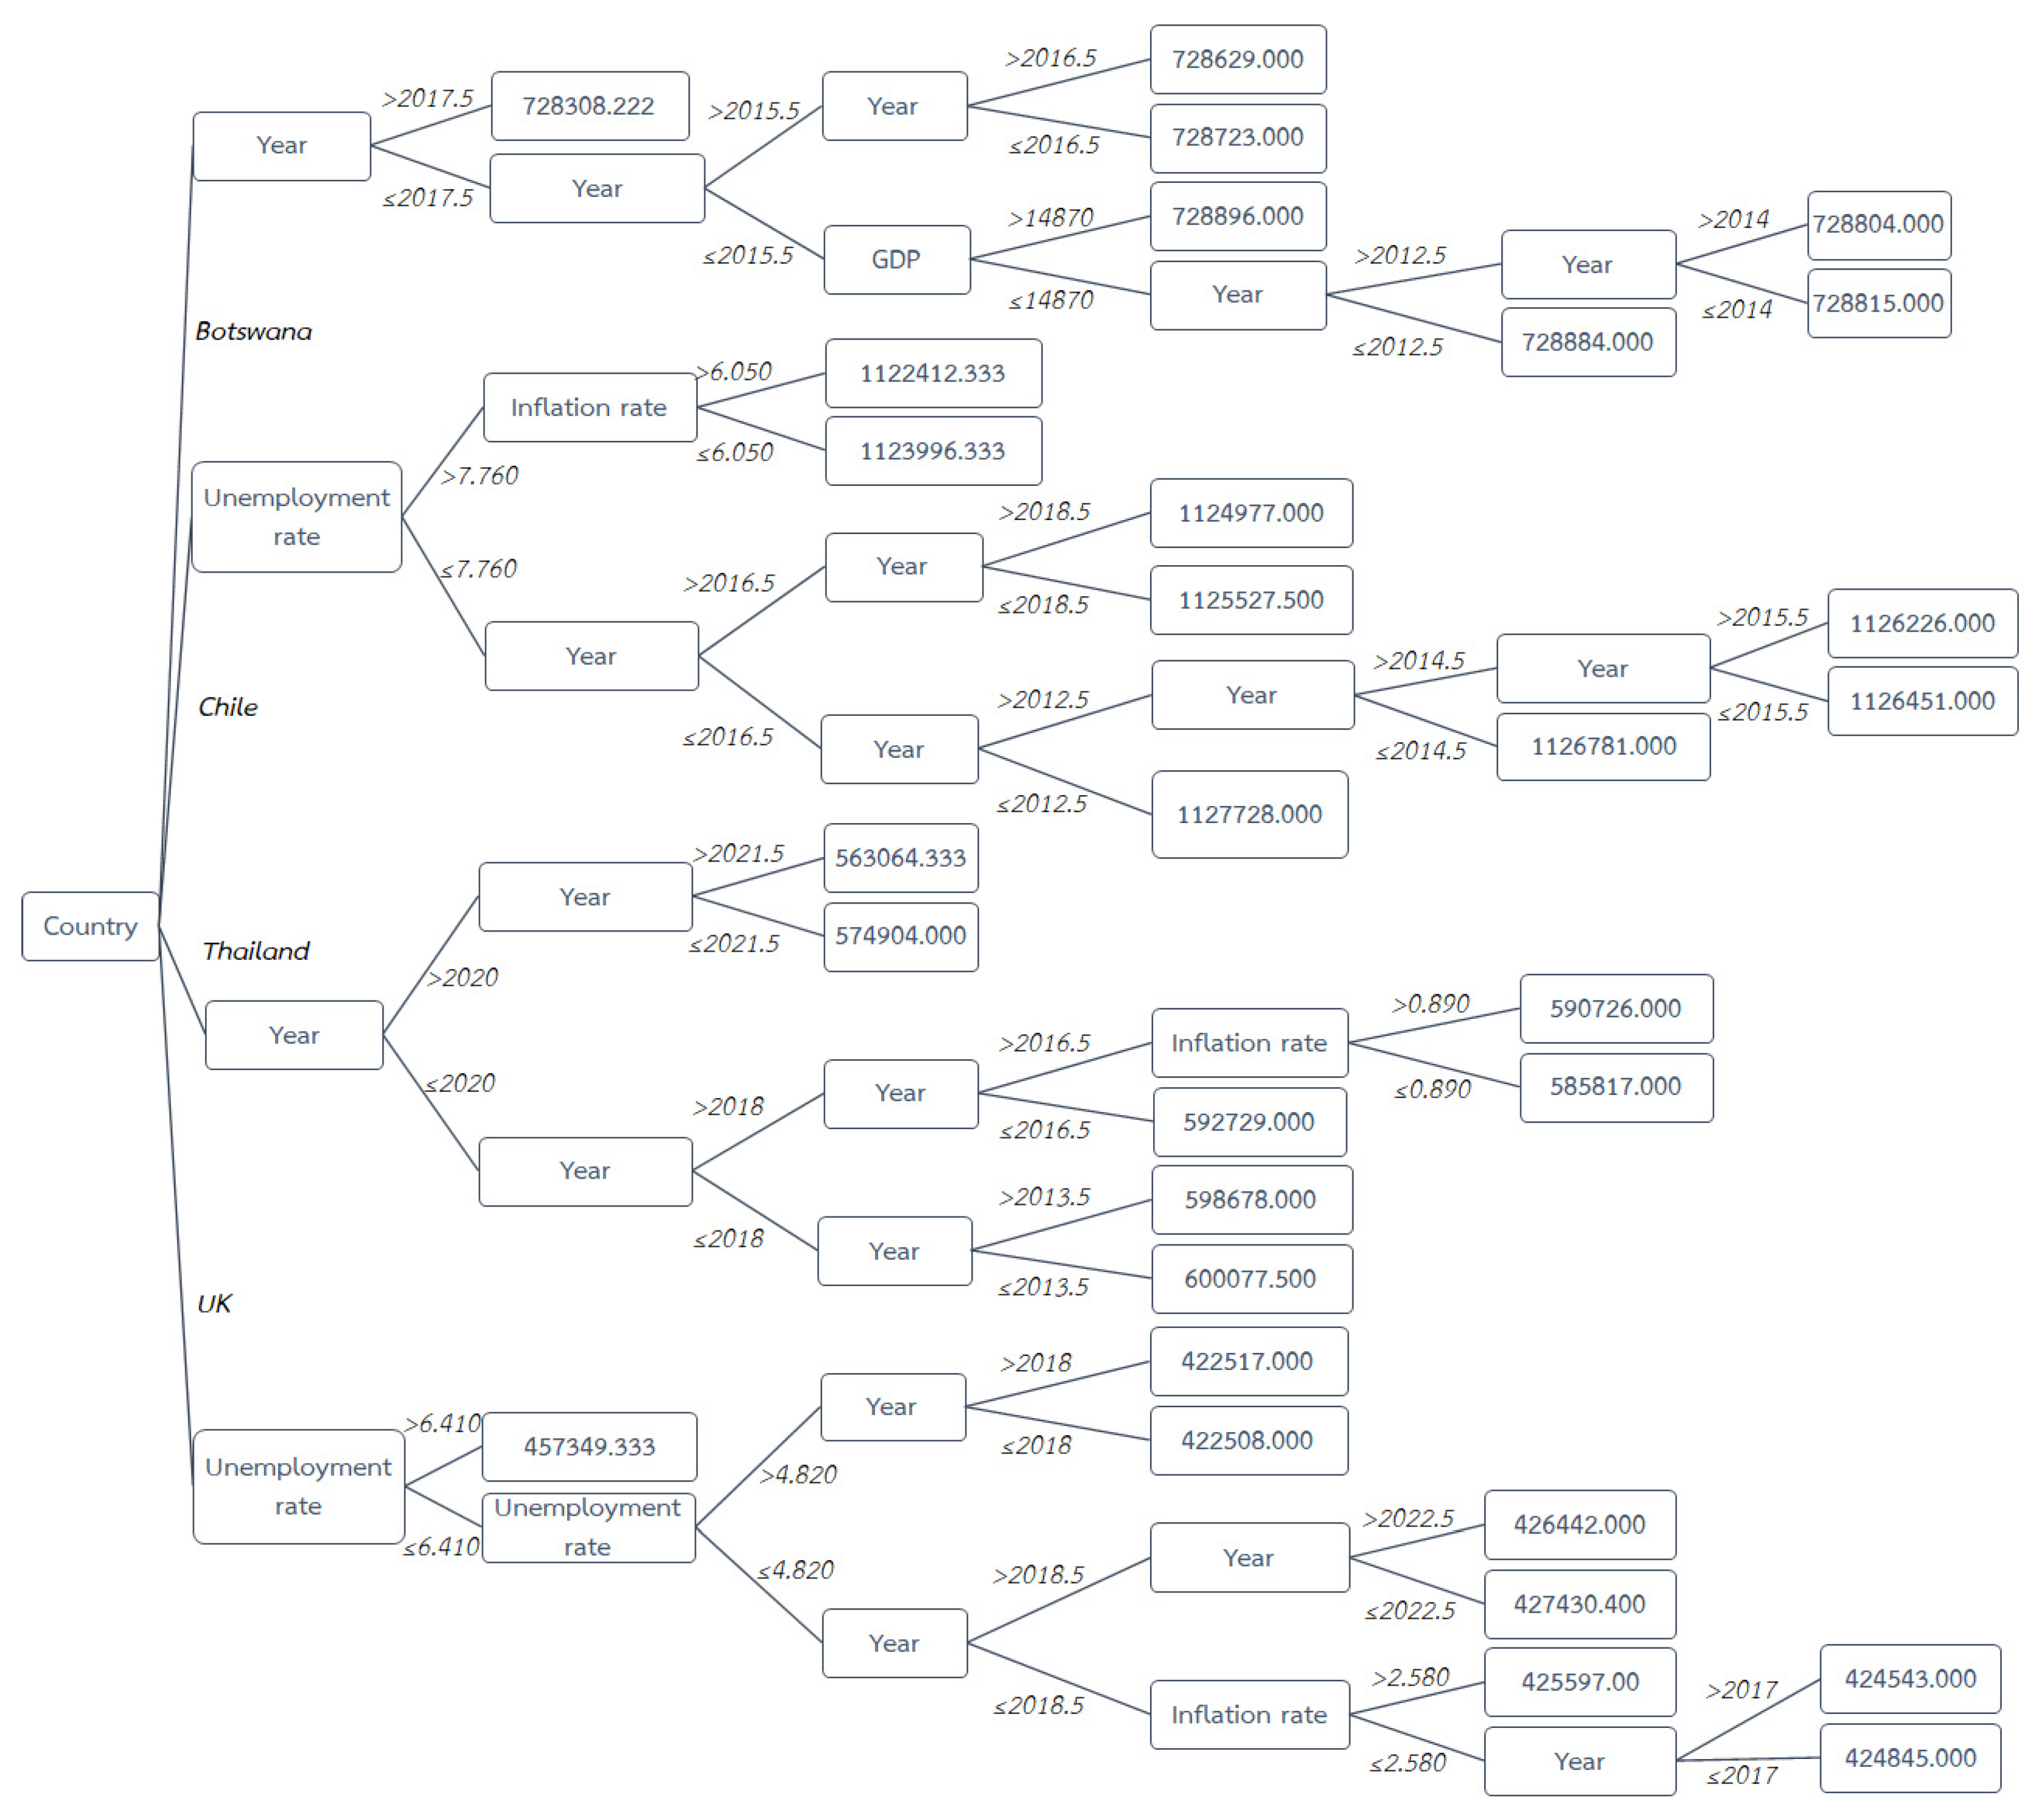
Figure 4.
Spatial changes in potential dark sky (class 1–9) from 2012 to 2023 in the four countries studied. Values are expressed as the percentage of area in sky classes 1–9 relative to the total area across all 14 sky classes. The figure was generated using public domain data extracted from NASA Earth Observatory by this paper. Generated from Elvidge et al. [7] under a CC BY license, with permission from the Earth Observation Group (EOG), original copyright 2017.
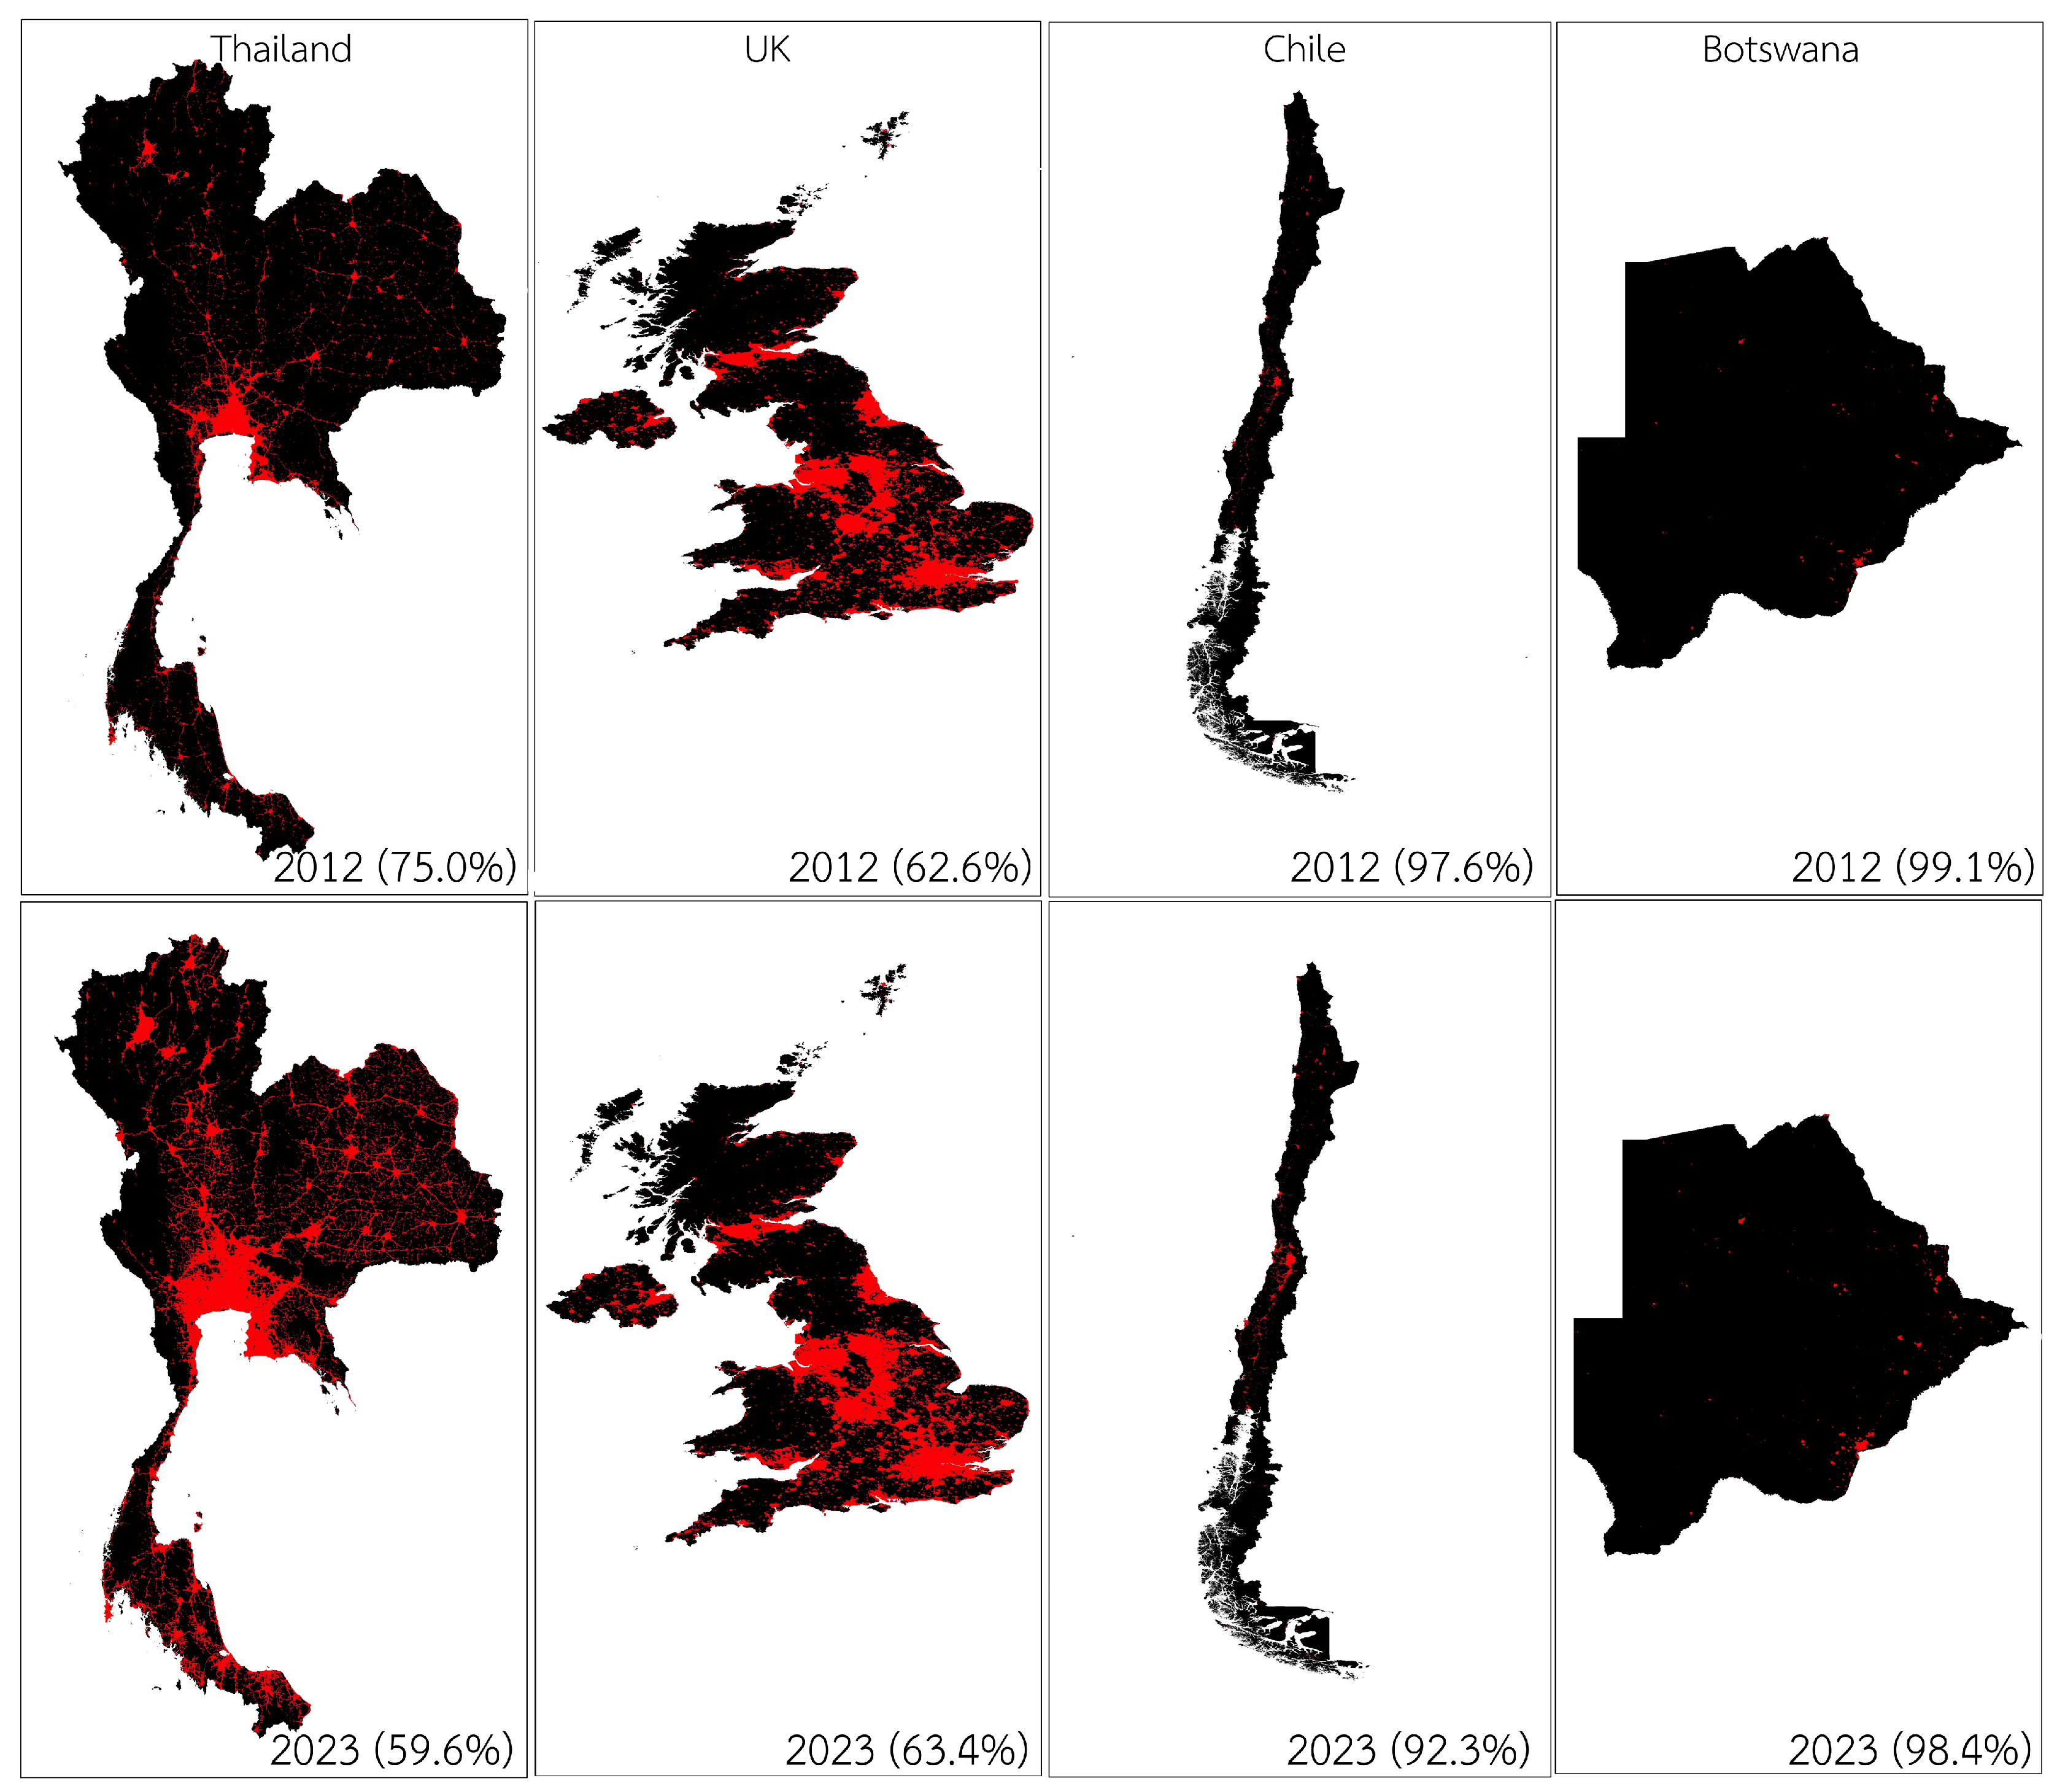
Figure 5.
Changes in the potential dark sky (class 1–9) area of four countries from 2012 to 2023.
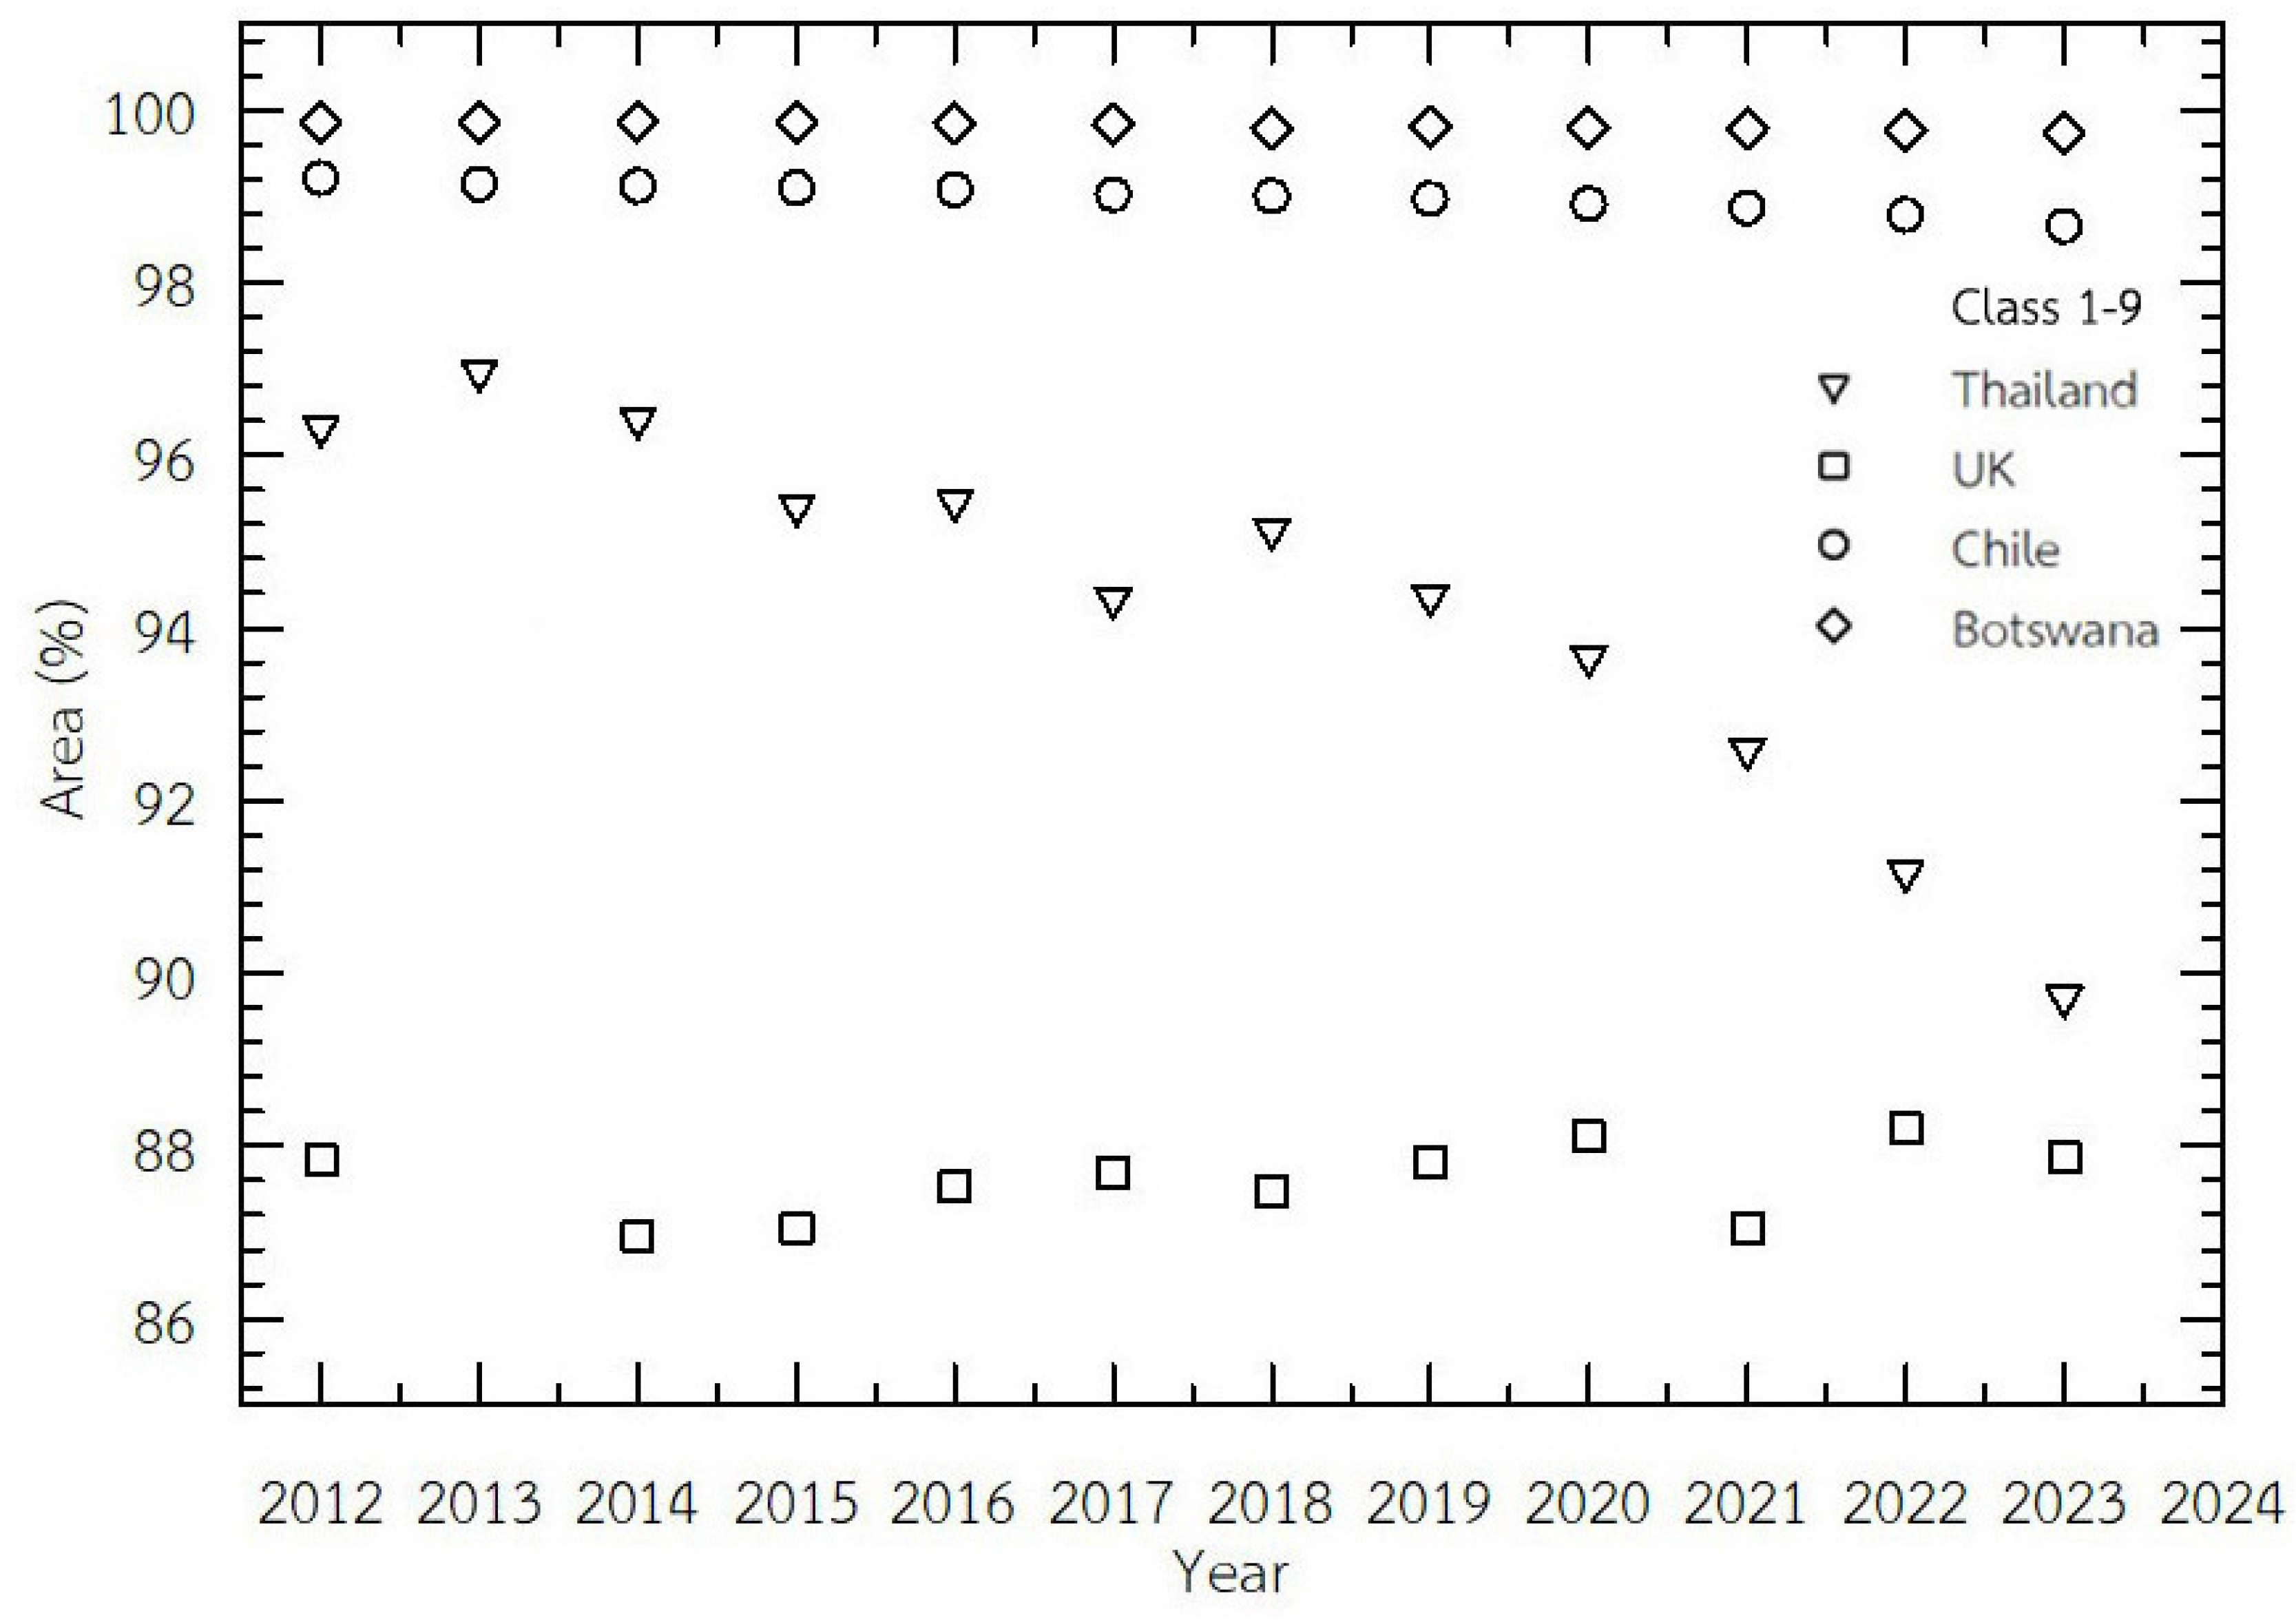
Table 1.
Sky brightness classification system used in this study, based on the 14-class framework introduced by Falchi et al. [4]. Classes are defined by the ratio of artificial light to natural night sky brightness. This scheme allows comparison with previous global studies and facilitates consistent tracking of sky degradation.
| Class | Colour | Ratio | Artificial brightness | Approximate total sky | Visual impacts |
| code | [Art./Nat.] | (cd m−2) | brightness(mcd m−2) | ||
| 1 | Black | <0.01 | <1.74 | <0.176 | Pristine sky |
| 2 | Dark gray | 0.01-0.02 | 1.74–3.48 | 0.176–0.177 | Degraded near horizon |
| 3 | Gray | 0.02-0.04 | 3.48–6.96 | 0.177–0.181 | Degraded near horizon |
| 4 | Dark blue | 0.04-0.08 | 6.96–13.9 | 0.181–0.188 | Degraded near horizon |
| 5 | Blue | 0.08-0.16 | 13.9–27.8 | 0.188–0.202 | Degraded to zenith |
| 6 | Light blue | 0.16-0.32 | 27.8–55.7 | 0.202–0.230 | Degraded to zenith |
| 7 | Dark green | 0.32-0.64 | 55.7–111 | 0.230–0.285 | Degraded to zenith - Natural sky lost |
| 8 | Green | 0.64-1.28 | 111–223 | 0.285–0.397 | Natural sky lost |
| 9 | Yellow | 1.28-2.56 | 223–445 | 0.397–0.619 | Natural sky lost |
| 10 | Orange | 2.56-5.12 | 445–890 | 0.619–1.065 | Natural sky lost - Milky Way lost |
| 11 | Red | 5.12-10.2 | 890–1780 | 1.07–1.96 | Milky Way lost |
| 12 | Magenta | 10.2-20.5 | 1780–3560 | 1.96–3.74 | Milky Way lost - Cone stimulation |
| 13 | Pink | 20.5-41 | 3560–7130 | 3.74–7.30 | Cone stimulation |
| 14 | White | >41 | >7130 | >7.30 | Cone stimulation |
Table 2.
Percentages of areas of all Thailand’s 77 provinces under specified artificial sky brightness classes.
Table 2.
Percentages of areas of all Thailand’s 77 provinces under specified artificial sky brightness classes.
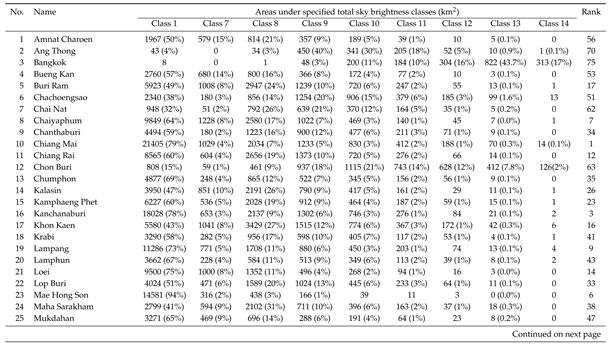
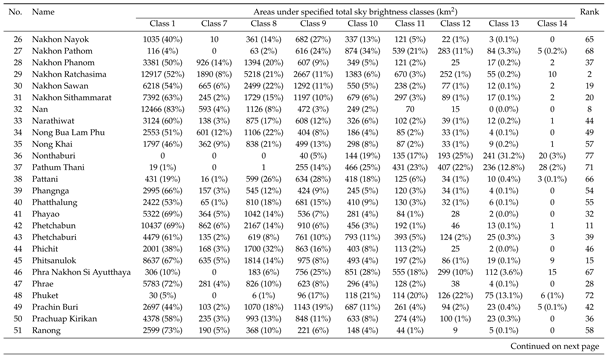
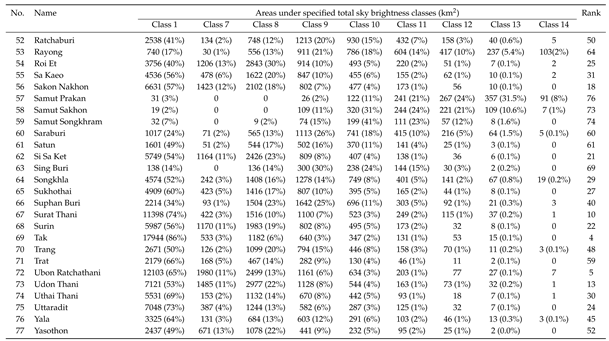
Table 3.
Changing in sky brightness during 2012–2023 over Thailand, the UK, Chile, and Botswana.
Disclaimer/Publisher’s Note: The statements, opinions and data contained in all publications are solely those of the individual author(s) and contributor(s) and not of MDPI and/or the editor(s). MDPI and/or the editor(s) disclaim responsibility for any injury to people or property resulting from any ideas, methods, instructions or products referred to in the content. |
© 2025 by the authors. Licensee MDPI, Basel, Switzerland. This article is an open access article distributed under the terms and conditions of the Creative Commons Attribution (CC BY) license (http://creativecommons.org/licenses/by/4.0/).
Copyright: This open access article is published under a Creative Commons CC BY 4.0 license, which permit the free download, distribution, and reuse, provided that the author and preprint are cited in any reuse.


