
Submitted:
08 September 2025
Posted:
09 September 2025
You are already at the latest version
Abstract
The article explores the multi-criteria approach to evaluating the results of the energy transition using the example of EU countries. It is substantiated that the process of change requires constant monitoring of results; however, this process is complicated by the significant number of indicators, many of which are subjective and do not always objectively reflect the effectiveness of the energy transition. For the technical analysis of energy transition results, the Data Envelopment Analysis (DEA) methodology was used, the main advantage of which is the ability to assess the impact of environmental factors on the results of changes, in this case, the EU countries. The analysis considers input factors, which include the resources required to achieve sustainable energy transition results, as well as output factors that define the results themselves, including the share of renewable energy sources, CO2 emission levels, and the level of innovation in environmental measures. Based on the comparison of calculated DEA efficiency scores and the Energy Transition Index (ETI), an efficiency matrix was constructed. This matrix allowed for the identification of four groups of countries based on the comparison of calculated DEA efficiency scores and the ETI. The use of the DEA methodology with Python software allowed for clarification of the difference between subjective assessments of the level of energy transition and objective results obtained based on efficiency indicators of resources allocated to the energy transition. The validation of results was obtained with decoupling score index (DS). Such approach not only allows for monitoring the state of energy changes but also assesses the potential of individual countries. The result obtained serves as an informative source for benchmarking to study best practices demonstrated by countries with high values of the Energy Transition Index and the effectiveness of this transition according to the DEA method.
Keywords:
energy transition
; DEA
; efficiency
; multi-criteria approach
; EU countries
; benchmarking
1. Introduction
The current energy transition policy is increasingly focused on decarbonization, reducing dependency on fossil fuels, and integrating renewable energy sources (RES) into national energy systems. This transition requires comprehensive solutions that address both technological and socio-economic aspects, including innovation, energy efficiency, infrastructure development, changes in consumer models, and institutional transformations. In this context, the relevance of systematic monitoring and evaluation of energy policy effectiveness increases, as it allows not only to measure the achieved progress but also to identify bottlenecks, development imbalances, and justify the need for adjusting strategic decisions.
Despite the vast amount of statistical data, research on efficiency in the energy transition faces several challenges. These include the multidimensionality and interdependence of indicators, the lack of a single integrated effectiveness metric, the heterogeneity of countries or regions based on initial conditions, as well as the difficulty of comparative analysis due to socio-economic and institutional differences. In this context, the application of Data Envelopment Analysis (DEA) is appropriate – a methodology based on the concept of comparative efficiency based on the ratio of resources (input) and results (output) [1]. DEA allows the assessment of the technical efficiency of entities (countries, regions, enterprises) that operate under similar conditions, without the need for prior determination of weight coefficients for each indicator.
Integrating DEA with other analytical approaches, such as the Energy Transition Index (ETI), enhances the accuracy of the assessment and provides a multidimensional view of progress in achieving energy goals. The ETI, proposed by the World Economic Forum, covers key elements of institutional, market, technological, and regulatory readiness for transition. It shows a 1.1% increase in the global average score compared to the previous year as of 2025, more than twice the average growth rate over the past three years [2]. This multi-criteria approach allows for the consideration of both qualitative and quantitative parameters, combining policy analysis with applied decision-support tools. As a result, it creates a foundation for building effective energy transition policies based on objective comparison, ranking, identifying leaders and followers, and developing targeted recommendations.
2. Materials and Methods
Research on Factors Affecting the Energy Transition
Research on the effectiveness of energy transition changes is an important tool for strategic planning, sustainable development policy formulation, and rational resource allocation. Such analysis allows not only to assess the achievements of countries in implementing energy reforms but also to identify systemic weaknesses, understand why some countries achieve significantly higher results with fewer resource costs. The relevance of studying the effectiveness of the energy transition is determined by several key factors. Firstly, this process is extremely resource-intensive and requires significant financial, technological, and human investments. Therefore, assessing efficiency helps to determine how rationally available resources are used [3,4]. Secondly, energy system development in Europe is uneven – countries start from different positions, have different institutional capacities, and varying access to technologies [5]. Thirdly, with the increasing accountability of governments and the need for evidence-based decision-making, efficiency becomes a criterion for policy quality [6]. Finally, to ensure sustainable progress, it is necessary to separate actions that genuinely cause positive shifts from superficial or declarative changes [7].
The study of the energy transition effectiveness is an essential tool for strategic planning, forming sustainable development policies, and rational resource use. Researchers [8] define resources as both material and immaterial elements that interact with humans and their environment. These include physical resources (e.g., natural resources and materials), as well as social, psychological, cultural, and intellectual resources that determine an individual or organization’s ability to achieve their goals, and can be mobilized through various processes, including exchange, use, and transformation of these resources to overcome external and internal demands and threats. Based on this generalization, we consider various resource factors, which will later be analysed within the framework of the DEA methodology for achieving the goals of the energy transition.
The study [9] emphasizes the strategic role of effective resource use, highlighting energy efficiency as a multidimensional concept that ensures competitiveness, reduces environmental harm, and supports the creation of sustainable jobs through optimal use of materials and production waste, particularly in resource-intensive industries. Article [10] discusses the importance of mobilizing materials for the energy transition, specifically through efficient resource use, and identifies four main paths for material mobilization: increasing primary production, redirecting existing production, repurposing used reserves, and re-mining waste and emissions. The interaction of these factors determines the maximum possible speed of material mobilization and the energy transition [11]. This issue is especially relevant for economies that consume a significant portion of natural resources and produce substantial CO2 emissions [12]. The publication [13] explores the influence of technological choices, investment needs, and socio-economic contexts related to setting the world on a trajectory toward a sustainable, resilient, and inclusive energy future. Authors in publication [14] discuss the importance of international law and organizations as institutional mechanisms for regulating energy decisions at the global level. Article [15] discusses alternatives to accelerate the energy transition in the Global South, focusing on three dimensions: technology, society, and policy, and highlights potential of these dimensions to support the transition, and examines the transformation of energy consumption through energy efficiency in the context of the global energy transition. Study [16] emphasizes the role of energy efficiency in reducing dependence on fossil fuels, decreasing energy imports, and mitigating negative environmental impacts, particularly regarding energy issues in Ukraine due to the conflict. Article [17] emphasizes the importance of a culture of energy-saving consumption as a necessary condition for modernity.
The impact of urbanization on the energy transition also deserves attention. Households' access to various forms of energy depends on the level of urbanization, which influences their energy consumption preferences. Studies [18] have shown that in sparsely populated areas, wood/biomass and natural gas reduce energy poverty, while in cities, electricity consumption is the key factor. Study [19] emphasizes the importance of localized approaches and long-term strategies to achieve a sustainable energy transition in cities. Thus, income levels significantly affect the effectiveness of the energy transition, as higher incomes provide more opportunities for implementing technical solutions and developing appropriate measures, while optimizing resource use is key to achieving maximum efficiency in the energy transition and reducing the environmental burden, particularly in low-income locations.
In addition to studying individual factors in the context of the energy transition, studies that comprehensively examine factors deserve attention. A multidimensional analysis of EU countries between 2000–2019 identified four energy transition profiles and showed that economic growth, trade indicators, innovation systems, and the design of policy measures significantly affected progress, while some developed economies, such as Germany and the Netherlands, lagged in achieving climate goals [20]. In study [21], it is emphasized that improving energy efficiency and achieving sustainable economic development requires favourable environmental conditions, fostering technological innovation, aligning with regional specifics, and enhancing collaboration in the field of ecological knowledge through targeted industrial and policy strategies.
Thus, publications highlight the key resource factors influencing the energy transition, among which we focus on the level of consumption of material resources, their reuse, energy efficiency, energy consumption, job potential, investments, the impact of urbanization, and income levels. Additionally, in the works of scientists, this list is supplemented with factors determining the energy transition, including new energy sources [22,23], shifts in the fuel source for energy production [24], a shift in the nature or pattern of how energy is utilized within a system [25], decarbonization [26,27,28].
Methods for Studying the Effectiveness of the Energy Transition
Various methods are used to study the impact of factors on the energy transition, including Analytical Hierarchy Process [29], clustering [30], statistical analysis of expert opinions [31], and fuzzy logic modelling [32]. Each of these methods has its advantages, but they may also have limitations, such as the subjectivity of assessments and weights or difficulty in working with large data sets. The DEA method stands out due to its objectivity, allowing for the comparison of multiple units simultaneously, considering various resources and performance outcomes. One of the key advantages of DEA is its ability to identify potential improvements and optimize resource usage, making it useful for decision-making in competitive environments with changing parameters. Thus, DEA is a relevant tool for environmental analysis, ensuring high accuracy and objectivity when assessing effectiveness in different contexts. Researchers consider the DEA method suitable for studying the efficiency of resource utilization to achieve goals. As shown in Xu et al.'s study (2020), DEA is widely used to assess energy efficiency as a method for evaluating overall factor efficiency, considering the changing technical condition and structure of sectors [33]. A systematic review of the literature on the use of DEA in energy and environmental studies highlights its ability to identify systemic weaknesses and potential for improving the performance of countries through comparative analysis of DMUs [34]. The study [35] demonstrated the importance of integrating DEA with additional tools for more precise strategic analysis at the national level. Research [36] is dedicated to the application of DEA for analysing the effectiveness of renewable energy in developed countries and the role of green finance in promoting sustainable energy usage. The DEA method was used to analyse energy efficiency in 30 provinces of China, revealing regional differences and the need for targeted sustainable development policies [37]. Based on a comprehensive review of DEA applications in energy efficiency studies, key measurement variables have been highlighted, models and practical scenarios expanded, and limitations, such as dependency on structured and clearly defined data, have been identified, with suggestions for future methodological developments [38].
To improve the results of applying the DEA methodology, researchers have combined it with other methods. Authors in [39] proposed a hybrid methodology combining DEA Window analysis and Fuzzy TOPSIS to assess the renewable energy production potential of 42 countries, based on population size, energy usage, power capacity, and broader sustainable development criteria, offering a strategic tool for guiding policies and investments in clean energy. In study [40], interval DEA and a super-efficiency model were presented for evaluating sustainable tourism, effective processing of data uncertainty, and identifying inefficiencies and improvement goals in DMUs using interval input data and greenhouse gas emissions as undesirable outcomes. Study [41] introduces a new DEA model that enables sequential comparison of the efficiency of all management units and subunits, ensures linearity, and avoids assumptions regarding multiplicative or hierarchical efficiency decomposition, enhancing its applicability to complex systems. Authors in the article [42]. consider the combination of the DEA and MCDA techniques for solving problems related to efficiency and productivity
Combining DEA and ETI for Energy Transition Effectiveness Evaluation
Evaluating the effectiveness of the energy transition requires considering both institutional preconditions and the actual results of energy system transformations. As the analysis of barriers prevalent in both developed and developing countries shows [43], obstacles to energy transition include not only financial and infrastructural challenges but also socio-institutional and regulatory aspects. In this context, it is beneficial to combine the index approach (ETI) with the tool for assessing actual effectiveness (DEA) for a comprehensive analysis of the situation. Specifically, ETI allows for the quantitative evaluation of governance quality, policy stability, access to capital, availability of infrastructure, and the level of human capital – factors that are typically beyond the scope of productivity models. However, the drawbacks of the ETI index include subjectivity in forming the aggregate indicator and the failure to account for resource usage efficiency, as ETI is more about potential rather than productivity [44].
The importance of institutional support for energy transition has been discussed in a few publications. In particular, the article [45] states that integrating transition studies with policy provides a comprehensive foundation for managing energy transformations, emphasizing public involvement in governance, reflexive political mechanisms, and innovation ecosystems. Using Germany's energy transition (Energiewende) as an example, the study demonstrates how inclusive multi-level governance fosters legitimacy, adaptability, and stakeholder engagement, ensuring socially just and sustainable transition processes. The study [46] highlights that a successful and fair energy transformation depends on multi-dimensional policies, identifying five main thematic areas – institutional, ecological, financial, socio-cultural, and technical — which together form the development of renewable energy. A systematic review in the source [47] identifies four key categories — economic, technological, social, and political – as foundational for accelerating the transition to low-carbon energy, with researchers emphasizing the critical role of environmental policy and stakeholder participation, while noting the limited attention to developing countries and low-income nations in existing studies. In the article [48], explicit and implicit aspects of the energy transition are distinguished: explicit aspects include observable changes in energy consumption and infrastructure, while implicit aspects involve deeper transformations such as governance, technologies, and geopolitical dynamics. By highlighting the interconnection of energy with social, economic, and ecological systems, the study emphasizes the need for future research to examine multi-scale consequences and support a fair and sustainable transition. In the study [49], advanced bibliometric and systematic analysis methods are applied to emphasize the importance of the scientific landscape of the transition to renewable energy sources, focusing on key economic, political, managerial, social, and climate aspects.
Thus, the institutional component is an essential factor of the energy transition, which is systematically addressed in the ETI methodology. At the same time, DEA enables the assessment of actual effectiveness in transforming resources (including investments, energy consumption, and human potential) into desired results — such as increasing the share of renewable energy, reducing emissions, and fostering innovative economic growth. DEA accounts for the heterogeneity of factors and identifies countries that, with the same or fewer resources, achieve better results, which is particularly important in regions with high costs or weak institutional support. ETI and DEA play complementary roles: the former diagnoses institutional capability, while the latter determines real effectiveness. Combining both approaches allows not only the identification of barriers that slow progress but also the identification of benchmark countries capable of optimizing policies and resources. This opens opportunities for forming comprehensive, strategically grounded decisions in the energy transition that consider both conditions and outcomes.
Therefore, the aim of this article is to form and test the conceptual foundations for studying the factors influencing energy transition effectiveness based on the multi-criteria approach, considering the application of the DEA method and its integration with ETI for benchmarking the research results. The authors aim to propose a methodological framework that allows for an objective assessment of the effectiveness of countries or regions in implementing energy transformation, considering both quantitative and qualitative criteria. The research tasks include: considering a multi-criteria approach for choosing factors of energy transition results study; developing and adapting a DEA model to assess the effectiveness of energy transformation in EU countries; comparing the results with other existing rankings (e.g., ETI); and forming an efficiency matrix for conducting benchmarking and identifying the potential of countries for energy transition.
Methodology and Data
To achieve the article's goal, the use of the DEA methodology is proposed. The necessity of applying DEA in energy transition studies is supported by a growing body of academic literature that emphasizes the importance of multidimensional evaluation frameworks. Prior studies have shown that energy transition is influenced not only by technological capacity and resource availability but also by governance quality, socio-economic structure, and innovation potential. DEA provides an empirical basis to incorporate these multiple factors into a unified evaluation model. A key strength of the DEA method lies in its ability to rank the evaluated DMUs. It autonomously determines the appropriate weights for the analysis and allows for the direct use of raw data. Furthermore, combining DEA with complementary indices like ETI allows researchers to overcome the limitations of one-dimensional rankings and better reflect the complexity of real-world transition dynamics.
The methodological framework of this study is based on the integration of DEA into a multicriteria assessment model to evaluate the effectiveness of national energy transition efforts across European countries. The research applies a non-parametric, input-oriented DEA model under the assumption of variable returns to scale (CCR model), enabling the comparison of countries (DMUs) in terms of how efficiently they convert multiple energy, economic, and environmental resources into desired outcomes.
The analysis is based on a panel of 27 European countries for which relevant quantitative indicators were collected from Eurostat databases. Variables were selected to reflect both the resource inputs and performance outputs of the energy transition process. The DEA model uses the following indicators:
Outputs (Desirable Results):
In the DEA model, three key indicators have been selected as output variables to reflect the results of the energy transition. The share of renewable energy sources (y1) represents the level of ecological transformation in the energy balance. The CO₂ Emissions in comparison with economic growth are presented by the decoupling Score (DS) indicator (y2). Decoupling of GHG emissions from GDP growth in the article is determined with the Tapio decoupling index (ε), which is a quantitative measure designed to evaluate the relationship between economic growth and environmental impact, particularly carbon emissions (formula 1).
, (1)
where e – g – .
The index ε is derived from the elasticity concept, which, in this context, represents the responsiveness of carbon emissions to changes in GDP. It characterizes the success of decarbonization measures and measures the country's ability to reduce CO₂ emissions while maintaining economic growth and reflects how successfully technologies that reduce environmental impact are being implemented, contributing to the sustainable development of the economy. The higher this coefficient, the more effectively the country implements decarbonization and energy transformation strategies [50].
Decoupling Index can take different values. For example, the literature discusses eight types of it [51]. In this study, we consider four cases that reflect different combinations of changes in GDP (g) and emissions (e). Taking these into account allows us to distinguish the following types of decoupling:
Absolute decoupling (g>0, e≤0): we assign DS=1 — this is the strategically best state: the economy is growing, emissions are decreasing;
The worst case (g≤0, e≥0): we assign DS=0— recession is accompanied by an increase in GHGs;
Relative decoupling (g>0, e>0) – GHGs and GDP are growing, we assign DS, calculated with the formula:
, (2)
The meaning of this calculation is that ε, which shows how fast emissions grow relative to economic growth, determines better decoupling at lower ε and worse at higher ε.
Both indicators fall (g<0, e<0): we assign DS, calculated with the formula:
, (3)
The content of the calculation is to determine the share of the “total reduction” that is due to the reduction of GHGs. The goal is to show the fall in emissions, but not to equate the case with the best-case scenario, if the reduction is achieved at the cost of recession. If GHGs fall more strongly than GDP → the share is closer to 1. If the economy falls more strongly than GHGs → the share is closer to 0. The coefficient k=0.6, κ∈ (0,1) guarantees that even with a large reduction in GHGs in a recession, it will not exceed the fall in GDP.
Thus, for DS calculation, we use formula 4:
, (4)
The proposed Decoupling Score normalizes Tapio’s elasticity to the [0,1] interval and provides a ‘higher = better’ interpretation. Under relative decoupling, smaller values of ε (GHG grows more slowly than GDP) yield a DS that approaches 1. When GDP and GHG both decline, DS increases with the larger contribution of GHG reduction to the total decline but is capped at κ=0.6 so that recession scenarios do not outweigh cases with economic growth. Thus, the indicator aligns with the policy logic of promoting decoupling and does not ‘over-reward’ emission cuts achieved at the expense of economic contraction.
EIS (Energy Intensity Score) is an indicator used within the DEA method. It assesses the innovation potential of countries in the energy sector and is designed to help countries evaluate their achievements in innovations related to energy technologies and the transition to a low-carbon economy. EIS is considered a reliable and comprehensive source for analysing innovation potential, making it ideal for studies on technological innovations and regional development [52]. In the context of DEA, EIS is an output indicator (y3), which allows for the assessment of countries' ability to develop and implement new energy technologies, including renewable energy sources, energy efficiency, and CO2 emissions reduction.
Inputs (Resources Used) are Presented By Indicators:
- x1: Energy import dependency rate (%) – high values indicate vulnerability to external energy supply;
- x2: Share of fossil fuels in total energy supply (%) – a key indicator of carbon-based dependency;
- x3: Investments in climate change mitigation (million EUR) – resources consumed to promote sustainability;
- x4: Job vacancy rate in professional, scientific, and technical fields (%) – proxy for innovation capacity and human capital demand;
- x5: Income by degree of urbanization (million EUR) – considered a resource associated with urban energy consumption and infrastructure capacity;
- x6: Energy consumption per capita – reflects intensity of resource use; lower values imply greater efficiency.
The goal of DEA is to achieve the goal of maximizing the efficiency ratio – that is, how proportionally can output be increased without reducing the level of input resources [1]. Objective of the task – Maximize θ – DEA efficiency ratio. The task is based on the following constraints:
input constraints: weighted sum of inputs for all DMUs is less than or equal to the input for the evaluated DMU:
, (5)
output constraints: weighted sum of outputs for all DMUs is greater than or equal to θ times the output for the evaluated DMU):
, (6)
Non-negativity of weights:
(7)
Variables:
λj – Weights for other DMUs;
θ – Output scaling coefficient (DEA efficiency ratio);
Notation Explanation:
xij – i-th input for j-th DMU;
yrj – r-th output for j-th DMU;
xio,yro – Input/output for the evaluated DMU;
n – Number of countries (DMUs);
m – Number of inputs;
s – Number of outputs.
This formulation is an output-oriented CCR. Output-oriented because the objective is to maximize output (θ) while keeping inputs constant. The CCR model, named after its developers (Charnes, Cooper, Rhodes), is the basic DEA model. It always assumes constant returns to scale (Constant Returns to Scale, CRS). There is no convexity constraint (∑λj=1), implying constant returns to scale, which means: the CCR model is designed to assess efficiency assuming that efficiency is independent of the scale of operations; the absence of an additional constraint that the sum of the weights (λj) is equal to one is a mathematical reflection of this assumption of constant returns to scale. This allows the model to compare DMUs of different sizes without considering scale effects, if the optimal scale does not matter for achieving efficiency; in practice, this makes the CCR model more rigid and may lead to fewer efficient units, since to achieve efficiency a DMU must be efficient in an absolute sense, regardless of its scale.
In the DEA model, all inputs are treated as resources consumed in the process of achieving energy transition outcomes. Import dependency (x1) and the share of fossil fuels (x2) indicate the level of vulnerability and carbon dependence of the energy system. Investments in climate initiatives (x3), vacancies in the scientific and technical sphere (x4), and income by urbanization level (x5) are interpreted as socio-economic resources that form the potential for transformation, but if used irrationally, may indicate low efficiency. Energy consumption per capita (x6) reflects the overall energy intensity of the economy. Though some variables, such as investments or technical job vacancies, might appear as stimulators of progress, within the DEA logic, they are treated as inputs (i.e., resources consumed) and thus classified as de-stimulators to align with the model's efficiency interpretation.
All variables were normalized to ensure comparability and avoid scale distortions, using min-max normalization where necessary. The DEA model was implemented in Python, offering transparency, flexibility, and scalability. Python allows the researcher to fully control the construction of the DEA model, adjust parameters, integrate weighting mechanisms if needed, and replicate results efficiently.
Accordingly, considering these indicators as resource provision for the energy transition, we will normalize them using the formula of linear transformation of disincentives:
, (8)
where:
- xij – actual value of the disincentive for object i by indicator j;
- , – respectively, the largest and smallest value of the indicator among all objects;
- xijnorm∈[0;1] – a normalized value where lower values of the disincentive are converted to higher values on the efficiency scale (i.e. values closer to 1 are better).
In the DEA model, all output indicators are interpreted as the results of the efforts expended. Together, these indicators provide a comprehensive assessment of the effectiveness of the use of energy resources and are characterized as stimulants. The formula for their normalization is as follows:
, (9)
Thus, all variables – both input and output – are reduced to a single scale within [0;1], which allows for the correct application of DEA analysis without distorting the results due to different scales, units of measurement or directions of influence. This approach ensures metric consistency, analytical transparency and interpretative unambiguity in comparing countries in terms of their energy efficiency. This transformation allows for the preservation of the evaluation logic, according to which high values of stimulants and low values of disincentives are interpreted as a sign of greater efficiency.
DEA method for assessing relative efficiency considering a set of input and output variables. DEA allows for the comparison of countries as Decision Making Units (DMUs) operating under the same external circumstances, but with different resources and outcomes. To ensure the reliability of the results, an empirical rule regarding the minimum number of DMUs required for the correct construction of the model was followed. According to it:
(10)
where: m – the number of input variables; s – the number of output variables.
This ratio ensures that the model will have sufficient statistical power to distinguish between efficient and inefficient countries. For example, when using 6 input and 3 output variables, the required number of countries (DMUs) is at least:
Thus, for a model that includes 6 input and 3 output variables, at least 27 countries were included in the study to ensure the statistical validity of the constructed efficiency.
In this study, the Python programming language was used to implement DEA, which provides full transparency, flexibility and reproducibility of calculations. Thanks to the open source and wide capabilities of Python, the researcher can adapt the model to the specifics of the input and output variables, add weight constraints, scale calculations to large samples, and integrate DEA with other analysis methods (clustering, regression, visualization, etc.). This ensures not only the accuracy and reliability of the results but also allows us to consider the complexity and multidimensionality of energy transition processes.
To enhance interpretability and address multidimensionality, DEA results were combined with the Energy Transition Index (ETI), a composite indicator provided by the World Economic Forum that captures broader institutional, technological, and market readiness dimensions. A correlation analysis between DEA efficiency scores and ETI rankings was performed, revealing a relationship, which justifies the development of a two-dimensional efficiency matrix (DEA Score vs. ETI Rank).
The Efficiency Matrix for Strategic Positioning enables the classification of countries into strategic quadrants, supporting more nuanced policy recommendations. This approach is widely accepted and for this research it allows classifying countries by their strategic behavior in the energy transition; identifying asymmetry between the level of institutional readiness and the actual results of energy reforms; identifying benchmark countries – those that achieve high efficiency even under unfavorable conditions; and identifying potential reserves in countries that, despite a high ranking position, demonstrate lower performance in utilizing available opportunities. Together, these indicators allow us to assess how effectively countries use available resources to achieve the desired results of sustainable development.
To determine the presence of a statistical relationship between the ETI and the efficiency indicator according to the DEA model, the Pearson correlation coefficient was calculated using the classical formula:
(11)
where: xi – DEA Efficiency Score value for country i;
yi – ETI value for country i;
xˉ, yˉ – average values of DEA and ETI, respectively.
For a better understanding of the research methodology, its graphic visualization is offered in Figure 1.
3. Results
Based on the results of the literature review, we identified groups of input and output indicators, which are examined within the DEA methodology in this study. The description and characteristics of each indicator are provided in Table A1 and Table A2 of the Appendix, located at the end of the article. The input indicators x1-x6 were obtained from the official Eurostat website. As for the output indicators, for y1 and y3, the sources of information were also obtained from the Eurostat website. The y2 indicator was calculated, and its calculation was based on formula 4. The results of the calculation are presented in Table 1.
The results analysis obtained allow us to conclude that the countries have different progress in energy transition:
1) Absolute decoupling (best case, DS = 1.000) was achieved in Estonia, Luxembourg, Finland, and Sweden, which expanded their economies while reducing emissions. In these cases, growth and mitigation coexisted, indicating that efficiency gains, fuel switching, clean power supply, or structural shifts outweighed any emission pressures from added output. These countries provide the benchmark pattern the EU ultimately seeks to scale.
2) Relative decoupling (mixed case, 0< DS <1) demonstrates a tendency – GDP↑, GHG↑, and indicates the economy grows, and emissions still increase, but the DS tells us how strongly growth outpaces emissions:— stronger relative decoupling (DS ≥ 0.60): France (0.751), Ireland (0.750), Poland (0.714), Malta (0.619), Denmark (0.604), Romania (0.602). These profiles show meaningful mitigation pressure within growth: emissions are rising more slowly than GDP, suggesting that efficiency policies, renewable deployment, or cleaner sectoral composition are taking hold;— moderate (0.50 ≤ DS < 0.60): Spain (0.569), Portugal (0.552), Bulgaria (0.505). Progress is visible but narrower; incremental improvements could tip these cases into the stronger bracket;— weak (DS < 0.50): Czechia (0.448), Slovakia (0.398), Croatia (0.390), Cyprus (0.374), Netherlands (0.316), Lithuania (0.270), Greece (0.250), Italy (0.195), Belgium (0.176), Slovenia (0.138), Hungary (0.078). In these economies, emissions rose nearly as fast as—or faster than—GDP. That pattern signals either carbon-intensive growth, delayed clean-energy uptake, or rebound effects outweighing efficiency gains. Within this set, the lowest DS values correspond to ε > 1 (emissions growing faster than GDP), which is the red flag to address first.
3) Green recession (both falling, capped DS ≈ 0.46–0.47) follows a tendency – GDP↓, GHG↓, and was achieved in Latvia (0.467) and Austria (0.464) reduced emissions alongside economic contraction. The score recognizes that a larger share of the joint decline comes from falling emissions, but applies an explicit cap so that recession-driven cuts do not outrank countries achieving reductions with growth. Policy-wise, the priority is to convert these short-run declines into structural improvements (efficiency, fuel switching, clean heat/power) that persist when growth resumes.
4) Worst case (DS = 0) with a tendency – DP↓, GHG↑, was achieved in Germany, which is the sole instance where the economy shrank while emissions increased. By design, DS = 0 flags this as the least desirable combination, typically pointing to adverse shocks in low-carbon supply, weather-driven demand spikes, or sector-specific setbacks that raise emissions intensity in a downturn. The remedy is targeted, sectoral—e.g., stabilizing clean generation and heat, removing bottlenecks for electrification, and cushioning efficiency investment during slowdowns.
In general, it can be concluded that in some countries, economic growth is not accompanied by adequate reductions in greenhouse gas emissions, which may signal the need to strengthen environmental policies and seek more effective pathways for energy transition.
Thus, Table 2 contains all the indicators used for the analysis of energy transition efficiency using the DEA method.
Based on the use of formulas (8), (9), the values were normalized (Table 3).
To determine the weight coefficient for each country (formulas 2-4), a linear programming method was applied using the Python programming language. The program code for solving this task is presented in Appendix B. Following the DEA methodology, the calculation of DEA Score was provided based on formulas (5), (6), (7).
The results of the DEA was prepared with cartographic form and presented in Figure 2.

As a result of the DEA conducted to assess the efficiency of countries in achieving energy transition goals, the conversion of input resources into desired results was evaluated, particularly regarding the use of renewable energy sources, economic growth, and the reduction of greenhouse gas emissions.
The results obtained show significant variability in the efficiency levels of the energy transition across EU countries. Specifically, most countries, such as Belgium, the Czech Republic, Estonia, Finland, Germany, Hungary, Greece, Latvia, Portugal, Slovenia, Sweden, Luxembourg, Cyprus, have a DEA efficiency score of 1.0000, indicating their high efficiency in the context of energy transition. These countries are self-sufficient in their achievements and do not require comparisons with others to evaluate their efficiency. This reflects the successful implementation of energy and environmental policies that ensure high results in energy transition.
In contrast, some countries have lower efficiency scores, indicating the need to improve their energy transition strategies. Austria, with a score of 0.9908, is behind the leaders, as evidenced by comparisons with Belgium, the Czech Republic, and Sweden. Countries like Lithuania (0.9603), Romania (0.9453), Denmark (0.9395), Malta (0.9283), and Bulgaria (0.8341) have even lower results, indicating the need to enhance their energy strategies and improve the effectiveness of environmental initiatives.
Countries with low efficiency scores, including Croatia (0.6589), Slovakia (0.5783), the Netherlands (0.5679), Spain (0.5017), France (0.5344), Italy (0.4501), Poland (0.4312), and Ireland (0.3563), have significant potential for improvement in their energy policies. Comparing these countries with leaders helps identify areas for improvement, including more active implementation of renewable energy sources, CO2 reduction, and increased innovation in environmental measures.
For a comprehensive analysis of the energy transformation results and the identification of relationships between technical efficiency and institutional readiness, a combination of two key indicators – DEA Efficiency Score and ETI Score — was used. While the first indicator reflects a country’s ability to efficiently utilize available resources to achieve specified outcomes, the second characterizes the overall strategic, political, and market readiness for transitioning to new energy models.
For visual representation and further analytical interpretation, these two indicators were consolidated into a joint table (Table 4), which enables comparative evaluation of countries across both dimensions simultaneously. This approach allows not only ranking countries but also identifying the gaps between potential (ETI) and actual effectiveness (DEA), which is extremely valuable for making management and strategic decisions.
To deepen the interpretation of DEA analysis results and identify strategic profiles of countries, it was deemed appropriate to construct an efficiency matrix that combines two key indicators – DEA Score and ETI Rank. In this context, the DEA Score is considered a generalized indicator of technical efficiency, calculated based on the DEA model, while the ETI Rank serves as an indicator of the input conditions of energy transformation: institutional, political, and market readiness, where a lower value indicates a higher position in the global ranking.
To justify the feasibility of constructing an efficiency matrix, we check the dependency between technical efficiency (DEA Efficiency Score) and the overall readiness for energy transition (ETI), the Pearson correlation coefficient was calculated (formula 11). The presence of a weak direct correlation (r = 0.145) with a statistically significant p-value (p < 0.05) makes the construction of a two-vector efficiency matrix particularly appropriate and correct. This decision is justified by the fact that such a matrix turns a quantitative indicator (weak correlation) into a powerful tool for qualitative and strategic analysis. The weak correlation between technical efficiency (DEA) and energy transition readiness (ETI) means that these two parameters, although related, do not move synchronously. That is, high technical efficiency does not guarantee high readiness for change, and, conversely, companies ready for the transition may not yet achieve a high level of efficiency. The statistical significance of p-value (p= 0.4692) is a key point. This indicates that the correlation found (although weak) is real and not random. Thus, the relationship exists, but it is not linear or predictive. That is why the matrix will allow you to get a "map" that shows how different entities (enterprises, industries) are distributed along two key dimensions and to isolate and classify enterprises into four clearly defined groups, each of which requires a unique approach.
To systematize the results, a 2x2 classification matrix was applied, constructed by dividing the space into four quadrants. The classification is based on a matrix built using two indicators – DEA Score and ETI Rank – with the determination of average values for each axis, allowing the space to be divided into four quadrants and countries to be classified based on the combination of technical efficiency and institutional readiness for the energy transition.
The construction of such a matrix allows for moving from abstract country ranking to a practically oriented typology, which can serve as the basis for recommendations on policy improvement strategies, adaptation of institutional approaches, and optimization of resource utilization in the context of the energy transition. In the future, this classification could be expanded by integrating additional indicators (such as environmental pressure, investment rates, or social justice), which would allow for the formation of a more comprehensive typology of countries for sustainable development purposes.
Thus, constructing the efficiency matrix based on DEA Score and ETI Rank is the logical next step in the research, providing a deeper understanding of the relationship between efficiency, preparedness, and outcomes of the energy transition. The results of the research were visualized in the form of a two-dimensional matrix combining two key parameters: DEA Score (on the X-axis), which reflects the technical efficiency of resource use in the energy transition process, and ETI Rank (on the Y-axis), an integral indicator of a country's overall readiness for energy changes, taking into account political, market, institutional, and technological aspects (Figure 3). This approach allows for identifying not only absolute leaders but also countries that demonstrate relative efficiency under limited resources or, conversely, suboptimal results despite a favorable environment
The presented scatter plot, hereinafter referred to as energy transition effectiveness matrix, visually displays the effectiveness of different European countries based on two key dimensions: the DEA efficiency score (on the X-axis) and the ETI rank (on the Y-axis). This matrix is divided into four different quadrants based on median values for both efficiency and ETI, allowing for clear categorization and comparison of national indicators.
The X-axis (DEA Efficiency Score) quantitatively assesses the relative effectiveness of countries in converting input resources into output results, with a score of 1.0 indicating full efficiency relative to the observed group of peers (the efficiency frontier). Countries positioned to the right are more efficient. The Y-axis (ETI Rank) reflects the country's progress and readiness for energy transition, with higher values (further up the axis) indicating better scores or more advanced transitions. The matrix uses a quadrant classification system, where the dashed lines indicate the median DEA efficiency score and median ETI rank, thus segmenting the chart into four areas. The horizontal dashed line indicates the median ETI score, while the vertical dashed line corresponds to DEA Score = 1.0. These lines divide the matrix into four quadrants, each characterized by a specific combination of efficiency and ETI score.
According to the legend, countries are grouped by colour reflecting their position in these four quadrants:
High DEA, High ETI (marked in blue): This quadrant represents countries that demonstrate high relative efficiency (DEA = 1.0) and high ETI scores. These are the leaders and “benchmarks” in the energy transition sample (Sweden, Finland, Germany, Estonia, Portugal, Luxembourg, Hungary, Latvia, and partly Slovenia). Their task is to maintain the edge: build out storage and hydrogen infrastructure, electrify hard-to-abate sectors, pursue deep renovation of buildings, and develop local energy communities. They can serve as practice donors for neighbors and pilot the next wave of innovations (carbon contracts for difference, digital grids, retail flexibility markets) to remain in the upper-right quadrant.
High DEA, Low ETI (marked in green): countries in this quadrant are also on the efficiency frontier (DEA = 1.0), but their ETI score is below the median. This indicates the “latent reserve”: technically efficient systems that lag on aggregate outcomes and policy indicators (Belgium, Czechia, Cyprus, and Greece). They need stable, predictable delivery frameworks: long-term auctions for renewables, permitting reform, development of flexibility markets, scaling corporate demand for green electricity, and a “green” taxonomy for capital. The key is to move upward — i.e., convert existing efficiency into a higher ETI through better policies, investment, and social support.
Low DEA, High ETI (marked in red): This quadrant includes countries with relatively lower efficiency (DEA < 1.0) but with ETI scores above the median. These countries have relatively strong policies and institutions, but with “structural costs” on efficiency (France, the Netherlands, Spain, and Austria). The focus should be on micro-reforms of markets and sectoral reorientation: boosting system flexibility (storage, demand response), accelerating decarbonization of heat and transport, clearing local network bottlenecks, and speeding up innovation diffusion in industry. The goal is to shift rightward without losing altitude.
Low DEA, Low ETI (marked in yellow): This is the quadrant for countries that exhibit lower scores for both relative efficiency (DEA < 1.0) and ETI. These countries lack both technical efficiency and transition outcomes (typically: Ireland, Italy, Poland, Slovakia, Croatia, Lithuania, Bulgaria, Romania, and Malta). Their priority is the “basic infrastructure of the transition”: grid and generation upgrades, lowering energy intensity, tackling energy poverty, and transparent incentives for renewables and energy efficiency in housing and SMEs. Quick wins come from thermal retrofits, dynamic tariffs/DSM (demand-side management), and removing permitting barriers for distributed generation.
The matrix effectively visualizes the reference links between countries with lower DEA scores and those on the efficiency frontier. These reference links, indicated by dashed gray lines, illustrate potential benchmarking relationships, where less efficient countries "refer" to more efficient ones as models of best practices.
Thus, the effectiveness matrix groups countries according to their DEA and ETI indicators. It allows for the quick identification of leaders ("Best" – Sweden) and countries that need the most improvement ("Worst" – Ireland), as well as highlighting groups of countries facing similar challenges. Additionally, the matrix is complemented by reference links. These links, obtained from the DEA analysis, indicate benchmarking relationships, where less effective countries "refer" to more effective ones as models of best practices. The central element of the presented visualization is the network of lines connecting countries with a DEA score below 1.0 to countries with a DEA score of 1.0. These lines are not random; they are a direct result of the DEA and visualize the concept of "reference groups" or "benchmarks." Each line indicates a specific effective country serving as a reference for a less effective country, demonstrating how the latter could improve its efficiency by following the practices of the "best in class." For each inefficient country, DEA identifies one or more effective counterparts that form its reference group (Figure 4).

In essence, the DEA method allows for determining the relative efficiency of countries by identifying the "efficiency frontier." This frontier is formed by the most efficient countries in the sample, which have a DEA score of 1.0. Countries located on this vertical frontier (e.g., Sweden, Finland, Germany, Estonia, and several others) are considered benchmark or reference countries as they demonstrate the best practices in achieving efficiency. The gray dashed lines departing from countries with a DEA score below 1.0 visually represent these reference links. They connect countries with the potential to improve their efficiency in DEA to their effective counterparts or references on the efficiency frontier. Each such link suggests that a country with lower relative efficiency according to DEA could improve its efficiency by approaching the level of its reference countries. This can be achieved by studying and implementing the best practices applied in reference countries, regardless of their ETI score. Countries like Ireland, which demonstrate a low DEA score (around 0.3594), have multiple reference links. These links are directed towards countries with higher DEA efficiency, such as Greece, the Czech Republic, and Greece, which are on the efficiency frontier. Another link involves France, with a DEA score of around 0.53, which also has an extensive network of reference links. Its references are high-performing countries in terms of DEA, such as Sweden (which has the highest ETI score among the effective countries), as well as Belgium, and the Czech Republic. Even countries with relatively high DEA scores, but still below 1.0, such as Austria (around 0.99), demonstrate reference links to the efficiency leaders in DEA, like Sweden, Belgium and Czech Republic. This highlights that even highly developed economies have the potential to further enhance their relative efficiency by focusing on the absolute leaders in the sample
Thus, the reference links on this graph are not just lines, but a visual roadmap for improving relative efficiency. They allow for the identification of specific benchmarks for countries with the potential to improve their DEA scores, promoting the exchange of knowledge and best practices in energy transition and increasing operational efficiency. This enables the development of more targeted policies and investment strategies for achieving a sustainable energy future. Thus, the visualization of reference groups through connecting lines transforms DEA results into concrete, actionable recommendations, clearly demonstrating that improving efficiency and accelerating the energy transition are not isolated tasks, but interconnected processes where the experience of leaders can serve as a catalyst for transforming others. Figure 5 highlights the study of the energy transition issue in EU countries, providing detailed insight into which allows for identifying priorities for the best practices in energy change.
Overall, the results of the matrix are significant for the formation of state policy, strategic planning, and monitoring. First, they allow for the identification of reference countries whose practices can serve as models for others. Second, the matrix helps to identify countries where strategic preparation does not translate into effective results, which provides a basis for revising policies and management decisions. Third, it can be used as a tool for assessing the investment attractiveness of countries based on the efficiency of resource use, rather than just formal positions in rankings. Finally, the combination of DEA and ETI strengthens the analytical foundation for adaptive energy transition management in line with the Sustainable Development Goals.
4. Discussion
This study developed a conceptual approach for integrating DEA methods and the ETI to evaluate the effectiveness of energy transformation in European countries. At the same time, it is important to highlight several discussion points that may limit the generality of the conclusions and create a basis for future research.
Discussions of the research.
Both DEA and ETI are indices based on selected inputs and outputs. Changing the list of these inputs or their weighting can significantly change the final indicators of efficiency and readiness for transition.
The four quadrants in the efficiency matrix are demarcated by the median values of DEA and ETI. The median is only a statistical measure of the middle of the sample, not an absolute criterion of "good" or "bad". Therefore, a country close to the median may be classified as "efficient", while another, just below, may be classified as "less efficient", although the actual difference between them is minimal. This creates a "border effect" that may seem unfair.
All countries that are near the median lines or on the borders between quadrants are considered "gray areas." Their belonging to one group or another can be a matter of debate, as small changes in the data can move them from one quadrant to another.
Limitations of the research.
Firstly, the analysis was conducted based on data from only one year. This approach was driven by the need to create and test a conceptual framework for assessing the effectiveness of the energy transition environment. However, future studies should consider the dynamics of changes in input and output parameters of the model, considering time series data. This would allow tracking the sustainability of efficiency over time, evaluating the impact of political or economic changes, and identifying the delayed effects of implemented reforms.
Secondly, despite the ability of the DEA to consider various factors, the multidimensionality of the indicators used (economic, technical, and social) makes it difficult to normalize data between countries with different economic scales and energy consumption structures. This limits the ability to consider external factors, such as geographical, war’s consequences, political, etc. The integration of DEA analysis with the ETI partially mitigates these limitations. DEA allows the assessment of technical efficiency based on multiple parameters without the need for prior functional form assumptions, while ETI serves as an aggregated indicator of institutional and market readiness for energy changes. Combining these approaches enables the identification of countries that, despite a low ETI rating, demonstrate effective resource use, or conversely, reveal inefficiency despite a high overall rating. Thirdly, the DEA method has certain limitations related to the sensitivity of the choice of input and output variables. Although the variables were justified based on a literature review and previous research results, different combinations of parameters can lead to different outcomes. This requires further validation of the model to correct any potential statistical distortions. Fourthly, the ETI, which is used as a component for comparison, has its own internal calculation methodology, which may not account for all contextual or regional specifics, such as institutional capacity or social readiness. This creates a risk of oversimplification when comparing countries that differ structurally or historically. Fifthly, effectiveness in this study is primarily considered in terms of resource use and macroeconomic parameters. Social aspects of the energy transition, such as energy poverty, inclusivity of policies, or the level of public participation and stakeholder engagement, are insufficiently covered [106]. Future research should integrate qualitative indicators and just transition measures.
While such a matrix is a powerful tool for visualization and strategic analysis, it is only a model of reality. Its classification serves as a starting point for discussions, not a final verdict. Users of the analysis should consider the context, methodological limitations, and dynamics of change to avoid simplistic conclusions.
In conclusion, although this study provides a solid foundation for integrated assessment of the energy transition, it also opens several directions for further refinement of models, including the incorporation of time dynamics, multi-dimensional criteria, error correction methods, and the expansion of variables.
5. Conclusions
As a result of the conducted research, a few theoretical and practical conclusions were formulated, which define its scientific novelty and practical significance. The relevance of DEA was substantiated due to the need to assess the rationality of resource expenditures, particularly in the process of energy transition, to identify systemic weaknesses, and to conduct comparative analysis of countries based on real efficiency outcomes. The methodological integration of DEA with multi-criteria analysis in the field of energy policy has been further developed, which allows for a comprehensive assessment of the effectiveness of the energy transition, taking into account a wide range of parameters relevant to the energy transition. An innovative methodology for comparative analysis was developed, allowing for the inclusion of a wide variety of input and output factors, ensuring a more accurate interpretation of countries' effectiveness in the dynamics of transition to sustainable energy systems.
The research expands the potential of DEA as a strategic-level analytical tool capable of supporting well-grounded policy decisions. It was demonstrated that operational research tools can serve as an effective platform for forming adaptive energy policies focused on energy transition results. The relevance of evaluating the effectiveness of the energy transition is determined not only by the high resource intensity of this process but also by the unequal starting conditions of countries, differing levels of institutional capacity, access to technologies, and political will.
The integration of DEA and ETI results allows for the creation of a two-dimensional analytical matrix that reflects not only the level of resource efficiency but also countries' readiness for energy transformation. Based on the constructed matrix, all countries were grouped into four types according to DEA efficiency scores (on the X-axis) and ETI ratings (on the Y-axis).
- High DEA, High ETI (blue points): Countries in this quadrant, such as Sweden, Finland, Germany, Estonia, Portugal, Luxembourg, Hungary, Latvia, and partly Slovenia, demonstrate high efficiency and successful energy transition. They are leaders that effectively use resources and actively develop RES, serving as benchmarks for other countries.
- High DEA, Low ETI (green points): Belgium, Czechia, Cyprus, and Greece, while effectively using their resources, show low progress in energy transition. This may indicate their focus on optimizing existing energy systems rather than rapidly transitioning to new energy sources.
- Low DEA, High ETI (red points): France, the Netherlands, Denmark, Spain and Austria show significant progress in the energy transition, but their internal processes and resource use are still suboptimal. This highlights the need for improving efficiency to achieve greater results in the transition.
- Low DEA, Low ETI (yellow points): countries such as Ireland, Italy, Poland, Slovakia, Croatia, Bulgaria, Romania, Malta, and Lithuania face challenges both in efficiency and readiness for energy transition. These countries require a comprehensive approach to improving resource efficiency and accelerating the transition to sustainable energy systems.
Thus, combining the DEA and ETI methods not only allows for the analysis of the effectiveness of energy changes but also identifies barriers and policy priorities for each country. The resulting typology aids in more accurately targeting strategies, considering both current effectiveness and readiness for implementing changes, which is crucial for achieving a just and inclusive energy transition in countries with varying starting positions.
Verification of the Results OBTAINED.
A comparison of the DEA×ETI matrix results with Decoupling Score (DS) typology shows broad alignment in identifying profiles, while each metric captures a different facet of transition performance. DS leaders with absolute decoupling – Estonia, Luxembourg, Finland, and Sweden – also sit in the matrix’s upper-right quadrant (high technical efficiency and high transition outcomes), indicating that growth is supported by structurally efficient systems and mature policies. Several “strong relative decouplers” in DS – France and Denmark – appear in the matrix’s upper-left quadrant: high ETI with lower DEA suggests that policies and institutions work, but structural costs and bottlenecks (networks, energy mix) hinder a shift to the right. The rest of this DS group – Ireland, Poland, Malta, and Romania – is heterogeneous: in the matrix, Ireland, Poland, and Malta remain in the lower-left quadrant (both outcomes and efficiency still weak despite improving DS dynamics), whereas Romania sits in the lower-right (more structurally efficient but without high ETI). The “green recession” cases – Latvia and Austria – plot close to the leaders (upper half and around/above the DEA median), consistent with the idea that their emission declines should be converted into durable intensity improvements so that, when growth resumes, they consolidate in the upper-right. The sharpest divergence is Germany: DS = 0 due to a one-year pattern of GDP contraction with rising emissions, while the matrix places it among high-ETI countries and in the DEA threshold. This underlines the complementarity of the two lenses: DS is sensitive to shocks and short-run disruptions (weather, war, fuel switching, outages), whereas the matrix reflects a more structural picture of efficiency and policy quality. In practice, DS offers a dynamic barometer of how clean growth was in the period observed, while DEA×ETI indicates how reliably the system can translate investments and governance into sustained results. Used together, they clarify priorities: countries with high DS but a “left-side” position should invest in grids, the heat sector, and flexibility to convert momentum into durable performance, while those in the lower-right should strengthen policy frameworks and social support to move upward.
The practical significance of the results lies in their potential use in management, policy, and investment. Specifically, the research allows identifying best practices for dissemination, adjusting national strategies based on the actual effectiveness of resource use, forming a well-reasoned investment appeal, and conducting monitoring and policy reviews within international cooperation frameworks such as EU programs, OECD, or other international organizations. The use of reference groups for countries with less efficiency scores allows focusing on countries with higher results that can serve as models for improving energy transition strategies in less efficient countries. This also enables transferring best practices from countries that have already succeeded in the energy transition to other lagging countries.
Thus, multi-factor data analysis based on the efficiency matrix allows not only to assess the current state of energy transition in EU countries, but also to formulate comprehensive and targeted strategic recommendations. The comparison of technical efficiency (DEA) and energy transition readiness (ETI) allows each country to determine its unique place in the context of energy transition and obtain a visualized "roadmap". This helps countries develop individual strategies to optimize their energy systems and achieve sustainable development goals within the framework of the energy transition.
Author Contributions
“Conceptualization, P.A. and S.D.; methodology, P.A., and S.D. ; software, P.V.; validation, S.D, P.Yu., and P.V..; formal analysis, S.D.; investigation, S.D., P.Yu.; resources, P.Yu.; data curation, P.Yu.; writing—original draft preparation, P.A.; writing—review and editing, S.D.; visualization, P.V.; supervision, S.D.; project administration, P.A.; funding acquisition, S.D. All authors have read and agreed to the published version of the manuscript.”
Funding
“This research received no external funding”
Data Availability Statement
The original data presented in the study are openly available at Eurostat platforms with appropriate citation and exposed in the article with calculations.
Conflicts of Interest
“The authors declare no conflicts of interest.”
Abbreviations
The following abbreviations are used in this manuscript:
| DEA | Data Envelopment Analysis |
| EIT | Energy Transition Index |
| EIS | Energy Intensity Score |
| DMU | Decision Making Unit |
| RES_share, % | Share of renewable energy in gross final energy consumption (%) |
| Imp_dep, % | Energy import dependency rate (%) |
| Fossi_share, % | Share of fossil fuels in total energy supply (%) |
| CCM_inv, million euro | Investments in carbon containment measures (million EUR) |
| JV_PST, % | Job vacancy rate in professional, scientific, and technical sectors (%) |
| GHG_red, % | Annual reduction rate of greenhouse gas emissions (%) |
| GDP_growth, % | Annual growth rate of Gross Domestic Product (GDP) (%) |
| DS | Decoupling Score |
| IDU, million euro | Income by degree of urbanization (million EUR) |
| EC_per_capita | Final energy consumption per capita (kWh/person) |
Appendix A

Table A1.
Justification of the feasibility of using input variables in the DEA model.
| № | Indicator name | Variable code | DEA- role | Economic interpretation as a resource (disincentive) |
| 1 | Level of energy import dependence (%) | x1 | Input | Reflects the country's strategic vulnerability; high values indicate the need for external resources, which reduces the stability of the energy system. |
| 2 | Share of fossil fuels in the total energy balance (%) | x2 | Input | Carbon dependency indicator: a decrease in this share indicates a more environmentally efficient energy consumption structure. |
| 3 | Investment in climate change mitigation measures (million euros) | x3 | Input | Despite the positive effect, investments are treated as a resource that is consumed to achieve sustainable development results. |
| 4 | Level of vacancies in the scientific and technical sector (%) | x4 | Input | High demand for innovative labour may indicate inefficient use of human capital, as an underutilized resource. |
| 5 | Income by level of urbanization (million euros) | x5 | Input | The economic capacity of urbanized areas is considered as a resource that promotes transformation, but with high consumption does not always provide proportional efficiency |
| 6 | Energy consumption per capita | x6 | Input | Reflects the energy intensity of the economy; lower consumption with the same results indicates greater energy efficiency. |
Table A2.
Justification of the output variables in the DEA model
| № | Indicator name | Variable code | DEA- role | Value for assessing the efficiency of the energy transition | |||
| 1 | Total share of energy from renewable sources (% in gross final energy consumption) | y1 | Output | The basic indicators of sustainable development. It reflects the actual result of the transition to clean energy sources. The growth of this indicator indicates the achievement of the targets of the ecological transformation. | |||
| 2 | Decoupling Score (DS) | y2 | Output | The Decoupling Score (DS) is a single, “higher = better” index (0 to 1) that summarizes how a country’s economy and its greenhouse-gas emissions move together in each period. It uses annual GDP growth and GHG change as inputs. DS equals 1 when the economy grows while emissions are flat or falling (absolute decoupling); it lies between 0 and 1 when both grow but GDP grows faster (relative decoupling, the closer to 1, the cleaner the growth); it gives mid-range value when both GDP and emissions fall (recognizing emission cuts during downturns without over-rewarding recessions); and it is 0 in the worst case, when the economy contracts while emissions still rise. The score is easy to compare across countries and years, aligns with policy goals of cleaner growth, and should be read alongside multi-year trends and sectoral evidence. | |||
| 3 | EU Innovation Index (EIS) | y3 | Output | The EU Innovation Index (EIS) is an important indicator for assessing the effectiveness of the energy transition, as it reflects the level of innovation and technological progress in a country. A high EIS indicates the development of new renewable energy technologies, the optimization of energy systems through innovations such as smart grids, and active investment in research and development. This allows countries to adapt more quickly to the demands of the energy transition, reduce CO2 emissions, and improve resource efficiency, contributing to a successful transition to sustainable energy systems. | |||
Appendix B
BASIC ALGORITHM FOR SOLVING LINEAR PROGRAMMING PROBLEMS
# Iterating over each country to calculate its efficiency
for index_dmu_under_evaluation, dmu_under_evaluation in enumerate(all_dmus):
objective_function_coefficients = np.zeros(number_of_dmus + 1)
objective_function_coefficients[-1] = -1 # Coefficient for h_j0 in the objective function
upper_bound_constraint_matrix = [] # Matrix of coefficients for "less than or equal to" inequalities
upper_bound_vector = [] # Vector of right-hand sides for "less than or equal to" inequalities
# Constraints for outputs: -sum(lambda_j * Y_rj) + h_j0 * Y_rj0 <= 0
for output_index in range(number_of_outputs):
row = [-all_dmus[dmu_index]['outputs'][output_index] for dmu_index in range(number_of_dmus)] # -Y_rj for each lambda_j
row.append(dmu_under_evaluation['outputs'][output_index]) # Coefficient for h_j0
upper_bound_constraint_matrix.append(row)
upper_bound_vector.append(0)
# Constraints for inputs: sum(lambda_j * X_ij) <= X_ij0
for input_index in range(number_of_inputs):
row = [all_dmus[dmu_index]['inputs'][input_index] for dmu_index in range(number_of_dmus)] # X_ij for each lambda_j
row.append(0) # Coefficient for h_j0 is 0 for input constraints
upper_bound_constraint_matrix.append(row)
upper_bound_vector.append(dmu_under_evaluation['inputs'][input_index])
upper_bound_constraint_matrix = np.array(upper_bound_constraint_matrix)
upper_bound_vector = np.array(upper_bound_vector)
# Bounds for variables: lambda_j >= 0, h_j0 >= epsilon
variable_bounds = [(0, None)] * number_of_dmus + [(epsilon, None)]
# Solve the linear programming problem
solution = linprog(objective_function_coefficients, A_ub=upper_bound_constraint_matrix, b_ub=upper_bound_vector, bounds=variable_bounds, method='highs')
# Get the efficiency score (the last variable in solution.x)
theta_score = solution.x[-1] if solution.success else 0.0
# Correction: the efficiency score for the output-oriented CCR model
# is usually interpreted as 1/theta, where theta >= 1.
# If theta_score is very close to 1, it means efficiency.
# If theta_score > 1, then 1/theta_score will be < 1, which indicates inefficiency.
if theta_score > 0: # Avoid division by zero
efficiency_score = 1 / theta_score
else:
efficiency_score = 0.0 # If theta_score <= 0, efficiency is 0
References
- Charnes, A.; Cooper, W.W.; Rhodes, E. Measuring the efficiency of decision making units. Eur. J. Oper. Res. 1978, 2, 429–444. [Google Scholar] [CrossRef]
- Energy Transition Index 2025: Five strategies for a more resilient and competitive energy system. https://www.weforum. 2025.
- Chwiłkowska-Kubala, A.; Cyfert, S.; Malewska, K.; Mierzejewska, K.; Szumowski, W. The impact of resources on digital transformation in energy sector companies. The role of readiness for digital transformation. Technol. Soc. 2023, 74. [Google Scholar] [CrossRef]
- Dirma, V.; Neverauskienė, L.O.; Tvaronavičienė, M.; Danilevičienė, I.; Tamošiūnienė, R. The Impact of Renewable Energy Development on Economic Growth. Energies 2024, 17, 6328. [Google Scholar] [CrossRef]
- Becker, A.; Oleńczuk-Paszel, A.; Sompolska-Rzechuła, A. Quality of Life and Energy Efficiency in Europe—A Multi-Criteria Classification of Countries and Analysis of Regional Disproportions. Sustainability 2025, 17, 4768. [Google Scholar] [CrossRef]
- Haby, M.M.; Reveiz, L.; Thomas, R.; Jordan, H. An integrated framework to guide evidence-informed public health policymaking. J. Public Heal. Policy 2025, 46, 193–210. [Google Scholar] [CrossRef]
- Hariram, N.P.; Mekha, K.B.; Suganthan, V.; Sudhakar, K. Sustainalism: An Integrated Socio-Economic-Environmental Model to Address Sustainable Development and Sustainability. Sustainability 2023, 15, 10682. [Google Scholar] [CrossRef]
- Schubert, F-C.; Knecht, A. Ressourcen – Merkmale, Theorien und Konzeptionen im Überblick. 2015. [CrossRef]
- Yaryhina, H.; Ziankova, I.; Sati, R.; Litvinenko, V. Efficient use of resources in the field of energy efficiency through the principles of the circular economy.CONFERENCE NAME, LOCATION OF CONFERENCE, COUNTRYDATE OF CONFERENCE; p. 02009.
- Desing, H.; Widmer, R.; Bardi, U.; Beylot, A.; Billy, R.G.; Gasser, M.; Gauch, M.; Monfort, D.; Müller, D.B.; Raugei, M.; et al. Mobilizing materials to enable a fast energy transition: A conceptual framework. Resour. Conserv. Recycl. 2023, 200. [Google Scholar] [CrossRef]
- Kosenko, A.; Khomenko, O.; Kononenko, M.; Polyanska, A.; Buketov, V.; Dychkovskyi, R.; Polański, J.; Howaniec, N.; Smolinski, A. Sustainable management of iron ore extraction processes using methods of borehole hydro technology. Int. J. Min. Miner. Eng. 2025, 16, 92–112. [Google Scholar] [CrossRef] [PubMed]
- Huang, S.-Z. The effect of natural resources and economic factors on energy transition: New evidence from China. Resour. Policy 2022, 76. [Google Scholar] [CrossRef]
- IRENA, World Energy Transitions Outlook: 1.5C Pathway (IRENA, Abu Dhabi 2021). Available at: https://www.irena.org/-/media/Files/IRENA/Agency/Publication/2021/March/IRENA_World_Energy_Transitions_Outlook_2021.
- Hailes, O.; E Viñuales, J. The energy transition at a critical juncture. J. Int. Econ. Law 2023, 26, 627–648. [Google Scholar] [CrossRef]
- Mercedes, М.; Cantarero, V. Of renewable energy, energy democracy, and sustainable development: A roadmap to accelerate the energy transition in developing countries. Energy Research & Social Science, 2020, 70, 101716. [Google Scholar] [CrossRef]
- Mykhailyshyn, K.; Polyanska, A.; Psyuk, V.; Antoniuk, O.; Dychkovskyi, R.; Dyczko, A.; Šoštarić, S.B. How to achieve the energy transition taking into account the efficiency of energy resources consumption.CONFERENCE NAME, LOCATION OF CONFERENCE, COUNTRYDATE OF CONFERENCE; p. 01026.
- Ivano-Frankivsk National Technical University of Oil and Gas; Polyanska, A. ; Pazynich, Y.; Dnipro University of Technology; Petinova, O.; South Ukrainian National Pedagogical University named after K. D. Ushynsky; Nesterova, O.; Mykytiuk, N.; Bodnar, G. Formation of a Culture of Frugal Energy Consumption in the Context of Social Security, pp. 60-87. J. Int. Comm. Hist. Technol. 2024, 29, 60–87. [Google Scholar] [CrossRef]
- Pereira, D.S.; Marques, A.C. How do energy forms impact energy poverty? An analysis of European degrees of urbanisation. Energy Policy 2022, 173. [Google Scholar] [CrossRef]
- Yatzkan, O.; Cohen, R.; Yaniv, E.; Rotem-Mindali, O. Urban Energy Transitions: A Systematic Review. Land 2025, 14, 566. [Google Scholar] [CrossRef]
- Renou-Maissant, P.; Abdesselam, R.; Bonnet, J. Trajectories for Energy Transition in EU-28 Countries over the Period 2000–2019: a Multidimensional Approach. Environ. Model. Assess. 2022, 27, 525–551. [Google Scholar] [CrossRef]
- Zhang, L.; Cui, J.; Gong, Q. Research on total factor energy efficiency in western China based on the three-stage DEA-Tobit model. PLOS ONE 2024, 19, e0294329. [Google Scholar] [CrossRef]
- Mirkin, C.A.; Sargent, E.H.; Schrag, D.P. Energy transition needs new materials. Science 2024, 384, 713–713. [Google Scholar] [CrossRef] [PubMed]
- Siddi, M. The Geopolitics of Energy Transition: New Resources and Technologies. In: Berghofer, J., Futter, A., Häusler, C., Hoell, M., Nosál, J. (eds) The Implications of Emerging Technologies in the Euro-Atlantic Space. Palgrave Macmillan, 2023, Cham. [CrossRef]
- Miller, C.A.; Richter, J.; O’lEary, J. Socio-energy systems design: A policy framework for energy transitions. Energy Res. Soc. Sci. 2015, 6, 29–40. [Google Scholar] [CrossRef]
- Araújo, K. The emerging field of energy transitions: Progress, challenges, and opportunities. Energy Res. Soc. Sci. 2014, 1, 112–121. [Google Scholar] [CrossRef]
- Yang, Y.; Xia, S.; Huang, P.; Qian, J. Energy transition: Connotations, mechanisms and effects. Energy Strat. Rev. 2024, 52. [Google Scholar] [CrossRef]
- Slameršak, A.; Kallis, G.; O’nEill, D.W. Energy requirements and carbon emissions for a low-carbon energy transition. Nat. Commun. 2022, 13, 1–15. [Google Scholar] [CrossRef]
- Saraji, M.K.; Streimikiene, D. Challenges to the low carbon energy transition: A systematic literature review and research agenda. Energy Strat. Rev. 2023, 49. [Google Scholar] [CrossRef]
- Zaheb, H.; Obaidi, O.; Mukhtar, S.; Shirani, H.; Ahmadi, M.; Yona, A. Comprehensive Analysis and Prioritization of Sustainable Energy Resources Using Analytical Hierarchy Process. Sustainability 2024, 16, 4873. [Google Scholar] [CrossRef]
- Abreu, S.; Rodrigues, F.; Pereira, J. Clustering of renewable energy assets to optimize resource allocation and operational strategies. J. Intell. Inf. Syst. 2025, 63, 831–853. [Google Scholar] [CrossRef]
- Pali, F.; Dsouza, R.; Ryu, Y.; Oishee, J.; Aikkarakudiyil, J.; Gaikwad, M.A.; Norouzzadeh, P.; Buckner, S.; Rahmani, B. Energy Transitions over Five Decades: A Statistical Perspective on Global Energy Trends. Computers 2025, 14, 190. [Google Scholar] [CrossRef]
- Zapukhliak, I.; Zaiachuk, Y.; Polyanska, A.; Kinash, I. Applying fuzzy logic to assessment of enterprise readiness for changes. Manag. Sci. Lett. 2019, 2277–2290. [Google Scholar] [CrossRef]
- Manning, M.; Bowhay, R. ; Bowman,M.; Knaack, P., Sachs, L., Smolenska, A., Stewart, F., Tayler, T., Toledano, P., Eds.; Walkate, H. A handbook to strategic national transition planning: supplementary guidance and examples, 2024. [Google Scholar]
- Sueyoshi, T.; Yuan, Y.; Goto, M. A literature study for DEA applied to energy and environment. Energy Econ. 2017, 62, 104–124. [Google Scholar] [CrossRef]
- Cook, W.D.; Tone, K.; Zhu, J. Data envelopment analysis: Prior to choosing a model. Omega 2014, 44, 1–4. [Google Scholar] [CrossRef]
- Wang, C.-N.; Nguyen, T.T.-V.; Chiang, C.-C.; Le, H.-D. Evaluating renewable energy consumption efficiency and impact factors in Asia-pacific economic cooperation countries: A new approach of DEA with undesirable output model. Renew. Energy 2024, 227. [Google Scholar] [CrossRef]
- Li, Y.; Liu, A.-C.; Wang, S.-M.; Zhan, Y.; Chen, J.; Hsiao, H.-F. A Study of Total-Factor Energy Efficiency for Regional Sustainable Development in China: An Application of Bootstrapped DEA and Clustering Approach. Energies 2022, 15, 3093. [Google Scholar] [CrossRef]
- Xu, T.; You, J.; Li, H.; Shao, L. Energy Efficiency Evaluation Based on Data Envelopment Analysis: A Literature Review. Energies 2020, 13, 3548. [Google Scholar] [CrossRef]
- Wang, C.-N.; Dang, T.-T.; Tibo, H.; Duong, D.-H. Assessing Renewable Energy Production Capabilities Using DEA Window and Fuzzy TOPSIS Model. Symmetry 2021, 13, 334. [Google Scholar] [CrossRef]
- Arana-Jiménez, M.; Lozano-Ramírez, J.; Sánchez-Gil, M.C.; Younesi, A.; Lozano, S. A Novel Slacks-Based Interval DEA Model and Application. Axioms 2024, 13, 144. [Google Scholar] [CrossRef]
- Peykani, P.; Esmaeili, F.S.S.; Pishvaee, M.S.; Rostamy-Malkhalifeh, M.; Lotfi, F.H. Matrix-based network data envelopment analysis: A common set of weights approach. Socio-Economic Plan. Sci. 2024, 95. [Google Scholar] [CrossRef]
- de Oliveira, M.S.; Steffen, V.; de Francisco, A.C.; Trojan, F. Integrated data envelopment analysis, multi-criteria decision making, and cluster analysis methods: Trends and perspectives. Decis. Anal. J. 2023, 8. [Google Scholar] [CrossRef]
- Pereira, S.; Silva, C.; Ferreira, L.M.D. Barriers to energy transition: Comparing developing with developed countries. Energy Sustain. Dev. 2025, 87. [Google Scholar] [CrossRef]
- Fostering Effective Energy Transition 2023 Edition INSIGHT REPORT JUNE 2023. Available at: https://www3.weforum.org/docs/WEF_Fostering_Effective_Energy_Transition_2023.
- Radtke, J. Understanding the Complexity of Governing Energy Transitions: Introducing an Integrated Approach of Policy and Transition Perspectives. Environ. Policy Gov. 2025, 35, 595–614. [Google Scholar] [CrossRef]
- Mirza, Z.T.; Anderson, T.; Seadon, J.; Brent, A. A thematic analysis of the factors that influence the development of a renewable energy policy. Renew. Energy Focus 2024, 49. [Google Scholar] [CrossRef]
- Carrilho-Nunes, I.; Catalão-Lopes, M. Factors Influencing the Transition to a Low-Carbon Energy Paradigm: A Systemic Literature Review. Green Low-Carbon Econ. 2024, 3, 1–17. [Google Scholar] [CrossRef]
- Yang, Y.; Xia, S.; Huang, P.; Qian, J. Energy transition: Connotations, mechanisms and effects. Energy Strat. Rev. 2024, 52. [Google Scholar] [CrossRef]
- Diaconescu, M.; Marinas, L.E.; Marinoiu, A.M.; Popescu, M.-F.; Diaconescu, M. Towards Renewable Energy Transition: Insights from Bibliometric Analysis on Scholar Discourse to Policy Actions. Energies 2024, 17, 4719. [Google Scholar] [CrossRef]
- Jing, L.; Zhou, B.; Liao, Z. Decoupling Analysis of Economic Growth and Carbon Emissions in Xinjiang Based on Tapio and Logarithmic Mean Divisia Index Models. Sustainability 2024, 16, 8010. [Google Scholar] [CrossRef]
- Shengrong, Lu; Yao, Liu. Decoupling Elasticity Analysis of Transportation Structure and Carbon Emission Efficiency of Transportation Industry in the Context of Intelligent Transportation. Artificial Intelligence, Medical Engineering and Education, 2024, 86–93. https://doi.org/10.3233/ATDE231318 .
- European Commission: Directorate-General for Research and Innovation and Hollanders, H. European Commission: Directorate-General for Research and Innovation and Hollanders, H., European Innovation Scoreboard 2023, Publications Office of the European Union, 2023. https://data.europa.eu/doi/10. 2777. [Google Scholar]
- Greenhouse gas emissions across EU countries. Quarterly greenhouse gas emissions in the EU. Eurostat website. Available at: https://ec.europa.eu/eurostat/statistics-explained/index.php?
- Overall share of energy from renewable sources, 2004-2023 (% of gross final energy consumption). Eurostat website. Available at: https://ec.europa.eu/eurostat/statistics-explained/index.php?title=File:T1_Overall_share_of_energy_from_renewable_sources,_2004-2023_(%25_of_gross_final_energy_consumption).
- Energy imports dependency. Eurostat website. Available at: https://ec.europa.eu/eurostat/databrowser/view/nrg_ind_id/default/table?
- Share of fossil fuels in gross available energy. Eurostat website. Available at: https://ec.europa.eu/eurostat/databrowser/view/NRG_IND_FFGAE__custom_4713496/bookmark/table? 5435.
- Investments in climate change mitigation by NACE Rev. 2 activity. Eurostat website. Available at: https://ec.europa.eu/eurostat/databrowser/view/env_ac_ccminv__custom_13950904/bookmark/table? 6654.
- Job vacancy statistics by NACE Rev. 2 activity - quarterly data. Eurostat website. Available at: https://ec.europa.eu/eurostat/databrowser/view/jvs_q_nace2__custom_13499757/bookmark/table? 4652.
- Mean and median income by degree of urbanisation. Eurostat website. Available at: https://ec.europa.eu/eurostat/databrowser/view/ilc_di17/default/table?
- Energy consumption per capita, 2023. Eurostat website. Available at: https://ec.europa.eu/eurostat/statistics-explained/images/2/22/Map_1-Energy_consumption_per_capita.
- Ring, M.; Wilson, E.; Ruwanpura, K.N.; Gay-Antaki, M. Just energy transitions? Energy policy and the adoption of clean energy technology by households in Sweden. Energy Res. Soc. Sci. 2022, 91. [Google Scholar] [CrossRef]
- Maliszewska-Nienartowicz, J.; Stefański, O. Decentralisation versus centralisation in Swedish energy policy: the main challenges and drivers for the energy transition at the regional and local levels. Energy Policy 2024, 188. [Google Scholar] [CrossRef]
- Vanhuyse, F.; Piseddu, T.; Jokiaho, J. Climate neutral cities in Sweden: True commitment or hollow statements? Cities 2023, 137. [Google Scholar] [CrossRef]
- Hyvönen, J.; Koivunen, T.; Syri, S. Possible bottlenecks in clean energy transitions: Overview and modelled effects – Case Finland. J. Clean. Prod. 2023, 410. [Google Scholar] [CrossRef]
- Finland is on track to meet some of the world's most ambitious carbon neutrality targets. This is how it has done it. 2023. https://www.weforum. 2023.
- Lebrouhi, B.E.; Schall, E.; Lamrani, B.; Chaibi, Y.; Kousksou, T. Energy Transition in France. Sustainability 2022, 14, 5818. [Google Scholar] [CrossRef]
- Lochot, V.; Khalilpour, K.; Hoadley, A.F.; Sánchez, D.R. French economy and clean energy transition: A macroeconomic multi-objective extended input-output analysis. Sustain. Futur. 2024, 8. [Google Scholar] [CrossRef]
- Lamnatou, C.; Cristofari, C.; Chemisana, D. Renewable energy sources as a catalyst for energy transition: Technological innovations and an example of the energy transition in France. Renew. Energy 2023, 221. [Google Scholar] [CrossRef]
- Ikstena, R.; Lagzdiņa, Ē.; Brizga, J.; Kudrenickis, I.; Ernšteins, R. Energy Citizenship in Energy Transition: The Case of the Baltic States. Sustainability 2024, 16, 9665. [Google Scholar] [CrossRef]
- Meitern, M. Navigating the rise of energy communities in Estonia: Challenges and successes through case studies. Energy Policy 2025, 198. [Google Scholar] [CrossRef]
- Bairrão, D.; Soares, J.; Almeida, J.; Franco, J.F.; Vale, Z. Green Hydrogen and Energy Transition: Current State and Prospects in Portugal. Energies 2023, 16, 551. [Google Scholar] [CrossRef]
- Maia, F.; Leitão, S.; Marques, M.C. Energy transition in Portugal: The harnessing of solar photovoltaics in electric mobility and its impact on the carbon footprint. J. Clean. Prod. 2024, 477. [Google Scholar] [CrossRef]
- Arababadi, A.; Leyer, S.; Hansen, J.; Arababadi, R.; Pignatta, G. Characterizing the Theory of Energy Transition in Luxembourg, Part Two—On Energy Enthusiasts’ Viewpoints. Sustainability 2021, 13, 12069. [Google Scholar] [CrossRef]
- Arababadi, A.; Leyer, S.; Hansen, J.; Arababadi, R. Characterizing the theory of energy transition in Luxembourg—Part three—In the residential sector. Energy Sci. Eng. 2022, 10, 1296–1313. [Google Scholar] [CrossRef]
- Arababadi, A.; Leyer, S.; Arababadi, R.; Pignatta, G. Theoretical Considerations about Energy Transition in Luxembourg. Built Environment Research Forum. LOCATION OF CONFERENCE, COUNTRYDATE OF CONFERENCE; p. 9.
- Chatzinikolaou, D. Integrating Sustainable Energy Development with Energy Ecosystems: Trends and Future Prospects in Greece. Sustainability 2025, 17, 1487. [Google Scholar] [CrossRef]
- Katsaprakakis, D.A.; Proka, A.; Zafirakis, D.; Damasiotis, M.; Kotsampopoulos, P.; Hatziargyriou, N.; Dakanali, E.; Arnaoutakis, G.; Xevgenos, D. Greek Islands’ Energy Transition: From Lighthouse Projects to the Emergence of Energy Communities. Energies 2022, 15, 5996. [Google Scholar] [CrossRef]
- Mezilis, L.; Lavidas, G. Future scenarios for 100% renewables in Greece, untapped potential of marine renewable energies. Energy Convers. Manag. X 2025, 27. [Google Scholar] [CrossRef]
- Brodny, J.; Tutak, M.; Grebski, W. Empirical Assessment of the Efficiency of Poland’s Energy Transition Process in the Context of Implementing the European Union’s Energy Policy. Energies 2024, 17, 2689. [Google Scholar] [CrossRef]
- Tokarski, S.; Urych, B.; Smolinski, A. National Energy and Climate Plan—Polish Participation in the Implementation of European Climate Policy in the 2040 Perspective and Its Implications for Energy Sustainability. Sustainability 2025, 17, 5035. [Google Scholar] [CrossRef]
- Janikowska, O.; Generowicz-Caba, N.; Kulczycka, J. Energy Poverty Alleviation in the Era of Energy Transition—Case Study of Poland and Sweden. Energies 2024, 17, 5481. [Google Scholar] [CrossRef]
- Pechancová, V.; Pavelková, D.; Saha, P. Community Renewable Energy in the Czech Republic: Value Proposition Perspective. Front. Energy Res. 2022, 10. [Google Scholar] [CrossRef]
- Denmark 2023 Energy Policy Review. International Energy Agency (IEA). 23. https://iea.blob.core.windows.net/assets/9af8f6a2-31e7-4136-94a6-fe3aa518ec7d/Denmark_2023. 20 December.
- Zhelev, P. Green Transformation: Bulgaria’s Path in the Energy Transition Process. In: Bulgaria in the Global Economy. Societies and Political Orders in Transition 2025, Springer, Cham. https://doi.org/10.1007/978-3-031-87923-4_13.
- Paliwa kopalne w transformacji energetycznej – przypadek Rumunii. Gospod. Surowcami Miner. - Miner. Resour. Manag. 2023, 39, 85–106. [CrossRef]
- Akçaba, S.; Eminer, F. Sustainable energy planning for the aspiration to transition from fossil energy to renewable energy in Northern Cyprus. Heliyon 2022, 8, e09813. [Google Scholar] [CrossRef] [PubMed]
- Venizelou, V.; Poullikkas, A. Navigating the Evolution of Cyprus’ Electricity Landscape: Drivers, Challenges and Future Prospects. Energies 2025, 18, 1199. [Google Scholar] [CrossRef]
- Maonaigh, C. , Reilly, L., Fitzgerald, L. Marginalised experiences in Ireland’s energy transition – moving towards a just and inclusive policy agenda. Public policy. Available at https://publicpolicy.
- Kotzebue, J.R.; Weissenbacher, M. The EU's Clean Energy strategy for islands: A policy perspective on Malta's spatial governance in energy transition. Energy Policy 2020, 139. [Google Scholar] [CrossRef]
- Crichton, R.; Mette, J.; Tambo, E.; Nduhuura, P.; Nguedia-Nguedoung, A. The impact of Austria’s climate strategy on renewable energy consumption and economic output. Energy Policy 2023, 178. [Google Scholar] [CrossRef]
- Limpens, G.; Jeanmart, H.; Maréchal, F. Belgian Energy Transition: What Are the Options? Energies 2020, 13, 261. [Google Scholar] [CrossRef]
- Blumberga, A.; Pakere, I.; Bohvalovs, Ģ.; Brakovska, V.; Vanaga, R.; Spurins, U.; Klasons, G.; Celmins, V.; Blumberga, D. Impact of the 2022 energy crisis on energy transition awareness in Latvia. Energy 2024, 306. [Google Scholar] [CrossRef]
- Lagzdiņa, Ē.; Brizga, J.; Kudreņickis, I..; Ikstena, R.; Ernšteins, R. Advancing Energy Citizenship: Hindering and Supporting Factors in Latvia’s Energy Transition. In: Fahy, F., Vadovics, E. (eds) Energy Citizenship Across Europe. Palgrave Macmillan, 2025. Cham. https://doi.org/10.1007/978-3-031-70157-3_7 .
- Crnčec, D., Sučić, B., Merše, S. Slovenia: Drivers and Challenges of Energy Transition to Climate Neutrality. In: Mišík, M., Oravcová, V. (eds) From Economic to Energy Transition. Energy, Climate and the Environment. Palgrave Macmillan, 2021. Cham. https://doi.org/10.1007/978-3-030-55085-1_9 .
- Proka, A.; Hisschemöller, M.; Loorbach, D. Transition without Conflict? Renewable Energy Initiatives in the Dutch Energy Transition. Sustainability 2018, 10, 1721. [Google Scholar] [CrossRef]
- Garha, N.S.; Mira, R.G.; González-Laxe, F. Energy Transition Narratives in Spain: A Case Study of As Pontes. Sustainability 2022, 14, 11177. [Google Scholar] [CrossRef]
- He, H.; Tu, H.; Zhang, H.; Luo, S.; Ma, Z.; Yang, X.; Li, Y.; Yang, C.; Wang, J.; Zhao, Z. Systematic evaluation and review of Germany renewable energy research: A bibliometric study from 2008 to 2023. Heliyon 2024, 10, e34933. [Google Scholar] [CrossRef]
- Sulich, A.; & Zema, T. The Green Energy Transition in Germany: A Bibliometric Study. Forum Scientiae Oeconomia, 2023, 11(2), 175–195. [CrossRef]
- Gulyás, T.; Palkovics, L.; Gondola, C. Analysis of Potential Energy Transition Schemes in Hungary: From Natural Gas to Electricity. Chemical Engineering Transactions, 2024, 114, 871–876. [Google Scholar] [CrossRef]
- Murano, G.; Caffari, F.; Calabrese, N.; Dall’ombra, M. Meeting 2030 Targets: Heat Pump Installation Scenarios in Italy. Sustainability 2025, 17, 5938. [Google Scholar] [CrossRef]
- Crichton, R.; Mette, J.; Tambo, E.; Nduhuura, P.; Nguedia-Nguedoung, A. The impact of Austria’s climate strategy on renewable energy consumption and economic output. Energy Policy 2023, 178. [Google Scholar] [CrossRef]
- Genys, D.; Krikštolaitis, R.; Pažėraitė, A. Lithuanian Energy Security Transition: The Evolution of Public Concern and Its Socio-Economic Implications. Energies 2024, 17, 971. [Google Scholar] [CrossRef]
- Slijepčević, S.; Villa, Ž.K.-D. Public Attitudes toward Renewable Energy in Croatia. Energies 2021, 14, 8111. [Google Scholar] [CrossRef]
- Figulová, A.; Gondášová, I. energy transition in Slovakia – destiny in/and change. EJTS European Journal of Transformation Studies, 2023, 11 (1), 169-187.
- Karatayev, M.; Gaduš, J.; Lisiakiewicz, R. Creating pathways toward secure and climate neutral energy system through EnergyPLAN scenario model: The case of Slovak Republic. Energy Rep. 2023, 10, 2525–2536. [Google Scholar] [CrossRef]
- Krasniqi, I. Evaluating strategic approaches to energy transition: leadership, policy, and innovation in European countries. Econ. Environ. 2024, 90, 929–929. [Google Scholar] [CrossRef]
Figure 1.
Research Methodology.
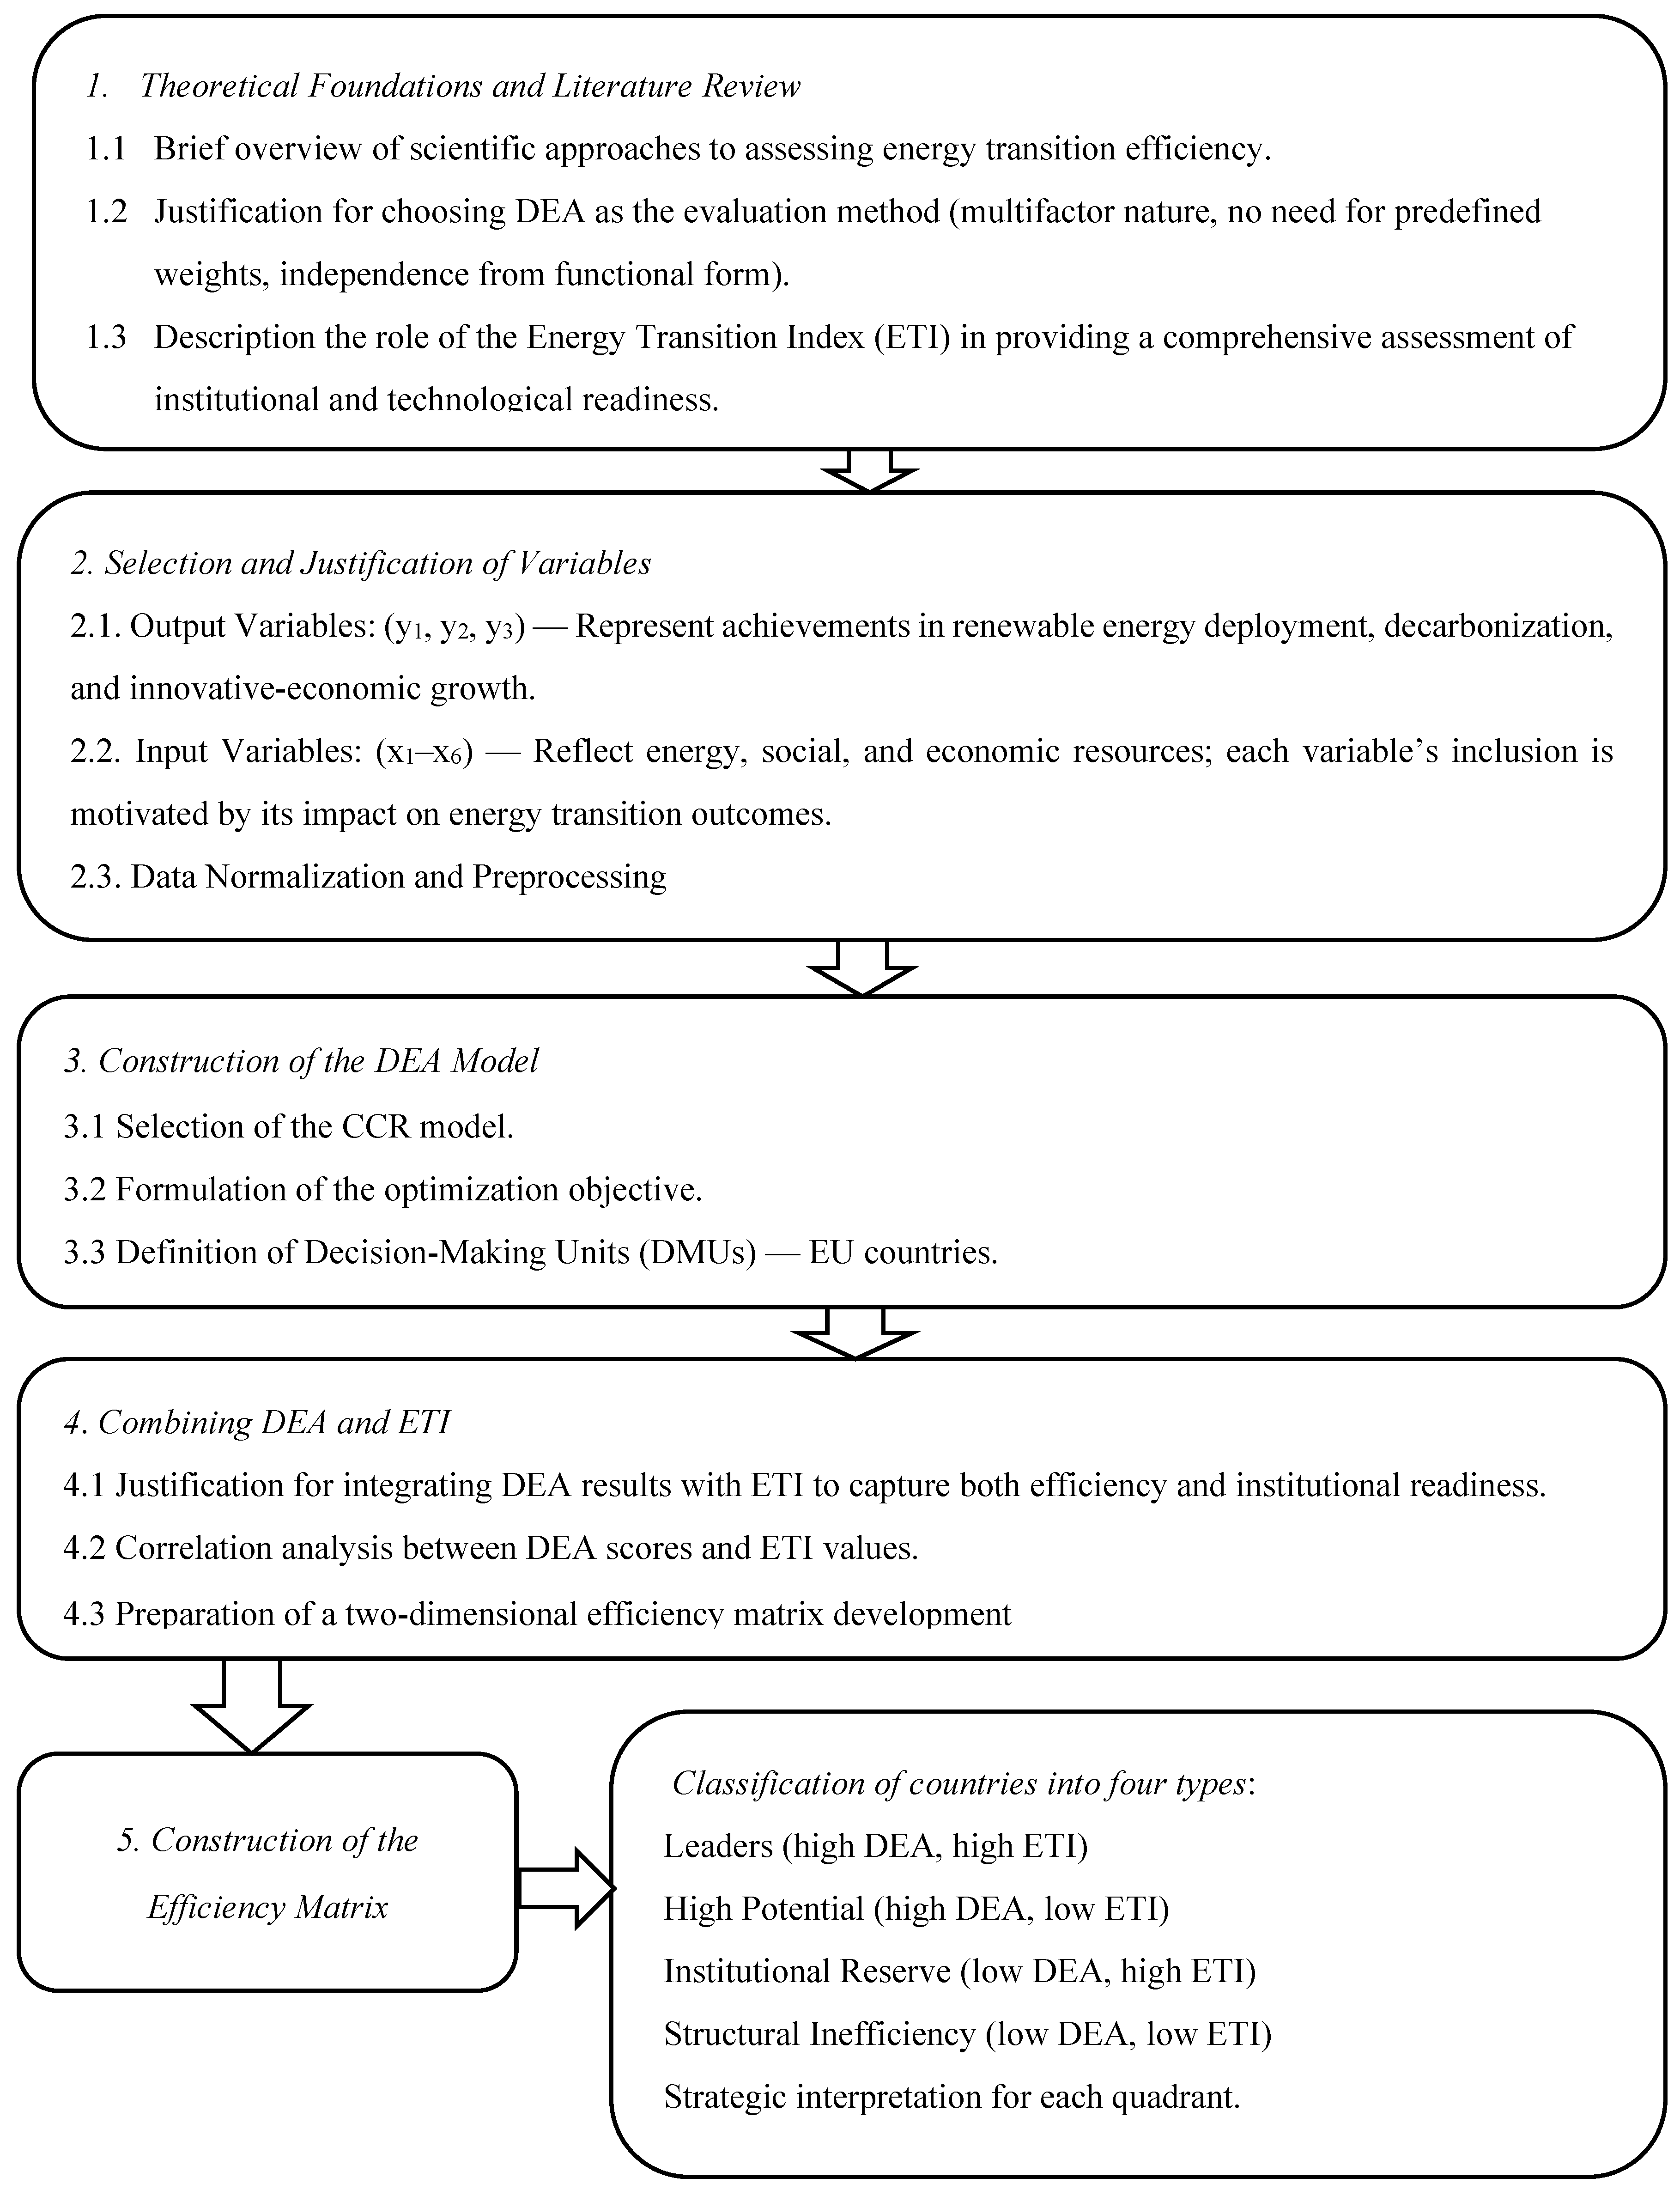
Figure 2.
Representation of the DEA Efficiency Score on the map. Source: compiled using mpl_toolkits.basemap.
Figure 2.
Representation of the DEA Efficiency Score on the map. Source: compiled using mpl_toolkits.basemap.
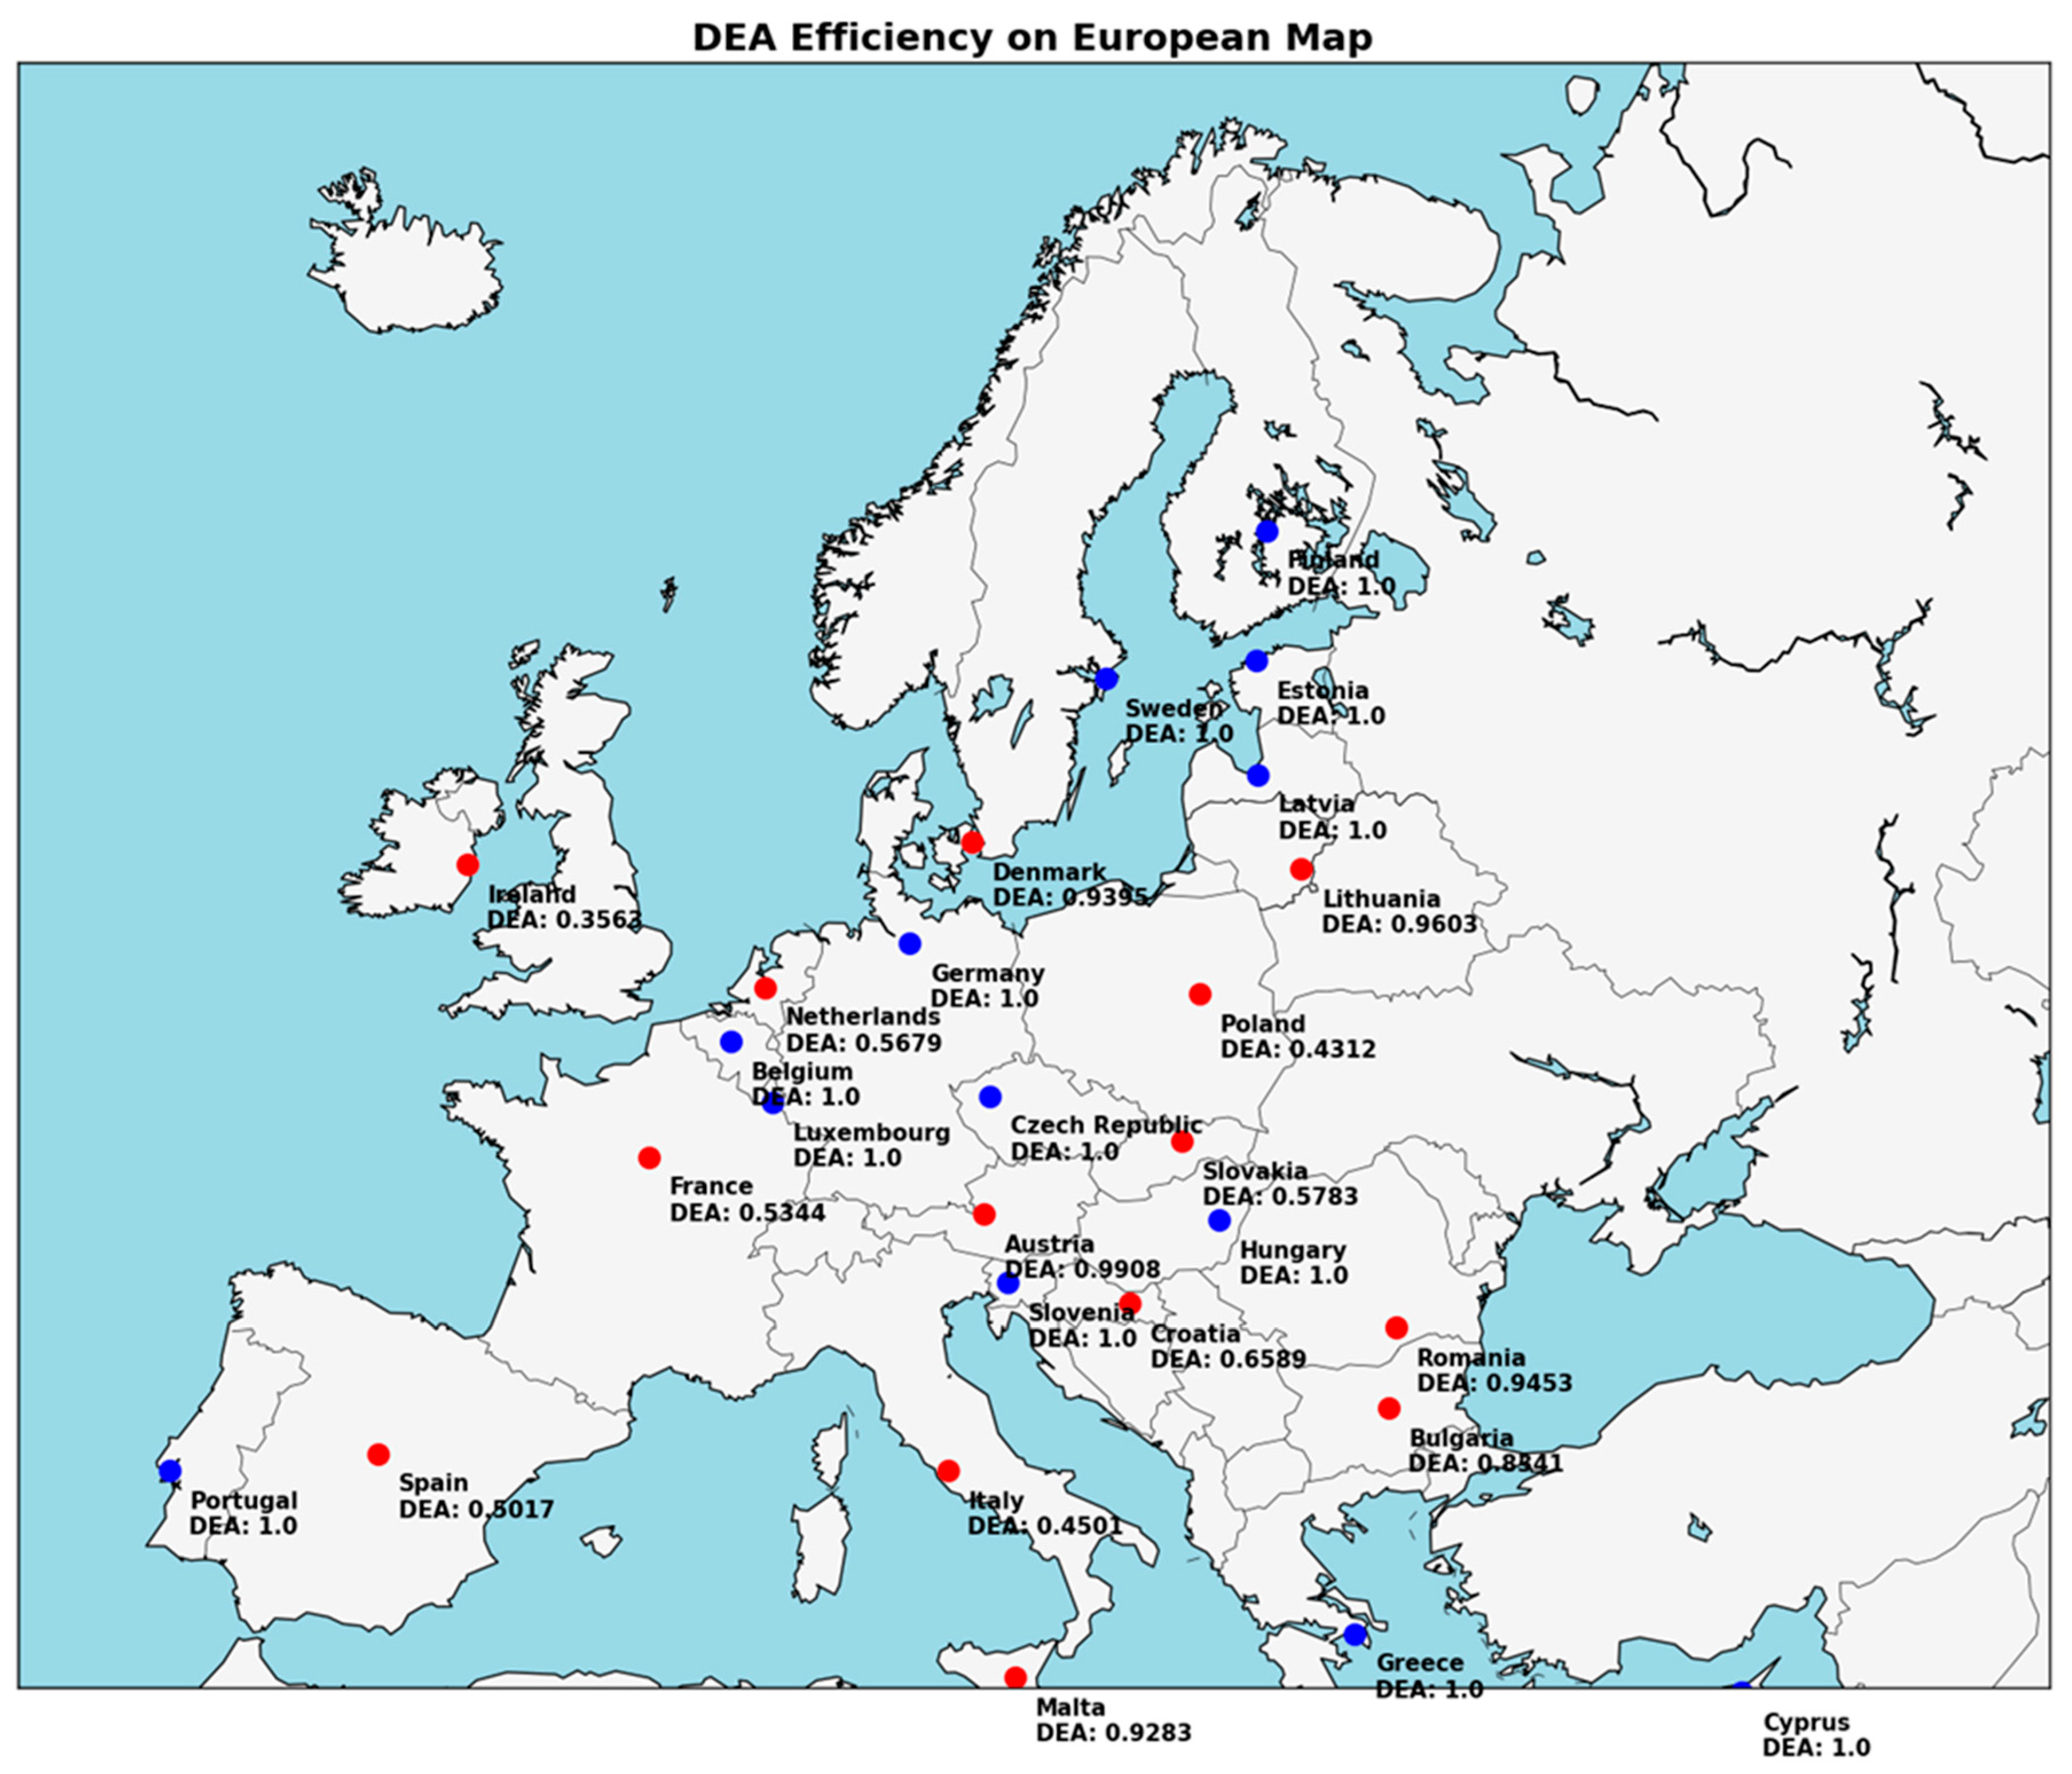
Figure 3.
Representation of energy transition effectiveness matrix DEA vs. ETI for EU countries.
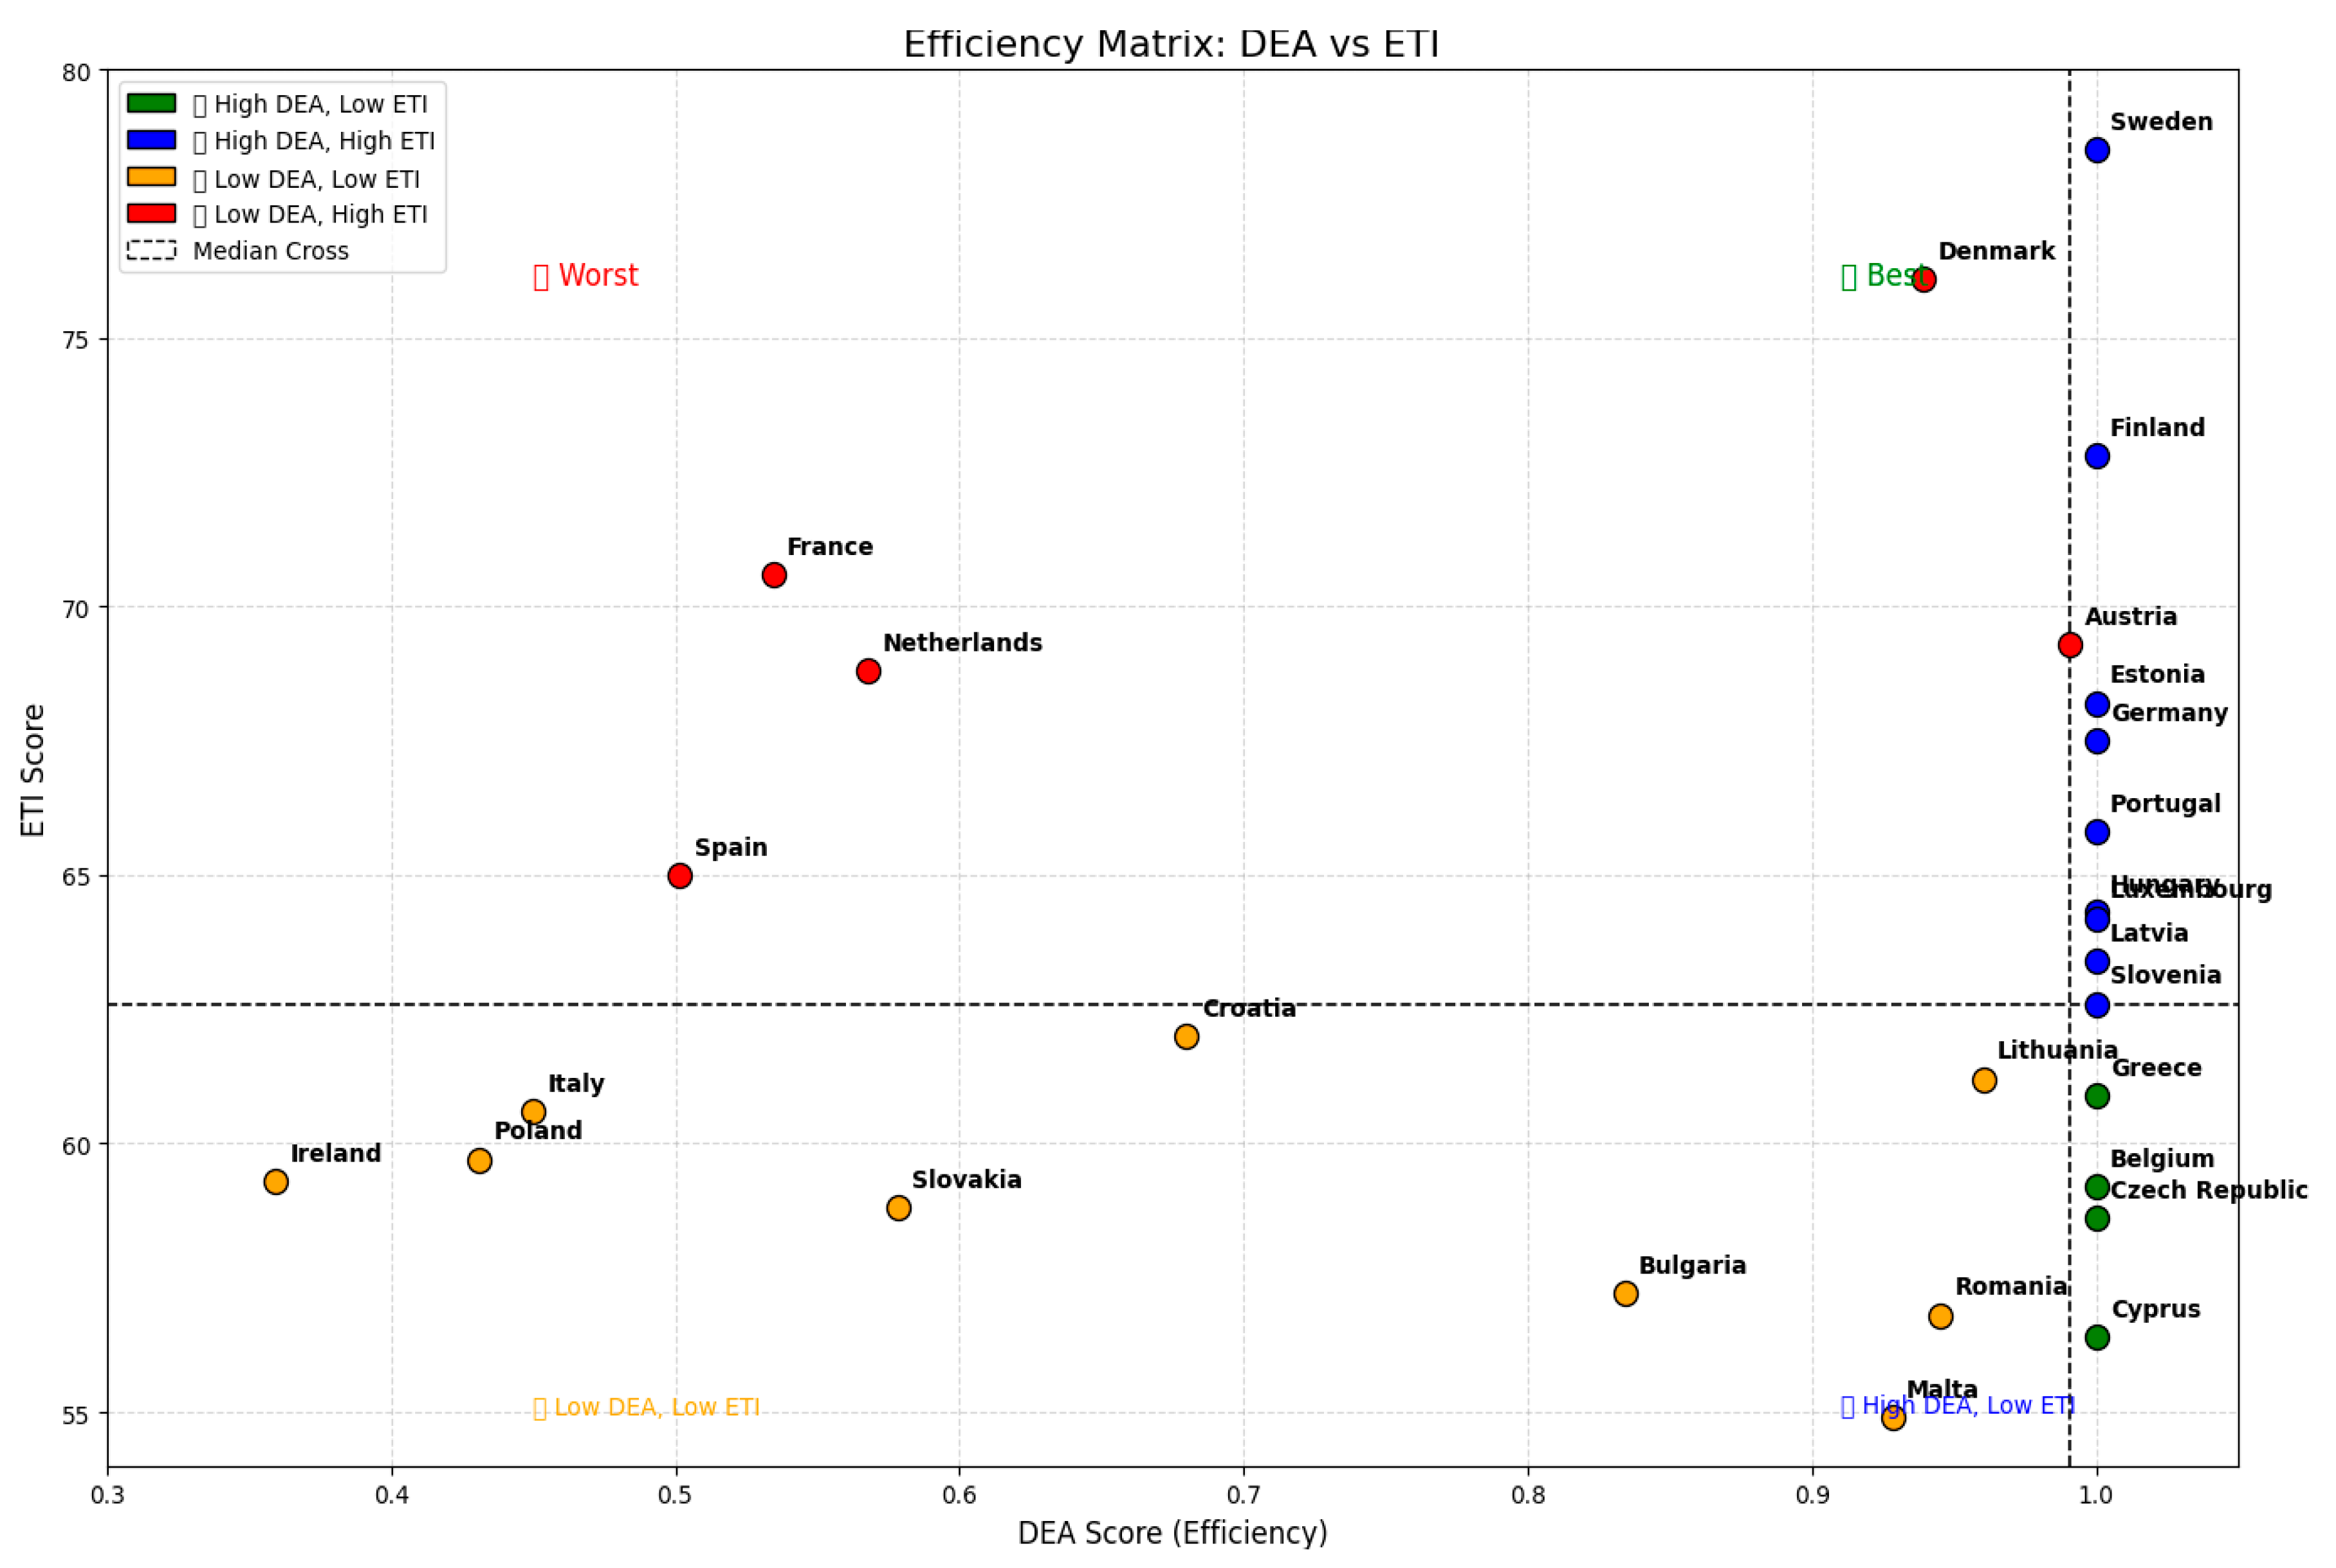
Figure 4.
Representation of reference links between energy transition effectiveness values for EU countries.
Figure 4.
Representation of reference links between energy transition effectiveness values for EU countries.
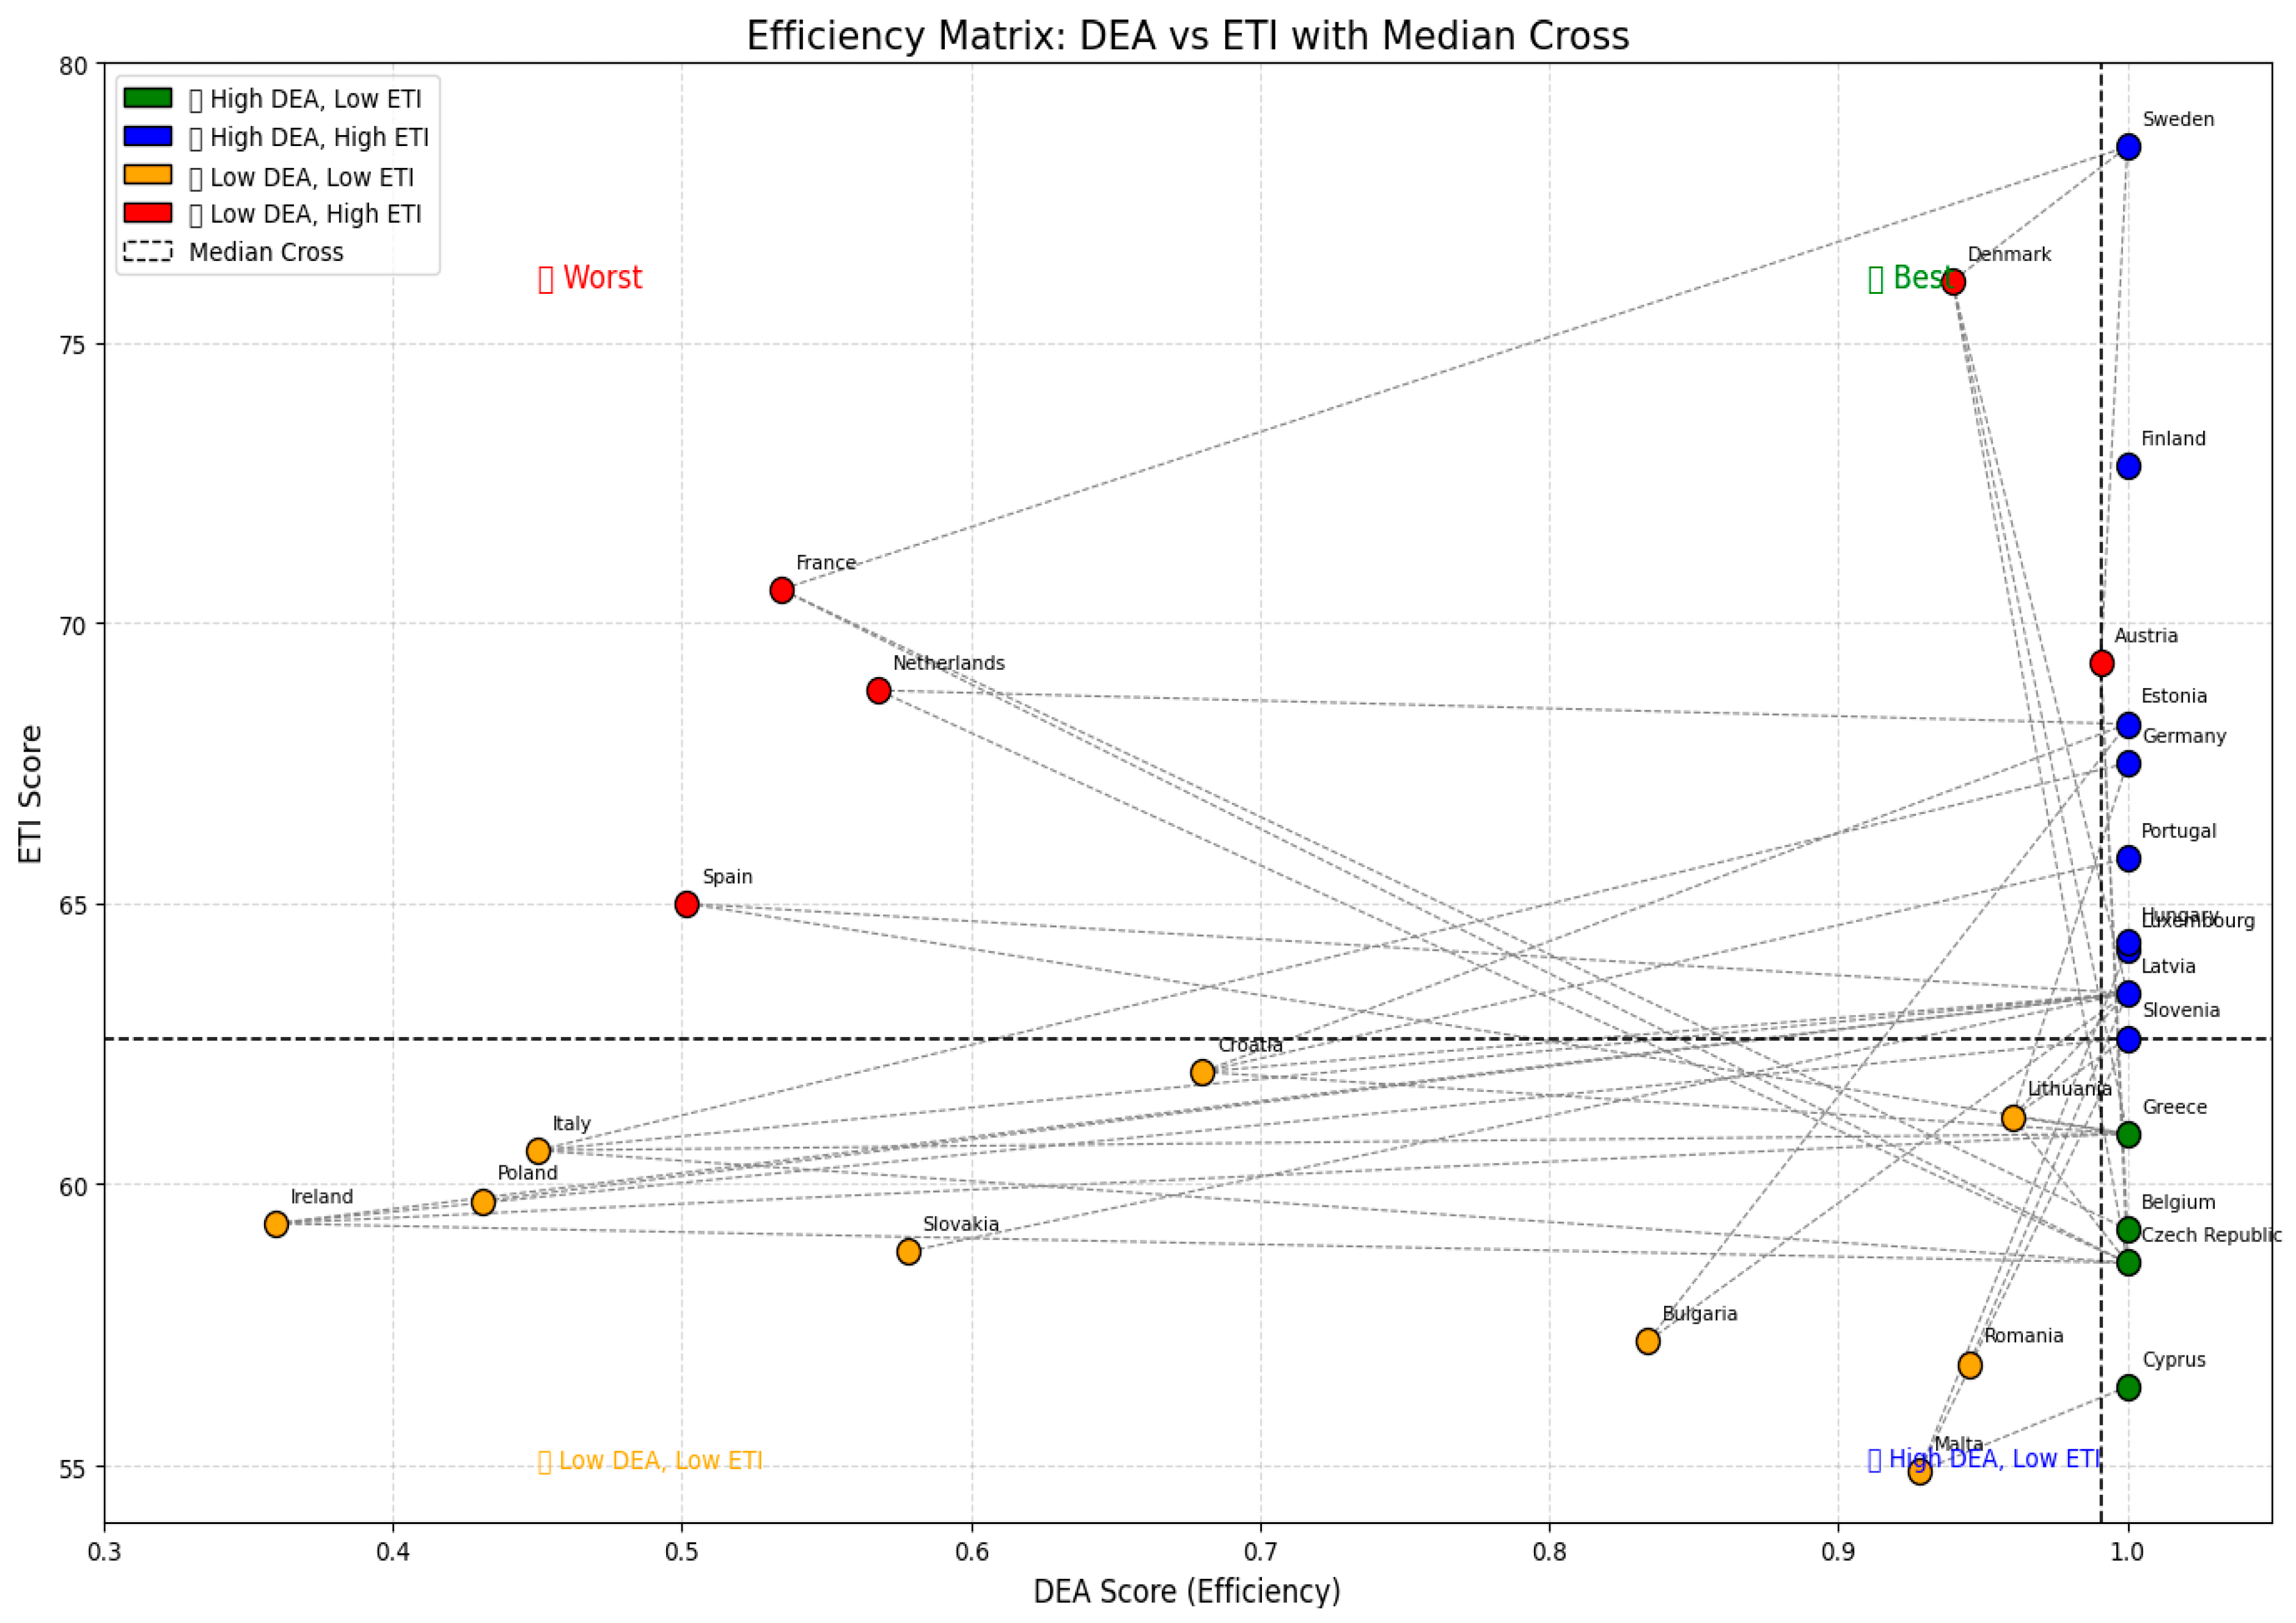
Figure 5.
Visualization of the classification of EU countries according to the efficiency matrix based on the integrated use of DEA and ETI and Distribution of publications dedicated to the study of current energy transition issues in EU countries.
Figure 5.
Visualization of the classification of EU countries according to the efficiency matrix based on the integrated use of DEA and ETI and Distribution of publications dedicated to the study of current energy transition issues in EU countries.
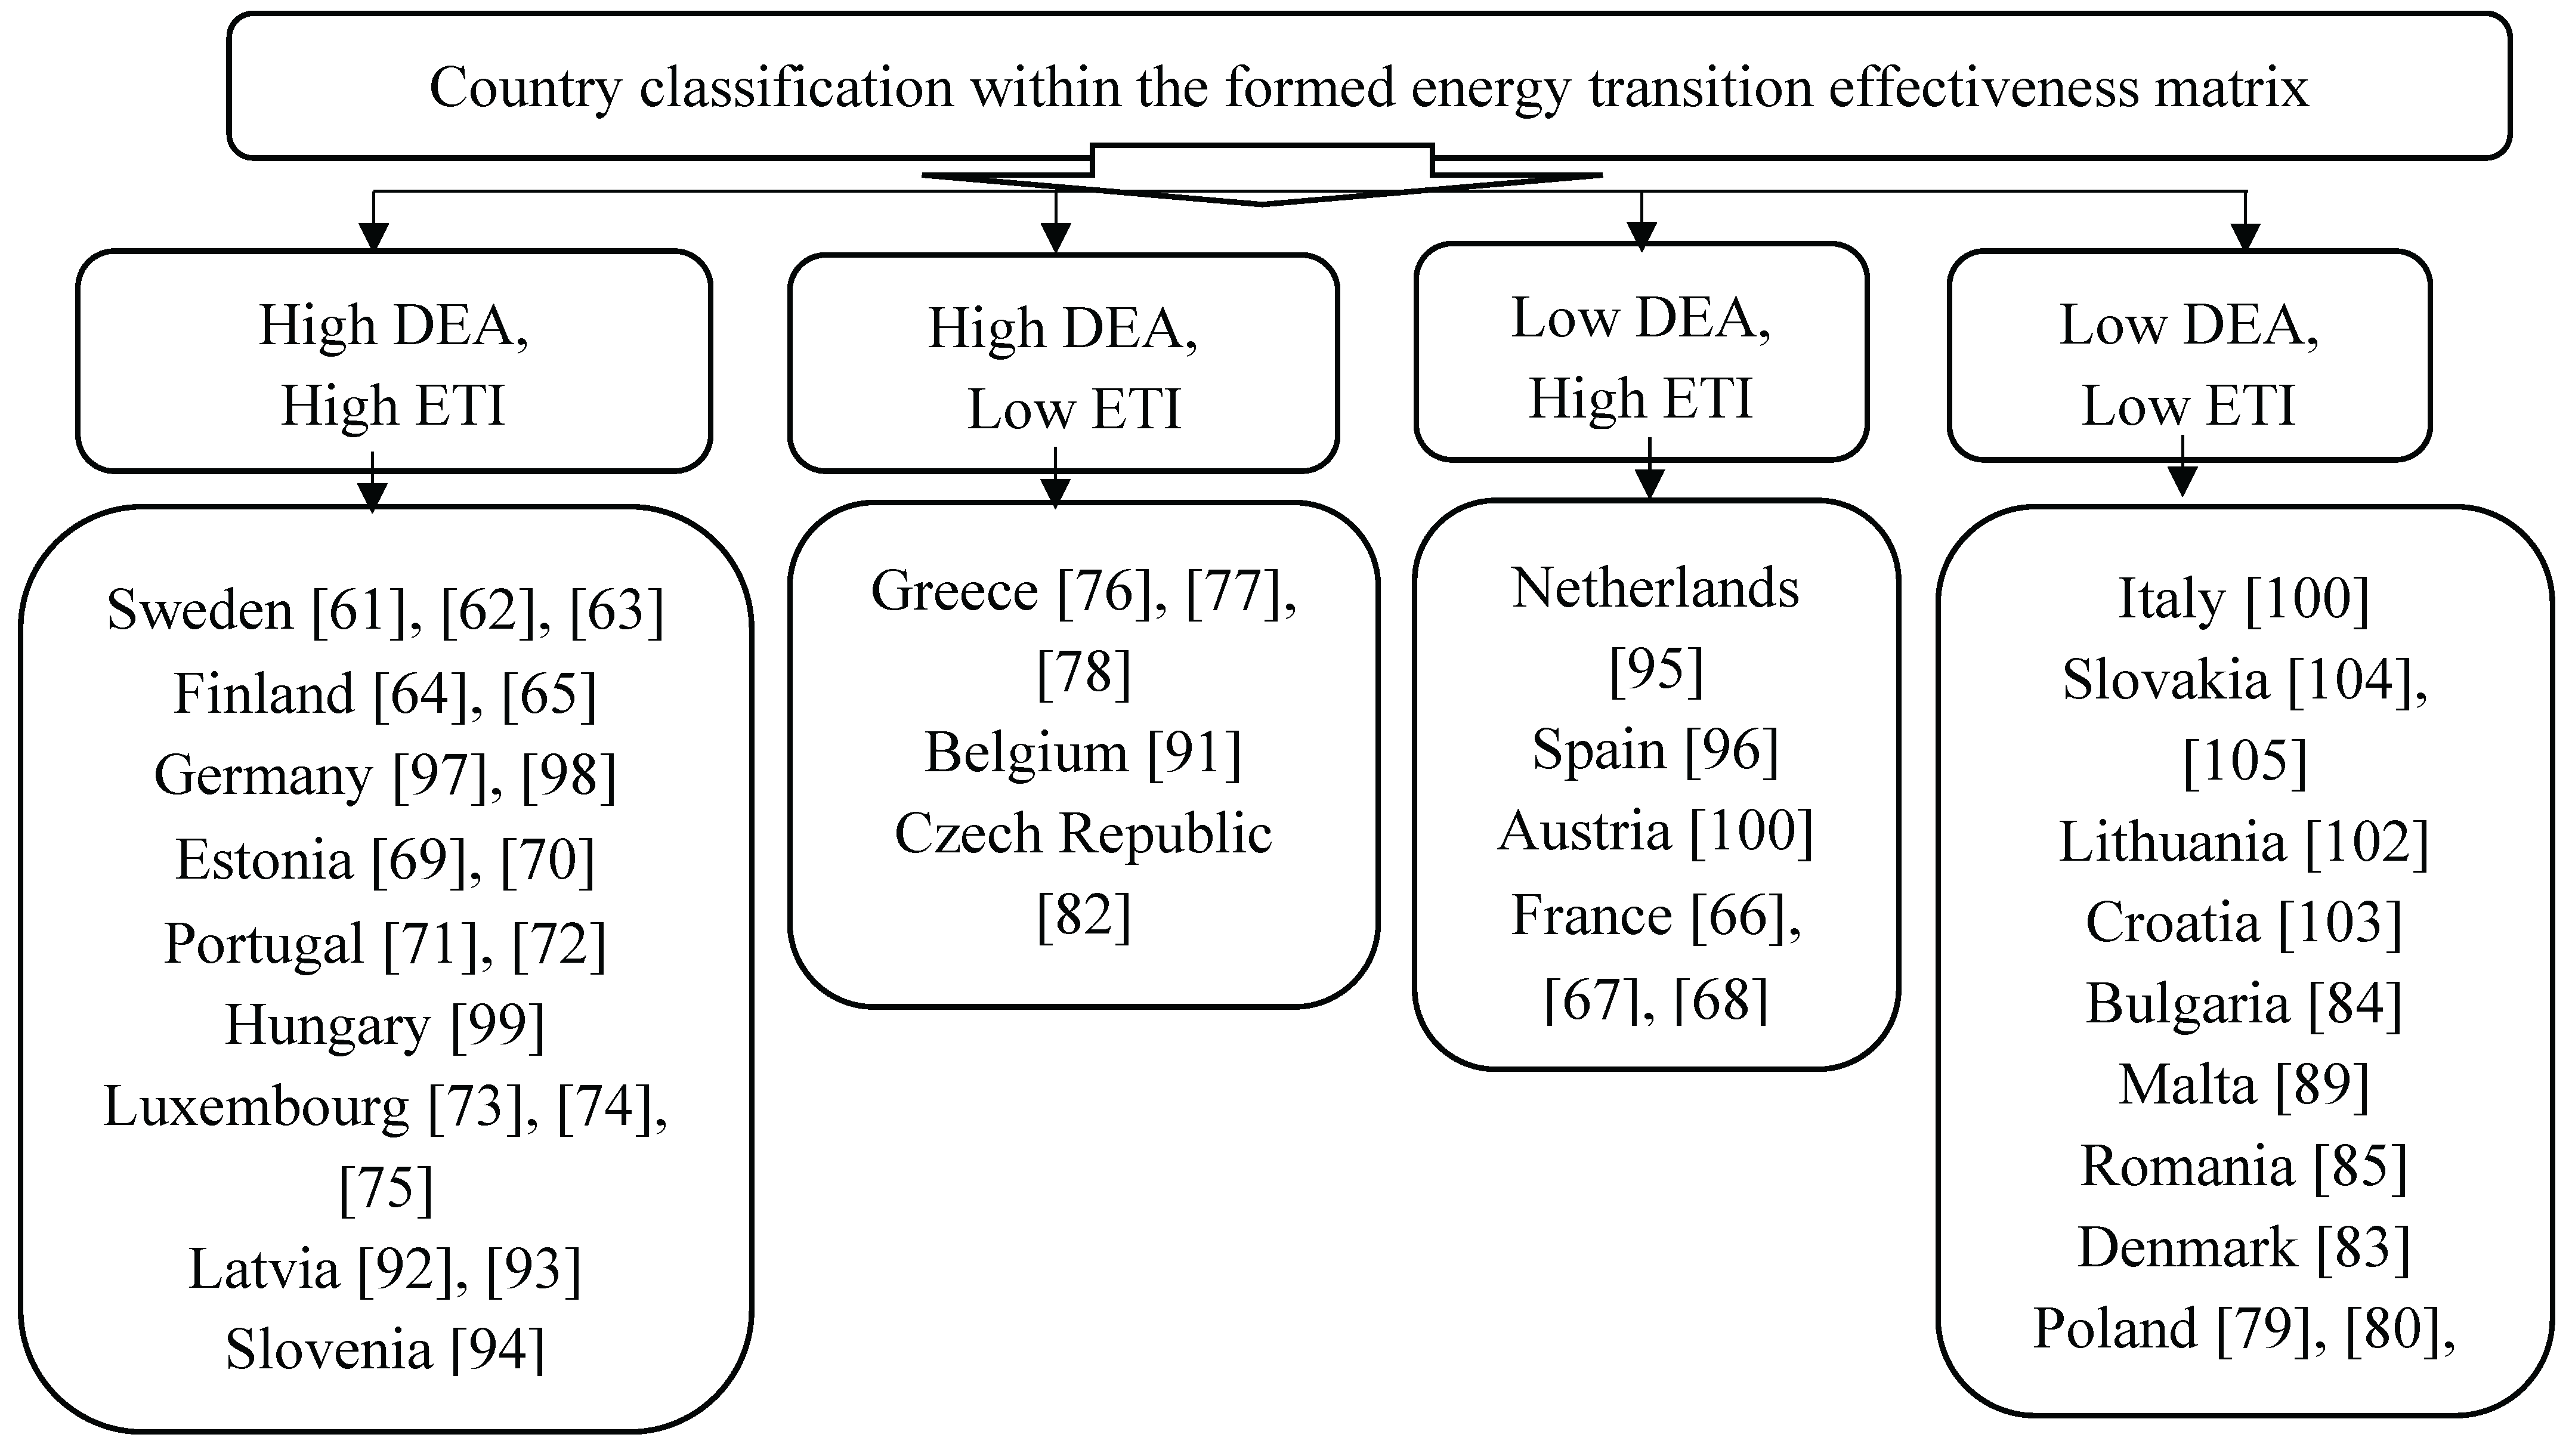
Table 1.
Value of the DS indicator.
| Country | GHG Growth Rate (%) [52] | GDP Growth Rate (%) | (GHG-GDP elasticity) | Regime | DS |
| Belgium | 5.1 | 1.1 | 4,667 | Relative decoupling (GDP↑,GHG↑) |
0,176 |
| Bulgaria | 4.0 | 4.1 | 0,981 | Relative decoupling (GDP↑,GHG↑) |
0,505 |
| Czechia | 2.2 | 1.8 | 1,233 | Relative decoupling (GDP↑,GHG↑) |
0,448 |
| Denmark | 2.6 | 3.9 | 0,655 | Relative decoupling (GDP↑,GHG↑) |
0,604 |
| Germany | 1.6 | -0.4 | -4,040 | Worst-case (GDP↓,GHG↑) | 0,000 |
| Estonia | -11.3 | 1.2 | -9,390 | Absolute decoupling (GDP↑,GHG↓) | 1,000 |
| Ireland | 3.1 | 9.2 | 0,333 | Relative decoupling (GDP↑,GHG↑) |
0,750 |
| Greece | 8.1 | 2.7 | 3,006 | Relative decoupling (GDP↑,GHG↑) |
0,250 |
| Spain | 2.4 | 3.2 | 0,757 | Relative decoupling (GDP↑,GHG↑) |
0,569 |
| France | 0.4 | 1.1 | 0,331 | Relative decoupling (GDP↑,GHG↑) |
0,751 |
| Croatia | 6.1 | 3.9 | 1,566 | Relative decoupling (GDP↑,GHG↑) |
0,390 |
| Italy | 4.1 | 1.0 | 4,126 | Relative decoupling (GDP↑,GHG↑) |
0,195 |
| Cyprus | 4.4 | 2.6 | 1,674 | Relative decoupling (GDP↑,GHG↑) |
0,374 |
| Latvia | -1.4 | -0.4 | 3,453 | Both falling (GDP↓,GHG↓) |
0,467 |
| Lithuania | 10.8 | 4.0 | 2,704 | Relative decoupling (GDP↑,GHG↑) |
0,270 |
| Luxembourg | -2.3 | 1.8 | -1,292 | Absolute decoupling (GDP↑,GHG↓) | 1,000 |
| Hungary | 4.7 | 0.4 | 11,783 | Relative decoupling (GDP↑,GHG↑) |
0,078 |
| Malta | 1.7 | 2.8 | 0,615 | Relative decoupling (GDP↑,GHG↑) |
0,619 |
| Netherlands | 4.1 | 1.9 | 2,163 | Relative decoupling (GDP↑,GHG↑) |
0,316 |
| Austria | -1.7 | -0.5 | 3,382 | Both falling (GDP↓,GHG↓) |
0,464 |
| Poland | 1.6 | 4.1 | 0,400 | Relative decoupling (GDP↑,GHG↑) |
0,714 |
| Portugal | 2.4 | 2.9 | 0,813 | Relative decoupling (GDP↑,GHG↑) |
0,552 |
| Romania | 0.3 | 0.5 | 0,662 | Relative decoupling (GDP↑,GHG↑) |
0,602 |
| Slovenia | 9.4 | 1.5 | 6,266 | Relative decoupling (GDP↑,GHG↑) |
0,138 |
| Slovakia | 2.6 | 1.7 | 1,514 | Relative decoupling (GDP↑,GHG↑) |
0,398 |
| Finland | -6.1 | 0.9 | -6,789 | Absolute decoupling (GDP↑,GHG↓) | 1,000 |
| Sweden | -2.3 | 1.9 | -1,232 | Absolute decoupling (GDP↑,GHG↓) | 1,000 |
Table 2.
Input and Output Indicators for DEA Analysis.
|
RES_ share, % [54] |
Imp_ dep, % [55] |
Fossi_ share, % [56] |
CCM_inv, million euro [57] | JV_PST, % [58] | DS |
EIS [52] |
IDU, mln euro [59] | EC_per capita [60] | |
| Austria | 40.84 | 61.1 | 66.42 | 2756.33 | 7.4 | 0.464 | 119.9 | 34130 | 145 |
| Belgium | 14.74 | 76.1 | 73.62 | 3682.74 | 8.5 | 0.176 | 125.8 | 29244 | 200 |
| Bulgaria | 22.58 | 39.7 | 66.32 | 194.90 | 0.7 | 0.505 | 46.7 | 10048 | 112 |
| Croatia | 28.05 | 55.7 | 67.28 | 353.61 | 1.93 | 0.390 | 69.6 | 120690 | 96 |
| Czech Republic | 48.59 | 41.7 | 71.47 | 981.11 | 8.0 | 0.448 | 94.7 | 16665 | 149 |
| Denmark | 44.92 | 38.9 | 57.23 | 5039.79 | 3.35 | 0.604 | 137.6 | 37853 | 117 |
| Estonia | 40.95 | 3.5 | 68.51 | 172.73 | 2.38 | 1.000 | 98.6 | 18216 | 138 |
| Finland | 50.75 | 29.6 | 38.26 | 1769.69 | 3.7 | 1.000 | 134.3 | 32690 | 253 |
| France | 22.28 | 44.9 | 48.15 | 21606.03 | 2.95 | 0.751 | 105.3 | 29445 | 138 |
| Germany | 21.55 | 66.4 | 78.77 | 18589.47 | 6.8 | 0.00 | 117.8 | 31091 | 130 |
| Greece | 25.27 | 75.6 | 82.18 | 339.83 | 3.2 | 0.250 | 79.5 | 12144 | 34 |
| Hungary | 17.36 | 62.1 | 69.43 | 1424.54 | 3.7 | 0.078 | 70.4 | 9548 | 106 |
| Ireland | 15.25 | 77.9 | 87.67 | 425.47 | 1.68 | 0.750 | 115.8 | 38642 | 115 |
| Italy | 19.56 | 78.4 | 78.32 | 4976.76 | 2.08 | 0.195 | 90.3 | 24143 | 103 |
| Latvia | 43.22 | 32.7 | 57.08 | 378.11 | 2.7 | 0.467 | 52.5 | 14390 | 98 |
| Lithuania | 31.93 | 68.0 | 64.46 | 804.90 | 1.78 | 0.270 | 83.8 | 16115 | 107 |
| Poland | 16.50 | 48.0 | 88.00 | 2899.62 | 0.9 | 0.714 | 62.8 | 12740 | 112 |
| Portugal | 35.16 | 66.9 | 68.27 | 150.14 | 2.43 | 0.552 | 85.6 | 15705 | 90 |
| Romania | 25.76 | 27.9 | 72.47 | 1258.56 | 0.83 | 0.602 | 33.1 | 9263 | 68 |
| Slovakia | 16.99 | 57.7 | 63.78 | 417.20 | 0.43 | 0.398 | 65.6 | 9781 | 127 |
| Slovenia | 25.07 | 49.3 | 60.93 | 141.72 | 4.1 | 0.138 | 95.1 | 20487 | 120 |
| Spain | 24.85 | 68.4 | 72.38 | 2911.79 | 0.98 | 0.569 | 89.2 | 22278 | 109 |
| Sweden | 66.39 | 26.4 | 31.39 | 5921.94 | 3.9 | 1.000 | 134.5 | 31849 | 187 |
| Luxembourg | 11.62 | 90.6 | 78.69 | 137.00 | 5.0 | 1.000 | 117.2 | 64863 | 234 |
| Netherlands | 17.15 | 40.45 | 89.13 | 2485.59 | 4.53 | 0.316 | 128.7 | 32404 | 179 |
| Malta | 15.08 | 97.56 | 96.28 | 64.66 | 2.78 | 0.619 | 85.8 | 24848 | 247 |
| Cyprus | 20.21 | 92.21 | 88.83 | 16.93 | 2.85 | 0.374 | 105.4 | 23907 | 125 |
Table 3.
Normalized DEA Analysis Indicators for EU Countries.
| RES_share, % | Imp_dep, % |
Fossi_ share, % |
CCM_inv, million euro | JV_PST, % | DS | EIS | IDU, mln euro | EC_per capita | |
| Austria | 0.534 | 0.388 | 0.381 | 0.873 | 0.136 | 0.464 | 0.169 | 0.777 | 0.493 |
| Belgium | 0.057 | 0.228 | 0.254 | 0.830 | 0.000 | 0.176 | 0.113 | 0.821 | 0.242 |
| Bulgaria | 0.200 | 0.615 | 0.383 | 0.992 | 0.967 | 0.505 | 0.870 | 0.993 | 0.644 |
| Croatia | 0.300 | 0.445 | 0.366 | 0.984 | 0.814 | 0.390 | 0.651 | 0.000 | 0.717 |
| Czech Republic | 0.675 | 0.594 | 0.292 | 0.955 | 0.062 | 0.448 | 0.411 | 0.934 | 0.475 |
| Denmark | 0.608 | 0.624 | 0.544 | 0.767 | 0.638 | 0.604 | 0.000 | 0.743 | 0.621 |
| Estonia | 0.536 | 1.000 | 0.344 | 0.993 | 0.758 | 1.000 | 0.373 | 0.920 | 0.525 |
| Finland | 0.714 | 0.723 | 0.879 | 0.919 | 0.595 | 1.000 | 0.032 | 0.790 | 0.000 |
| France | 0.195 | 0.560 | 0.704 | 0.000 | 0.688 | 0.751 | 0.309 | 0.819 | 0.525 |
| Germany | 0.181 | 0.331 | 0.163 | 0.140 | 0.211 | 0.000 | 0.189 | 0.804 | 0.562 |
| Greece | 0.249 | 0.233 | 0.103 | 0.985 | 0.657 | 0.250 | 0.556 | 0.974 | 1.000 |
| Hungary | 0.105 | 0.377 | 0.328 | 0.935 | 0.595 | 0.078 | 0.643 | 0.997 | 0.671 |
| Ireland | 0.066 | 0.209 | 0.006 | 0.981 | 0.845 | 0.750 | 0.209 | 0.736 | 0.630 |
| Italy | 0.145 | 0.204 | 0.171 | 0.770 | 0.796 | 0.195 | 0.453 | 0.866 | 0.685 |
| Latvia | 0.577 | 0.690 | 0.546 | 0.983 | 0.719 | 0.467 | 0.814 | 0.954 | 0.708 |
| Lithuania | 0.371 | 0.314 | 0.416 | 0.964 | 0.833 | 0.270 | 0.515 | 0.939 | 0.667 |
| Poland | 0.089 | 0.527 | 0.000 | 0.866 | 0.942 | 0.714 | 0.716 | 0.969 | 0.644 |
| Portugal | 0.430 | 0.326 | 0.349 | 0.994 | 0.752 | 0.552 | 0.498 | 0.942 | 0.744 |
| Romania | 0.258 | 0.741 | 0.274 | 0.942 | 0.950 | 0.602 | 1.000 | 1.000 | 0.845 |
| Slovakia | 0.098 | 0.424 | 0.428 | 0.981 | 1.000 | 0.398 | 0.689 | 0.995 | 0.575 |
| Slovenia | 0.246 | 0.513 | 0.478 | 0.994 | 0.545 | 0.138 | 0.407 | 0.899 | 0.607 |
| Spain | 0.242 | 0.310 | 0.276 | 0.866 | 0.932 | 0.569 | 0.463 | 0.883 | 0.658 |
| Sweden | 1.000 | 0.757 | 1.000 | 0.726 | 0.570 | 1.000 | 0.030 | 0.797 | 0.301 |
| Luxembourg | 0.000 | 0.074 | 0.164 | 0.994 | 0.434 | 1.000 | 0.195 | 0.501 | 0.087 |
| Netherlands | 0.101 | 0.607 | -0.020 | 0.886 | 0.492 | 0.316 | 0.085 | 0.792 | 0.338 |
| Malta | 0.063 | 0.000 | -0.146 | 0.998 | 0.709 | 0.619 | 0.496 | 0.860 | 0.027 |
| Cyprus | 0.157 | 0.057 | -0.015 | 1.000 | 0.700 | 0.374 | 0.308 | 0.869 | 0.584 |
Table 4.
Values of the ITE and DEA Indicators.
| # | Country | DEA Efficiency Index | ETI |
| 1 | Belgium | 1 | 59.2 |
| 2 | Czech Republic | 1 | 58.6 |
| 3 | Estonia | 1 | 68.2 |
| 4 | Finland | 1 | 72.8 |
| 5 | Greece | 1 | 60.9 |
| 6 | Latvia | 1 | 63.4 |
| 7 | Portugal | 1 | 65.8 |
| 8 | Slovenia | 1 | 62.6 |
| 9 | Sweden | 1 | 78.5 |
| 10 | Luxembourg | 1 | 64.2 |
| 11 | Cyprus | 1 | 56.4 |
| 12 | Germany | 1 | 67.5 |
| 13 | Hungary | 1 | 64.3 |
| 14 | Austria | 0.9908 | 69.3 |
| 15 | Lithuania | 0.9603 | 61.2 |
| 16 | Romania | 0.9453 | 56.8 |
| 17 | Denmark | 0.9395 | 76.1 |
| 18 | Malta | 0.9283 | 54.9 |
| 19 | Bulgaria | 0.8341 | 57.2 |
| 20 | Croatia | 0.6589 | 62.0 |
| 21 | Spain | 0.5017 | 65.0 |
| 22 | Slovakia | 0.5783 | 58.8 |
| 23 | Netherlands | 0.5679 | 68.8 |
| 24 | France | 0.5344 | 70.6 |
| 25 | Italy | 0.4501 | 60.6 |
| 26 | Poland | 0.4312 | 59.7 |
| 27 | Ireland | 0.3563 | 59.3 |
Disclaimer/Publisher’s Note: The statements, opinions and data contained in all publications are solely those of the individual author(s) and contributor(s) and not of MDPI and/or the editor(s). MDPI and/or the editor(s) disclaim responsibility for any injury to people or property resulting from any ideas, methods, instructions or products referred to in the content. |
© 2025 by the authors. Licensee MDPI, Basel, Switzerland. This article is an open access article distributed under the terms and conditions of the Creative Commons Attribution (CC BY) license (https://creativecommons.org/licenses/by/4.0/).
Copyright: This open access article is published under a Creative Commons CC BY 4.0 license, which permit the free download, distribution, and reuse, provided that the author and preprint are cited in any reuse.


