Submitted:
03 October 2025
Posted:
03 October 2025
Read the latest preprint version here
Abstract
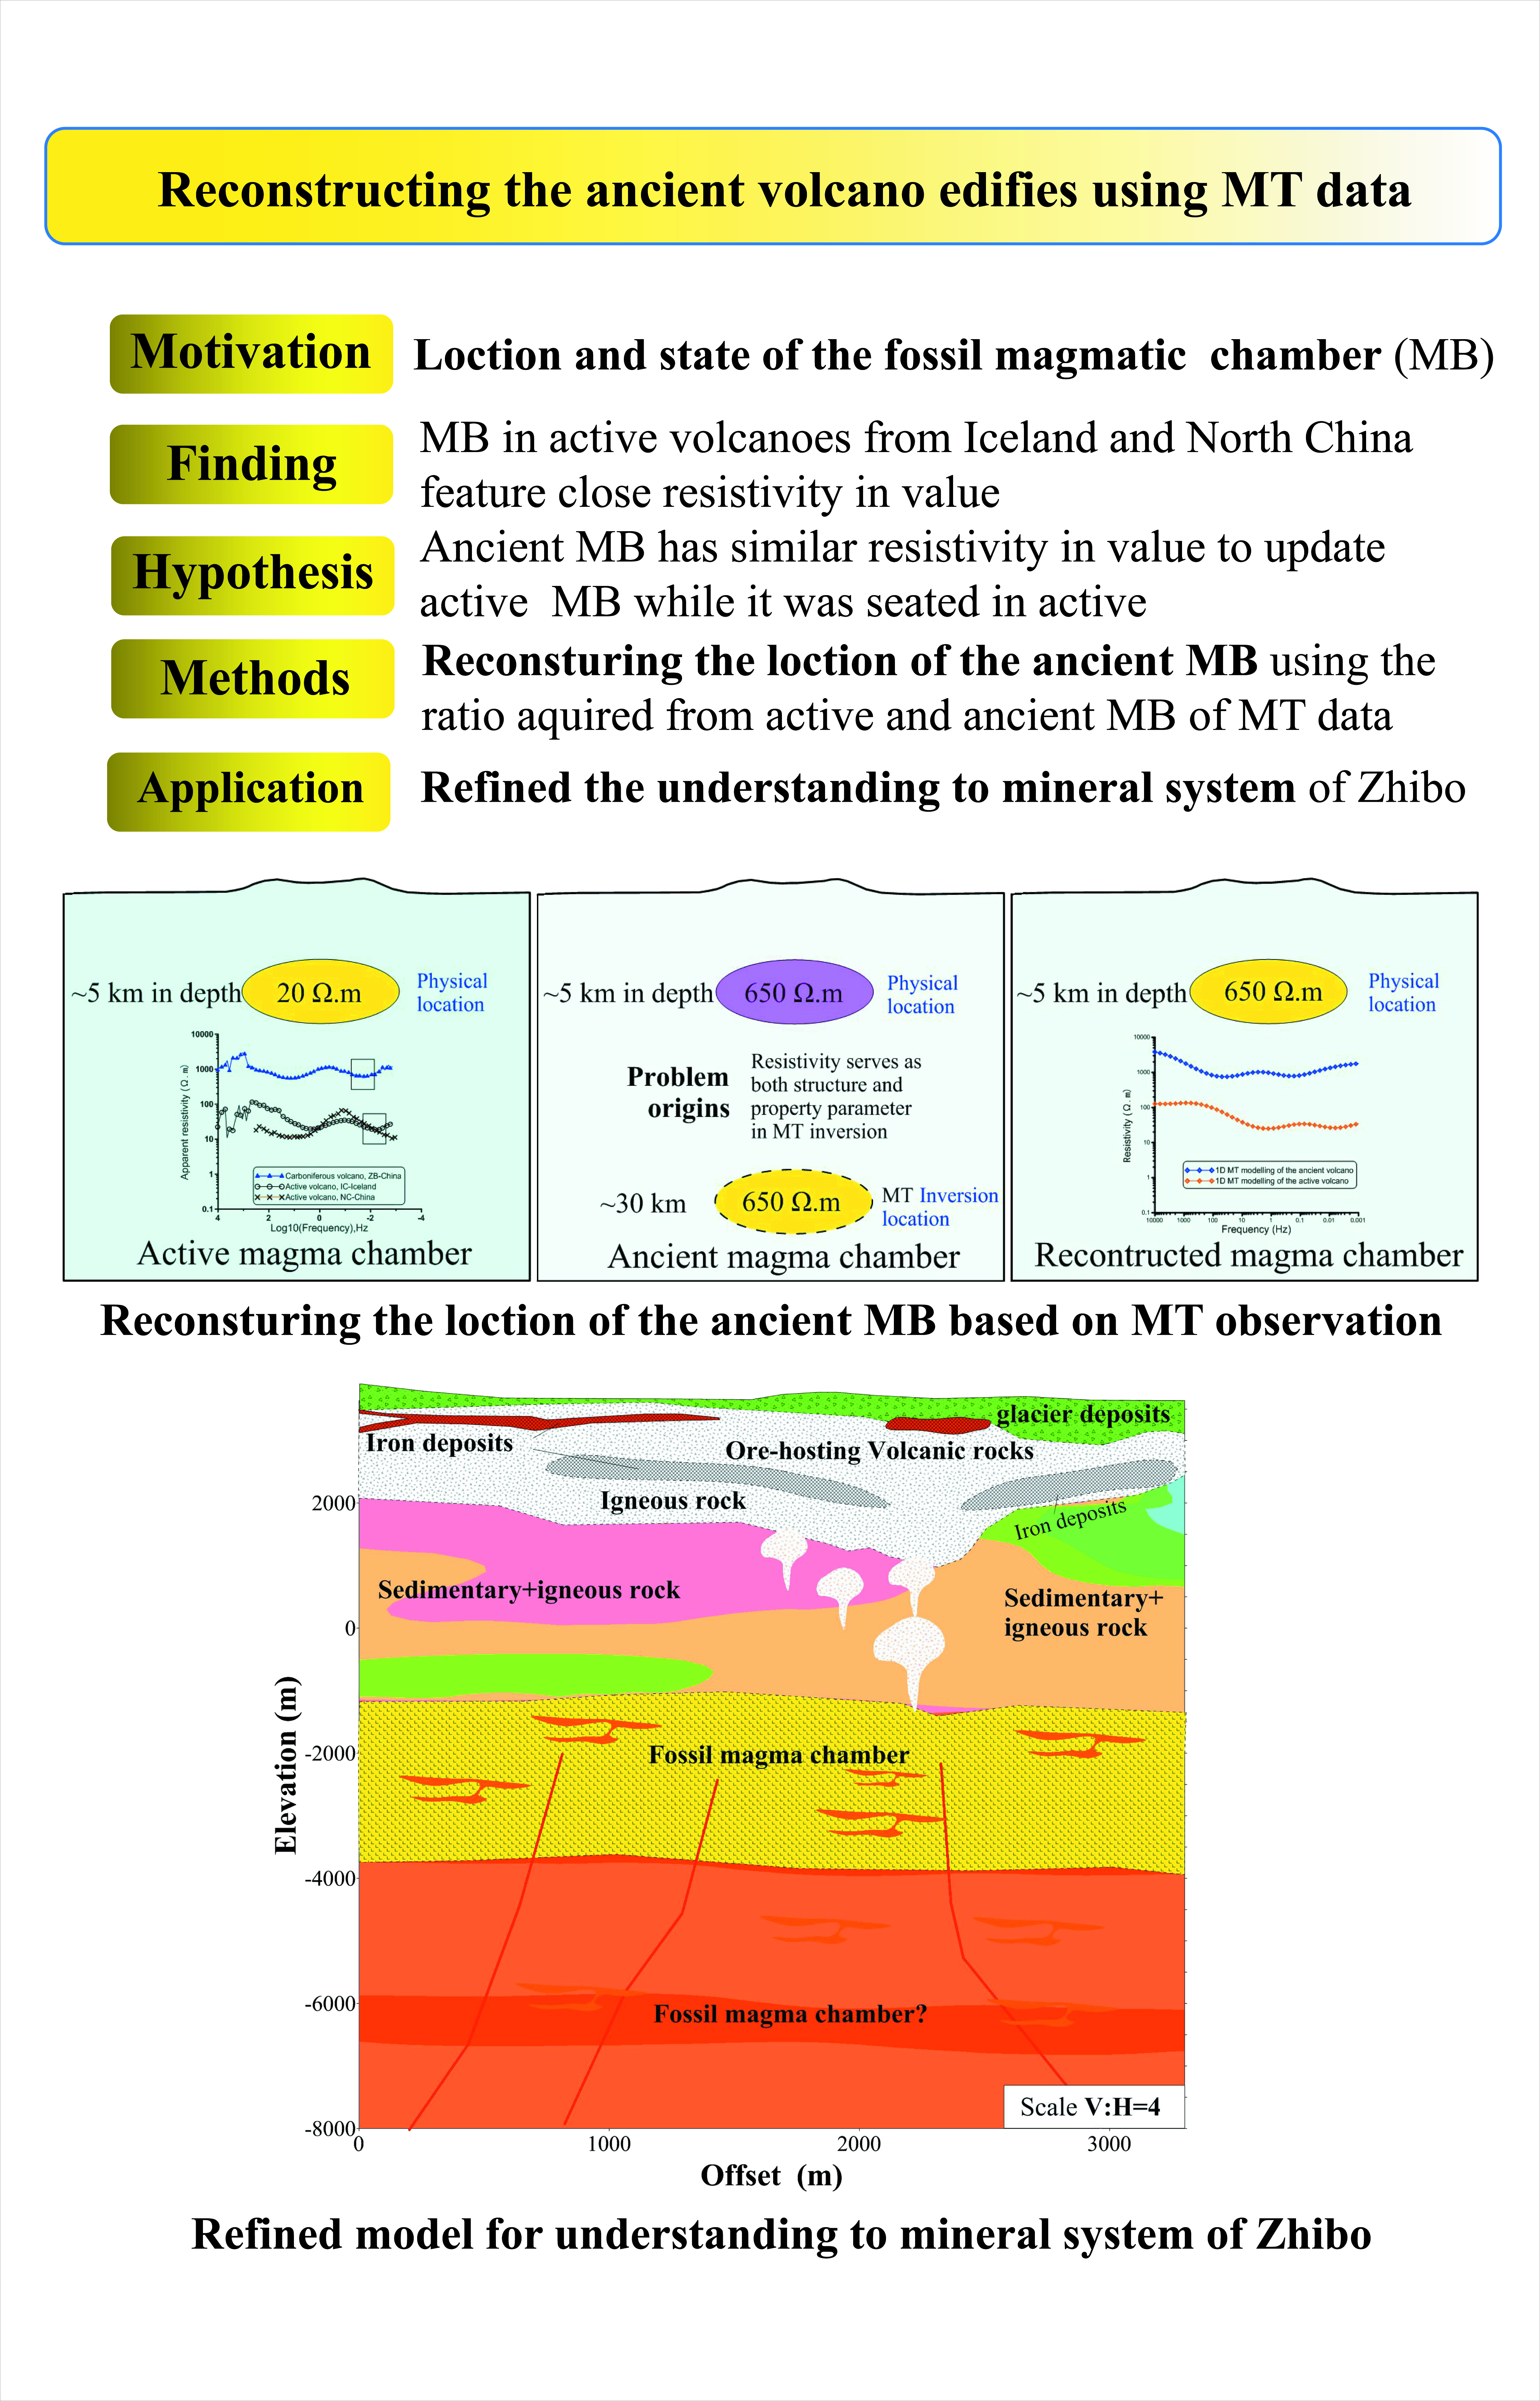
Volcanoes serves as the main pathways for the heat and material from internal to surface of the Earth. It is the window into the Earth because they provide and record many clues to what is going on in the subsurface. Active and potentially active volcanoes greatly affected the course of human history and are closely related to the present tectonics of the Earth. As a result, a great number of active volcanoes have experienced comprehensive geophysical studies. However, understanding to the internal structure of the ancient volcano complexes remains very poor. We propose a new approach to study the structure of the ancient volcano complexes based on the comparison of the magnetotelluric (MT) observation from Zhibo (ZB) ancient volcano and the active mid-oceanic ridges volcanoes from Iceland and intracontinental volcanoes from north China. MT responses of magma chambers from active volcanoes from Iceland and north China shows very close low resistivity values ranges from several to tens Ω.m, which indicates that the active magma have very close resistivity. Based on these observations, we assumed that the ancient active volcano chambers have similar resistivity as current active volcanoes. We then reconstruct the ancient Carboniferous volcanoes complex in ZB using the ratio of the lower portion of the MT responses from ZB ancient volcanic edifices and active volcanoes. The results imply the existence of the fossil magma chambers at around 5 km in depth. It serves as the critical indication for a volcanic center and confirms the magmatic origin of the ZB volcanic rock-hosted iron deposits.
Keywords:
reconstruction
; ancient volcanic edifices
; magnetotelluric
; active volcanoes
; Western Tianshan
1. Introduction
Volcanoes are the main pathways to the surface for heat and material within the Earth, most of them are associated with the boundaries of tectonic plates [1,2]. More than 1400 volcanoes around the world have ever been active, and more than 1500 are active or potentially active in the last 10,000 years, some 1200 volcanoes are thought to have been active during the Pleistocene, but only tens of these are well documented or studied [3,4]. Active and potentially active volcanoes greatly affected the course of human history and are closely related to the present tectonics of the Earth [5,6]. A number of active volcanoes have experienced geophysical studies [7,8,9,10,11,12], and magnetotelluric (MT) is the main approach in active magma chambers imaging [13,14,15,16,17]. The ancient volcanoes, although they have significantly contributed to the structure, surface, composition, biosphere, and evolution of the Earth [18]. However, very few geophysical observations have been conducted to the ancient volcanoes [19].
The presence of fluids and partial melt in the magma and crystal mush storage reservoirs of active volcanoes results in lower electrical resistivity compared to their hosting geological units, and geo-electrical methods are frequently employed for volcanoes studying [16,20,21]. Among them, Magnetotellurics (MT) are widely used due to the great penetration depth and sensitivity to temperature, water content and metallic mineral content [13,14,15,16,17,23,24]. MT has revealed two conductive layered structure in many active volcanoes system, an upper layer reflects hydrothermal system and a deeper layer or mass means the magma or partial melting source [25]. Low-velocity anomalies have been imaged in magma systems as well [26]. The energy, volatile materials, and space within a volcano are thought to be responsible for the formation of volcano-hosted or related ore deposits. As a result, ancient volcanic edifices are important in the formation and storage of mineral, oil, and gas deposits. How to locate and map ancient volcanic edifices using MT, whether the ancient volcano has relative low-resistivity anomalies, remains unclear.
Iceland is the only large subaerial part of the mid-ocean ridges and is a place where the processes at divergent plate boundaries can be studied in great detail. Volcanic eruptions are common in Iceland with small eruptions happening about once every 4–5 years. Volcanic activity in Iceland is confined to the active volcanic zones [27,28]. This make it a perfect place to study the active volcanoes and magma in mid-ocean ridges. Krafla is an active volcanic field and a high-temperature geothermal system in northeast Iceland, magnetotelluric (MT) data that were used to model the electrical resistivity structure at Krafla, and an active magma chamber has been interpreted base on the low MT resistivity anomaly around 5 km in depth [29]. Quaternary volcanoes are located in the north and northeast of China, the Xilingol volcanic group stands out as the longest duration of eruptions in the Cenozoic volcanic eruption zone of the Great Xing'an Range-to-Datong. The Late Pleistocene was the period of highest volcanic activity. The most recent eruption age of the volcano has been determined to be approximately 6800 years ago, confirming its status as a continental active volcano [30,31].
We conducted a broadband MT (BMT, which combined audio magnetotelluric and magnetotelluric with a frequency range from 0.001 to 10000Hz) exploration of the Zhibo (ZB) submarine volcano rock-hosted iron deposits within an ancient volcanic edifices. In order to reconstruct of the ancient volcanic complexes, we proposed a new approach by comparing the MT observation among the active volcanoes and ZB ancient Carboniferous volcanoes edifices. We calculate a ration between the average MT response of two active volcanos in Iceland and north China and those in ZB. Based on the modeling and inversion, we reconstruct the ZB ancient Carboniferous volcanoes using the ratio of the observational apparent resistivity in the closer frequency portions of the MT responses from ZB and the Iceland active volcanoes. Our BMT results show the response of the ancient volcanic edifice, refine the understanding of volcano mineral control system in ZB.
2. Geological Setting
ZB iron deposit is location in the eastern section of Western Tianshan, northwest China. Western Tianshan is in the southwestern part of the Central Asian Orogenic Belt (CAOB, Figure 1), one of the largest Paleozoic accretionary orogenic systems in the world [32]. It is a Paleozoic orogenic collage formed by multiple subduction events and the accretion of several terranes between the Junggar Terrane and the Tarim Craton [25,26]. The CAOB is a tectonic collage of various oceanic fragments (e.g., oceanic plateaus, seamounts), accretionary prisms, and intraoceanic and continental magmatic arcs during the Paleozoic [27,28,29,30]. It was deformed by the closures of Tethyan branches and microcontinental collision during the Mesozoic and the far-reaching effect of India-Asia collision during the Cenozoic [27,28,29,30]. Moreover, CAOB controls the tectonics of Central Asia [26,32,33,34,35]. The Western Tianshan Metallogenic Belt (WTMB) is a typical submarine volcano rock-hosted iron deposits (MVIR) in China [36]. It has several large to medium deposits of submarine Carboniferous volcanic-hosted iron (hematite and magnetite). More than 1.2 billion tons of iron ore resources with an average grade of 40% (up to >60%) have been found in the Awulale iron deposits belt, eastern section of the WTMB, which is thought to have excellent prospecting potential for high-grade iron ore deposits [37,38]. All the iron ore deposits are hosted in the widespread Early Carboniferous submarine volcano-related rocks [37]. Some of these deposits are characterized by well-developed skarn assemblages; others are considered to have been directly controlled by the ancient volcanic edifices [37,38]. Surface and mining geological, petrological, geochemical, and surface and aeromagnetic analyses have been employed to explore the mineral deposits and mineral systems, making many new discoveries about the deposits and the structure and origin of the mineral system [37,38,39,40]. Carboniferous volcanoes are speculated to control the distribution of the iron deposits in the Awulale Iron Metallogenic Belt in the eastern portion of WTMB. The ZB iron deposit is one of the largest volcanic-hosted magnetite deposits in the WTMB (Figure 1c). It has attracted widespread interest from geologists and mineralogists for its large size and high grade, as well as the controlling ancient volcanic edifices. Previous geochemical and geochronological studies determined that the iron mineralization at ZB was originated from the melting of a mantle wedge fertilized during subduction with subordinate hydrothermal overprinting [38,39,40,41,42,43] or hydrothermal origins [41]. The nature and tectonic affinity of the volcanic host rock are still controversial.
Remote sensing and geological field observations confirm the existence of an ancient volcano edifice. A huge oval caldera named as Aikendaban was recognized by remote sensing [43]. Aikendaban lies in the eastern Awulale belt where the ZB iron deposit is seated (Figure 1d). There are several other large-scale MVIR, which are considered to be controlled by this volcanic edifices [37,44]. Field work in ZB has found some typical characteristics of volcano activity, such as the stomata and almond-shaped structures in the ore deposit [44]. Shen et al. [45] reported new evidence of an ancient volcano edifice different from the huge Aikendaban oval caldera based on field observations of the ZB deposit. They found andesite in volcanic overflow facies as well as tuff and breccia-bearing tuff in volcanic sedimentary facies in the eastern mining area of ZB. Besides, outcrops of andesitic volcanic breccia and agglomerate rocks have been found in the eastern mining area and in some drill cores. These indicate that there were two stages of volcanic activity: the eruptive and overflow volcanic stages. An arc-shaped fault system and formations as well as the occurrence of the ore body, which were controlled by the ring fault system, imply the existence of a caldera and weak erosion in the ZB iron deposit.
Petrological and geochemical analyses provide plenty of evidence for the volcanic and magmatic origin of the ZB iron deposit. It is reported that this deposit is close to the center of a volcano. The U-Pb zircon age of the host rocks ranges from 350 to around 300 Ma in three stages [46]. The main magmatic activity in this area is the Carboniferous period, followed by the Permian period. The Permian magmatic rocks are mainly distributed west of Xinyuan County, while the Carboniferous magmatic rocks are distributed throughout the entire mineralization zone. Based on their tholeiitic-calc-alkaline affinities, most of these volcanic rocks in ZB are considered to have formed an active continental margin arc. Primitive mantle-normalized incompatible element diagrams, their relatively complete rock assemblages, and Th/Yb versus Nb/Yb diagrams indicate that they have remarkable negative Nb, Ta, and Ti anomalies [46]. Electron probe micro-analyzer data show that the average Co content of pyrite from the magmatic phase in ZB is some six times higher than that of the hydrothermal phase. The Co/Ni ratio is about 20 times higher. Moreover, δ34S for the pyrite indicates that the magmatic-origin sulfur is characterized by a deep source [39,46]. A rock geochemical analysis indicated that the ZB iron deposit was mainly formed by the affection of magmatism associated with volcanic activity and hydrothermal metasomatism of magmatic-hydrothermal fluid [37,39]. An ore-forming fluid analysis showed that the metallogenic temperatures during the magmatic mineralization in ZB were about 650–700°C and that the composition of the fluid in the inclusions of magnetite are of the Na+-Cl--(SO42-) type. This indicates that the metallogenic fluids activated during magmatic mineralization are Fe-rich melts [39].
3. Data and Methods
We carried out an AMT and MT study in the ZB iron deposit and its vicinity, the AMT and MT results are combined as broadband magnetotelluric (BMT). Data from 19 of the stations were acquired in August, 2019 (Figure 2), and 8 of them with relatively lower artificial noise were used for the further processing of reconstruction. The working area is of rough mountainous terrain, these make it is very difficult to find suitable places to set up a data acquisition system and the survey line could not go straight. Most station spacing are 100 m, while some are great or less than 100 m. We collected six MT station data sets from mid-ocean ridge (northeastern Iceland) and inland (north China) to study the MT response of the different type active volcanoes.
The naturally occurring magnetotelluric fields are used as the field source of MT and AMT. The natural field contains electromagnetic waves with different frequency component, they are source used to investigate the underground electrical conductivity of the Earth in different depth [47]. Frequency components in band of 10 Hz to 10 kHz are employed for AMT sounding, those of several hundred hertz to less than 0.001 Hz are used for MT sounding. AMT and MT measured the orthogonal electric (E) and magnetic (H or B) fields behave like plane waves on the Earth surface [48,49]. Frequency-based impedance results could be extracted from the amplitude, phase, and directional relations between the surface electric and magnetic fields. The subsurface distribution of electrical conductivity are then converted from the impedance results [50,51].
We use three MT receiver units for data acquisition. A detailed field operation have been described in He et al.[52]. Some stations lie close to an open operational mining pit, and data from these stations were affected by artificial electromagnetic and vibration noise at different levels. Data with a high noise level are rejected in further processing. We utilize electromagnetic array profile filtering (EMAP) [53] to correct for topographic static shifts and artificial noise effects, the data are inverted using Bostick conversion after EMAP filtering [54,55]. Comparison of the result with and without EMAP filtering is shown in Figure A1. The Bostick conversion (also named as Bostick transform) is a method for generating a resistivity distribution by depth using magnetotelluric apparent resistivity and phase base on looking at the asymptotic behavior of the apparent resistivity curve and phase at low frequencies in models of a layer over an infinite basement [55]. The transform resistivity ρ(D) and depth D at frequency w are expressed as Equation (1) and (2):
Where D is the depth, (D) is the resistivity at depth D, w is the frequency, ρa(w) and Φ is the apparent resistivity and phase at frequency w, μ in the magnetic permeability [55].
The reconstruction approach of ancient volcanic edifices using magnetotellurics are based on the assumption that the ancient active magmatic chamber has similar resistivity to update active magmatic chamber, for the resistivity of the magmatic chamber are mainly controlled by the temperature and water content. With the cooling and degassing of the magmatic chamber, its resistivity increase. However, the resistivity is also employed for determine the buried depth of magmatic chamber. Even though the active and ancient magmatic chambers are seated in the same depth, the conversion depth from frequency to space domain of an active and ancient magmatic chamber are different because the conversion depth are determined by the resistivity of the magmatic chamber. We propose a reconstruction approach by using the ration between the average apparent resistivity of active volcano and ancient volcano system. The conversion depth and the resistivity of the ancient volcanic edifices are then reconstructed based on this ratio (Figure A2). The details of why and how to determine of the ratio is discussed in Section 5.1.
4. Results
We combined the observational results from the same AMT and MT station into one BMT curve with a broad frequency range from greater than 10,040 to some 0.001 Hz. The location of the stations is shown in Figure 1c and the observational curve shows in Figure 2. The resistivity curve from 7 (Site: 0100, 0102, 0104, 0114, 0118, 0122, 2126) among the 8 stations have an obvious fine-layer high (high resistivity)-low (low resistivity)-high-low-high (H-L-H-L-H) electrical structure. It is hard to identify this structure in the data from the other station (Site: 2120) due to the artificial noise. Figure 3 shows the typical resistivity curves of 12 stations from ZB deposits (Figure 3a) in the ancient Carboniferous volcanic edifice, active volcano in Northeastern Iceland (IC) as a representative of an active mid-oceanic ridge volcano (Figure 3b), Xilingol of Inner Mongolia in north China (NC) with active intraplate volcanoes (Figure 3c), and the vicinity of ZB, an non-volcanic area (Figure 3d). The MT resistivity curve from ZB ancient Carboniferous volcanic edifice and the IC active volcano have very similar geo-electrical structure, characterized as H-L-H-L-H model, but the resistivity value at ZB is more than 30 times higher than those at IC. The intraplate active volcanoes in Xilingol in north China (NC) have H-L-H-L structure. There was no obvious low-resistivity layer in the non-volcanic area (Figure 3d).
Figure 3e shows the logarithm of the resistivity as a function of frequency averaged from three selected stations at ZB, IC, and NC. It confirms the similar geo-electrical structures at IC and ZB. The average resistivity at ZB was around 1000 Ω.m for frequencies from 10,000 to 0.001 Hz. There are two relative resistivity lows around 10 and 0.01 Hz. The average resistivity for IC varies from 100 to tens Ω.m with two relative lows centered at 1.72 and 0.046 Hz. The resistivity for NC varies from high to low to high as the frequency decreased from 320 to 0.094 Hz. The lowest resistivity lies at 15 Hz. The resistivity decreases with the decreasing frequency from 0.094 to 0.0011 Hz.
Results from IC and NC indicate that the mid-oceanic ridge and intraplate active volcanoes have very similar average resistivity at the low frequency portion. Figure 3f shows the comparison result of the 1-D MT models (using the algorithm of Whittall and Oldenburg [56]) between the active and ancient volcano. The model of the active volcano was based on the Bostick conversion result of the average resistivity curves for IC, as shown in Figure 3b. One dimension (1D) geo-electrical structure of the ancient volcano model is similar to those of the active volcanoes, but the resistivity is 30 times greater in value than those of the active model. Overall, the average resistivity of the ancient volcano is 21.88 times greater than that of the active volcano. Their ratio of the lowest resistivity in the lower frequency band is around 30.
Figure 4 shows the BMT conversion results from the observational and reconstructed data, the reconstruction correction ratio is 0.0315 (Table A1), how to determine the correction ratio are discussed in next section. The result converted from the pre-reconstructed (raw observational) data (Figure 4a) show four distinct layers apart from the top resistant layer: (1) an top layer with a spatially variable resistivity that contains a number of discrete low-resistivity zones from the surface to 10 km below the sea level, (2) an upper high-resistivity layer with a conversion resistivity greater than 1000 Ω.m, (3) an intermediate layer with relatively lower resistivity from 100 to 500 Ω.m seated around 35 to 40 km below sea level, and (4) a bottom high-resistivity layer with a resistivity greater than 500 Ω.m. The uppermost low-resistivity layer may reflect the aqueous fluids and shallow iron deposits in ZB. The top high-resistivity layer above it is glacial debris. Figure 4b and 4c show the conversion result of the post-reconstructed data (corrected with the reconstruction ratio) in different depth scale. There are two distinct conducting layers with resistivity from 5 to 10 Ω.m. The upper conducting layer is around 2 km below the surface. It might reflect the mainly iron deposits and their host rocks. The lower conducting layer is speculated to be the reflection of the ancient magma chamber in depth of 4 to 8 km. A layer with a relatively high resistivity more than 15 Ω.m separates the two conducting layers.
5. Discussion
5.1. Determining the Reconstruction Correction Ratio
The magma and melting in the active volcanoes feature high temperature and contain dissolved water in their composition that reduces its resistivity and result in the strong resistivity contrasts between the active magma chamber and hosting units [57]. This contrasting represents an appropriate framework for the application of electromagnetic methods, such as MT, to study the property and the volcano structure. The active magma chambers are always characterized by deep buried low resistivity layer and the location could be infer by the MT conversion results. Understanding to the buried depth and the electrical property of the fossil magma chamber remain very poor. Once a volcano went bone-dry and cooled, we can consider the fossil magma chambers are immobile at the certain buried depth apart from the later tectonic uplift and erosion. Several Carboniferous caldera are preserved in the Western Tianshan, indicate that this area has experienced very weak erosion.
The buried depth of geological units infers from the observational MT data are basically determined by two parameters: the impedance, which is always in terms of resistivity and phase, and the corresponding frequencies range. A simple estimation is that the buried depth is proportional to the square root of the resistivity at a given frequency. During the evolution from active to fossil, the magma chambers lose its high temperature and water content and then turn from conductive to resistant at the same buried depth. However, the buried depth would be overestimated by MT conversion due to their increased observational resistivity. We attempt to reconstruct the ancient volcanoes by correcting the observational resistivity of the fossil magma chamber to those of the active magma chamber (Figure A2).
The low resistivity anomalies (<100 Ω.m) in the active volcanoes are mostly plausible interpreted as melt, saline fluids and the high temperature, although it difficult to differentiate between fluids and melt with MT alone due to the inherent non-uniqueness of the MT problem and the tendency for conductive bodies to smear vertically in regularized inversion [58]. The temperature will weakly affect the resistivity of chamber system of the active volcanoes due to the presence of fluid phase [59]. Modeling result of bulk resistivity as a function of fluid fraction by Yang et al. [58] shows that the bulk resistivity of the melt system would decrease 2~3 time when the fluid fraction range from 7 to 26 percent. These indicate that the fluid fraction will weakly affect the resistivity of chamber system after the conductive fluid are connected [60,61]. The above discussions infer that most of the active melt chamber might have similar resistivity even they feature as different temperature and fluid content. The observed MT result from the mid-oceanic ridge (IC) and intraplate (NC) active volcanoes (Figure 3e) have potential provided illustrations to our inference.
We assume that the magma systems of ancient active volcanoes feature resistivity close to those of present active volcanoes. We use the average apparent resistivity acquired from several stations of currently active volcanoes and select the lowest portion from the apparent resistivity curve in the low-frequency band. The average of nine adjacent frequencies is used to represent the apparent resistivity of the active volcano. In the same way, the apparent resistivity of an ancient volcano provides values about its fossil chamber. The ratio of the average apparent resistivity of an active volcano and an ancient volcano is employed as the reconstruction correction (Table A1). The ratio value at 0.0315 was used to recalculate the apparent resistivity for all BMT data sets from each station in the ZB iron deposit. Although this approach is immature, it is the important way we can make for the reconstruction of the ancient volcanic magma chambers so far.
5.2. Refined Understanding Marine Volcanic-Hosted ZB Iron Deposit
The ZB iron deposit represents a typical volcanic-hosted magnetite deposit in the Awulale belt, eastern part of the Western Tianshan, the tectonic setting is still controversial [39,40]. A huge Aikendaban oval caldera was recognized in the eastern Awulale belt where the ZB iron deposit is seated. Apart from ZB, several other large-scale MVRI, which are considered to be controlled by this volcanic edifices [39,45], have been discovered. Petrological and geochemical analyses have provided a great many of observations for understanding the volcanic and magmatic origin of the ZB iron deposit. It is reported that this deposit is close to the center of a volcano [45].
The MT observations from ZB and an active IC volcano have resistivity curves with similar shapes (Figure 3). These indicate the existence of a volcano system and potentially imply the key information for understanding volcanic structure, but the resistivity is obviously greater to those of the active volcano system. We reconstructed the ancient volcano system (Figure 5) using MT data based on the assumption that the active magma chambers feature almost same resistivity in value to the ancient chambers before they are cooled and dried.
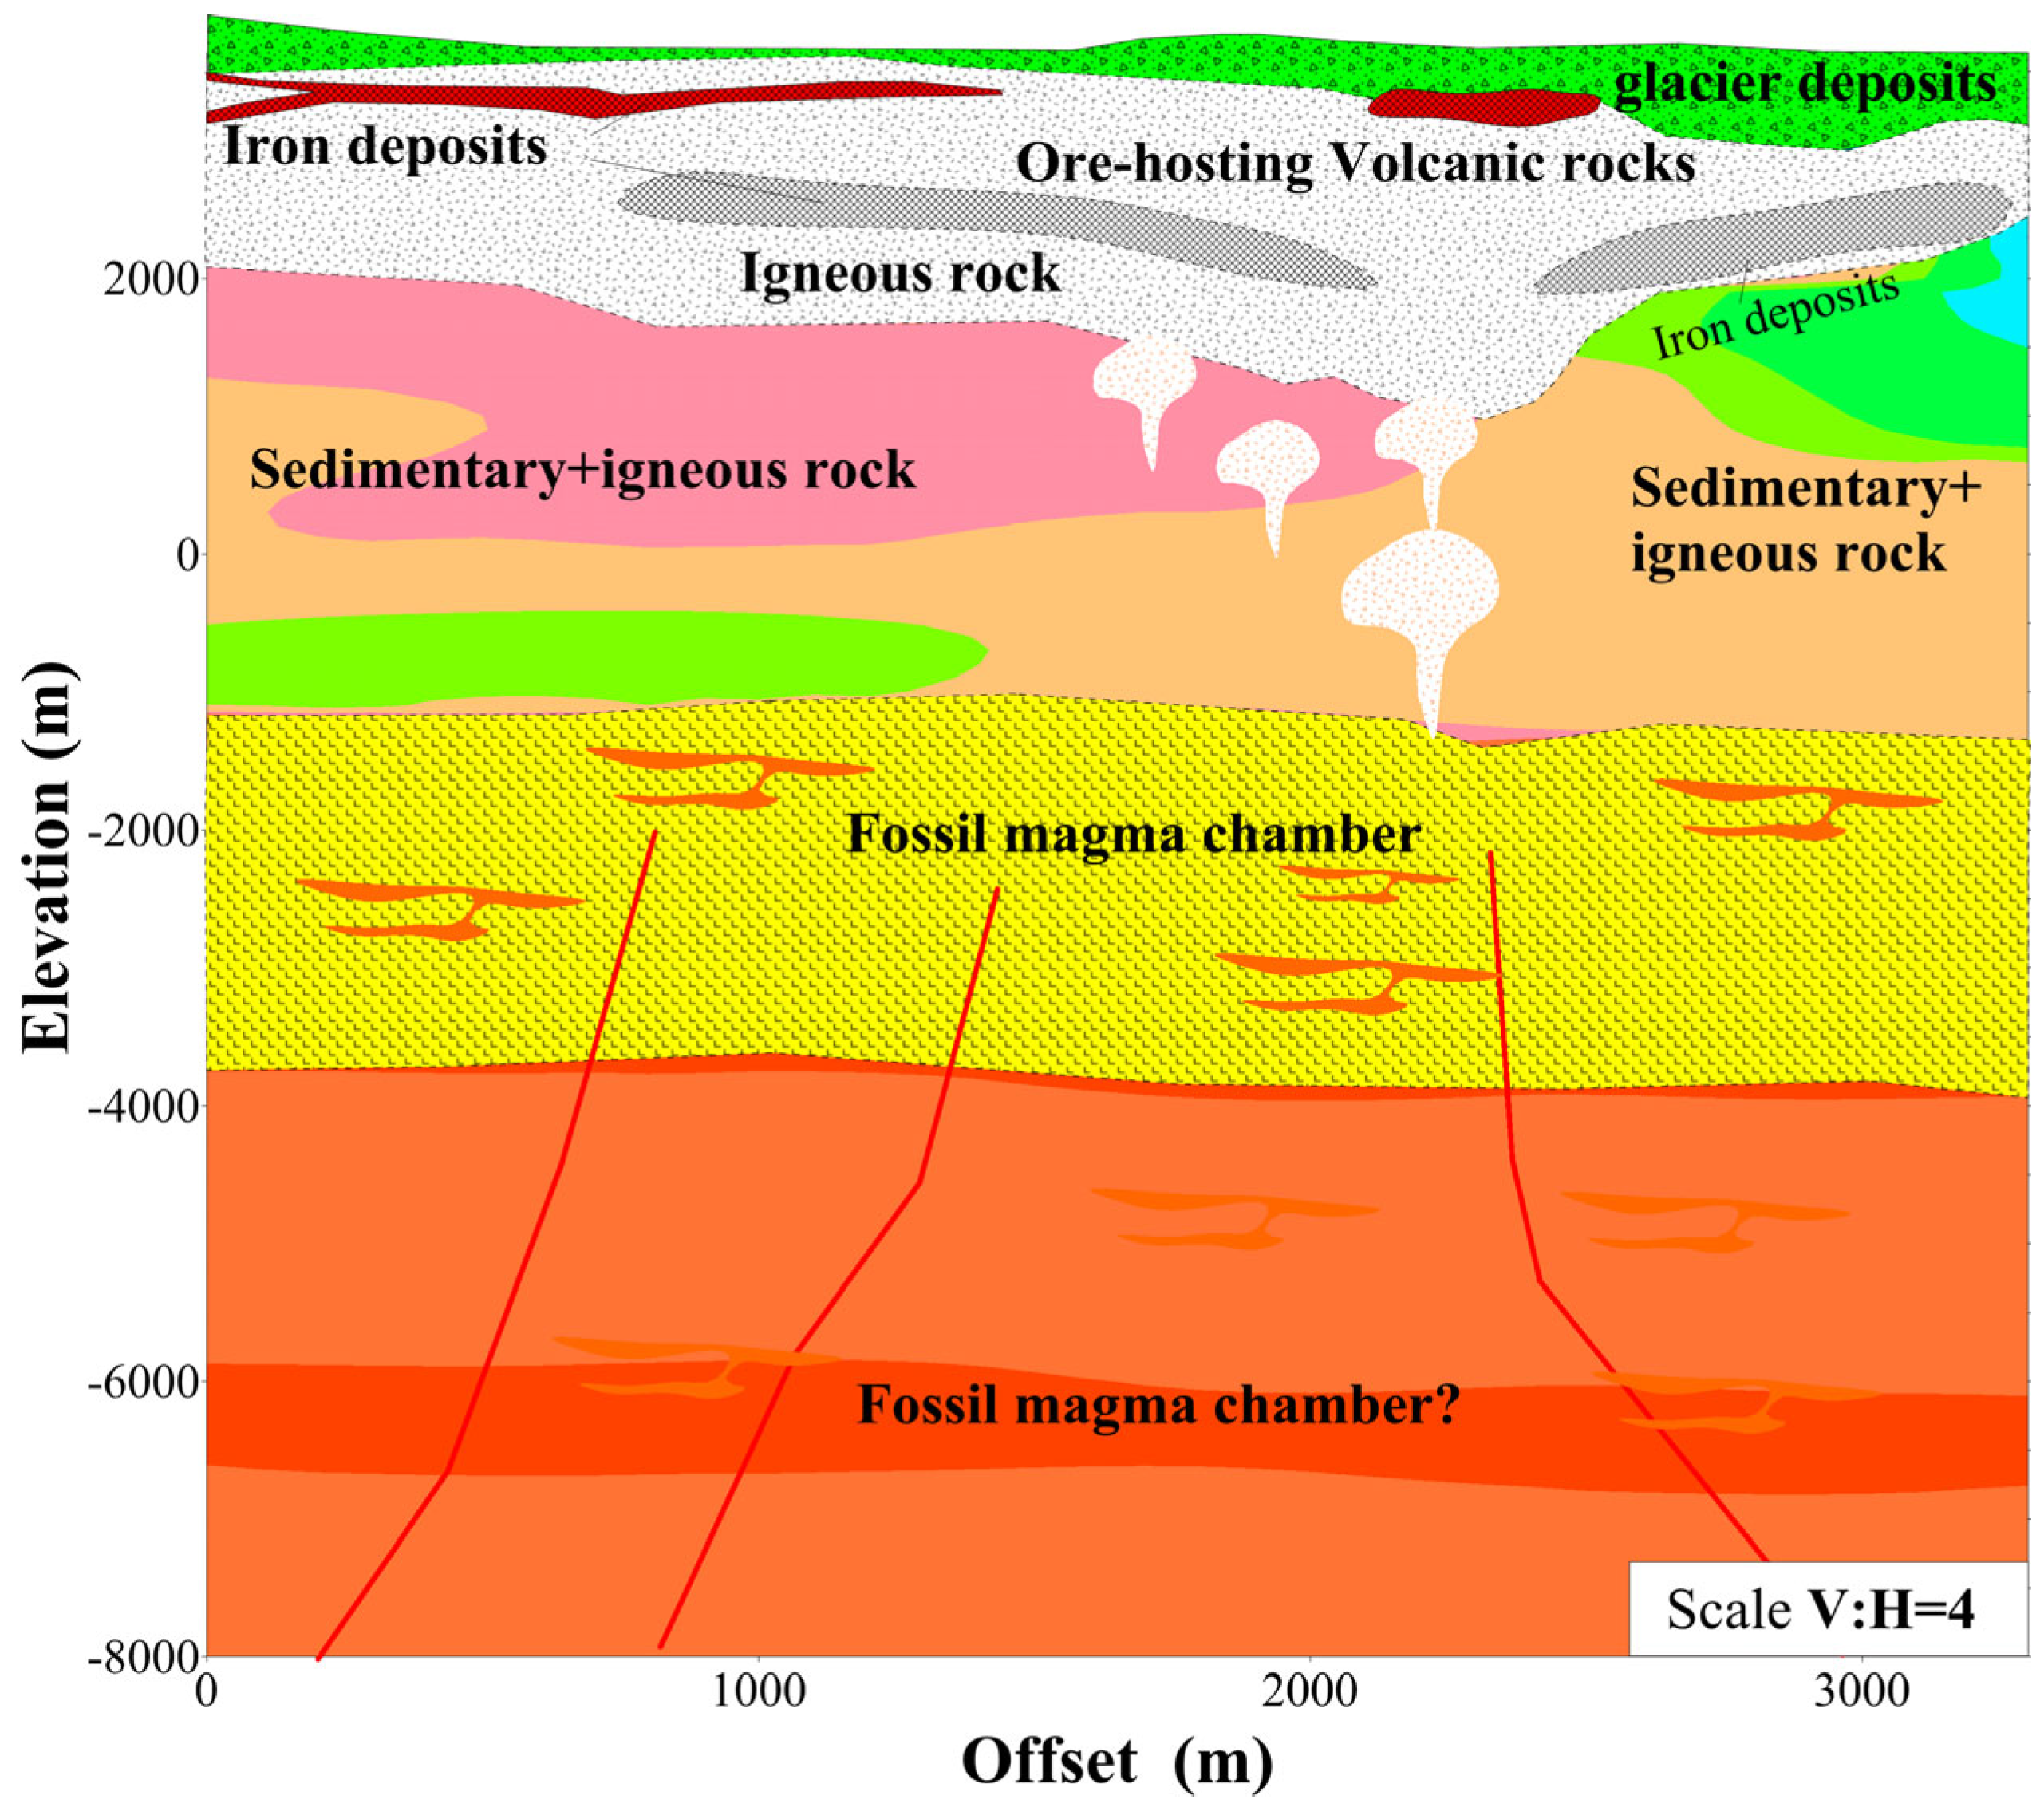
The result shows a five-layer geo-electrical structure. A comprehensive model are in interpreted as shown in Figure 5 based on the rock physics analysis, geochemical study, drilling, geological and this MT observation. The resistive top layer in ZB is mainly composed of glacial and debris, the upper conductive layer reflects the iron deposits and their related mineralization and alteration deposits. Inferred from the understanding of active volcanoes, the deeper conductive layer is interpreted as the fossil magma chamber. Before reconstruction, our MT result reflects the seated depth of the fossil magma chamber locates at some 30 km (Figure 4a). The buried depth of the ancient magma chamber is corrected to around 5 km after reconstruction (Figure 4b). It provides important space for magmatic mixing and iron enrichment, and it eventually contributed to the metallogenesis of the ZB iron deposit. Our MT study has refined the understanding of the volcano system in the ZB iron deposit.
6. Conclusions
Broadband MT observations reveal similar geo-electrical structures in terms of apparent resistivity curves type in ZB ancient Carboniferous volcanic edifies and active volcanoes in north Iceland except different value. MT results from active volcanoes in northern Iceland and Xilingol in Inner Mongolia reveals similar geo-electrical values in term of average apparent resistivity in the corresponding frequency band. It indicate that the magma chamber from the active mid-oceanic ridge and intra-continental volcanoes have close resistivity property. Further more, the active volcanoes chambers might feature almost same close resistivity property in the state that the partial melt and/or fluid exist. Based this assumption, a new approach was proposed for the reconstruction of the ancient volcanic edifies taking the Zhibo ancient Carboniferous volcanoes as case study. The correction ratio of the MT observed resistivity between the ancient and active volcanoes is about 0.03. The understanding to Zhibo mineral system has refined using the reconstructed model. Zhibo mineral system is controlled by the fossil magma chamber in the upper crust. The approach that taking MT response from the active magma chambers as reference explored a new way for understanding the ancient volcanic edifices.
Author Contributions
Conceptualization, Lanfang He; methodology, validation, investigation. Lanfang He; Ping Shen, resources. Lanfang He; Zhongxing Wang; writing—original draft preparation. Lanfang He; Ping Shen; Xi Zhang; Song Huang; writing—review and editing. Lanfang He; Ping Shen; Zhongxing Wang; project administration. All authors have read and agreed to the published version of the manuscript.
Funding
This study was supported by funds of the National Key S&T Program of China (Grant No. 2024ZD1002305, 2018YFC0604004), Xinjiang Key Research and Development Program (Grant No. 2023B03006-1, 2023B03006-3), the CAS Project for Young Scientists in Basic Research (Grant no. YSBR-082) and the “Tianchi Talent” Plan of Xinjiang Uygur Autonomous Region.
Data Availability Statement
The data used to support the findings of this study are available from the corresponding author upon request.
Acknowledgments
We thank Professor Ling Chen, Rishi Xie, Jianshou Zhang and Changming Yu for their help in this study.
Conflicts of Interest
The authors declare no conflict of interest.
Appendix A
Figure A1.
Comparison of the results without(a) and with EMAP filtering.
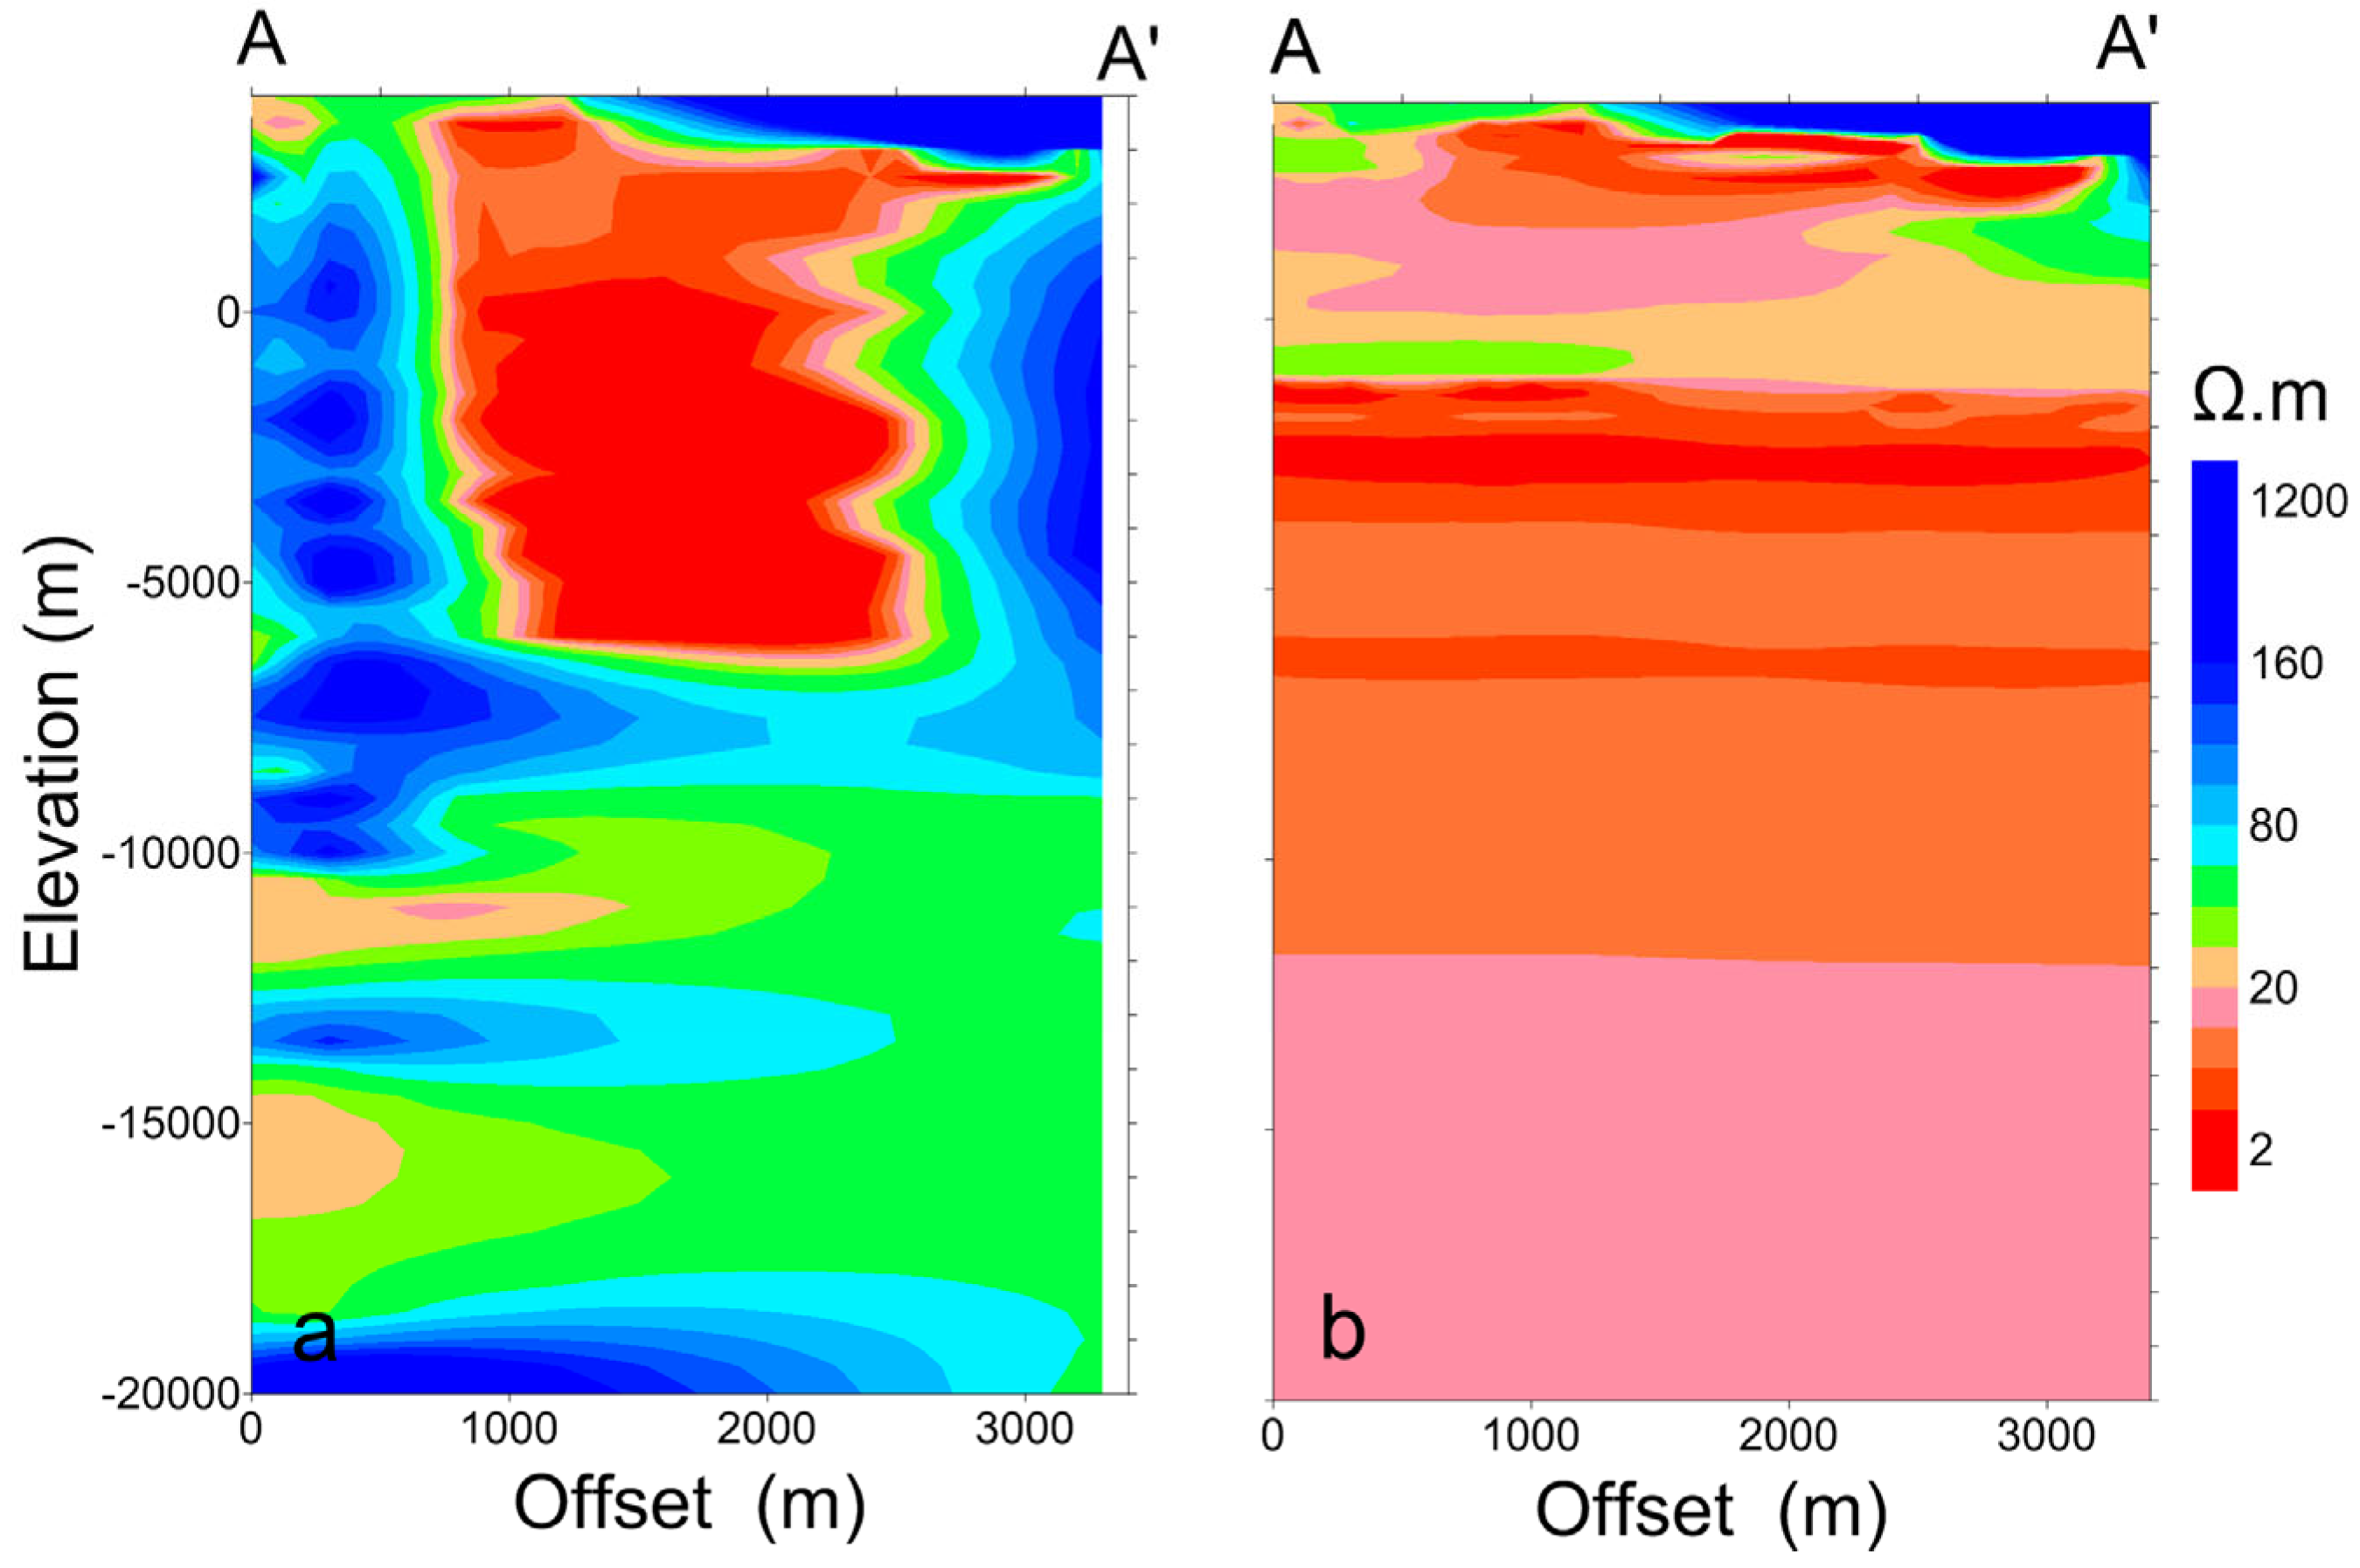
Figure A2.
Sketch map shows the flowchart of ancient volcanic edifies reconstruction.
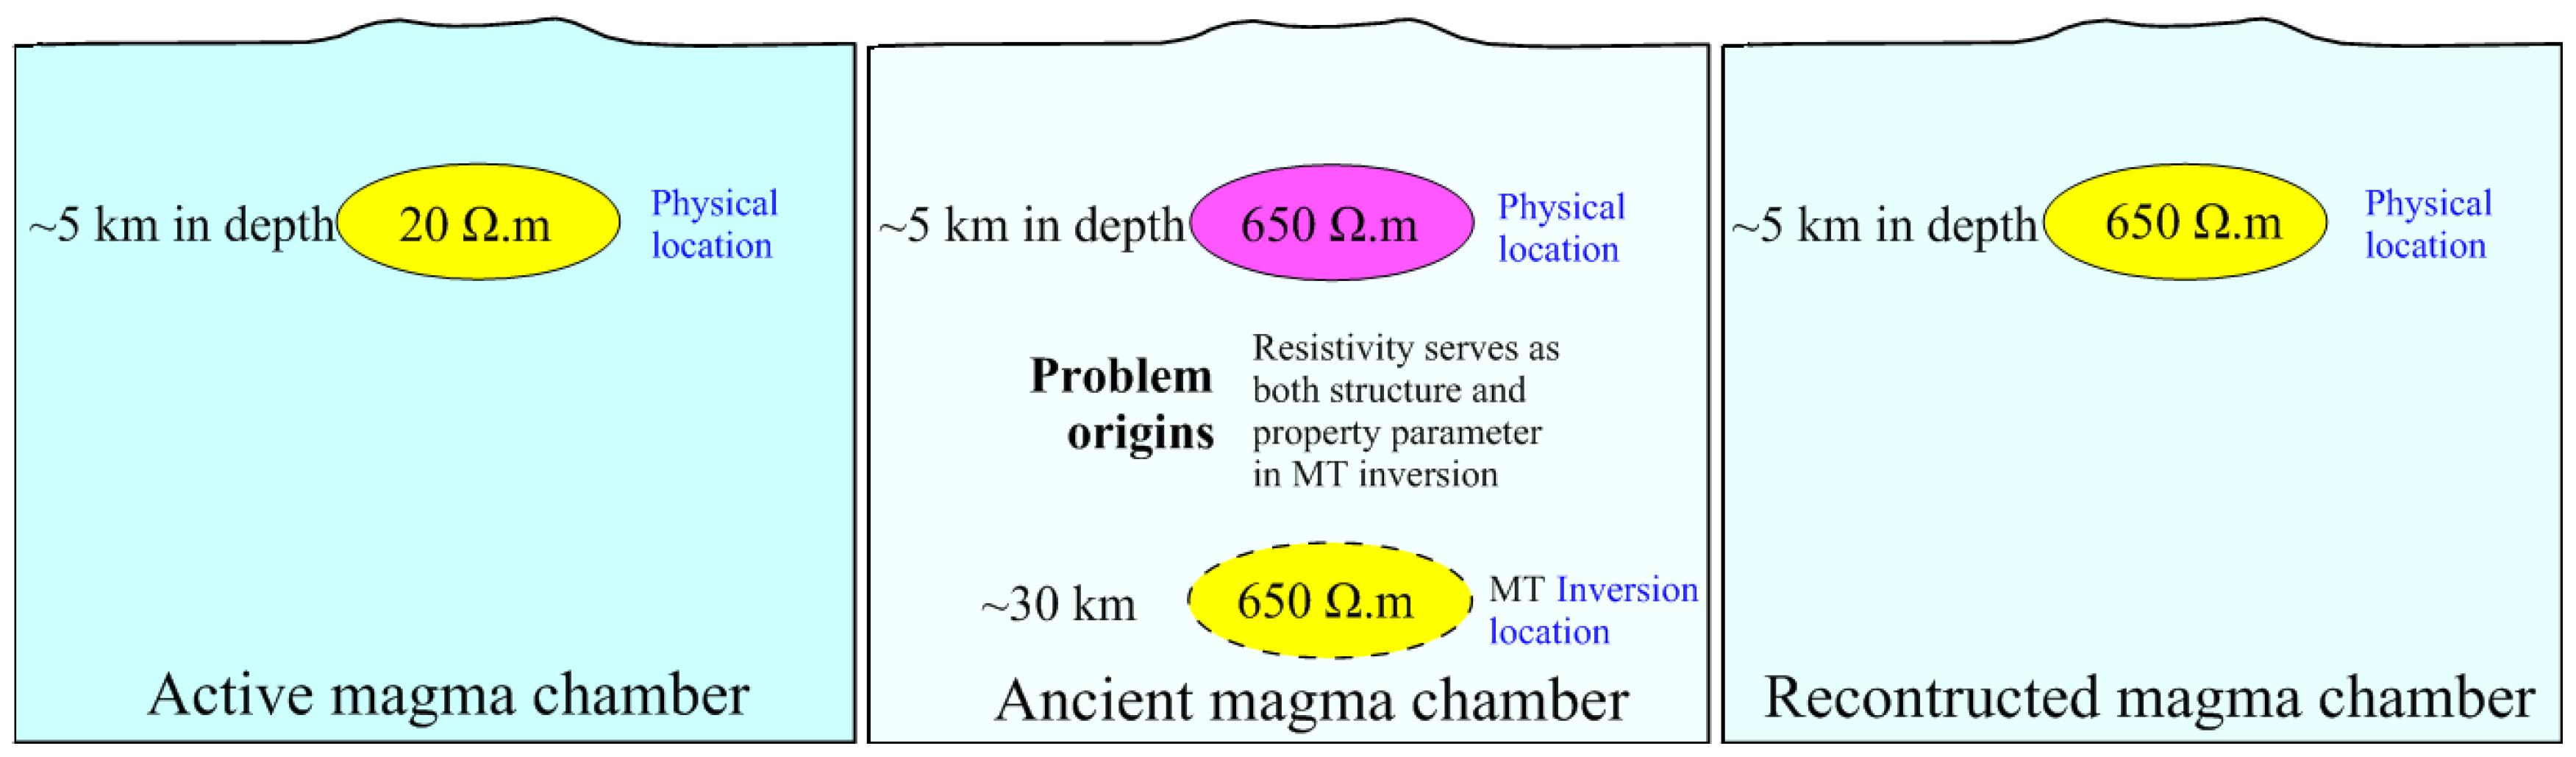

Table A1.
Apparent resistivity value used for calculating the reconstruction correction shift coefficient.
Table A1.
Apparent resistivity value used for calculating the reconstruction correction shift coefficient.
| Number | Rxy-IC | Rxy-ZB | Ratio |
| 1 | 19.348 | 643.622 | 0.0300 |
| 2 | 19.701 | 681.674 | 0.0290 |
| 3 | 18.936 | 647.165 | 0.0290 |
| 4 | 19.843 | 647.734 | 0.0306 |
| 5 | 18.944 | 622.475 | 0.0304 |
| 6 | 19.186 | 632.86 | 0.0303 |
| 7 | 20.876 | 637.369 | 0.0328 |
| 8 | 23.785 | 654.074 | 0.0364 |
| 9 | 24.384 | 695.172 | 0.0351 |
| Average | 20.556 | 651.349 | 0.0315 |
References
- Kusky, T.M. Volcanoes: Eruptions and Other Volcanic Hazards. Infobase Publishing, 2008.
- Fischer, T.P.; Arellano, S.; Carn, S.; Aiuppa, A.; Galle, B.; Allard, P.; … Werner, C. The emissions of CO2 and other volatiles from the world’s subaerial volcanoes. Sci. Rep. 2019, 9, 18716. [Google Scholar] [CrossRef] [PubMed]
- Fournier, T.; Freymueller, J.; Cervelli, P. Tracking magma volume recovery at Okmok volcano using GPS and an unscented Kalman filter. J. Geophys. Res. 2009, 114, B02405 (1-18). [Google Scholar] [CrossRef]
- Phillipson, G.G.; Sobradelo, R.; Gottsmann, J.H. Global volcanic unrest in the 21st century: An analysis of the first decade. J. Volcanol. Geotherm. Res. 2013, 264, 183–196. [Google Scholar] [CrossRef]
- Lopes, R. The Volcano Adventure Guide. Cambridge University Press, 2005.
- Stoffel, M.; Khodri, M.; Corona, C.; Guillet, S.; Poulain, V.; Bekki, S.; Guiot, J.; Luckman, B.H.; Oppenheimer, C.; Lebas, N.; Beniston, M.; Masson-Delmotte, V. Estimates of volcanic-induced cooling in the Northern Hemisphere over the past 1,500 years. Nat. Geosci. 2015, 8, 784–788. [Google Scholar] [CrossRef]
- Sharp, A.D.L.; Davis, P.M.; Gray, F. A low velocity zone beneath Mount Etna and magma storage. Nature. 1980, 287, 587–591. [Google Scholar] [CrossRef]
- Stanley, W.D.; Mooney, W.D.; Fuis, G.S. Deep crustal structure of the Cascade Range and surrounding regions from seismic refraction and magnetotelluric data. J. Geophys. Res. B: Solid Earth. 1990, 95, 19419–19438. [Google Scholar] [CrossRef]
- Jaxybulatov, K.; Shapiro, N.M.; Koulakov, I.; Mordret, A.; Landès, M.; Sens-Schönfelder, C. A large magmatic sill complex beneath the Toba caldera. Science. 2014, 346, 617–619. [Google Scholar] [CrossRef]
- Gudmundsson, M.T.; Jónsdóttir, K.; Hooper, A.; Holohan, E.P.; Halldórsson, S.A.; Ófeigsson, B.G. . and Einarsson, P. Gradual caldera collapse at Bárdarbunga volcano, Iceland, regulated by lateral magma outflow. Science. 2016, 353, aaf8988. [Google Scholar] [CrossRef]
- Gansecki, C.; Lee, R.L.; Shea, T.; Lundblad, S.P.; Hon, K. , Parcheta, C. The tangled tale of Kīlauea’s 2018 eruption as told by geochemical monitoring. Science. 2019, 366, eaaz0147. [Google Scholar] [CrossRef]
- Debayle, E.; Bodin, T.; Durand, S.; Ricard, Y. Seismic evidence for partial melt below tectonic plates. Nature, 2020, 586, 555–559. [Google Scholar]
- Bai, D.H.; Meju, M.A.; Liao, Z.J. Magnetotelluric images of deep crustal structure of the Rehai geothermal field near Tengchong, southern China. Geophys. J. Int. 2001, 147, 677–687. [Google Scholar] [CrossRef]
- Takakura, S.; Matsushima, N. Magnetotelluric Investigation of the Hydrothermal System and Heat Source in the Muine-Toyoha Geothermal Area, Hokkaido, Japan. Resour. Geol. 2003, 53, 213–220. [Google Scholar] [CrossRef]
- Azeez, K.K.A.; Harinarayana, T. Magnetotelluric evidence of potential geothermal resource in Puga, Ladakh, NW Himalaya. Current Science. 2007, 93, 324–329. [Google Scholar]
- Hill, G.J.; Caldwell, T.G.; Heise, W.; Chertkoff, D.G.; Bibby, H.M.; Burgess, M.K.; Cull, J.P.; Cas, R.A. Distribution of melt beneath Mount St Helens and Mount Adams inferred from magnetotelluric data. Nat. Geosci. 2009, 2, 785–789. [Google Scholar] [CrossRef]
- Bertrand, E.A.; Caldwell, T.G.; Hill, G.J.; Wallin, E.L.; Bennie, S.L.; Cozens, N. ,..., Wameyo, P. Magnetotelluric imaging of upper-crustal convection plumes beneath the Taupo Volcanic Zone, New Zealand. Geophys. Res. Lett. 2012, 39, L02304 (1–6). [Google Scholar] [CrossRef]
- Al Habib, J.; Setijadji, L.D.; Maryono, A.; Rompo, I. Identification of Paleovolcanic Centers in the Bima District, East Sumbawa Island (Indonesia) as Guidance for Future Exploration of Cu-Au Deposits. J.Applied Geology. 2024, 9, 64–75. [Google Scholar] [CrossRef]
- Liu, Q.; Xuan, F.; Liu, C.; Minghe Zhang, M.H.; Tian, Y.; Hou, H.S. Metallic mineral exploration by using ambient noise tomography in Ashele copper mine, Xinjiang, China. Geophysics. 2022, 87, B221–B231. [Google Scholar] [CrossRef]
- Poland, M.P.; Miklius, A.; Sutton, A.J.; Thornber, C.R. A mantle-driven surge in magma supply to Kīlauea Volcano during 2003–2007. Nat. Geosci. 2012, 5, 295–300. [Google Scholar] [CrossRef]
- Gao, J.; Zhang, H.J.; Zhang, S.Q.; Xin, H.L.; Li, Z.W.; Tian, W.; Bao, F.; Cheng, Z.P.; Jia, X.F.; Fu, L. Magma recharging beneath the Weishan volcano of the intraplate Wudalianchi volcanic field, northeast China, implied from 3-D magnetotelluric imaging. Geology. 2020, 48, 913–918. [Google Scholar] [CrossRef]
- Spichak, V.V.; Borisova, V.P.; Fainberg, E.B.; Khalezov, A.A.; Goidina, A.G. Electromagnetic 3D Tomography of the Elbrus Volcanic Center According to Magnetotelluric and Satellite Data. J. Volcanol. Seismolog. 2007, 1, 53–66. [Google Scholar] [CrossRef]
- Park, S.K.; Ostos, L.C. Constraints from magnetotelluric measurements on magmatic processes and upper mantle structure in the vicinity of Lassen volcanic center, northern California. Geosphere. 2013, 9, 382–393. [Google Scholar] [CrossRef]
- Tsukamoto, K.; Aizawa, K.; Chiba, K.; Kanda, W.; Uyeshima, M.; Koyama, T.; Utsugi, M.; Seki, T.; Kishita, T. Three Dimensional Resistivity Structure of Iwo-Yama Volcano, Kirishima Volcanic Complex, Japan: Relationship to Shallow Seismicity, Surface Uplift, and a Small Phreatic Eruption. Geophys. Res. Lett. 2018, 45, 12821–12826. [Google Scholar]
- He, L.F.; Chen, L.; Dorji; Xi, X.L.; Zhao, X.F.; Chen, R.J.; Yao, H.C. Mapping the Geothermal System Using AMT and MT in the Mapamyum (QP) Field, Lake Manasarovar, Southwestern Tibet. Energies 2016, 9, 855. [Google Scholar] [CrossRef]
- Pang, G.; Abers, G.A.; Moran, S.C.; Thelen, W. A. Long-lived partial melt beneath Cascade Range volcanoes. Nat. Geosci. 2025, 18, 184–190. [Google Scholar] [CrossRef]
- Gudmundsson, A. Infrastructure and mechanics of volcanic systems in Iceland. J. Volcanology and Geothermal Res. 1995, 64, 1–22. [Google Scholar]
- Gudmundsson, M.T.; Larsen, G.; Höskuldsson, Á.; Gylfason, Á.G. Volcanic hazards in Iceland. Jökull 2008, 58, 251–268. [Google Scholar]
- Lee, B.; Unsworth, M.; Árnason, K.; Cordell, D. Imaging the magmatic system beneath the Krafla geothermal field, Iceland: A new 3-D electrical resistivity model from inversion of magnetotelluric data. Geophys. J. International. 2020, 220, 541–567. [Google Scholar]
- Shi, Z.W.; Bai, Z.D.; Zhao, Z.D.; Dong, G.C.; Wang, J.W.; Jin, D.B. Late Cenozoic sequence of volcanic eruptions in the Xilinhot area, Inner Mongolia. Acta Petrologica Sinica. 2024, 40, 2087–2102. [Google Scholar]
- Wei, H.; Sparks, R.S.; Liu, R.; Fan, Q.; Wang, Y.; Hong, H.; Zhang, H.; Chen, H.; Jiang, C.; Dong, J.; Zheng, Y. Three active volcanoes in China and their hazards. J. Asian Earth Sci. 2003, 21, 515–526. [Google Scholar] [CrossRef]
- Gao, J.; Long, L.L.; Klemd, R.; Qian, Q.; Liu, D.Y.; Xiong, X.M.; Su, W.; Liu, W.; Wang, Y.T.; Yang, F.Q. Tectonic evolution of the South Tianshan orogen and adjacent regions, NW China: geochemical and age constraints of granitoid rocks. Int. J. Earth Sci. 2009, 98, 1221–1238. [Google Scholar]
- Wang, X.S.; Zhang, X.; Gao, J.; Li, J.L.; Jiang, T.; Xue, S.C. A slab break-off model for the submarine volcanic-hosted iron mineralization in the Chinese Western Tianshan: Insights from Paleozoic subduction-related to post-collisional magmatism. Ore Geol. Rev. 2018, 92, 144–160. [Google Scholar] [CrossRef]
- Wan, B.; Wang, X.S.; Liu, X.J.; Cai, K.D.; Xiao, W.J.; Mitchell, R.N. Long-lived seamount subduction in ancient orogens: Evidence from the Paleozoic South Tianshan. Geology. 2021, 49, 531–535. [Google Scholar] [CrossRef]
- Xiao, W.J.; Windley, B.F.; Allen, M.B.; Han, C.M. Paleozoic multiple accretionary and collisional tectonics of the Chinese Tianshan orogenic collage. Gondwana Res. 2013, 23, 1316–1341. [Google Scholar] [CrossRef]
- Zhang, K.J.; Zhang, Y.X.; Tang, X.C.; Xia, B. Late Mesozoic tectonic evolution and growth of the Tibetan plateau prior to the Indo–Asian collision. Earth. Sci. Rev., 2012, 114, p. [Google Scholar] [CrossRef]
- Zhang, K.J.; Ji, C.; Zhou, Y.Z.; Zhang, Y.J. Tracing oceanic plateau relics in the basement of mainland China: A synthesis of aeromagnetic and seismic refraction data. Earth. Sci. Rev. 2024, 255, 104849. [Google Scholar] [CrossRef]
- Hou, T.; Zhang, Z.C.; Pirajno, F.; Santosh, M.; Encarnacion, J.; Liu, J.L.; Zhao, Z.D.; Zhang, L. Geology, tectonic settings and iron ore metallogenesis associated with submarine volcanism in China, An overview. Ore Geol. Rev. 2014, 57, 498–517. [Google Scholar] [CrossRef]
- Zhang, X.; Tian, J.Q.; Gao, J.; Klemd, R.; Dong, L.H.; Fan, J.J.; Tuo, J.; Hu, C.J.; Qian, Q. Geochronology and geochemistry of granitoid rocks from the ZB syngenetic volcanogenic iron ore deposit in the Western Tianshan Mountains (NW-China): Constraints on the age of mineralization and tectonic setting. Gondwana Res. 2012, 22, 585–596. [Google Scholar] [CrossRef]
- Jiang, Z.S.; Zhang, Z.H.; Wang, Z.H.; Duan, S.G.; Li, F.M.; Tian, J. Geology, geochemistry, and geochronology of the ZB iron deposit in the Western Tianshan, NW China: Constraints on metallogenesis and tectonic setting. Ore Geol. Rev. 2014, 57, 406–424. [Google Scholar] [CrossRef]
- Zhang, X. The Metallogenic Tectonic Setting and Metallogenesis of the ZB and Chagangnuoer Iron Ore Deposits, Western Tianshan Mountains. Doctoral Dissertation of University of Chinese Academy of Sciences (in Chinese), 2013.
- Zhang, X.; Klemd, R.; Gao, J.; Dong, L.H.; Wang, X.S.; Haase, K.; Jiang, T.; Qian, Q. Metallogenesis of the ZB and Chagangnuoer volcanic iron oxide deposits in the Awulale Iron Metallogenic Belt, Western Tianshan orogen, China. J. Asian Earth Sci. 2015, 113, 151–172. [Google Scholar]
- Shen, P.; Pan, H.D.; Li, C.H.; Feng, H.X.; Wu, Y.; Shi, F.P.; Guo, X.C.; Li, W.G. Carboniferous ore-controlling volcanic apparatus and metallogenic models for the large-scale iron deposits in the Western Tianshan,Xinjiang. Acta Petrologica Sinica. 2021, 36, 2845–2868, (in Chinese with English abstract). [Google Scholar]
- Shen, L.J.; Du, Y.S.; Wang, S.X.; Li, D.P.; Ge, S.S.; Wang, K. Magmatic and hydrothermal mineralization of the ZB iron deposit in the western Tian Shan,Xinjiang: Evidence from andesite mineralogy. Geology and Exploration. 2014, 50, 0321–0331, (in Chinese with Engilsh abstract). [Google Scholar]
- Luo, W.J.; Zhang, Z.H.; Duan, S.G.; Jiang, Z.S.; Wang, D.C.; Chen, J.; Sun, J. Geochemistry of the ZB submarine intermediate-mafic volcanic rocks and associated iron ores, Western Tianshan, Northwest China: Implications for ore genesis. Geol. J. 2018, 53, 3147–3172. [Google Scholar] [CrossRef]
- Wang, Z.H.; Zhang, Z.H.; Jiang, Z.S.; Wei, H.; Tian, J.Q. Magnetite composition of ZB iron deposit in western Tianshan mountains and its genetic significance. Mineral deposits, 2012, 31, 983–998, (in Chinese with Engilsh abstract). [Google Scholar]
- Guo, Z.W.; Xue, G.Q.; Liu, J.X.; Wu, X. Electromagnetic methods for mineral exploration in China: A review. Ore Geol. Rev. 2020, 118, 103357. [Google Scholar] [CrossRef]
- Vozoff, K. Magnetotellurics: Principles and practice. Proceedings of the Indian Academy of Sciences-Earth and Planetary Sciences. 1990, 99, 441–471. [Google Scholar] [CrossRef]
- He, L.F.; Chen, L.; Dorji; He, Z.X.; Wang, X.B.; Xiao, B.Y.; Xu, L.G.; Zhao, X.F.; Xi, X.L.; Yao, H.C.; Chen, R.J. Mapping chromite deposits with audio magnetotellurics in the Luobusa ophiolite of southern Tibet. Geophys. 2018, 83, B47–B57. [Google Scholar] [CrossRef]
- Asch, T.H.; Sweetkind, D.S. Audio magnetotelluric characterization of range-front faults, Snake Range, Nevada. Geophys. 2011, 76, B1–B7. [Google Scholar] [CrossRef]
- Garcia, X.; Julià, J.; Nemocón, A.M.; Neukirch, M. Lithospheric thinning under the Araripe Basin (NE Brazil) from a long-period magnetotelluric survey: Constraints for tectonic inversion. Gondwana Res. 2019, 68, 174–184. [Google Scholar] [CrossRef]
- Torres-Verdin, C.; Bostick Jr, F.X. Principles of spatial surface electric field filtering in magnetotellurics: Electromagnetic array profiling (EMAP). Geophys. 1992, 57, 603–622. [Google Scholar] [CrossRef]
- Goldberg, S.; Loewenthal, D.; Rotstein, Y. An improved algorithm for magnetotelluric and direct current data interpretation. J. Geophys. 1982, 50, 151–158. [Google Scholar]
- Whittall, K.P.; Oldenburg, D.W. Inversion of magnetotelluric data for a one-dimensional conductivity. in Geophysical monograph series, Society of Exploration Geophysicists, 1992.
- Goldberg, S.; Rotstein, Y. A simple form of presentation of magnetotelluric data using the Bostick transform. Geophysical Prospecting. 1982, 30, 211–216. [Google Scholar] [CrossRef]
- Jiracek, G.R. Near-surface and topographic distortions in electromagnetic induction. Surv Geophys. 1990, 11, 163–203. [Google Scholar] [CrossRef]
- Piña-Varas, P.; Ledo, J.; Queralt, P.; Marcuello, A.; Perez, N. On the detectability of Teide volcano magma chambers (Tenerife, Canary Islands) with magnetotelluric data. Earth, Planets and Space. 2018, 70, 1–11. [Google Scholar] [CrossRef]
- Yang, B.; Lin, W.L.; Hu, X.Y.; Fang, H.; Qiu, G.G.; Wang, G. The magma system beneath Changbaishan-Tianchi Volcano, China/North Korea: Constraints from three-dimensional magnetotelluric imaging. J. Volcanol. Geotherm. Res. 2021, 419, 107385. [Google Scholar] [CrossRef]
- Wang, Q.; Bagdassarov, N.; Xia, Q.K.; Zhu, B. Water contents and electrical conductivity of peridotite xenoliths from the North China Craton: Implications for water distribution in the upper mantle. Lithos. 2014, 189, 105–126. [Google Scholar] [CrossRef]
- Zhang, B.H.; Yoshino, T.; Wu, X.P.; Matsuzaki, T.; Shan, S.M.; Katsura, T. Electrical conductivity of enstatite as a function of water content: Implications for the electrical structure in the upper mantle. Earth Planet. Sci. Lett. 2012, 357-358, 11–20. [Google Scholar] [CrossRef]
- Zhang, B.H.; Zhao, C.C.; Ge, J.H.; Yoshino, T. Electrical conductivity of omphacite as a function of water content and implications for high conductivity anomalies in the Dabie-Sulu UHPM belts and Tibet. J. Geophys. Res.: Solid Earth. 2019, 124, 12523–12536. [Google Scholar] [CrossRef]
Figure 1.
Tectonic setting of ZB iron deposit [26]. (a) Tectonic outline of the Central Asian Orogenic Belt (CAOB) and environs. (b) Simplified tectonic divisions of the Western Tianshan Orogen and adjacent. (c) Geological map of the ZB iron deposit and the locations of MT stations. (d) Geologiccal map of the Aikengdaban district along the Awulale metalloenic belt, the dashed line shows the location of Aikengdaban volcano based on the interpretation from remote sensing [43]. NTAC–North Tianshan Accretionary Complex, KYB–Kazakhstan–Yili Block, KNTS–Kyrgyzstan North Tianshan Block, CTB–Central Tianshan Block, STAC–South Tianshan Accretionary Complex. Major faults: NTF = North Tianshan Fault; NTMF = Northern Tarim Margin Fault [26]. IC: MT data collection station in Iceland; NC: MT data collection station in Xilingol in north China. ZB: Zhibo iron deposit in the ancient volcanic edifies of Aikendaban oval caldera.
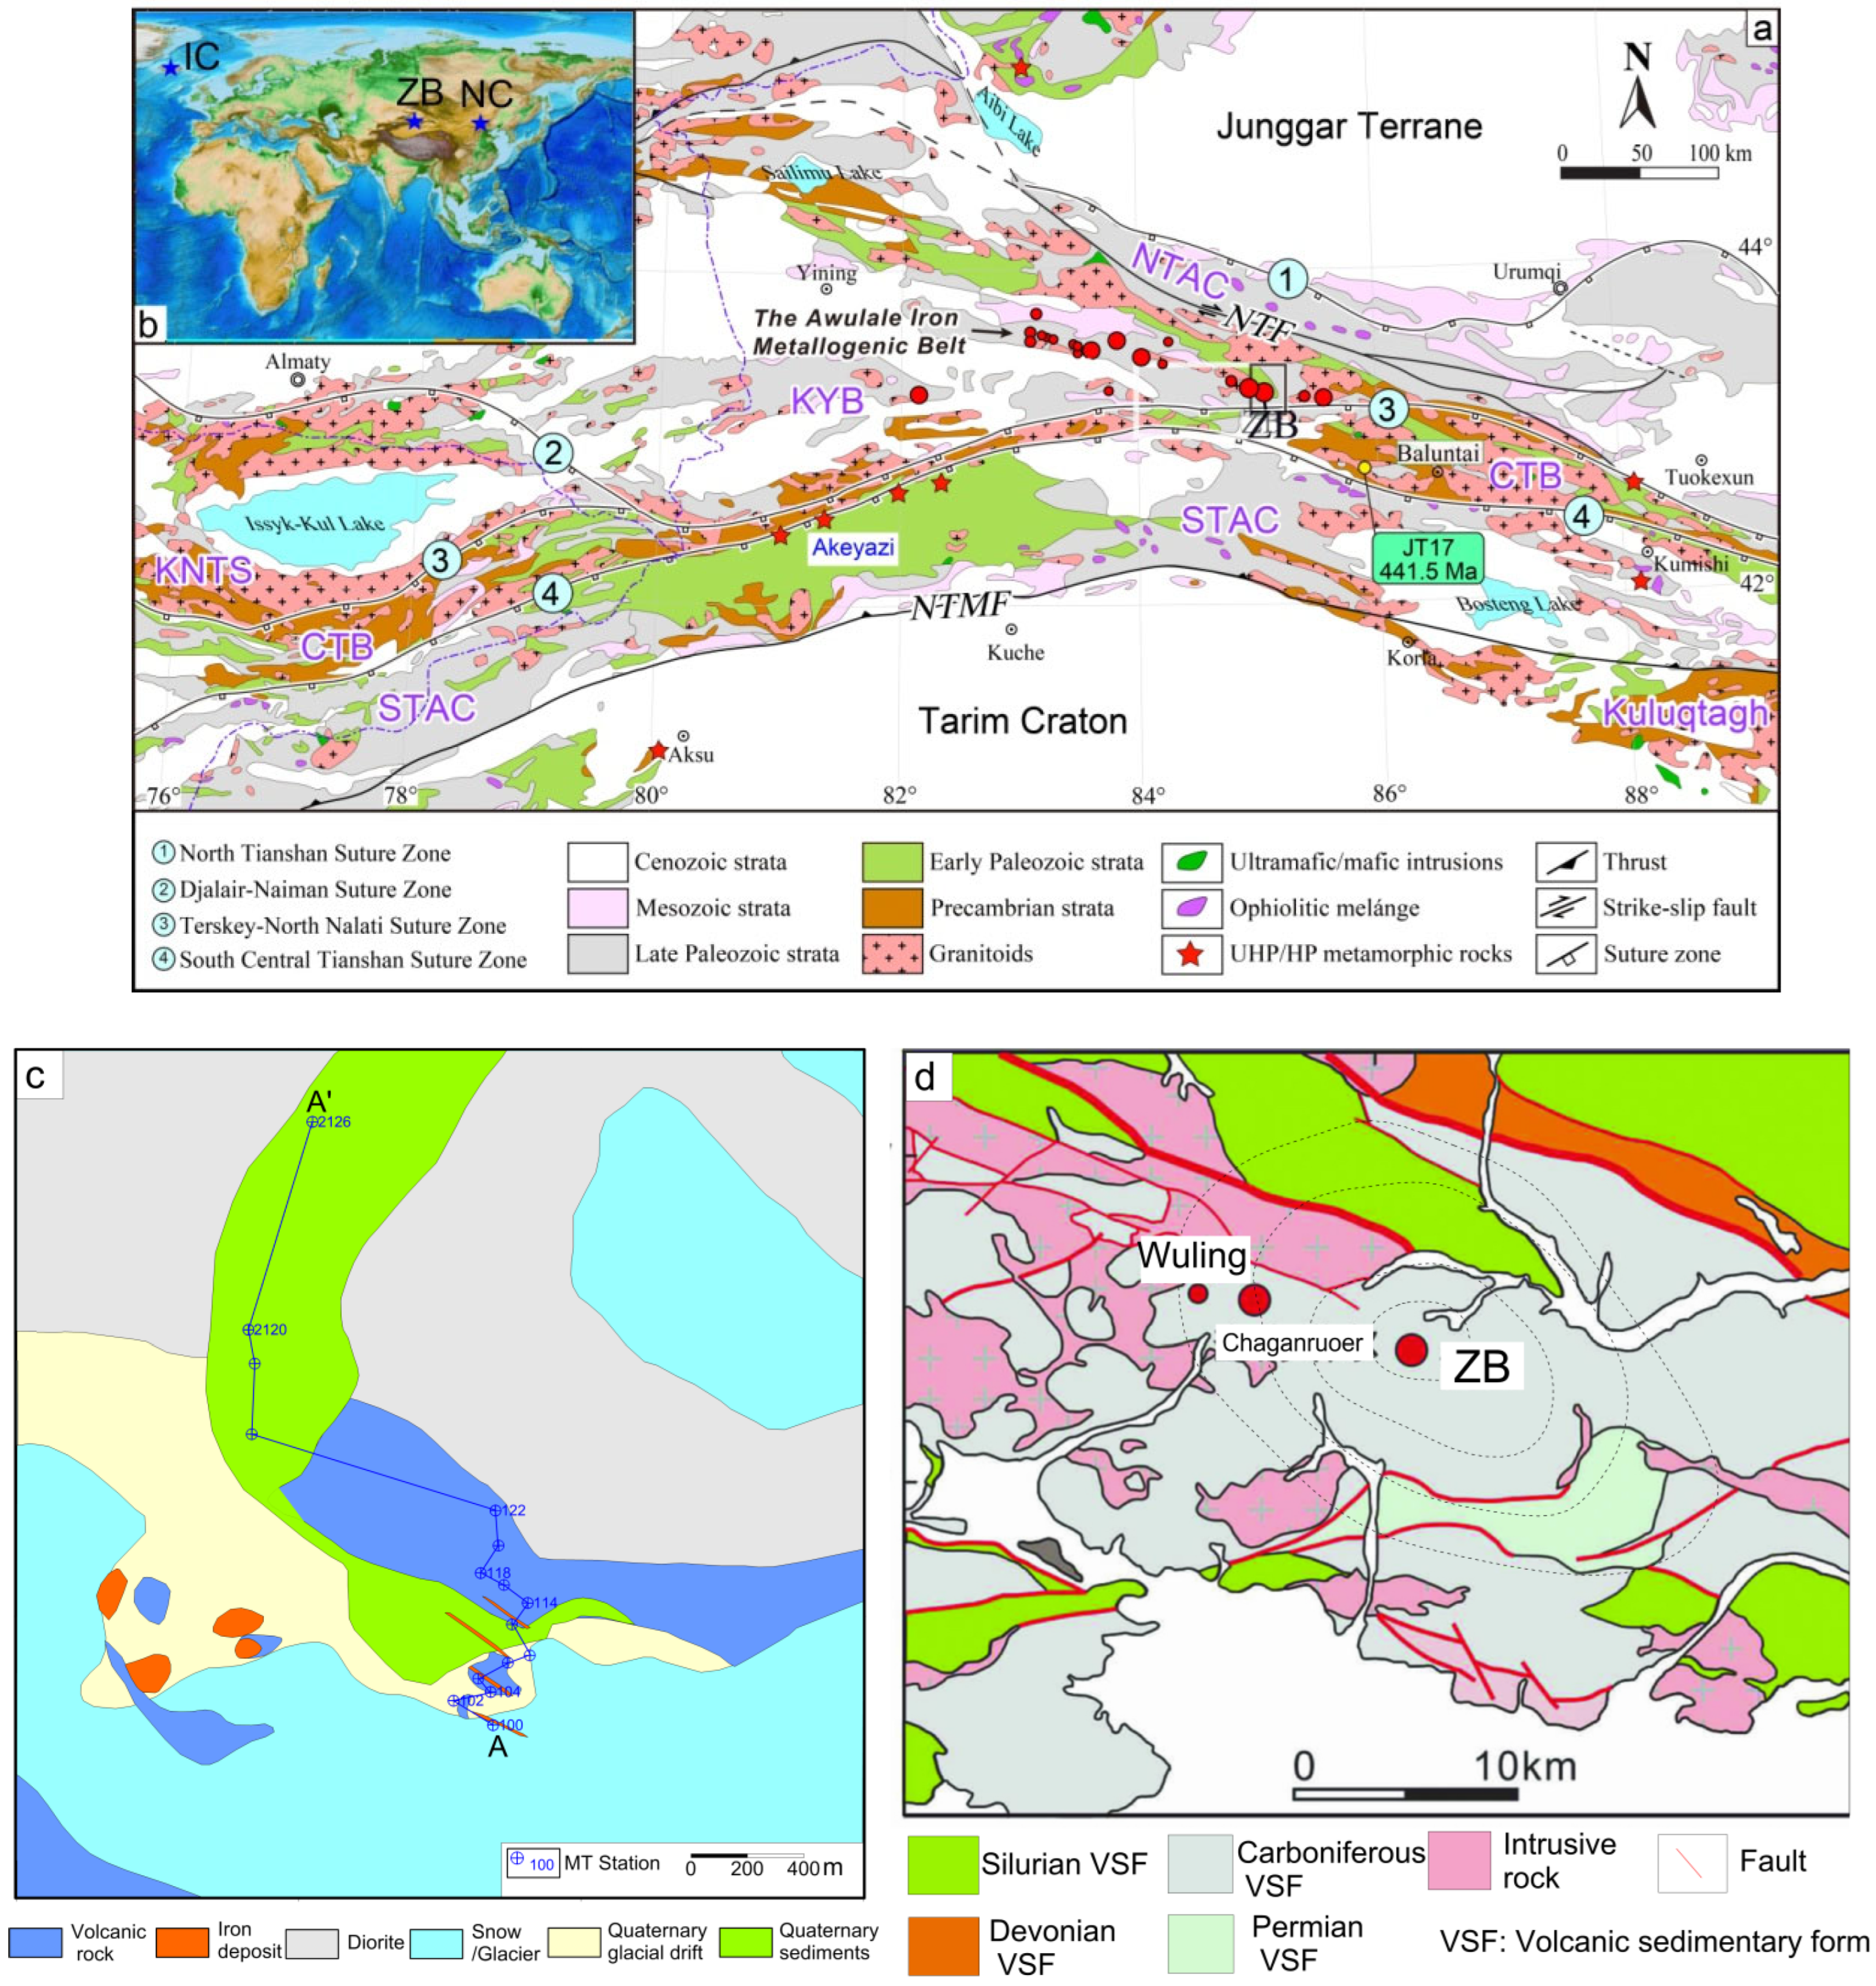
Figure 2.
The apparent resistivity versus frequency curves of 8 BMT stations show general geo-electrical variation with depth, the low frequencies refer to the deep and the higher refer to shallow. The relative low resistivity layer in Rxy direction which might reflect the ancient volcanic edifies could be identified from data of 6 stations.
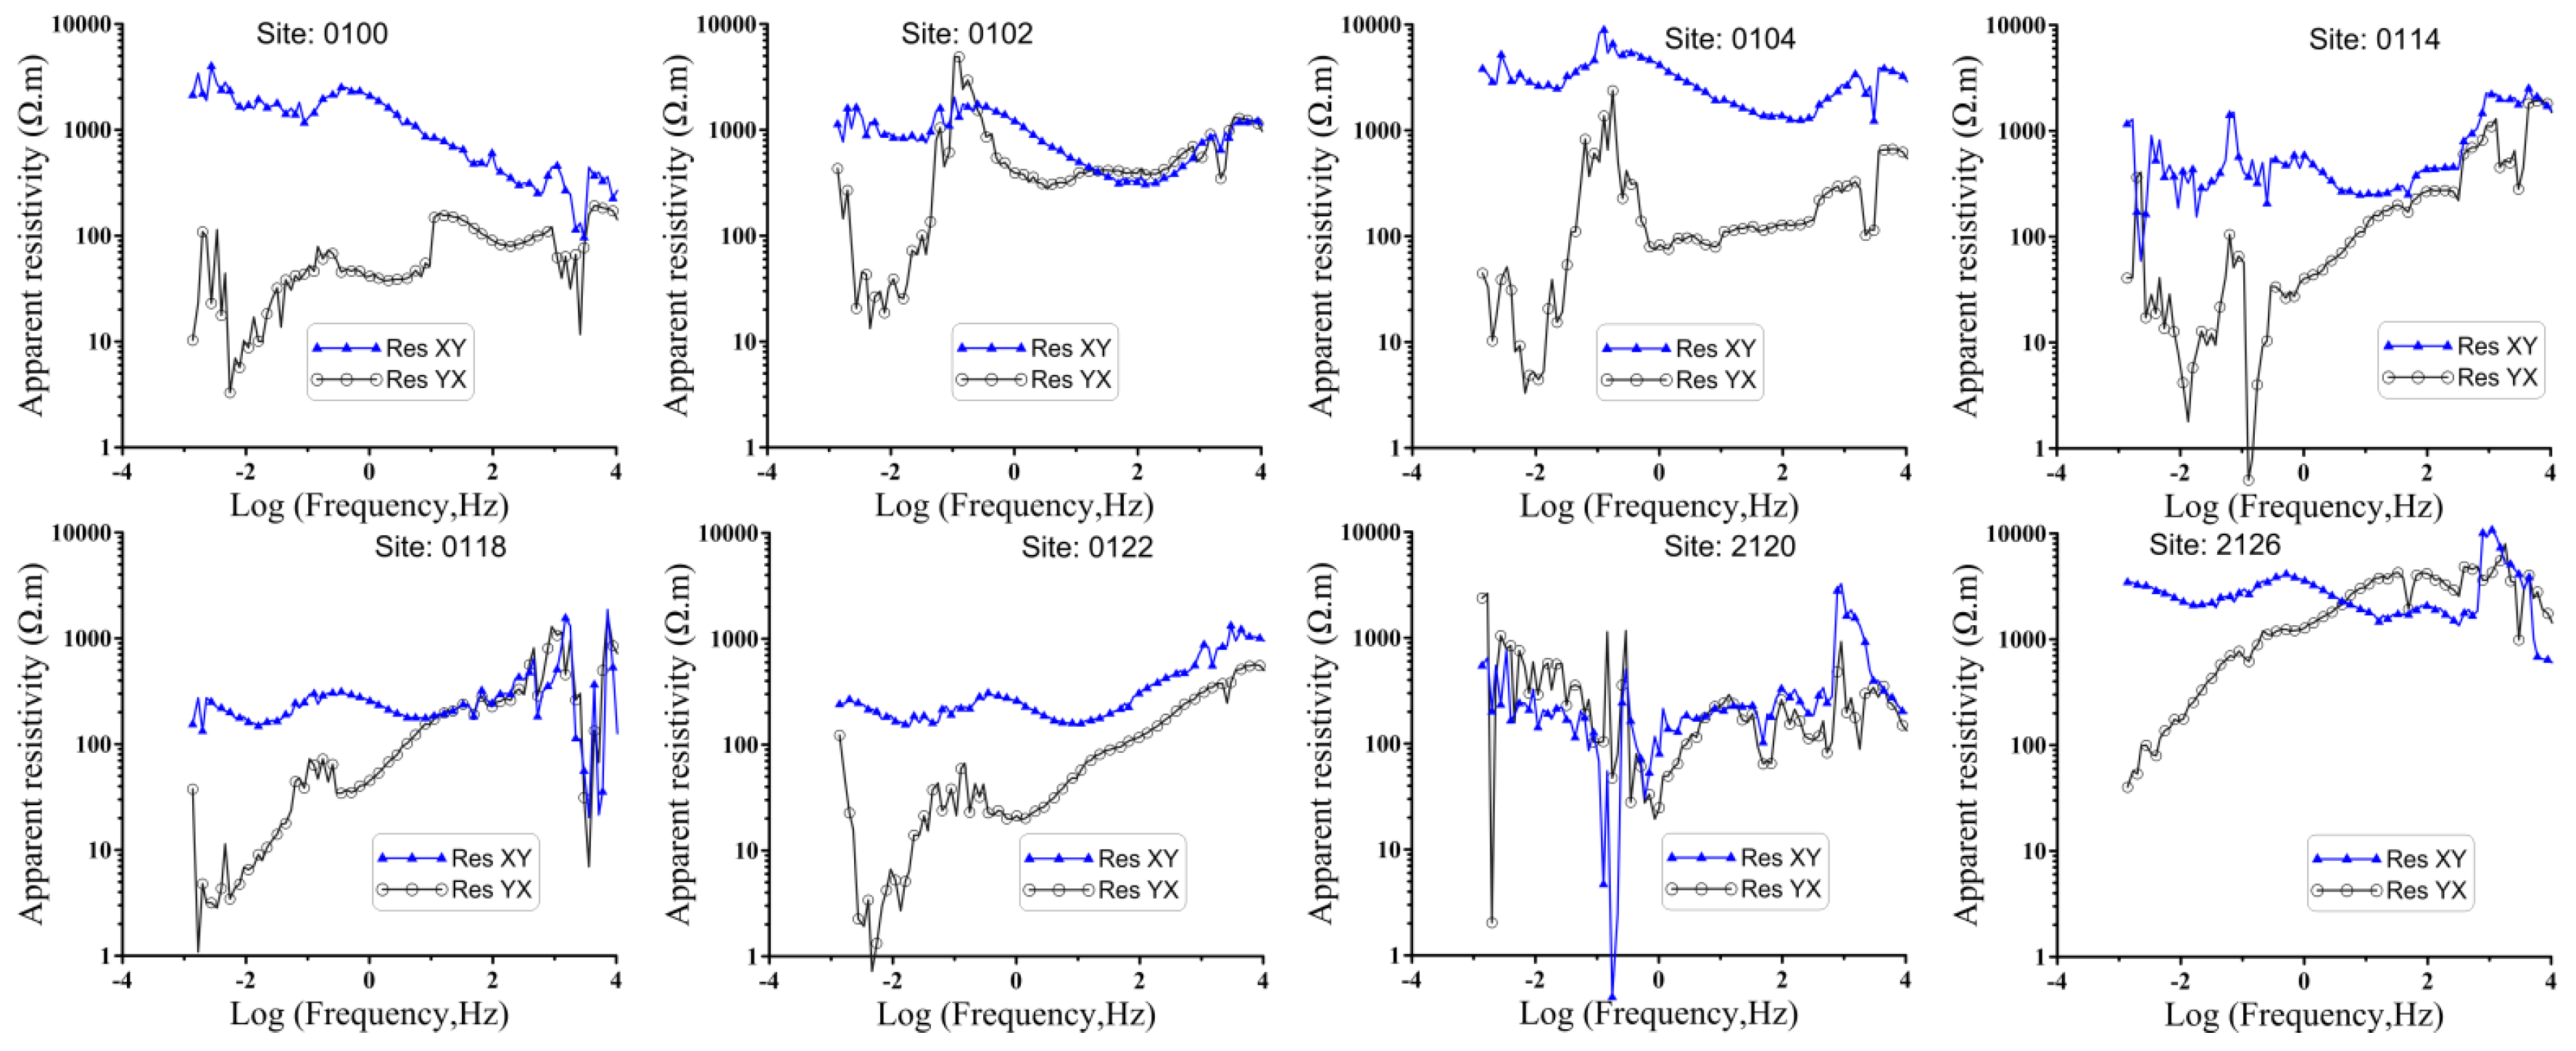
Figure 3.
The typical MT responses in term of the resistivity curves. We chose 3 station from ZB, IC and NC for comparison, respectively. 3a shows the ZB deposits in the ancient Carboniferous volcanoes, 3b are acquired from the active mid-oceanic ridge volcano in Iceland, 3c from north China with active intraplate volcanoes, and 3d the vicinity of ZB, a non-volcanic area. 3e is the logarithm of the resistivity averaged for three selected stations at ZB, IC, and NC. 3f shows the comparison of 1-D MT models of the active and ancient volcanoes. The model of the active volcano used data from the Bostick conversion from the average resistivity curves of IC 3b. The ratio of the resistivity of the ancient and active volcano models for each layer is 30. The black box shows the relatively lower resistivity part. The site number (054, 000, K102, etc.) are listed in the legend.
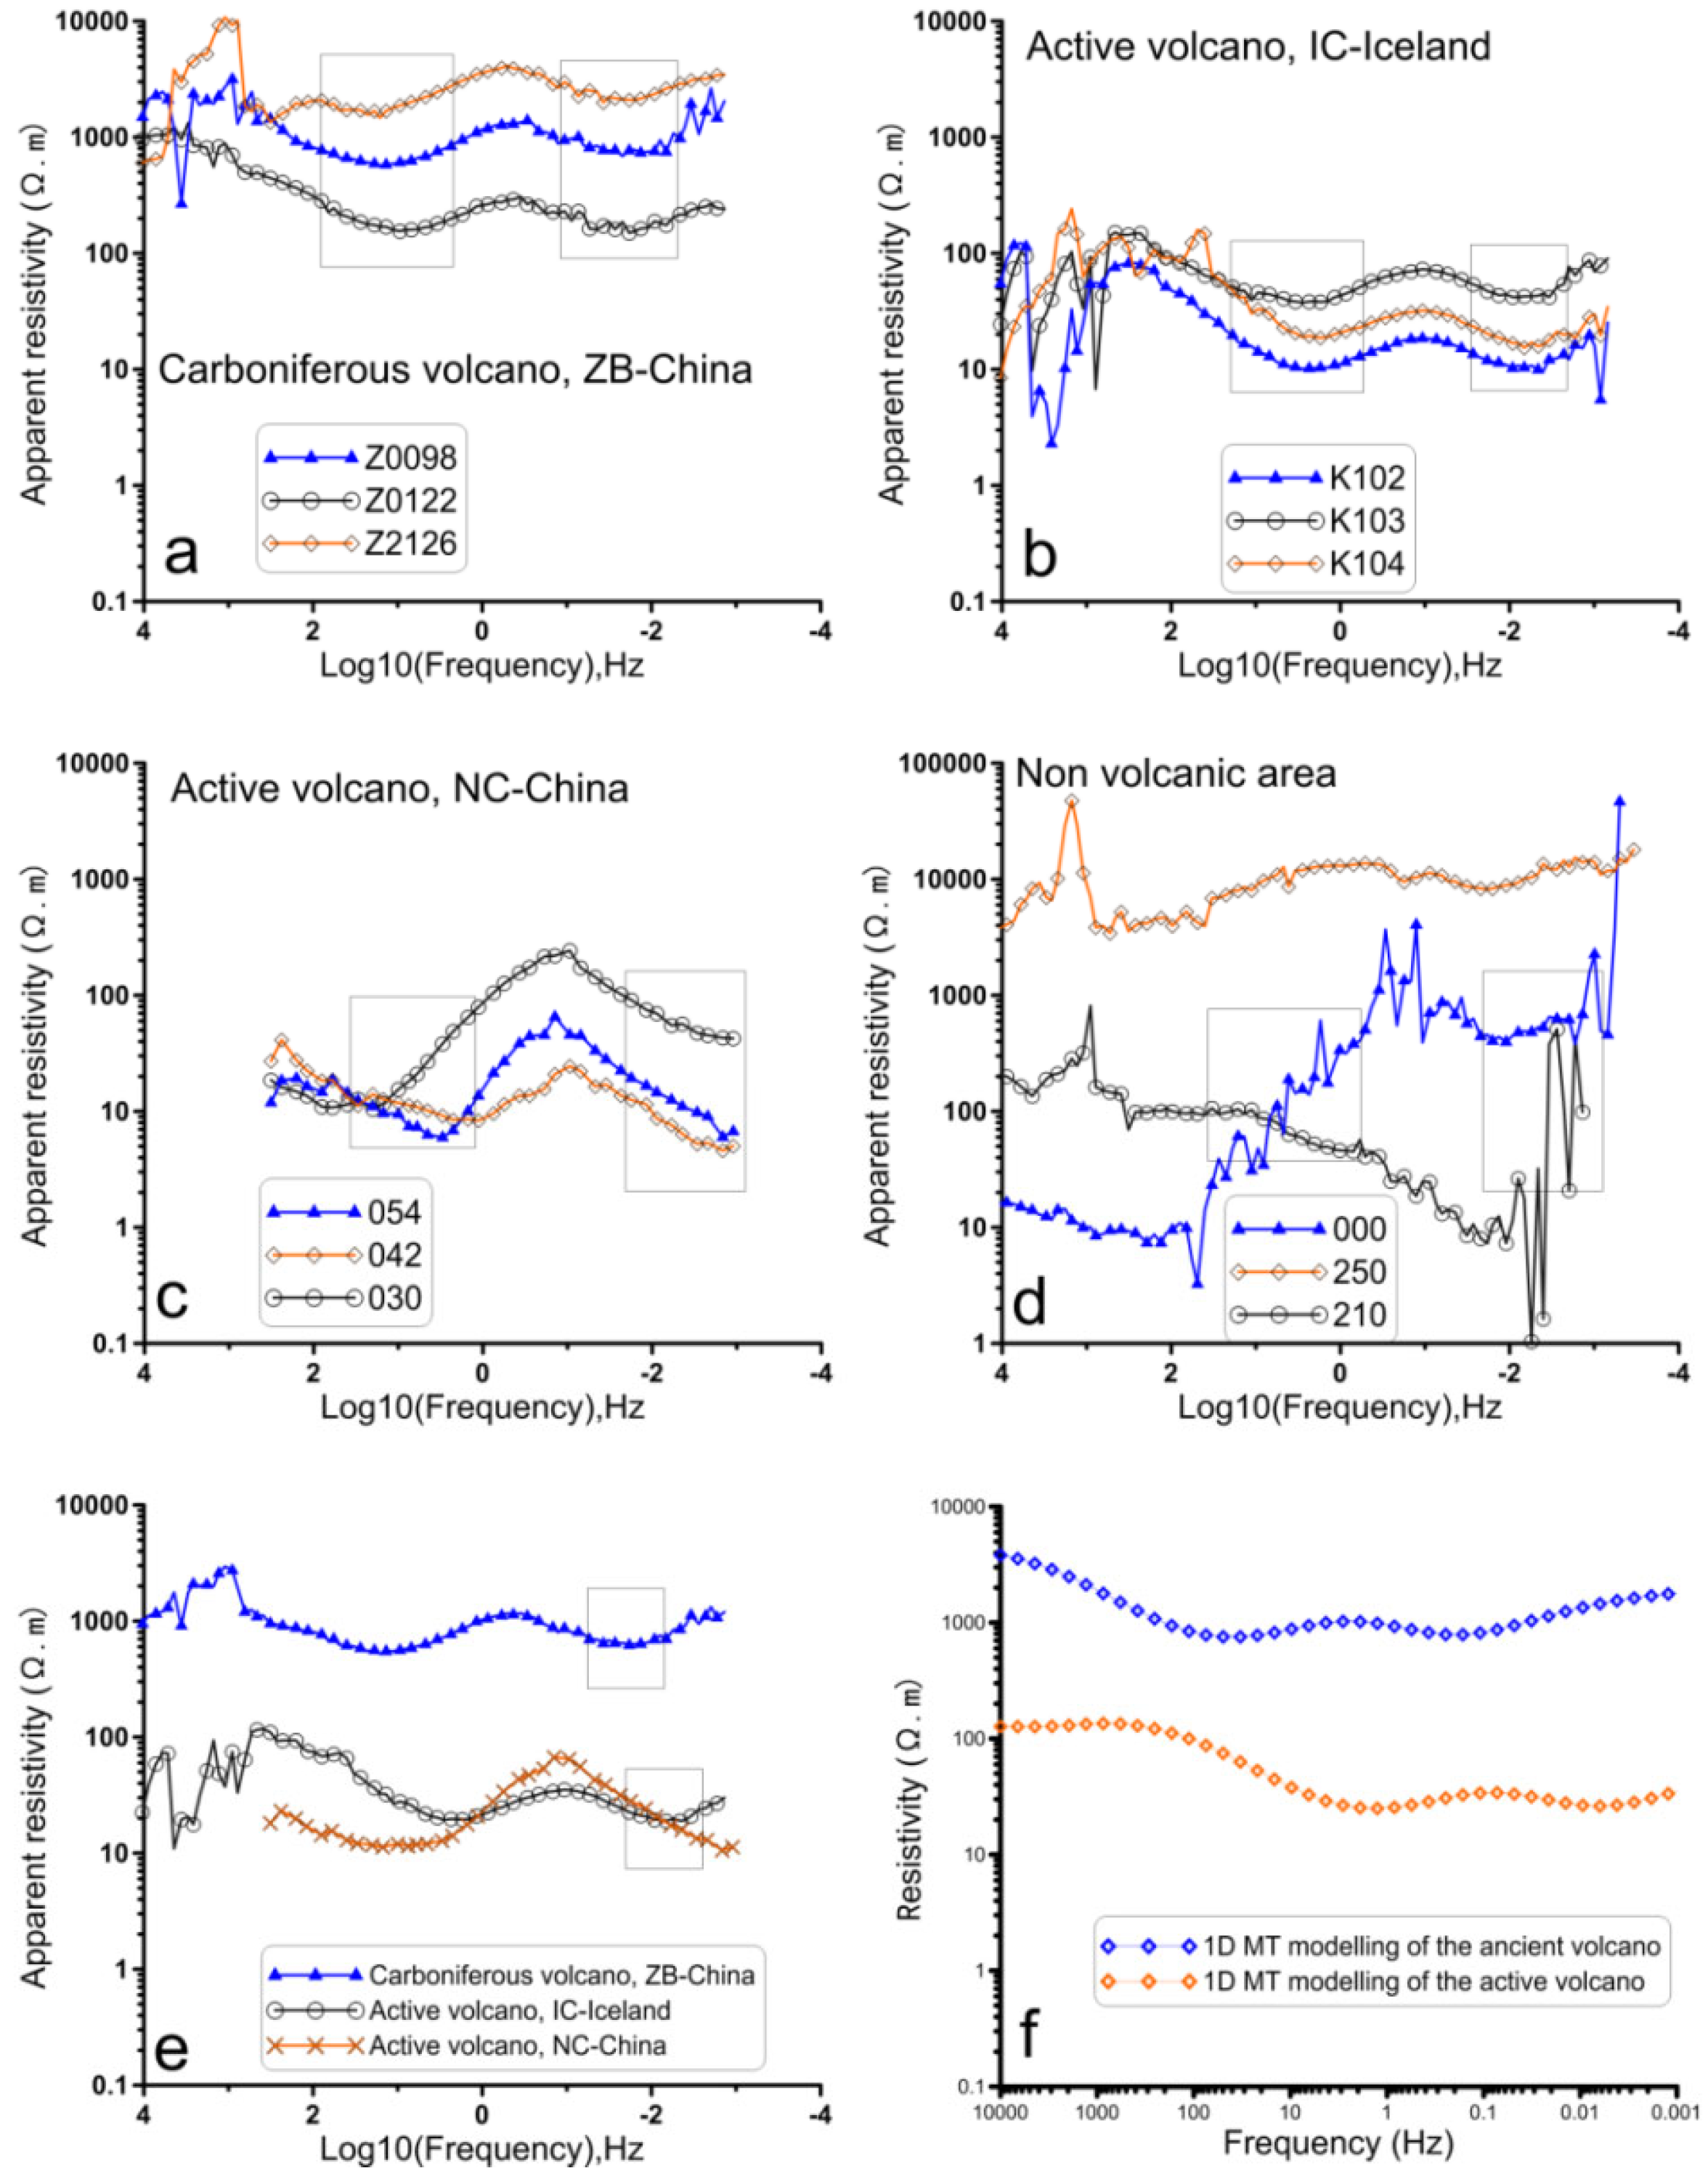
Figure 4.
Resistivity conversion result of the cross-section from BMT results roughly from south (A) to north (A') of the ZB iron deposit. The reconstruction are conducted by correct the observed BMT data with a reconstruction correction ratio of 0.0315. (a) Data converted from the observational raw data (pre-reconstruction), with mainly high resistivity and a relatively low resistivity layer around 25 to 30 km below sea level. (b) The geo-electrical structure of post-reconstruction. After the correction, the lower deep resistivity layer is seated around 1 to 2 km below sea level. (c) An enlargement of the upper part of (b).
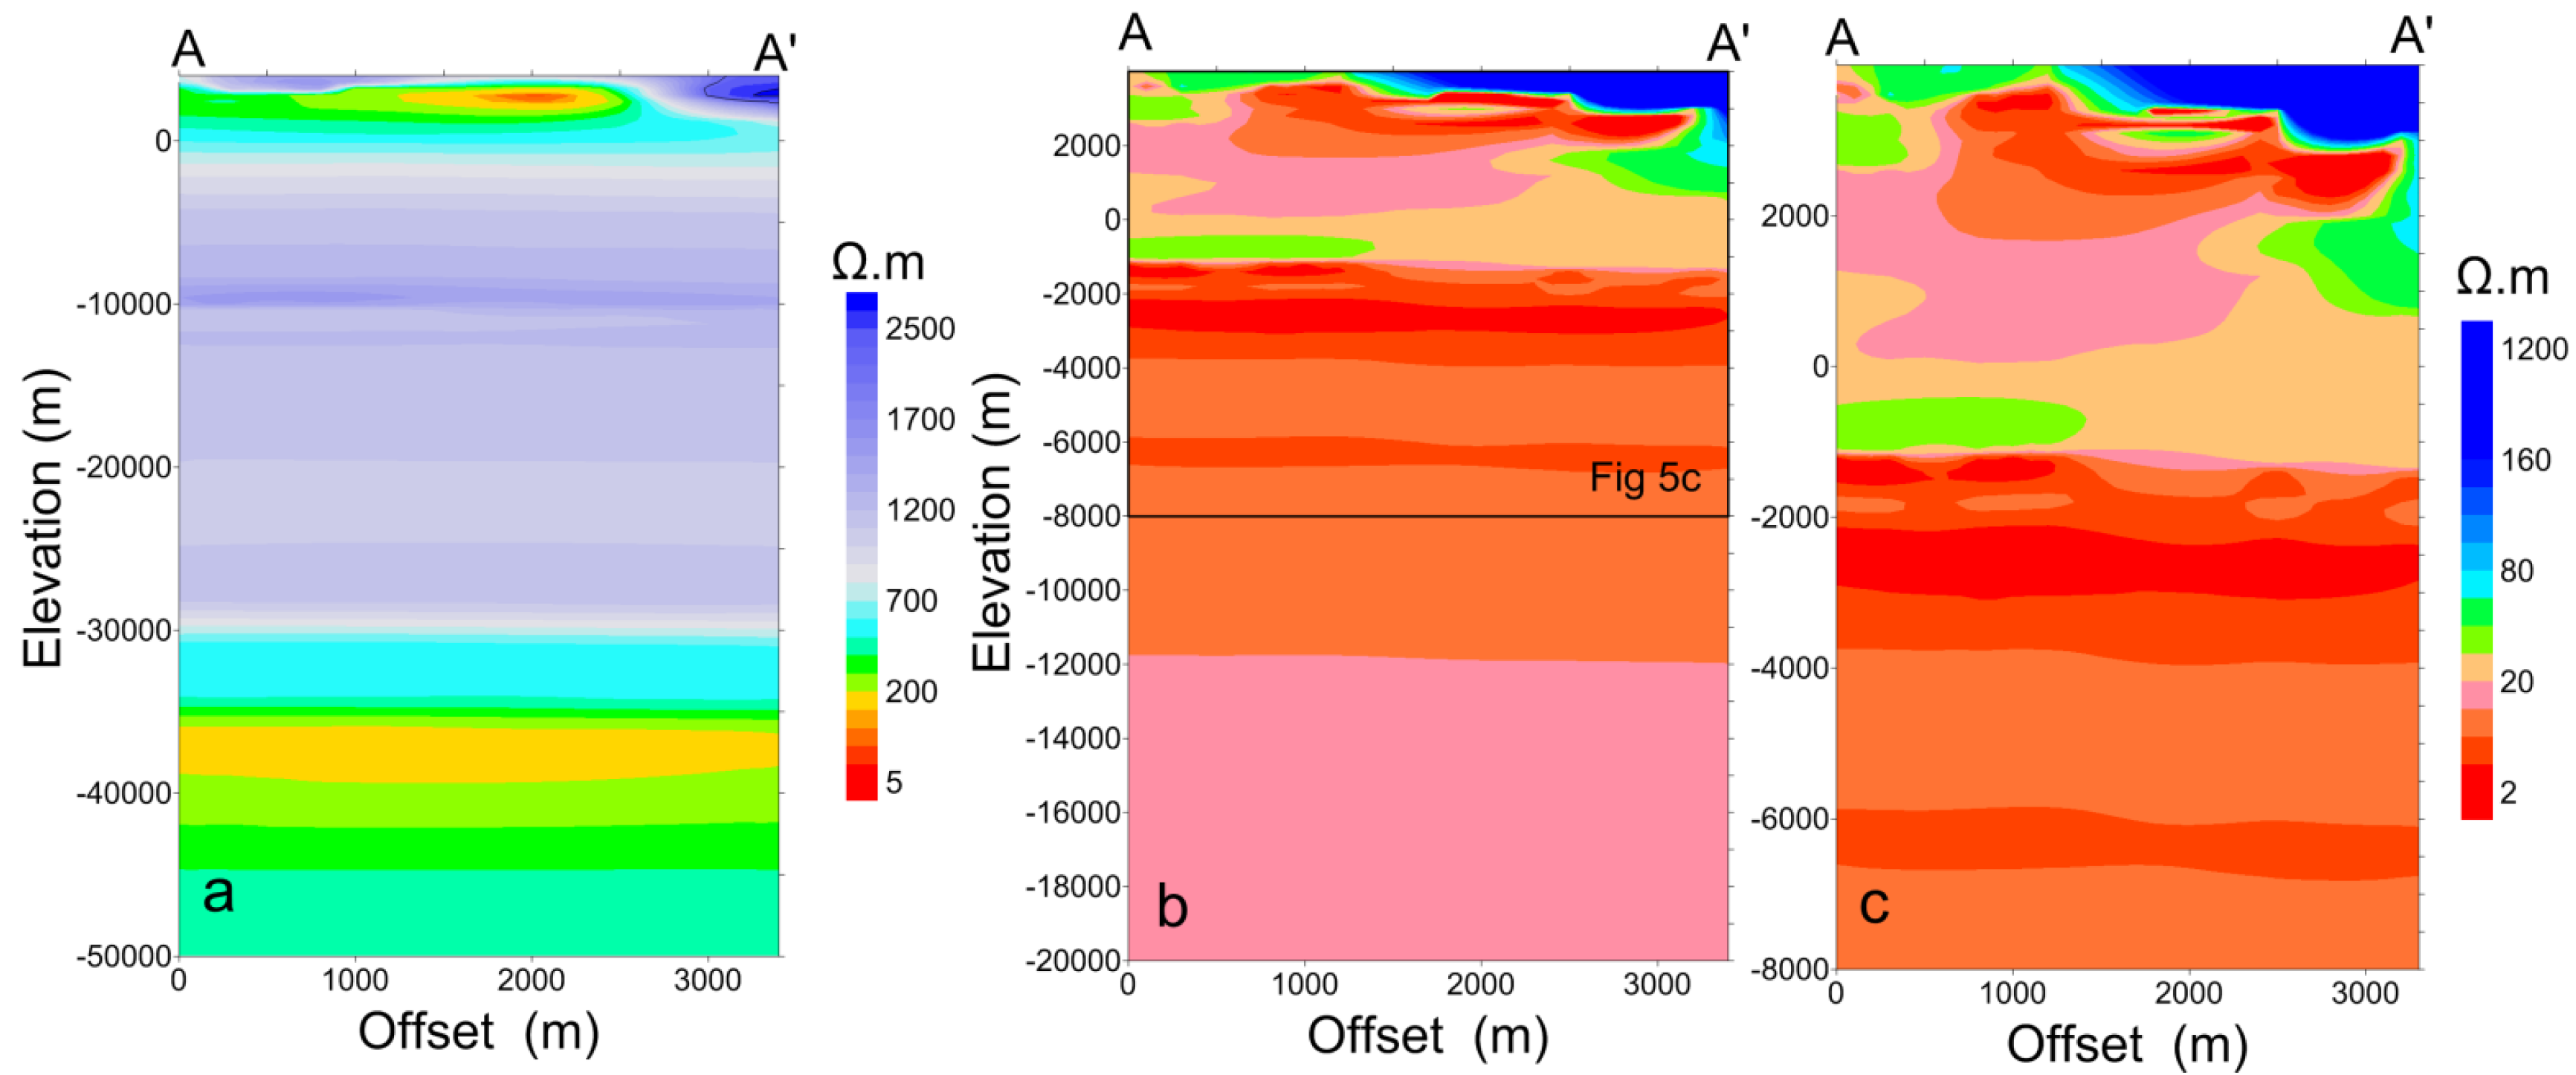
Figure 5.
Refined and simplified model of the ZB iron deposit mineral system by reconstructing ancient Carboniferous volcanoes based on MT observations. It is a typical volcano-hosted iron deposit mineral system. A near surface volcanic iron deposit layer serves the main ore-bearing layer, its top portion has been verified by drilling borehole. A fossil magma chamber is seated in upper crust beneath the ZB iron deposit. The red polylines reflect the pathways for heat, magma and/or fluid. The base map is geo-electrical section of post-reconstruction. The vertical scale is four times than the horizontal scale (V:H=4).
Disclaimer/Publisher’s Note: The statements, opinions and data contained in all publications are solely those of the individual author(s) and contributor(s) and not of MDPI and/or the editor(s). MDPI and/or the editor(s) disclaim responsibility for any injury to people or property resulting from any ideas, methods, instructions or products referred to in the content. |
© 2025 by the authors. Licensee MDPI, Basel, Switzerland. This article is an open access article distributed under the terms and conditions of the Creative Commons Attribution (CC BY) license (http://creativecommons.org/licenses/by/4.0/).
Copyright: This open access article is published under a Creative Commons CC BY 4.0 license, which permit the free download, distribution, and reuse, provided that the author and preprint are cited in any reuse.


