Submitted:
06 September 2025
Posted:
09 September 2025
You are already at the latest version
Abstract
Bridges are critical nodes in freight networks, yet limited funding prevents agencies from maintaining all structures in good condition. This creates the need for a transparent and scalable method to identify which bridges pose the greatest risk to supply chain continuity. This study develops a bridge risk index using the threat–vulnerability–consequence (TVC) framework and validates its components with machine learning. Threat is defined as per-lane average daily traffic, vulnerability as effective bridge age (epoch), and consequence as detour distance, with traffic also contributing to disruption magnitude. The methodology applies log transformation and normalization to construct an interpretable multiplicative index, then classifies risk using Jenks natural breaks. Results show that epoch dominates vulnerability, detour distance amplifies consequence, and their interaction explains most of the risk variation. The highest-risk bridges are concentrated in rural areas and near major freight gateways where detour options are limited. The proposed TVC index provides a transparent, data-driven decision-support tool that agencies can apply nationwide to prioritize investments, safeguard freight corridors, and strengthen supply chain resilience.
Keywords:
bridge risk index
; threat–vulnerability–consequence
; supply chain resilience
; freight corridors
; infrastructure prioritization
; machine learning
; national bridge inventory
1. Introduction
Bridges are critical elements of highway networks and often act as bottlenecks on freight corridors. Trucks move more than 65% of U.S. freight by weight compared with 8% by rail and 3% by other modes [1]. This makes bridge reliability essential for supply chain continuity. Yet bridge owners face persistent funding shortfalls that limit their ability to keep all structures in good condition [2]. A practical way to rank bridges by the risk they pose to freight operations would help agencies target maintenance funds where they deliver the greatest resilience benefits. Such information would also enable trucking companies to identify lower-risk routes when planning logistics.
The goal of this paper is to develop a bridge risk index that quantifies threats to supply chain continuity. The methodology applies the threat–vulnerability–consequence (TVC) model institutionalized by the United States Department of Homeland Security, marking a progression from earlier additive formulas toward a more structured multiplicative formulation [3]. Analysts describe the TVC model as a sound philosophical decomposition that aligns with accepted risk analysis practices and informs resource prioritization [4]. This work defines the TVC model as the product of operational loading, structural vulnerability, and the cost of disruption. In this context, the model quantifies threat as the per-lane average daily traffic (ADT), vulnerability as the effective age (epoch) of the structure, and consequence as the detour distance. Together, these factors provide an interpretable and scalable representation of risk that aligns with the operational realities of freight movement.
The methodology integrates machine learning (ML) with risk modeling to identify the most predictive attributes of bridge vulnerability. It then applies normalization, log transformation, and multiplicative aggregation to produce a risk index. The approach is validated across more than 83,000 National Highway System (NHS) bridges. The NHS is a critical subset of U.S. highways that serves as the backbone of freight movement [5]. Trucks, which carry the majority of national freight by tonnage and value, rely heavily on the NHS for efficient delivery. As freight corridors emerged on the system, the industry constructed hundreds of freight-only terminals on the NHS. Similarly, states constructed freight connectors to access hundreds of multimodal river and ocean ports [6]. Finally, for actionable interpretation, the methodology classified the risk indices into categories using Jenks natural breaks.
The contributions of this work are threefold. First, it introduces a transparent, supply-chain-oriented risk index that can be computed nationwide with existing data. Second, it validates the vulnerability factor through non-parametric ML models. Third, it demonstrates how the index highlights geographic concentrations of high-risk bridges that threaten freight corridor continuity.
The remainder of the paper is organized as follows: Section 2 reviews the literature on bridge risk assessment and network resilience. Section 3 describes the methodology used to construct and validate the TVC index. Section 4 presents the results, including ML validation, regression analysis, and risk rankings. Section 5 discusses the implications and limitations of the findings, and Section 6 concludes with contributions and directions for future work.
2. Literature Review
Research on bridge and network risk has expanded across multiple domains. This expansion reflects the critical role of infrastructure in safety, mobility, and economic resilience. Prior studies have examined climate-driven deterioration, component-level vulnerability, hazard-specific risk models, and data-driven prediction of structural condition. Others have focused on multi-risk frameworks and road network resilience to emphasize robustness, reliability, and recovery capacity. While these efforts have advanced the understanding of bridge performance and critical infrastructure protection, they often emphasize hazards or structural mechanics rather than supply chain continuity. This review synthesizes recent contributions across these themes. The synthesis positions the present work within the broader body of literature.
Altamimi et al. (2024) developed a protocol that integrates projected temperatures, structural response, and socioeconomic effects for existing bridges under climate change. They step through component-level assessment and produce a holistic risk rating for a case study. The protocol offers rigor for thermal hazards and decision support under climate scenarios [7].
ML studies advanced predictive accuracy for condition states. Fard and Fard (2024) trained random forest (RF), extreme gradient boosting (XGB), and artificial neural network (ANN) models on large U.S. datasets [8]. They showed that historical data improved prediction accuracy for deck condition. Permutation importance highlighted age, traffic, and climate as key predictors. This reinforced the value of data-driven prioritization. Principi et al. (2025) proposed a fast neural-network screening to flag high-risk bridges from a small set of inputs that were easy to obtain. They demonstrated scalable triage on Italy’s highway network [9].
Broader risk and resilience analyses emphasized multi-risk and coupled systems. Li and Mostafavi (2025) created an index based on ML for post-disaster community risk and resilience [10]. They blended human actions, asset performance, and recovery features to map disparities after Hurricane Harvey. A systematic review by Nirandjan et al. (2024) compiled fragility and vulnerability curves for critical infrastructure across hazards and sectors [11]. They aimed to enable standardized input for hazard-risk assessments. Cao et al. (2025) extended Bayesian networks with multi-state fuzzy logic and expert confidence to infer bridge safety risks and identify critical nodes in causal chains [12]. Kammouh and Chahrour (2025) assembled indicator bundles spanning physical, operational, and social dimensions for transport resilience [13]. The work highlighted practical, indicator-based assessment paths.
Network-level literature focused on vulnerability, resilience, robustness, and reliability. Bibliometric reviews summarize methods and trends for road-network vulnerability and resilience. Bashir et al. (2025) noted varied metrics and modeling traditions [14]. Similarly, Santos and Bertoncini (2025) linked vulnerability to robustness and reliability for roads [15]. Nicholson et al. (2024) simulated spatially correlated failures to rank structural component importance under a hazard footprint. The simulation captured interdependence beyond independent-failure assumptions [16]. Doğaroğlu and Çalışkanelli (2025) defined link and node vulnerability indices using microsimulation to quantify and rebalance network vulnerability [17]. López et al. (2025) provided reliability-based, component-level vulnerability assessment for steel truss bridges. They integrated finite element analysis (FEM) and uncertainty quantification to optimize inspections [18]. Arabi et al. (2024) reviewed multilayer transport networks and proposed equity-aware resilience metrics to guide inclusive resource allocation [19].
Hazard-specific applications illustrated method depth but had limited generality. Ren et al. (2024) combined convolutional neural networks (CNNs) and conventional ML to predict driftwood accumulation and rainfall-driven bridge damage [20]. They aimed to link landslide susceptibility to bridge safety. Urban flood studies similarly quantify subsystem performance degradation and routing shifts under inundation [21]. Ansari et al. (2025) used a fuzzy synthetic approach to classify seismic damage with attention to ground conditions, span orientation, and proximity to fault rupture [22]. Han et al. (2025) synthesized lessons from historical failures and emphasized life-cycle management, preventive maintenance, and monitoring [23]. Beyond transport, analysis based on the Method Organized Systematic Analysis of Risk (MOSAR) for energy networks showed structured, scenario-driven critical infrastructure (CI) risk assessments to inform cross-sector practices [24]. Rodriguez et al. (2025) adapted a Quality Function Deployment (QFD) tool into a multi-risk deployment framework to assess preparedness in industrial facilities [25]. They aimed to add territorial prioritization and practical rating schemes.
Data and digital-twin advances promised richer, real-time risk forecasting but they increased complexity. Geng et al. (2025) proposed a digital twin framework with Bayesian networks to integrate inspection, traffic, and hydrologic data for life-cycle risk assessment across bridge networks [26]. They captured interdependencies across components, structures, and systems but required intensive data assimilation. Intini et al. (2025) modeled annual average daily traffic (AADT) exposure using public predictors to fill traffic-count gaps and support multi-risk frameworks [27]. They showed that using ML improved heavy-vehicle accuracy. Grieco et al. (2024) presented an index-based multi-hazard prioritization for large portfolios under limited knowledge [28]. They delivered rankings that were consistent with national guidelines. Papamichael et al. (2024) examined how transnational challenges and human decision biases shaped CI risk processes [29]. They highlighted the need for transparent, domain-aware methods.
Across these strands, the literature advanced climate-aware protocols, component reliability, ML-based condition prediction, multi-risk frameworks, and network vulnerability metrics. Yet three practical gaps persist in freight-corridor decision support:
- Freight-centric consequence is under-specified. Most studies emphasized hazard intensity, structural fragility, or community recovery. Fewer quantified the potential for daily supply-chain disruption with simple, scalable measures such as detour distance that is a proxy for user cost and logistics delay.
- Operational threat exposure lacks a direct, routable metric in portfolio risk indices. Traffic is often ancillary, imputed, or used for exposure mapping rather than embedded as a multiplicative driver of risk at the structure level.
- Interpretable, nation-scale screenings are rare. Rich Bayesian/digital-twin or fuzzy frameworks offer depth but can be data-heavy. Many methods stop at component-reliability or hazard-specific scoring, limiting transferability to routine prioritization across an entire inventory.
This paper addresses those gaps with a transparent TVC risk index, aligned with federal guidelines in risk assessment, and designed for freight corridors. The methodology log-transforms and normalizes factors, multiplies them into a single interpretable score, and classifies the results with Jenks natural breaks for actionable mapping. The risk index design remains hazard-agnostic yet supply-chain relevant. Hence, the proposed method enables consistent ranking across a national portfolio and provides direct linkage to routing and investment decisions.
3. Methodology
This study developed and validated a risk index for bridges through a structured data mining and modeling workflow. The methodology integrates data preparation, descriptive analysis, index construction, ML validation, and regression analysis. The workflow emphasizes interpretability while ensuring empirical rigor by combining established risk modeling concepts with non-parametric ML techniques. The foundation of the index is the TVC framework, which quantifies risk as the product of operational loading, structural vulnerability, and the disruption costs of rerouting freight. The design process, therefore, required variables that could represent each dimension in a transparent and scalable way.
Figure 1 provides an overview of this workflow.
It illustrates the sequence from raw data preparation to the development and validation of the final bridge risk index. The workflow proceeds in three stages. First, it filtered a large bridge inventory dataset and cleaned it to create a representative subset of highway bridges used for long-haul trucking. Second, descriptive analyses summarized the distributions of condition ratings, effective age, load margins, and traffic intensity. Third, it constructed the risk index through non-linear transformations and normalizations of the TVC risk factors, and risk classification using Jenks natural breaks. The methodology also incorporated non-parametric ML models and regression analysis to validate the selection of vulnerability factors and quantify the relative contributions of threat, vulnerability, and consequence. The subsections that follow further describe each step in the workflow.
3.1. Data Preparation
This research utilized the National Bridge Inventory (NBI) database, annually updated by the Federal Highway Administration [30]. The NBI includes identification information, structural specifications, operational conditions, traffic loading, geometric data, functional descriptions, and inspection ratings for 624,193 U.S. bridges. The record for each structure contained 128 attributes or meta data. The ArcGIS online version included two more fields that provide corrected latitude and longitude coordinates.
Table 1 summarizes the data extraction, filtering, and cleaning of the NBI dataset to focus the analysis on contiguous United States (CONUS) bridges that support long-haul trucking. The data filtering first extracted CONUS bridges by removing records for Alaska, Hawaii, Puerto Rico, and the U.S. Virgin Islands. For replication, the item number listed in parentheses after the attribute description is the NBI data dictionary item number [31]. The next filter extracted records for bridges on the NHS. This filtering stage revealed that close to one-quarter (23.6%) of the CONUS bridges are on the NHS.
To focus on long-haul truck routes, the next filter stage extracted functional bridges on the mainline highways. These excluded ramps, bypasses, spurs, frontage roads, and other structures that do not support the main traffic load. The remaining filters then cleaned the data by removing records with missing or obvious erroneous data such as no geospatial coordinates, zero design load capacity, zero ADT, or zero detour distance.
The workflow defines the variable “epoch” as the years from the most recent defining event in the bridge’s life cycle. Hence, the epoch is the years since built, reconstructed, or improved, whichever is the most recent, to capture the “effective age” of the bridge. Subsequently, the filter removed records with an epoch of zero or negative years. The final cleaning step removed attributes and meta data that were irrelevant to the risk model development. These items included information such as bridge identification number, ownership, history, approach type, clearances, structures under the bridge, and navigational features. The final filtered and cleaned dataset had 83,479 records, each with 67 attributes and four meta data items.
3.2. Data Mining
To motivate the development of the risk index, the methodology first applies exploratory data analysis to key attributes of the cleaned bridge dataset. It examined five important factors: inspector-assigned condition ratings, the distribution of effective age (epoch), the distribution of load margin, ADT per lane, and detour distance. These descriptive statistics establish baseline patterns for structural condition, traffic demand, loading, and rerouting penalties. The subsections that follow provide more context for how each factor contributes to the threat, vulnerability, and consequence components of the TVC model.
3.2.1. Condition Rating
Table 2 summarizes the condition rating that inspectors assigned to the major structural sections of the bridge, namely the deck, sub-structure, and super-structure [32].
To facilitate downstream ML models, the research workflow defined the categorical variable “Undamaged” to take on the label of “1” if the rating is 8 or 9 and zero otherwise. Hence, a label of “1” indicates that the structure has no deficiencies that require repair to support traffic. A label of “0” indicates that the structure does require some level of remediation as described by the rating levels from 0 to 7. Figure 2 plots the distribution of the lowest rating received for any portion of the bridge. The distribution indicates that there is a central tendency toward ratings from 5 to 7. This suggests that the majority of bridges on the NHS have some minor damage or deterioration that requires attention.
3.2.2. Epoch Distribution
Figure 3 shows the distribution of the epoch as defined above in Table 1. The pattern aligns with intuition in that a larger number of the more recently built, reconstructed, or improved bridges are in the undamaged category. As expected, the undamaged category decreases steadily with the increasing epoch. Overall, only 5.6% of the bridges are in the undamaged category. The average and standard deviation of the epoch was 33.2 and 22.5 years, respectively.
Interestingly, epoch within the recent five years dominates the distribution. This outcome aligns with the U. S. Infrastructure Investment and Jobs Act passed in 2021. This is a federal law allocating $550 trillion to modernize the nation’s transportation infrastructure [33]. The distribution reveals that states of New York, Wisconsin, and Washington have been the most active among states within that distribution peak. This also aligns with the major bridge improvement programs and funding that those states recently established. For instance, New York established a five-year capital program of $200 million annually to fund bridge rehabilitation and replacement [34]. Wisconsin established their Local Bridge Improvement Assistance Program to supplement grants from the U. S. Bipartisan Infrastructure Law with local funding [35]. Washington State estimated that its Interstate Bridge Replacement Program will invest $7.5 billion [36].
3.2.3. Load Margin
The research workflow defines a load margin as the difference between the load capacity rating and the design load of the bridge. The NBI data attribute described as “inventory” rating (item 66) stores the bridge’s inspection rated capacity in metric tons. The NBI data attribute described as design load (item 31) is the weight of a live load for which the bridge was designed. The data are coded in weight categories as “H xx” where xx is the live load in tons, which the load margin calculation converted to metric tons [37]. Figure 4 plots the distribution of the load margin.
The results reveal that nearly one-third (32.5%) of the bridges are rated for a load capacity that is below their design load. The distribution also shows a central tendency for the capacity ratings to be within 20 metric tons of the design load. For reference, most multi-axle trucks in the U.S. have a loaded maximum weight of 80,000 pounds, which is around 36.3 metric tons [38]. A deeper examination of the distribution also revealed that 6.6% of the bridges rated with positive load margin are in the undamaged category versus 3.6% of bridges rated with negative load margin. Hence, aligning with intuition, bridges rated with a positive load margin have more than 1.8 times those in the undamaged category than bridges rated with a negative load margin.
Figure 5 shows the rank of states by the percentage of state bridges rated below their design load. Figure 6 shows the same results on a map. It is evident that Tennessee, California, Oregon, New Mexico, and Georgia ranked in the top five. Figure 7 plots a ranking of the average load margin of bridges within a state. Figure 8 plots the same data on a map. It is evident that the states of Oregon, Tennessee, Wyoming, Texas, and New Mexico are within the top five among states that have bridges rated with the lowest average load margin. This result aligns with the previous result of states having the highest percentage of bridges rated with a negative load margin. In contrast, the states of Arizona, Virginia, Maryland, Nevada, and Vermont are in the top five with bridges rated with the highest average load margins.
3.2.4. Average Daily Traffic
Figure 9a plots the ADT per lane distribution of the bridges analyzed. Overall, the average and standard deviation was 10,618 and 11,143, respectively.
The distribution is highly skewed, showing a strong tendency for most of the NHS highway bridges to carry less than 10,000 vehicles per lane. The central tendency within that category ranged from 2,000 to 2,800. Outliers carried between 20,000 and 60,000 vehicles per lane. Figure 9b shows the log-transformed distribution, which improved the ML performance downstream in the workflow.
Figure 10 shows the average ADT per lane for the subset of bridges on interstate routes. Figure 11 illustrates the same information on a map. The results indicate that Tennessee, Washington, D.C., Maryland, Florida, and Georgia rank in the top five among states. This aligns with the intuition that the eastern U.S. freight corridors and ports carry or generate much of that traffic. California is next in rank, which also aligns with intuition that the Western U.S. freight corridors and ports carry or generate some of the most traffic.
3.2.5. Detour Distance
The distribution of the detour distance is highly skewed, as shown in Figure 12a. The average distance is just over 15 kilometers, and the standard deviation is just over 34 kilometers. Within the distribution peak, most of the detour distance is within three kilometers. Figure 12b shows the natural log transformation to reduce the skew, which improves the performance of ML algorithms downstream by rebalancing the data.
3.3. Index Design and Validation
The following subsections explain the selection of key risk factors, the transformations and normalizations applied to ensure comparability, and the use of the Jenks method to classify the index into clear and interpretable clusters.
3.3.1. TVC Model
The TVC model is a product of threat (T), vulnerability (V), and consequence (C) factors as
to quantify a level of risk that aligns with the operational realities of freight corridors. The TVC framework is widely used in critical infrastructure protection because it captures the three essential dimensions of risk: the likelihood of stressors, the susceptibility of structures to deterioration, and the magnitude of impacts due to loss of functionality. Unlike purely probabilistic or reliability-based models, the TVC model emphasizes the integration of operational exposure and system consequences, making it well suited for transportation security and supply chain analysis. Alternative models such as Fault Tree Analysis, Failure Modes and Effects Analysis, or probabilistic risk assessment are valuable for component-level reliability studies. However, they often require detailed failure probability data that are not available at a network scale. The TVC model balances conceptual clarity with practical data availability, which enables consistent application across large bridge inventories.
In the TVC context, threat is defined as the operational loading intensity on a bridge. For freight corridors, ADT per lane captures the degree of stress imposed by vehicles, particularly long-haul trucks. Vulnerability reflects the structural condition of a bridge. ML models later confirm that the effective age of a bridge (epoch) has the highest power in predicting the condition rating. In the results section below, the ML models showed that effectively newer bridges strongly correlate with undamaged ratings, while older bridges correlate with various levels of deterioration. Consequence measures the disruption imposed on freight if a bridge becomes unusable. Hence, the detour distance captures the added cost of rerouting trucks. These costs are due to increased travel time, fuel consumption, and logistical inefficiencies. The ADT per lane is also a component of consequence. That is, bridges with higher per-lane traffic volumes face elevated risk of disruption because closures would affect more vehicles and critical freight flows. These costs reflect the supply chain perspective, where continuity of freight movement is paramount. Hence, the TVC framework ensures that the risk index remains transparent, scalable, and grounded in both security literature and practical freight logistics considerations.
To construct the risk index, the workflow first transformed and normalized each factor to ensure comparability across scales. The workflow log-transformed the threat and the consequence factors to reduce skewness and then normalized them to the [0,1] range. The workflow normalized the vulnerability factor (epoch) without log transformation because its distribution was less skewed, and the interpretation would be more direct. The procedure then constructed the risk index as the product of these transformed and normalized factors as
where is the normalization function
and LN is the natural logarithm.
3.3.2. Jenks Classification
The workflow used the Jenks natural breaks method to classify the TVC risk index into categories. The optimization method partitions data into classes that minimize variance within each class while maximizing variance between classes. The algorithm seeks to minimize the total within-class sum of squared deviations as
where k is the number of classes, Cj is the set of values in class j, is an observation, and is the mean value of class j. At the same time, it maximizes the between-class variance as
where nj is the number of observations in class j, and is the global mean value. The objective is to maximize the goodness-of-variance fit (GVF):
where
is the total variance. A GVF closer to 1 indicates stronger class separation. This method is well suited for skewed distributions, such as the TVC risk index, because it identifies natural groupings in the data rather than imposing equal intervals or quantiles.
3.4. ML Models
The workflow defines ‘undamaged’ as the target variable for the ML models. Attributes that best predict undamaged bridges are considered most relevant for the vulnerability component of the TVC model. The workflow applied six non-parametric models to rank the predictive power of attributes: extreme gradient boosting (XGB), random forest (RF), artificial neural network (ANN), logistic regression (LR), k-nearest neighbor (kNN), and support vector machine (SVM). Although more complex to implement and explain, non-parametric models are advantageous in that they do not assume strict functional forms. This flexibility allows them to capture nonlinear and complex relationships in bridge condition data. Parametric models, by contrast, require strong distributional assumptions that do not hold for infrastructure data.
XGB is an ensemble method that builds decision trees sequentially, with each tree correcting errors from the previous one [39]. The algorithm minimizes a loss function with regularization to prevent overfitting. The prediction is:
where are regression trees and is the space of all possible trees. In all models, yi and xi represent the target values and the set of associated features, respectively, for record i in the dataset.
RF constructs many decision trees on bootstrapped samples and averages their predictions [40]. Each tree uses a random subset of features, which reduces correlation and variance. The prediction is:
where is the prediction from tree t.
ANN uses layers of interconnected neurons to capture nonlinear relationships [39]. Each neuron applies an activation function to a weighted sum of inputs. The output is:
where σ is the activation function, wj are weights, and b is the bias.
Although often considered parametric, LR is included for its interpretability and to compare performance against the other non-parametric models [40]. LR estimates the probability that a bridge is undamaged using the logistic function:
kNN classifies a bridge based on the majority class among its k nearest neighbors in attribute space [40]. The decision rule is:
where is the set of k nearest neighbors of x.
SVM finds the hyperplane that best separates undamaged and damaged bridges [39]. The objective is to maximize the margin between classes:
These models are expected to perform differently on highly unbalanced data, which is the case in this dataset where less than 6% of bridges are undamaged. XGB and RF often perform well because they handle nonlinearity and class imbalance with sampling or weighting. ANN can capture complex patterns but may require resampling or cost-sensitive learning to avoid bias toward the majority class. LR provides baseline interpretability but typically struggles with unbalanced datasets. kNN is sensitive to imbalance because the class containing the majority of records dominates local neighborhoods. SVM can be effective due to the use of kernel functions but is sensitive to data with a noisy class boundary. Together, these models provide a comprehensive evaluation of attribute importance under unbalanced conditions to robustly and reliably identify the vulnerability factors.
3.5. Performance Evaluation
The workflow evaluates the performance of each model by using five metrics: classification accuracy (CA), F1-score, precision, recall, and the area under the curve (AUC). These metrics provide a balanced view of predictive ability, especially under unbalanced data [39]. CA measures the proportion of correctly classified bridges.
where TP is the number of true positives, TN the true negatives, FP the false positives, and FN the false negatives. However, CA can be misleading under unbalanced data. For example, a model that always predicts the target variable as the same value, e.g., the bridge is damaged, would achieve high accuracy but would fail to identify any undamaged bridges.
Precision (Pr), also called specificity, measures the fraction of correctly identified undamaged bridges among all bridges predicted as undamaged.
Recall (Rc), also called sensitivity, measures the fraction of undamaged bridges correctly identified by the model.
The F1-score is the harmonic mean of precision and recall. It balances both metrics, which is critical in unbalanced datasets.
AUC measures the ability of the model to distinguish between undamaged and damaged bridges across different thresholds. It is calculated as the area under the receiver operating characteristic (ROC) curve as
where is the true positive rate and is the false positive rate. The models use a probability threshold to determine whether a bridge is classified as undamaged or damaged. By varying this threshold from 0 to 1, the AUC evaluates performance at every decision point. The ROC curve plots the true positive rate against the false positive rate for each threshold, and the AUC is the area under this curve. The ML procedures determined these rates through stratified k-fold cross-validation and hyperparameters tuning to maximize the AUC.
Using the above metrics together ensured that model performance is not judged solely on overall accuracy. They emphasize the correct identification of the minority class, which is critical since less than 6% of bridges are undamaged. However, the evaluation emphasized AUC because it measures the model’s ability to distinguish between undamaged and damaged bridges across all thresholds. Unlike accuracy, AUC is not biased by class imbalance and provides a threshold-independent assessment. This ensures that the minority class of undamaged bridges is properly recognized.
3.6. Attribute Importance
The workflow used the permutation feature importance (PFI) method to assess the contribution of each attribute [41]. The PFI method measures the change in model performance, based on the AUC, when randomly shuffling the values of a single attribute while keeping all other attributes fixed. Intuitively, randomly shuffling an attribute effectively nullifies its contribution toward predicting the class of the target variable. Hence, if shuffling an attribute causes a large drop in performance, that attribute is considered important for prediction. Conversely, if the performance remains stable, the attribute has little influence. The model quantifies the importance of an attribute as
where is the model performance with unshuffled data and is the performance after permutation. Overall, the PFI is model-agnostic, simple to implement, and directly interprets the predictive power of attributes by quantifying their effect on classification outcomes.
3.7. Regression
To quantify the relative influence of threat, vulnerability, and consequence factors on the risk index, the workflow used an ordinary least squares (OLS) regression model with all pairwise combinations of the transformed and normalized factors. A regression model with the three pairwise terms as predictors was
where is the risk index for bridge i. Hence, the variables , , and are the estimated coefficients for the three pairwise factors. The variable is the estimated regression constant, and is the error term. The estimated coefficients directly reflect the relative contributions of the underlying factors. For example, if (associated with VC) is larger than or , it indicates that the combination of vulnerability and consequence explains more of the variation in the risk index, and therefore the threat factor contributes less.
The explanatory power of the model is measured by the coefficient of determination (R2) as
where is the predicted value and is the average value of the risk index. Higher R2 values indicate stronger predictive ability.
The selection of this approach was due to its simplicity, transparency, and interpretability. As pairwise terms in the regression, one can assess the marginal contribution of each factor to the overall risk index without resorting to complex decomposition and less intuitive methods.
4. Results
The analysis produced results at three levels: attribute validation, index construction, and risk ranking. First, non-parametric ML models identified the most predictive attributes for bridge condition and confirmed the dominance of effective age (epoch) as the vulnerability factor. Second, regression analysis quantified the relative contributions of threat, vulnerability, and consequence, showing that vulnerability and detour distance explain most of the variation in the risk index. Finally, the workflow applied the constructed TVC index to bridges across the NHS to reveal geographic patterns and clusters of high-risk bridges. The following subsections present these results in detail.
4.1. Machine Learning
The ML models ranked bridge attributes by their predictive power for the target variable undamaged. Table 3 summarizes the attributes in descending order of importance, and Figure 13 shows the decrease in AUC after permuting each attribute. The variable epoch, which represents effective bridge age, dominated the rankings. The model performance was approximately 3.5 times more sensitive to removing the influence of epoch than to the next most important attribute, structural material type. This strong signal justified selecting epoch as the vulnerability factor in the TVC risk index.
Several other attributes showed moderate influence, including structural material type, inventory load, maximum span length, number of spans, and ADT per lane. Attributes such as deck width, structure type, and detour distance had smaller effects. The lowest-ranked attributes, including traffic direction and number of lanes, contributed little to predictive performance. This confirms that age-related deterioration is the strongest predictor of undamaged bridges, while other attributes add only marginal value.
Table 4 reports the performance of the six ML models. XGB achieved the best performance with an AUC of 0.90, classification accuracy of 0.95, and F1-score of 0.93. RF and NN models followed closely, with AUC values of 0.86. LR also performed well with an AUC of 0.82, while kNN trailed at 0.75. The SVM performed poorly on this dataset, with an AUC of 0.57 and much lower classification accuracy.
The consistently high classification accuracy across most models reflected the strong imbalance in the dataset, where undamaged bridges accounted for less than 6% of the population. The AUC and F1-score were therefore more reliable indicators of true performance. Among these, the tree-based ensemble models provided the most robust results. Together, these findings confirm that the effective bridge age (epoch) is the most critical vulnerability factor, and that the chosen ML framework reliably identified it.
4.2. OLS Regression
Figure 14 plots the instances of risk index predicted by the OLS regression against the constructed risk index and the best linear fit. The regression of the risk index on the three pairwise terms (TV, TC, and VC) produced a high coefficient of determination of R2 = 0.98. This indicates that the three pairwise combinations together captured most of the variation in the constructed risk index.
Table 5 summarizes the estimated coefficients for each pairwise combination. The t-statistic and the p-value indicate the probability that the estimated values are non-zero. The relative magnitudes of the regression coefficients provide insight into the contributions of the underlying factors. The coefficient for the VC term () was the largest, followed by the coefficient for TV (). This result shows that the interaction of vulnerability and consequence explains the majority of the risk index. In contrast, terms containing threat contribute less to prediction once vulnerability and consequence are included.
These findings indicate that bridge age and detour distance dominate the risk measure, while traffic intensity plays a secondary role. The results are consistent with the interpretation that supply chain disruption is more sensitive to structural deterioration and rerouting costs than to traffic loading alone.
4.3. Ranking Risks
Figure 15 ranks states by their average TVC risk index. Oklahoma has the highest average risk, followed by Nebraska, Oregon, Wyoming, and Montana. States with the lowest averages include South Carolina, Wisconsin, New York, and Massachusetts. Figure 16 maps these averages across states, where darker shades highlight higher average risk. The map shows a concentration of higher-risk states in the Great Plains and Mountain West. This result is intuitive because these rural regions combine older bridges, higher detour distances, and fewer redundancy options, which increase risk.
Figure 17 presents the distribution of the TVC risk index using Jenks natural breaks into 10 intervals. Most bridges cluster at low-risk values, but a long tail extends toward extreme outliers. This confirms that while the majority of bridges present low supply chain risk, a small fraction represents disproportionately high vulnerabilities.
Figure 18 highlights bridges in the highest Jenks category, showing 292 outliers. The map uses k-means clustering to group these into five clusters. The outliers often appear near major cities, where dense NHS corridors converge. Many outliers also fall close to primary U.S. port areas, shown in orange. This overlap emphasizes how failures at these bridges would disrupt freight flows at strategic gateways, amplifying risks to supply chains.
Table 6 lists the top 20 bridges ranked by the risk index. The table includes the lowest rating (L), if it is in a rural location (R = 1), the detour distance (DD), the ADT per lane (ADL), and the latitude (LAT)/longitude (LON) coordinates of the structure. The average effective age of these bridges is 91 years. They carry an average of more than 5,000 vehicles per lane per day, and detours average 170 kilometers. Most are on major interstate or U.S. routes within the NHS. Several bridges in Oregon, Missouri, Tennessee, and Colorado dominate the top of the list, with risk index values approaching 30. Many of the Colorado bridges fall on Interstate 12A and share similar characteristics, highlighting clusters of high vulnerability.
Together, these results show that high-risk bridges are not evenly distributed. They concentrate in specific states and along major freight corridors near ports. The combination of advanced age, heavy truck volumes, and long detour distances create localized but severe threats to supply chain continuity.
5. Discussions
The results demonstrate that a TVC-based index that is transparent can effectively capture how structural aging and rerouting costs dominate supply chain risk across the U.S. bridge network. The consistent identification of epoch as the strongest predictor validates the use of effective bridge age as the most representative vulnerability factor. Combined with detour distance, these attributes explain the majority of the variation in the risk index. This outcome supports this study’s goal to create a practical decision-support tool for freight corridor resilience.
The findings highlight how disruptions to supply chains are more sensitive to deterioration and rerouting penalties than to traffic intensity alone. This interpretation aligns with the operational reality that long detours and aging structures impose significant costs even when traffic volumes are moderate. By integrating per-lane ADT as both a loading factor and a multiplier of consequence, the model balances exposure and disruption in the risk ranking process.
This study advances the body of knowledge by translating the widely recognized TVC framework into a scalable and interpretable index tailored for freight infrastructure. Unlike hazard-specific or component-level assessments, this index generalizes across regions and hazards while remaining rooted in supply chain continuity. The ability to classify risk through Jenks natural breaks further enhances interpretability by identifying natural clusters of high-risk bridges and allowing agencies to prioritize clusters rather than isolated outliers.
When compared with related work, this approach extends beyond climate-focused protocols, seismic or flood-specific models, and digital-twin frameworks that require intensive data assimilation. It provides a middle ground that is both empirically validated through ML methods and is operationally simple to compute at scale. The explicit incorporation of detour distance as a proxy for user cost distinguishes this work from prior studies that emphasized hazard intensity or component fragility without addressing freight logistics implications.
This study focused on developing a transparent and scalable risk index using variables available in the NBI. While the approach captured key dimensions of supply chain disruption, several aspects were not within the scope of this effort. The index does not incorporate dynamic traffic variations, seasonal demand shifts, or real-time hazard exposure. Those factors may alter risk profiles in practice. The consequence term is represented by detour distance as a proxy for user cost, but it does not differentiate by commodity value, time sensitivity, or regional economic dependence. In addition, the analysis treated hazards in a hazard-agnostic manner rather than tailoring fragility relationships to specific threats such as floods, earthquakes, or extreme weather. These limitations suggest clear paths for future research. Extending the framework to include dynamic traffic data, hazard-specific fragility models, and commodity-sensitive consequence measures will enhance the precision of the risk index. Integrating multimodal supply chain flows and regional economic models would further strengthen its relevance for investment planning and resilience strategies. Such extensions will broaden the implications of this work while preserving its central value: a simple, interpretable, data-driven foundation for prioritizing bridges that matter most to freight continuity.
6. Conclusions
This study addressed the challenge of prioritizing bridge investments by developing a transparent and scalable risk index tailored to freight corridors. Bridges are indispensable to the U.S. supply chain, yet limited resources force agencies to make difficult decisions about which structures to repair or replace. By applying the threat–vulnerability–consequence (TVC) framework and validating its components with machine learning, the research provides a practical tool to identify which bridges pose the greatest disruption risk to freight movement. The conclusions connect directly to the goal of the study to support decision-making for both infrastructure managers and supply chain stakeholders.
The analysis showed that effective age (epoch) is the dominant vulnerability factor, while detour distance magnifies the consequence of bridge closures. Together, these factors explain most of the risk variation across the network. The index successfully identified clusters of high-risk bridges in rural regions and freight gateways where limited redundancy amplifies disruption potential. The results confirm that supply chain continuity is most sensitive to deterioration and rerouting costs rather than traffic intensity alone.
The contribution of this work is a practical and scalable decision-support tool for state and federal agencies. The TVC index can guide prioritization of maintenance investments, inform freight routing strategies, and support long-range infrastructure planning. The index offers consistent applicability across the national bridge inventory because it is hazard-agnostic and based on publicly available data. Beyond freight applications, the framework demonstrates how interpretable machine learning and risk modeling can be combined to derive actionable indices for critical infrastructure. The approach can be generalized to other asset classes where exposure, vulnerability, and consequence interact to drive operational risk.
Funding
This research received funding from the United States Department of Transportation, Center for Transformative Infrastructure Preservation and Sustainability (CTIPS), Funding Number 69A3552348308.
Data Availability Statement
This article includes the data presented in the study.
Conflicts of Interest
The author declares no conflicts of interest.
References
- B. Goldman, "Surface Freight Transportation: Modal Options," Congressional Research Service (CRS), Washington, D.C., 2025.
- Pew, "States Fall Short of Funding Needed to Keep Roads and Bridges in Good Repair," Pew Research Center, Washington, D.C., 2025.
- T. Masse, S. O’Neil and J. Rollins, " The Department of Homeland Security’s Risk Assessment Methodology: Evolution, Issues, and Options for Congress," Congressional Research Service (CRS), Washington, D.C., 2007.
- National Research Council. Review of the Department of Homeland Security's Approach to Risk Analysis; The National Academies Press: Washington, DC, United States, 2010. [Google Scholar]
- Hwang, T. Assignment of Freight Truck Shipment on the U.S. Highway Network. Sustainability 2021, 13, 6369. [Google Scholar] [CrossRef]
- L. Chimini and H. Caldwell, "NHS Intermodal Freight Connectors - A Report to Congress," United States Department of Transportation, Federal Highway Administration, Office of Freight Management and Operations, Washington, D.C., 2001.
- Altamimi, S.; Amleh, L.; Fang, L. Risk Assessment Protocol for Existing Bridge Infrastructure Considering Climate Change. Climate 2024, 12, 132. [Google Scholar] [CrossRef]
- F. Fard and F. S. N. Fard, "Development and Utilization of Bridge Data of the United States for Predicting Deck Condition Rating using Random Forest, XGBoost, and Artificial Neural Network," Remote Sensing, vol. 16, no. 2, p. 367, 2024.
- Principi, L.; Morici, M.; Natali, A.; Salvatore, W.; Dall'ASta, A. Preliminary fast assessment of bridge risk by neural network. Int. J. Disaster Risk Reduct. 2024, 116. [Google Scholar] [CrossRef]
- Li, X.; Mostafavi, A. Machine learning approach for disaster risk and resilience assessment in coupled human infrastructure systems performance. npj Nat. Hazards 2025, 2, 1–15. [Google Scholar] [CrossRef]
- S. Nirandjan, E. E. Koks, M. Ye, R. Pant, K. C. V. Ginkel, J. C. Aerts and P. J. Ward, "Physical Vulnerability Database for Critical Infrastructure Hazard Risk Assessments–a Systematic Review and Data Collection," Natural Hazards and Earth System Sciences, vol. 24, no. 12, p. 1, 2024.
- Cao, Z.; He, W.; Chen, K.; Rao, R.; Chen, Z. A robust method for bridge safety risk assessment using improved multi-state fuzzy Bayesian network. Sci. Rep. 2025, 15, 1–20. [Google Scholar] [CrossRef]
- Kammouh, O.; Chahrour, N. Indicator-based framework to evaluate the resilience of transport infrastructure systems. Sustain. Resilient Infrastruct. 2025, 1–27. [Google Scholar] [CrossRef]
- Bashir, T.; Bergantino, A.S.; Troiani, G.; Henke, I.; Pagliara, F. Vulnerability and resilience analysis of road network: A systematic literature review using Bibliometrix. Sustain. Futur. 2025, 10. [Google Scholar] [CrossRef]
- J. E. D. d. Santos and B. V. Bertoncini, "Systematic analysis of vulnerability and resilience in road networks: A study of critical components and recent trends," Latin American Transport Studies, vol. 3, p. 100034, 2025.
- Nicholson, C.; Tehrani, M.; Ghasemkhani, A. A systemic approach for assessing infrastructure component importance in hazard-prone communities. Int. J. Disaster Risk Reduct. 2024, 113. [Google Scholar] [CrossRef]
- Doğaroğlu, B.; Çalişkanelli, S.P. A novel vulnerability index and approach for improving road network vulnerability. Can. J. Civ. Eng. 2025, 52, 1796–1811. [Google Scholar] [CrossRef]
- López, S.; Barros, B.; Buitrago, M.; Adam, J.M.; Riveiro, B. Reliability-based vulnerability assessment of steel truss bridge components. Struct. Saf. 2025, 117. [Google Scholar] [CrossRef]
- Arabi, M.; Gerasimidis, S.; Barchers, C.; Oke, J. Resilience in multilayer transportation infrastructure networks: a review and conceptual framework for equity-based assessment. Sustain. Resilient Infrastruct. 2024, 9, 616–639. [Google Scholar] [CrossRef]
- Ren, F.; Isobe, K.; Ando, M. Risk Assessment of Bridge Damage Due to Heavy Rainfall Considering Landslide Risk and Driftwood Generation Potential Using Convolutional Neural Networks and Conventional Machine Learning. Water 2024, 16, 3471. [Google Scholar] [CrossRef]
- Borowska-Stefańska, M.; Bartnik, A.; Goniewicz, K.; Kowalski, M.; Sahebgharani, A.; Tomalski, P.; Wiśniewski, S. Assessing road network resilience and vulnerability in urban transport systems against urban flooding. Environ. Hazards 2025, 1–24. [Google Scholar] [CrossRef]
- Ansari, A.; Alluqmani, A.E.; Huang, Z.; Lee, J.-H.; Özden, G.; Fissha, Y.; Saidani, T.; Ansari, A. Fuzzy synthetic approach for seismic risk assessment of bridges with insights from the 2023 Kahramanmaras Earthquake in Turkiye. Sci. Rep. 2025, 15, 1–16. [Google Scholar] [CrossRef] [PubMed]
- Han, Z.-Y.; Lei, J.-Q.; Li, G.-X.; Wang, W.-Q. Prevention and Safety Research of Bridge Life Cycle Risk Accidents. The 10th World Congress on Civil, Structural, and Environmental Engineering. LOCATION OF CONFERENCE, COUNTRYDATE OF CONFERENCE;
- Fošner, A.; Bertoncelj, B.; Poznič, T.; Fink, L. Risk analysis of critical infrastructure with the MOSAR method. Heliyon 2024, 10, e26439. [Google Scholar] [CrossRef]
- Rodriguez, D.J.C.; Barresi, A.A.; Demichela, M. “Critical infrastructure multi-risk deployment: an innovative framework to support NaTech preparedness in industrial facilities”. Process. Saf. Environ. Prot. 2025, 202. [Google Scholar] [CrossRef]
- Geng, Z.; Zhang, C.; Jiang, Y.; Pugliese, D.; Cheng, M. Integrating multi-source data for life-cycle risk assessment of bridge networks: a system digital twin framework. J. Infrastruct. Preserv. Resil. 2025, 6, 1–20. [Google Scholar] [CrossRef]
- Intini, P.; Blasi, G.; Fracella, F.; Francone, A.; Vergallo, R.; Perrone, D. Predicting traffic volumes on road infrastructures in the context of multi-risk assessment frameworks. Int. J. Disaster Risk Reduct. 2024, 117. [Google Scholar] [CrossRef]
- Grieco, L.A.; Scattarreggia, N.; Monteiro, R.; Parisi, F. An index-based multi-hazard risk assessment method for prioritisation of existing bridge portfolios. Int. J. Disaster Risk Reduct. 2024, 114. [Google Scholar] [CrossRef]
- Papamichael, M.; Dimopoulos, C.; Boustras, G. Performing risk assessment for critical infrastructure protection: an investigation of transnational challenges and human decision-making considerations. Sustain. Resilient Infrastruct. 2024, 9, 367–385. [Google Scholar] [CrossRef]
- National Bridge Inventory," United States Department of Transportation, 11 August 2025. [Online]. Available: https://geodata.bts.gov/datasets/usdot::national-bridge-inventory/explore. [Accessed 15 August 2025].
- FHWA, "Recording and Coding Guide for the Structure Inventory and Appraisal of the Nation's Bridges," Federal Highway Administration (FHWA), Washington, D.C., 1995.
- Hasan, S.; Elwakil, E. National Bridge Inventory Data-Based Stochastic Modeling for Deck Condition Rating of Prestressed Concrete Bridges. Pr. Period. Struct. Des. Constr. 2020, 25, 04020022. [Google Scholar] [CrossRef]
- Suárez-Cuesta, D.; Latorre, M.C. Modeling the Impact of Public Infrastructure investments in the U.S.: A CGE Analysis. Int. Adv. Econ. Res. 2023, 29, 165–176. [Google Scholar] [CrossRef]
- NYSDOT, "2023 BRIDGE NY Program," New York State Department of Transportation (NYSDOT), 2025. [Online]. Available: https://www.dot.ny.gov/BRIDGENY. [Accessed 15 August 2025].
- WisDOT, "Local Bridge Improvement Assistance," Wisconsin Department of Transportation (WisDOT), 2025. [Online]. Available: https://wisconsindot.gov/Pages/doing-bus/local-gov/astnce-pgms/highway/localbridge.aspx. [Accessed 15 August 2025].
- WSDOT, "Interstate Bridge Replacement Program: A Bridge to the Future," Washington State Department of Transportation (WSDOT), 2025.
- FHWA, "Bridges & Structures," Federal Highway Administration, 5 October 2022. [Online]. Available: https://www.fhwa.dot.gov/bridge/110202.cfm. [Accessed 15 August 2025].
- Woodrooffe, J. Opportunity Cost for Society Related to U.S. Truck Size and Weight Regulation: Freight Efficiency. Transp. Res. Rec. J. Transp. Res. Board 2016, 2547, 25–31. [Google Scholar] [CrossRef]
- C. C. Aggarwal, Data Mining, New York, New York: Springer International Publishing, 2015, p. 734.
- A. Burkov, The Hundred-Page Machine Learning Book, Quebec City: Andriy Burkov, 2019.
- Khan, A.; Ali, A.; Khan, J.; Ullah, F.; Faheem, M. Using Permutation-Based Feature Importance for Improved Machine Learning Model Performance at Reduced Costs. IEEE Access 2025, 13, 36421–36435. [Google Scholar] [CrossRef]
Figure 1.
The workflow to develop and evaluate the bridge risk index.
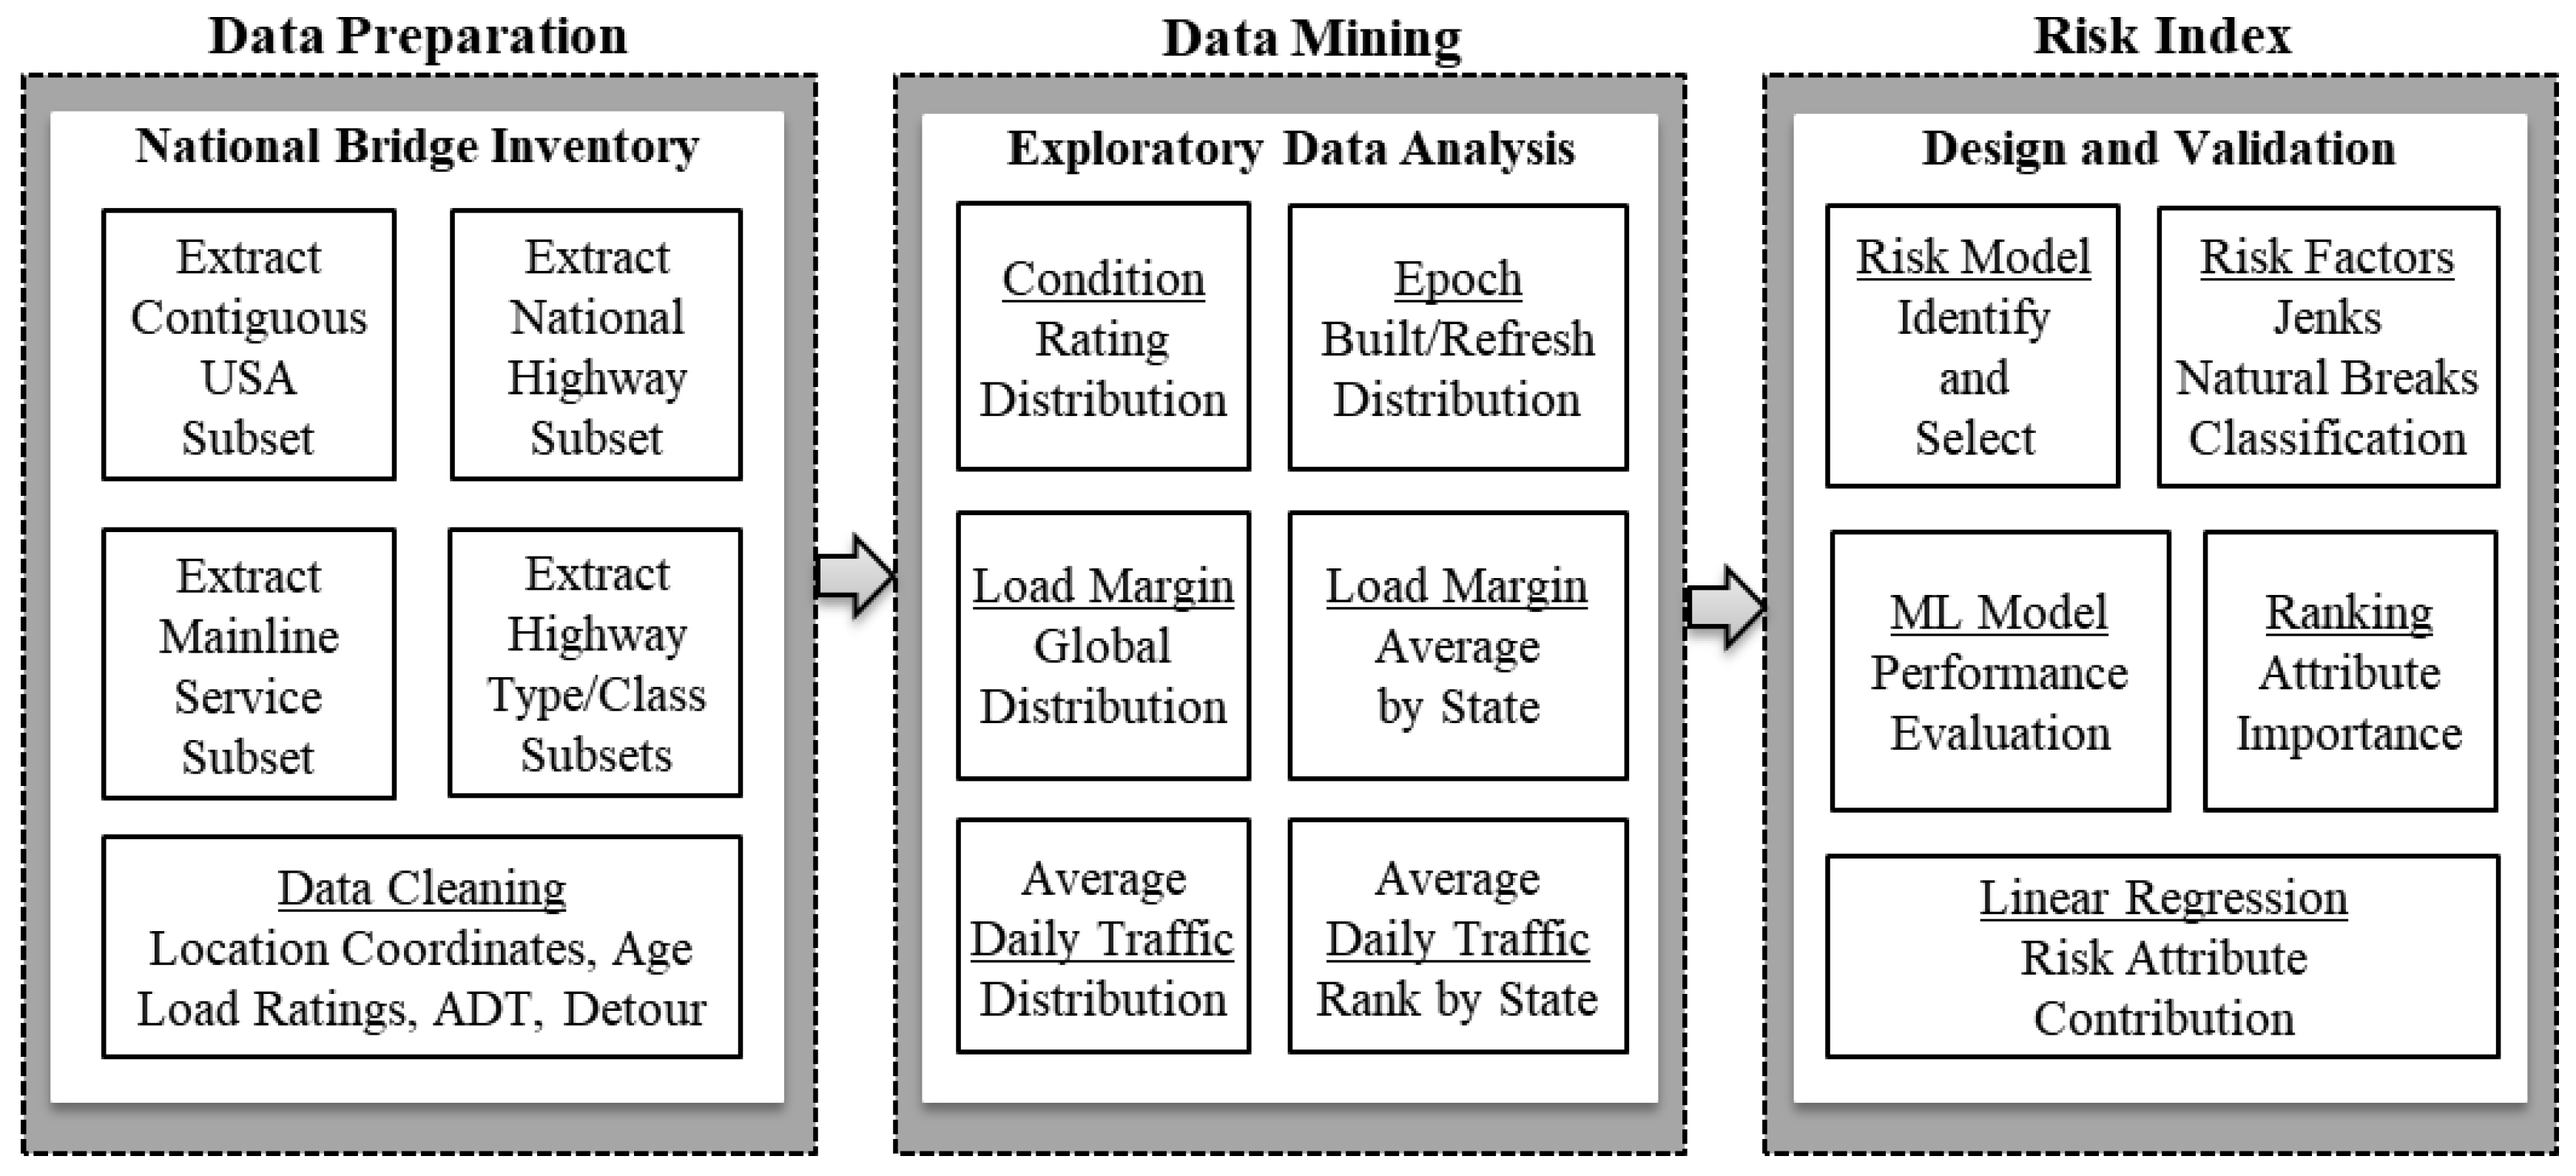
Figure 2.
Lowest condition rating for the cleaned sample of bridges on the NHS.
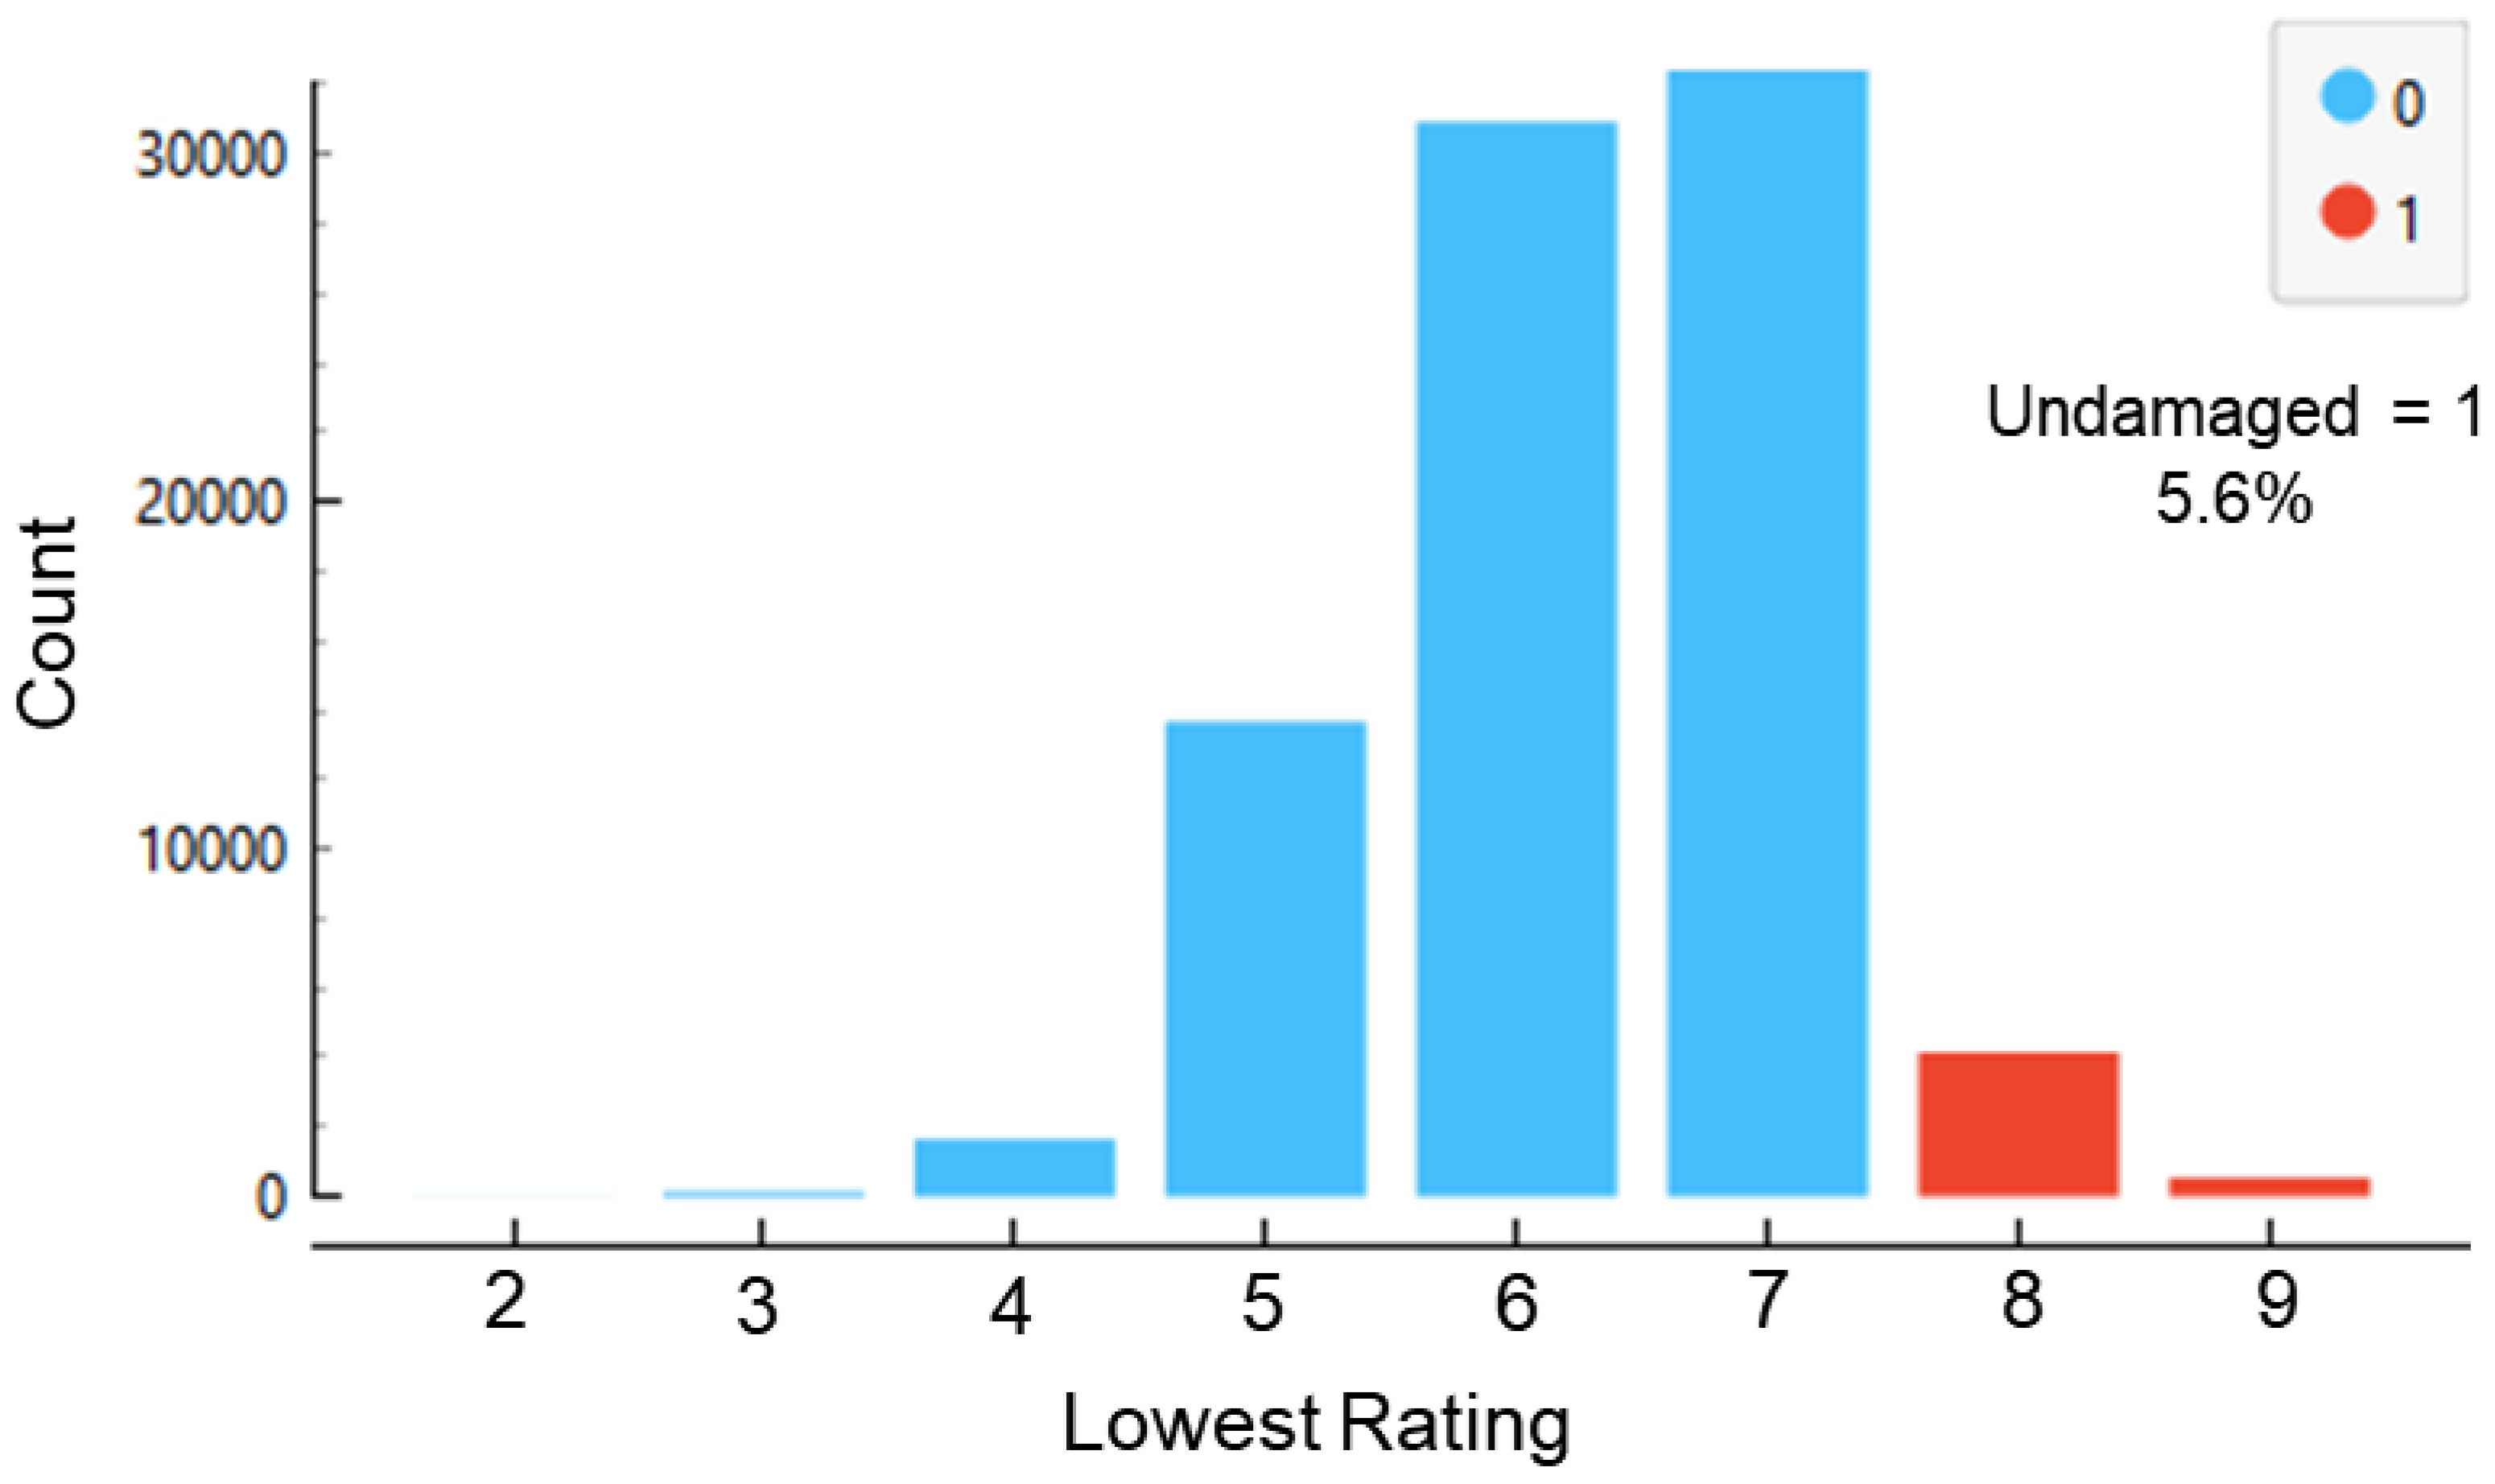
Figure 3.
Distribution of bridge age, accounting for the most recent reconstruction or improvement.
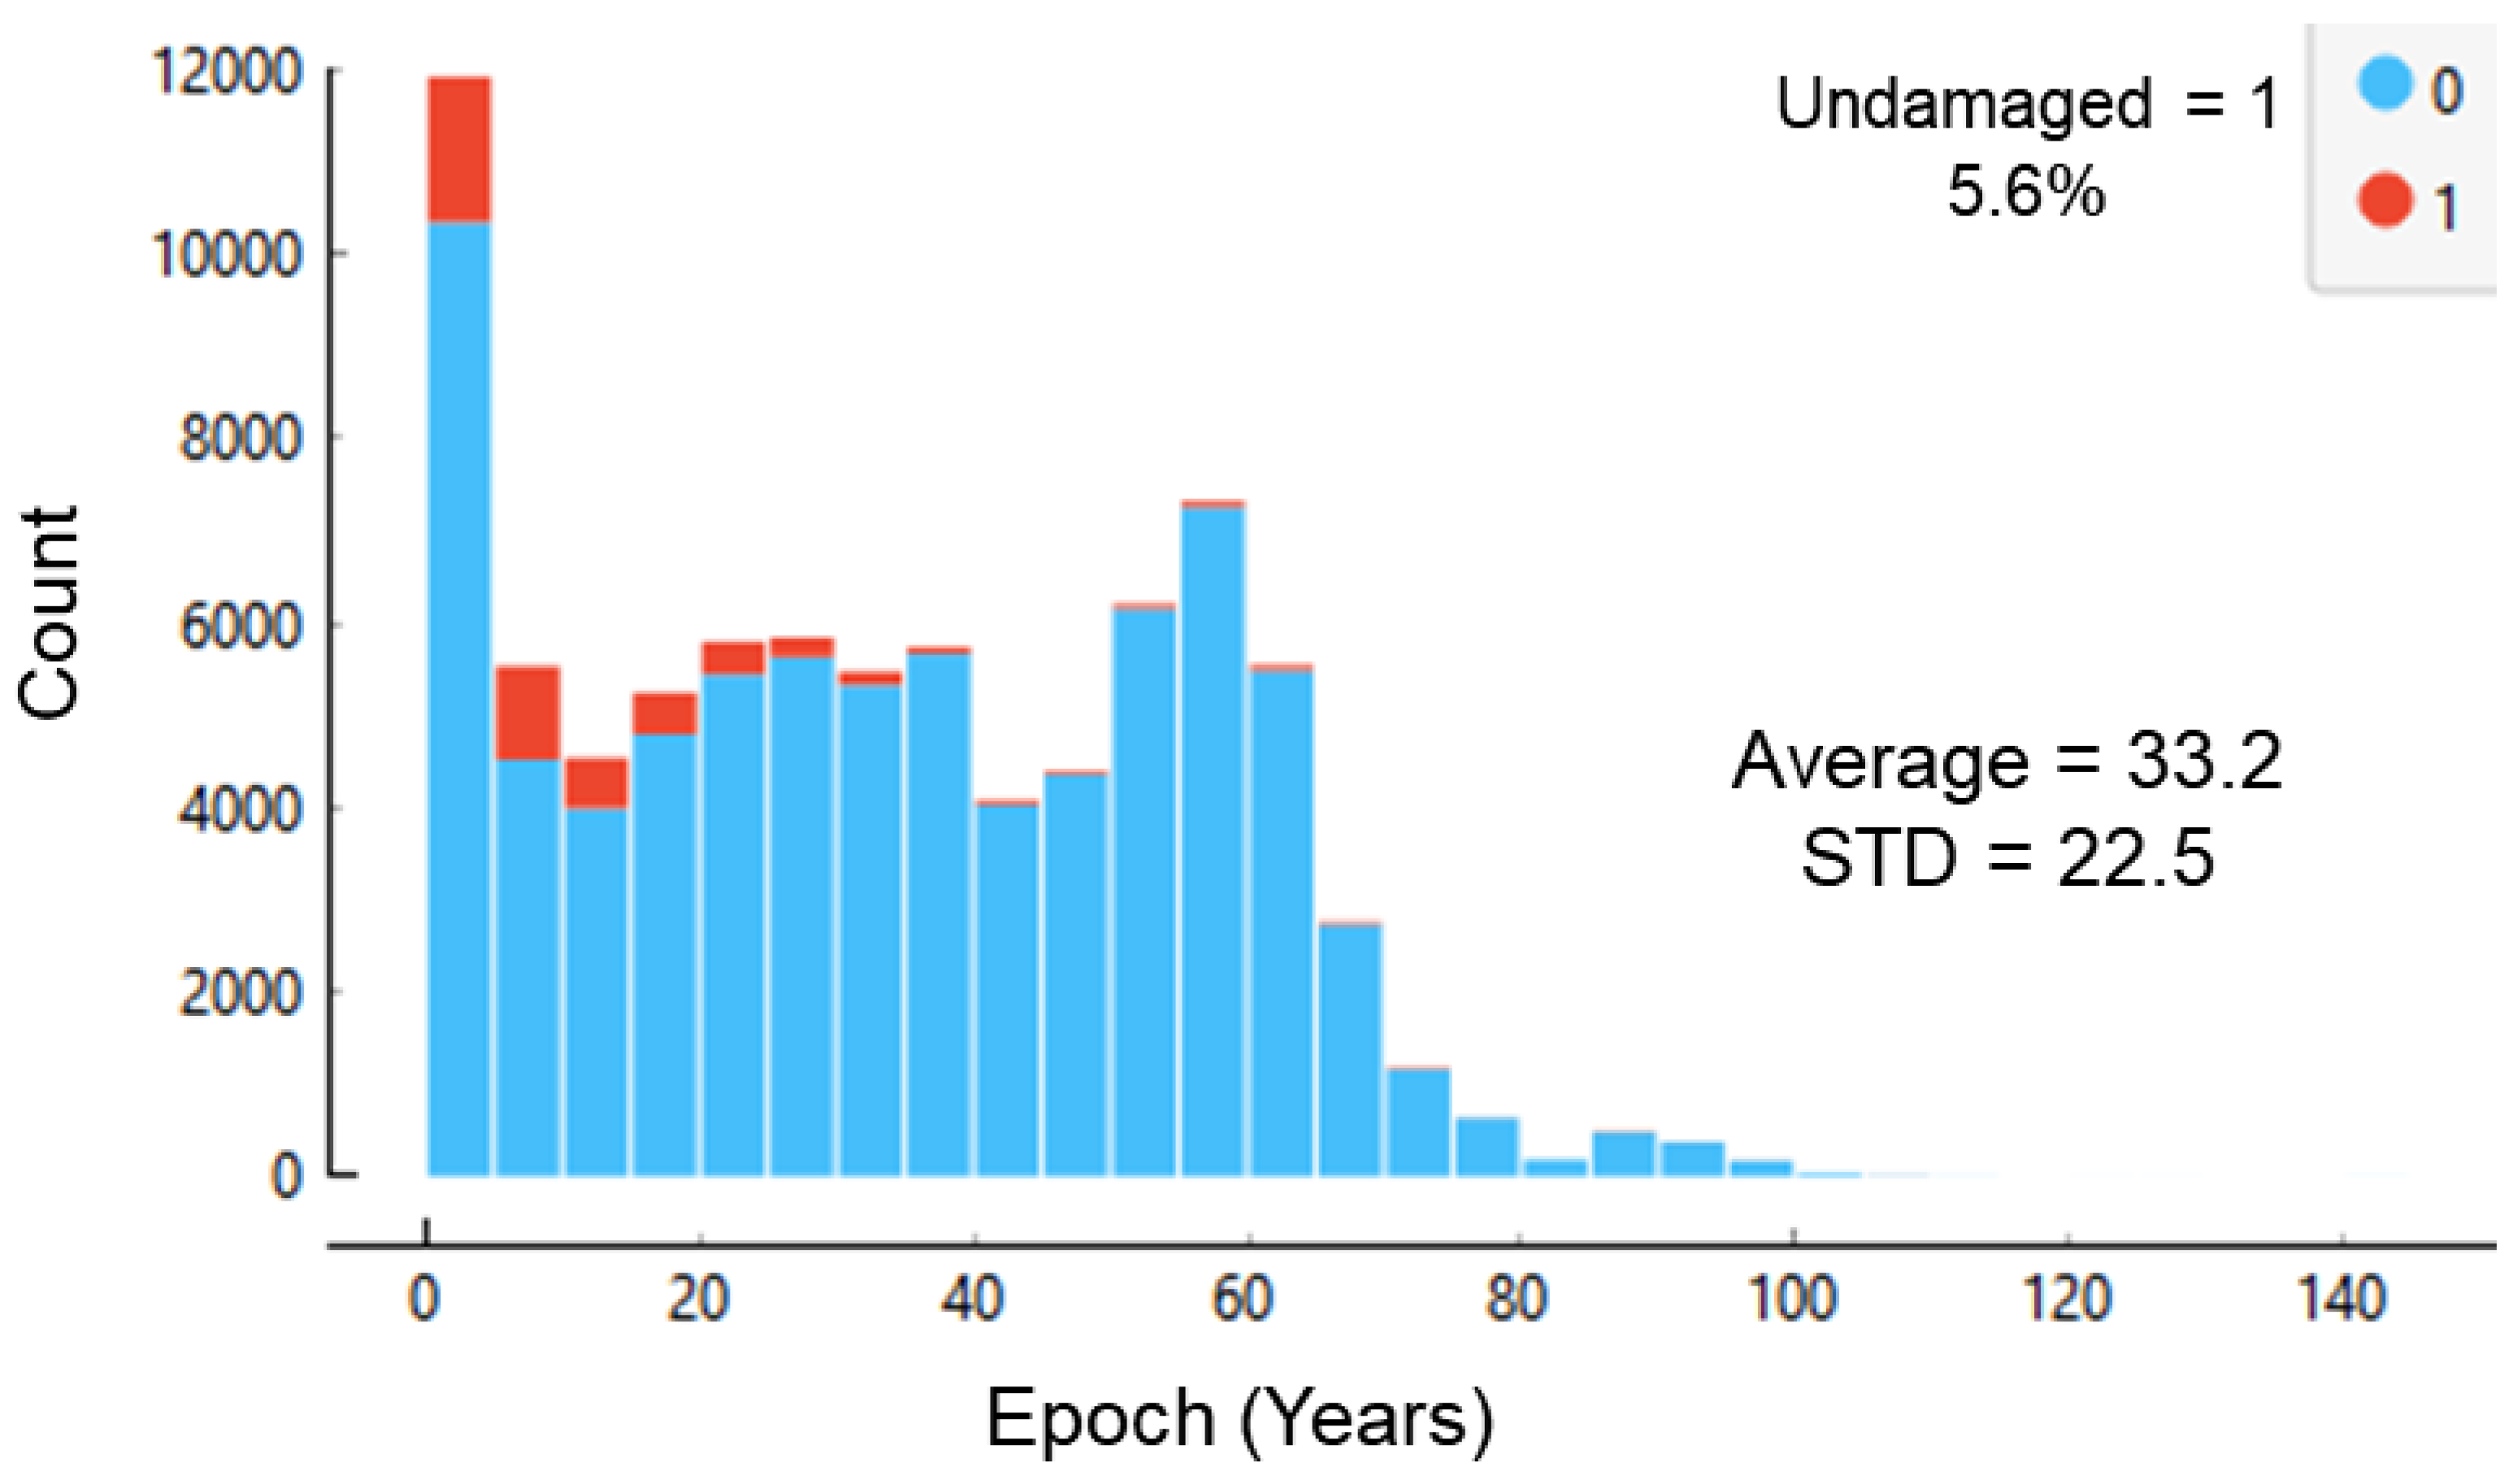
Figure 4.
Distribution of the load margin.
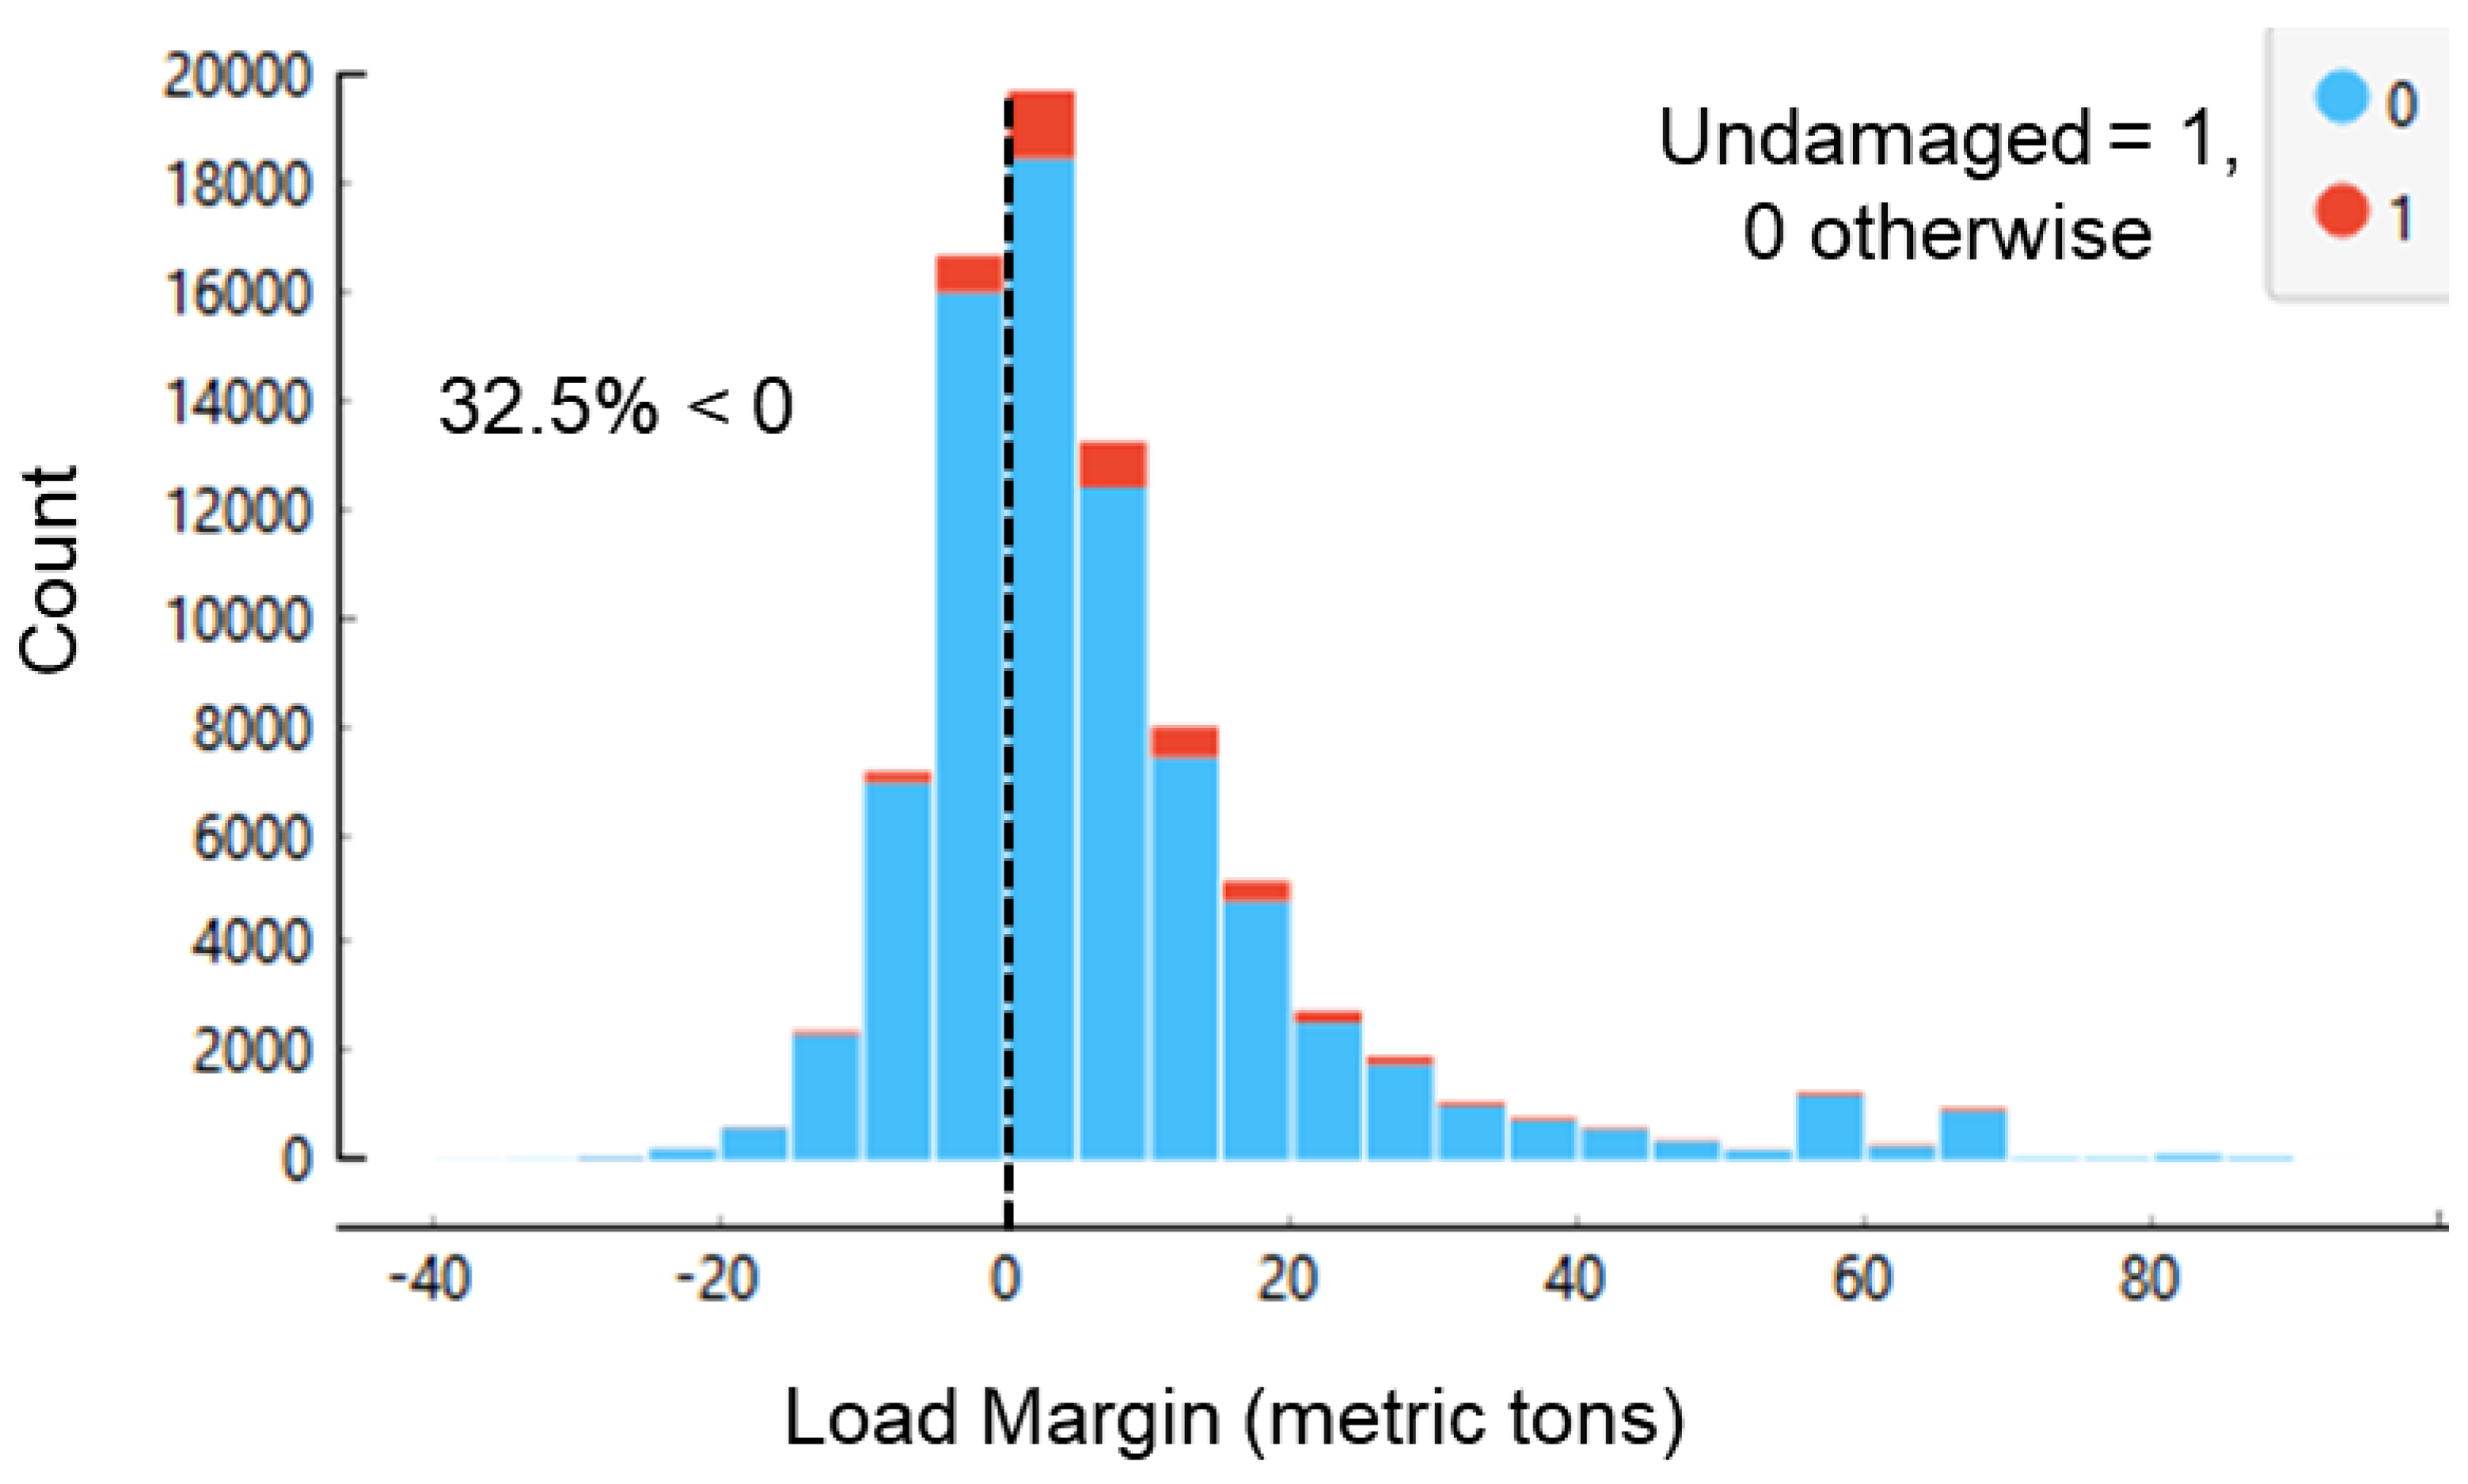
Figure 5.
Rank of states by the percentage of state bridges rated below their design load.
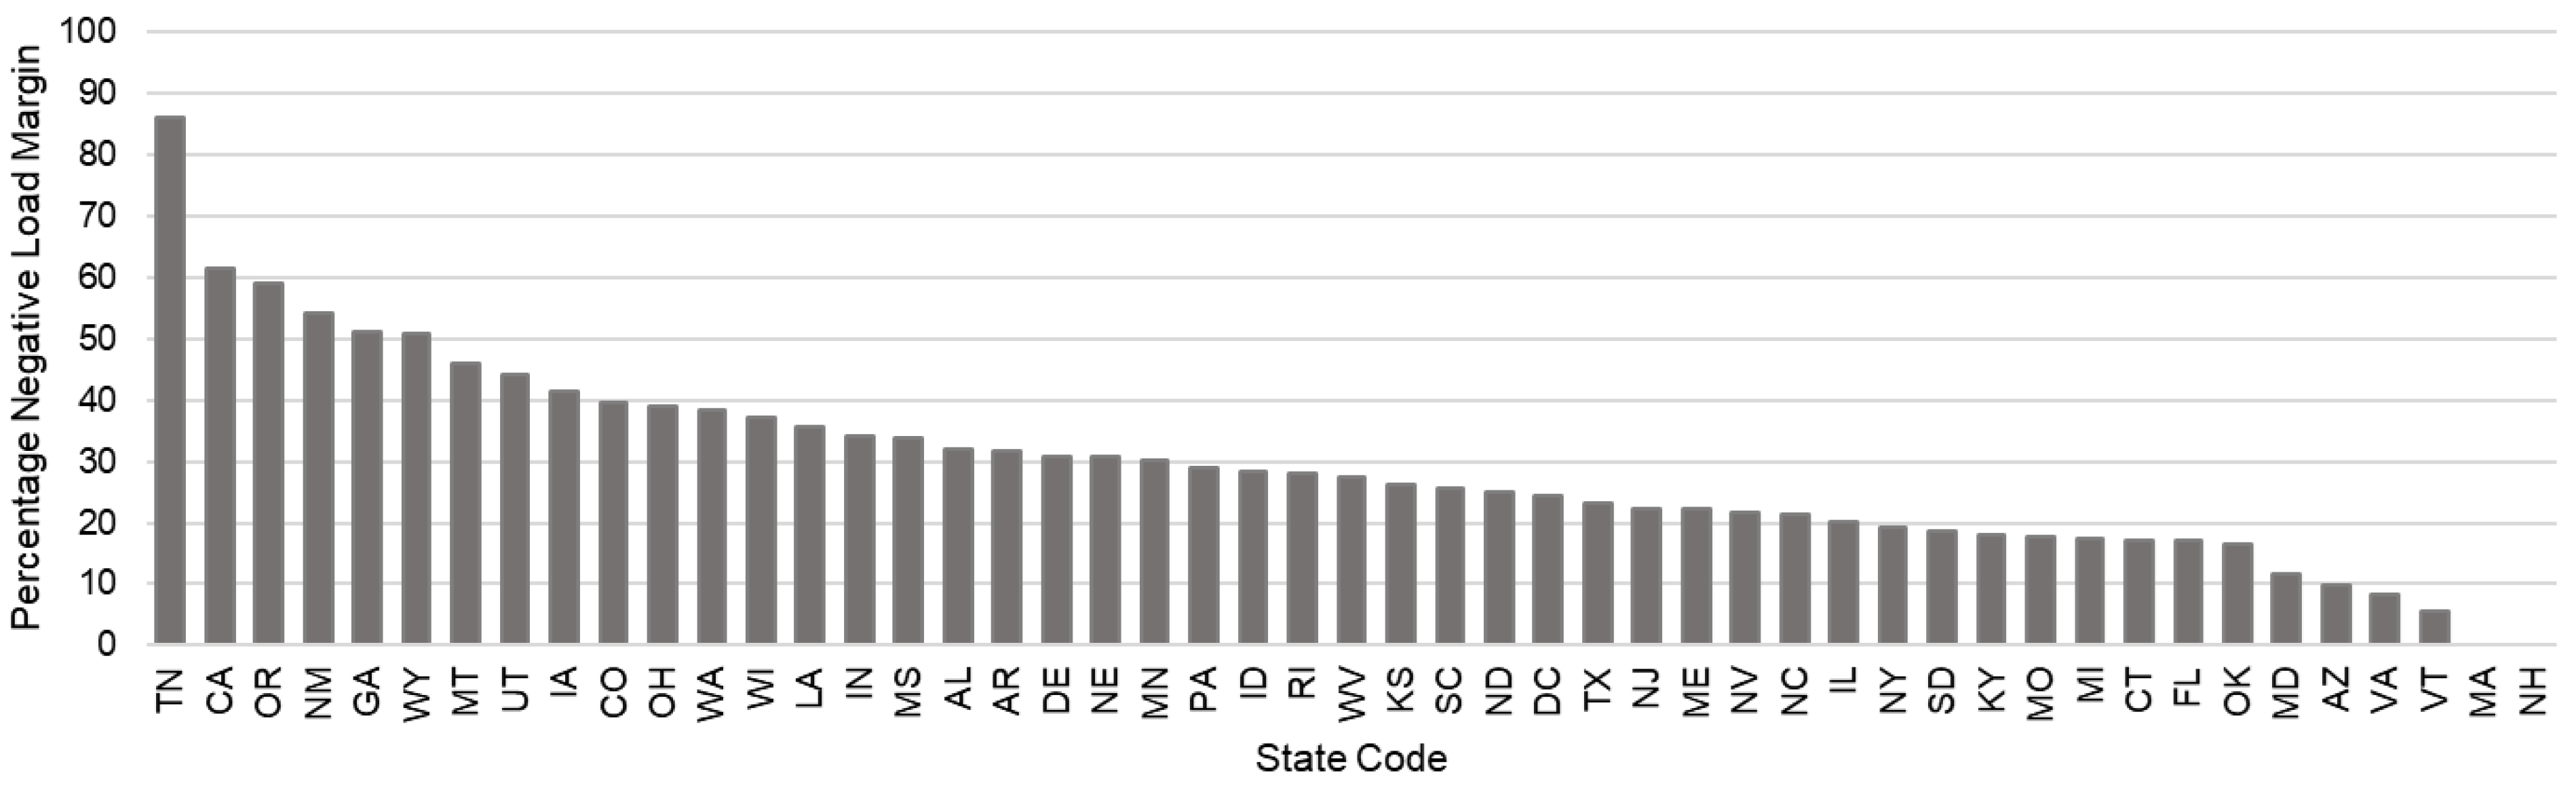
Figure 6.
Choropleth state map of the percentage of state bridges rated below their design load.
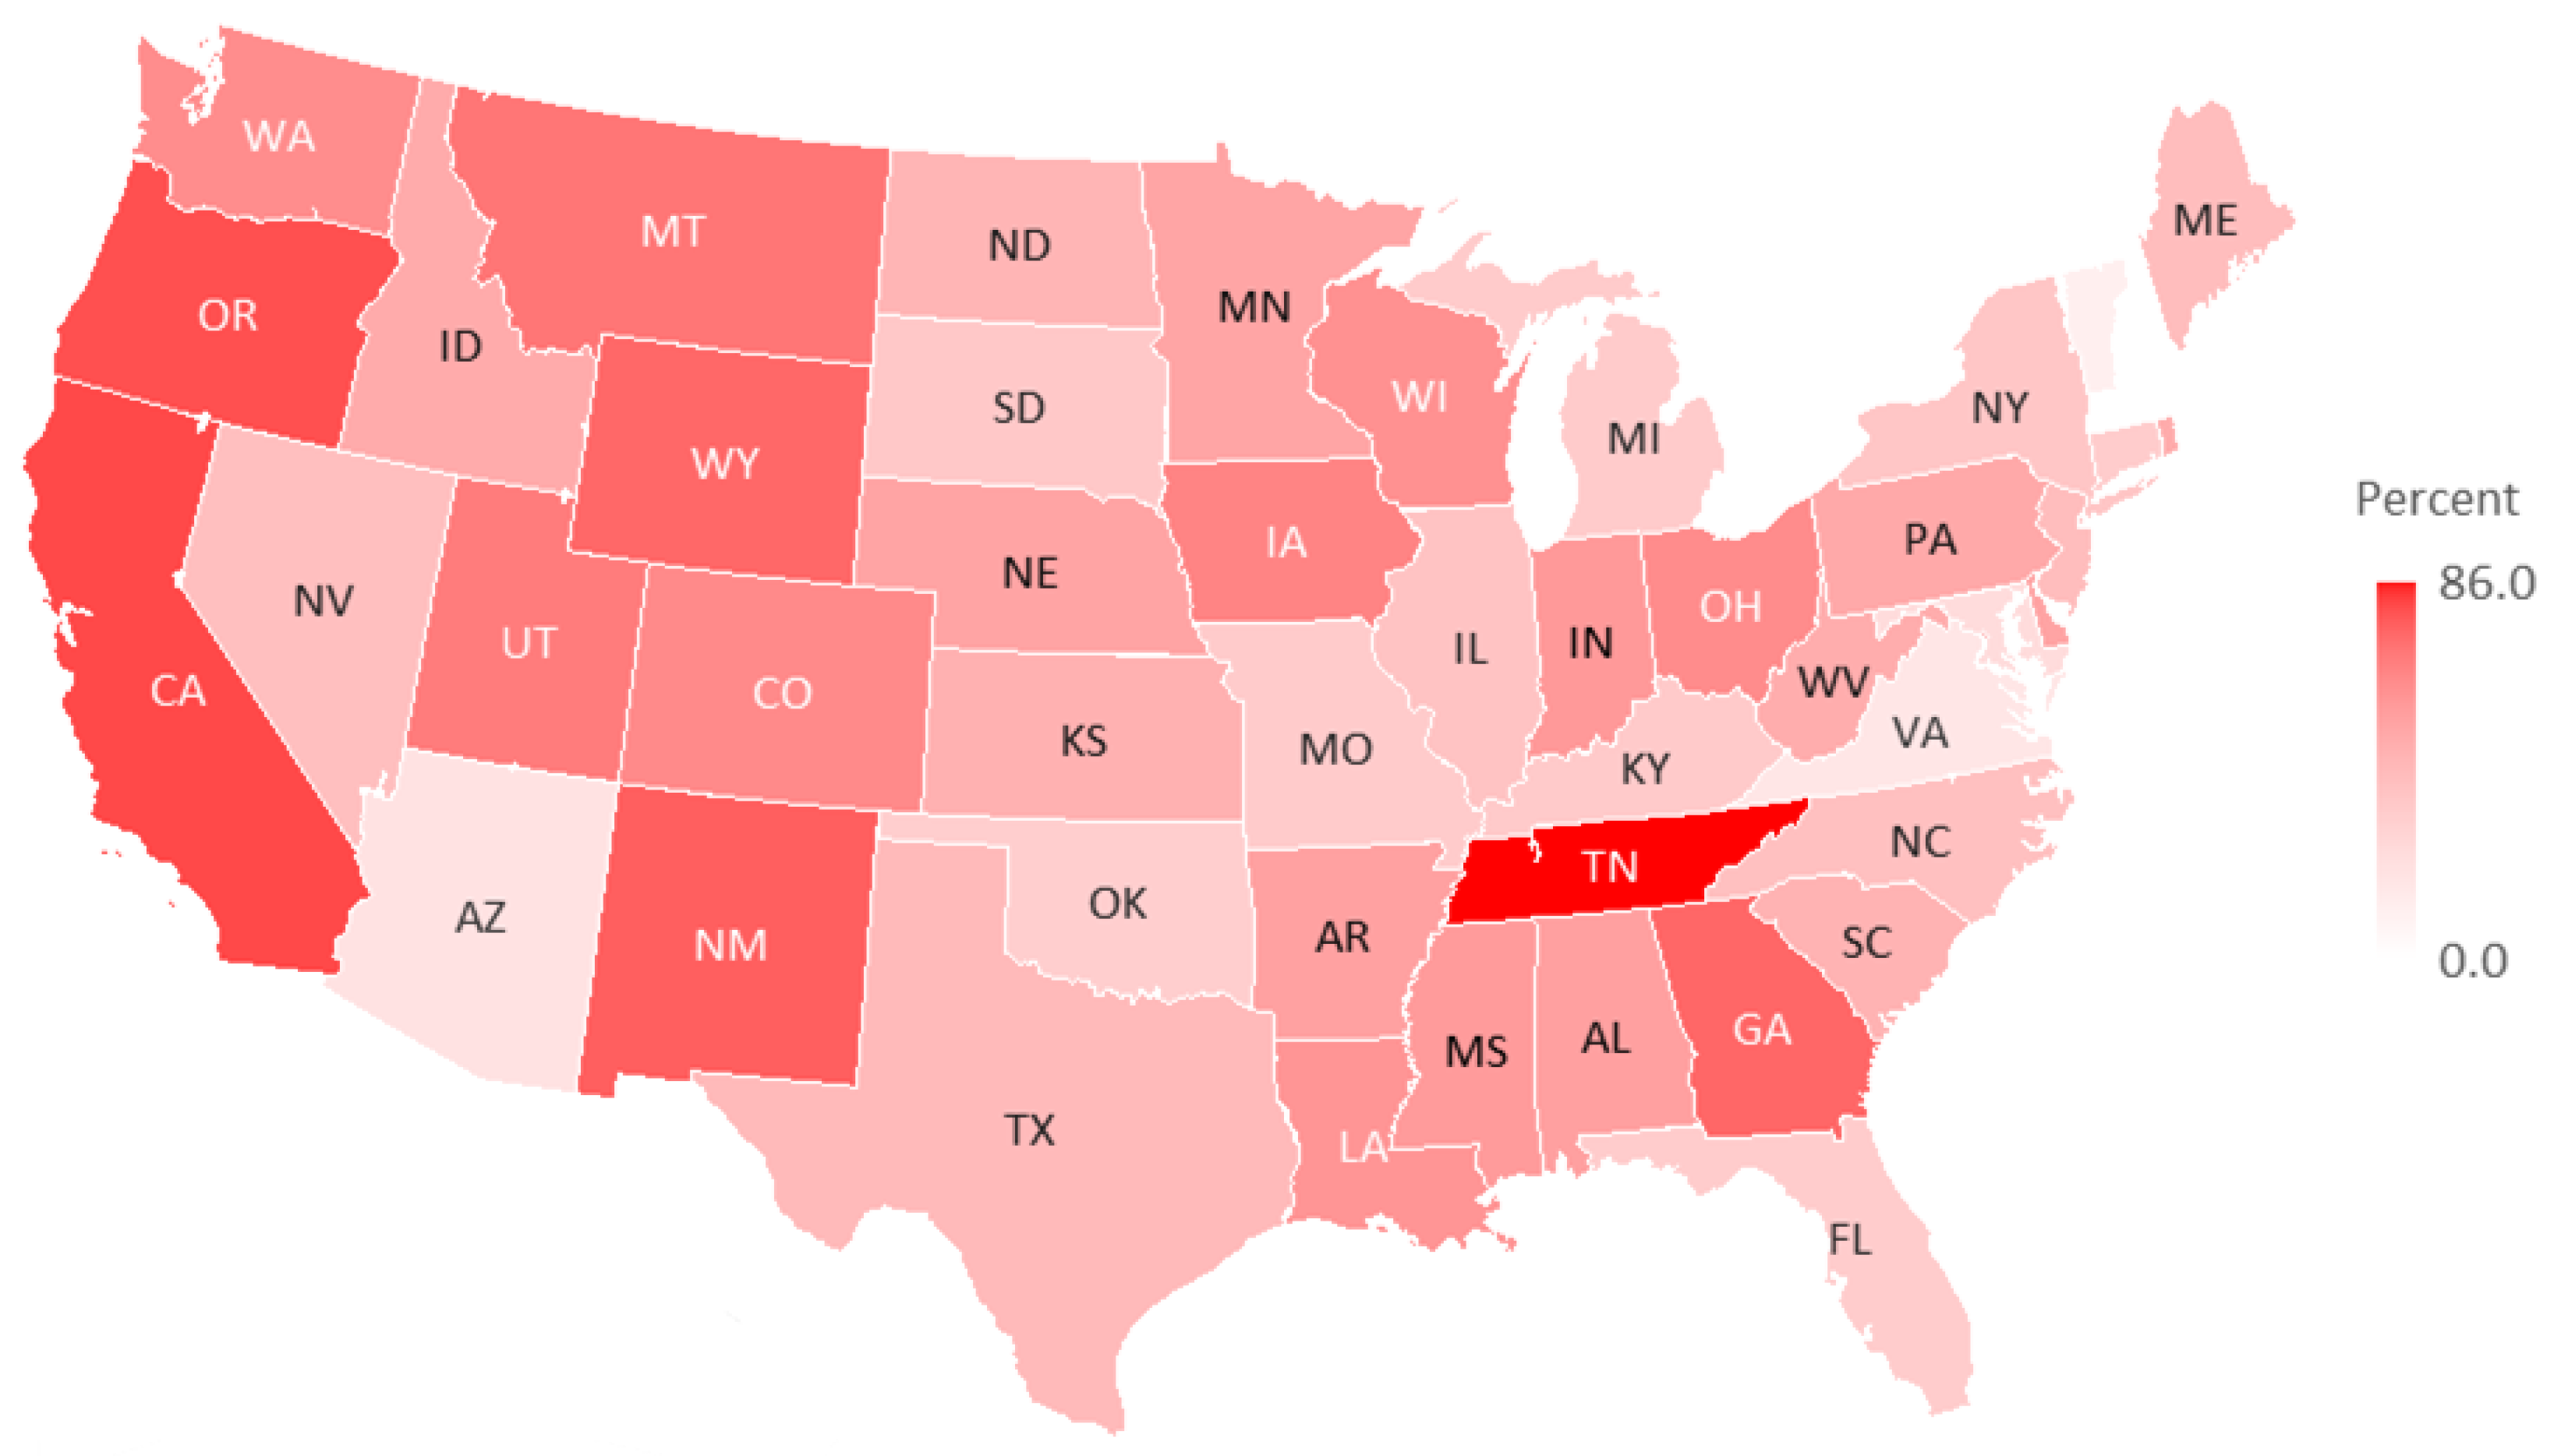
Figure 7.
Rank of states by the average load margin of their bridges.
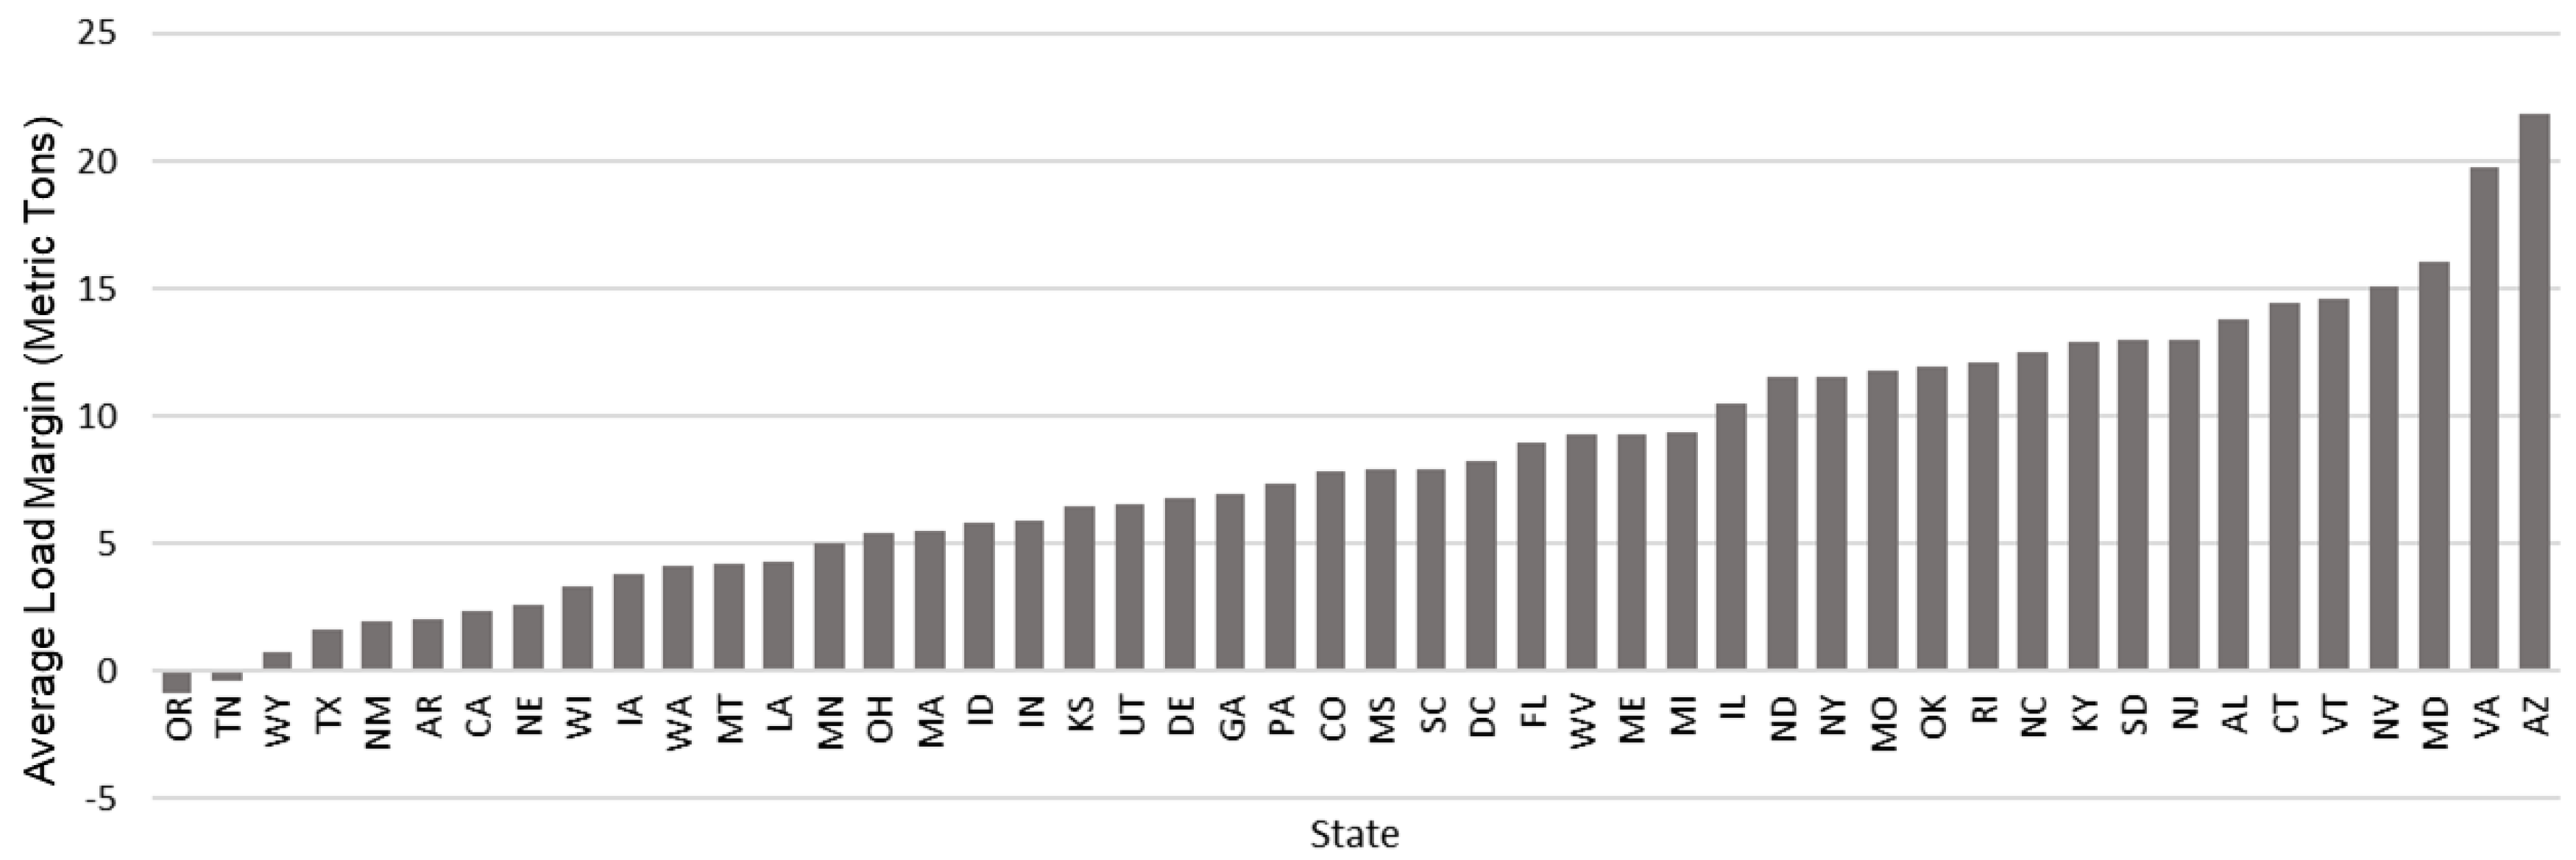
Figure 8.
Choropleth state map of the average load margin (metric tons) of their bridges.
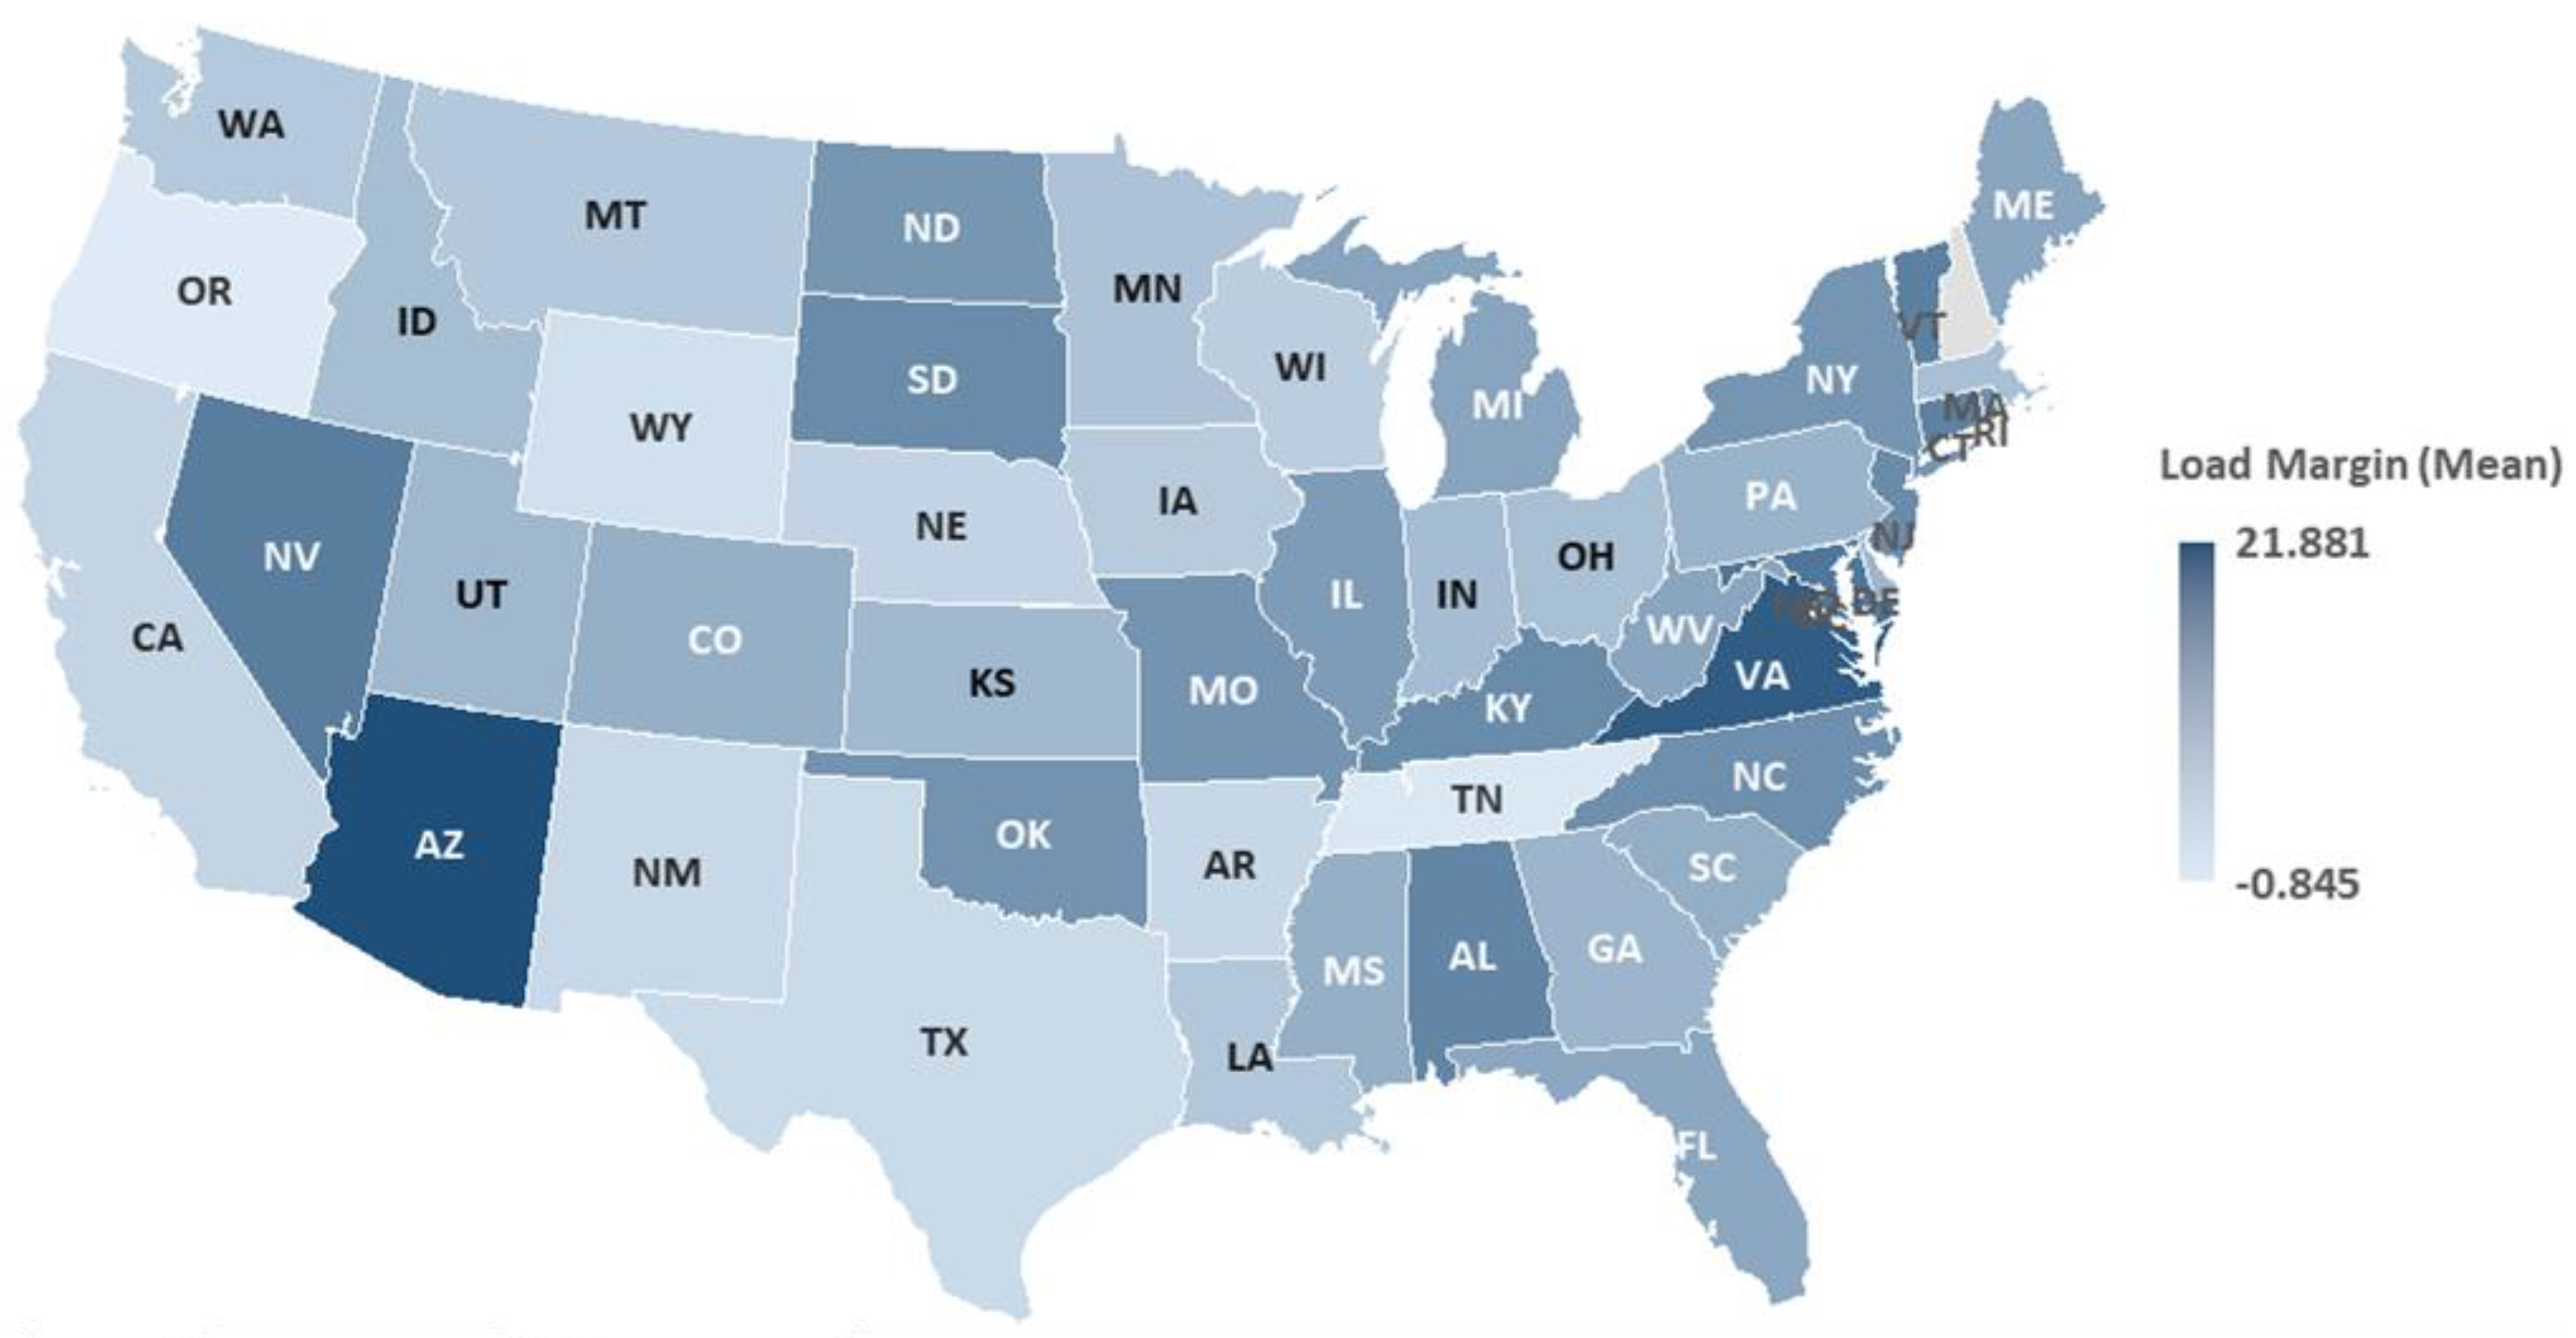
Figure 9.
Distribution of a) the per lane ADT, and b) log transformed ADT/lane for bridges on the NHS.
Figure 9.
Distribution of a) the per lane ADT, and b) log transformed ADT/lane for bridges on the NHS.
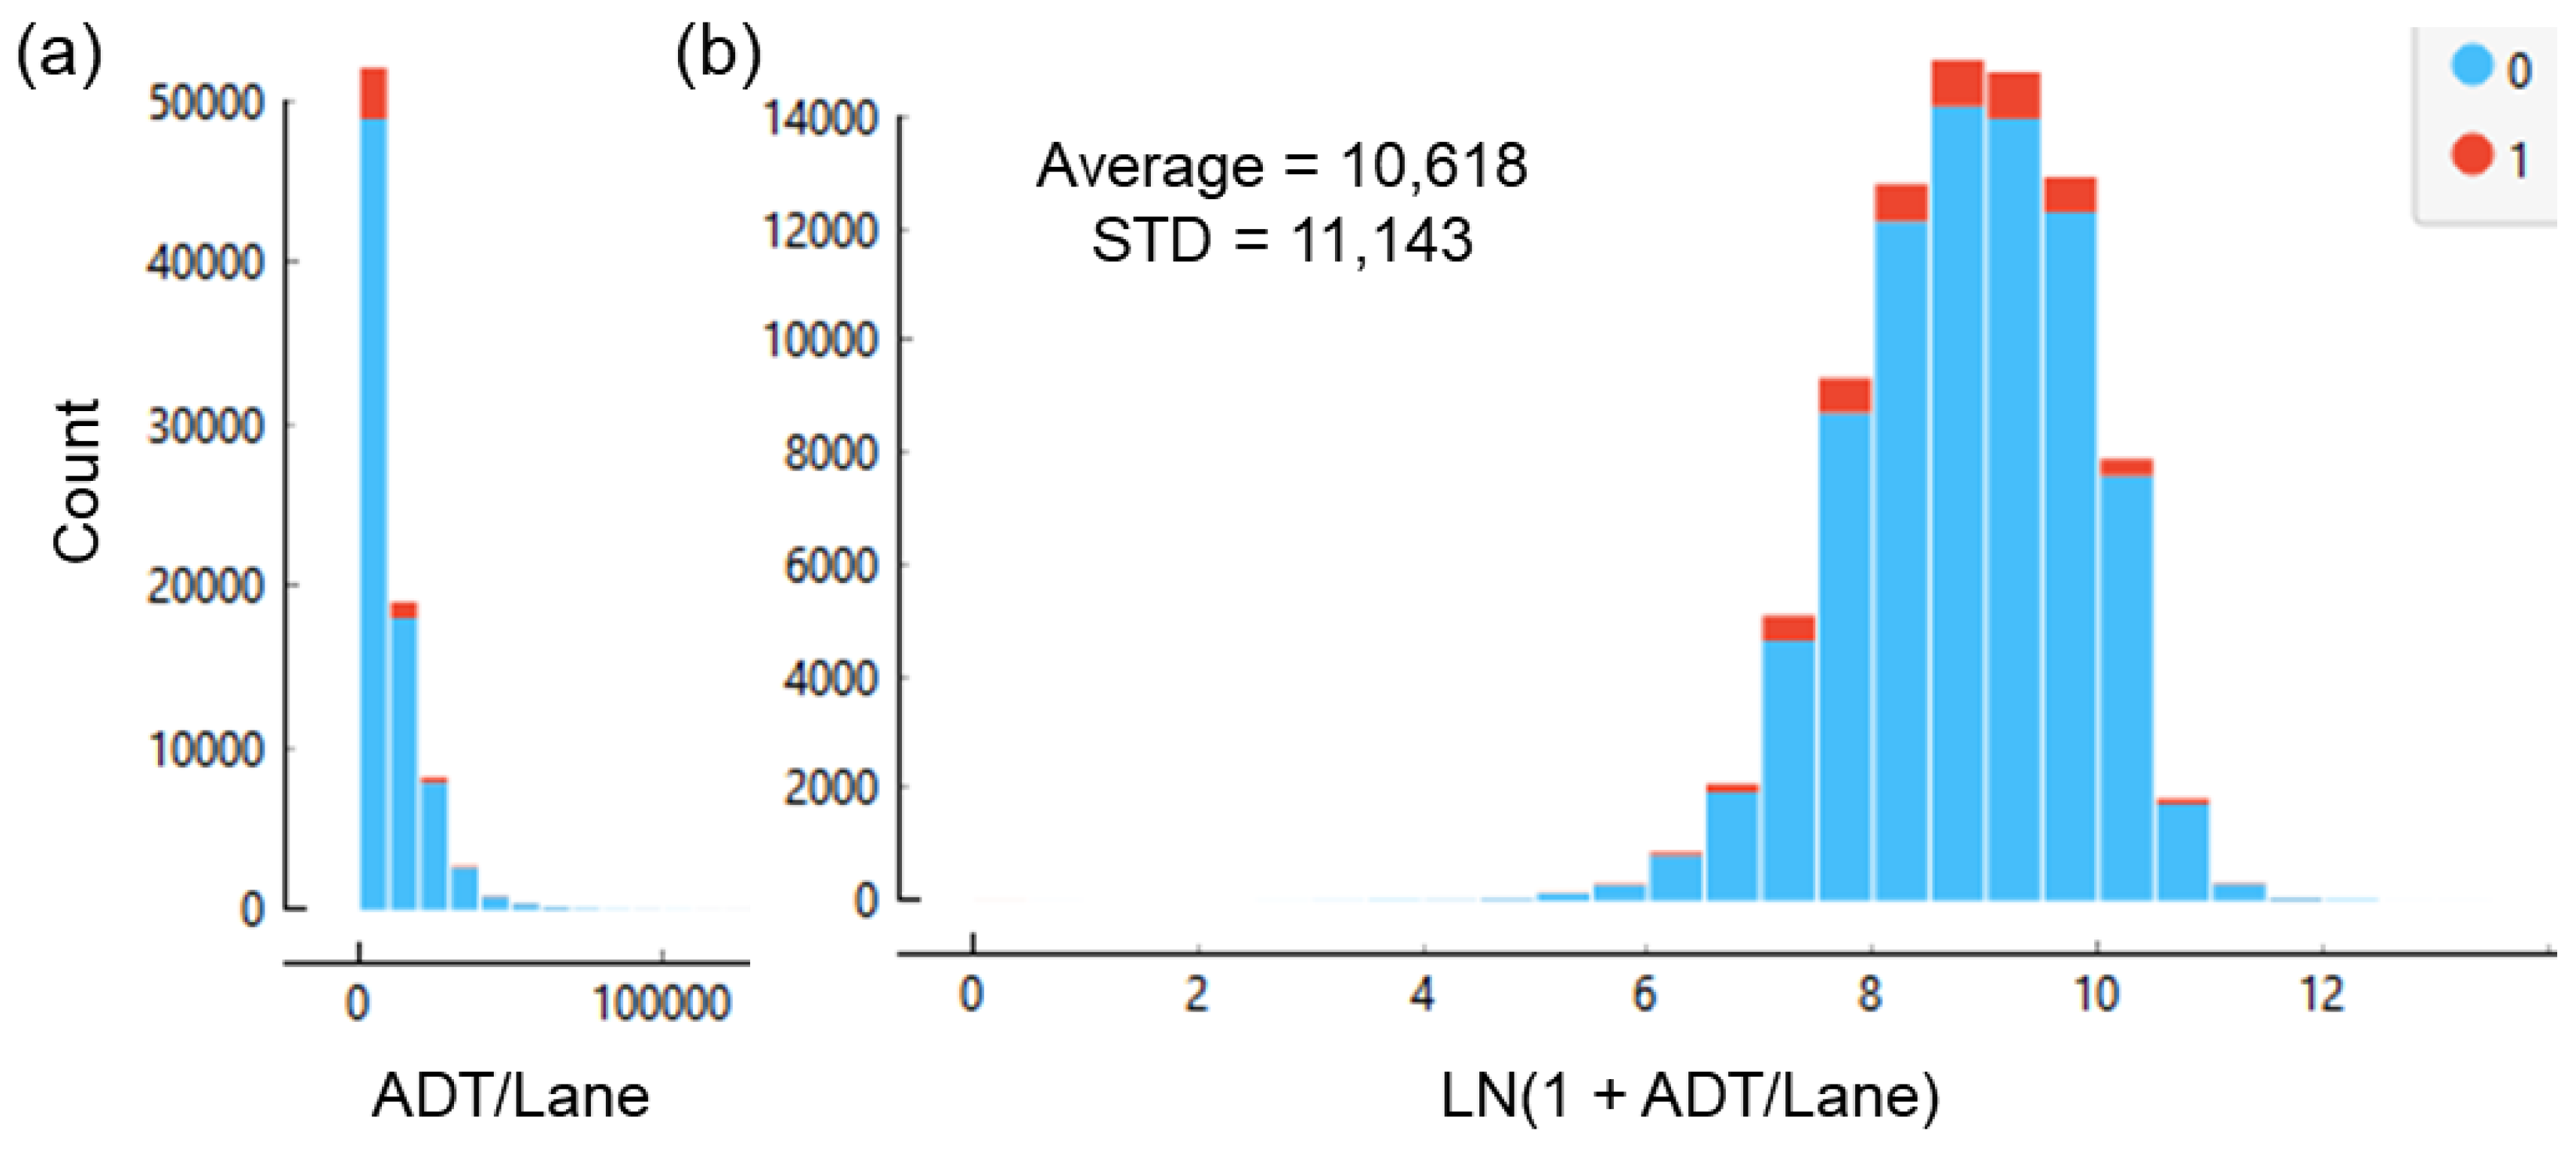
Figure 10.
Rank of the average ADT/lane on interstate bridges in a state.
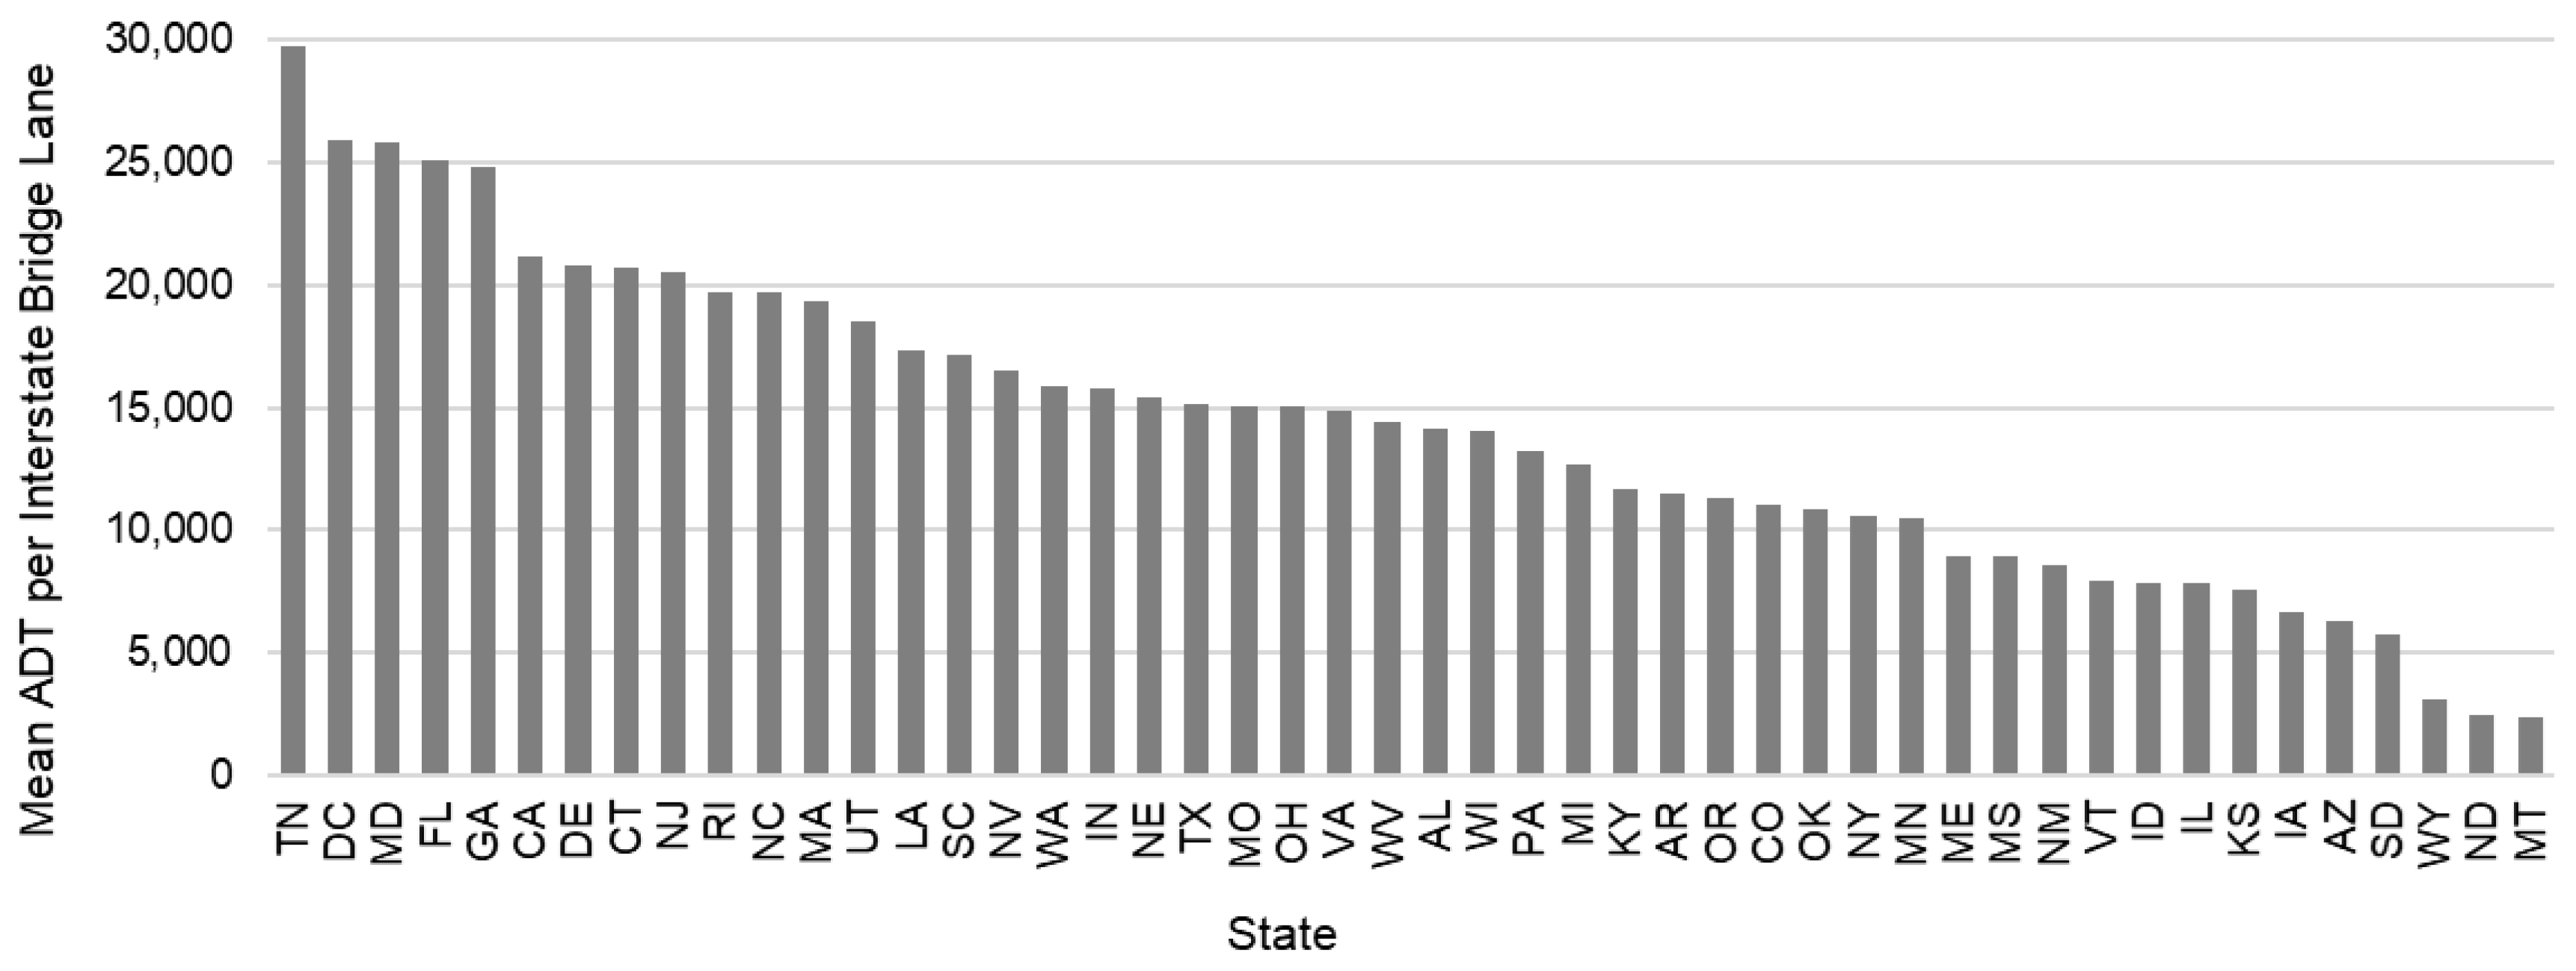
Figure 11.
Choropleth state map of the average per lane ADT on interstate bridges.
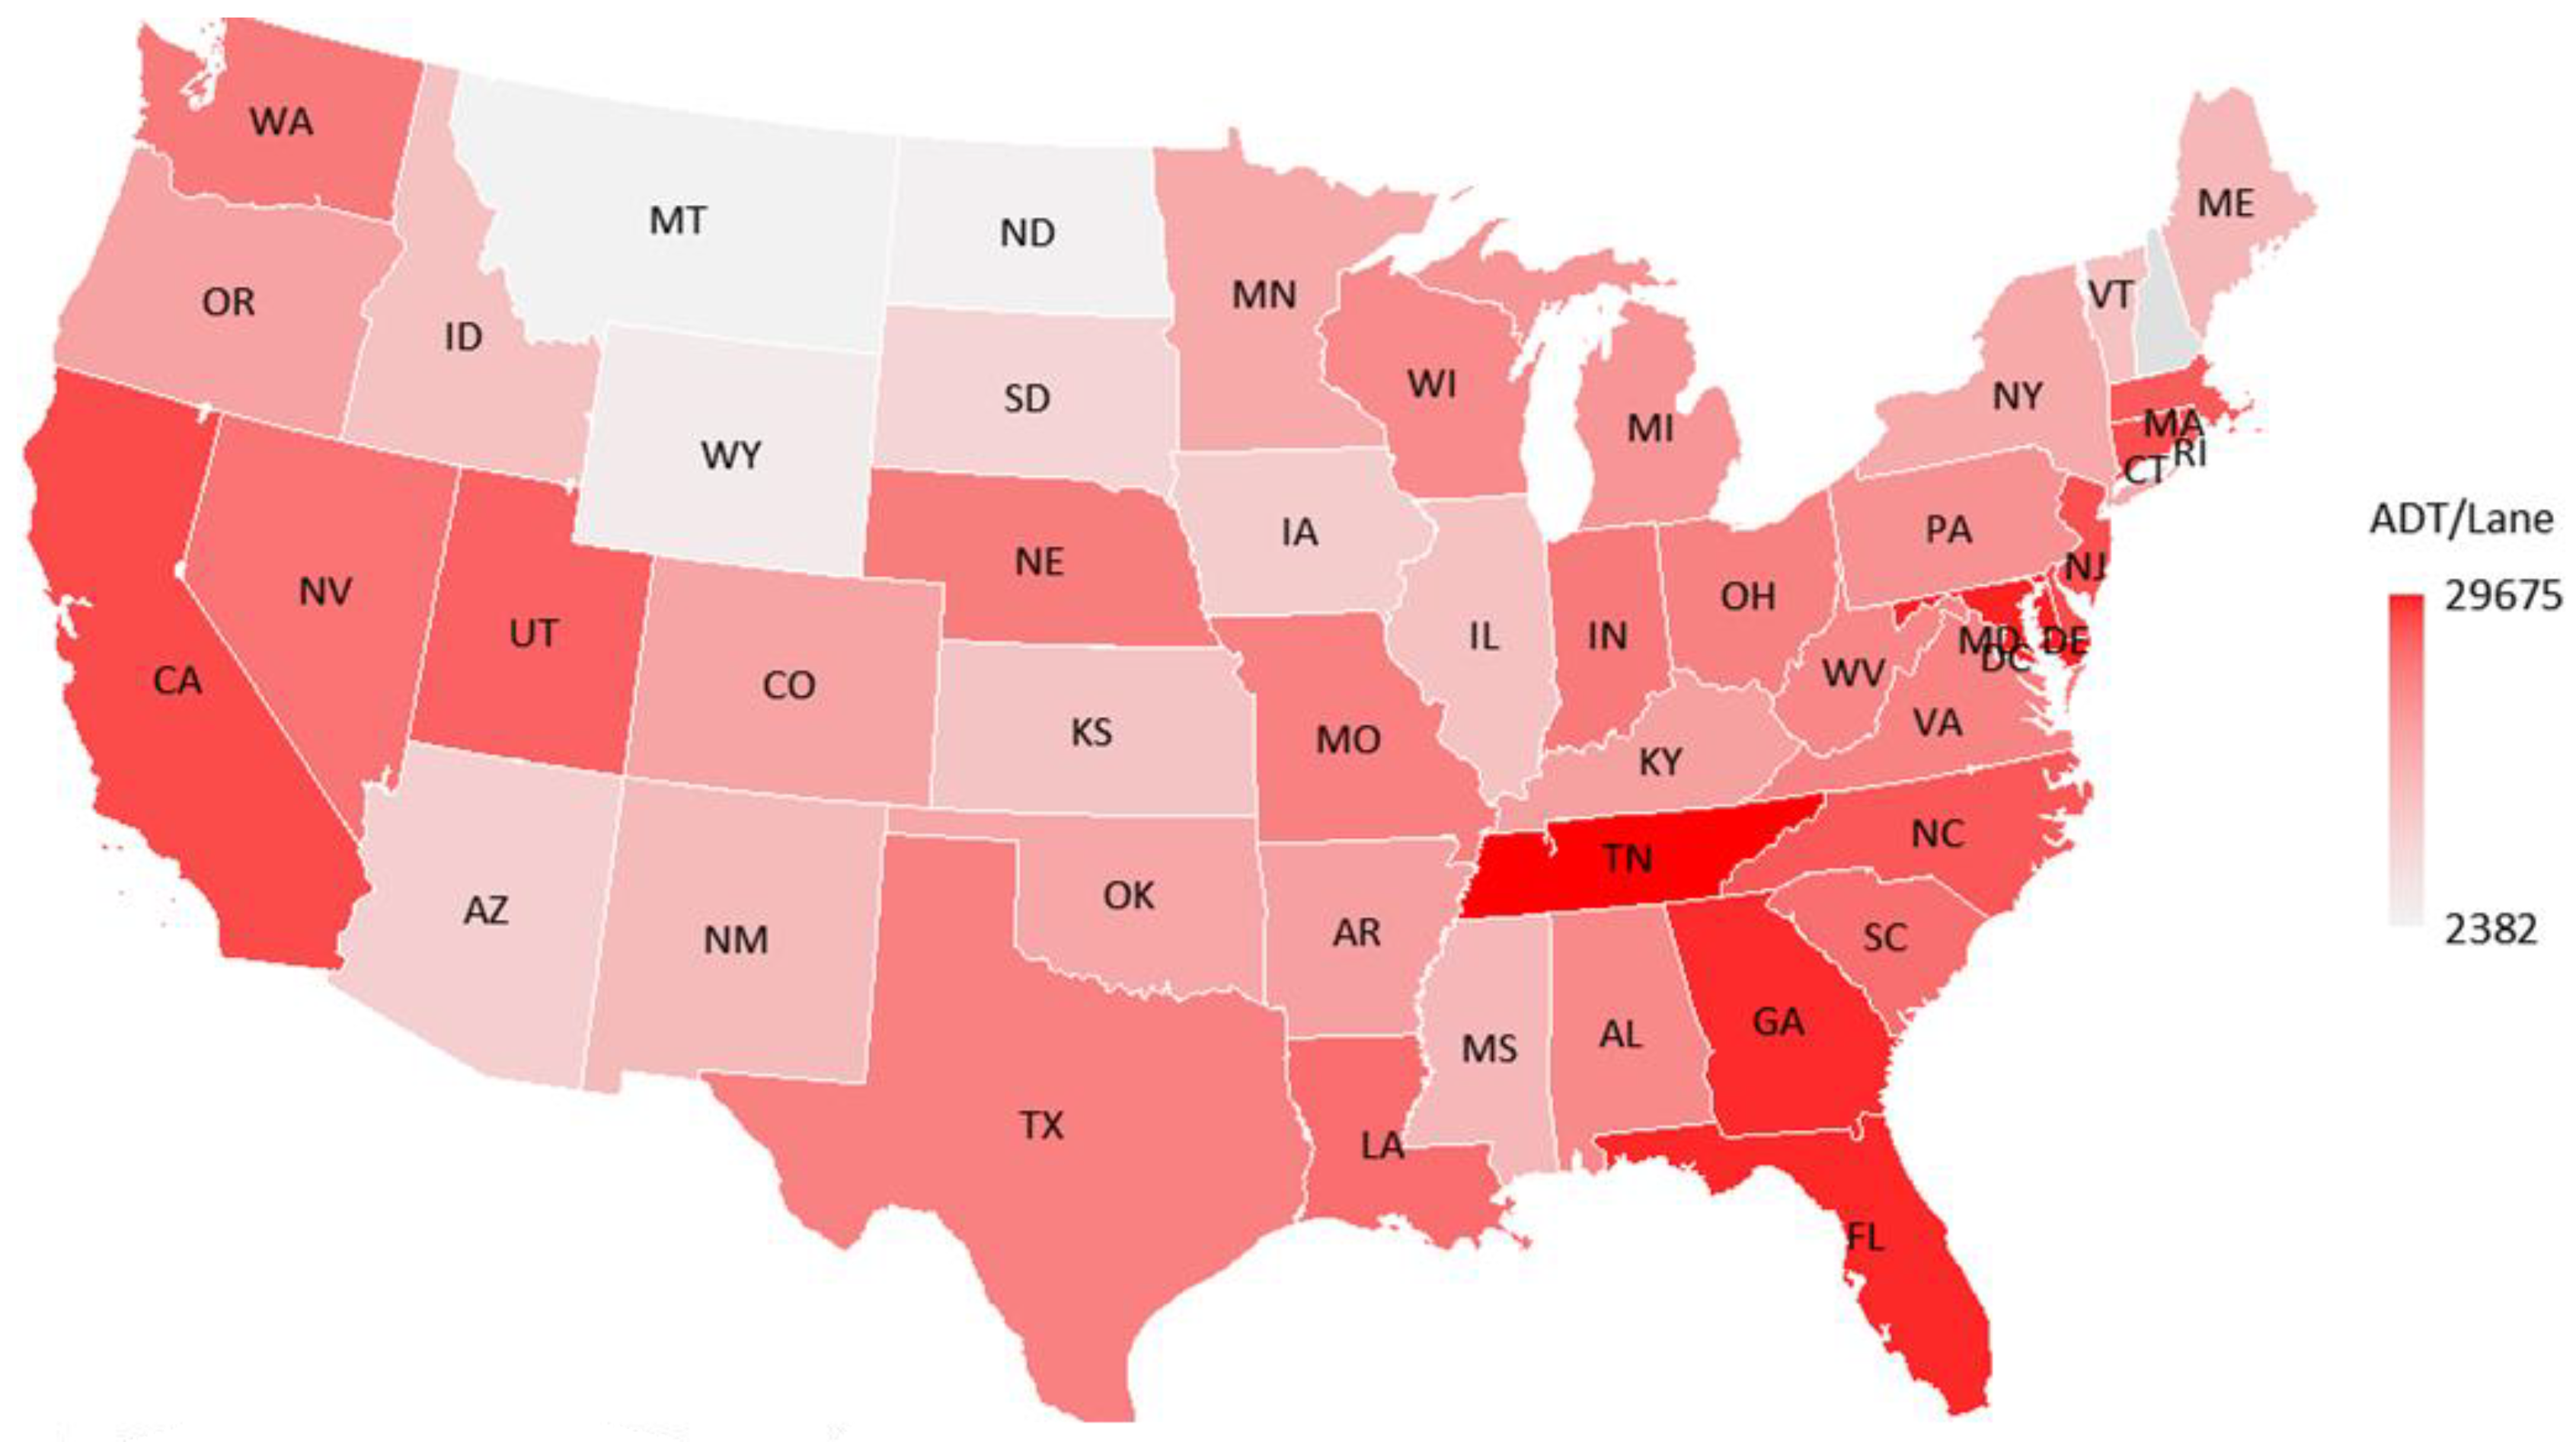
Figure 12.
Distribution of a) the detour distance, and b) log transformed detour distance for bridges on the NHS.
Figure 12.
Distribution of a) the detour distance, and b) log transformed detour distance for bridges on the NHS.
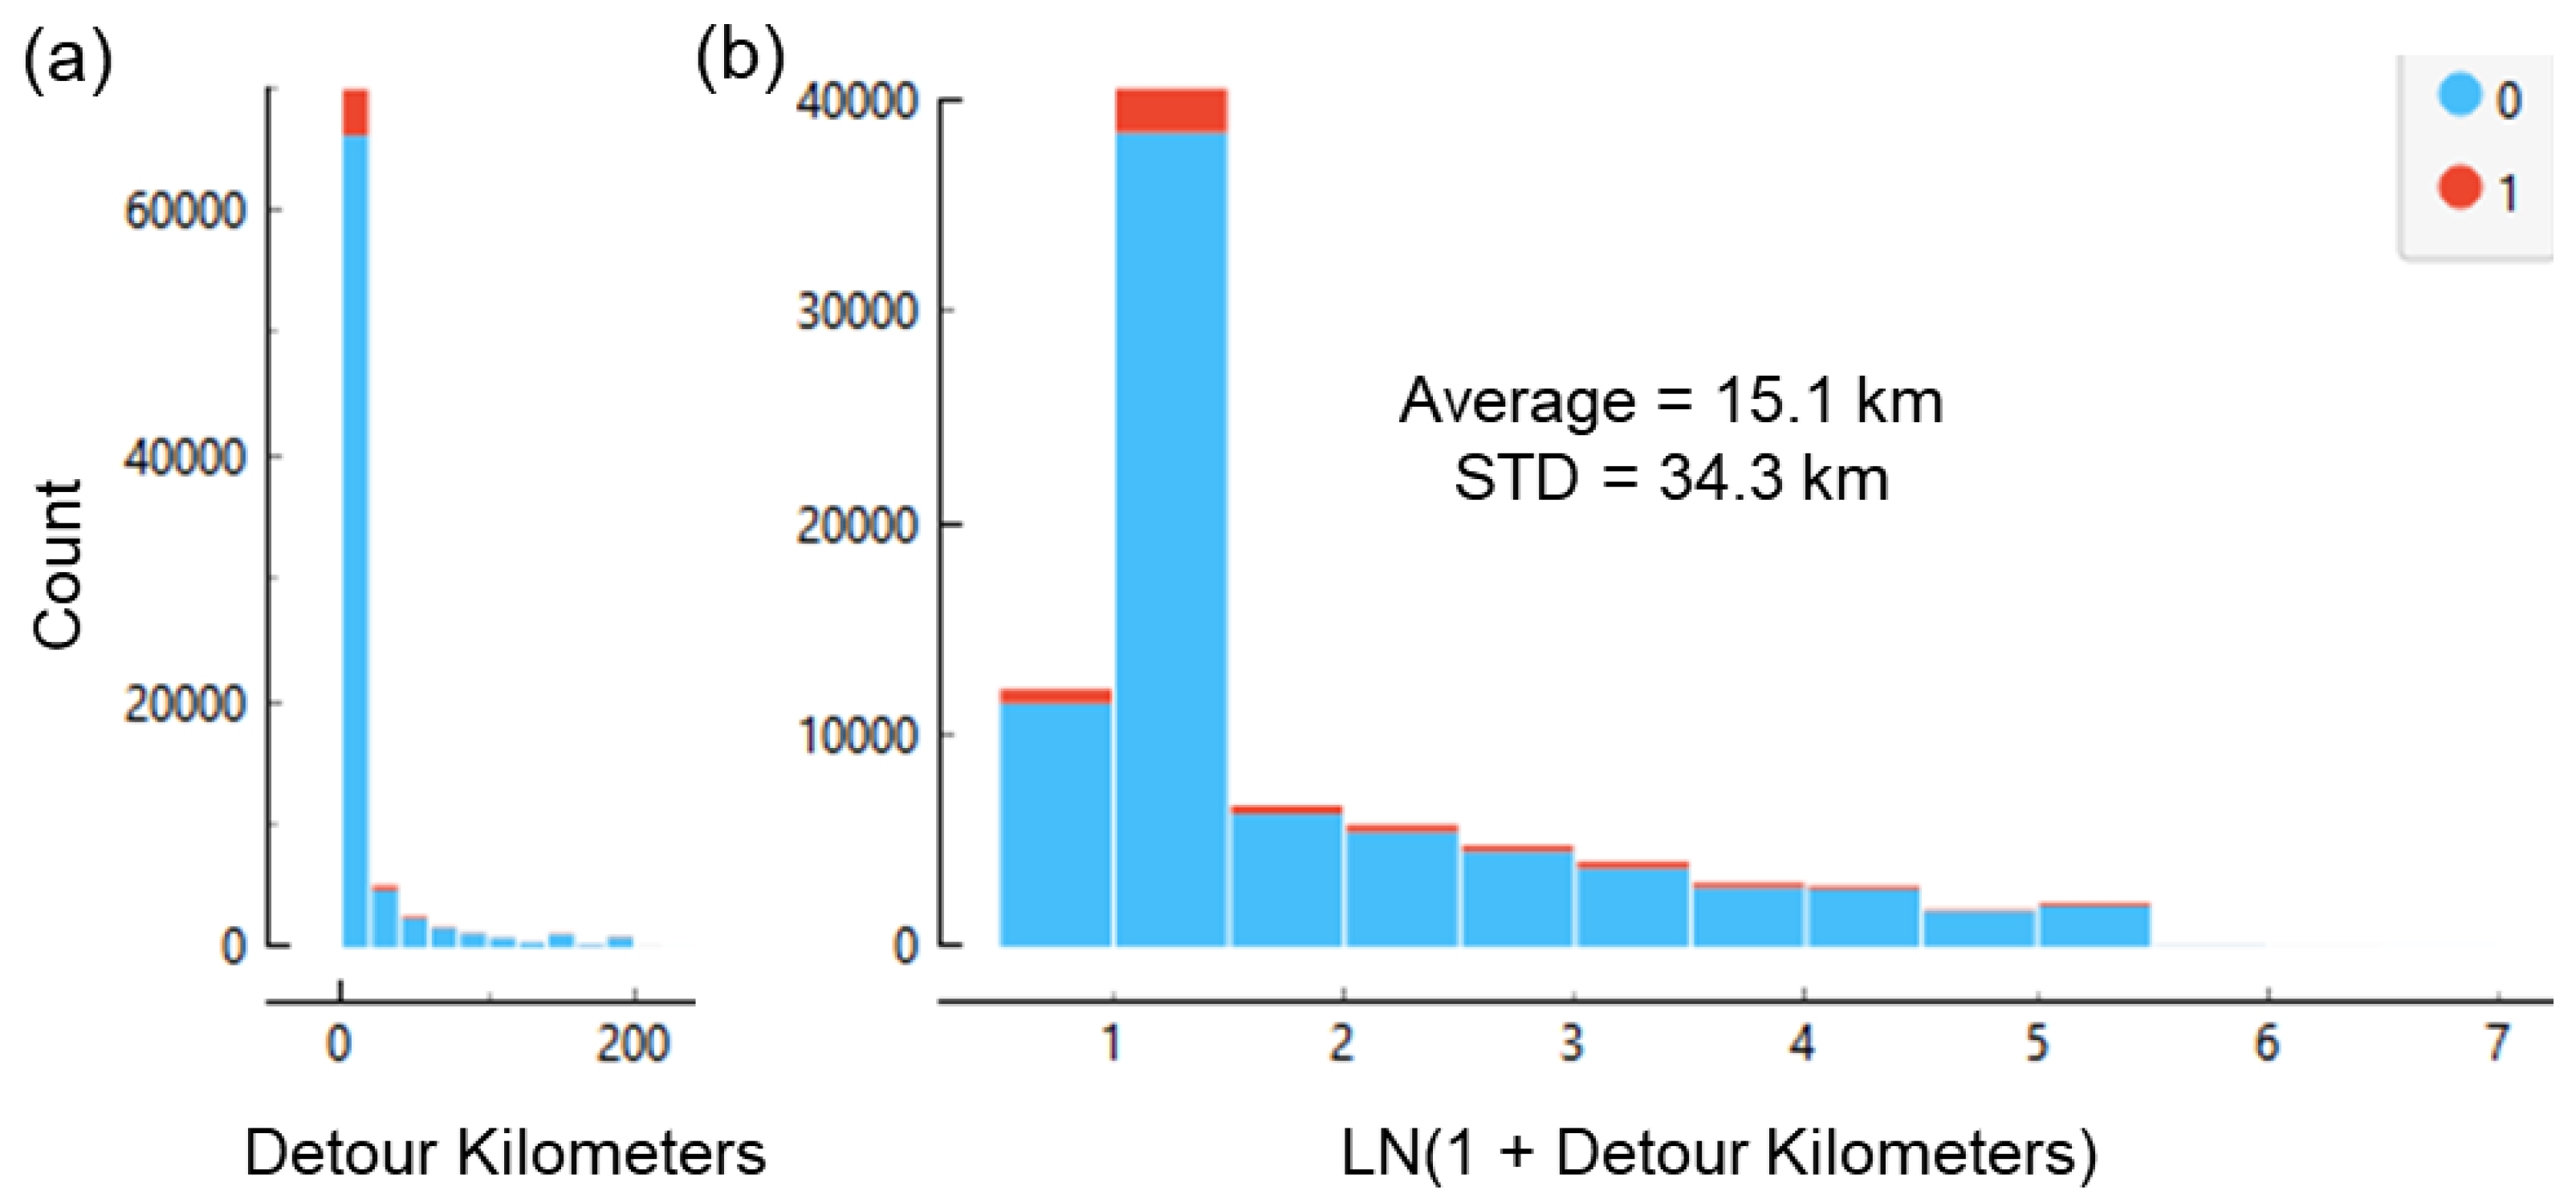
Figure 13.
Feature importance in predicting bridge condition.
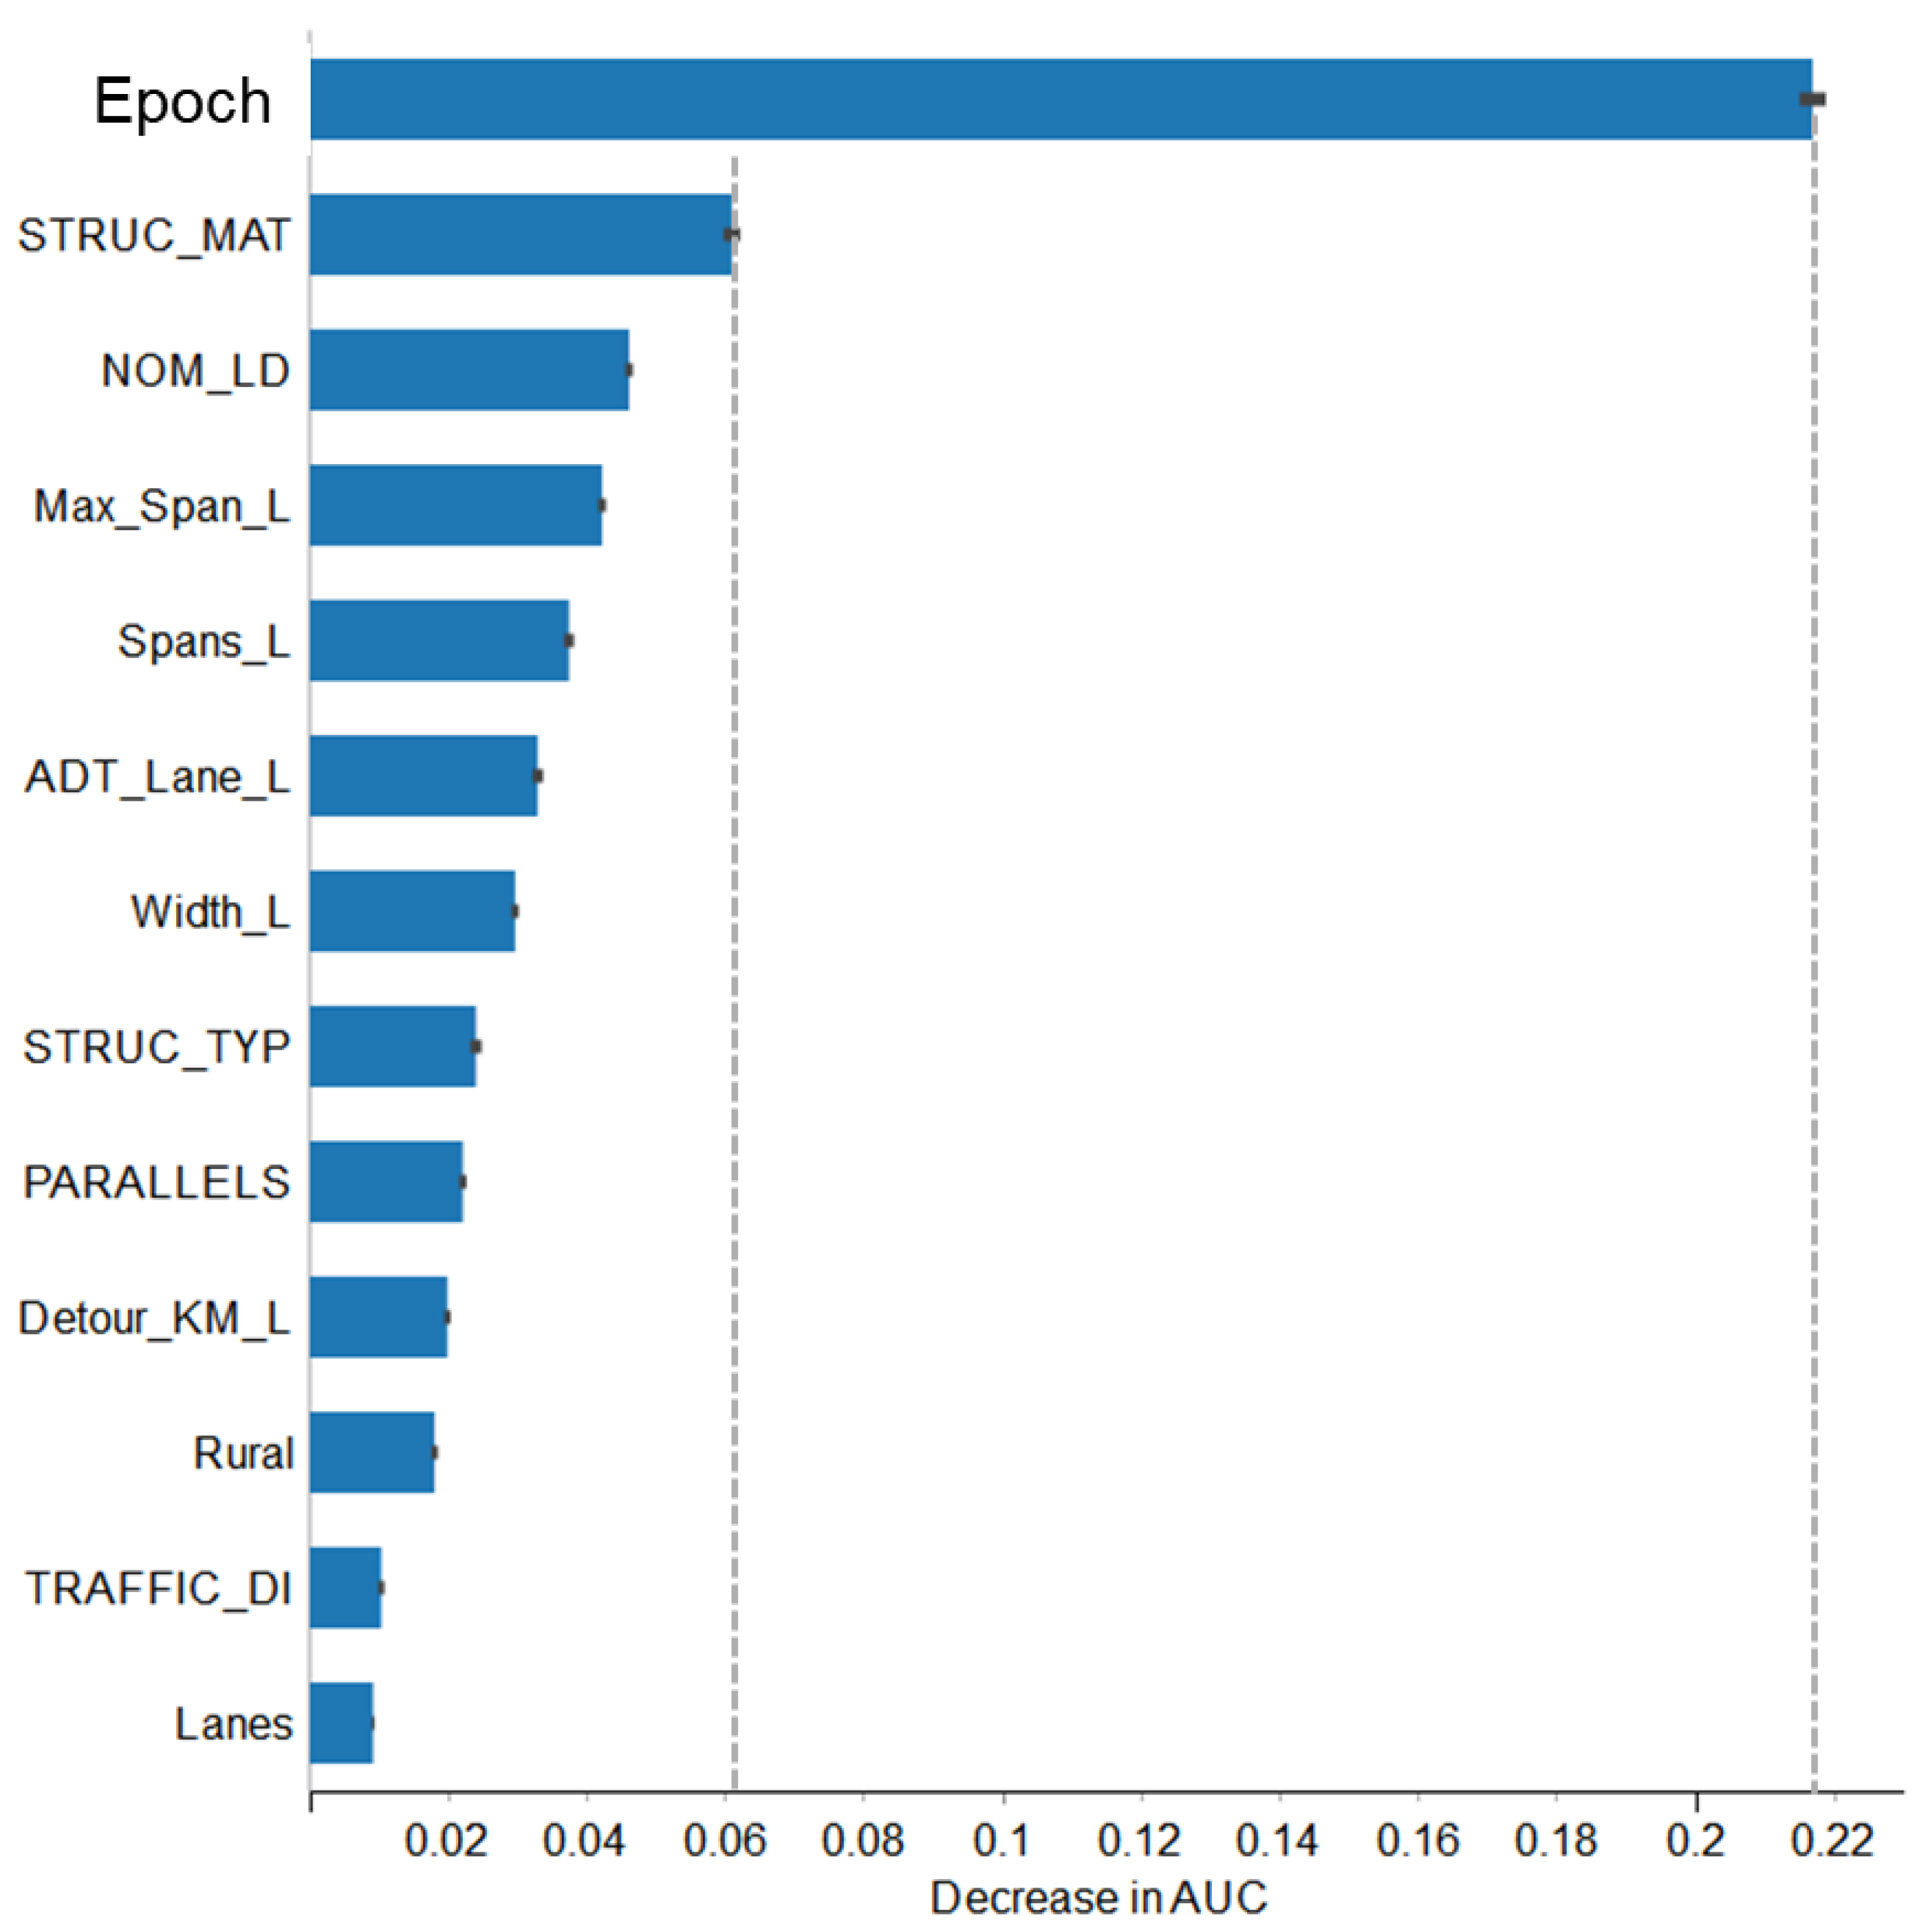
Figure 14.
Instances of risk index predicted by the OLS regression against the constructed risk index and the best linear fit.
Figure 14.
Instances of risk index predicted by the OLS regression against the constructed risk index and the best linear fit.
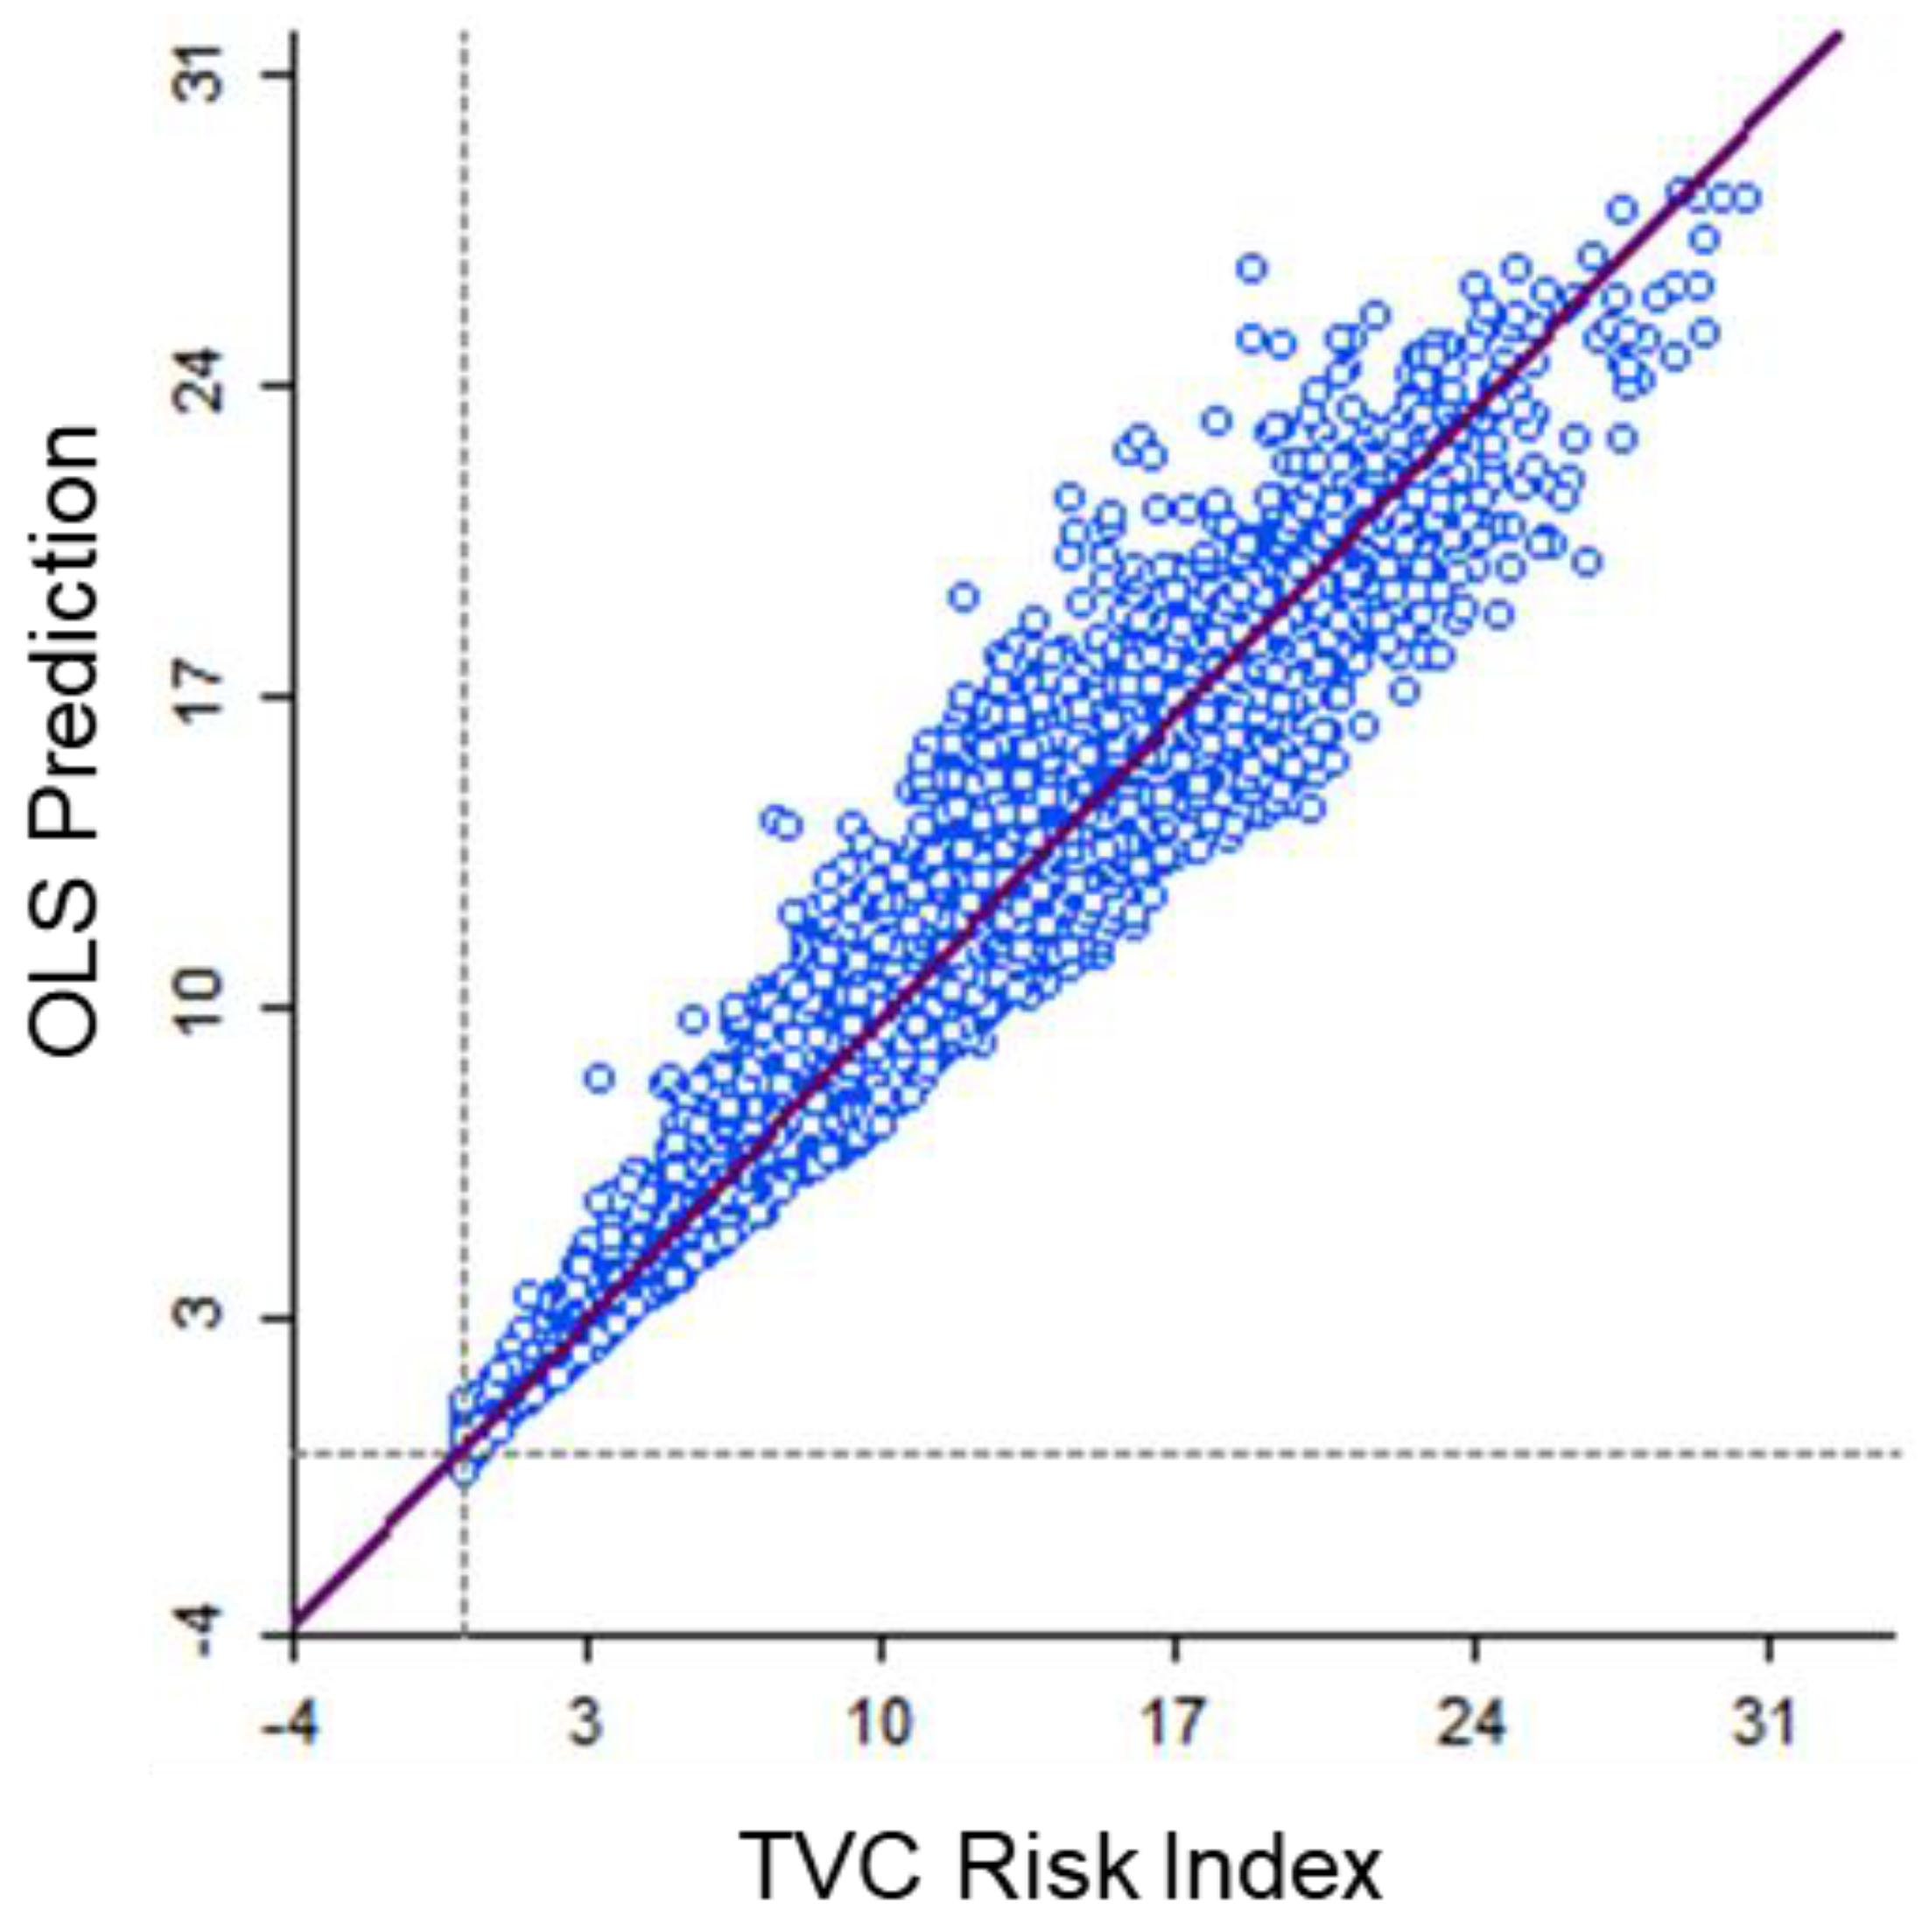
Figure 15.
Rank of states by their average risk index.
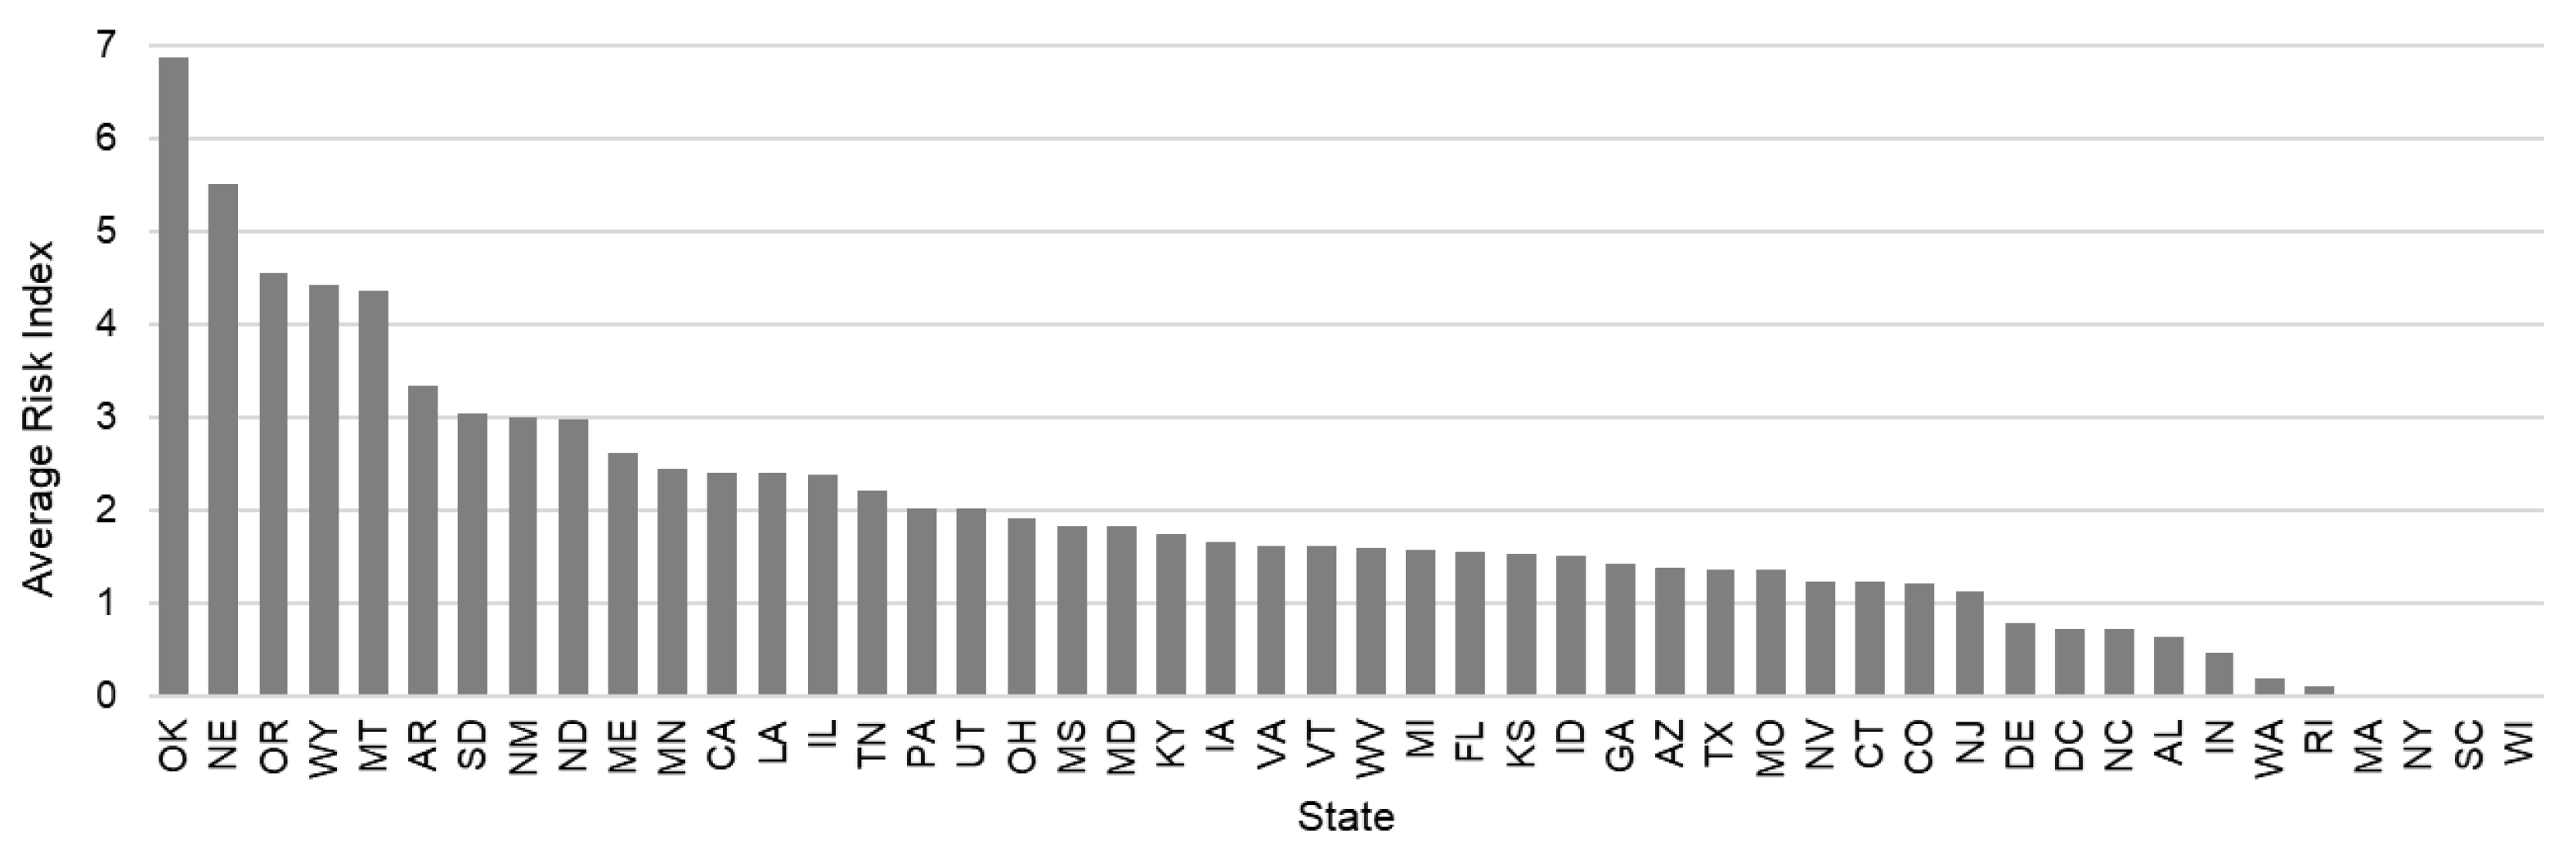
Figure 16.
Choropleth state map of the average risk index.
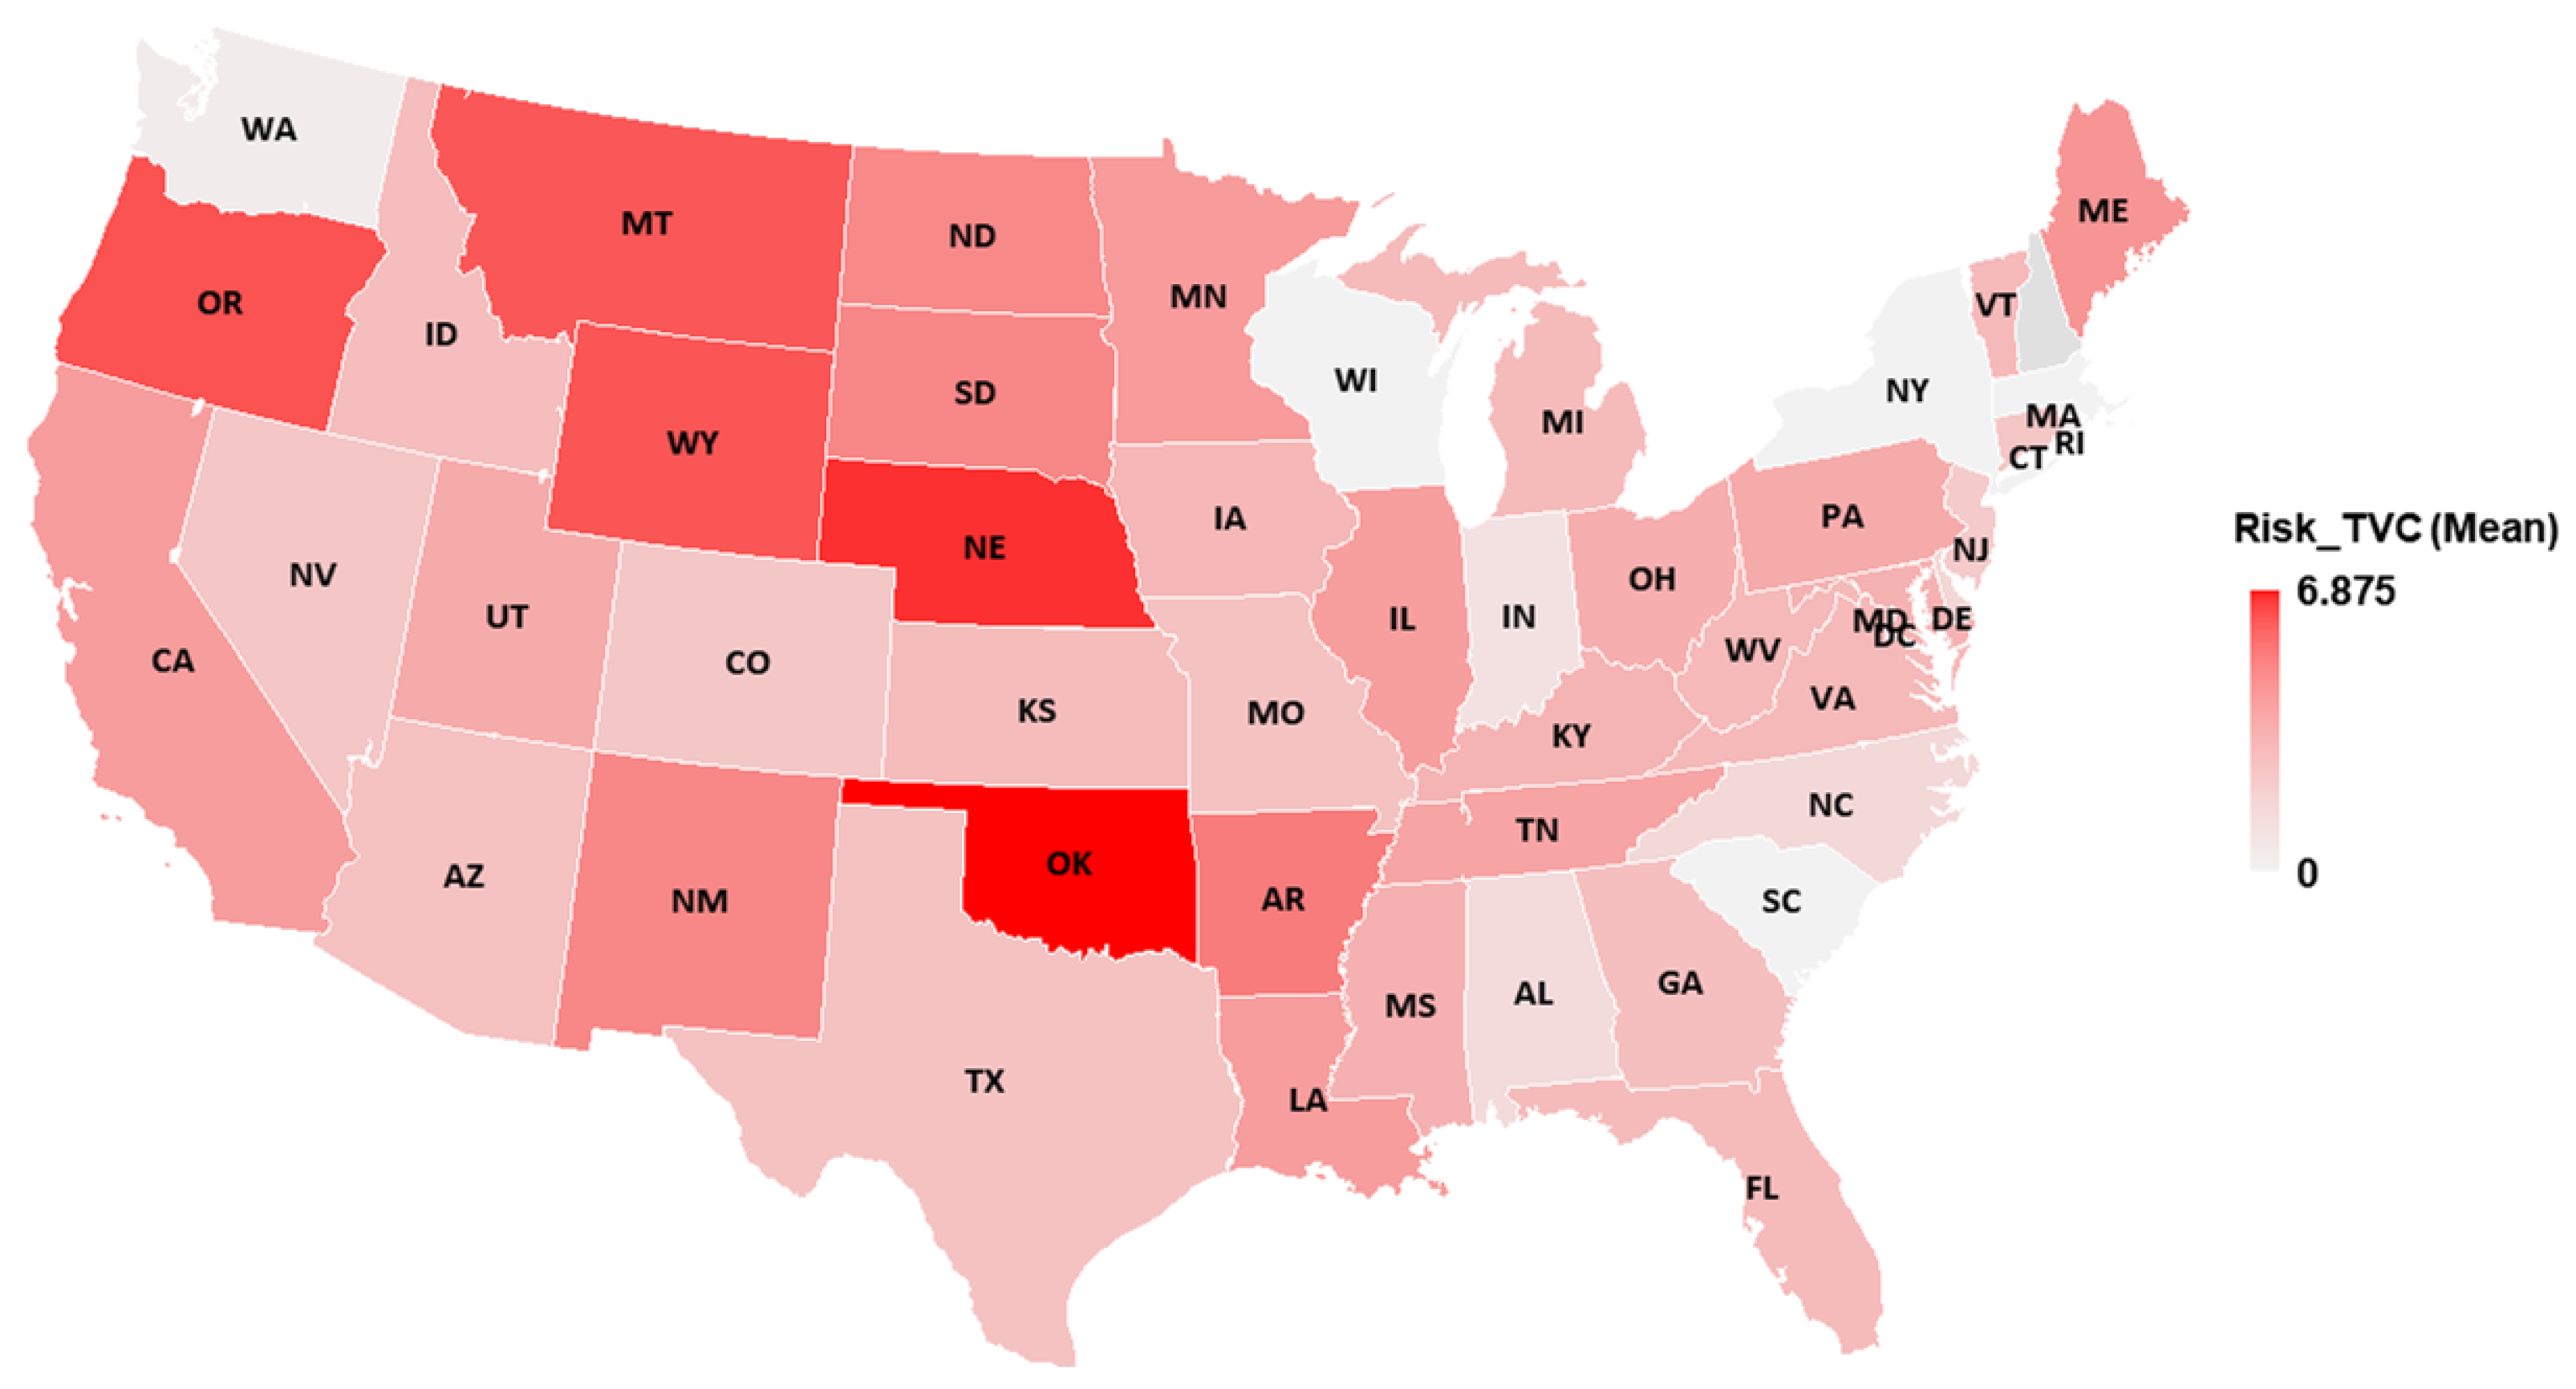
Figure 17.
Distribution of the TVC risk index.
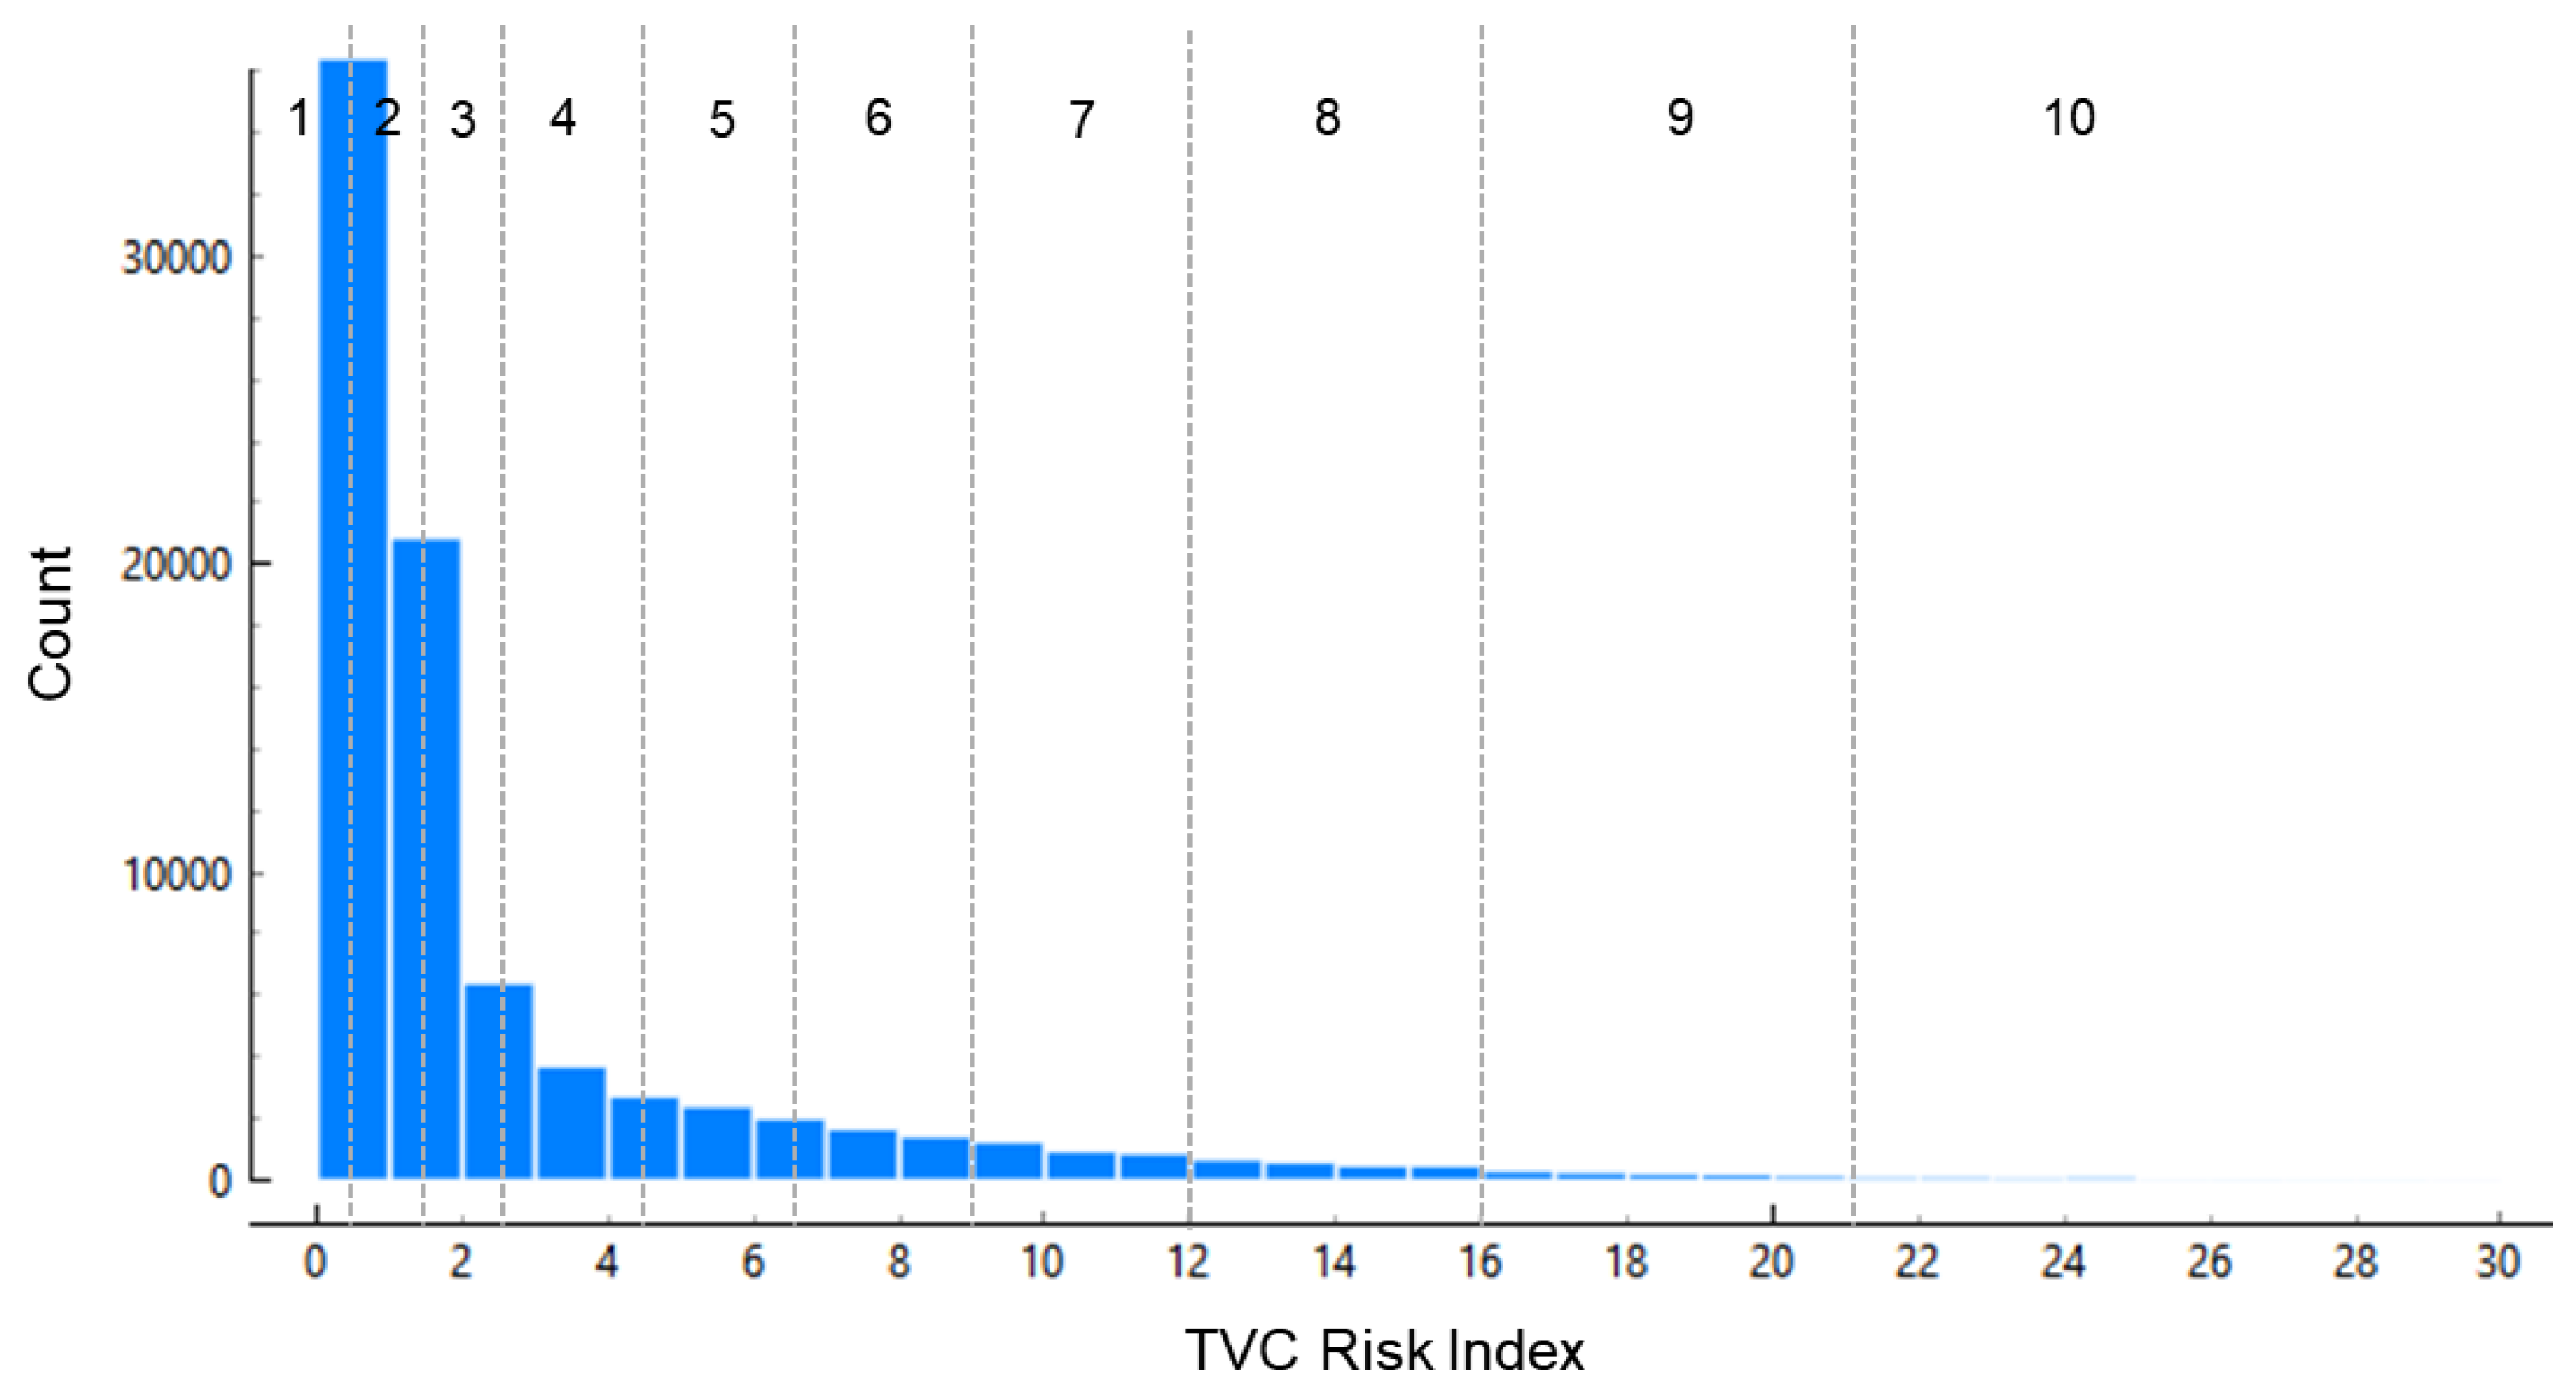
Figure 18.
Bridges on the NHS within the outlier risk category of the Jenks-10 natural break.
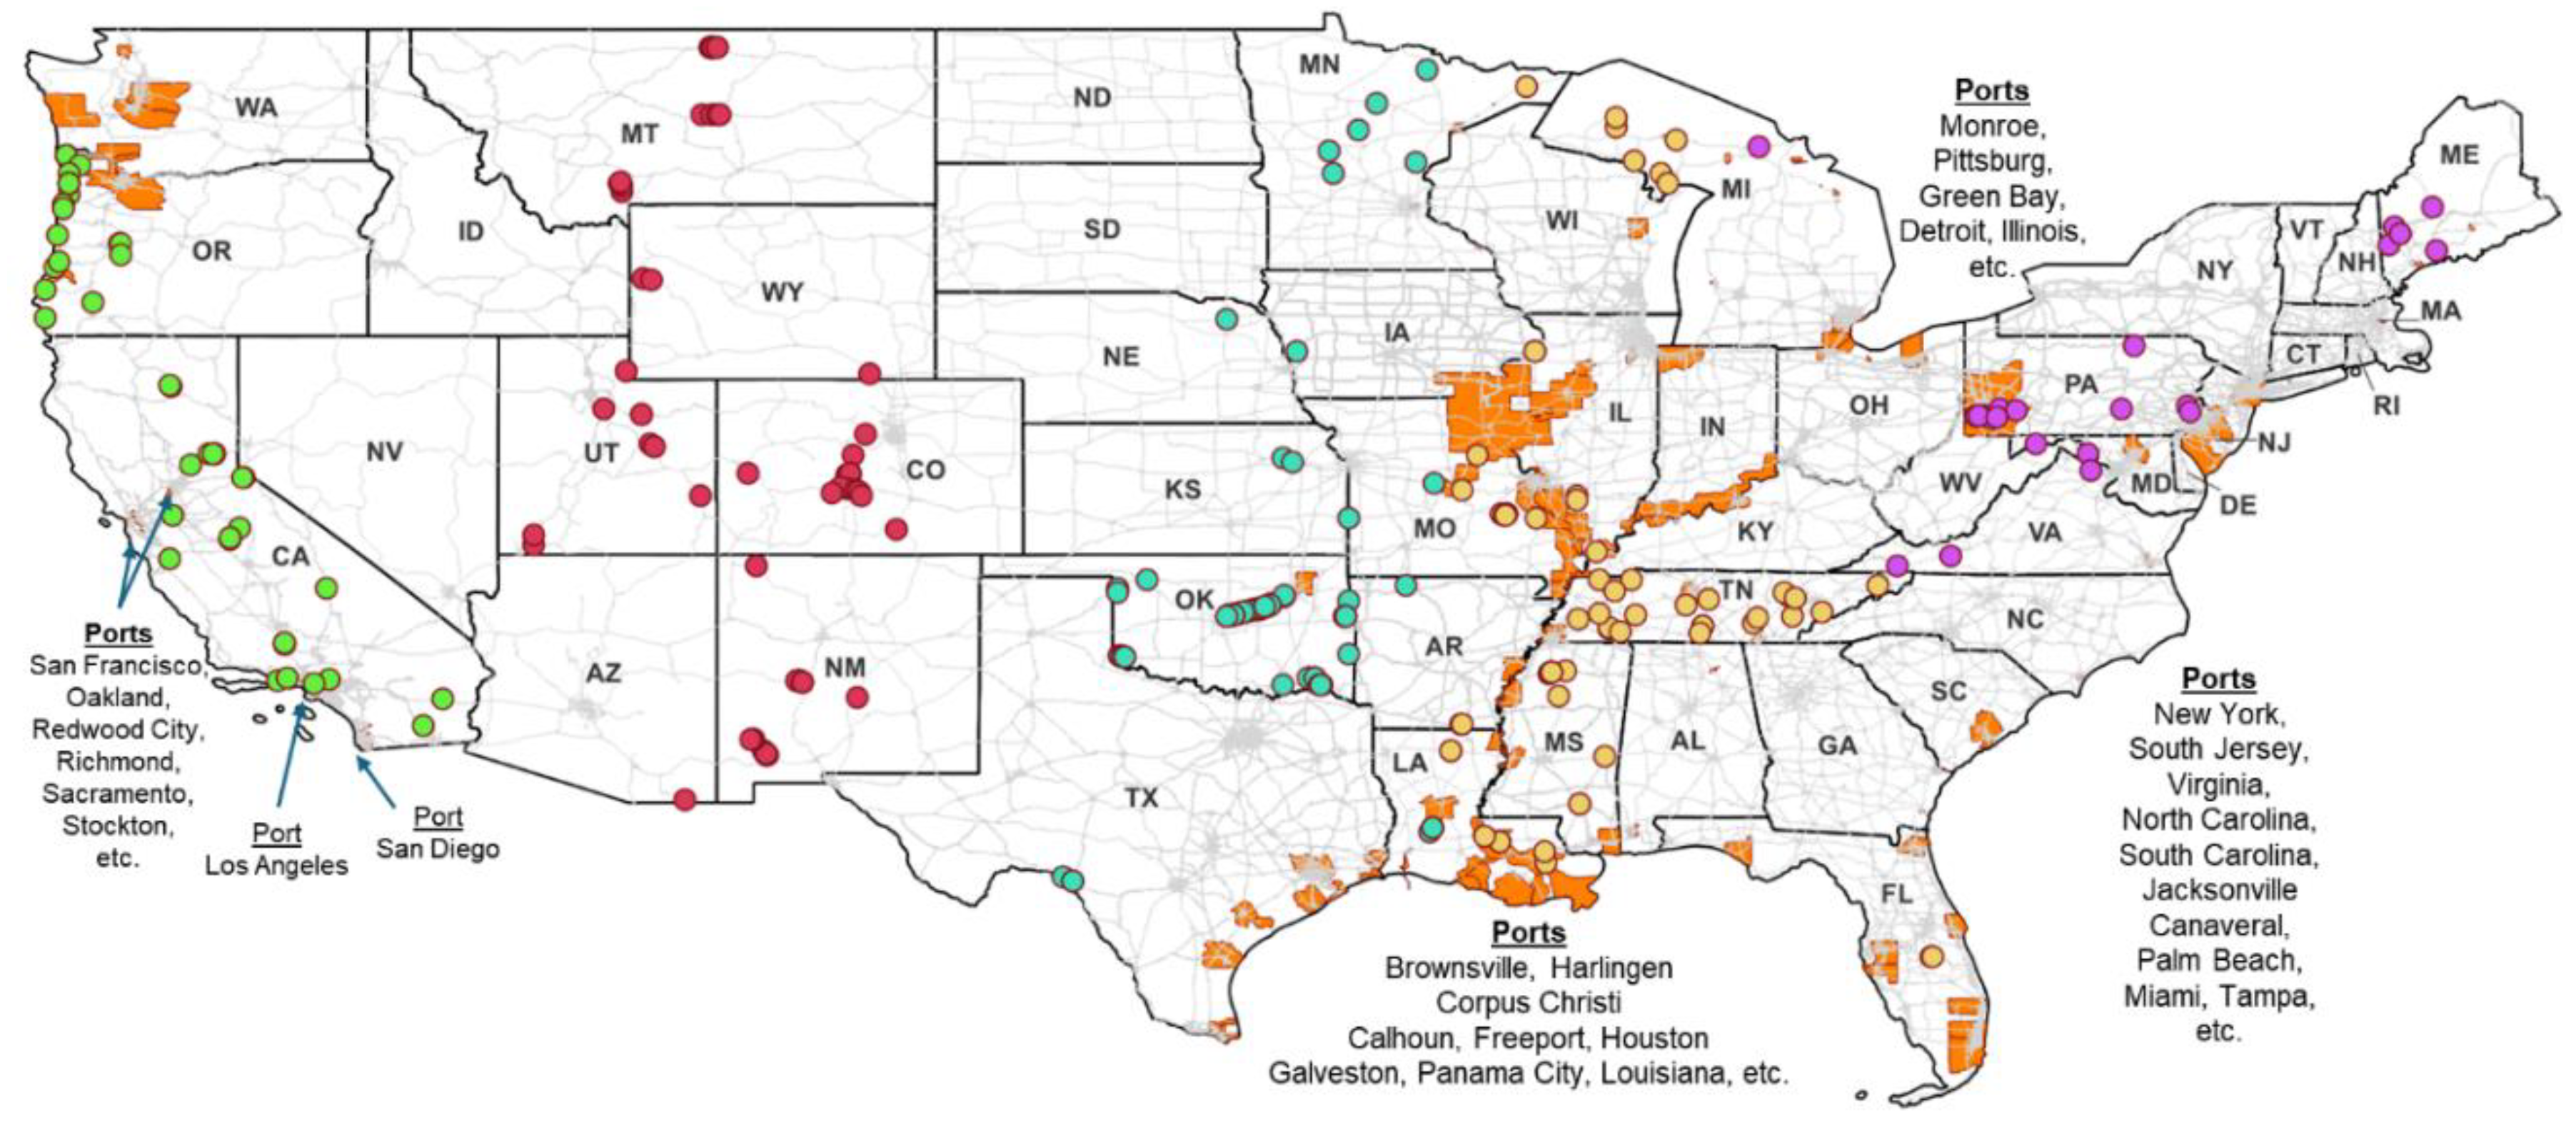

Table 1.
Data Cleaning and Filtering.
| Category | Attribute (Item Number) | Filter | Bridges |
| CONUS | State Code (1) | NOT IN (‘02’,’15’,’72’,’78’) | 618,495 |
| NHS | Highway System (104) | IN (‘1’) | 145,705 |
| Mainline | Service Level (5C) | IN (‘1’) | 126,043 |
| Highway | Bridge Service (42A) | IN (‘1’) | 111,304 |
| Open | Open-Close (41) | IN (‘A’) | 109,635 |
| Road Class | Route Prefix (5B) | IN (‘1’, ‘2’, ‘3’, ‘4’) | 106,443 |
| Latitude | LATDD | > 0 | 106,443 |
| Rated Load | Inventory Rating (66) | > 0 | 106,126 |
| Design Load | Design Load Capacity (31) | > 0 | 101,761 |
| ADT per Lane | ADT (29)/Lanes (28A) | > 0 | 101,681 |
| Detour | Detour Length (19) | > 0 | 87,752 |
| Epoch | 2025 – max [Built (27), Rec (106), Imp (97)] | > 0 | 83,479 |
Table 2.
Structural Rating.
| Condition | Rating | Description |
| Excellent | 9 | Pristine condition—no dificiences observed. |
| Very Good | 8 | No noteworty deficiencies observed, other than cosmetic. |
| Good | 7 | Some minor issues that do not affect the structural performance. |
| Satisfactory | 6 | Some minor deterioration in the structural elements. |
| Fair | 5 | Some minor section loss or damage but the primary structural elements are sound. |
| Poor | 4 | Notable advancement in section loss, damage, or deterioration. |
| Serious | 3 | Section loss, damage, cracking, shearing, or other deterioration seriously affects the primary structural components. |
| Critical | 2 | The primary structural elements are in a state of advanced deterioration. The bridge should be closely monitored or closed until fixed. |
| Failing | 1 | Inspectors expect that the critical structural elements are about to fail or that obvious movement destabalized the structure unstable. The bridge should be closed until fixed. |
| Failed | 0 | The bridge is beyond corrective action and cannot presently carry traffic. |
Table 3.
Bridge Attributes Ranked by their Predictive Power for Undamaged Condition Rating.
| Attribute | Item | Description |
| Epoch | Defined in Table 2. Years since the most recent defining event in the life cycle. | |
| STRUC_MAT | 43A | Structure material type (concrete, steel, wood, etc.). |
| NOM_LD | 66 | Inventory rating. The nominal load for which inspectors rated the bridge. |
| Max_Span_L | 48 | Natural log of the meters of the maximum span length. |
| Spans_L | 45 | Natural log of the number of spans in the main unit. |
| ADT_Lane_L | 29/28A | Average daily traffic per lane. |
| Width_L | 52 | Natural log of the meters of deck width. |
| STRUC_TYP | 43B | Type of structure (slab, tee beam, truss, movable, etc.). |
| PARALLELS | 101 | Boolean variable indicating if the bridge has parallel structures/spans. |
| Detour_KM_L | 19 | Natural log of the kilometers of bypass or detour. |
| Rural | 26 | Boolean if functional class is at most 9. |
| TRAFFIC_DI | 102 | Direction of traffic on on the same or parallel structure. |
| Lanes | 28A | Number of lanes on the structure. |
Table 4.
ML Model Performance.
| Model | AUC | CA | F1 | Pc | Rc |
| XGB | 0.90 | 0.95 | 0.93 | 0.93 | 0.95 |
| Random Forest | 0.86 | 0.95 | 0.93 | 0.93 | 0.95 |
| Neural Network | 0.86 | 0.94 | 0.93 | 0.92 | 0.94 |
| Logistic Regression | 0.82 | 0.94 | 0.92 | 0.92 | 0.94 |
| kNN | 0.75 | 0.94 | 0.93 | 0.92 | 0.94 |
| SVM | 0.57 | 0.82 | 0.86 | 0.90 | 0.82 |
Table 5.
Fitted OLS Regression Model.
| Variable | Coefficient | t-Statistic | p-value |
| Constant | -0.38 | -90.3 | 10-6 |
| TV | 3.1 | 139.9 | 10-6 |
| TC | 2.8 | 110.7 | 10-6 |
| VC | 52.8 | 1048.6 | 10-6 |
Table 6.
The Top 20 Bridges Based on the TVC Risk Index.
| Route | State | Bridge ID | Epoch | ADL | DD | Risk | L | R | LAT | LON |
| 101 | OR | 01172 009 32764 | 95 | 3700 | 199 | 30.34 | 6 | 1 | 42.4245 | -124.4130 |
| 54 | MO | 5255 | 101 | 3137 | 153 | 29.80 | 5 | 1 | 37.8436 | -94.5893 |
| 45 | TN | 55SR0050015 | 98 | 8013 | 101 | 29.38 | 6 | 1 | 35.2984 | -88.6367 |
| 45 | TN | 55SR0050019 | 98 | 8013 | 101 | 29.38 | 7 | 1 | 35.3394 | -88.6394 |
| 39 | CA | 53 0113 | 92 | 3679 | 199 | 29.35 | 7 | 0 | 34.1641 | -117.8950 |
| 285 | CO | G-13-G | 88 | 5076 | 199 | 29.22 | 5 | 1 | 39.2773 | -105.9250 |
| 23 | MN | 6073 | 101 | 2325 | 159 | 28.89 | 5 | 1 | 45.9515 | -93.0719 |
| 30 | PA | 35921 | 86 | 7943 | 159 | 28.66 | 5 | 0 | 40.3265 | -79.7112 |
| 24A | CO | I-12-AC | 88 | 4322 | 199 | 28.64 | 6 | 1 | 38.8409 | -106.0130 |
| 24A | CO | I-13-D | 88 | 4322 | 199 | 28.64 | 5 | 1 | 38.8582 | -105.9860 |
| 24A | CO | I-13-E | 88 | 4322 | 199 | 28.64 | 7 | 1 | 38.8649 | -105.9850 |
| 24A | CO | I-12-V | 87 | 4322 | 199 | 28.31 | 5 | 1 | 38.8205 | -106.0650 |
| 24A | CO | I-12-W | 87 | 4322 | 199 | 28.31 | 5 | 1 | 38.8209 | -106.0640 |
| 24A | CO | I-12-X | 87 | 4322 | 199 | 28.31 | 5 | 1 | 38.8227 | -106.0590 |
| 24A | CO | I-12-Y | 87 | 4322 | 199 | 28.31 | 6 | 1 | 38.8258 | -106.0530 |
| 54 | MO | 4886 | 98 | 5436 | 101 | 28.05 | 6 | 1 | 39.2596 | -91.6450 |
| 101 | OR | 11817 | 80 | 7750 | 199 | 27.91 | 6 | 0 | 44.9983 | -123.9950 |
| 19 | VA | 18855 | 92 | 4581 | 135 | 27.65 | 5 | 1 | 36.7484 | -82.0537 |
| 11 | TN | 62SR0020003 | 94 | 6304 | 105 | 27.65 | 6 | 0 | 35.5974 | -84.4648 |
| 101 | OR | 11927 | 80 | 6950 | 199 | 27.56 | 5 | 1 | 44.9127 | -124.0050 |
| AVG | 91 | 5158 | 170 | 29 | 6 |
Disclaimer/Publisher’s Note: The statements, opinions and data contained in all publications are solely those of the individual author(s) and contributor(s) and not of MDPI and/or the editor(s). MDPI and/or the editor(s) disclaim responsibility for any injury to people or property resulting from any ideas, methods, instructions or products referred to in the content. |
© 2025 by the authors. Licensee MDPI, Basel, Switzerland. This article is an open access article distributed under the terms and conditions of the Creative Commons Attribution (CC BY) license (http://creativecommons.org/licenses/by/4.0/).
Copyright: This open access article is published under a Creative Commons CC BY 4.0 license, which permit the free download, distribution, and reuse, provided that the author and preprint are cited in any reuse.


