Submitted:
05 September 2025
Posted:
08 September 2025
You are already at the latest version
Abstract
Well-annotated datasets are fundamental for developing robust artificial intelligence models, particularly in medical fields. Many existing skin lesion datasets have limitations in image diversity (including only clinical or dermoscopic images) or metadata, which hinder their utility for mimicking real-world clinical practice. The purpose of the MCR-SL dataset is to introduce a new, meticulously curated dataset that addresses these limitations. The MCR-SL dataset was collected from 60 subjects at the University Hospital of North Norway and comprises 779 clinical images and 1,352 dermoscopic images of 240 unique lesions. The lesion types included are nevus, seborrheic keratosis, basal cell carcinoma, actinic keratosis, atypical nevus, melanoma, squamous cell carcinoma, angioma, and dermatofibroma. Labels were established by combining the consensus of a panel of four dermatologists with histopathology reports for the 29 excised lesions, with the latter serving as the gold standard. The resulting dataset provides a comprehensive resource with clinical and dermoscopic images and rich clinical context, ensuring a high level of clinical relevance, surpassing many existing resources in that matter. The MCR-SL dataset provides a holistic and reliable foundation for validating artificial intelligence models, enabling a more nuanced and clinically relevant approach to automated skin lesion diagnosis that mirrors real-world clinical practice.
Keywords:
skin cancer
; multimodal
; diagnosis
; dermoscopy
; machine learning
; deep learning
; clinical data
1. Summary
Skin cancer is one of the most prevalent types of cancer worldwide, and it is expected to continue growing in the fair-skinned population in 2050 [1]. It is diagnosed by dermatologists, who evaluate the look of the lesion and other factors such as the subject’s risk factors (e.g., family history of skin cancer) or any associated symptoms (e.g., itching, bleeding, or pain) of the lesion. There are two image modalities typically used to depict skin lesions for diagnosis: clinical and dermoscopic images. The first shows the lesion as it appears to the naked eye. At the same time, the latter is captured using a dermoscope, which illuminates the skin with polarized or non-polarized light, removes surface reflections, and magnifies the lesion. An example of each modality is shown in Figure 1.
Artificial Intelligence (AI) models have been applied for skin lesion classification for some years [2,3]. It has been greatly promoted by the existence of public datasets such as the HAM10000, BCN20000, PH2, or PAD-UFES-20 dataset [4,5,6,7]. However, the ability of these models to accurately classify skin lesions and assist in clinical diagnosis is directly dependent on the richness and quality of the data used for their training and validation. While several datasets of skin lesions are publicly available, many present limitations in terms of image diversity, detailed metadata, or the methodology for establishing ground truth labels [7,8].
To address these limitations, this work introduces a new multimodal dataset of skin lesions, collected and curated to provide a comprehensive resource for the scientific community. The dataset includes clinical and dermoscopic images, as well as tabular metadata about the subjects, lesions, and diagnoses, covering clinical data, risk factors, lesion characteristics, and diagnostic information. The Multimodal, Context-Rich Skin Lesion dataset (MCR-SL) is the result of a data acquisition campaign carried out at the University Hospital of North Norway (UNN) and was initially created to serve as a controlled test dataset for the AI models developed within the European project WARIFA (Watching the Risk Factors, Grant Agreement: 101017385), which targeted automatic skin cancer prevention and detection based on smartphone applications [9].
The MCR-SL dataset distinguishes itself from existing resources by combining key strengths often found in isolation in other datasets. For instance, while datasets like PAD-UFES-20 [7] include detailed subject metadata, they consist solely of clinical images. Conversely, popular dermoscopic-only datasets such as PH2 [6] offer detailed ground truth but lack the crucial context provided by clinical images and extensive metadata. The well-known HAM10000 dataset [4] provides a large number of images and robust ground truth, but its metadata is often limited to basic subject demographics, and its image modalities can vary across different challenges. The MCR-SL dataset combines both clinical and dermoscopic images with extensive subject and lesion metadata, which provides the critical context typically available to a clinician. This holistic structure aims to mirror real-world clinical practice, enabling a more nuanced approach to lesion diagnosis where experts consider a subject’s complete history, individual characteristics, and the nuanced details of the lesion itself. Furthermore, for those lesions that were excised (around 12% of the lesions in the dataset), our ground truth labeling combines the consensus of an expert panel of dermatologists for all the lesions with histopathology reports (when available), providing a robust and reliable label for each lesion.
The MCR-SL dataset comprises 2,131 images documenting 240 skin lesions from 60 subjects. It includes a combination of 779 clinical images and 1,352 dermoscopic images, along with 20 images of excision scars. A central feature of this dataset is its approach to ground truth labeling. The diagnosis for each lesion was established in two ways: first, a panel of four dermatologists diagnosed every lesion; then, for those lesions that had been excised, the histopathology results served as the gold standard. A unified diagnosis combines both to serve as the gold standard. In addition to the images, the dataset includes extensive anonymized metadata: 9 attributes for lesions, 22 for subjects, and 16 attributes in total for diagnoses (encompassing dermatological, histopathological, and unified diagnoses). All data underwent a thorough curation process to ensure integrity and consistency, which included image standardization and the removal of all subject-identifying information to maintain privacy.
While the current size of this dataset is limited, its design incorporates several features to facilitate future expansion. The relational structure was chosen to ensure that new data entries can be seamlessly integrated. By using unique identifiers and standardized tables, the addition of new subjects, lesions, and images is straightforward. Furthermore, the modular design accommodates the inclusion of new data collection points without requiring a redesign of the core database schema. For instance, a new table for data collection locations could be added to account for other clinics or hospitals. This forward-looking approach allows the dataset to grow over time and provides a flexible framework for potential collaborative, multi-center studies.
2. Data Description
The MCR-SL dataset documents 240 unique skin lesions collected from 60 subjects. It consists of 877 clinical images, 1,518 dermoscopic images, and 20 images of excision scars. Each lesion has a diagnosis from a dermatologist, and for the 29 lesions that were excised, a histopathological diagnosis is also included. The dataset encompasses various types of skin lesions, including nevus (NEV), seborrheic keratosis (SK), basal cell carcinoma (BCC), actinic keratosis (AK), atypical nevus (ATY), melanoma (MEL), squamous cell carcinoma (SCC), angioma (ANG), dermatofibroma (DF), and unknown (UNK).
Table 1 summarizes the distribution of lesion types, detailing the number of lesions and subjects associated with each specific type. The percentages for subjects and lesions are calculated with respect to the total number of subjects (60) and lesions (240) in the dataset, respectively. Note that the percentages for lesions sum to 100%, but the percentages for subjects do not, as some subjects may present with multiple types of skin lesion types. For example, a subject with both nevi and seborrheic keratoses is counted in both categories, which is why the sum of subjects across categories can exceed the total number of unique subjects (60). How the lesions were diagnosed is explained in Section 3.4. Additionally, the association between subjects’ characteristics and lesion malignancy is explored in Table 2.
The images are stored in separate folders for clinical and dermoscopic image modalities. Both types of images were cropped to standardized sizes, which are detailed in the Methods section. It is important to note that many images of the same lesion are near-duplicates, captured with slight variations in lighting, focus, or rotation.
The images are provided in JPEG (.jpg) format and utilize the sRGB color space. The compression ratio varies significantly depending on the image content (e.g., 6.9:1 vs. 12:1). Each image is accompanied by extensive metadata detailing the lesions and subjects’ characteristics. This metadata is organized into multiple tables (provided as spreadsheets) designed to function as a relational database. The attributes and structure of these tables are further explained in Section 2.1.
2.1. Dataset Structure
The dataset is composed of both images and contextual data tables, which together provide a comprehensive record of skin lesions. The images are organized into two separate folders based on modality: dermoscopic and clinical. The contextual data is stored in several tables that contain clinical information about each lesion and the subjects. Each of these elements is an entity in our dataset, with the Lesion entity serving as the central element that connects all other data. This structure is further detailed in the Entity-Relationship Diagram shown in Figure 2.
In it, each rectangle represents an entity of our database, and the diamonds represent the relationship between the two entities connected to them. The numbers indicate the cardinality of the relationship, which specifies how many instances of one entity can be associated with instances of another. For instance, the relationship "subject-lesion (1,1):(1,M)" in the diagram shows that a single Subject can have multiple Lesions (1 to M), but each Lesion belongs to a single Subject. In contrast, the relationship "lesion-unified (1,1):(1,1)" in the diagram indicates that each Lesion is linked to a single Unified diagnosis, and each Unified diagnosis corresponds to a single Lesion. Also, the relationship "histopath-unified (0,1):(1,1)" between Histopathology diagnosis and Unified diagnosis entities shows that each Histopathology diagnosis is associated with a single Unified diagnosis; however, a Unified diagnosis may not be linked to any Histopathology diagnosis. Each entity and its relationships are further explained below.
2.1.1. Lesion Entity
The Lesion entity serves as the central entity of the dataset. Each entry is uniquely identified by a lesion_id, which is tied to a specific subject. This entity contains a unified diagnosis for each lesion and is associated with multiple images (both clinical and dermoscopic). Additional attributes, such as the lesion's diameter (diameter) or the referring physician's diagnosis (referral_diagnosis), are also included. All attributes of the Lesion entity are described in detail in Table 3.
Note that a few lesions were included even if they had only one image modality, as they were accompanied by other lesions from the same subject for which both modalities were available. This allowed for a more complete dataset and a holistic analysis of each subject.
2.1.2. Subject Entity
The Subjects table contains extensive, anonymized clinical data and risk factors, obtained through a questionnaire filled in by the subject. Each entry is uniquely identified by its subject_id. The specific attributes of this table are detailed in Table 4.
2.3. Image Entities
The Images entity stores metadata for all the acquired images. Each entry is uniquely identified by its image_id and is linked to a specific lesion via the lesion_id. It also includes the modality attribute, which specifies the type of image (e.g., clinical or dermoscopic). The attributes of the Images entity are detailed in Table 5, which serves as the key link connecting the image files to the rich contextual information of lesions and subjects stored in the dataset.
2.4. Diagnostic Entities: Dermatology, Histopathology, and Unified Diagnosis
The dataset contains three distinct types of diagnosis:
- 1)
- Dermatology Diagnosis: A diagnosis provided by a panel of dermatologists, assigned to each lesion.
- 2)
- Histopathology Diagnosis: A diagnosis derived from histopathology reports, available for a subset of 29 excised lesions (out of 240). This report also contains tumor thickness information when applicable.
- 3)
- Unified Diagnosis: The definitive label for this dataset, derived by synthesizing the dermatology and histopathology diagnoses. The methodology for generating this label is detailed in the Methods section.
The attributes of the Dermatology, Histopathology, and Unified diagnosis entities are detailed in Table 6, Table 7 and Table 8, respectively. The Dermatology entity contains individual diagnoses from each expert, whereas the Unified entity holds the definitive final diagnosis for each lesion. With both expert and histopathology diagnoses available, two analyses can be performed: first, to calculate the diagnostic accuracy of the dermatologists for the 29 excised lesions; and second, to analyze the interobserver variability among the experts. The diagnostic accuracy derived from this subset of histologically proven lesions will be used to extrapolate the dermatologists' expected performance on the larger set of non-confirmed lesions.
3. Methods
3.1. Ethics Declaration
This study was conducted in accordance with the Declaration of Helsinki. The dataset was obtained in partnership with the dermatology and plastic surgery departments at UNN. The data collection campaign received approval from the Regional Committee for Medical and Health Research Ethics (North) (Ref.: 392439).
3.2. Participants and Selection Criteria
Eligibility criteria include subjects with skin lesions belonging to one of the following types (previously introduced in Table 1): NEV, ATY, SK, AK, ANG, DF, BCC, SCC, or MEL. These skin lesion types have been selected to aid in the development of AI-based algorithms to learn the key differences among benign, malignant, and premalignant lesions. In order to make a comparison between skin lesion types, at least two lesions per subject were captured. Note that originally, only melanoma, BCC, or SCC were considered as eligible skin cancer lesions, but the inclusion criteria were extended during the data collection to decrease the probability of missing a relevant lesion for the study. The methodology for consolidating these diagnoses and establishing ground truth is detailed in Section 3.4.
Participants include patients and volunteers from the dermatology and plastic surgery departments at UNN. In this context, patients are individuals who sought medical care, while volunteers are individuals recruited specifically for the study who did not seek treatment. Both departments were asked to collaborate to increase the potential number of subjects and lesions in the final dataset, finding patients with at least one lesion fitting the eligibility criteria.
The recruitment process differed between the departments. In the case of dermatology, dermatologists derived every subject after screening them. For plastic surgery, patients were scheduled to participate 45 minutes before their surgery. This approach prioritized subject convenience, as other methods would have required additional hospital appointments.
Additionally, a few subjects volunteered to participate to increase the number of benign lesions collected during the campaign. Images of as many lesions as possible were taken from all participants, including those the subjects were referred to, and any incidental findings.
3.3. Data Acquisition Workflow
Data collection and diagnosis were performed as three distinct steps, separately. First, a questionnaire is used to gather information about the subject's demographic profile (e.g., age, sex) and skin cancer risk factors, while images of their lesions are acquired. Then, the histopathology reports for the excised lesions were collected through the plastic surgery department personnel. Finally, once the image collection ended, a panel of dermatologists was asked to diagnose one image per lesion. The image provided for each lesion was a randomly selected dermoscopic image, except for a few cases where none was available, in which case a clinical image was used instead. The workflow is illustrated in Figure 3. The consolidation of the diagnoses from dermatology and histopathology is explained in Section 3.4.
Image and subject metadata were collected on-site at UNN. Data collection was carried out by a researcher familiar with the appearance of clinical and dermoscopic images, though without formal training in their acquisition. Room illumination corresponded to a standard clinical setup. Clinical images were generally collected as close-up views of the lesions, although in a few cases focusing issues prevented the acquisition of optimal images. The equipment used for image collection consisted of a Xiaomi Redmi 9A smartphone, equipped with a 13-MP rear camera (f/2.2 aperture, 28 mm focal length), and a DermLite HÜD 2 portable dermatoscope providing ×10 magnification under polarized light. The dermoscope, with an outer diameter of approximately 59.2 mm and a lens diameter of 12.5 mm, was attached directly to the smartphone for dermoscopic acquisitions. Clinical images were captured at close range using ambient room illumination without flash. Since the dermatological component of the WARIFA project targeted the general population, images acquired with these devices were selected to better reflect the type of data expected in the final WARIFA application. We acknowledge that higher-end imaging setups could have provided better image quality; however, our choice prioritized accessibility and realism over optimal resolution.
Assuming two lesions per subject, the total time required for carrying out the whole process was around 15-20 minutes. The steps followed are outlined below:
- 1.
- Informed consent: When the subject arrives in the room, they are informed about the study. Then, the subject is given the informed consent form to read and sign if they are willing to participate in the study (Figure 3a). Estimated time: 5 min.
- 2.
- Clinical data collection: If the informed consent form is signed, the subject is asked to fill out a questionnaire in situ, so the data collector can clarify any questions the subject may have if needed (Figure 3b). Estimated time: 10 min.
- 3.
- Clinical and dermoscopic image acquisition: A smartphone-based digital camera is used by the data collector for capturing the images with and without the dermoscope attached to the device (Figure 3c). Estimated time: 30 s per lesion.
- 4.
- Diameter measurement of the skin lesion: The lesion is measured by the data collector with a caliper gauge (Figure 3d). Estimated time: 20 s per lesion.
- 5.
- Data Storage: All acquired data are verified and stored in a secure, encrypted storage system (Figure 3e). Estimated time: 5 min per lesion.
Note that the subjects were guided through the questionnaire, but their answers were entirely their own. Participation was encouraged, but not mandatory, which resulted in missing values for some cases. The questionnaire was written in Norwegian to make it easier for subjects to understand; an English version is available in the supplementary material.
Special consideration was given for two subjects who were underage at the time of data collection. In these cases, the consent form was signed by their legal guardians. Furthermore, questions asking about characteristics at 18 years old were answered with their current status. Consequently, the answers for the current number of moles and the number of moles at 18 years old are the same for these subjects.
As mentioned, the diagnoses of the excised lesions were obtained from their histopathology reports (Figure 3f). To do that, all the recent reports for a given patient were collected, sorted, and translated into English to extract the relevant information: procedure, diagnosis, and tumor thickness (when applicable).
Once the data collection was completed, the dermatology diagnoses of the acquired images were performed remotely by a panel of four dermatologists (Figure 3g) who had high or very high levels of expertise (self-reported). They used a customized software interface developed for this purpose (Figure 4).
Using this software interface, the dermatologists could examine the image shown and provide a diagnosis for the lesion, alongside other variables. For each image, the dermatologists were asked to specify their certainty of diagnosis on a scale of 0%, 25%, 50%, 75%, and 100% (A 100% rating meant they were completely sure about their answer, while a 0% rating meant the opposite). They also provided a rating of image quality on a scale from 1 to 10, with 1 being the lowest and 10 the highest quality, and the software automatically recorded the time spent on each image. The dermatologists were encouraged to add comments about the lesion and were given the option to specify a lesion type if it wasn't available in the predefined class options. Finally, if they were unsure about their primary diagnosis, they were asked to provide a second diagnostic option.
3.4. Diagnosis Consolidation and Ground Truth Determination
The lesions were diagnosed in two ways: by dermatologists and, when possible, by histopathology.
First, the software interface and corresponding images were sent to a panel of four expert dermatologists, who independently provided a diagnosis, among other variables. Using only one image per lesion to diagnose, the dermatology diagnosis was determined by taking the most frequent diagnosis from the four experts (i.e., majority voting). If no experts provided the same diagnosis, the diagnosis for that lesion was labeled as UNK. This happened with 6 lesions (around 2.5% of the total).
A tie-breaker criterion was implemented for the cases where two labels were proposed (Figure 5), based on the collective accuracy of the experts who proposed each label. This occurred for 26 out of 240 lesions (around 10.8% of the total). The experts were ranked according to their individual accuracy against the histopathology diagnoses available within the same dataset. For each tied diagnosis, the average accuracy of the proposing experts was calculated, and the diagnosis associated with the pair of experts with the highest average accuracy was selected as the final dermatology diagnosis. This approach ensured that the decision reflected the combined expertise of the agreeing parties rather than relying on a single individual. Specific accuracy values are reported in Figure 5, and additional details can be found in the dataset.
To establish a single, definitive ground truth for each lesion (a fundamental step for training and evaluating AI-based models), a unified diagnosis was created. The choice of gold standard varies widely across public datasets; some rely on a clinical diagnosis, while others use histopathology. For instance, the BCN20000 dataset's labels are a result of expert consensus from dermatologists, while the PAD-UFES-20 dataset relies primarily on histopathology, with all skin cancer cases being biopsy-proven. The HAM10000 dataset uses a combined approach, with over 50% of lesions confirmed by histopathology and the remainder by a combination of follow-up examinations, expert consensus, and in-vivo confocal microscopy.
Histopathology is widely considered the definitive diagnosis because it provides a final, conclusive diagnosis based on the microscopic examination of tissue, rather than on visual patterns alone. However, it is well-documented that it is susceptible to interobserver variability [10]. Similarly, clinical and dermoscopic diagnoses are also subject to variability, as shown by studies on expert consensus [11], but a diagnosis reached by a consensus of expert dermatologists can still serve as a highly reliable benchmark [12]. To create a robust and comprehensive ground truth for our dataset, we adopted a hierarchical approach to diagnosis. For all lesions that were excised, the histopathology diagnosis was prioritized and used as the definitive gold standard (Figure 6). For the remaining lesions, which were not excised, the consensus diagnosis from the expert panel served as the ground truth. This systematic integration of expert consensus and histopathology provides a more robust and less ambiguous label for each image in the dataset than a diagnosis from a single expert.
3.5. Data Curation and Validation
To ensure the integrity and consistency of the dataset, several steps were taken during data collection and post-processing (Figure 7).
First, to protect subject privacy and comply with ethical guidelines, all identifying information, such as names, birth dates, and exact data collection dates were removed. A relational database was established, allowing unique identifiers to be assigned to each subject, lesion, and image immediately after collection. These codes serve to identify and link data records while ensuring anonymity. Any free-text fields containing potentially identifying information were also removed to complete the anonymization process.
To homogenize the image data, most camera settings were standardized. While automatic white balancing and exposure were used by default to capture the first image of all the lesions, another image was also captured with manually adjusted brightness for comparison (a near duplicate of the first one). This process ensured consistent image capture across the dataset.
Following data collection, a visual inspection and curation process was performed. Images of poor, unrecoverable quality (e.g., highly unfocused or improperly framed images) were removed. However, we intentionally retained images of moderate to lower quality (e.g., slight blurriness or sub-optimal lighting) to allow for comparisons between higher and lower quality images and to study their effect on other variables, such as diagnosis accuracy. The remaining images were then manually cropped to contain only the region of interest, excluding artifacts such as the frame of the dermoscopic lens or stray hairs (Figure 8). While this cropping does not necessarily reflect routine clinical practice, it is a standard step performed to ensure a clear judgment and help the AI model focus on the lesion instead of irrelevant artifacts [10,13].
To further standardize the image data, dermoscopic images were consistently cropped to a size of 1750×1750 pixels. This dimension was chosen as the maximum squared size that could be obtained while eliminating the dermoscope's frame. Clinical images were cropped to 512×512, 1024×1024, or 1750×1750 pixels, depending on the size of the lesion.
In parallel with image curation, the metadata was reviewed for consistency and completeness. Missing values were not imputed or removed from the dataset, leaving the choice of how to handle them to end users of the dataset. All categorical data, such as lesion locations and diagnoses, were standardized to a predefined list. For instance, we collapsed the original body locations into a more compact list of categories but maintained both fields to provide flexibility for future researchers. Data types were also validated to ensure, for example, that age was stored as a numerical value. Beyond these standard measures, the expert ratings on image quality, collected for a fraction of the dataset (29 out of 240 lesions), serve as a valuable, human-centric validation of the dataset's visual integrity.
The expert feedback collected, which includes diagnostic certainty, time spent per image, and image quality ratings, provides rich contextual information for future work on inter-rater variability. However, due to a technical error, image quality ratings from one of the four experts were not recorded. Notably, the remaining experts' responses varied concerning image quality: those who generally gave lower ratings to the images also tended to achieve lower accuracy in their diagnosis. This suggests that some experts may be less comfortable diagnosing when image quality is limited. However, further studies are needed to fully analyze this inter-observer variability and the impact of image quality on diagnostic confidence.
Supplementary Materials
The questionnaire used for the data collection is included in the supplementary materials.
Author Contributions
Conceptualization, MCF; Methodology, MCF, TS, HK, BR, IC; Software, MCF, SO; Validation, MCF, TS, HK, BR, IC; Formal Analysis, MCF; Investigation, MCF, TS, HK, BR, IC; Resources, HF, GCM; Data Curation, MCF; Writing—Original Draft Preparation, MCF; Writing—Review and Editing, TS, HK, BR, IC, HF, SO, FG GCM; Visualization, MCF; Supervision, HF, GCM; Project Administration, MCF, CG; Funding Acquisition, FG, GMC, TS, CG. All authors have read and agreed to the published version of the manuscript.
Funding
This work was completed while Maria Castro-Fernandez was a beneficiary of a predoctoral fellowship from the 2022 Ph.D. Training Program for Research Staff of the University of Las Palmas de Gran Canaria (ULPGC). The data collection was performed as part of the tasks in the Watching the Risk Factors (WARIFA) project, funded by the European Union’s Horizon 2020 research and innovation program under grant agreement 101017385. The labelling software used is an adaptation of the original version created during a research project supported by the IKT+ initiative, funded by the Research Council of Norway (grant no. 332901).
Institutional Review Board Statement
The study was conducted in accordance with the Declaration of Helsinki and approved by the Regional Committee for Medical and Health Research Ethics (North) (Ref.: 392439) at UNN Hospital.
Informed Consent Statement
Informed consent was obtained from all subjects involved in the study.
Acknowledgments
The authors would like to thank the Dermatology and Plastic Surgery Departments at UNN Hospital for their invaluable assistance in facilitating subject recruitment and data collection. Authors also thank Dr. Pablo Herández Morera for his valuable comments, which have helped to improve some of the descriptions presented in this manuscript. During the preparation of this manuscript, the author(s) used Gemini 2.5 Flash and Grammarly to polish a human-written text. The authors have reviewed and edited the output and take full responsibility for the content of this publication.
Conflicts of Interest
The authors declare no conflicts of interest. The funders had no role in the design of the study; in the collection, analyses, or interpretation of data; in the writing of the manuscript; or in the decision to publish the results.
Abbreviations
The following abbreviations are used in this manuscript:
| AI | Artificial Intelligence |
| MCR-SL | Multimodal, Context-Rich Skin Lesion |
| UNN | University Hospital of North Norway |
| WARIFA | Watching the Risk Factors |
| NEV | Nevus |
| SK | Seborrheic Keratosis |
| BCC | Basal Cell Carcinoma |
| AK | Actinic Keratosis |
| ATY | Atypical nevus |
| MEL | Melanoma |
| SCC | Squamous Cell Carcinoma |
| ANG | Angioma |
| DF | Dermatofibroma |
| UNK | Unknown |
| NM | Non-malignant |
| M | Malignant |
References
- Wang, R.; Chen, Y.; Shao, X.; Chen, T.; Zhong, J.; Ou, Y.; Chen, J. Burden of Skin Cancer in Older Adults From 1990 to 2021 and Modelled Projection to 2050. JAMA Dermatol 2025, 161, 715. [Google Scholar] [CrossRef] [PubMed]
- Haenssle, H.A.; Fink, C.; Toberer, F.; Winkler, J.; Stolz, W.; Deinlein, T.; Hofmann-Wellenhof, R.; Lallas, A.; Emmert, S.; Buhl, T.; et al. Man against Machine Reloaded: Performance of a Market-Approved Convolutional Neural Network in Classifying a Broad Spectrum of Skin Lesions in Comparison with 96 Dermatologists Working under Less Artificial Conditions. Annals of Oncology 2020, 31, 137–143. [Google Scholar] [CrossRef] [PubMed]
- Esteva, A.; Kuprel, B.; Novoa, R.A.; Ko, J.; Swetter, S.M.; Blau, H.M.; Thrun, S. Dermatologist-Level Classification of Skin Cancer with Deep Neural Networks. Nature 2017, 542, 115–118. [Google Scholar] [CrossRef] [PubMed]
- Tschandl, P.; Rosendahl, C.; Kittler, H. The HAM10000 Dataset, a Large Collection of Multi-Source Dermatoscopic Images of Common Pigmented Skin Lesions. Sci Data 2018, 5, 180161. [Google Scholar] [CrossRef] [PubMed]
- Combalia, M.; Codella, N.C.F.; Rotemberg, V.; Helba, B.; Vilaplana, V.; Reiter, O.; Carrera, C.; Barreiro, A.; Halpern, A.C.; Puig, S.; et al. BCN20000: Dermoscopic Lesions in the Wild. 2019. [CrossRef]
- Mendonca, T.; Ferreira, P.M.; Marques, J.S.; Marcal, A.R.S.; Rozeira, J. PH2 - A Dermoscopic Image Database for Research and Benchmarking. In Proceedings of the 2013 35th Annual International Conference of the IEEE Engineering in Medicine and Biology Society (EMBC); IEEE: Osaka (Japan), July 2013; pp. 5437–5440. [Google Scholar]
- Pacheco, A.G.C.; Lima, G.R.; Salomão, A.S.; Krohling, B.; Biral, I.P.; de Angelo, G.G.; Alves Jr, F.C.R.; Esgario, J.G.M.; Simora, A.C.; Castro, P.B.C.; et al. PAD-UFES-20: A Skin Lesion Dataset Composed of Patient Data and Clinical Images Collected from Smartphones. Data Brief 2020, 32, 106221. [Google Scholar] [CrossRef] [PubMed]
- Codella, N.; Rotemberg, V.; Tschandl, P.; Celebi, M.E.; Dusza, S.; Gutman, D.; Helba, B.; Kalloo, A.; Liopyris, K.; Marchetti, M.; et al. Skin Lesion Analysis Toward Melanoma Detection 2018: A Challenge Hosted by the International Skin Imaging Collaboration (ISIC). 2019.
- Watching the Risk Factors: Artificial Intelligence and the Prevention of Chronic Conditions | WARIFA Project | Fact Sheet | H2020 | CORDIS | European Commission. Available online: https://cordis.europa.eu/project/id/101017385/es (accessed on 27 October 2021).
- Daneshjou, R.; Barata, C.; Betz-Stablein, B.; Celebi, M.E.; Codella, N.; Combalia, M.; Guitera, P.; Gutman, D.; Halpern, A.; Helba, B.; et al. Checklist for Evaluation of Image-Based Artificial Intelligence Reports in Dermatology: CLEAR Derm Consensus Guidelines From the International Skin Imaging Collaboration Artificial Intelligence Working Group. JAMA Dermatol 2022, 158, 90–96. [Google Scholar] [CrossRef] [PubMed]
- Haenssle, H.A.; Fink, C.; Schneiderbauer, R.; Toberer, F.; Buhl, T.; Blum, A.; Kalloo, A.; Ben Hadj Hassen, A.; Thomas, L.; Enk, A.; et al. Man against Machine: Diagnostic Performance of a Deep Learning Convolutional Neural Network for Dermoscopic Melanoma Recognition in Comparison to 58 Dermatologists. Annals of Oncology 2018, 29, 1836–1842. [Google Scholar] [CrossRef] [PubMed]
- Bourkas, A.N.; Barone, N.; Bourkas, M.E.C.; Mannarino, M.; Fraser, R.D.J.; Lorincz, A.; Wang, S.C.; Ramirez-Garcialuna, J.L. Diagnostic Reliability in Teledermatology: A Systematic Review and a Meta-Analysis. BMJ Open 2023, 13, e068207. [Google Scholar] [CrossRef] [PubMed]
- Barata, C.; Celebi, M.E.; Marques, J.S. A Survey of Feature Extraction in Dermoscopy Image Analysis of Skin Cancer. IEEE J Biomed Health Inform 2019, 23, 1096–1109. [Google Scholar] [CrossRef] [PubMed]
Figure 1.
(a) A clinical and (b) a dermoscopic image of the same lesion (L0098).
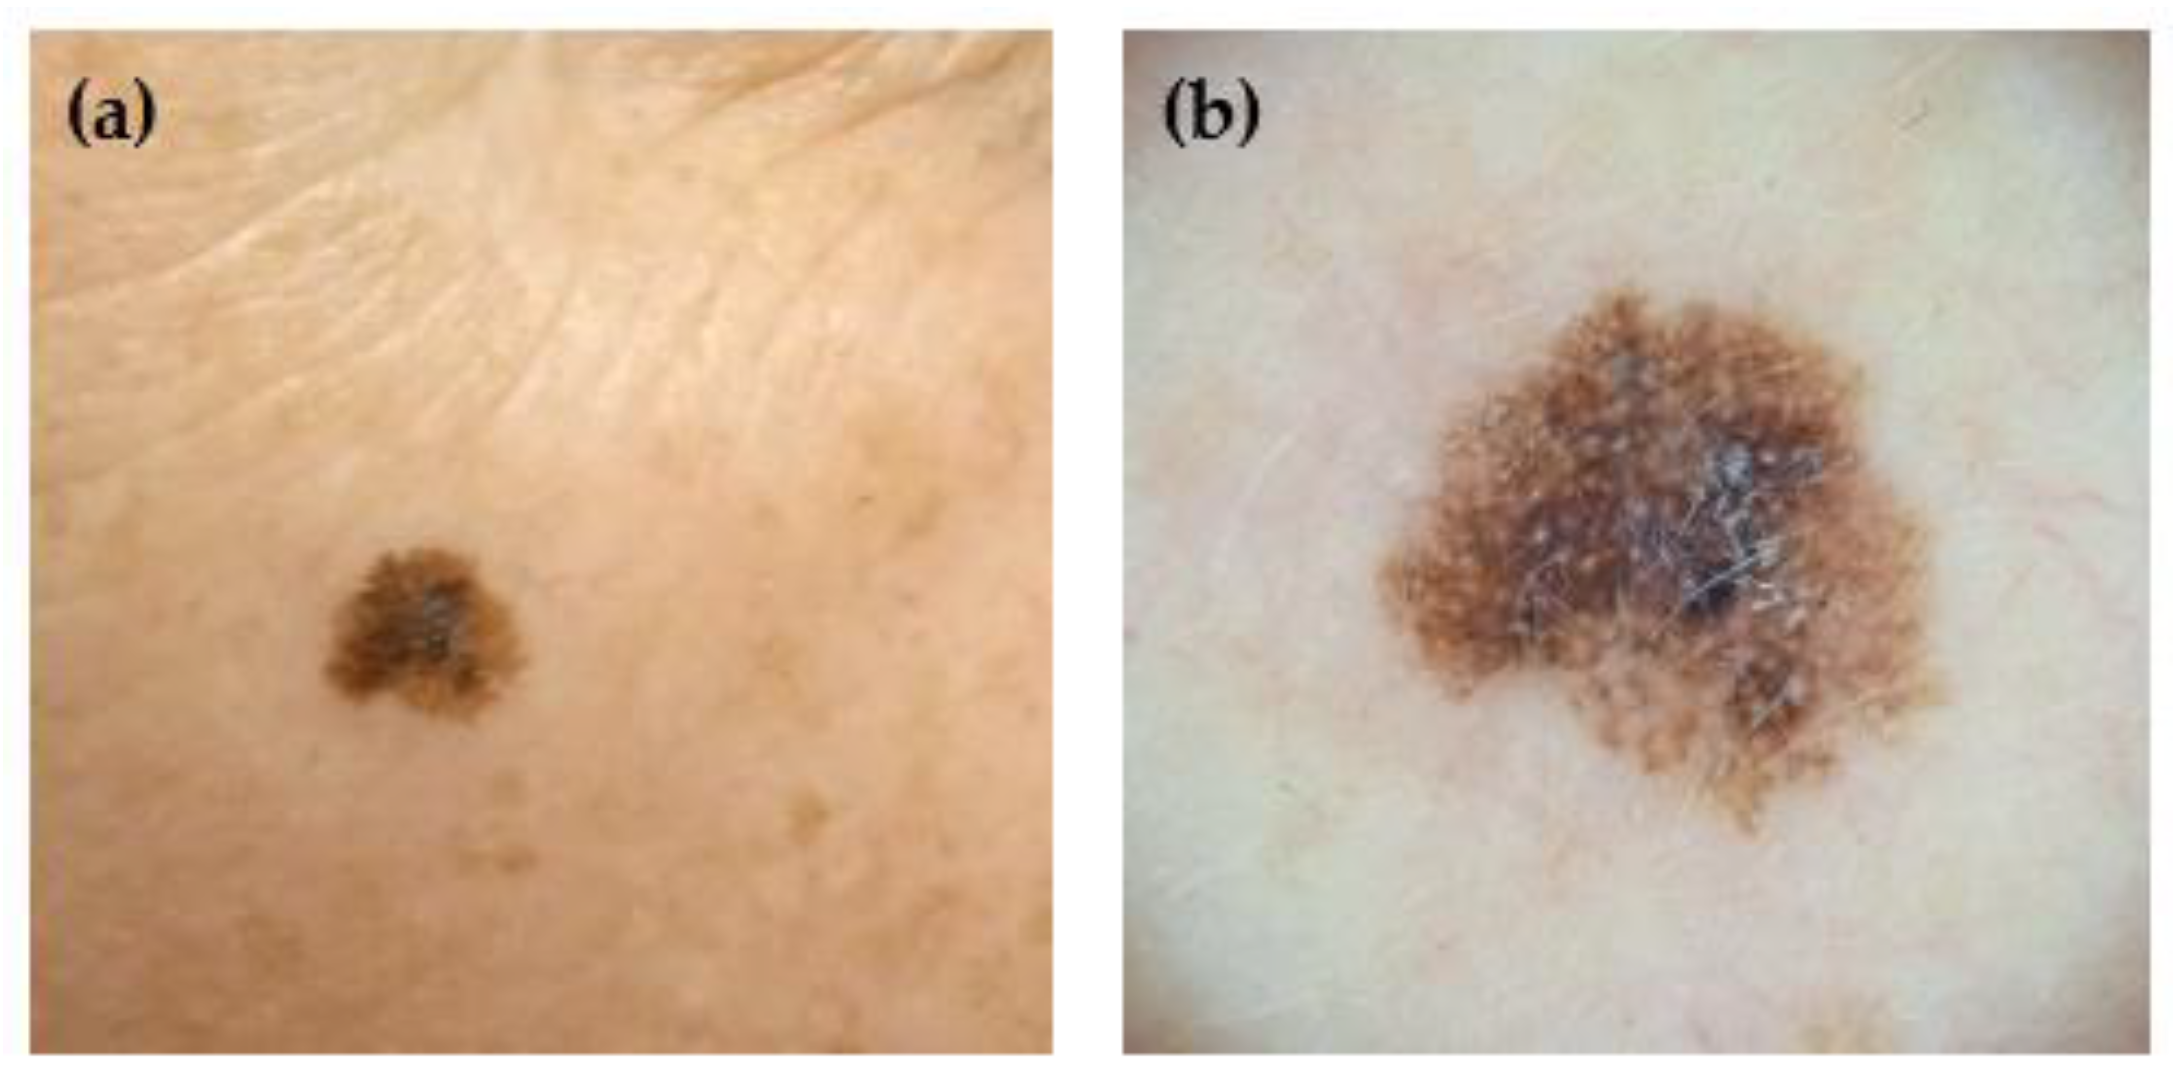
Figure 2.
Entity-Relationship Diagram: This diagram visually represents the relationships between the dataset's core entities. Attributes are not included in the figure for the sake of simplicity.
Figure 2.
Entity-Relationship Diagram: This diagram visually represents the relationships between the dataset's core entities. Attributes are not included in the figure for the sake of simplicity.
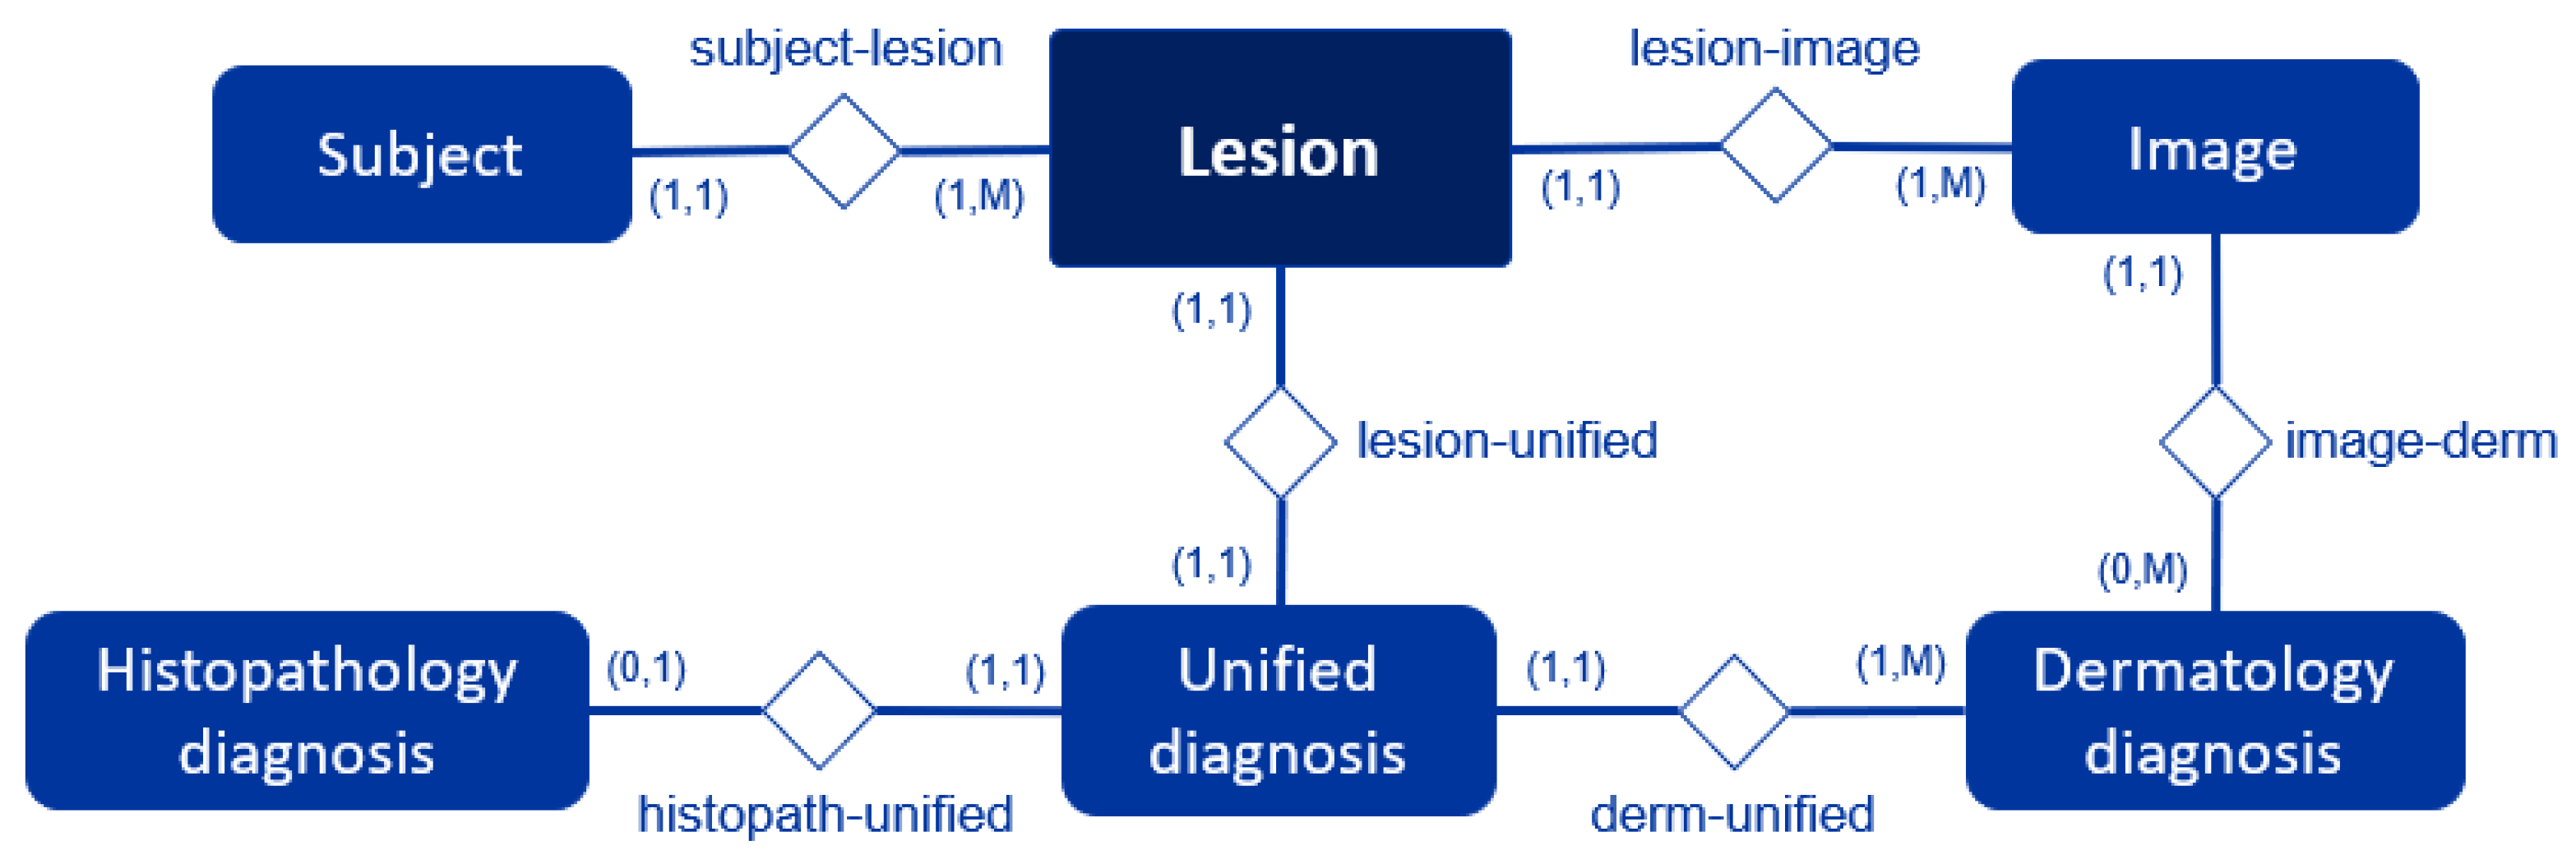
Figure 3.
Workflow of the data acquisition process. (a) Signing the informed consent form; (b) Collecting clinical data via a questionnaire; (c) Clinical and dermoscopic images are acquired using a smartphone and a portable dermoscope; (d) Diameter of the skin lesion is measured with a caliper; (e) After the subject interview, data is verified and stored in a secure, encrypted system; (f) Histopathology diagnosis is gathered for the excised lesions; (g) Dermatology diagnoses are collected from a panel of dermatologists.
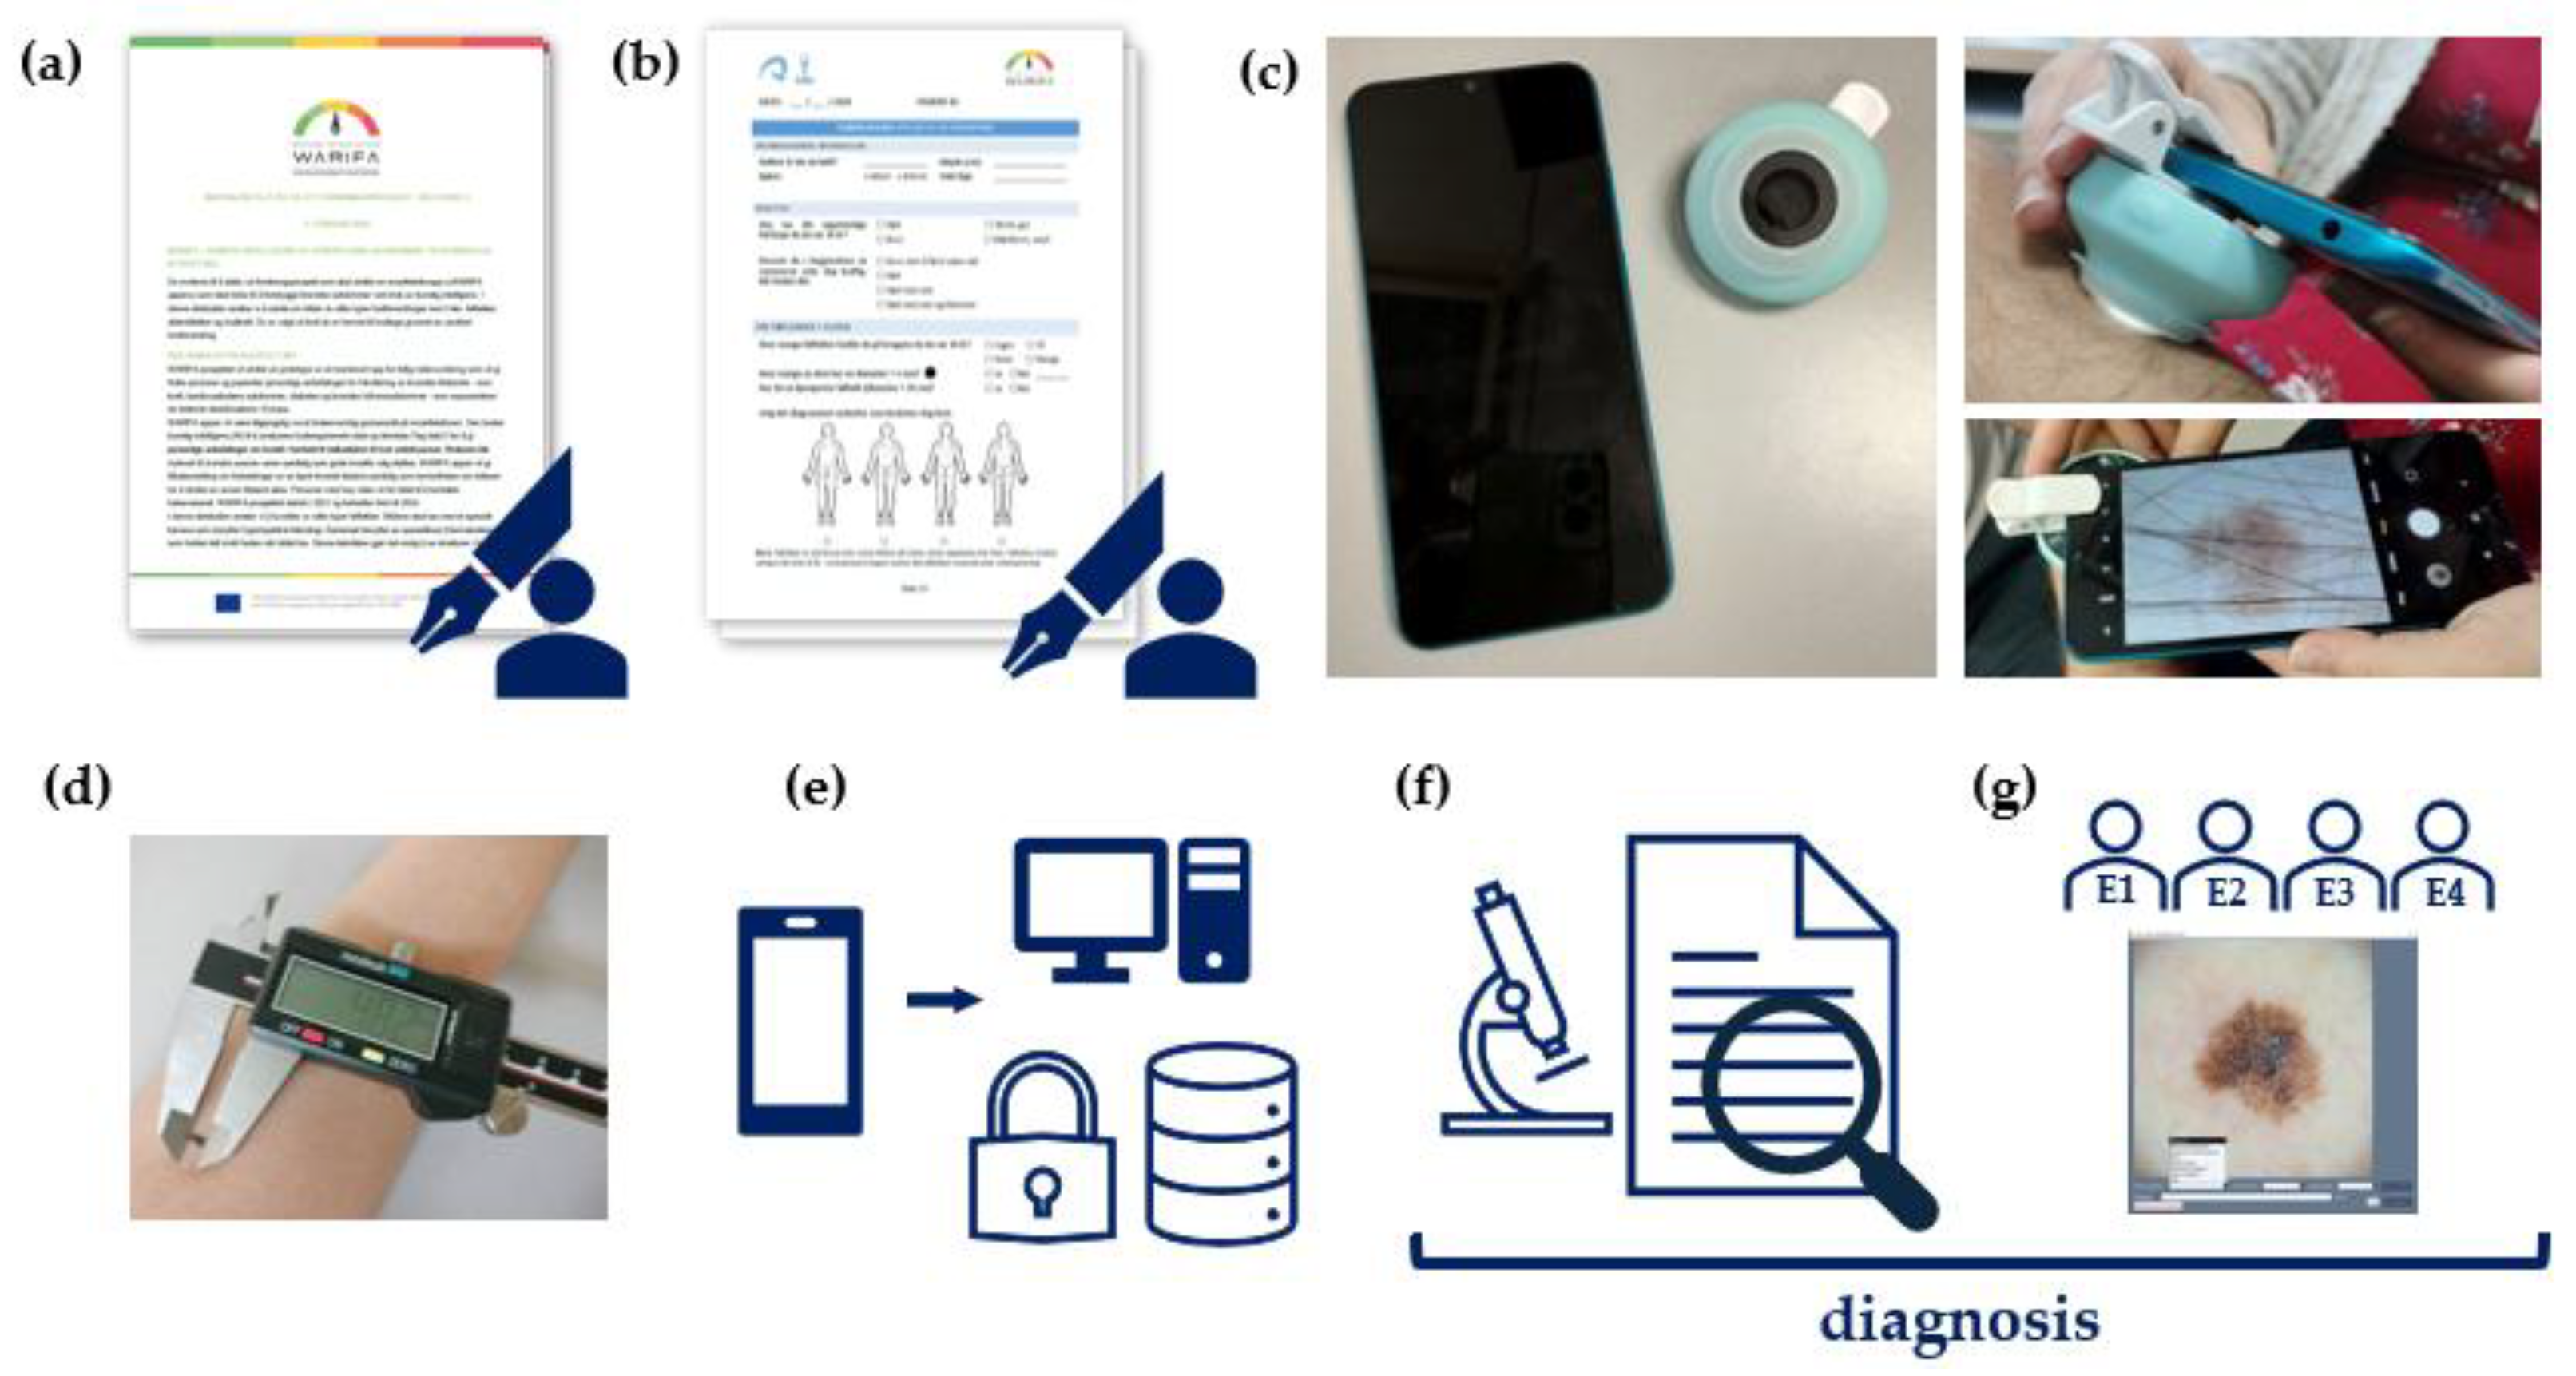
Figure 4.
View of the software interface showing a list of potential diagnoses and certain fields for quantifying the certainty level of the diagnosis, and the image quality and for adding a comment about the image or the lesion.
Figure 4.
View of the software interface showing a list of potential diagnoses and certain fields for quantifying the certainty level of the diagnosis, and the image quality and for adding a comment about the image or the lesion.

Figure 5.
Tie-breaker criterion for the dermatology diagnosis, explained with an example.
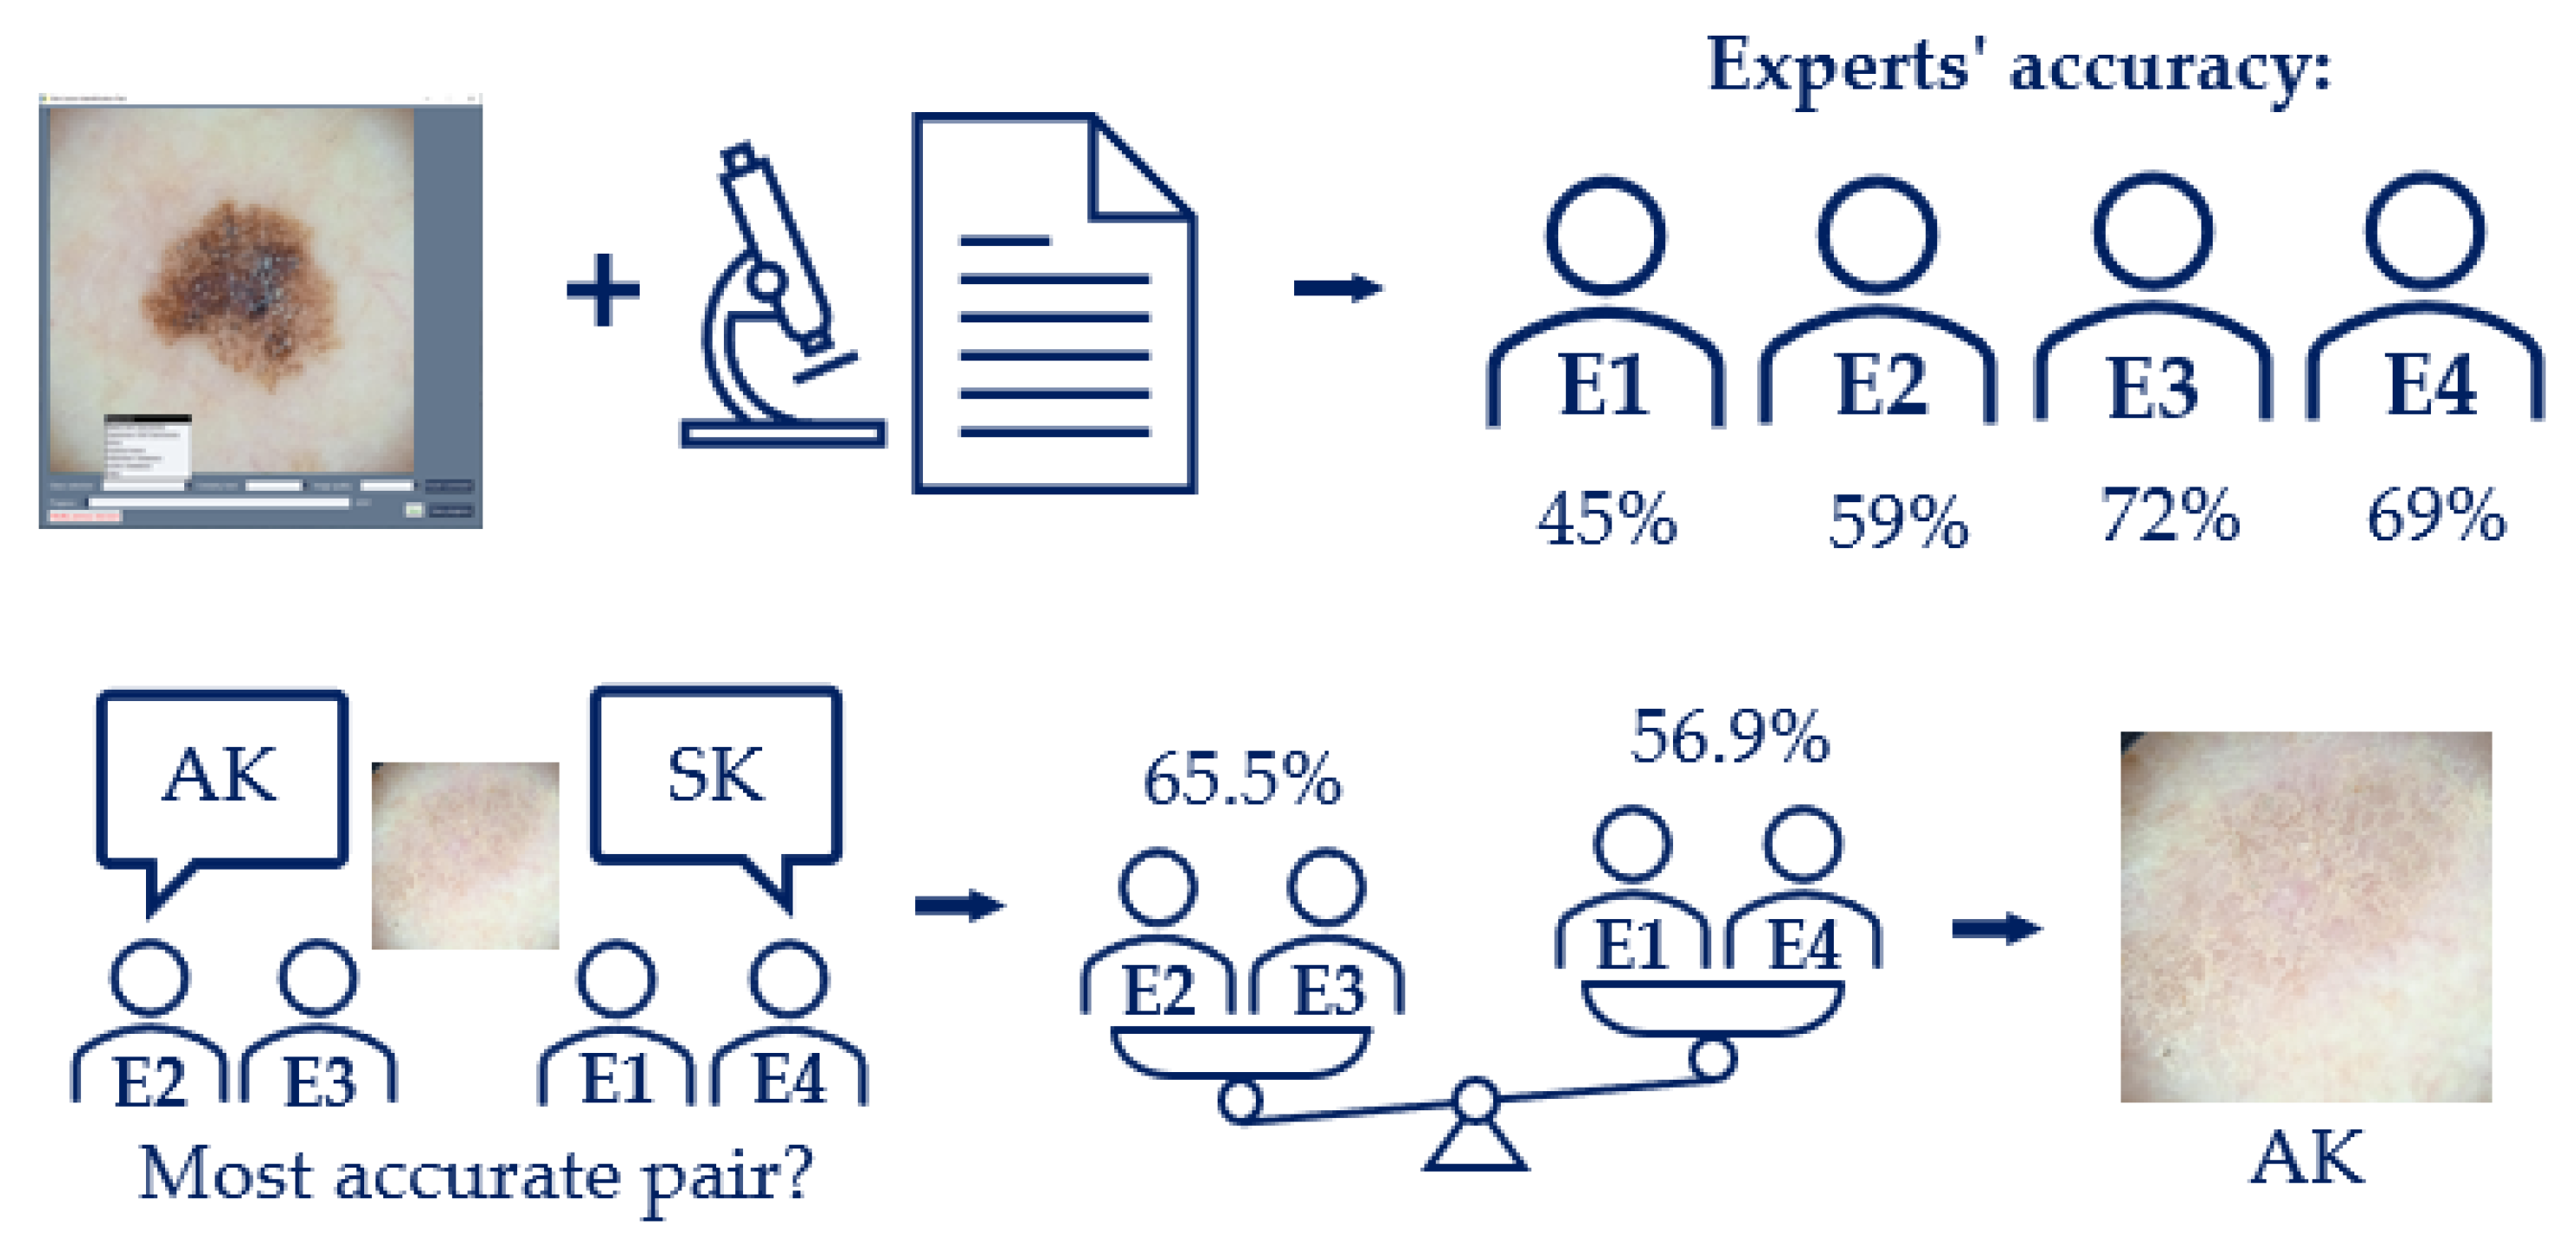
Figure 6.
Unified diagnosis: if the lesion has a diagnosis from histopathology, that is the gold standard. If not, then it is the diagnosis given by the panel of dermatologists.
Figure 6.
Unified diagnosis: if the lesion has a diagnosis from histopathology, that is the gold standard. If not, then it is the diagnosis given by the panel of dermatologists.
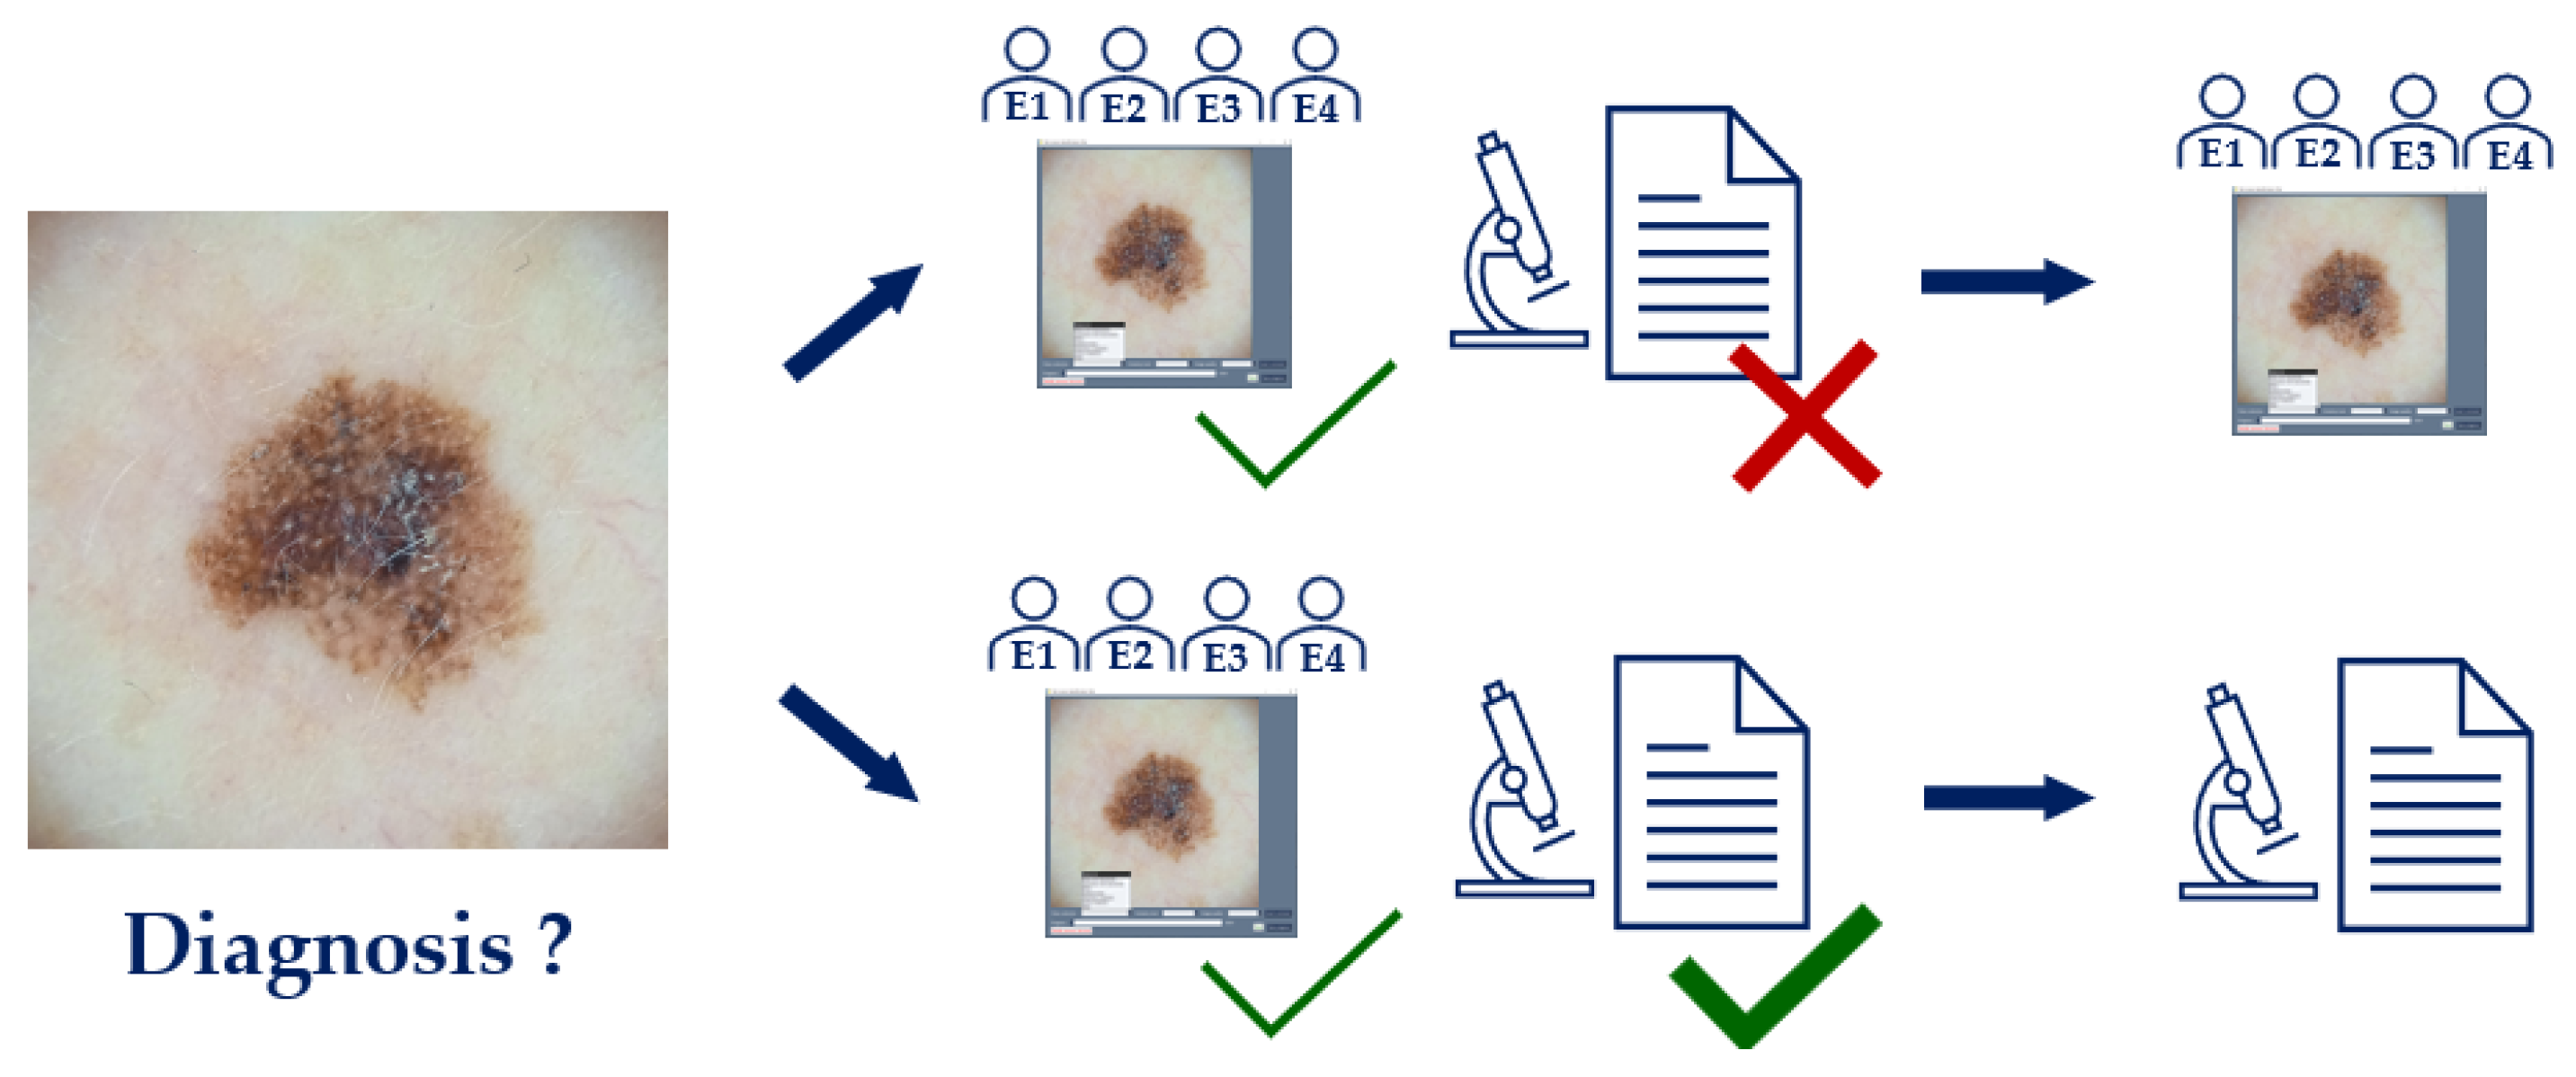
Figure 7.
Data curation and validation workflow.
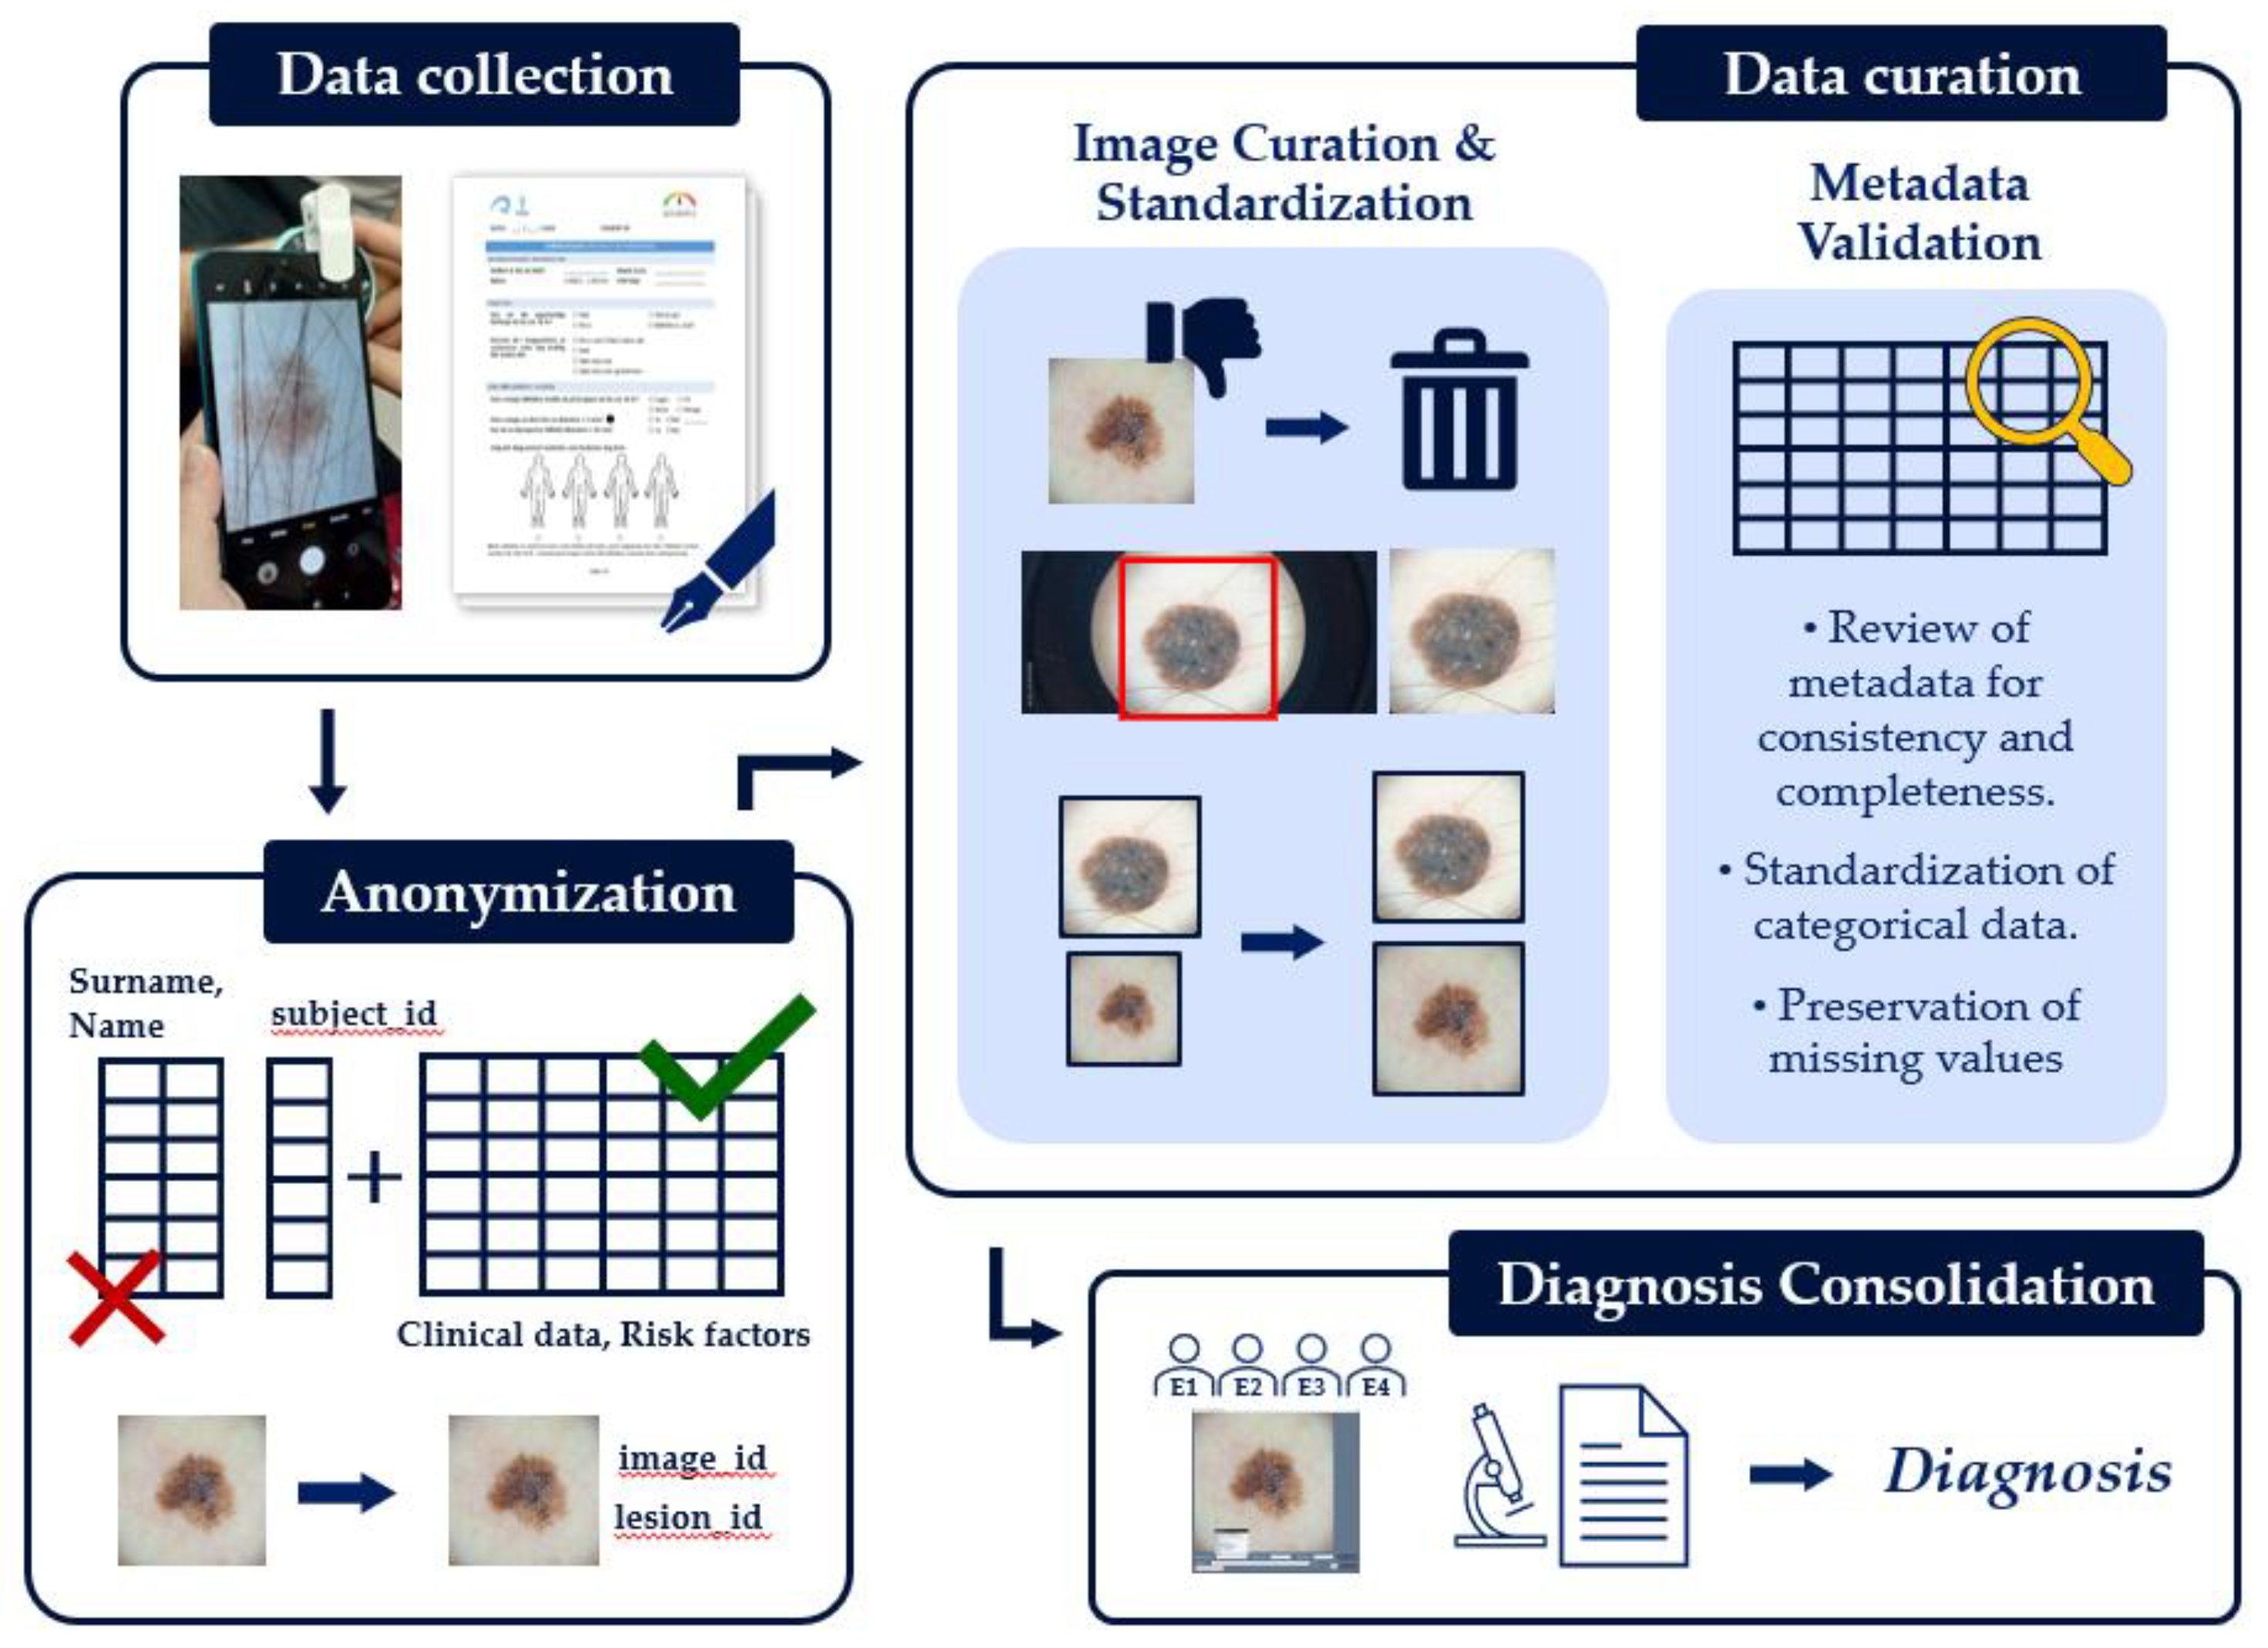
Figure 8.
An example of before (a) and after (b) cropping one of the collected images.
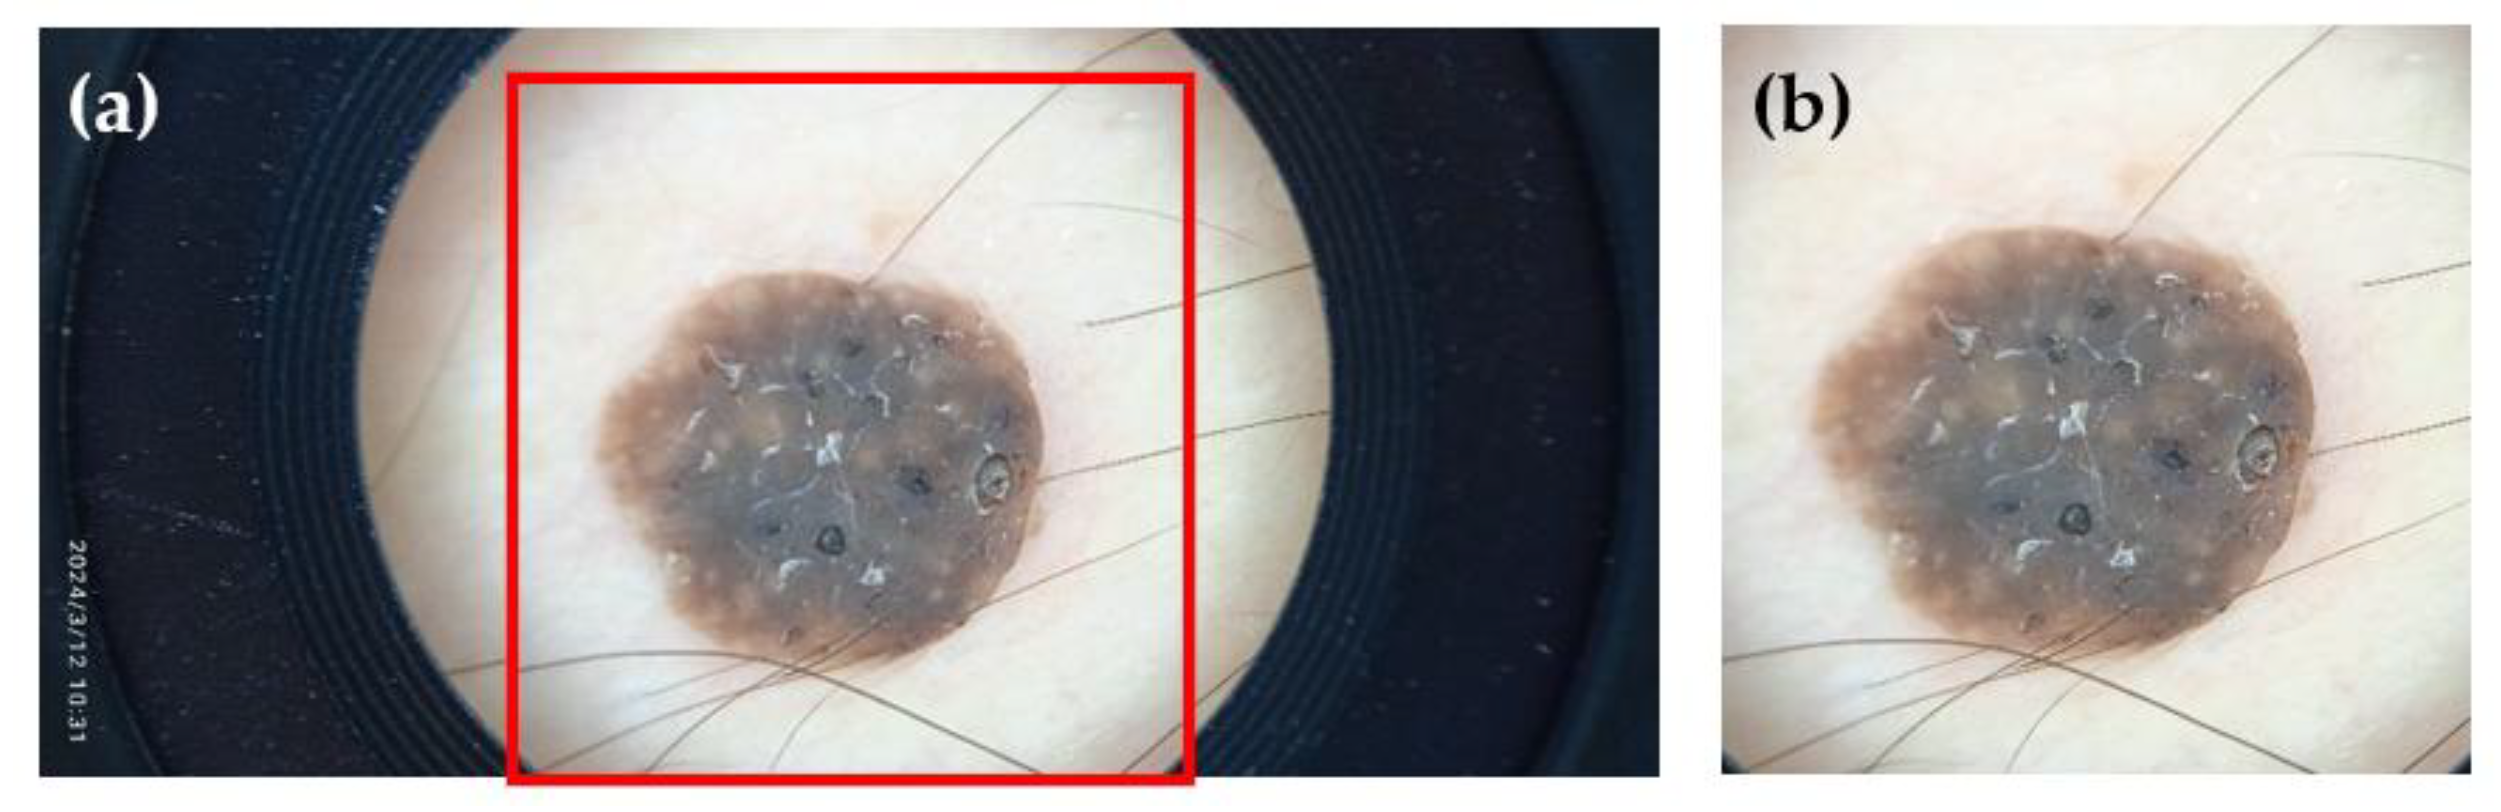

Table 1.
Lesion distribution by unified and histopathological diagnoses. The numbers in parentheses represent the proportion of subjects and lesions out of the total subjects and lesions in the dataset.
Table 1.
Lesion distribution by unified and histopathological diagnoses. The numbers in parentheses represent the proportion of subjects and lesions out of the total subjects and lesions in the dataset.
| Lesion type | Malignancy | Diagnosed by histopathology | Diagnosed by dermatologists | ||
|---|---|---|---|---|---|
| Subjects | Lesions | Subjects | Lesions | ||
| BCC | Malignant | 18 (30.0 %) | 20 (8.3 %) | 18 (30.0 %) | 26 (10.8 %) |
| MEL | Malignant | 3 (5.0 %) | 3 (1.3 %) | 7 (11.7 %) | 8 (3.3 %) |
| SCC | Malignant | 0 (0.0 %) | 0 (0.0 %) | 5 (8.3 %) | 5 (2.1 %) |
| NEV | Non-Malignant | 3 (5.0 %) | 3 (1.3 %) | 37 (61.7 %) | 85 (35.4 %) |
| SK | Non-Malignant | 1 (1.7 %) | 1 (0.4 %) | 34 (56.6 %) | 84 (35.0 %) |
| AK | Non-Malignant | 0 (0.0 %) | 0 (0.0 %) | 10 (16.7 %) | 12 (5.0 %) |
| ATY | Non-Malignant | 2 (3.3 %) | 2 (0.8 %) | 6 (10.0 %) | 7 (2.9 %) |
| ANG | Non-Malignant | 0 (0.0 %) | 0 (0.0 %) | 2 (3.3 %) | 4 (1.7 %) |
| DF | Non-Malignant | 0 (0.0 %) | 0 (0.0 %) | 2 (3.3 %) | 2 (0.8 %) |
| UNK | - | 0 (0.0 %) | 0 (0.0 %) | 6 (10.0 %) | 7 (2.9 %) |
| Total | 27 (45.0 %) | 29 (12.1 %) | 60 (100.0 %) | 240 (100.0 %) | |
Table 2.
Distribution of demographic and clinical attributes in the dataset, including counts and percentages for each category, stratified by lesion malignancy. Chi-squared test p-values indicate the strength of association between each attribute and lesion malignancy. In this table, NM and M stand for Non-malignant and Malignant, respectively.
| Attribute | Values | # | % | # NM | % NM | # M | % M | p-value |
|---|---|---|---|---|---|---|---|---|
| Age | 14.9-40.7 | 8 | 13% | 0 | 0% | 8 | 100% | 0,582 |
| 40.7-66.3 | 23 | 38% | 13 | 57% | 10 | 43% | ||
| 66.3-92.0 | 29 | 48% | 19 | 66% | 10 | 34% | ||
| Sex | Female | 33 | 55% | 12 | 36% | 21 | 64% | 0,008 |
| Male | 27 | 45% | 20 | 74% | 7 | 26% | ||
| Height (cm) | 145.9-162.3 | 14 | 23% | 4 | 29% | 10 | 71% | 0,053 |
| 162.3-178.7 | 27 | 45% | 17 | 63% | 10 | 37% | ||
| 178.7-195.0 | 19 | 32% | 11 | 58% | 8 | 42% | ||
| Weight (kg) | 38.9-66.0 | 19 | 32% | 6 | 32% | 13 | 68% | 0,496 |
| 66.0-93.0 | 32 | 53% | 20 | 62% | 13 | 41% | ||
| 93.0-120.0 | 9 | 15% | 6 | 67% | 4 | 44% | ||
|
Natural hair color (≤ 18 years old) |
Brown | 25 | 42% | 12 | 48% | 13 | 52% | 0,382 |
| Fair blonde | 19 | 32% | 10 | 53% | 9 | 47% | ||
| Dark brown, black | 12 | 20% | 9 | 75% | 3 | 25% | ||
| Red or auburn | 3 | 5% | 1 | 33% | 2 | 67% | ||
| Blonde | 1 | 2% | 0 | 0% | 1 | 100% | ||
| Skin reaction to sun exposure | Red | 29 | 48% | 16 | 55% | 13 | 45% | 0,844 |
| Brown without 1st becoming red | 22 | 37% | 12 | 55% | 10 | 45% | ||
| Red with pain | 9 | 15% | 4 | 44% | 5 | 56% | ||
|
Number of moles (≤ 18 years old) |
Few | 21 | 35% | 14 | 67% | 7 | 33% | 0,065 |
| Some | 18 | 30% | 5 | 28% | 13 | 72% | ||
| Many | 14 | 23% | 8 | 57% | 6 | 43% | ||
| Unknown | 7 | 12% | 5 | 71% | 2 | 29% | ||
| Moles > 5 mm | Yes | 30 | 50% | 14 | 47% | 16 | 53% | 0,361 |
| No | 25 | 42% | 16 | 64% | 9 | 36% | ||
| Unknown | 5 | 8% | 2 | 40% | 3 | 60% | ||
| Moles > 20 cm | No | 60 | 100% | 32 | 53% | 28 | 47% | 1,000 |
|
Number of moles (now) |
Some | 24 | 40% | 9 | 38% | 15 | 62% | 0,133 |
| Few | 22 | 37% | 15 | 68% | 7 | 32% | ||
| Many | 7 | 12% | 3 | 43% | 4 | 57% | ||
| Unknown | 7 | 12% | 5 | 71% | 2 | 29% | ||
| Number of severe sunburns | 0 | 28 | 47% | 14 | 50% | 14 | 50% | 0,617 |
| 1-2 | 13 | 22% | 7 | 54% | 6 | 46% | ||
| 3-5 | 8 | 13% | 3 | 38% | 5 | 62% | ||
| >5 | 3 | 5% | 2 | 67% | 1 | 33% | ||
| Unknown | 8 | 13% | 6 | 75% | 2 | 25% | ||
| Sunbed use | No | 54 | 90% | 29 | 54% | 25 | 46% | 0,218 |
| Yes | 4 | 7% | 1 | 25% | 3 | 75% | ||
| Unknown | 2 | 3% | 2 | 100% | 0 | 0% | ||
| History of cancer | No | 39 | 65% | 17 | 44% | 22 | 56% | 0,073 |
| Yes | 21 | 35% | 15 | 71% | 6 | 29% | ||
| History of skin cancer | No | 41 | 68% | 19 | 46% | 22 | 54% | 0,102 |
| Yes | 15 | 25% | 9 | 60% | 6 | 40% | ||
| Unknown | 4 | 7% | 4 | 100% | 0 | 0% | ||
| History of skin cancer (close relatives) | No | 50 | 83% | 25 | 50% | 25 | 50% | 0,418 |
| Yes | 10 | 17% | 7 | 70% | 3 | 30% | ||
| Organ transplant | No | 57 | 95% | 30 | 53% | 27 | 47% | 0,234 |
| Yes | 2 | 3% | 2 | 100% | 0 | 0% | ||
| Unknown | 1 | 2% | 0 | 0% | 1 | 100% | ||
|
Immunosuppression |
No | 54 | 90% | 30 | 56% | 24 | 44% | 0,448 |
| Yes | 5 | 8% | 2 | 40% | 3 | 60% | ||
| Unknown | 1 | 2% | 0 | 0% | 1 | 100% | ||
| Patients derived from | Plastic surgery | 35 | 58% | 20 | 57% | 15 | 43% | 0,040 |
| Dermatology | 17 | 28% | 11 | 65% | 6 | 35% | ||
| Volunteer | 8 | 13% | 1 | 12% | 7 | 88% | ||
| Malignant lesions | yes | 32 | 53% | |||||
| no | 28 | 47% |
Table 3.
Attributes of the Lesion entity.
| Attribute | Data type | Description |
|---|---|---|
| lesion_id | string | A unique identifier for the lesion. |
| referral_diagnosis | text | The initial diagnosis provided during the subject's referral. |
| lesion_status_when_captured | categorical | The status of the lesion at the time of imaging. |
| location | categorical | The anatomical location of the lesion on the subject's body. |
| location_group | categorical | A broader classification of the lesion's location. |
| diameter | numerical | The measured diameter of the lesion in millimeters. |
| malignancy | categorical | The malignancy status of the lesion (i.e., malignant, non-malignant). |
| lesion_diagnosis | text | The unified diagnosis assigned to the lesion. |
| diagnosis_image_id | string | The unique identifier of the specific image used by the dermatologists to make their diagnoses. |
Table 4.
Attributes of the Subject entity.
| Attribute | Data type | Description |
|---|---|---|
| subject_id | string | A unique identifier for the subject. |
| derived_from | categorical | The hospital's department that derived the subject. |
| year_of_birth | integer | The subject's year of birth. |
| age | integer | The subject's age. |
| sex | categorical | The subject's sex. |
| height | numerical | Subject height in centimeters. |
| weight | numerical | Subject weight in kilograms. |
| natural_hair_color | categorical | The subject's natural hair color at 18 years old. |
| skin_reaction_to_sun | categorical | How the subject's skin reacts to sun exposure without sun protection. |
| number_of_moles | integer | The total number of moles on the subject at 18 years old. |
| moles_bigger_5mm | integer | Current number of moles larger than 5mm. |
| moles_bigger_20cm | integer | Current number of moles larger than 20cm. |
| moles_body | integer | Current number of moles on the body. |
| sunburn_number | integer | The number of severe sunburns the subject has experienced. |
| sunburn_age | text | The age at which the subject experienced severe sunburns. |
| sunburn_number_group | categorical | A categorized group for the number of sunburns. |
| sunbed | boolean | Whether the subject has used a sunbed. |
| h_cancer | boolean | History of hereditary cancer. |
| h_skin_cancer | boolean | History of hereditary skin cancer. |
| h_skin_cancer_relatives | boolean | History of skin cancer in close relatives. |
| organ_transplant | boolean | Whether the subject has had an organ transplant. |
| immunosuppresion | boolean | Whether the subject is on immunosuppressive medication. |
Table 5.
Attributes of the Image entity.
| Attribute | Data type | Description |
|---|---|---|
| image_id | string | A unique identifier for each image. |
| lesion_id | string | A unique identifier for the lesion depicted in the image. |
| modality | categorical | The modality of the image (clinical or dermoscopic). |
Table 6.
Attributes of the Dermatology diagnosis entity.
| Attribute | Data type | Description |
|---|---|---|
| diagnosis_id | string | A unique identifier for each diagnosis. |
| lesion_id | string | The identifier of the lesion the diagnosis refers to. |
| image_id | string | The identifier of the image that was diagnosed. |
| expert_id | string | The identifier of the dermatologist who provided the diagnosis. |
| diagnosis | string | The primary diagnosis provided by the expert (e.g., NEV, MEL). |
| 2nd_option | string | An optional second choice or differential diagnosis. |
| certainty | categorical | A numerical rating of the expert's confidence in their diagnosis. Potential values are 0%, 25%, 50%, 75%, and 100%. |
| image_rating | integer | The expert's rating of the image quality, ranging from 1 to 10. |
| time | datetime | The time taken by the expert to provide the diagnosis. |
Table 7.
Attributes of the Histopathology diagnosis entity.
| Attribute | Data type | Description |
|---|---|---|
| diagnosis_id | string | A unique identifier for each histopathology diagnosis. |
| lesion_id | string | The identifier of the lesion the diagnosis refers to. |
| procedure | string | The type of procedure described in the report (e.g., biopsy, excision). |
| tumor_thickness | float | The Breslow thickness of the tumor, if applicable. |
| diagnosis | string | The final diagnosis from the histopathology report (e.g. NEV, MEL). |
Table 8.
Attributes of the Unified diagnosis entity.
| Attribute | Data type | Description |
|---|---|---|
| diagnosis_id | string | A unique identifier for the unified diagnosis. |
| lesion_id | string | The identifier of the lesion the diagnosis refers to. |
| dermatology_diagnosis | string | The final diagnosis selected by the dermatology experts. |
| histopathology_diagnosis | string | The diagnosis from the histopathology report, used as the ground truth when available. |
| diagnosis_id_histopath | string | The unique identifier of the histopathological diagnosis of the lesion. |
| unified_diagnosis | string | The final ground truth diagnosis for the lesion. |
Disclaimer/Publisher’s Note: The statements, opinions and data contained in all publications are solely those of the individual author(s) and contributor(s) and not of MDPI and/or the editor(s). MDPI and/or the editor(s) disclaim responsibility for any injury to people or property resulting from any ideas, methods, instructions or products referred to in the content. |
© 2025 by the authors. Licensee MDPI, Basel, Switzerland. This article is an open access article distributed under the terms and conditions of the Creative Commons Attribution (CC BY) license (http://creativecommons.org/licenses/by/4.0/).
Copyright: This open access article is published under a Creative Commons CC BY 4.0 license, which permit the free download, distribution, and reuse, provided that the author and preprint are cited in any reuse.


