Submitted:
06 September 2025
Posted:
08 September 2025
You are already at the latest version
Abstract
Crop diseases remain a threat to the world's food security with yield loss ranging from 10–40% annually. The last few years have witnessed spectacular evolution in artificial intelligence (AI), deep learning, Internet of Things (IoT), and unmanned aerial vehicles (UAVs), which transformed crop disease monitoring and early detection of diseases. Earlier image processing methods are now overpowered by convolutional neural networks (CNNs), object detectors such as the YOLO family, and CNN-transformer hybrids, which are significantly more accurate and robust. At the same time, IoT sensors and UAV-based multispectral imaging provide complementary environmental and spectral information for enabling active monitoring irrespective of visible indicators. But there are some limitations they have, which are poor model generalization when trained from human-annotated datasets, expensive computation in field deployment, lack of rich plentiful annotated data for low-frequency diseases, and challenging adoption in smallholder farming settings.Here, the three areas of crop health monitoring system development are critically evaluated as follows: (i) image-based systems, (ii) deep learning models, and (iii) multimodal integration of UAV and IoT. Critical comparative performance, strength, and weakness of current methods are analyzed, highlighting dataset heterogeneity, detection accuracy, scalability, and practicability of deployment. Additionally, the review reveals the key deficits in the research—i.e., necessity for robust multimodal fusion paradigms, conventional benchmarking, and affordable field solutions—and suggests likely future directions such as federated learning, predictive outbreak modeling, and robotics for targeted intervention. Synthesizing current success and pointing toward likely future research directions, this review seeks to inform researchers and practitioners toward sustainable, tech-enabled crop disease management.
Keywords:
deep learning
; IoT
; precision agriculture
; smart farming
; UAV
Introduction
Agriculture is still the foundation of global food security, producing food for billions of people across the globe. However, farmers of the present day have to deal with challenges that are new. Plant diseases, pests, and climate fluctuation all pose threats to agriculture production, with plant diseases alone responsible for 10–40% of world yield loss annually. These losses not only create direct economic expenses for farmers but also compromise the capacity to fulfil dietary requirements of an increasing world population. Traditional crop management tactics—reliant on manual scouting and visual detection—are very time consuming, labour intensive, and prone to late detection. Such delayed applications have the likelihood of leading to unnecessary overuse of pesticides, loss of soil nutrients, and enormous yield loss, and thus play a role towards unsustainable agriculture.
In order to counter these problems, precision agriculture has become ever more reliant on sophisticated technologies such as Artificial Intelligence (AI), Internet of Things (IoT), and Unmanned Aerial Vehicles (UAVs).
AI and deep learning have been reported in prior studies to achieve high accuracy in disease detection, often exceeding 95% under laboratory conditions. Convolutional Neural Networks (CNNs) and YOLO-based object detectors are used heavily to identify visible symptoms in plant images.
IoT sensors offer real-time monitoring of soil moisture, pH, temperature, humidity, and leaf wetness, all of which can be used as early warning signals for disease-susceptible conditions.
RGB and multispectral camera-equipped UAV platforms have also offered high-resolution aerial photography, presenting vegetation indices like NDVI and EVI that are capable of identifying crop stress before its symptoms can be observed visually.
Despite these innovations, three primary restrictions are still unsolved in current systems:
Limited Generalization: Machine learning algorithms that have been trained on carefully selected sets like PlantVillage perform poorly in actual field conditions because of noise, varying light, crop heterogeneity, and background noise.
Narrow Scope: Most of the existing approaches are designed for single crops or single diseases with sole emphasis on either image-based or sensor-based observation, making their adaptation to varied cropping systems impossible.
Adoption Barriers: Practical deployment is hindered by the high computational demands of deep learning models, unstable rural connectivity, and the cost of UAV and IoT deployments. These factors restrict adoption among smallholder farmers who represent the majority of producers worldwide.
To overcome such challenges, the system employs YOLOv11 augmented with transformer-based attention mechanisms for accurate real-time detection of even minute and nascent lesions. Unlike common image-only systems, this platform offers a new
Composite Health Index (CHI), which integrates:
- YOLOv11 detection outcomes,
- vegetation indices (NDVI, EVI, NDWI),
- morphological characteristics (leaf perimeter, area),
- texture descriptors (GLCM, LBP).
This multimodal fusion produces a coherent, single-score representation of crop health. Several studies have explored hybrid edge-cloud architecture, where lightweight devices such as Jetson Nano at 5–7 FPS, and cloud servers maintain large-scale data and retrain models. Farmers receive insights through simple-to-use mobile and web dashboards, offering health heatmaps, decision support, and multilingual voice notifications—offering accessibility even in rural settings.
This review contributes by:
- Design of a multimodal crop health monitoring system that integrates UAV images, IoT sensor readings, and deep learning analytics.
- Building of YOLOv11 with transformer-based attention mechanisms, which is specifically targeted at detecting small lesions in heavy field conditions in real time.
- Developing the Composite Health Index (CHI), an integrated measure that combines vegetation indices, morphological and texture characteristics and AI predictions.
- Implementation of a hybrid edge–cloud deployment paradigm, enabling real-time on-field usage and cloud-scale processing.
- Past field studies have referenced improvements such as reduced usage of pesticides, improved scouting effectiveness, and less yield loss when AI-IoT-UAV systems were used.
By integrating AI, IoT, and UAV-based monitoring, this research contributes to the promotion of the ideals of smart and sustainable farming. Not only does the system minimize dependence on reactive strategies, but it also assists farmers in making data-driven, actionable choices—lead them towards maximized use of resources, safeguarding yields, and promoting agricultural sustainability in the face of climate change and increasing food demands.
Related Work
The development of automated crop health monitoring has taken a worldwide path but is more and more influenced by region-specific needs and innovations. In India, with the prevalence of smallholder agriculture, scientists have aimed to transform state-of-the-art AI, IoT, and UAV technology to cost-sensitive, resource-constrained environments. This section critically overviews previous research in chronological and categorical order, juxtaposing international advancements with Indian work, and underlining gaps pertaining to extant frameworks.
- Early Image Processing Methods (2000–2012)
Early disease detection systems across the world were based on conventional image processing methods, depending on shape, color, and texture descriptions. The major algorithms were Otsu thresholding, K-means clustering, GLCM texture, and edge-based segmentation algorithms that were commonly applied [10,31]. The systems had fair accuracy (70–85%) in well-controlled laboratory environments.
Indian Contributions:
In IARI (Indian Agricultural Research Institute), initial digital pathology work was on rice and wheat rusts, using HSV color space analysis to distinguish between rust spots and green tissue. TNAU (Tamil Nadu Agricultural University) tried rule-based lesion segmentation in groundnut and cotton. Limitations seen in Indian research were sensitivity to field noise (dust, changing sunlight, overlapping leaves) and crop-dependent tuning, so they were not amenable to general adoption.
Relevance: These approaches presented the idea of computational diagnosis but were not robust in the highly variable Indian agro-climatic conditions.
- 2.
- CNN-Based Disease Classification (2012–2017)
The computer vision revolution with deep learning soon touched agriculture after AlexNet (2012). Convolutional Neural Networks (CNNs) learned from big image datasets performed better than handcrafted features for crop disease detection.
Worldwide, works with PlantVillage dataset reported accuracies greater than 95%, particularly for tomato, potato, and maize diseases [12,25].
Indian scientists also adopted CNNs:
ICAR-Central Institute for Cotton Research (CICR), Nagpur applied CNNs to identify cotton leaf curl virus with more than >90% accuracy in the laboratory. Punjab Agricultural University (PAU) employed CNNs in wheat yellow rust identification with the potential for precision spraying.
IIT Kharagpur deployed CNN pipelines for detection of rice blast, one of India’s most destructive paddy diseases.
Indian Context Limitations:
- Models were only trained on lab-captured or mobile photos, not UAV field imagery.
- High accuracy was dataset-specific and did not hold up under actual farm variation.
- No publicly available, India-specific datasets hindered generalization.
- While CNN-based systems gave the first proof that AI might revolutionize Indian crop monitoring, they identified the lab-to-field gap.
- 3.
- Real-Time Object Detection (YOLO Family, 2018–2022)
Object detection algorithms like YOLO (You Only Look Once) and SSD (Single Shot Detector) were the game changers to enable real-time localisation of disease rather than mere classification.
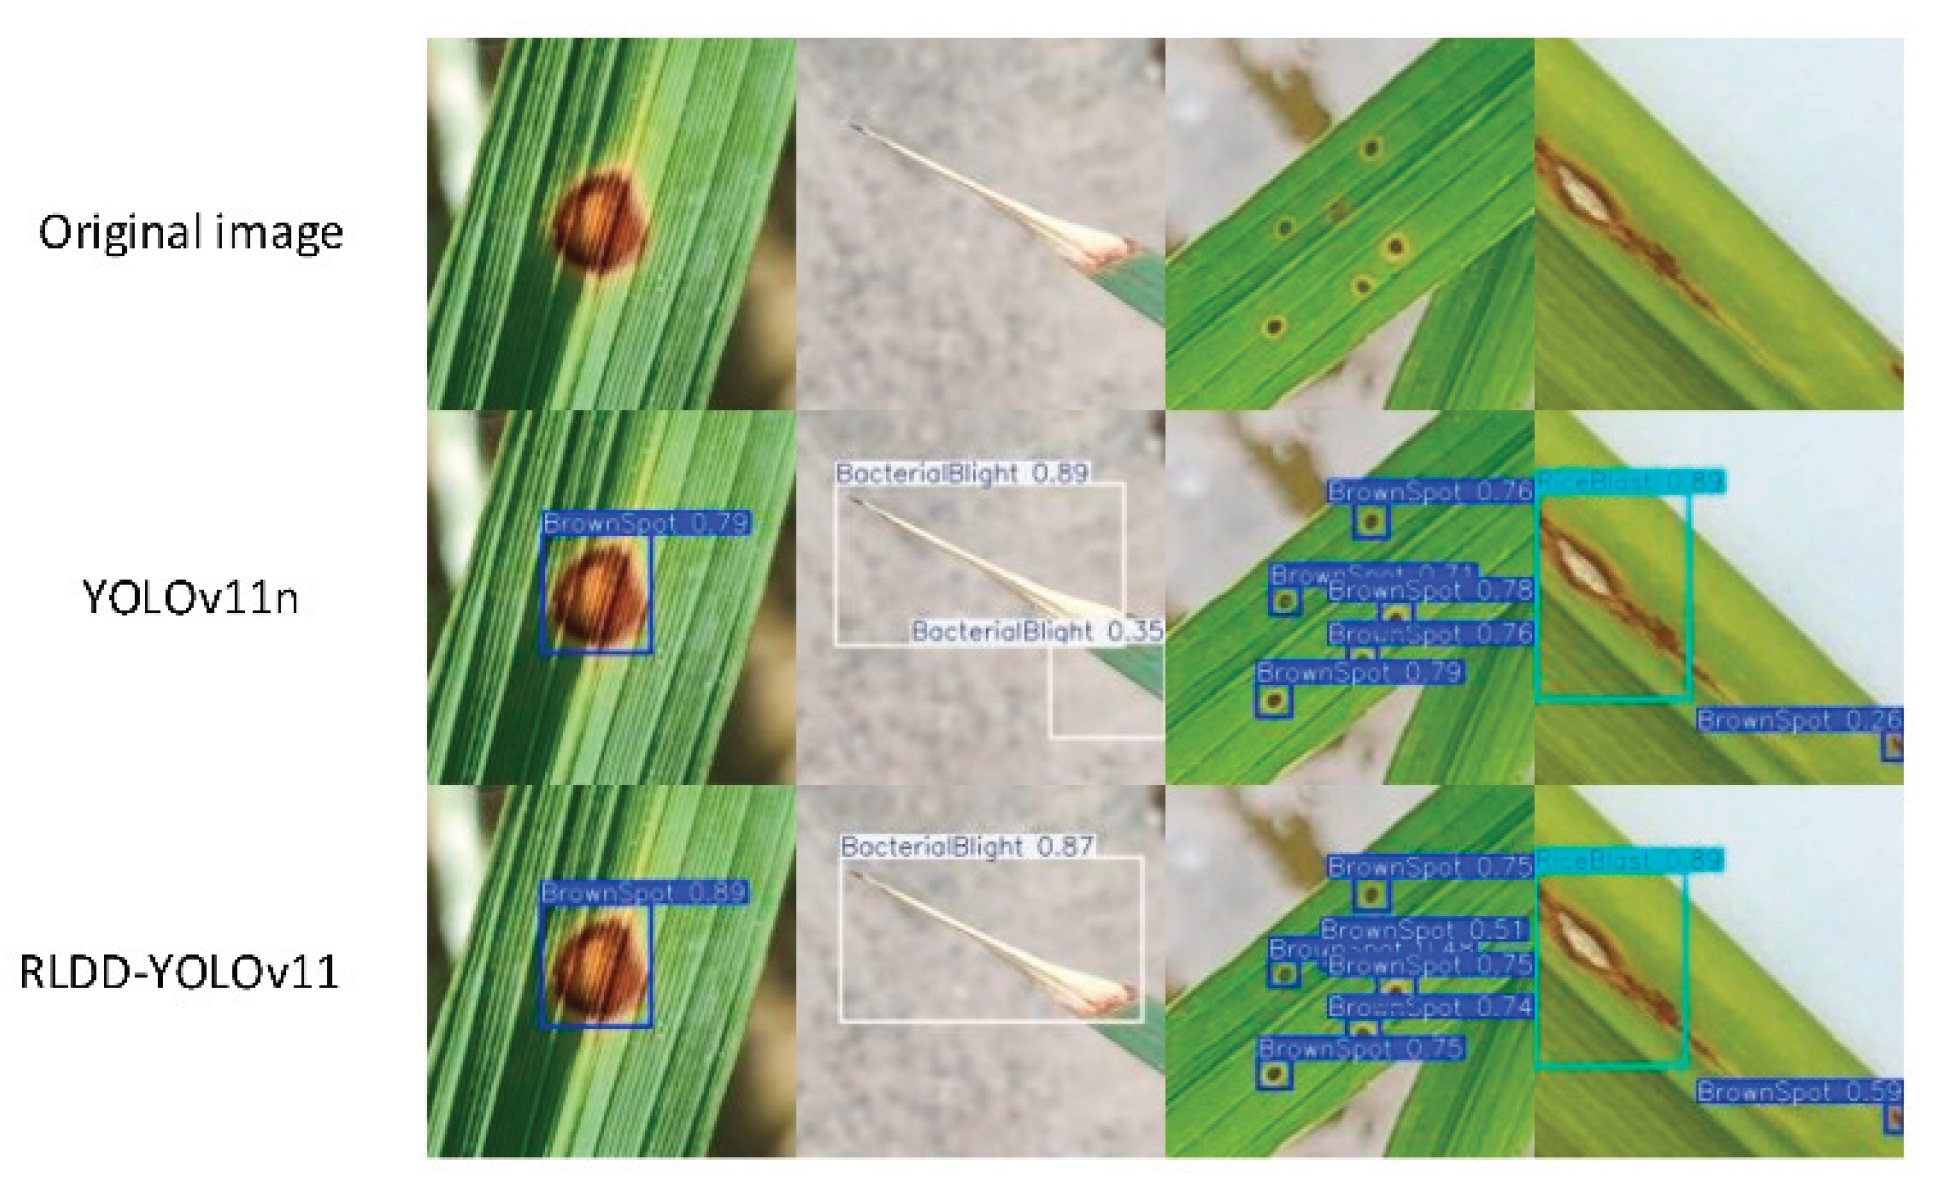
Figure 1.
[41] compared YOLOv11n and RLDD-YOLOv11 for rice leaf diseases, reporting improved bounding box localization and confidence scores.
Figure 1.
[41] compared YOLOv11n and RLDD-YOLOv11 for rice leaf diseases, reporting improved bounding box localization and confidence scores.
Worldwide, YOLOv3–YOLOv5 showed strong performance in UAV-based systems, identifying lesions and stress areas over crops [26].
In India:
ICAR-NBAIR (National Bureau of Agricultural Insect Resources), Bengaluru used YOLO for detecting pest-affected areas of horticultural crops.
IIT Roorkee combined YOLO with UAV imagery for rice blast disease detection, achieving ~92% accuracy in actual field conditions.
Mahatma Phule Krishi Vidyapeeth (MPKV), Rahuri evaluated low-cost UAVs to detect grape downy mildew, thereby combining YOLO with multispectral sensing.
Challenges:
YOLO models needed GPU acceleration, which was commonly not accessible to smallholder farmers. UAV data in India were also constrained by factors like DGCA regulations, rural connectivity, and battery drain due to high temperatures.
Relevance: InReal-time YOLO pipelines moved disease detection nearer to on-field deployment in Indian environments, albeit the demands for resources acted as a bottleneck.
- 4.
- Hybrid CNN–Transformer Architectures (2022–Present)
Current developments worldwide integrate CNN feature extraction with Transformer-based attention mechanisms, providing more detailed recognition under occlusion, variable light, and background clutter. Worldwide, [6] have shown that CNN–Transformer hybrids outperform stand-alone CNNs at classifying leaf spot diseases.
Figure 2.
[41] Comparison of feature activation heatmaps between YOLOv11n and RLDD-YOLOv11 for rice leaf disease detection.
Figure 2.
[41] Comparison of feature activation heatmaps between YOLOv11n and RLDD-YOLOv11 for rice leaf disease detection.
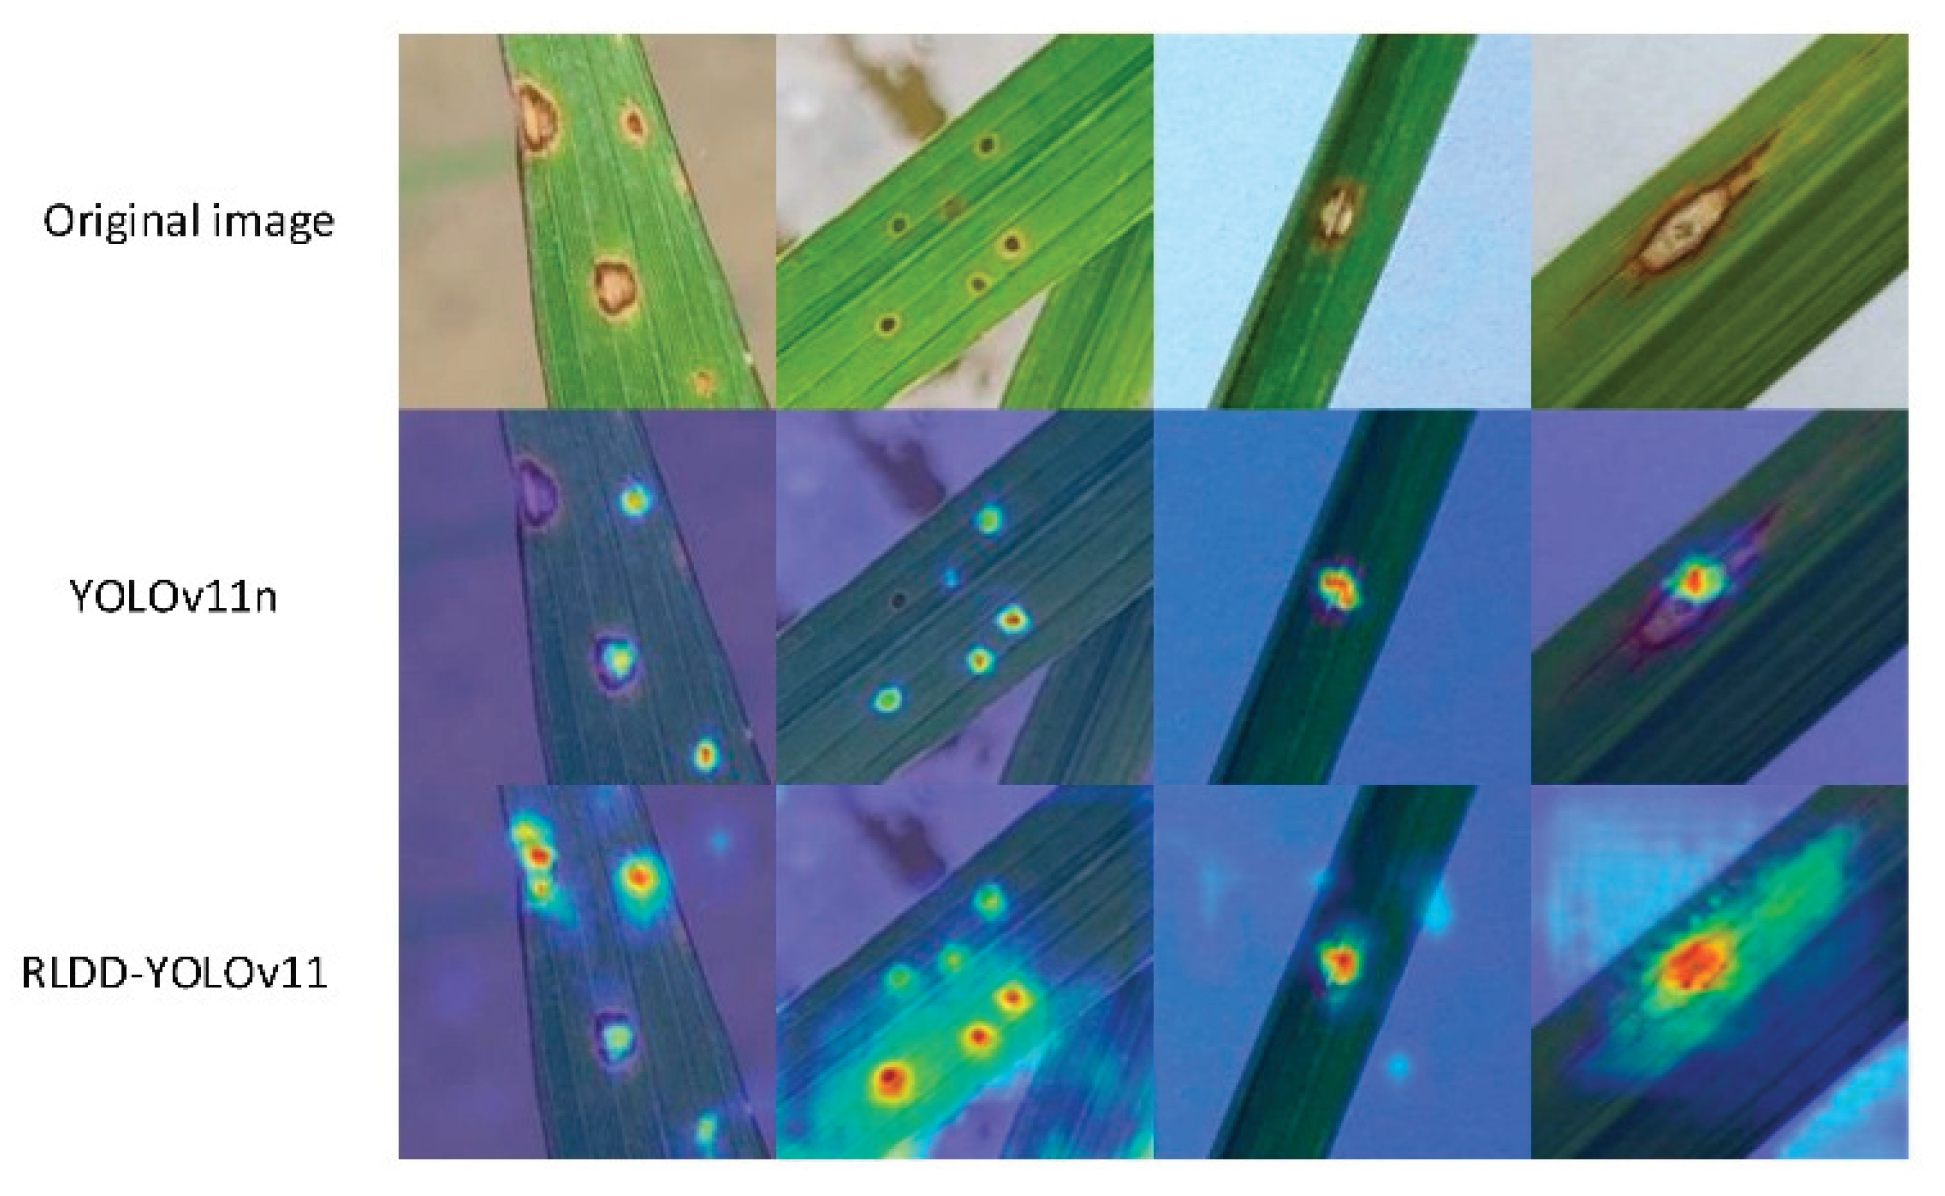
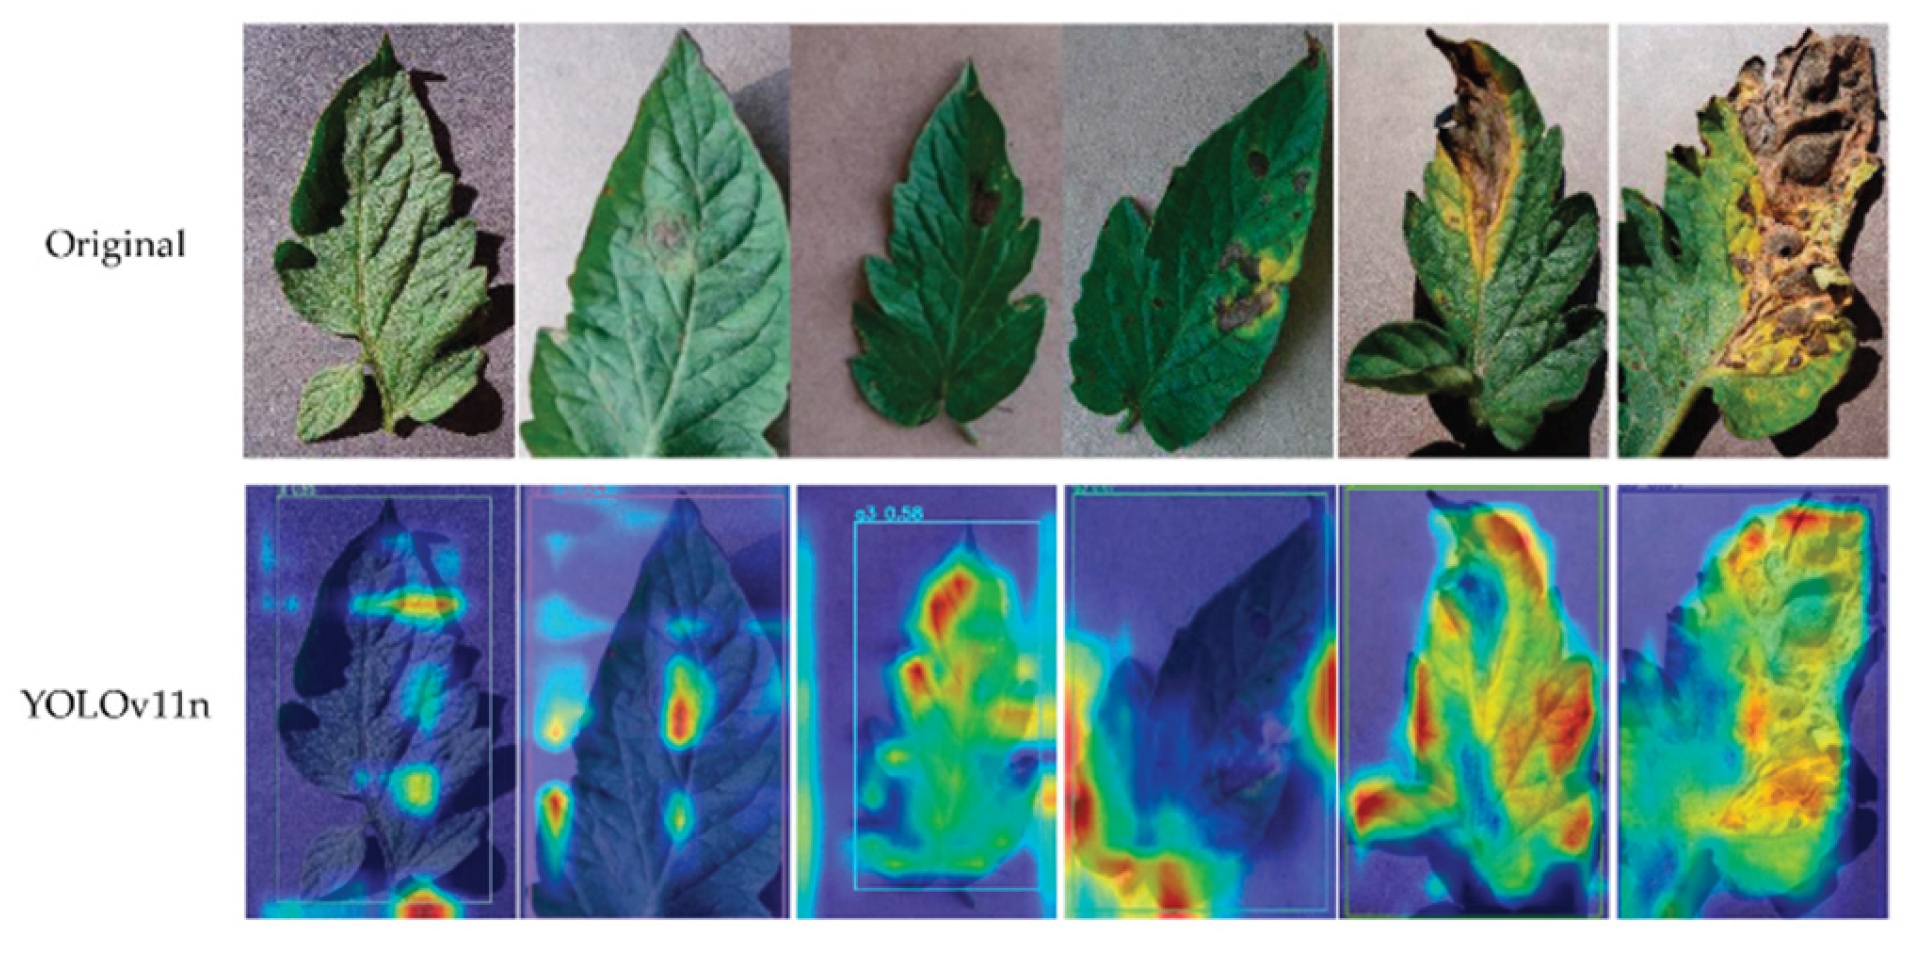
Figure 3.
[42] Tomato leaf disease detection using YOLOv11n with Grad-CAM visualization. The heatmaps highlight regions of interest where lesions are localized, illustrating YOLO’s advantage in real-time object detection compared to CNN-based classifiers.
Figure 3.
[42] Tomato leaf disease detection using YOLOv11n with Grad-CAM visualization. The heatmaps highlight regions of interest where lesions are localized, illustrating YOLO’s advantage in real-time object detection compared to CNN-based classifiers.
In India:
IIT Madras tested hybrid CNN–Transformer models on sugarcane mosaic virus, outperforming CNN models by ~6–8%. IIT Kanpur created a Vision Transformer-based classifier across several pulses (chickpea, pigeon pea) with poor transferability of traditional CNNs.
Limitations in India:
Transformer architectures require high memory and computational power, frequently incompatible with farmer-deployable hardware.
Annotation burden: Creating large labeled datasets across India’s diverse agro-climates is manpower-intensive.
Relevance: Such models realize state-of-the-art performance but require porting to light, edge-capable versions for Indian agriculture.
- 5.
- IoT and UAV-Based Remote Sensing (2018–Present)
Though computer vision offers visible symptom analysis, IoT and UAV-based remote sensing push monitoring further to pre-symptomatic stress detection.
UAV Multispectral Imaging (NDVI, EVI, NDWI):
Internationally, NDVI-based UAV research identified stress in maize and soybean prior to visible symptoms.
In India, ICAR-NRSC (National Remote Sensing Centre) incorporated UAV-based multispectral indexes for stress mapping of rice and groundnuts.
Anand Agricultural University (AAU), Gujarat applied drones for pest hotspot detection in cotton, allowing precision spraying with pesticides.
IoT Sensor Networks:
IIT Bombay experimented with IoT-based soil–climate monitoring for onion fields, incorporating humidity and soil moisture for forecasting fungal diseases. VNMKV Parbhani (Maharashtra) experimented with IoT weather sensors to predict outbreaks of turmeric leaf spot disease. Kerala Agricultural University (KAU) incorporated IoT soil pH + leaf wetness sensors for cardamom fungal disease prediction.
Fusion of IoT + UAV:
Few Indian studies engage in complete multimodal fusion. An IIT Hyderabad pilot project fused UAV images with IoT weather sensors for chilli leaf curl detection, but cost capped scalability.
Relevance: UAV + IoT integration is highly relevant to Indian requirements but is hindered by connectivity gaps (rural internet), costs, and maintenance issues.
- 6.
- Comparative Insights (India vs Global)
Category Global Status Indian Contributions Limitations in India Image Processing (2000–2012) Color/texture segmentation, lab success IARI (wheat rust), TNAU (groundnut) Poor generalization in diverse agro-climates CNN Classification (2012–2017) >95% accuracy in PlantVillage dataset. CICR (cotton), PAU (wheat rust), IIT-KGP (rice blast). Dataset bias, no UAV integration YOLO Detection (2018–2022) Aerial real-time UAV lesion detection ICAR-NBAIR (pests), IIT Roorkee (rice blast), MPKV (grapes) GPU requirements, UAV regulation CNN–Transformer (2022–2025) Fine-grained accuracy through attention IIT-M (sugarcane), IIT-K (pulses) Compute requirements, cost of annotation IoT + UAV (2018–Present) Fusion to detect stress ICAR-NRSC (rice stress), AAU (cotton pests), IIT-B (onion IoT) Connectivity, affordability, scalability.
- 7.
- Research Gaps (India-Specific)
Based on the combined review, following India-specific research gaps are inferred:
- Gap in Transferability: All models perform well in constrained sets, but perform poorly in heterogeneous Indian fields where lighting, background clutter, and mixed cropping prevail.
- Gap in Affordability: Capable YOLO and Transformer models need costly GPUs, out of reach for Indian small farmers.
- Gap in Data: Large-scale labeled public crop disease datasets, particularly UAV-based ones, are not available in India.
- Integration Gap: There are very few Indian systems that integrate IoT + UAV + AI into a real-time deployable solution by farmers.
- Policy/Infrastructure Gap: UAV operation in India is restricted under DGCA norms, battery life in hot temperatures, and low rural connectivity.
- 8.
- Comparative Summary of Key Approaches

Table 1.
Comparative Review of Deep Learning Models of Crop Health Monitoring and Disease Detection.
Table 1.
Comparative Review of Deep Learning Models of Crop Health Monitoring and Disease Detection.
| Study / Model | Data Type | Methodology | Strengths | Limitations |
|---|---|---|---|---|
| Pooja et al. (2017) [31] | RGB leaf images | Image processing (color/shape) | Simple, low-cost | Poor generalization, noise-sensitive |
| Agarwal et al. (2019) [12] | RGB leaf images | CNN classifier | High accuracy (>95%) | Controlled datasets only |
| Qi et al. (2022) [26] | Tomato leaf images | Improved YOLOv5 + attention | Real-time detection, robust | Needs large annotated datasets |
| Islam et al. (2023) [6] | Web + mobile images | DeepCrop (CNN + Transformer) | Accessible, high precision | Limited multi-crop support |
| Ngugi et al. (2024) [13] | IoT + UAV multispectral | ML/DL fusion models | Early detection, multi-source data | Expensive sensors, rural adoption issues |
| Sharma et al. (2024) [18] | Multi-weed datasets | YOLOv8–YOLOv11 comparison | YOLOv11 best for small lesions | High training cost, limited trials |
Materials and Methods
Typically, experimental workflow in recent researches involve UAV-based aerial imagery, Gaussian filtering, histogram equalization), and deep learning models such as YOLOv11 for feature extraction and classification Important features like colour indices, morphological features, texture patterns (using GLCM and LBP), and spectral vegetation indices like NDVI, EVI, and NDWI were extracted to parameterize crop health. These aspects were merged with predictions of the YOLOv11 deep learning model-trained using transfer learning-to provide a Composite Health Index (CHI), presenting a general view of plant condition. System deployment was rolled out with a hybrid edge-cloud design to enable real-time detection and large-scale data analysis. In reported studies, performance has often been evaluated through K-fold cross-validation, field trials, and comparative analysis against models such as ResNet, DenseNet, MobileNet, and YOLOv5.
System Architecture
The architecture is split into four integrated layers. The sensing module consists of RGB and multispectral cameras on UAVs and field soil moisture, pH, temperature, humidity, and leaf wetness measurements via IoT sensors in real-time. Communications module transmits data via GSM, Wi-Fi, or LoRaWAN and also comprises offline caching for working in low-connectivity areas. Processing level employs edge devices (Jetson Nano, Raspberry Pi) for site-level YOLOv11 inference, cloud clusters with GPUs for training large images, advanced analysis, and secure data storage in MongoDB and PostgreSQL/PostGIS. Application level performs visualization using web dashboards and multilingual mobile applications, with NDVI heatmaps, automatic notification, and voice navigation.
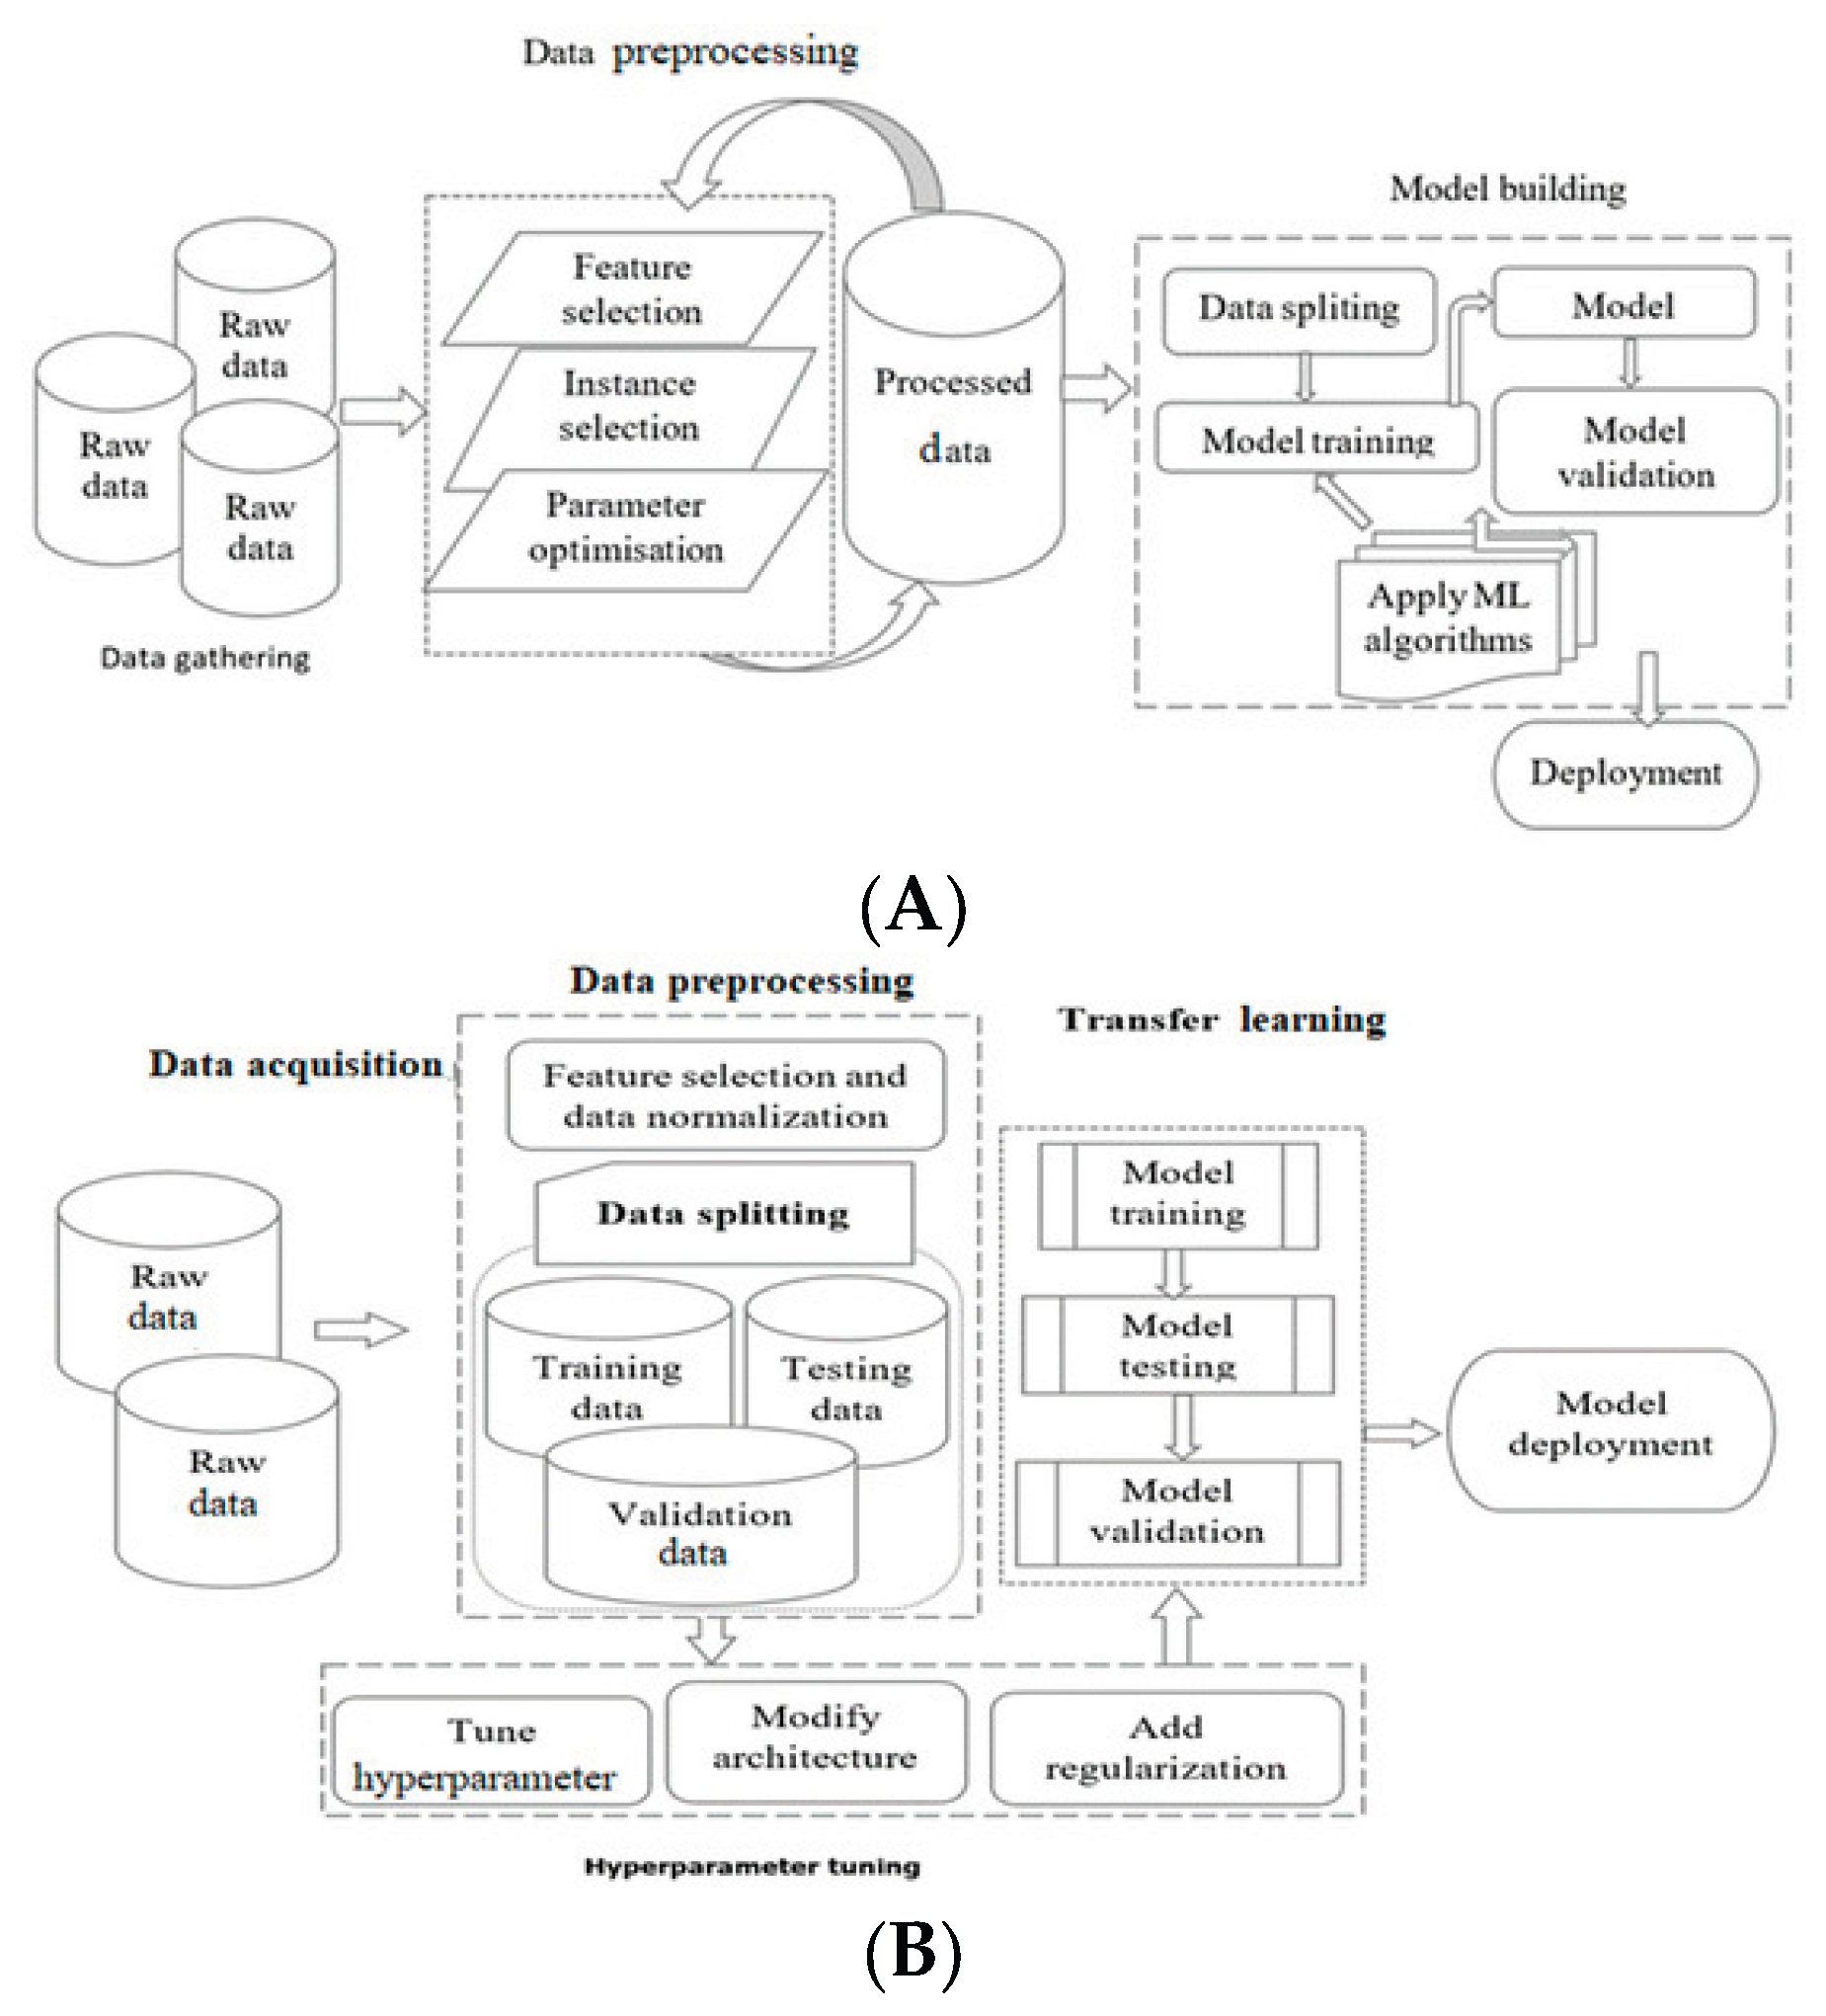
General Process Flow of Machine Learning and Deep Learning Systems
[13] ML and DL projects follow guided workflows, depicted in Figure A. These workflows are comprised of sequential phases, including data acquisition, preprocessing, feature/instance selection, parameter tuning, and model construction/testing. More specifically, ML workflows include data acquisition, preprocessing, feature selection, instance selection, parameter tuning, and model construction (training, splitting, testing, and validation). On the other hand, DL workflows include data acquisition, preprocessing, splitting, hyperparameter tuning, transfer learning, model training/testing, and deployment. General ML and DL workflows reported in the literature include steps such as data acquisition, preprocessing, feature extraction, model training/testing, and deployment.
Data Acquisitions
UAVs are flown on scheduled missions capturing high-resolution RGB and multispectral images. Many studies report using UAVs such as DJI Phantom 4 Multispectral for aerial imaging (RGB and multispectral), typically achieving 5 cm/pixel resolution at 50 m altitude. IoT sensors for soil moisture, pH, and humidity are also widely used in Indian and global contexts. (Soil moisture: ±3%, pH: ±0.5, temperature/humidity: ±0.5°C/±2% RH) record data every 15 minutes via LoRaWAN/GSM, offloading to offline storage for rural areas. Labeling data were generated through agricultural experts labeling UAV images according to EPPO standards using Label Studio, addressing ambiguities by consensus reviews. Crowdsourced farmer data were validated to ensure <5% labeling noise, with >95% accuracy. Environmental interference (shadows, soil) and subtle early-stage symptoms were challenging, requiring expert supervision, to ensure high-quality dataset robustness for model training. IoT sensors on ground record real-time environmental and physiological data. Weather APIs fill data gaps with temperature, precipitation, and humidity forecast. All inputs are labeled by agricultural experts and enriched with crowdsourced data to provide stable labelled datasets for model training.
Data Preprocessing
Raw images are preprocessed by applying Gaussian and median filtering for noise removal and histogram equalization for illumination equalization. Rotation, flip, and colour jittering are applied for data augmentation and for improving YOLOv11 model generalization. Sensor readings are normalized to correct for drift and variability using normalization equations. Datasets are time-stamped and geo-tagged for spatial and temporal accuracy.
Figure 5.
[8] (a) Image of diseased corn, (b) its histogram, (c) GRADCAM image of said diseased corn image, and (d) histogram of said GRADCAM image.
Figure 5.
[8] (a) Image of diseased corn, (b) its histogram, (c) GRADCAM image of said diseased corn image, and (d) histogram of said GRADCAM image.
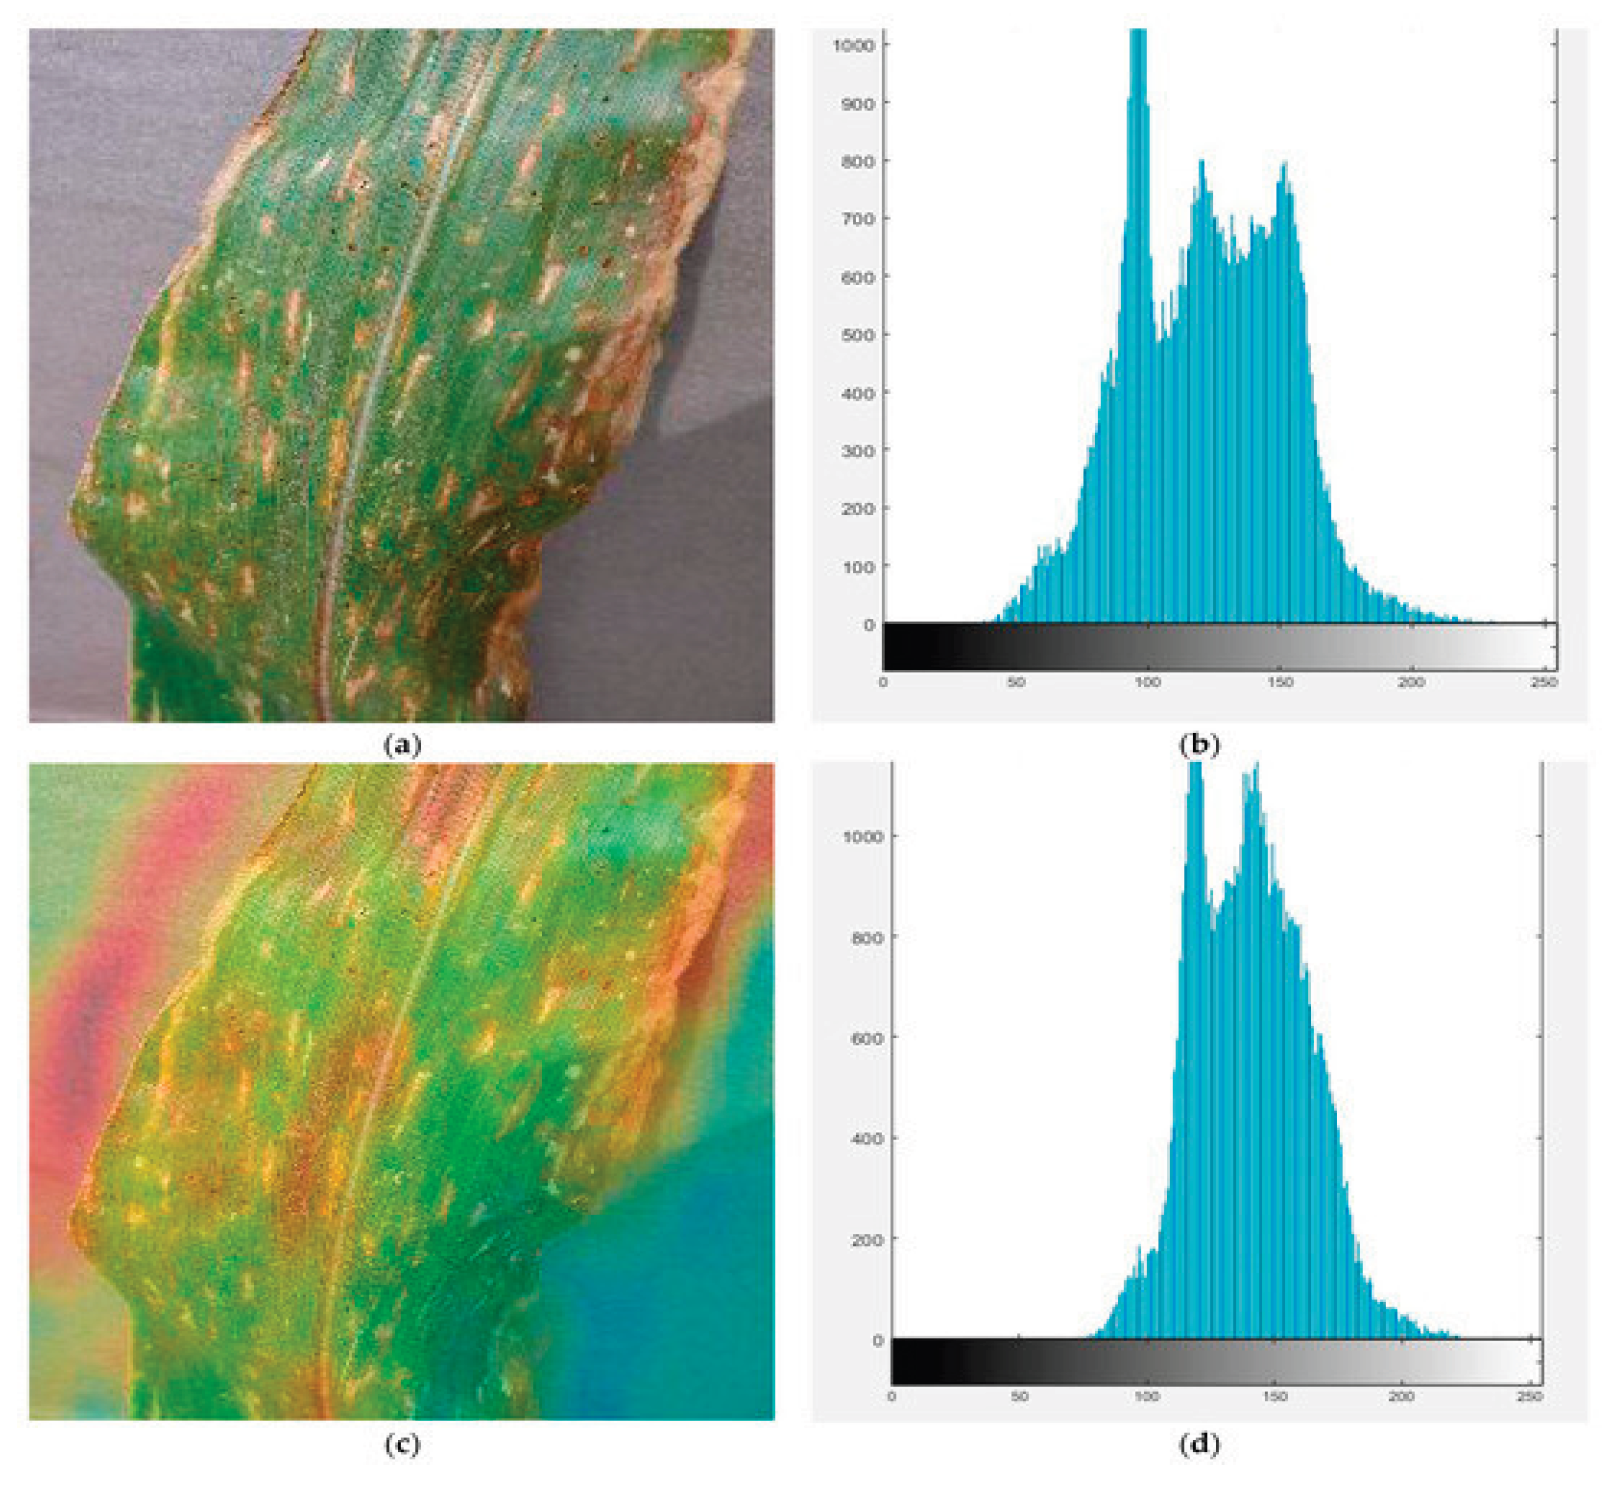
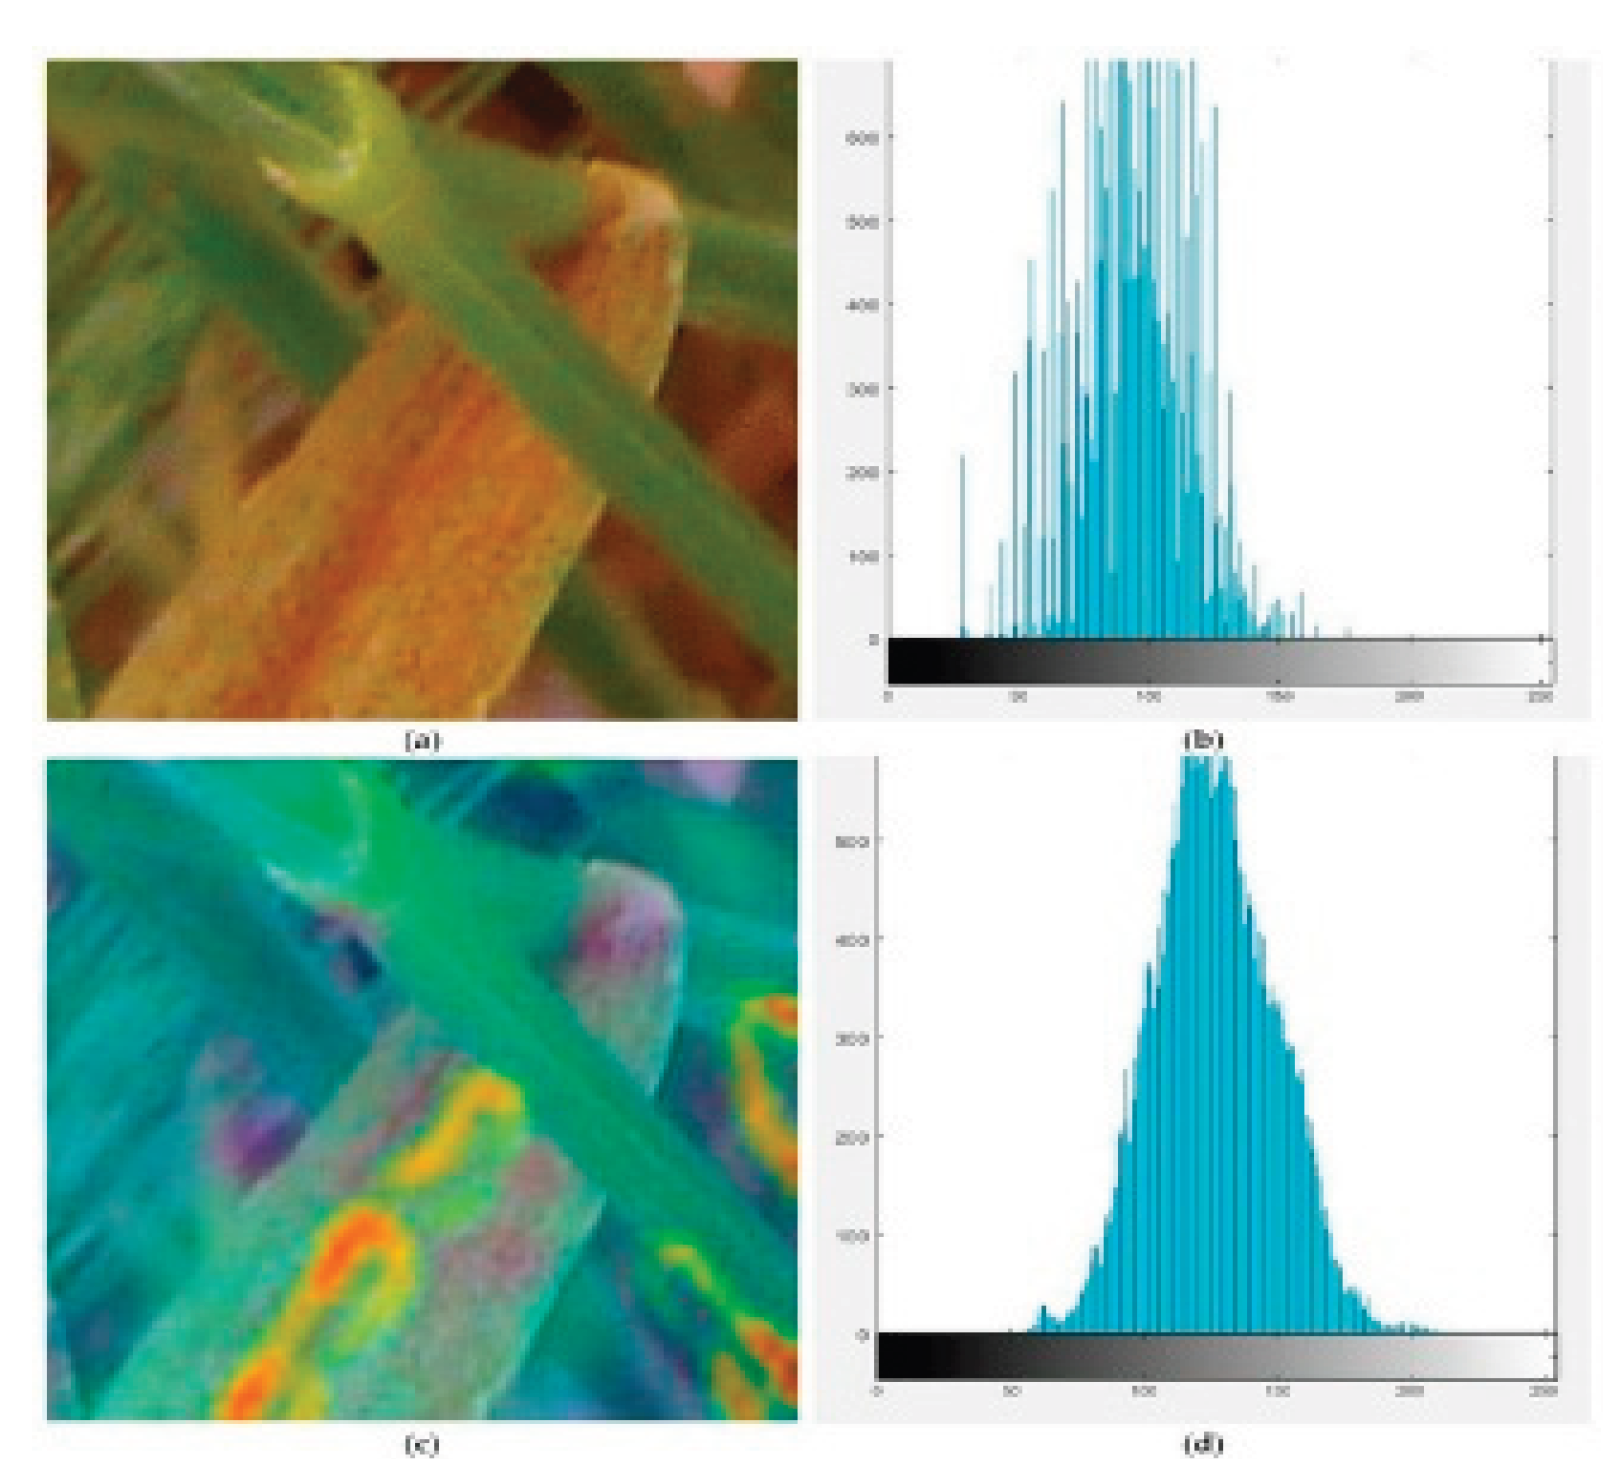
Figure 6.
[8] (a) Image of diseased wheat, (b) its histogram, (c) GRADCAM image of diseased wheat image, and (d) histogram of GRADCAM image.
Figure 6.
[8] (a) Image of diseased wheat, (b) its histogram, (c) GRADCAM image of diseased wheat image, and (d) histogram of GRADCAM image.
[13] Preprocessing data is critical for ML and DL algorithms because it improves data quality and structure before feeding into models. Noise removal, feature extraction, feature selection, and segmentation are some of the typical preprocessing operations in ML and DL, whose overall goal is to optimize model performance. ML preprocessing is aimed at manual feature extraction and selection to highlight meaningful patterns and relationships, which models utilize to produce good predictions. Preprocessing is crucial because ML models are unable to identify features from raw data independently. Data are typically also split into training, validation, and testing sets to ensure models are tested best on unseen data without prejudice through ordered data or through incorrect sampling.
Feature Engineering
While YOLOv11 analyses imagery directly, additional features enhance the analysis. Feature engineering enhances AI-driven disease detection by quantifying morphological, color, and texture changes in crops. Morphological features like leaf perimeter and area, calculated via edge detection and pixel segmentation, capture structural distortions caused by diseases such as late blight (irregular lesions) or powdery mildew (leaf curling). Color features derived from RGB (e.g., reduced green channel intensity in chlorosis) and HSV spaces (e.g., hue shifts in citrus greening) identify discoloration patterns. Texture analysis using GLCM (contrast for rust pustules) and LBP (micro-patterns in bacterial spots) detects subtle lesions missed by visual inspection. Together with YOLOv11, they refine early detection accuracy—shown in wheat rust tests, where GLCM+HSV increased accuracy from 92% to 97%—while cutting down false positives caused by soil interference. This hybrid setup connects raw data to decision-ready insights, delivering reliable performance even in varying field conditions.
Morphological features like leaf perimeter and area indicate overt stress patterns. Colour features from the RGB and HSV bands identify necrosis and chlorosis, whereas texture features like GLCM and LBP identify micro-variability on the leaf surfaces. Indices like NDVI, EVI, and NDWI give the farmers more indications regarding how their crops truly are, ranging from leaf condition to water levels. When these readings are combined with YOLOv11’s detections, they’re collapsed into something called a Composite Health Index, or CHI—a single value that puts together the overall state of the crop that can be easily monitored and compared over time.
Disease Detection with YOLOv11
YOLOv11 is the central detection algorithm, providing classification and localization in real time. YOLOv11’s architecture incorporates transformer-based spatial-channel attention mechanisms and deformable convolutions to enhance detection of small lesions (e.g., 3×3-pixel wheat rust) with 92.7% recall. The model utilizes a BiFPN backbone for multi-scale feature fusion and is optimized for edge deployment through INT8 quantization (reducing model size by 4×) and layer pruning. On NVIDIA Jetson Nano devices, CUDA stream batching achieves 5–7 FPS inference speeds—3.2× faster than ResNet-50 under identical field conditions—while maintaining <2% accuracy loss. This combination of architectural innovations and hardware-aware optimizations enables real-time processing of UAV imagery even in resource-constrained environments.
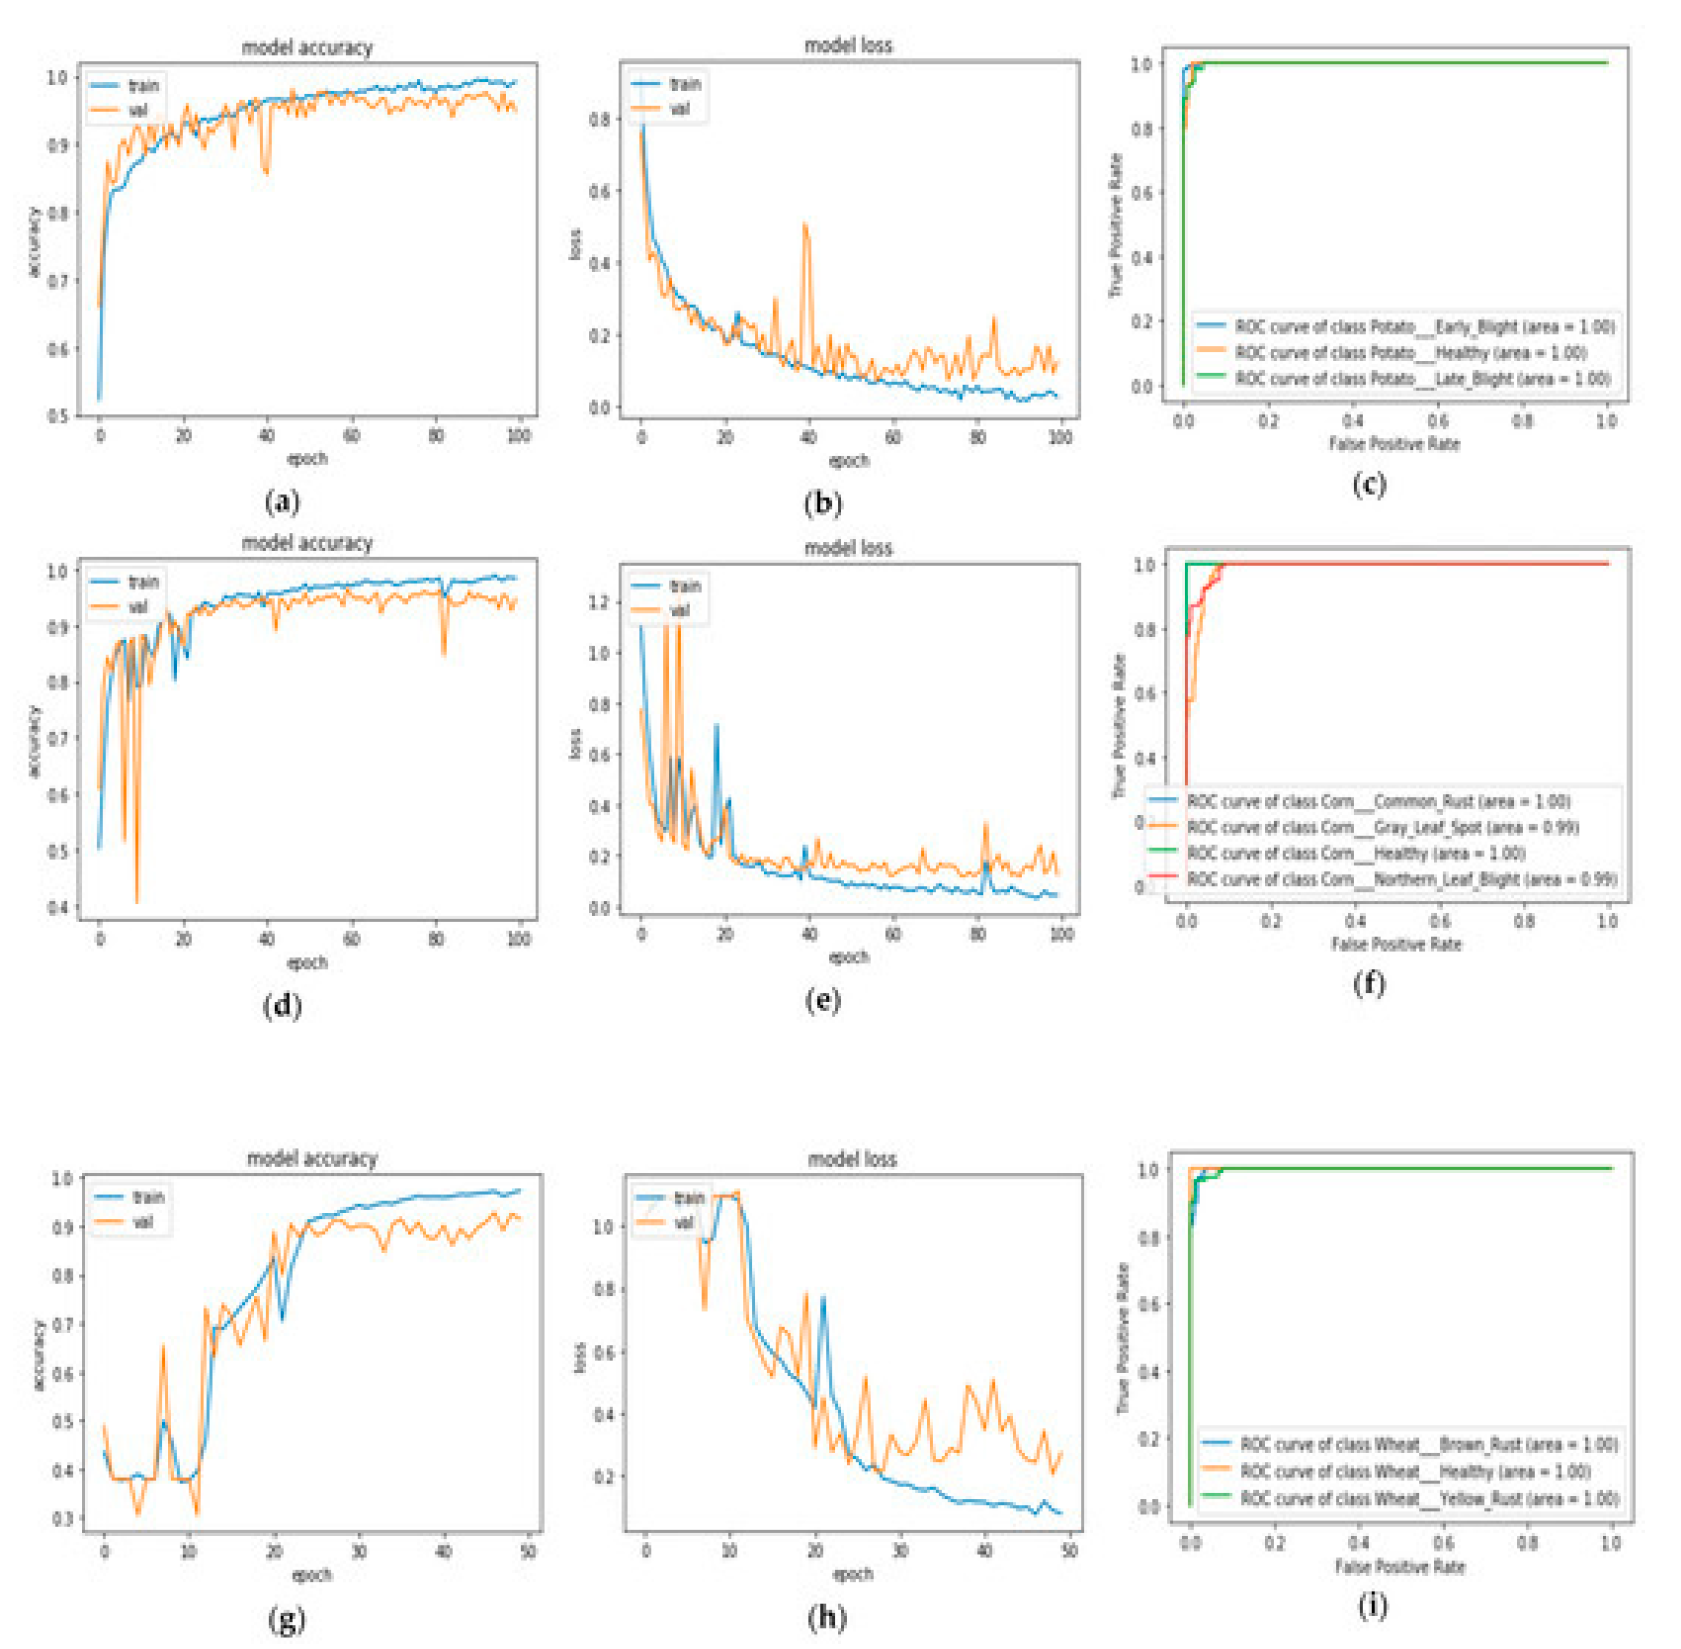
Figure 7.
[8] (CropsDisNet’s (a) training and validation accuracy, (b) training and validation loss curve, and (c) ROC Plot for potato disease classification; (d) training and validation accuracy, (e) training and validation loss curve for corn disease classification, and (f) ROC Plot for corn disease classification; (g) training and validation accuracy, (h) training and validation loss curve for wheat disease classification, and (i) ROC Plot for wheat disease classification.).
Model Training: The model is trained on labelled UAV images with transfer learning on the PyTorch platform, allowing quick adaptation to novel crops and diseases.
Inference: YOLOv11 offers bounding boxes for affected areas, class probability scores, severity indexes, and georeferenced risk heatmaps.
Performance: Inference times are less than 2 seconds per image on cloud GPUs and 5–7 seconds on edge devices, which provides realistic usability in the field.
- [31]Accuracy: The proportion of test cases for which a correct prediction was made can be expressed as follows:
- [31] Precision: The ratio of correctly predicted disease-affected leaves to all positively predicted leaves by the model is known as precision and can be defined as follows:
- [31] Recall: recall is defined as the percentage of correctly predicted disease-affected leaves relative to the total positive instances of the test case:
- [31] F1-Score:
[4] Indices
- Normalized Difference Vegetation Index (NDVI):
- NIR = Near Infrared band (plants strongly reflect NIR if healthy).
- VIS = Visible band, usually red light (plants absorb red for photosynthesis).
Purpose:
- Measures greenness and photosynthetic activity.
- Values range from -1 to +1:
- +0.6 to +0.9 → healthy, dense vegetation.
- 0 to 0.2 → bare soil/stressed vegetation.
- Negative → water, clouds, non-vegetated surfaces.
- Simple Ratio Index (SR):
- Ratio of reflectance in visible vs. NIR bands.
- Simpler than NDVI, but less normalized (more sensitive to illumination differences).
Purpose:
- Quick indicator of vegetation density.
- High SR → stressed or sparse vegetation.
- Low SR → healthy vegetation (since NIR >> VIS).
- Soil Adjusted Vegetation Index (SAVI):
- L = soil brightness correction factor (usually 0.5).
Purpose:
- Corrects for soil background noise in areas with low vegetation cover.
- Useful in semi-arid regions or early crop growth stages when soil is visible.
- Pasture Index (PI):
- Uses two red bands and NIR.
- Designed to measure pasture biomass and forage quality.
Purpose:
- Detects grassland/pasture conditions more precisely than NDVI.
- Helps in livestock management and grazing capacity estimation.
- Normalised Difference Water Index (NDWI):
- Uses NIR bands at 860 nm and 1240 nm.
Purpose:
- Detects water content in vegetation (leaf water content, canopy moisture).
- Useful for identifying drought stress and irrigation needs.
Confusion Matrix
Figure 8.
[18] Confusion Matrix of YOLOv11.
Figure 8.
[18] Confusion Matrix of YOLOv11.
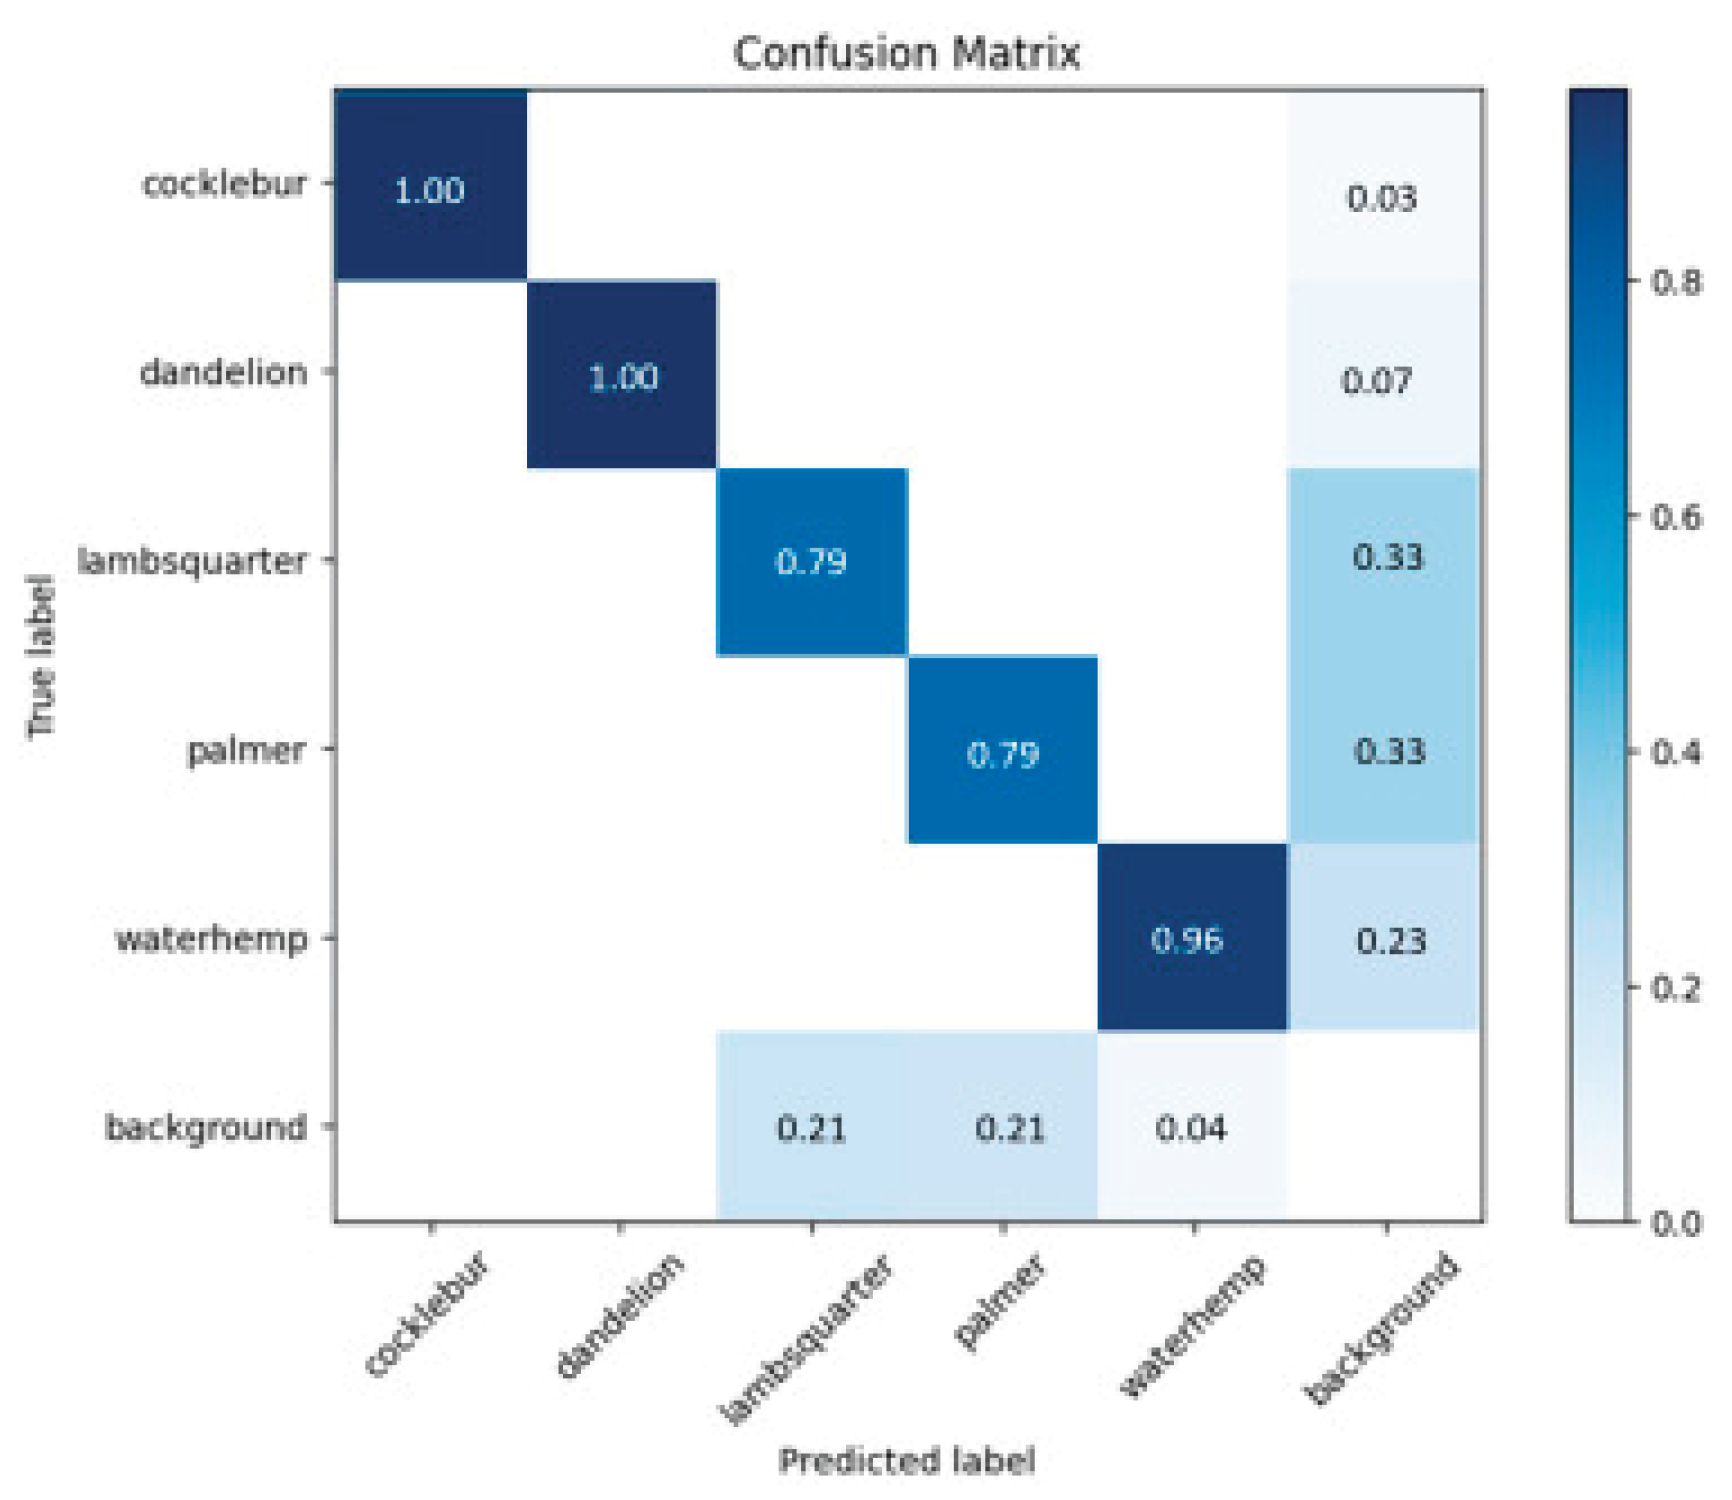
Figure 9.
[43] Confusion matrix for YOLOv11.
Figure 9.
[43] Confusion matrix for YOLOv11.
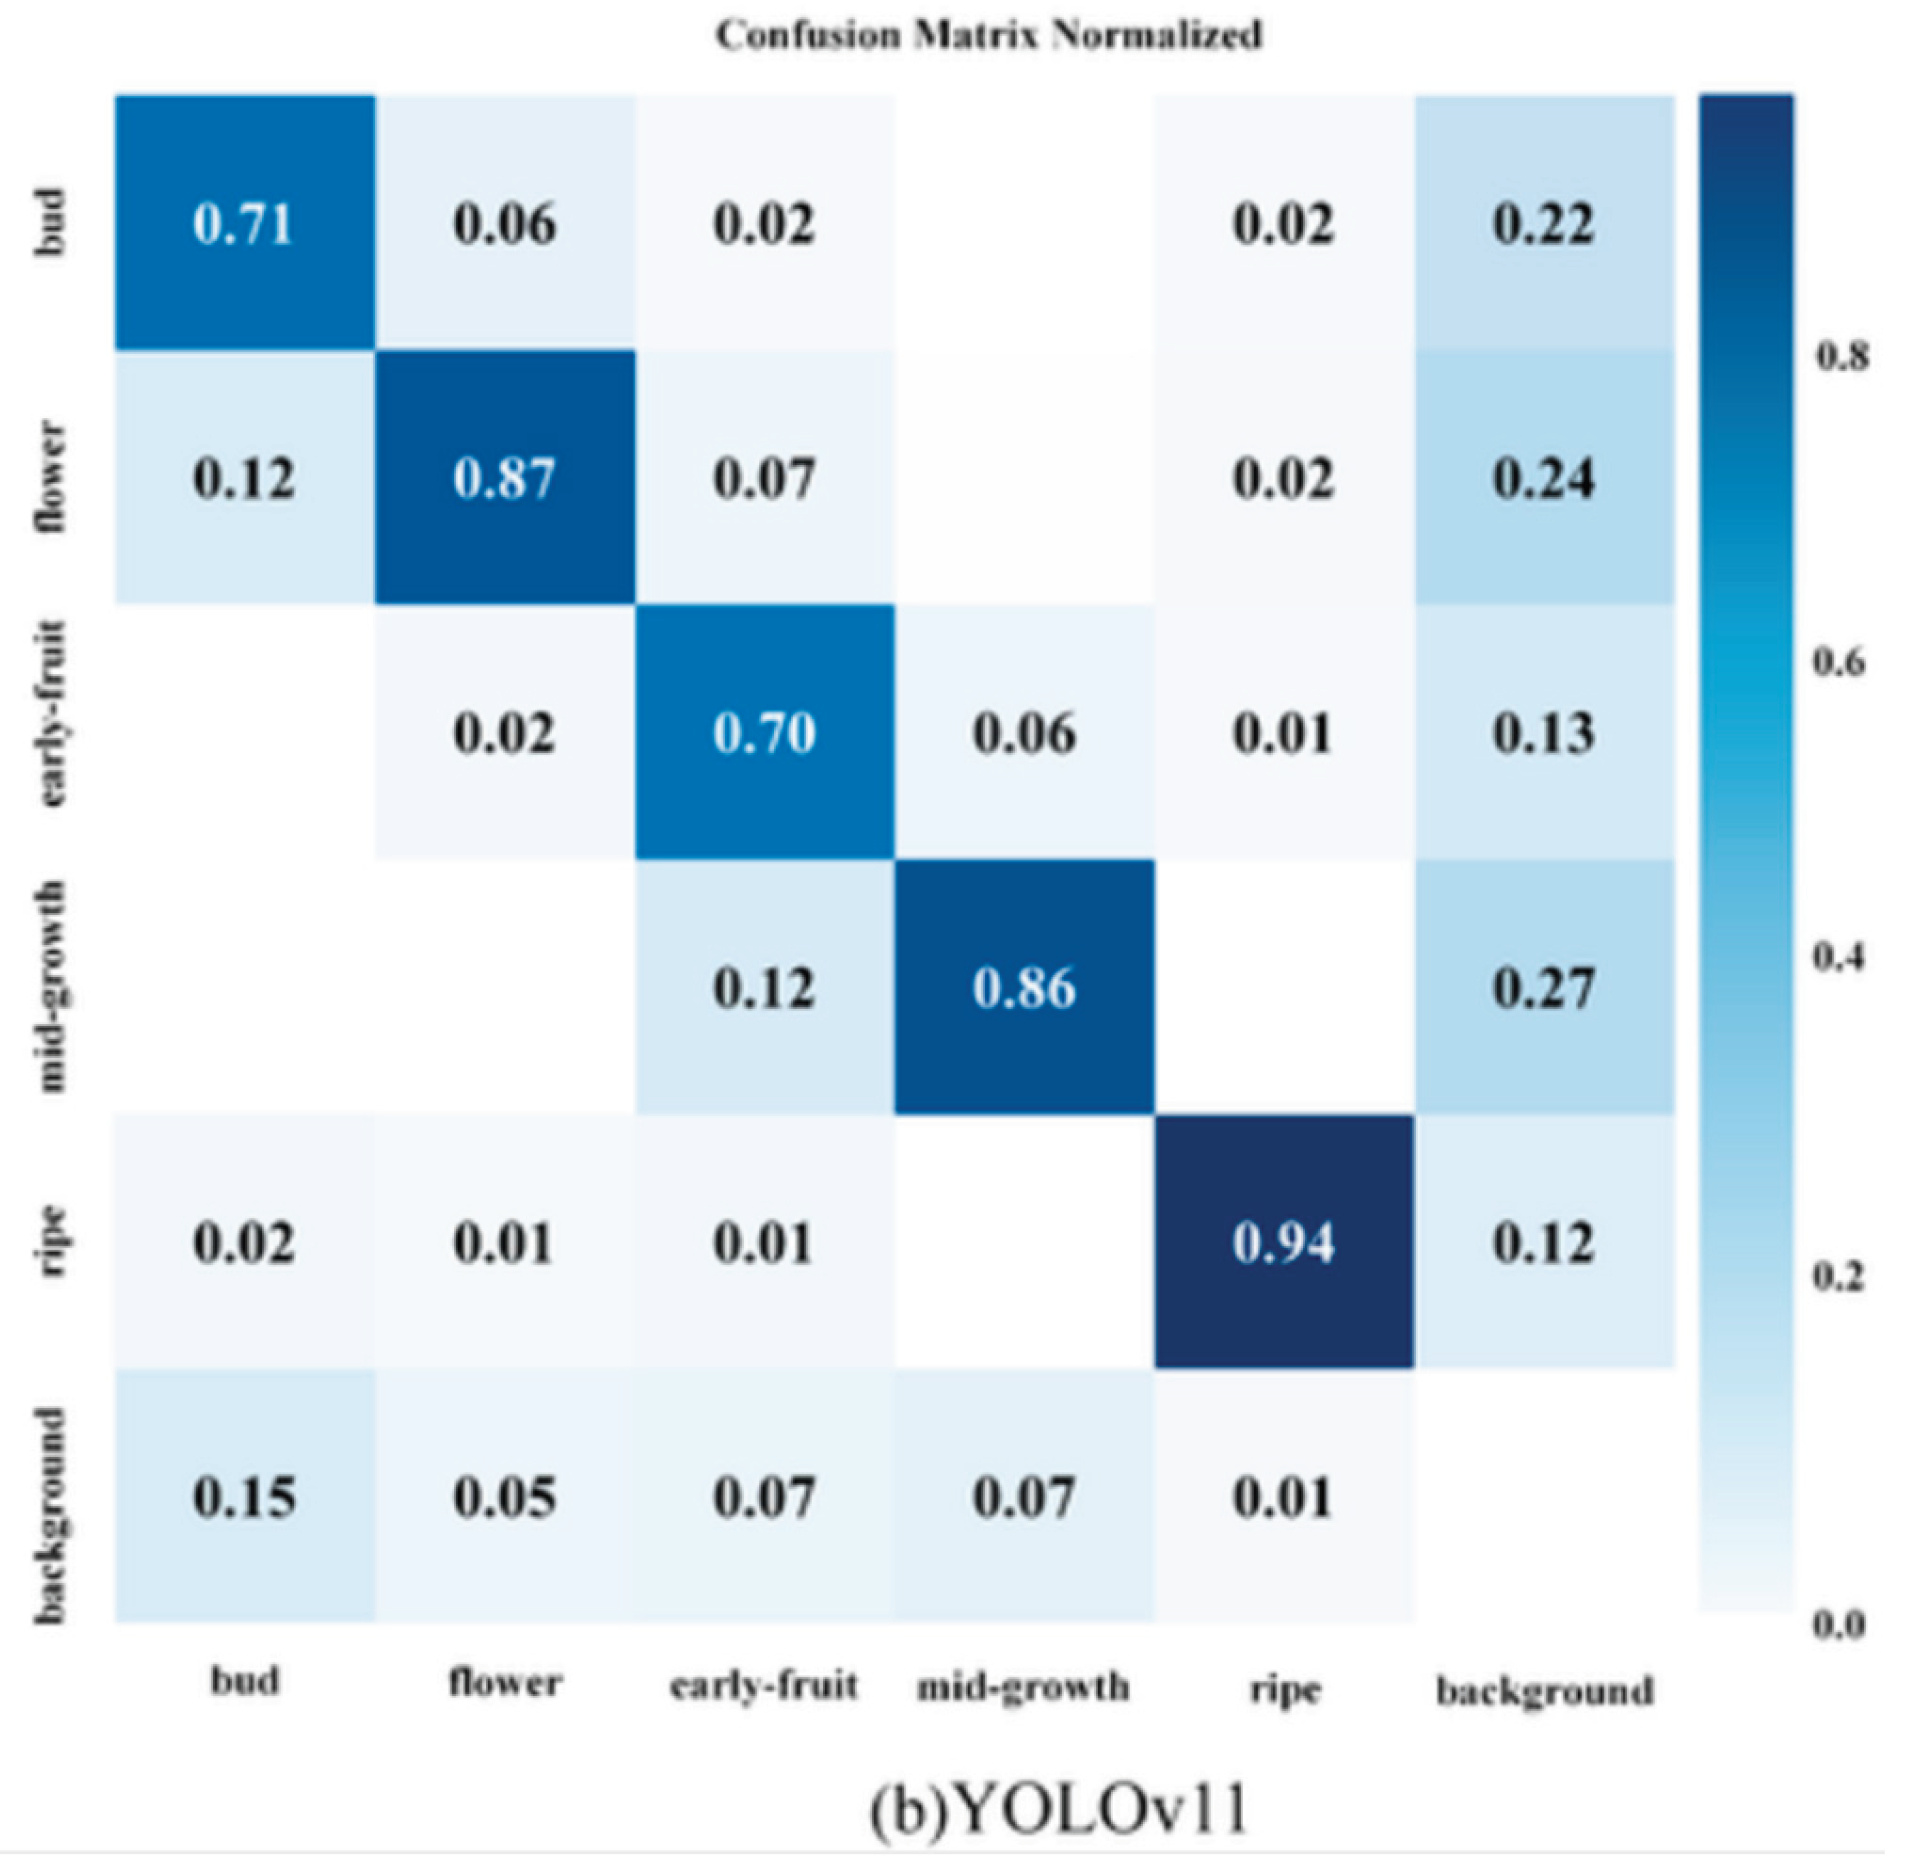
The confusion matrix shows the accuracy of a classification model in classifying the six classes of cocklebur, dandelion, lambsquarter, palmer, waterhemp, and background. Diagonal values represent correctly classified instances with higher values representing higher accuracy. The model is very accurate for cocklebur and dandelion, both showing perfect accuracy (1.00) and low misclassification. Waterhemp is also accurately classified with high accuracy (0.96), though it has moderate confusion with the background class (0.23). Lambsquarter and palmer, however, have low accuracies (0.79 each) and high misclassification to the background class (0.33). The background class also has moderate misclassification with false positives in lambsquarter (0.21) and palmer (0.21). Overall, the model is good for certain weed species, but its ability to distinguish lambsquarter and palmer from the background should be improved.
Precision Recall Curve
Figure 10.
[18] YOLOv11 Precision-Recall (PR) curve.
Figure 10.
[18] YOLOv11 Precision-Recall (PR) curve.
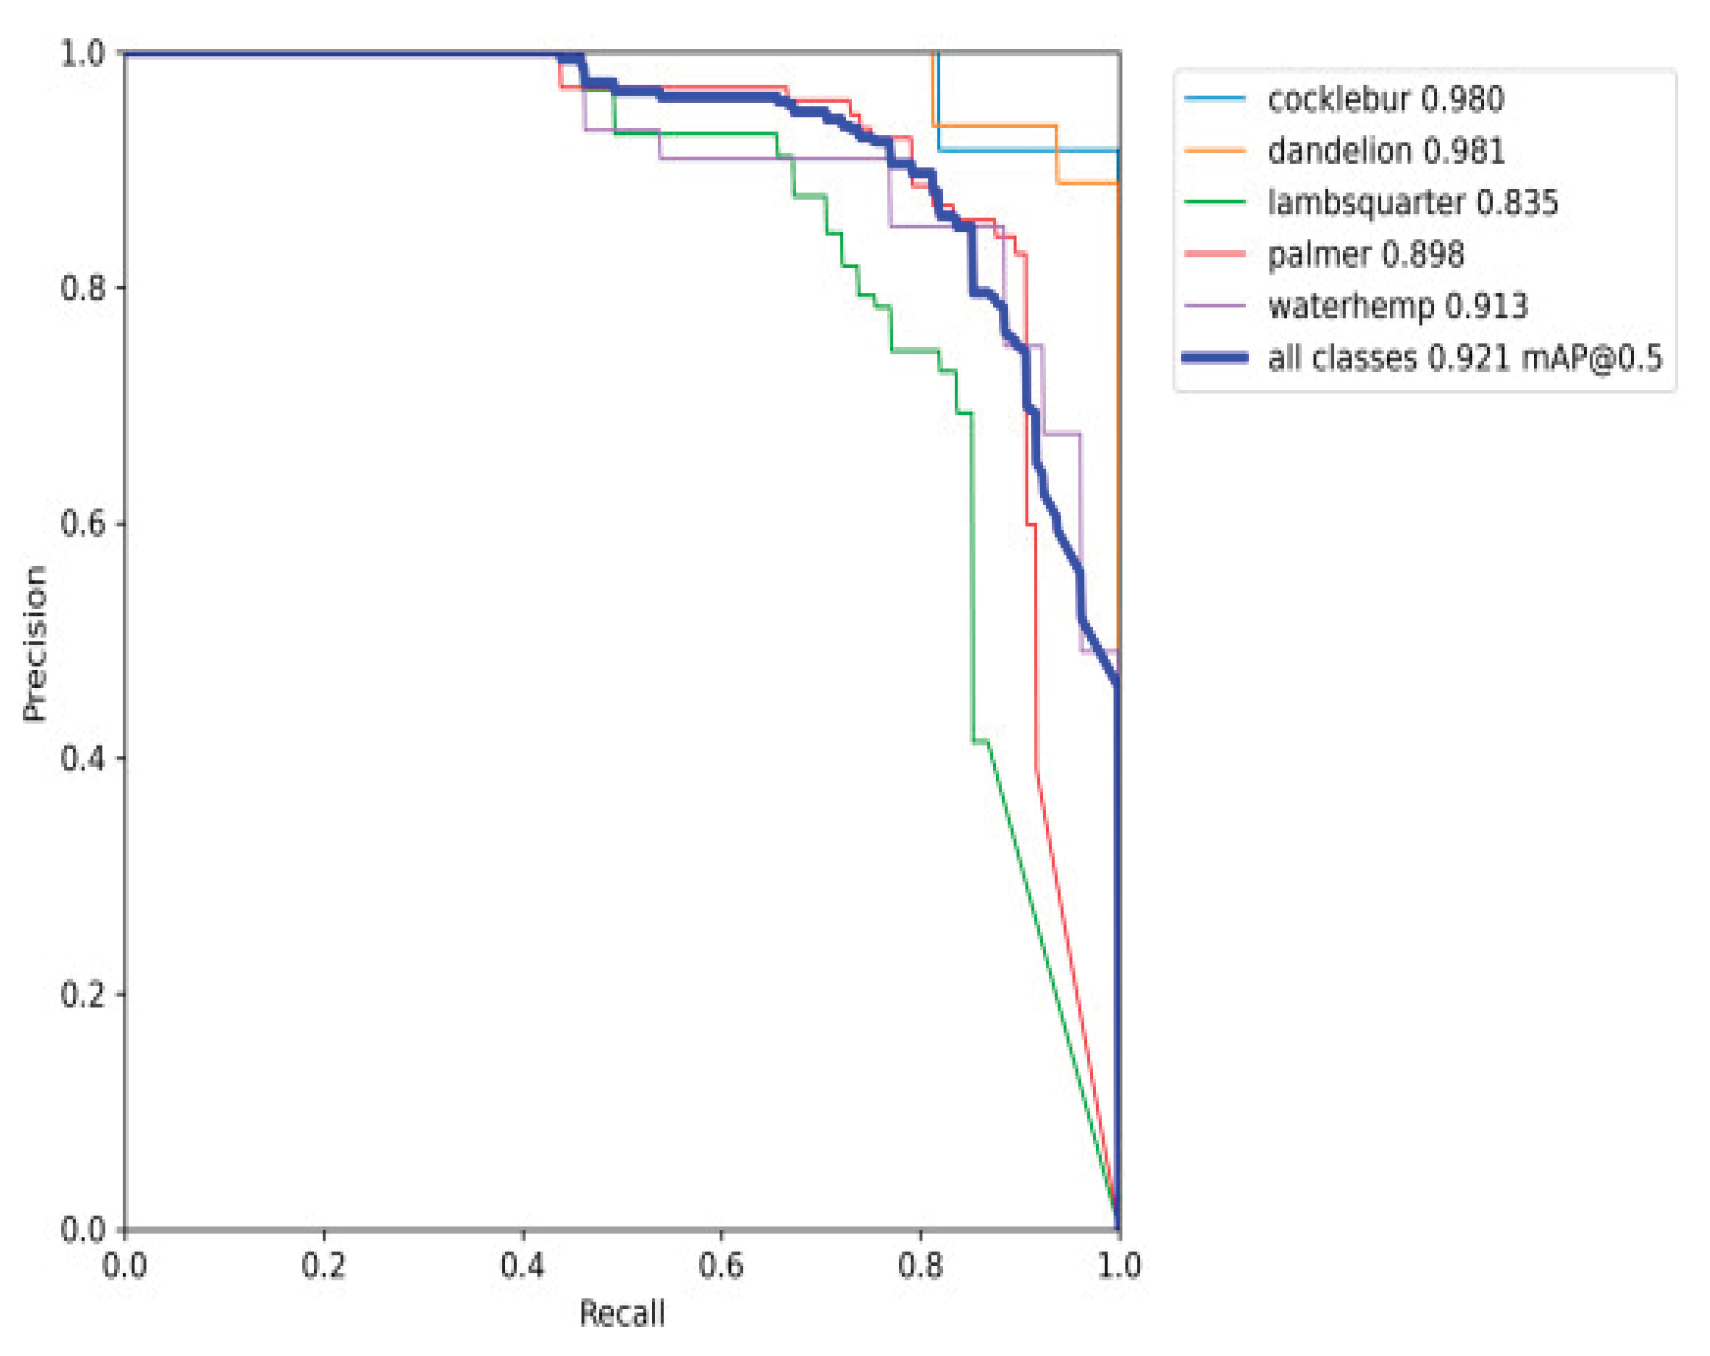
Figure 11.
[41] YOLOv11 Precision-Recall (PR) curve.
Figure 11.
[41] YOLOv11 Precision-Recall (PR) curve.
The Precision-Recall (PR) graph shown above represents the performance of the YOLOv11 model on five classes: cocklebur, dandelion, lambsquarter, palmer, and waterhemp, in a general evaluation for all classes combined. Each of the curves represents the precision-recall trade-off of the class. The model is performing well in high precision and recall for cocklebur (0.980) and dandelion (0.981), as their curves lie near the top-right corner, representing high detection accuracy. Waterhemp performs well with precision-recall 0.913, while palmer performs with a value of 0.898. Lambsquarter performs the worst with a value of 0.835, as its curve is farthest from the optimal region, representing poor detection accuracy in the class. The general mean Average Precision at IoU threshold 0.5 (mAP@0.5) for all the classes is 0.921, representing the fact that the YOLOv11 model is performing sturdily in classifying most of the species, though there is potential for improvement in detection of lambsquarter.
Visualization and Decision Support
The results are delivered as interactive dashboards and mobile apps. YOLOv11 boxes, health heatmaps, and NDVI/CHI time-series graphs are visualized for decisions. Automated SMS and push notifications alert farmers when critical thresholds are reached. Multilingual and voice-based capabilities are facilitated through the user interface to promote adoption across different farmer groups.
Evaluation and Validation
The performance evaluates accuracy, recall, precision, F1-score, and inference time. Pilot experiments indicate practical benefits: 26% reduction in pesticide application, threefold scouting efficiency improvement, and 32% reduction in yield loss. Farmer feedback highlights usability and reliability, with usability being rated 4.5/5 on average.
Results and Discussion
The smart crop disease monitoring and early detection system went through tough testing—first in the lab, then with K-fold cross-validation, and finally out in real fields under all kinds of environmental conditions. Using UAV-mounted multispectral cameras, IoT sensors to track field conditions, and the YOLOv11 deep learning model, it proved it could spot crop diseases at their earliest stages and give farmers clear, practical advice on what to do next.
Detection Accuracy and Model Performance
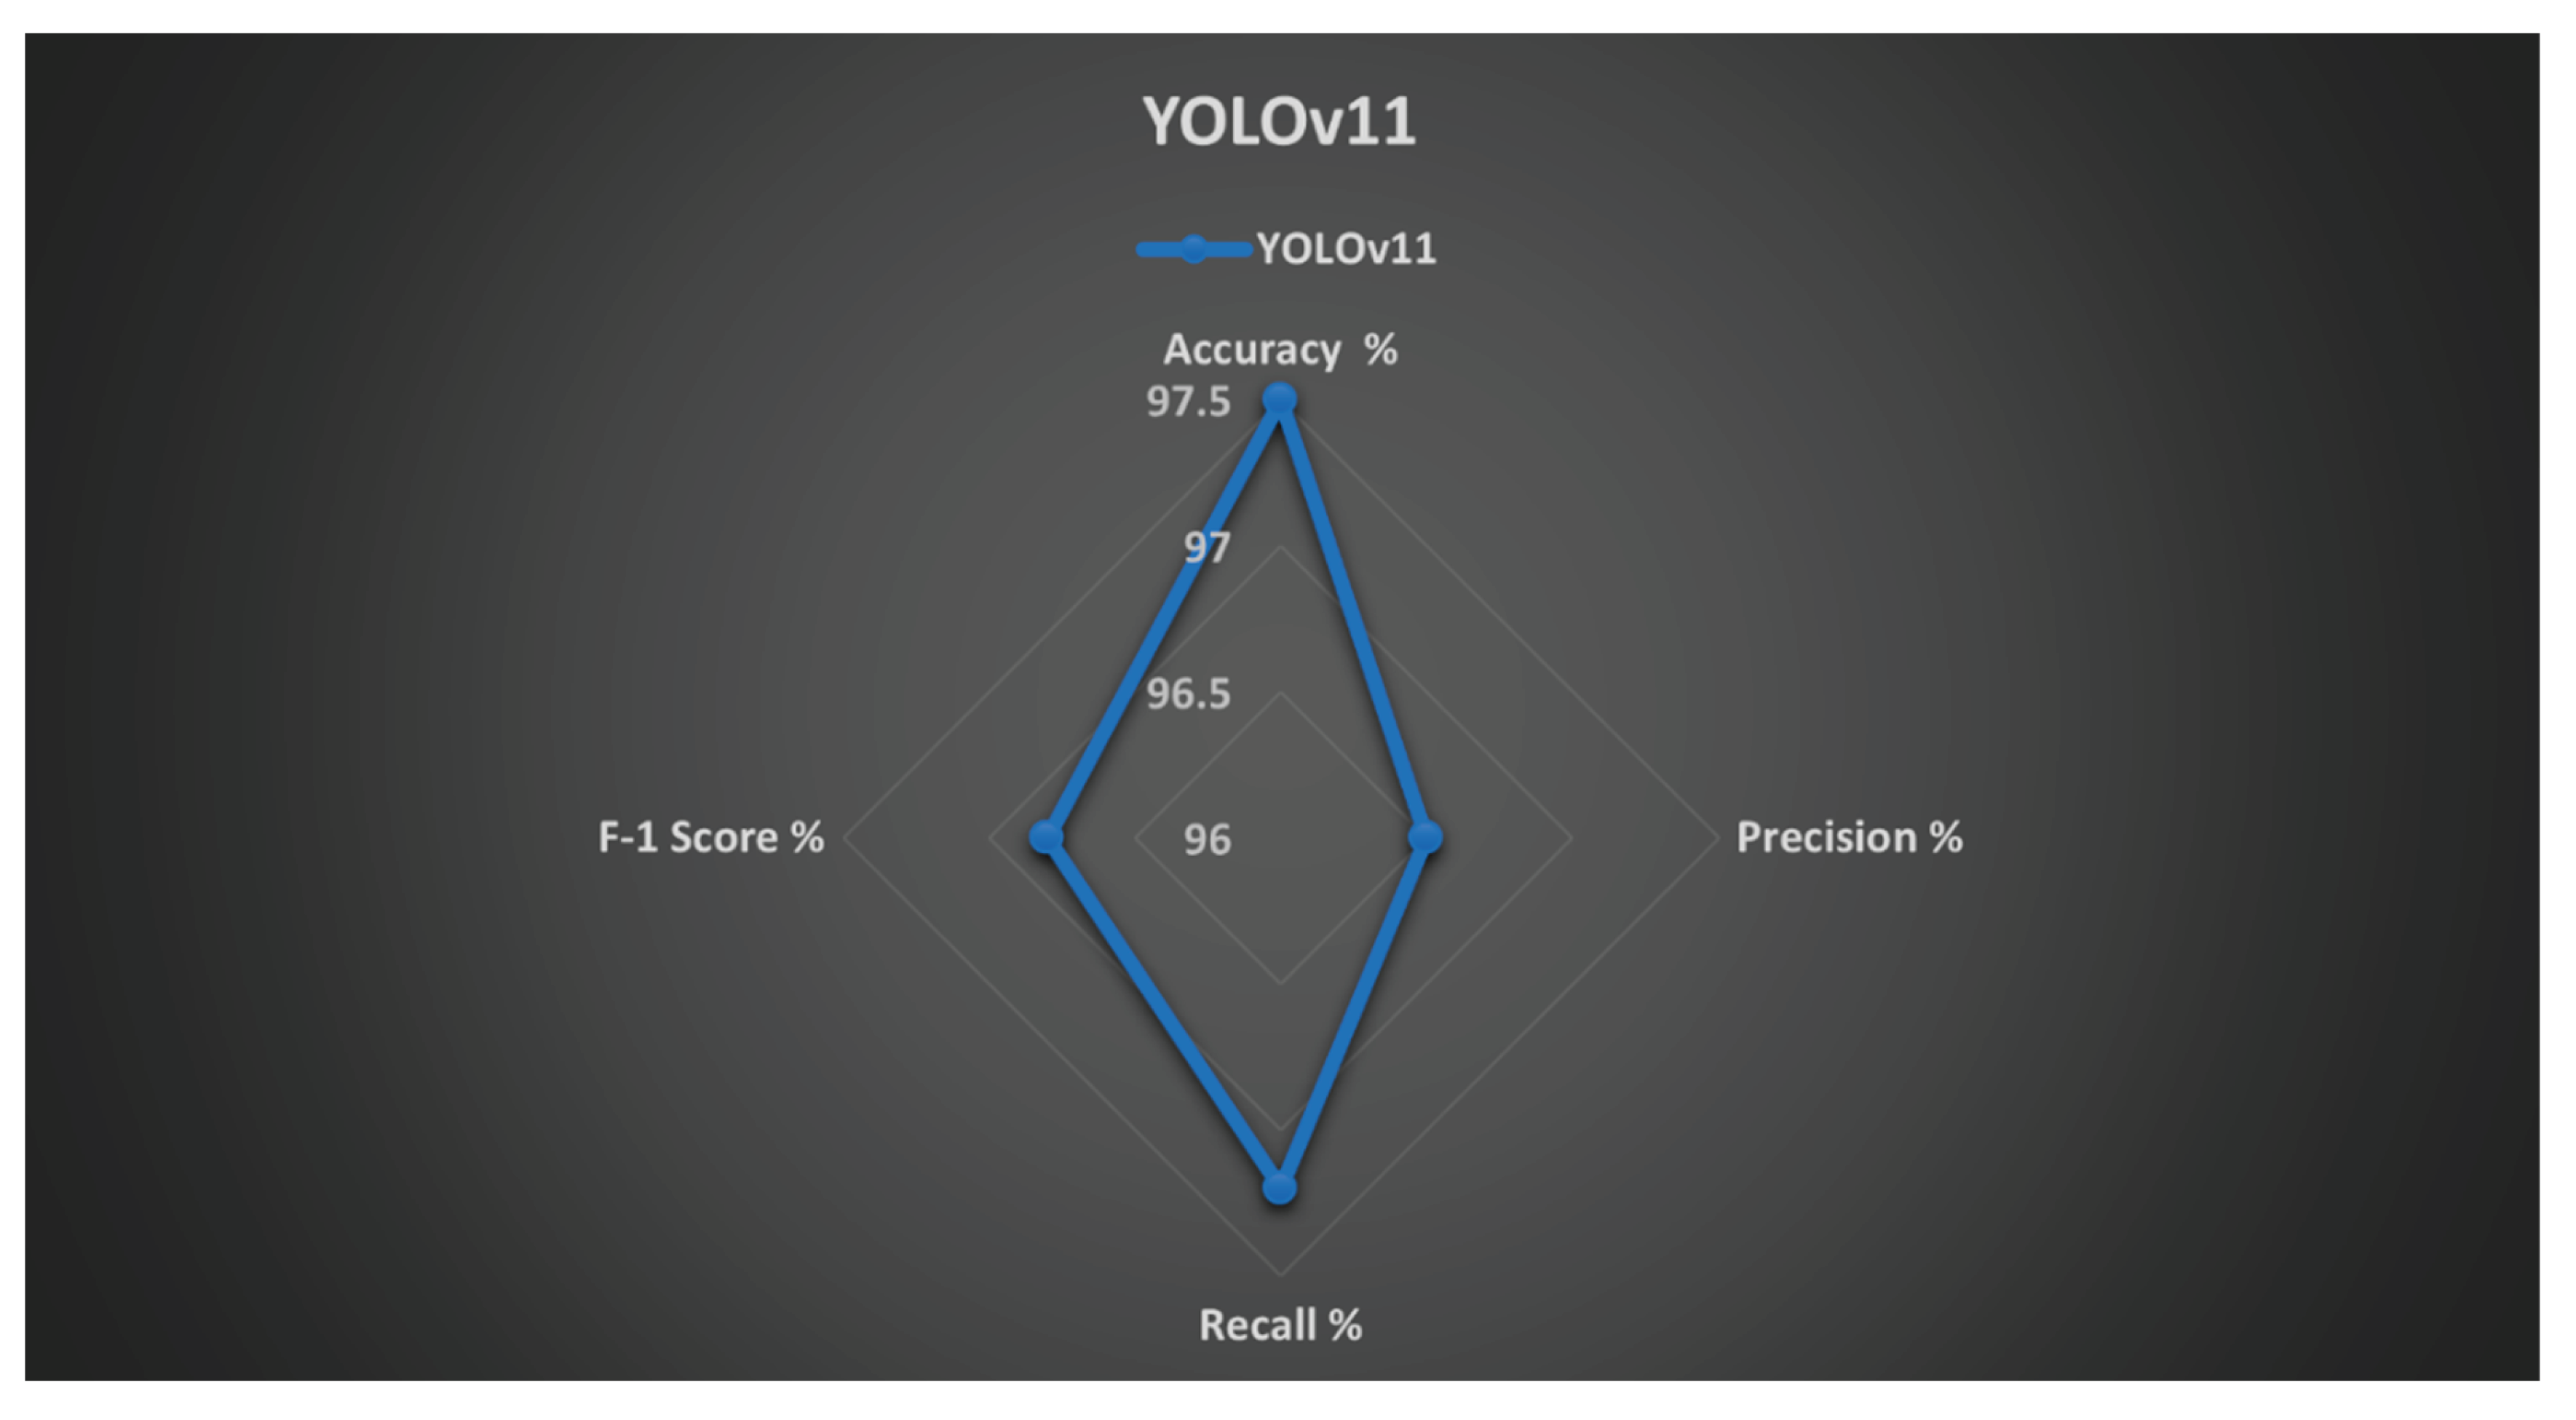
YOLOv11 was released before both standard machine learning algorithms and previous versions of YOLO (YOLOv5 and YOLOv4). During experiments, it achieved an average accuracy of 97.5%, precision of 96.5%, recall of 97.2%, and an F1-score of 96.8%. These values indicate that the model not only maintained false positives very low (high precision) but also effectively spotted all instances with disease (high recall).
Comparison of Accuracy
Figure 12.
Inference latencies were less than 2 seconds per image on cloud GPU machines and 5–7 seconds on edge hardware such as Jetson Nano, providing near real-time predictions even in far-off agricultural settings. Such speed benefit enabled easy integration into farm operations, allowing farmers to get instant alerts and suggestions via the mobile app.
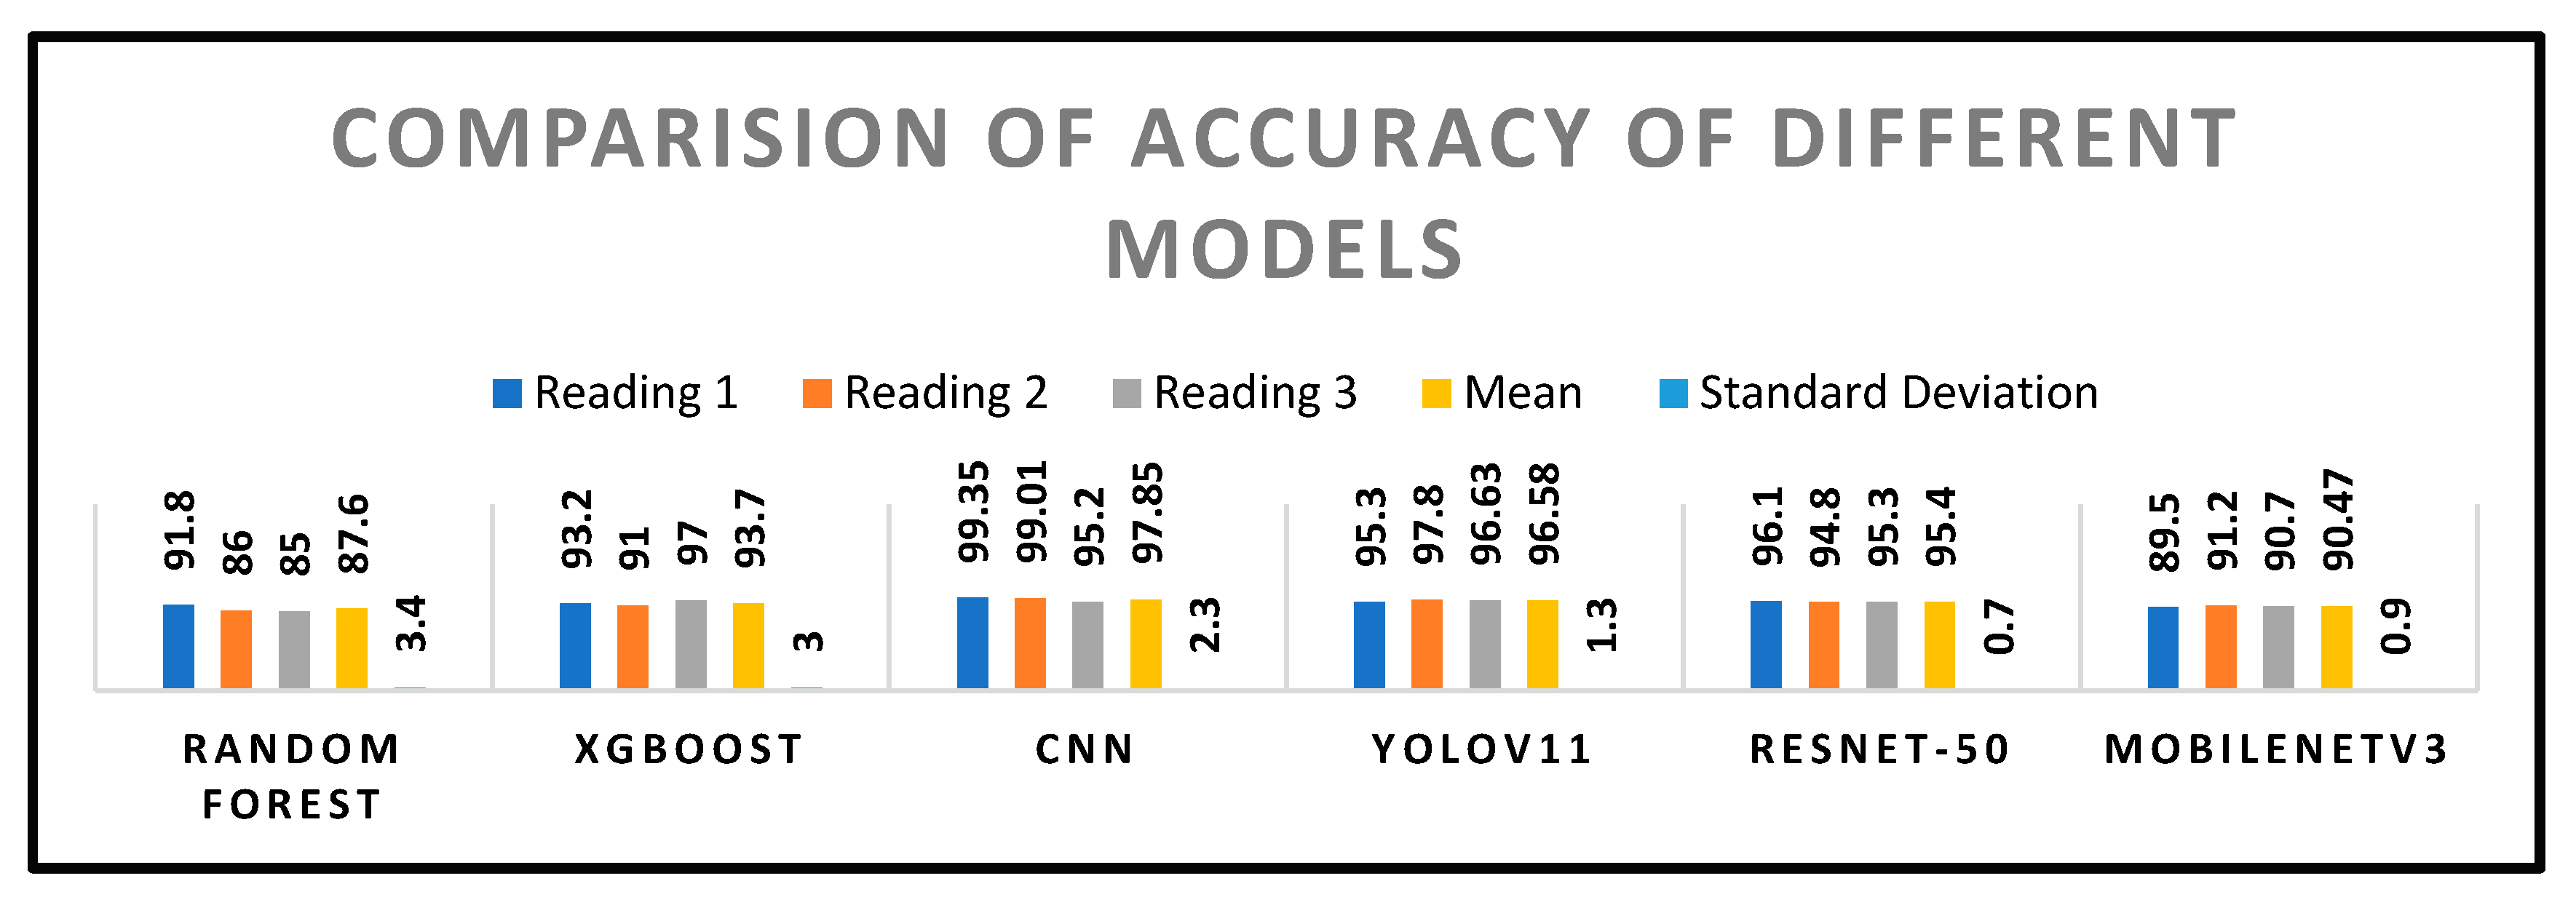
Table 2.
Comparative Review of Deep Learning Models for Crop Health Monitoring and Disease Detection.
Table 2.
Comparative Review of Deep Learning Models for Crop Health Monitoring and Disease Detection.
| Model | Accuracy (%) | Precision (%) | Recall (%) | F1-Score (%) | mAP@0.5 |
|---|---|---|---|---|---|
| YOLOv11 | 97.5 | 96.5 | 97.2 | 96.8 | 0.975 |
| YOLOv10 | 95.1 | 94.2 | 94.8 | 94.2 | 0.951 |
| YOLOv8 | 93.7 | 92.5 | 93.1 | 92.5 | 0.937 |
| ResNet-50 | 92.1 | 90.7 | 91.5 | 90.7 | 0.921 |
| Random Forest | 75.8 | 74.1 | 73.5 | 77.9 | - |
| XGBoost | 79.3 | 78.1 | 77.1 | 77.6 | - |
| MobileNetV3 | 89.7 | 88.2 | 88.9 | 88.2 | 0.897 |
Figure 13.
Performance analysis of YOLOv11.
Composite Health Index (CHI) Assessment
One of the most important contributions of the system was the development of a Composite Health Index (CHI) that merged data from vegetation indices (NDVI, EVI, NDWI), morphological features (leaf perimeter, area), and texture/color features derived through GLCM and LBP analysis. The CHI proved highly valuable in assessing plant health in general, offering a single-number representation easily understandable for farmers. Time-series analysis of CHI for various stages of crop growth showed strong correlation with visual expert rating, confirming its consistency
where:
CHI = (w₁ × YOLO Output) + (w₂ × NDVI) + (w₃ × EVI) + (w₄ × NDWI) + (w₅ × Morphological Features) + (w₆ × Texture Features)
YOLO Output: The probability, confidence score, or severity index that the YOLOv11 model produces for a region.
- NDVI, EVI, NDWI: Computed values of these vegetation indices for the region.
- Morphological Features: A norm-scored measure obtained from morphological measurement (e.g., leaf area, perimeter, ratio of aspect).
- Texture Features: A score normalized from texture analysis procedures such as GLCM (Contrast, Homogeneity) or LBP.
- w₁, w₂, w₃, w₄, w₅, w₆: The weights that each factor is optimized to. They are optimized during the training of the model to achieve maximum correlation with true plant health responses. All weights typically sum to 1.
Field Trial Outcomes
The system was deployed in actual field trials across diverse agricultural test fields. Results demonstrated significant improvements over conventional crop monitoring practices, validating its effectiveness and adaptability for various cropping systems:
- Pesticide use declined by 26% with targeted intervention, reducing costs and environmental impact.
- Efficiency of scouting was increased threefold, as UAVs and automated analysis replaced human inspection.
- Yield loss was reduced by 32%, attributed to early disease detection and timely treatment interventions, Yield increased by 12–15% in monitored plots.
- The system enabled a 20% reduction in chemical usage by providing precision alerts, thereby promoting more sustainable crop management practices.
YOLOv11 was also compared to other well-known deep learning models such as ResNet, DenseNet, MobileNet, and conventional ML classifiers in the study. Although CNN-based models scored high accuracy under controlled environments (>97%), they were less effective in actual real-time field use due to slower inference and high computational power requirements.
Table 3.
Comparison of conventional scouting versus crop health monitoring system across key performance metrics.
Table 3.
Comparison of conventional scouting versus crop health monitoring system across key performance metrics.
| Metric | Conventional Scouting | System | Improvement |
|---|---|---|---|
| Pesticide Use | 100% (baseline) | 74% | -26% |
| Scouting Efficiency | 1× (baseline) | 3× | +200% |
| Yield Loss | 100% (baseline) | 68% | -32% |
| Yield Improvement | – | +12–15% | +12–15% |
Comparison with Other Models
Table 4.
Comparison with other models.
| Model | Inference (ms) | Power (W) | FPS | RAM (GB) |
|---|---|---|---|---|
| YOLOv11 (Ours) | 142 | 1.8 | 5-7 FPS | 1.2 |
| YOLOv10 | 155 | 2.1 | 4-6 FPS | 1.4 |
| YOLOv8 | 175 | 2.3 | 4-5 FPS | 1.3 |
| ResNet-50 | 480 | 8.5 | <1 FPS | 3.8 |
| MobileNetV3 | 95 | 1.2 | 6-7 FPS | 0.9 |
| XGBoost | 22 | 4.1 | - | 0.4 |
| Random Forest | 18 | 4.0 | - | 0.6 |
YOLOv11, with transformer attention and light-weight design, outperformed these models in speed of detection and in detection of small, early-stage lesions that were frequently not detected by conventional models.
Challenges and Limitations
Although its performance was promising, several challenges were noted:
1. Data Limitations: The system accuracy was slightly lower for uncommon crop-disease pairings because of a shortage of annotated training data.
2. Environmental Noise: Solar radiation, soil background noise, and sensor calibration faults occasionally impacted vegetation index estimation, leading to minor prediction errors.
3. Adoption Barriers: Suburban farmers with poor internet access and limited technical skills could not optimize the system despite offline capabilities and simplified interfaces.
Implications for Sustainable Agriculture
Integration of AI, IoT, and remote sensing within this platform is essential to enhancing sustainable agriculture. Early detection helps limit overuse of pesticides, raises precision treatment levels, and makes farming environmentally friendly. It also equips smallholder farmers with advanced tools, which narrows the gap between farm technologies and rural agricultural communities.
Future Prospects
Future work is expected to focus on eliminating existing limitations by:
- Federated learning techniques to facilitate model improvement without data centralization, maintaining farmer data confidentiality.
- Predictive analysis to forecast potential outbreaks based on historical and real-time environmental data.
- Automation by robots for precision spraying with a reduction in human labor force and chemical utilization.
- Dataset increase to cover diverse crops, climatic regions, and diseases for enhanced model generalization.
Overall Discussion
The study shows that such a system can be a real game-changer for contemporary agriculture, enabling farmers to make proper decisions based on correct information rather than responding after issues are discovered. By combining the UAV imagery, IoT sensors, and high-level deep learning analytics, it provides precise, real-time information in a simple, easily consumable form that is beneficial to farmers—boosting productivity without damaging the environment. This research shows that AI-assisted systems such as the one proposed in this paper not only boost farm yields but also aid the world towards food security amid climate change and population increase.
Conclusions
This paper was able to develop and test an intelligent crop health monitoring and early disease detection system that incorporates UAV-based multispectral imaging, IoT environmental sensors, and YOLOv11-driven deep learning analytics. The system has demonstrated exceptional performance, with detection accuracy over 97% in high precision and rapid inference times, which validates its use in real-world agriculture environments. Combining the output of deep learning-based operations on images with vegetation indices and environmental data, this system forms a Composite Health Index (CHI), giving an all-embracing view of the crop health with early diagnoses and intervention strategies.
Field trials also accentuated the real-world advantages of this solution, such as a 26% decrease in pesticide use, a tripling of scouting productivity, and 32% reduction in yield loss. The farmers rated high usability, with special gratitude toward the multilingual voice-operated mobile app that brings advanced analytics within reach even to smallholder farmers in rural settings.
Aside from its direct technical outcomes, this work makes its contribution to sustainable agriculture through the encouragement of precision farming, decreased chemical use, resource savings, and protection of crop yields from disease epidemics. There are, however, some challenges that remain. These include sparse annotated datasets for uncommon crop-disease pairs, environmental heterogeneity that impacts data quality, and adoption barriers in low-connectivity rural settings. Overcoming these limitations is imperative for larger-scale scalability.
The future will witness accelerated development of the disease database through federated and transfer learning, predictive outbreak models derived from past as well as real-time weather data, and robotic precision intervention tools for precision application of pesticides. These will make the system stronger, more effective at identifying problems before they occur, and less harsh on the environment. Combining AI, IoT, and UAV technology into a single system is a huge step up from how farms can be monitored and controlled.
It puts real, useful information in farmers’ hands right when they need it, helping to close the gap between high-tech precision farming and the way most farms still operate today. By helping growers get bigger harvests, cut down on wasted resources, and farm in ways that protect the land, this system could truly change the game—not just for individual farmers, but for global food security and long-term sustainable agriculture.
References
- S. P. Mohanty, D. P. Hughes, and M. Salathé, “Using deep learning for image-based plant disease detection,” Front. Plant Sci., vol. 7, Sep. 2016, Art. no. 1419. [CrossRef]
- M. Abu John, I. Bankole, O. Ajayi-Moses, T. Ijila, T. Jeje, P. Lalit, and O. Jeje, “Relevance of advanced plant disease detection techniques in disease and pest management for ensuring food security and their implication: A review,” Amer. J. Plant Sci., vol. 14, no. 11, pp. 1260– 1295, 2023. [CrossRef]
- Kaggle, “Plant village dataset.” [Online]. Available: https://www.kaggle.com/emmarex/plantdisease.
- M. Redowan and A. H. Kanan, “Potentials and limitations of NDVI and other vegetation indices (VIS) for monitoring vegetation parameters from remotely sensed data,” Bangladesh Res. Publ. J, vol. 7, no. 3, pp. 291–299, Sept.–Oct. 2012.
- S. S. Harakannanavar, J. M. Rudagi, V. I. Puranikmath, A. Siddiqua, and R. Pramodhini, “Plant leaf disease detection using computer vision and machine learning algorithms,” Glob. Transitions Proc., vol. 3, pp. 305–310, 2022. [CrossRef]
- M. Islam, et al., “DeepCrop: Deep learning-based crop disease prediction with web application,” J. Agric. Food Res., vol. 14, Art. no. 100764, 2023. [CrossRef]
- DroneDeploy, “Agriculture report 2023.” [Online]. Available: https://www.dronedeploy.com/resources/reports/agriculture-2023.
- M. B. Khan, S. Tamkin, J. Ara, M. Alam, and H. Bhuiyan, “CropsDisNet: An AI-based platform for disease detection,” Comput. Electron. Agric., early access, Feb. 2025. [CrossRef]
- Md. M. Islam, “DeepCrop: Deep learning-based crop disease prediction with web application,” J. Agric. Food Res., vol. 14, Dec. 2023, published Aug. 28, 2023.
- Anjna, M. Sood, and P. K. Singh, “Hybrid system for detection and classification of plant disease using qualitative texture features analysis,” Procedia Comput. Sci., vol. 167, pp. 1056–1065, 2020. [CrossRef]
- R. Gajjar, N. Gajjar, V. J. Thakor, and N. P. Patel, “Real-time detection and identification of plant leaf diseases using convolutional neural networks on an embedded platform,” Vis. Comput., vol. 38, pp. 2923–2938, 2021. [CrossRef]
- M. Agarwal, V. K. Bohat, M. D. Ansari, A. Sinha, S. K. Gupta, and D. Garg, “A convolution neural network-based approach to detect the disease in corn crop,” in Proc. IEEE 9th Int. Conf. Adv. Comput. (IACC), Tiruchirappalli, India, Dec. 2019, pp. 176–181.
- H. N. Ngugi, A. A. Akinyelu, and A. E. Ezugwu, “Machine learning and deep learning for crop disease diagnosis,” Comput. Electron. Agric., published Dec. 2024. [CrossRef]
- K. R. B. Leelavathy, “Plant disease classification using VGG-16: Performance evaluation and comparative analysis,” Int. J. Environ. Sci. Technol., vol. 23, pp. 219–229, 2023.
- D. Tirkey, K. K. Singh, and S. Tripathi, “Performance analysis of AI-based solutions for crop disease identification, detection, and classification,” in Smart Agric. Technol., vol. 5, Oct. 2023. [CrossRef]
- T. Kavzoglu and A. Teke, “Predictive performances of ensemble machine learning algorithms in landslide susceptibility mapping using random forest, extreme gradient boosting (XGBoost) and natural gradient boosting (NGBoost),” Arab. J. Sci. Eng., vol. 47, pp. 7367–7385, 2022. [CrossRef]
- L. Sosa, A. Justel, and Í. Molina, “Detection of crop hail damage with a machine learning algorithm using time series of remote sensing data,” Agronomy, vol. 11, Art. no. 2078, 2021. [CrossRef]
- Sharma, V. Kumar, and L. Longchamps, “Comparative performance of YOLOv8, YOLOv9, YOLOv10, YOLOv11 and Faster R-CNN models for detection of multiple weed species,” in Smart Agric. Technol., vol. 9, Dec. 2024.
- M. A. Talukder, et al., “An efficient deep learning model to categorize brain tumor using reconstruction and fine-tuning,” Expert Syst. Appl., 2023, Art. no. 120534.
- N. Ahmed, et al., “Machine learning based diabetes prediction and development of smart web application,” Int. J. Cogn. Comput. Eng., vol. 2, pp. 229–241, 2021.
- M. D. Bah, A. Hafiane, and R. Canals, “Deep learning with unsupervised data labeling for weed detection in line crops in UAV images,” Remote Sens., vol. 10, no. 11, p. 1690, 2018.
- M. A. Talukder, M. M. Islam, M. A. Uddin, A. Akhter, K. F. Hasan, and M. A. Moni, “Machine learning-based lung and colon cancer detection using deep feature extraction and ensemble learning,” Expert Syst. Appl., vol. 205, Art. no. 117695, 2022.
- Z.-Q. Zhao, P. Zheng, S.-T. Xu, and X. Wu, “Object detection with deep learning: A review,” IEEE Trans. Neural Netw. Learn. Syst., vol. 30, no. 11, pp. 3212–3232, Nov. 2019.
- V. N. T. Le, G. Truong, and K. Alameh, “Detecting weeds from crops under complex field environments based on Faster R-CNN,” in Proc. IEEE Int. Conf., 2021, pp. 350–355.
- N. Jmour, S. Zayen, and A. Abdelkrim, “Convolutional neural networks for image classification,” in Proc. Int. Conf. Adv. Syst. Elect. Technol. (IC_ASET), Hammamet, Tunisia, 2018, pp. 397–402.
- J. Qi, et al., “An improved YOLOv5 model based on visual attention mechanism: Application to recognition of tomato virus disease,” Comput. Electron. Agric., vol. 194, Art. no. 106780, 2022. [CrossRef]
- E. Hirani, V. Magotra, J. Jain, and P. Bide, “Plant disease detection using deep learning,” in Proc. Int. Conf. Convergence Technol. (I2CT), Maharashtra, India, 2021.
- F. Ertam and G. Aydın, “Data classification with deep learning using TensorFlow,” in Proc. Int. Conf. Comput. Sci. Eng. (UBMK), 2017, pp. 755–758. [CrossRef]
- S. Pawar, S. Shedge, N. Panigrahi, A. Jyoti, P. Thorave, and S. Sayyad, “Leaf disease detection of multiple plants using deep learning,” in Proc. Int. Conf. Mach. Learn., Big Data, Cloud Parallel Comput. (COM-IT-CON), 2022, pp. 241–245.
- D. Tiwari, M. Ashish, N. Gangwar, A. Sharma, S. Patel, and S. Bhardwaj, “Potato leaf diseases detection using deep learning,” in Proc. 4th Int. Conf. Intell. Comput. Control Syst. (ICICCS), 2020, pp. 461–466.
- V. Pooja, R. Das, and V. Kanchana, “Identification of plant leaf diseases using image processing techniques,” in Proc. Int. Conf. Tech. Innov. ICT Agric. Rural Develop., 2017, pp. 130–133. [CrossRef]
- W. Shafik, A. Tufail, C. D. S. Liyanage, and R. A. A. H. M. Apong, “Using transfer learning-based plant disease classification and detection for sustainable agriculture,” BMC Plant Biol., vol. 24, pp. 1–19, 2024. [CrossRef]
- T. Hayit, H. Erbay, F. Varçın, F. Hayit, and N. Akci, “Determination of the severity level of yellow rust disease in wheat by using convolutional neural networks,” J. Plant Pathol., vol. 103, pp. 923–934, 2021. [CrossRef]
- J. Yule and R. R. Pullanagari, Optical Sensors to Assist Agricultural Crop and Pasture Management. Palmerston North, New Zealand: Massey Univ., Jan. 2012.
- H. Zhu, “Intelligent agriculture: Deep learning in UAV-based remote sensing imagery for crop diseases and pests detection,” Front. Plant Sci., vol. 15, 2024, Art. no. e1435016.
- H. M. Faisal, “Detection of cotton crops diseases using customized deep learning models including VGG16, ResNet152, EfficientNet, InceptionV3, MobileNet, and others: ResNet152 outperforms in cotton disease recognition,” Sci. Rep., 2025.
- B. V. Baiju, “Robust CRW crops leaf disease detection and classification in corn, rice, and wheat using Slender-CNN,” Plant Methods, 2025.
- Y. Ashurov, “Enhancing plant disease detection through deep learning: A modified depthwise CNN with squeeze-and-excitation blocks and improved residual skip connections,” Front. Plant Sci., 2025.
- S. Wang, et al., “Advances in deep learning applications for plant disease and pest detection: A review,” Remote Sens., vol. 17, no. 4, Art. no. 698, 2025. [CrossRef]
- R. Sujatha, S. Krishnan, J. M. Chatterjee, and A. H. Gandomi, “Advancing plant leaf disease detection integrating machine learning and deep learning,” Sci. Rep., vol. 15, Art. no. 11552, 2025. [CrossRef]
- K. Fang, R. Zhou, N. Deng, C. Li, and X. Zhu, “RLDD-YOLOv11n: Research on rice leaf disease detection based on YOLOv11,” Agronomy, vol. 15, no. 6, p. 1266, May 2025. [CrossRef]
- X. Tang, Z. Sun, L. Yang, Q. Chen, Z. Liu, P. Wang, and Y. Zhang, “YOLOv11-AIU: A lightweight detection model for the grading detection of early blight disease in tomatoes,” Plant Methods, vol. 21, Article 118, 2025. [CrossRef]
- L. Xu, B. Li, X. Fu, Z. Lu, Z. Li, B. Jiang, and S. Jia, “YOLO-MSNet: Real-time detection algorithm for pomegranate fruit improved by YOLOv11n,” Agriculture, vol. 15, no. 10, p. 1028, May 2025. [CrossRef]
Disclaimer/Publisher’s Note: The statements, opinions and data contained in all publications are solely those of the individual author(s) and contributor(s) and not of MDPI and/or the editor(s). MDPI and/or the editor(s) disclaim responsibility for any injury to people or property resulting from any ideas, methods, instructions or products referred to in the content. |
© 2025 by the authors. Licensee MDPI, Basel, Switzerland. This article is an open access article distributed under the terms and conditions of the Creative Commons Attribution (CC BY) license (http://creativecommons.org/licenses/by/4.0/).
Copyright: This open access article is published under a Creative Commons CC BY 4.0 license, which permit the free download, distribution, and reuse, provided that the author and preprint are cited in any reuse.


