Submitted:
05 September 2025
Posted:
08 September 2025
You are already at the latest version
Abstract
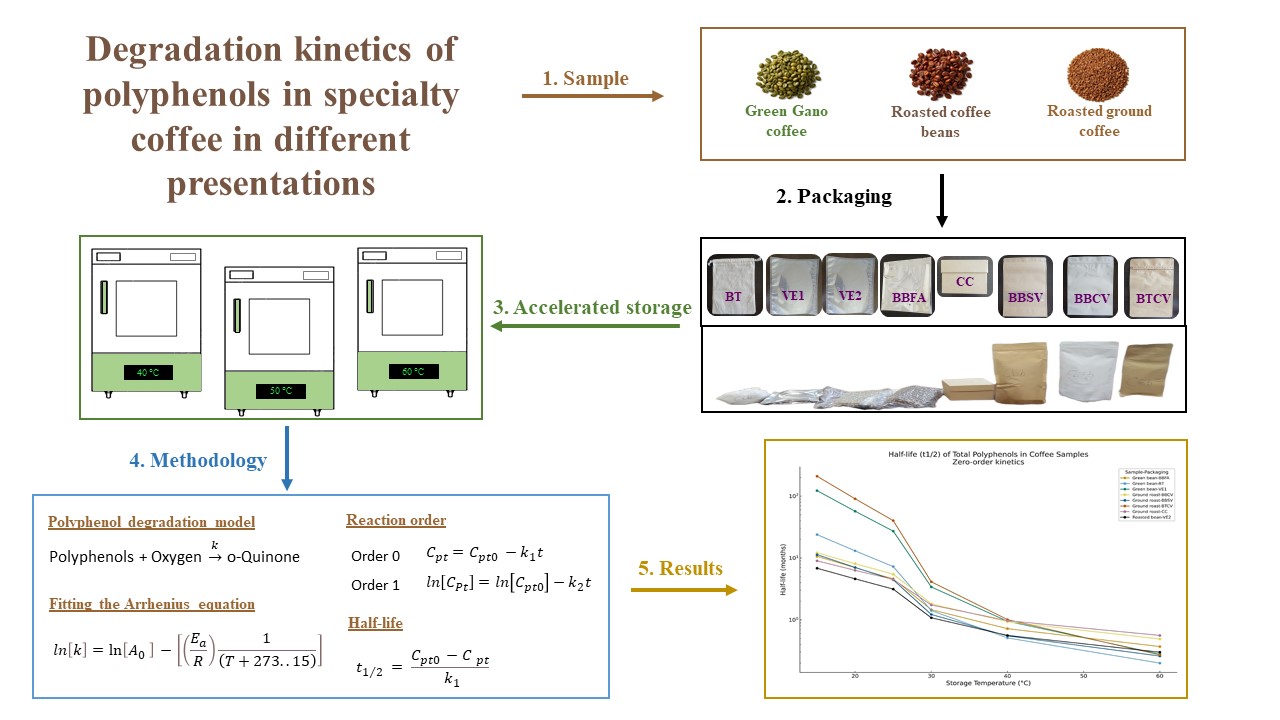
Polyphenols are chemical compounds found in plants, and coffee is an important source of them. The objective of the study was to evaluate the kinetics of polyphenol degradation in a blend of specialty coffee (green, roasted and roasted-ground beans), packaged in eight different packages, under accelerated storage conditions. The samples were stored at 40, 50 and 60 °C for 12, 8 and 4 days, respectively. The degradation kinetics was modelled by determining the reaction order, rate constants (k), activation energies (Ea) using the Arrhenius model, and half-life. The degradation followed zero-order kinetics. The rate constant (k) varied between 0.437 and 9.534 days -¹ (40-60 °C). The Ea ranged from 49.321 to 118.04 kJ*mol -¹. The predicted longest half-life for daily storage at 25 °C was obtained for: vacuum packed green beans (27.16 months), vacuum roasted beans (3.14 months) and ground roasted coffee in trilaminated foil with valve (40.21 months). Polyphenol retention decreased significantly with increasing temperature. For green bean, roasted bean and roasted ground coffee, the packaging that showed the best protection for the coffee was vacuum packaging and trilaminate with valve respectively, being crucial for preserving these bioactive compounds.
Keywords:
specialty coffee
; polyphenols
; reaction order
; decay constant
; activation energy
; accelerated storage
; Arrhenius
; half-life
1. Introduction
Coffee is one of the world’s popular beverages, noted for its psychoactive effects, pleasant taste and an important source of polyphenols [1], compounds that possess several bioactive properties that can positively influence human health [2,3,4,5,6,7,8,9,10,11,12,13,14]. Specialty coffees are characterized by the uniqueness of their quality and origin, from the selection of the seedlings to the preparation of the beverage itself [15]. Flavor and aroma are the important properties for assessing coffee quality [16,17] and consumer preferences [18]. The composition of coffee consists mainly of caffeine, diterpene, kahweol, chlorogenic acid and phenols [19], these compounds including volatiles, lipids, phenolic and alkaloids contribute to the basic taste sensation of coffee beverages, providing bitterness, astringency, strength and body to the coffee brew [20,21,22]. During roasting, simultaneous chemical reactions occur that promote the degradation of proteins, sugars, trigonelline, and chlorogenic acids [23], and the formation of substances resulting from Mallard reactions and Strecker degradation, which influence both the flavor and aroma of coffee [24,25]. Melanoidin is obtained from non-enzymatic roasting, which is responsible for the antioxidant activity of coffee [26]. The chlorogenic acid content decreases during this stage, while the melanoidin content increases [27].
Polyphenols are compounds with structures that oxidize easily, which can lead to the degradation of their antioxidant capacities [28,29]. There are two main forms of polyphenol degradation: enzymatic and non-enzymatic methods [30,31]. Enzymatic degradation involves enzymes such as polyphenol oxidase, lipoxygenase, and peroxidase [32]. Non-enzymatic degradation includes Maillard reactions, which cause phenol oxidation [33]. However, these are not the only ways in which polyphenols can be destroyed, but rather the main reactions that take place in food.
Studies show the presence of phenolic acids in green coffee (chlorogenic acid) and roasted coffee (other phenolic acids) [34,35,36], scientifically recognizing that coffee changes its chemical composition during the roasting process [25,37]. Roasted and ground coffee is considered a stable product [25]. The phenolic compounds in coffee are directly or indirectly related to the quality of the coffee in the cup [38], based on the presence of chlorogenic acids (6-12%) [35], which are responsible for the pigmentation, aroma formation, and astringency of coffee [39]. However, the thermal degradation of chlorogenic acids during roasting results in phenolic substances that contribute to bitterness [36].
It has been shown that the amount of polyphenols in coffee can vary significantly depending on the type of coffee, the roasting process, the extraction method, and storage conditions. In addition, factors such as temperature and packaging material play a crucial role in the preservation of these bioactive compounds [40,41]. Indicate that the rate of degradation of chlorogenic acids increases significantly with temperature during the storage of roasted coffee. Likewise, [7,42] show that the matrix, type of processing, and packaging are determining variables in the preservation of antioxidants [23]. Demonstrated that the roasting process has a negative influence on bioactive compounds.
The quantification, analysis, and study of the stability of polyphenols in coffee are essential for understanding their antioxidant potential and health benefits. The kinetics of polyphenol loss in coffee have been predominantly characterized as a zero-order reaction, indicating that the rate of loss does not depend on the concentration of the reactant, an observation that is consistent with the results of previous studies that analyzed the stability of these compounds [43,44,45]. When comparing linear regressions and R2 between zero-order and first-order models, the results play a fundamental role in validating which model best describes the kinetics of polyphenol loss.
This study focuses on how different packaging and storage conditions affect the stability of polyphenols in green, roasted, and ground coffee beans, using the Folin-Ciocalteu method for measurement. This method is known for its ability to quantify phenolic compounds present in many matrices, including beverages and plant extracts, and is particularly valued for its robustness and accuracy [46,47]. The objective of the study was to evaluate the kinetics of deterioration of total polyphenols in a blend of specialty coffee (Coffea arabica) in green beans, roasted beans, and ground roasted beans packaged in eight packages subjected to accelerated storage at temperatures of 40, 50, and 60 °C for 12, 8, and 4 days, respectively.
2. Materials and Methods
2.1. Materials
The sample consisted of 120 kg of a blend of specialty coffees (Blend Gourmet oro verde with 50% Geisha, 25% Caturra, and 25% Pache) with organic and quality certification, from the 2024 harvest of the Cooperativa Agraria Cafetalera Cenfrocafe in the province of Jaen, department of Cajamarca, Peru. Green coffee beans were purchased and divided into three parts: green beans, roasted beans, and ground roasted beans. The initial moisture content of the green beans was 10.5%. The samples were packaged in tocuyo bags (100% polycotton material with a light weight of 120 g/cm2), double-laminated aluminum foil (aluminum weight 92 g/m2 and permeability: 5.75 g/m2/day) and vacuum-packed in Ecotac bags for green beans; vacuum-packed in Ecotac bags (O2 Transfer Rate (OTR) 0.13 cc/m2/24 hours, 20x30 cm) for roasted coffee beans, and in pressed cardboard boxes (made of micro-corrugated, self-assembling brown kraft material, 10x10x7 cm), bilaminate bag without valve with window and zipper (14x22 cm, white, standard zipper closure), bilaminate bag (Kraft paper and aluminum) with degassing valve and zipper (14x22 cm, Kraft color, standard zipper closure, weight 145 g/m2), and in a trilaminate bag (Kraft paper, aluminum, polyethylene) with degassing valve and zipper (25x12.3 cm) for roasted ground coffee. Each container held 250 g of sample. However, the cup profile of the coffee samples and the validation of their specialty status during accelerated storage were determined using the cupping method carried out by six Q Arabica Graders [48] (Figure 1).
2.2. Preparation of the Sample
A total of 120 kg of coffee was weighed using an electronic platform scale (T-Scale, TCS-K2, Taiwan), which was distributed into three parts: for green coffee beans, 45 units per 250 g package were used, distributed as follows: 15 tocuyo packages, 15 bilaminated foil packages, and 15 vacuum-packed Ecotec bags, which were packaged using a vacuum packer (Grondoy, EVE, China); to obtain roasted ground coffee, 15 kg of green coffee beans were placed in the roaster (Probat, P12-2, USA) at an initial temperature of 185 °C and a final temperature of 210 °C for 10.5 min under a medium roast. Once the process was complete, it was left to rest for 12 hours. For packaging, 15 Ecotec bags of 250 g were used with a vacuum packer (Grondoy, EVE, China). For the roasted ground coffee, the roasting was carried out as described above and then ground using an industrial grinder (Ditting, KFA1403, Switzerland). Fifteen kg of roasted coffee were placed in the hopper for 15 min with a grind setting of level 5, obtaining ground coffee. The roasted and ground coffee was then packaged in 60 250 g containers distributed in 15 pressed cardboard boxes, 15 bilaminate containers without a valve, with a window and zipper, 15 bilaminate containers with a degassing valve and zipper, and 15 trilaminate coffee containers with a degassing valve and zipper. The packaged samples were sealed using a sealing machine (Ditting, FR-900, Switzerland), with the exception of the pressed cardboard boxes and Ecotec vacuum bags.
2.3. Accelerated Storage
Once packaging was complete, each sample was coded and stored in three ovens (FAITHFUL, GX-45BE, China). Fifteen samples per container (120 containers) were placed in each oven at temperatures of 40, 50, and 60 °C over a period of 12 days for evaluation. Once the time for each temperature had elapsed, the samples were gradually removed from the ovens for roasting (in the case of green coffee bean samples) using a roaster (PROBAT-WERKE, BRZ, Germany). 110 g of green coffee was placed at an initial temperature of 185 °C and a final temperature of 190 °C for a period of 15 min. Before grinding (for green coffee samples and roasted coffee samples), the coffee was left to rest for 10 minutes and then ground using a grinder (Mahlkönig, BRZ2, Germany). 11.55 g of coffee was placed in the hopper and ground for 3 s, with the grind size set to level 6.
2.4. Total Polyphenol Content
The total polyphenol content of each extract and its replicates was determined using the Folin-Ciocalteu method following the methodology of [49] with some modifications. Gallic acid was used as the standard: 10 mg was dissolved in distilled water to a total volume of 25 mL, obtaining the stock solution. From this, the calibration curve was prepared in the range of 0–140 mg/L. For the extracts, 25 mg of ground coffee was weighed and mixed with 5 mL of ethanol/water (80:20 v/v). The mixture was stirred in an orbital shaker (Benchmark BT302) for 30 min at 3000 rpm and then centrifuged (PRO ANALYTICAL CR 4000) at 4000 rpm for 15 min. The supernatant was filtered using Whatman N° 42 paper. For analysis, 20 µL of the extract was pipetted into microplates, followed by 800 µL of distilled water, 40 µL of 10% Folin-Ciocalteu reagent, and 160 µL of 770 mM Na2CO3. Finally, the absorbance was measured at 765 nm using a Thermo Scientific™ Multiskan SkyHigh microplate reader with touchscreen.
2.5. Polyphenol Degradation Model
2.5.1. Chemical Kinetics
Equation (1) describes the main reaction of the polyphenol degradation model [50]:
Where k is the pseudo-constant reaction rate (h−1).
2.5.2. Determination of the Reaction Order
The reaction order of chemical kinetics (zero or one order) was determined for the loss of desirable compounds (Equations (2), (3), (4), and (5)) to represent the above reaction, according to the result defined by the highest value of the coefficient of determination (R2) of the regression constructed with the data obtained from the decay of total polyphenols over time, for each storage temperature and type of container.
Where Cpt and Cpt0 are the total polyphenol content (mg/L) at a given time and at the start, respectively, t is time (s), and n is the reaction order (0 and 1).
Equations (3) and (5) were linearized, and graphs were plotted for [Cpt] versus t (Equation (6)) and ln[Cpt] versus t (Equation (7)). The rate constants k (1 or 2) were determined from the slopes of the linear graphs:
2.5.3. Calculation of Activation Energy (Ea) and Pre-Exponential Factor (A0)
With the selected reaction order, the activation energy Ea (kJ/mol) and the pre-exponential factor A0 (mg/L) were estimated using an Arrhenius-type fit via Equation (10), constructed with the slopes of the straight line graphs between ln(k) and (1/(T + 273.15)) for each temperature and packaging in the study, where R is the gas constant (8.31446 J/mol*K) and T is the constant air temperature in storage (°C).
2.5.4. Estimation of the Average Retention Time of Total Polyphenols
Using Equation (11), the half-life (t1/2) of total polyphenol retention in specialty coffee samples was calculated, following a zero-order reaction.
2.6. Statistical Analysis
The experiments were performed in triplicate, and the results were expressed using descriptive statistics with means ± standard deviations. In addition, data analysis was performed to determine whether there were significant differences in total polyphenol retention depending on the type of packaging, storage time, and temperature. For each storage temperature (40, 50, and 60 °C), a two-way analysis of variance (ANOVA) with replicates was applied, considering the type of packaging and storage time (days) as fixed factors. Subsequently, for multiple comparisons between the means of the different treatments (packages) at each measurement time, Tukey’s honestly significant difference (HSD) test was used, with a confidence level of 95% (α = 0.05). The results of this test are presented in the results tables using letters as superscripts, where means within the same sampling day that share a letter are not significantly different. The analyses were performed using the statistical software R (version 4.3.0, R Core Team, 2023) and the software used was Python through Google Colaboratory.
3. Results and Discussion
3.1. Quantification of Total Polyphenols
Figure 2 shows the calibration curve for polyphenols with respect to absorbance, establishing the regression model y = 0.0038x + 0.0051 with an R2 of 0.9781.
Tables 1, 2, and 3 show the results of polyphenol degradation during accelerated storage of coffee in three states and packaged in different types of packaging.
The results in Table 1 show that, as expected, there are no significant differences in polyphenol content on day 0 between the different types of packaging at the start of the experiment (all share the letter ‘a’), but as time passes, the differences between packaging types become more evident. Green grain in BBFA packaging and vacuum packaging (VE1) generally showed greater polyphenol retention in the early days. Towards the end of storage (day 12), the trilaminate bag (BTCV) and vacuum-packed green beans (VE1) were the packaging types that retained significantly more polyphenols, unlike the cardboard box (CC) and tocuyo bag (BT), which showed some of the greatest degradation.
The results in Table 2 show that the trilaminate bag (BTCV) is the packaging that preserves significantly more polyphenols over time (days 4, 6, and 8), followed by the bilaminate bag with aluminum foil (BBFA) for green beans and the bilaminate bag with valve (BBCV) for roasted ground coffee. On the other hand, the tocuyo bag (BT) and the vacuum-packed roasted beans (VE2) showed the worst results at the end of the period (day 8), being significantly different from the best packaging.
The results in Table 3 show that, at this extreme temperature, the degradation of polyphenols is very rapid and severe. The differences between packaging types are marked. The bilaminate bag with valve (BBCV) for roasted ground coffee showed significant superiority in polyphenol retention at the end of storage (day 4), being the only one that remained above 89 mg/L, while the bilaminated aluminum foil bag (BBFA) for green beans and the trilaminated bag (BTCV) showed some of the worst retention at this temperature, suggesting that their effectiveness may be compromised under extreme conditions.
Figure 3 shows descriptive statistics as a graphical summary of the decline in polyphenol content during accelerated storage for all coffee presentations, showing the temporal trends of polyphenols using a line graph for each temperature and evaluation day.
Furthermore, Figure 4 presents an overview of interactions using a heat map, in which it can be seen that areas with warm colors (reds and oranges) indicate the highest concentration of total polyphenols, while cool colors (yellows) show low values.
The total polyphenol content decreased significantly over time, affected by packaging material and storage conditions, particularly at high temperatures, with this decline being more pronounced in roasted beans and ground roasted beans compared to green beans. This phenomenon can be attributed to the thermal degradation of phenolic compounds during roasting and storage, thus affecting the antioxidant properties of coffee [13,40,47,51,52,53,54,55,56,57]. The Folin-Ciocalteu method, which was used to quantify polyphenols, has proven effective in determining the content of these compounds in various coffee preparations [58,59].
Table 1 shows the observed losses in polyphenol content at 40 °C. It is noteworthy that green coffee beans maintained a relatively high polyphenol content compared to the other processed formats, which is consistent with the literature suggesting that polyphenols are more abundant in unprocessed or minimally processed coffee [6,10,40]. This phenomenon may be related to the fact that green grain has less exposure to environmental factors such as light and air, which can accelerate the degradation of phenolic compounds [9].
At higher storage temperatures, as shown in Table 3 (50°C) and Table 4 (60°C), the polyphenol content decreases progressively in all types of packaging, although the impact varies depending on the type of packaging. Bilinamized bags, for example, act as effective barriers against the loss of important compounds, resulting in greater polyphenol retention compared to less efficient packaging, such as paper [5,46].
It is also interesting to note that packaging with degassing valves appears to provide additional protection against oxidation, facilitating better preservation of polyphenols in roasted ground coffee [1,60]. The effectiveness of packaging could be associated with its oxygen permeability and moisture control, critical factors in the stability of phenolic content [5]. Vacuum packaging proved more efficient at retaining polyphenols in roasted coffee compared to other types of packaging such as aluminum foil bilaminate and trilaminate bags with degassing valves [61]. This suggests that oxygen permeability and the ability to limit exposure to moisture are key factors in the stability of bioactive compounds in packaged coffee [60,62].
In conclusion, differences in polyphenol content when using different packaging suggest a detailed study of the barrier properties of each material, such as limiting exposure to oxygen and heat, which could provide additional information for preserving the polyphenol content of coffee. Therefore, the choice of packaging and storage conditions can have a significant impact on coffee quality, as well as on the health benefits associated with its consumption.
3.2. Determination of the Reaction Order
Table 4 shows the comparison of the regressions and R2 determined for the deterioration kinetics of polyphenols for zero and first order of the coffee samples under different storage conditions, which defined that the chemical reaction kinetics for the loss of phenolic compounds present in coffee exhibits a predominantly zero-order behavior.
The data obtained suggest that a zero-order model provides a better fit, indicating that the reaction of polyphenol loss under coffee storage conditions is constant over time, confirming that this phenomenon may be more related to physical factors such as temperature and exposure to oxygen than to the concentration of the polyphenols themselves [63,64,65,66]. These findings underscore the need for a consistent approach to coffee supply chain design, considering both bean quality and storage conditions to maximize the duration and effectiveness of its bioactive compounds and nutritional properties.
3.3. Determination of the Kinetic Constants of Deterioration (k)
Table 5 shows the Arrhenius equation determined for each coffee sample based on the values of the pre-exponential factor (A0) and calculated activation energy (Ea), which can be used to predict the deterioration constants at different storage temperatures to which the different coffee presentations are subjected.
The total loss of polyphenols in coffee during storage is intrinsically related to several factors, including temperature, type of packaging, and the state of the bean (green, roasted, or ground). The Arrhenius model, which relates the reaction rate to temperature through activation energy (Ea), is fundamental to understanding these phenomena. In particular, its application in assessing the stability of polyphenols at different temperatures is crucial for determining the viability of storage and the long-term quality of coffee [60,67]. For example, it has been reported that packaging that limits access to O2, such as vacuum packaging, tends to show lower Ea values, suggesting that reducing oxygen can inhibit the degradation of phenolic compounds, prolonging their effectiveness in terms of antioxidant properties [40,68]. Alternatively, packaging that allows gas exchange has shown greater loss of polyphenols at room temperature [69]. According to Arrhenius’ theory, at higher temperatures, the Ea required for the loss of polyphenols tends to be lower, causing an acceleration in the degradation process.
Likewise, it was observed that optimized packaging, such as the Ecotac bag for green beans (Ea of 107.67 kJ/mol*K), has higher Ea values, suggesting greater resistance to polyphenol degradation compared to other packaging. This could be the result of the packaging’s ability to limit the exposure of polyphenols to oxygen and moisture, two critical factors in the oxidation process [70,71]. On the other hand, the trilaminate bag packaging with degassing valve and zipper (BTCV) for roasted ground coffee showed an Ea value of 118.04 kJ/mol*K, which was the highest in the study. This result could indicate that the packaging design is particularly effective in retaining the quality of polyphenols, allowing for a gradual decrease in their oxidative degradation due to its sophisticated preservation methodology [72,73]. The high capacity of this packaging to minimize exposure to air and control O2 transfer is crucial for maintaining the stability of these compounds at higher temperatures [74]. In contrast, packaging with lower Ea values, such as pressed cardboard boxes with 49,321 kJ/mol*K for roasted and ground coffee, appear to be more susceptible to rapid polyphenol degradation. This phenomenon can be attributed to its design, which may allow more direct contact with O2 and, therefore, an increase in the oxidation rate of polyphenols [75,76]. The permeability of cardboard can facilitate the diffusion of O2 and moisture into the packaging, accelerating the degradation process [77].
Furthermore, it can be seen that the order of Ea values among the different forms of coffee (green beans, roasted beans, and ground coffee) is also clear. Green beans, which are more susceptible to repeated oxidation processes under high temperature conditions, may undergo slow degradation in more preferred packaging that adequately protects the chemical integrity of polyphenols [78,79]. In general, differences in Ea values reflect not only the chemical nature of the phenolic compounds present, but also variations in the storage atmosphere generated by the type of packaging used [80,81].
3.4. Estimated Half-Life of Total Polyphenol Retention
Table 6 shows the calculated values of the kinetic constants of deterioration (k) and half-lives (t1/2) (where half of the total polyphenol concentration is lost), following zero-order chemical kinetics, for coffee samples at the acceleration temperatures of the study (40, 50, and 60°C) and at the everyday storage temperatures of supermarkets and homes (15, 20, and 25°C).
The data in Table 6 show that green coffee in Ecotac bags (VE1) exhibits a t1/2 of 122.45 months at 15 °C, as opposed to 0.20 months at 60 °C. This phenomenon of accelerated degradation can be attributed to high temperatures, which potentially promote undesirable chemical reactions that lead to the loss of bioactive compounds such as polyphenols. The literature supports this observation, suggesting that proper temperature management during storage is essential for preserving phenolic compounds in coffee [40,55,82]. Bilaminate aluminum foil packaging (BBFA) and tocuyo bags (BT) demonstrate different levels of effectiveness in terms of polyphenol retention. For example, green coffee beans in BBFA packaging have a shelf life of 10.63 months at 15 °C, which is significantly less than green coffee stored in vacuum packaging. These findings underscore how packaging material can affect the exposure of products to light and oxygen, factors that are known to contribute to the oxidation of polyphenols [14,60]. In the case of roasted coffee, it can be seen that the t1/2 values are considerably lower than those for green coffee. For example, coffee roasted in an Ecotac bag (VE2) has a t1/2 of only 6.82 months at 15 °C. The reduction in stability can be attributed to the roasting process, which on the one hand improves the sensory profile of coffee but, on the other, can lead to the degradation of phenolic compounds such as chlorogenic acids, which are vital for the antioxidant properties of coffee [68,82,83]. According to the evaluation of t1/2 at 60 °C, both roasted and green coffee beans exhibit extremely low polyphenol retention times. This indicates that, as the temperature increases, not only is faster oxidation promoted, but the formation of compounds is also favored which, although they may be more volatile and less desirable, can contribute to changes in the organoleptic characteristics of the beverage [6,39].
Analysis of the rate constant (k) provides further context for these data. It can be observed that k increases considerably with rising temperature, confirming a direct relationship between temperature and the rate of polyphenol degradation. This pattern is consistent with various studies that highlight that increased temperature accelerates the kinetics of chemical oxidation reactions, which are responsible for the decline in coffee quality [39,68,83].
4. Conclusions
The evaluation of the kinetics of polyphenol deterioration in different forms of specialty coffee and its correlation with various packaging systems has provided fundamental information on the stability and preservation of these bioactive compounds under accelerated storage conditions. The polyphenol loss reaction fits a zero-order kinetic model, indicating that the decay of bioactive compounds under specialty coffee storage conditions is constant over time, suggesting that this phenomenon may be more related to external physical factors such as temperature and oxygen exposure than to the concentration of the polyphenols themselves. The degradation rate constants found reflect an inverse relationship between temperature and shelf life. The data indicate that packaging such as aluminum trilaminate bags and vacuum bags proved effective in controlled environments, while cardboard containers showed lower polyphenol retention. Therefore, this study highlights the complexity of the degradation kinetics of polyphenols in coffee and the critical influence of storage and packaging systems. These findings are highly relevant to the coffee industry, suggesting that the appropriate selection of packaging and optimal storage conditions can significantly extend the shelf life of polyphenols, thus contributing to the preservation of coffee quality in the market.
Author Contributions
Conceptualization, F.F. and L.Q.; methodology, F.F. and E.C; formal analysis, L.Q.; investigation, F.F., L.Q. and E.C.; resources, S.C.; writing—original draft preparation, F.F.; writing—review and editing, L.Q. and S.C.; visualization, S.C.; supervision, F.F. and E.C.; project administration, F.F.; funding acquisition, F.F., L.Q., S.C. and L.Q. All authors have read and agreed to the published version of the manuscript.
Funding
This research was funded by the National Program for Scientific Research and Advanced Studies (PROCIENCIA) of the National Council for Science and Technology (CONCYTEC-PERU), under Contract No. PE501087000-2024, as well as APC funding.
Institutional Review Board Statement
Not applicable.
Data Availability Statement
The original contributions presented in this study are included in this article. For further information, please contact the corresponding author.
Acknowledgments
The authors would like to thank the Data Science Research Institute at the National University of Jaen, Peru, the Faculty of Animal Science, Biotechnology, Agribusiness, and Data Science at Toribio Rodriguez de Mendoza National University, Amazonas, Peru, and Falcon Coffees Peru S.R.L. for providing the facilities and materials for the experiments.
Conflicts of Interest
The authors declare no conflicts of interest.
References
- Ponder, A.; Krakówko, K.; Kruk, M.; Kuliński, S.; Magoń, R.; Ziółkowski, D.; Jariene, E.; Hallmann, E. Organic and Conventional Coffee Beans, Infusions, and Grounds as a Rich Sources of Phenolic Compounds in Coffees from Different Origins. Molecules 2025, 30, 1290. [Google Scholar] [CrossRef]
- Bagó-Mas, A.; Korimová, A.; Deulofeu, M.; Verdú, E.; Fiol, N.; Svobodová, V.; Dubovỳ, P.; Boadas-Vaello, P. Polyphenolic Grape Stalk and Coffee Extracts Attenuate Spinal Cord Injury-Induced Neuropathic Pain Development in ICR-CD1 Female Mice. Sci. Rep. 2022, 12, 14980. [Google Scholar] [CrossRef]
- Burkholder-Cooley, N.; Rajaram, S.; Haddad, E.; Fraser, G.E.; Jaceldo-Siegl, K. Comparison of Polyphenol Intakes According to Distinct Dietary Patterns and Food Sources in the Adventist Health Study-2 Cohort. Br. J. Nutr. 2016, 115, 2162–2169. [Google Scholar] [CrossRef]
- Del Bo’, C.; Bernardi, S.; Marino, M.; Porrini, M.; Tucci, M.; Guglielmetti, S.; Cherubini, A.; Carrieri, B.; Kirkup, B.; Kroon, P. Systematic Review on Polyphenol Intake and Health Outcomes: Is There Sufficient Evidence to Define a Health-Promoting Polyphenol-Rich Dietary Pattern? Nutrients 2019, 11, 1355. [Google Scholar] [CrossRef] [PubMed]
- Erdem, S.A.; Senol, F.S.; Budakoglu, E.; Orhan, I.E.; Sener, B. Exploring in Vitro Neurobiological Effects and High-Pressure Liquid Chromatography-Assisted Quantitation of Chlorogenic Acid in 18 Turkish Coffee Brands. J. Food Drug Anal. 2016, 24, 112–120. [Google Scholar] [CrossRef]
- Fukushima, Y.; Tashiro, T.; Kumagai, A.; Ohyanagi, H.; Horiuchi, T.; Takizawa, K.; Sugihara, N.; Kishimoto, Y.; Taguchi, C.; Tani, M.; et al. Coffee and Beverages Are the Major Contributors to Polyphenol Consumption from Food and Beverages in Japanese Middle-Aged Women. J. Nutr. Sci. 2014, 3, e48. [Google Scholar] [CrossRef] [PubMed]
- Giulia, S.; Eloisa, B.; Giulia, R.; Gloria, P.; Carlo, B.; Erica, L. Evaluation of the Behaviour of Phenols and Alkaloids in Samples of Roasted and Ground Coffee Stored in Different Types of Packaging: Implications for Quality and Shelf Life. Food Res. Int. 2023, 174, 113548. [Google Scholar] [CrossRef]
- Lee, A.H.; Tan, L. ’B; Hiramatsu, N.; Ishisaka, A.; Alfonso, H.; Tanaka, A.; Uemura, N.; Fujiwara, Y.; Takechi, R. Plasma Concentrations of Coffee Polyphenols and Plasma Biomarkers of Diabetes Risk in Healthy Japanese Women. Nutr. Diabetes 2016, 6, e212–e212. [CrossRef]
- Loftfield, E.; Shiels, M.S.; Graubard, B.I.; Katki, H.A.; Chaturvedi, A.K.; Trabert, B.; Pinto, L.A.; Kemp, T.J.; Shebl, F.M.; Mayne, S.T.; et al. Associations of Coffee Drinking with Systemic Immune and Inflammatory Markers. Cancer Epidemiol. Biomarkers Prev. 2015, 24, 1052–1060. [Google Scholar] [CrossRef]
- Miranda, A.M.; Steluti, J.; Fisberg, R.M.; Marchioni, D.M. Dietary Intake and Food Contributors of Polyphenols in Adults and Elderly Adults of Sao Paulo: A Population-Based Study. Br. J. Nutr. 2016, 115, 1061–1070. [Google Scholar] [CrossRef] [PubMed]
- Rudrapal, M.; Khairnar, S.J.; Khan, J.; Dukhyil, A.B.; Ansari, M.A.; Alomary, M.N.; Alshabrmi, F.M.; Palai, S.; Deb, P.K.; Devi, R. Dietary Polyphenols and Their Role in Oxidative Stress-Induced Human Diseases: Insights Into Protective Effects, Antioxidant Potentials and Mechanism(s) of Action. Front. Pharmacol. 2022, 13. [Google Scholar] [CrossRef]
- Socała, K.; Szopa, A.; Serefko, A.; Poleszak, E.; Wlaź, P. Neuroprotective Effects of Coffee Bioactive Compounds: A Review. Int. J. Mol. Sci. 2021, 22, 107. [Google Scholar] [CrossRef]
- Tajik, N.; Tajik, M.; Mack, I.; Enck, P. The Potential Effects of Chlorogenic Acid, the Main Phenolic Components in Coffee, on Health: A Comprehensive Review of the Literature. Eur. J. Nutr. 2017, 56, 2215–2244. [Google Scholar] [CrossRef]
- Yamagata, K. Do Coffee Polyphenols Have a Preventive Action on Metabolic Syndrome Associated Endothelial Dysfunctions? An Assessment of the Current Evidence. Antioxidants 2018, 7, 26. [Google Scholar] [CrossRef]
- Várady, M.; Tauchen, J.; Fraňková, A.; Klouček, P.; Popelka, P. Effect of Method of Processing Specialty Coffee Beans (Natural, Washed, Honey, Fermentation, Maceration) on Bioactive and Volatile Compounds. LWT 2022, 172, 114245. [Google Scholar] [CrossRef]
- Córdoba, N.; Moreno, F.L.; Osorio, C.; Velásquez, S.; Fernandez-Alduenda, M.; Ruiz-Pardo, Y. Specialty and Regular Coffee Bean Quality for Cold and Hot Brewing: Evaluation of Sensory Profile and Physicochemical Characteristics. LWT 2021, 145, 111363. [Google Scholar] [CrossRef]
- Merga Sakata, W.; Gebreselassie Abtew, W.; Garedew, W. Organoleptic Quality Attributes and Their Association with Morphological Traits in Arabica Coffee (Coffea Arabica L.) Genotypes. J. Food Qual. 2022, 2022, 2906424. [Google Scholar] [CrossRef]
- Rune, C.J.B.; Münchow, M.; Perez-Cueto, F.J.A.; Giacalone, D. Pairing Coffee with Basic Tastes and Real Foods Changes Perceived Sensory Characteristics and Consumer Liking. Int. J. Gastron. Food Sci. 2022, 30, 100591. [Google Scholar] [CrossRef]
- Martins, V. de C.; da Silva, M.A.E.; da Veiga, V.F.; Pereira, H.M.G.; de Rezende, C.M. Ent-Kaurane Diterpenoids from Coffea Genus: An Update of Chemical Diversity and Biological Aspects. Molecules 2025, 30, 59. [CrossRef]
- Amiri, R.; Akbari, M.; Moradikor, N. Chapter Two - Bioactive Potential and Chemical Compounds of Coffee. In Progress in Brain Research; Moradikor, N., Chatterjee, I., Eds.; Neuroscience of Coffee Part A; Elsevier, 2024; Vol. 288, pp. 23–33.
- Hameed, A.; Hussain, S.A.; Ijaz, M.U.; Ullah, S.; Pasha, I.; Suleria, H.A.R. Farm to Consumer: Factors Affecting the Organoleptic Characteristics of Coffee. II: Postharvest Processing Factors. Compr. Rev. Food Sci. Food Saf. 2018, 17, 1184–1237. [Google Scholar] [CrossRef]
- Hu, G.-L.; Alafifi, J.H.; Quan, C.-X.; Al-Romaima, A.; Qiu, M.-H. Exploring the Complexities of Bitterness: A Comprehensive Review of Methodologies, Bitterants, and Influencing Factors Centered around Coffee Beverage. Crit. Rev. Food Sci. Nutr. 2025, 0, 1–17. [Google Scholar] [CrossRef]
- Lapčíková, B.; Lapčík, L.; Barták, P.; Valenta, T.; Dokládalová, K. Effect of Extraction Methods on Aroma Profile, Antioxidant Activity and Sensory Acceptability of Specialty Coffee Brews. Foods 2023, 12, 4125. [Google Scholar] [CrossRef]
- da Costa, D.S.; Albuquerque, T.G.; Costa, H.S.; Bragotto, A.P.A. Thermal Contaminants in Coffee Induced by Roasting: A Review. Int. J. Environ. Res. Public. Health 2023, 20, 5586. [Google Scholar] [CrossRef]
- Tarigan, E.B.; Wardiana, E.; Hilmi, Y.S.; Komarudin, N.A. The Changes in Chemical Properties of Coffee during Roasting: A Review. IOP Conf. Ser. Earth Environ. Sci. 2022, 974, 012115. [Google Scholar] [CrossRef]
- Grzelczyk, J.; Budryn, G.; Kołodziejczyk, K.; Ziętala, J. The Influence of Maceration and Flavoring on the Composition and Health-Promoting Properties of Roasted Coffee. Nutrients 2024, 16, 2823. [Google Scholar] [CrossRef] [PubMed]
- Misto, M.; Lestari, N.P.; Purwandari, E. Chlorogenic Acid Content of Local Robusta Coffee at Variations of Roasting Temperature. J. Pendidik. Fis. Indones. 2022, 18, 25–32. [Google Scholar] [CrossRef]
- Cao, H.; Saroglu, O.; Karadag, A.; Diaconeasa, Z.; Zoccatelli, G.; Conte-Junior, C.A.; Gonzalez-Aguilar, G.A.; Ou, J.; Bai, W.; Zamarioli, C.M.; et al. Available Technologies on Improving the Stability of Polyphenols in Food Processing. Food Front. 2021, 2, 109–139. [Google Scholar] [CrossRef]
- Lv, Q.; Long, J.; Gong, Z.; Nong, K.; Liang, X.; Qin, T.; Huang, W.; Yang, L. Current State of Knowledge on the Antioxidant Effects and Mechanisms of Action of Polyphenolic Compounds. Nat. Prod. Commun. 2021, 16, 1934578X211027745. [Google Scholar] [CrossRef]
- Huang, B.; Zhang, Z.; Ding, N.; Zhuang, Y.; Zhang, G.; Fei, P. Preparation of Acylated Chitosan with Caffeic Acid in Non-Enzymatic and Enzymatic Systems: Characterization and Application in Pork Preservation. Int. J. Biol. Macromol. 2022, 194, 246–253. [Google Scholar] [CrossRef]
- Tilley, A.; McHenry, M.P.; McHenry, J.A.; Solah, V.; Bayliss, K. Enzymatic Browning: The Role of Substrates in Polyphenol Oxidase Mediated Browning. Curr. Res. Food Sci. 2023, 7, 100623. [Google Scholar] [CrossRef]
- López-Nicolás, J.; García-Carmona, F. Enzymatic and Nonenzymatic Degradation of Polyphenols. In Fruit and Vegetable Phytochemicals; John Wiley & Sons, Ltd., 2009; pp. 101–129 ISBN 978-0-8138-0939-7.
- Vauzour, D.; Rodriguez-Mateos, A.; Corona, G.; Oruna-Concha, M.J.; Spencer, J.P.E. Polyphenols and Human Health: Prevention of Disease and Mechanisms of Action. Nutrients 2010, 2, 1106–1131. [Google Scholar] [CrossRef]
- Chia-Fang, T.; Irvan, J.J. The Analysis of Chlorogenic Acid and Caffeine Content and Its Correlation with Coffee Bean Color under Different Roasting Degree and Sources of Coffee (Coffea Arabica Typica). Processes 2021, 9, 2040. [Google Scholar] [CrossRef]
- Cwiková, O.; Komprda, T.; Šottníková, V.; Svoboda, Z.; Simonová, J.; Slováček, J.; Jůzl, M. Effects of Different Processing Methods of Coffee Arabica on Colour, Acrylamide, Caffeine, Chlorogenic Acid, and Polyphenol Content. Foods 2022, 11, 3295. [Google Scholar] [CrossRef]
- Yi, K.K.; Jae-Min, L.; Young, J.K.; Wook, K. Alterations in pH of Coffee Bean Extract and Properties of Chlorogenic Acid Based on the Roasting Degree. Foods 2024, 13, 1757. [Google Scholar] [CrossRef]
- LIczbiński, P.; Bukowska, B. Polifenoles Del Té y Del Café y Sus Propiedades Biológicas Según Las Últimas Investigaciones in Vitro. Ind. Crops Prod. 2022, 175, 114265. [Google Scholar] [CrossRef] [PubMed]
- Hall, R.D.; Trevisan, F.; de Vos, R.C.H. Coffee Berry and Green Bean Chemistry – Opportunities for Improving Cup Quality and Crop Circularity. Food Res. Int. 2022, 151, 110825. [Google Scholar] [CrossRef] [PubMed]
- Maksimowski, D.; Pachura, N.; Oziembłowski, M.; Nawirska-Olszańska, A.; Szumny, A. Coffee Roasting and Extraction as a Factor in Cold Brew Coffee Quality. Appl. Sci. 2022, 12, 2582. [Google Scholar] [CrossRef]
- Król, K.; Gantner, M.; Tatarak, A.; Hallmann, E. The Content of Polyphenols in Coffee Beans as Roasting, Origin and Storage Effect. Eur. Food Res. Technol. 2020, 246, 33–39. [Google Scholar] [CrossRef]
- Saeed, M.; Musa Özcan, M.; Uslu, N.; Salamatullah, A.M.; Hayat, K. Effect of Microwave and Oven Roasting Methods on Total Phenol, Antioxidant Activity, Phenolic Compounds, and Fatty Acid Compositions of Coffee Beans. J. Food Process. Preserv. 2020, 44, e14874. [Google Scholar] [CrossRef]
- Sánchez-Rangel, J.C.; Benavides, J.; Heredia, J.B.; Cisneros-Zevallos, L.; Jacobo-Velázquez, D.A. The Folin–Ciocalteu Assay Revisited: Improvement of Its Specificity for Total Phenolic Content Determination. Anal. Methods 2013, 5, 5990–5999. [Google Scholar] [CrossRef]
- Anese, M.; Manzocco, L.; Nicoli, M.C. Modeling the Secondary Shelf Life of Ground Roasted Coffee. J. Agric. Food Chem. 2006, 54, 5571–5576. [Google Scholar] [CrossRef]
- Cruz, R.G. da; Vieira, T.M.F. de S. ; Lira, S.P. de Potential Antioxidant of Brazilian Coffee from the Region of Cerrado. Food Sci. Technol. 2018, 38, 447–453. [Google Scholar] [CrossRef]
- Priftis, A.; Stagos, D.; Konstantinopoulos, K.; Tsitsimpikou, C.; Spandidos, D.A.; Tsatsakis, A.M.; Tzatzarakis, M.N.; Kouretas, D. Comparison of Antioxidant Activity between Green and Roasted Coffee Beans Using Molecular Methods. Mol. Med. Rep. 2015, 12, 7293–7302. [Google Scholar] [CrossRef] [PubMed]
- D’Agostino, C.; Chillocci, C.; Polli, F.; Surace, L.; Simonetti, F.; Agostini, M.; Brutti, S.; Mazzei, F.; Favero, G.; Zumpano, R. Smartphone-Based Electrochemical Biosensor for On-Site Nutritional Quality Assessment of Coffee Blends. Molecules 2023, 28, 5425. [Google Scholar] [CrossRef]
- Dwiecki, K.; Nogala-Kałucka, M.; Polewski, K. Determination of Total Phenolic Compounds in Common Beverages Using CdTe Quantum Dots. J. Food Process. Preserv. 2017, 41, e12863. [Google Scholar] [CrossRef]
- Louzada Pereira, L.; Carvalho Guarçoni, R.; Soares De Souza, G.; Brioschi Junior, D.; Rizzo Moreira, T.; Schwengber Ten Caten, C. Propositions on the Optimal Number of Q-Graders and R-Graders. J. Food Qual. 2018, 2018, 1–7. [Google Scholar] [CrossRef]
- Kc, Y.; Parajuli, A.; Khatri, B.B.; Shiwakoti, L.D. Phytochemicals and Quality of Green and Black Teas from Different Clones of Tea Plant. J. Food Qual. 2020, 2020, 1–13. [Google Scholar] [CrossRef]
- Teh, Q.T.M.; Tan, G.L.Y.; Loo, S.M.; Azhar, F.Z.; Menon, A.S.; Hii, C.L. The Drying Kinetics and Polyphenol Degradation of Cocoa Beans. J. Food Process Eng. 2016, 39, 484–491. [Google Scholar] [CrossRef]
- Durak, A.; Gawlik-Dziki, U. The Study of Interactions between Active Compounds of Coffee and Willow ( Salix Sp.) Bark Water Extract. BioMed Res. Int. 2014, 2014, 1–11. [Google Scholar] [CrossRef]
- González-González, G.M.; Palomo-Ligas, L.; Nery-Flores, S.D.; Ascacio-Valdés, J.A.; Sáenz-Galindo, A.; Flores-Gallegos, A.C.; Zakaria, Z.A.; Aguilar, C.N.; Rodríguez-Herrera, R. Coffee Pulp as a Source for Polyphenols Extraction Using Ultrasound, Microwave, and Green Solvents. Environ. Qual. Manag. 2022, 32, 451–461. [Google Scholar] [CrossRef]
- Hečimović, I.; Belščak-Cvitanović, A.; Horžić, D.; Komes, D. Comparative Study of Polyphenols and Caffeine in Different Coffee Varieties Affected by the Degree of Roasting. Food Chem. 2011, 129, 991–1000. [Google Scholar] [CrossRef] [PubMed]
- Hidayat, M.A.; Puspitaningtyas, N.; Gani, A.A.; Kuswandi, B. Rapid Test for the Determination of Total Phenolic Content in Brewed-Filtered Coffee Using Colorimetric Paper. J. Food Sci. Technol. 2017, 54, 3384–3390. [Google Scholar] [CrossRef] [PubMed]
- Husniati, H.; Oktiani, D. Chlorogenic Acid Isolation from Coffee as Affected by the Homogeneity of Cherry Maturity. Pelita Perkeb. 2019, 35, 119–124. [Google Scholar] [CrossRef]
- Oktaviani, L.; Astuti, D.I.; Rosmiati, M.; Abduh, M.Y. Fermentation of Coffee Pulp Using Indigenous Lactic Acid Bacteria with Simultaneous Aeration to Produce Cascara with a High Antioxidant Activity. Heliyon 2020, 6. [Google Scholar] [CrossRef]
- Severini, C.; Derossi, A.; Ricci, I.; Caporizzi, R.; Fiore, A. Roasting Conditions, Grinding Level and Brewing Method Highly Affect the Healthy Benefits of a Coffee Cup. Int J Clin Nutr Diet 2018, 4, 127. [Google Scholar] [CrossRef]
- Wierzejska, R.E.; Gielecińska, I.; Hallmann, E.; Wojda, B. Polyphenols vs. Caffeine in Coffee from Franchise Coffee Shops: Which Serving of Coffee Provides the Optimal Amount of This Compounds to the Body. Molecules 2024, 29, 2231. [Google Scholar] [CrossRef]
- Zhang, Q.; Zhang, J.; Shen, J.; Silva, A.; Dennis, D.A.; Barrow, C.J. A Simple 96-Well Microplate Method for Estimation of Total Polyphenol Content in Seaweeds. J. Appl. Phycol. 2006, 18, 445–450. [Google Scholar] [CrossRef]
- Derossi, A.; Ricci, I.; Caporizzi, R.; Fiore, A.; Severini, C. How Grinding Level and Brewing Method (Espresso, American, Turkish) Could Affect the Antioxidant Activity and Bioactive Compounds in a Coffee Cup. J. Sci. Food Agric. 2018, 98, 3198–3207. [Google Scholar] [CrossRef]
- Agustini, S.; Yusya, M.K. The Effect of Packaging Materials on the Physicochemical Stability of Ground Roasted Coffee. Curr. Res. Biosci. Biotechnol. 2020, 1, 66–70. [Google Scholar] [CrossRef]
- Vamanu, E.; Gatea, F.; Pelinescu, D.R. Bioavailability and Bioactivities of Polyphenols Eco Extracts from Coffee Grounds after In Vitro Digestion. Foods 2020, 9, 1281. [Google Scholar] [CrossRef] [PubMed]
- Kawada, T. Estimated Dietary Polyphenol Intake and Major Food Sources. Br. J. Nutr. 2021, 126, 1758–1758. [Google Scholar] [CrossRef] [PubMed]
- Mariotti-Celis, M.S.; Martínez-Cifuentes, M.; Huamán-Castilla, N.; Vargas-González, M.; Pedreschi, F.; Pérez-Correa, J.R. The Antioxidant and Safety Properties of Spent Coffee Ground Extracts Impacted by the Combined Hot Pressurized Liquid Extraction–Resin Purification Process. Molecules 2018, 23, 21. [Google Scholar] [CrossRef]
- Mehaya, F.M.; Mohammad, A.A. Thermostability of Bioactive Compounds during Roasting Process of Coffee Beans. Heliyon 2020, 6. [Google Scholar] [CrossRef]
- Müller, C.; Hofmann, T. Quantitative Studies on the Formation of Phenol/2-Furfurylthiol Conjugates in Coffee Beverages toward the Understanding of the Molecular Mechanisms of Coffee Aroma Staling. J. Agric. Food Chem. 2007, 55, 4095–4102. [Google Scholar] [CrossRef]
- Tantoush, Z.; Apostolovic, D.; Kravic, B.; Prodic, I.; Mihajlovic, L.; Stanic-Vucinic, D.; Cirkovic Velickovic, T. Green Tea Catechins of Food Supplements Facilitate Pepsin Digestion of Major Food Allergens, but Hampers Their Digestion If Oxidized by Phenol Oxidase. J. Funct. Foods 2012, 4, 650–660. [Google Scholar] [CrossRef]
- Grosso, G.; Stepaniak, U.; Topor-Mądry, R.; Szafraniec, K.; Pająk, A. Estimated Dietary Intake and Major Food Sources of Polyphenols in the Polish Arm of the HAPIEE Study. Nutrition 2014, 30, 1398–1403. [Google Scholar] [CrossRef] [PubMed]
- Odžaković, B.; Džinić, N.; Kukrić, Z.; Grujić, S. Influence of Coffee Blends and Roasting Process on the Antioxidant Activity of Coffee. J. Eng. Process. Manag. 2019, 11, 106–111. [Google Scholar] [CrossRef]
- Basheer, V.A.; Muthusamy, S. Mathematical Modeling and Kinetic Behavior of Indian Umblachery Cow Butter and Its Nutritional Degradation Analysis under Modified Atmospheric Packaging Technique. J. Food Process Eng. 2022, 45, e14042. [Google Scholar] [CrossRef]
- Bitton, R.; Berglin, M.; Elwing, H.; Colin, C.; Delage, L.; Potin, P.; Bianco-Peled, H. The Influence of Halide-Mediated Oxidation on Algae-Born Adhesives. Macromol. Biosci. 2007, 7, 1280–1289. [Google Scholar] [CrossRef]
- Anis, N.; Ahmed, D. Modelling and Optimization of Polyphenol and Antioxidant Extraction from Rumex Hastatus by Green Glycerol-Water Solvent According to Response Surface Methodology. Heliyon 2022, 8. [Google Scholar] [CrossRef]
- Gago, B.; Lundberg, J.O.; Barbosa, R.M.; Laranjinha, J. Red Wine-Dependent Reduction of Nitrite to Nitric Oxide in the Stomach. Free Radic. Biol. Med. 2007, 43, 1233–1242. [Google Scholar] [CrossRef]
- Jokić, S.; Velić, D.; Bilić, M.; Bucić-Kojić, A.; Planinić, M.; Tomas, S. Modelling of Solid-Liquid Extraction Process of Total Polyphenols from Soybeans. Czech J. Food Sci. 2010, 28, 206–212. [Google Scholar] [CrossRef]
- Makris, D.P. Kinetics of Ultrasound-Assisted Flavonoid Extraction from Agri-Food Solid Wastes Using Water/Glycerol Mixtures. Resources 2016, 5, 7. [Google Scholar] [CrossRef]
- Wijngaard, H.H.; Brunton, N. The Optimisation of Solid–Liquid Extraction of Antioxidants from Apple Pomace by Response Surface Methodology. J. Food Eng. 2010, 96, 134–140. [Google Scholar] [CrossRef]
- Bors, W.; Christa, M.; Stettmaier, K.; Yinrong, L.; L. Yeap, F. Antioxidant Mechanisms of Polyphenolic Caffeic Acid Oligomers, Constituents of Salvia Officinalis. Biol. Res. 2004, 37, 301–311. [CrossRef]
- Mostafa, H.S.; El Azab, E.F. Efficacy of Green Coffee as an Antioxidant in Beef Meatballs Compared with Ascorbic Acid. Food Chem. X 2022, 14, 100336. [Google Scholar] [CrossRef] [PubMed]
- Psarra, C.; Gortzi, O.; Makris, D.P. Kinetics of Polyphenol Extraction from Wood Chips in Wine Model Solutions: Effect of Chip Amount and Botanical Species: Polyphenol Extraction from Wooden Chips in Wine Model. J. Inst. Brew. 2015, 121, 207–212. [Google Scholar] [CrossRef]
- Dordevic, S.; Dordevic, D.; Danilović, B.; Tremlova, B.; Gablo, N. Development of Edible/Biodegradable Packaging Based on κ-Carrageenan with Spent Coffee Grounds as Active Additives. Adv. Technol. 2023, 12, 57–62. [Google Scholar] [CrossRef]
- Fan, Z.; Li, L.; Bai, X.; Zhang, H.; Liu, Q.; Zhang, H.; Fu, Y.; Moyo, R. Extraction Optimization, Antioxidant Activity, and Tyrosinase Inhibitory Capacity of Polyphenols from Lonicera Japonica. Food Sci. Nutr. 2019, 7, 1786–1794. [Google Scholar] [CrossRef]
- Simedru, D.; Becze, A. Complex Profiling of Roasted Coffee Based on Origin and Production Scale. Agriculture 2023, 13, 1146. [Google Scholar] [CrossRef]
- Cho, A.R.; Park, K.W.; Kim, K.M.; Kim, S.Y.; Han, J. Influence of Roasting Conditions on the Antioxidant Characteristics of Colombian Coffee (Coffea Arabica L.) Beans. J. Food Biochem. 2014, 38, 271–280. [Google Scholar] [CrossRef]
Figure 1.
Cup scores for each presentation and packaging during accelerated storage at 40°C (a), 50°C (b), and 60°C (c). BT: tocuyo bag. BBFA: bilaminated aluminum foil bag. VE1: Ecotac vacuum bag with green beans. VE2: Ecotac vacuum bag with roasted beans. CC: pressed cardboard box. BBSV: bilaminated bag without valve, with window and zipper. BBCV: bilaminated bag with degassing valve and zipper. BTCV: trilaminate bag with degassing valve and zipper.
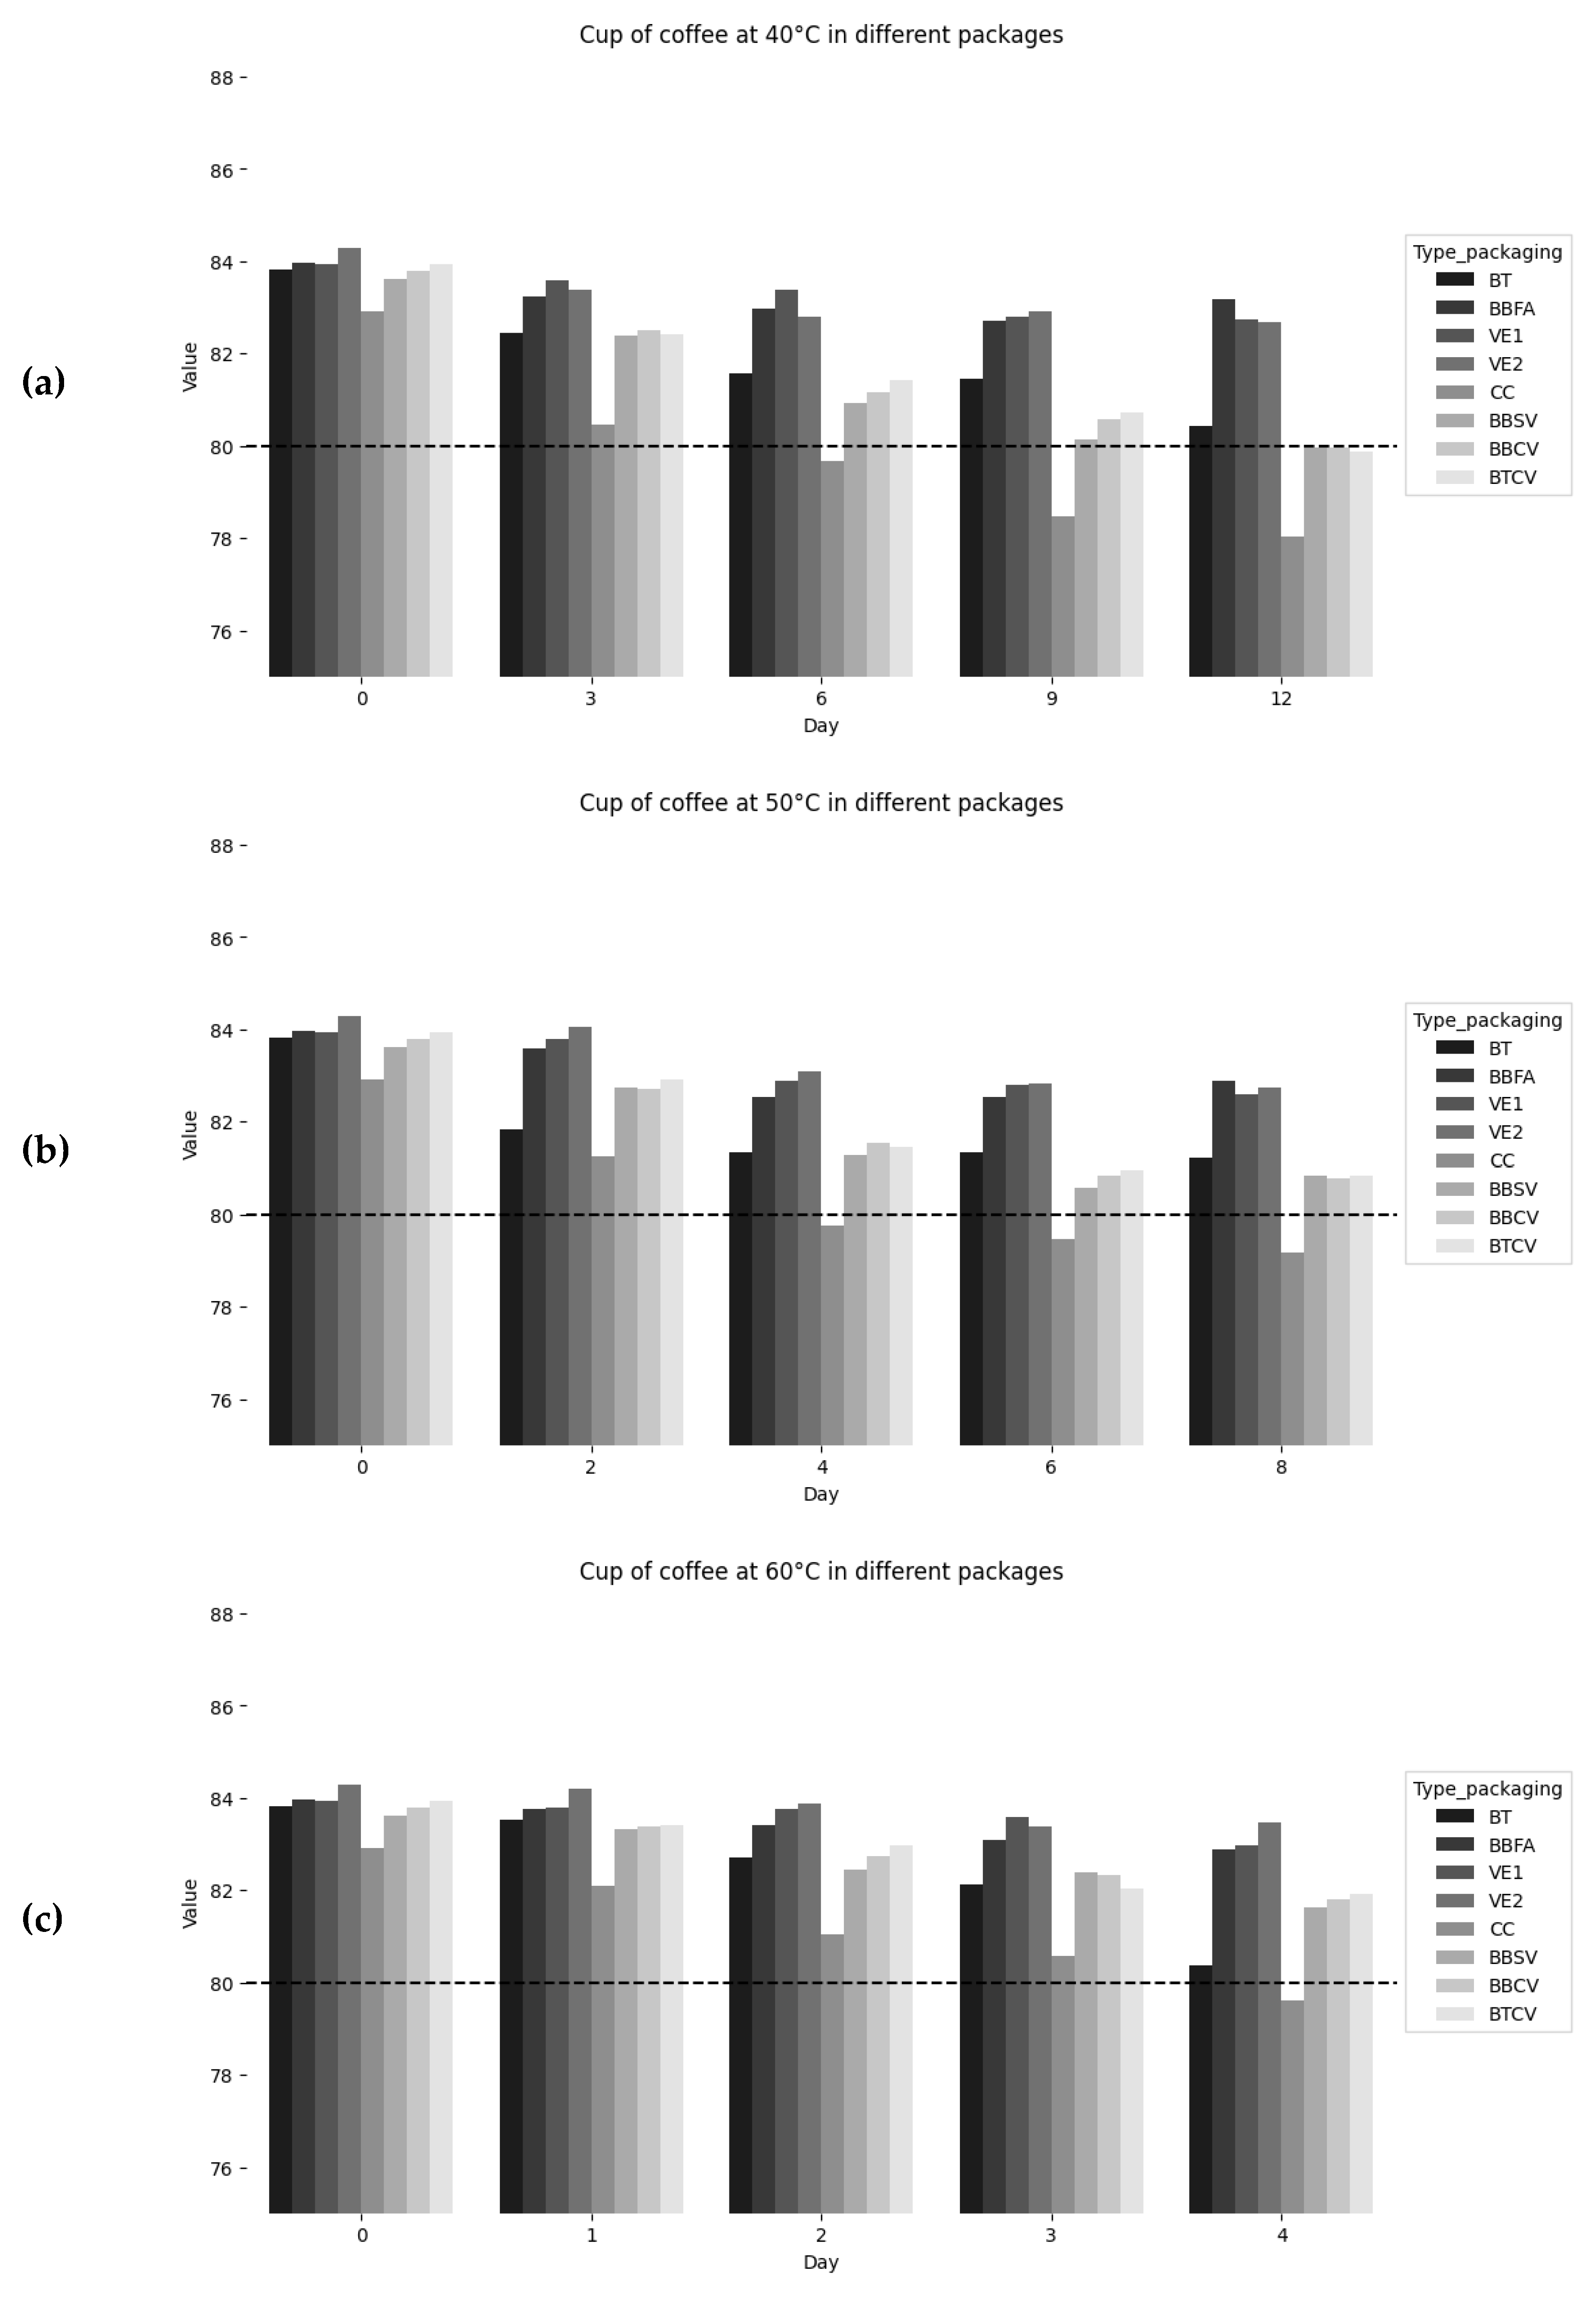
Figure 2.
Calibration curve for total polyphenols.
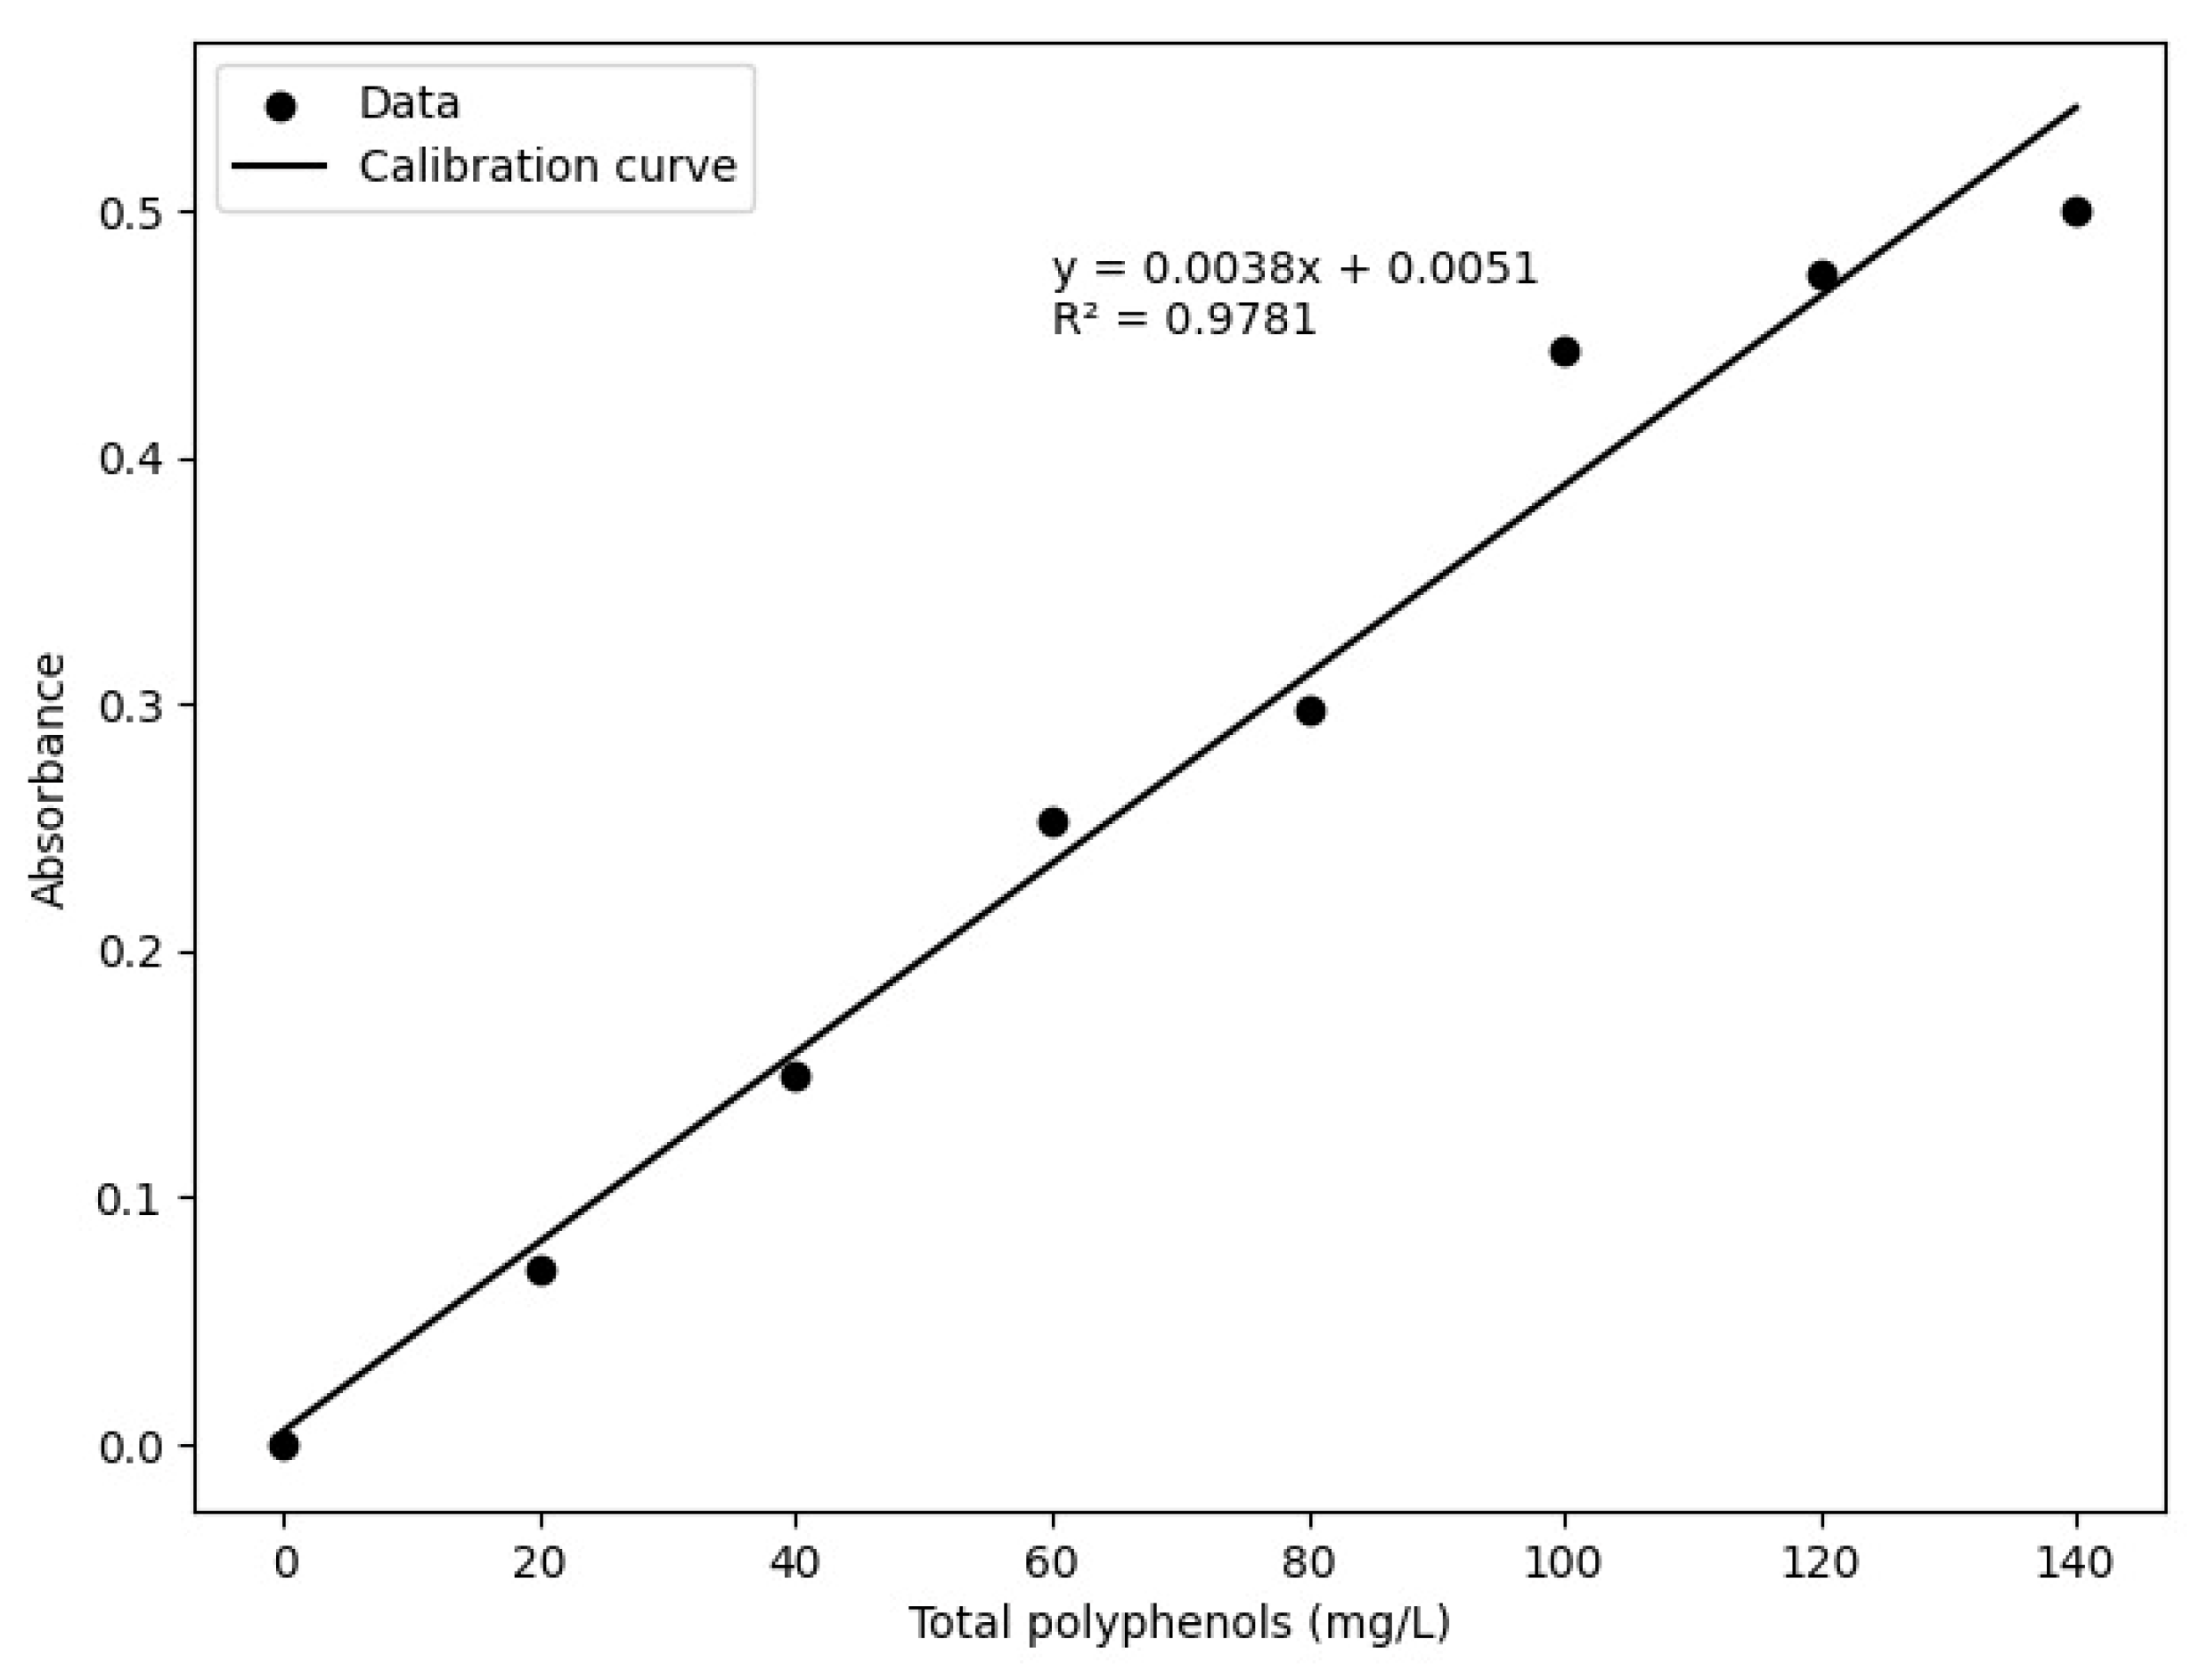
Figure 3.
Temporal trends in total polyphenols in specialty coffee samples under accelerated storage conditions. BT: Tocuyo bag with green beans. BBFA: Bilaminated aluminum bag with green beans. VE1: Ecotac vacuum bag with green beans. VE2: Ecotac vacuum bag with roasted beans. CC: Pressed cardboard box with ground roasted coffee. BBSV: Bilaminated bag without valve, with window and zipper, with ground roasted coffee. BBCV: bilaminate bag with degassing valve and zipper with ground roasted coffee. BTCV: trilaminate bag with degassing valve and zipper with ground roasted coffee.
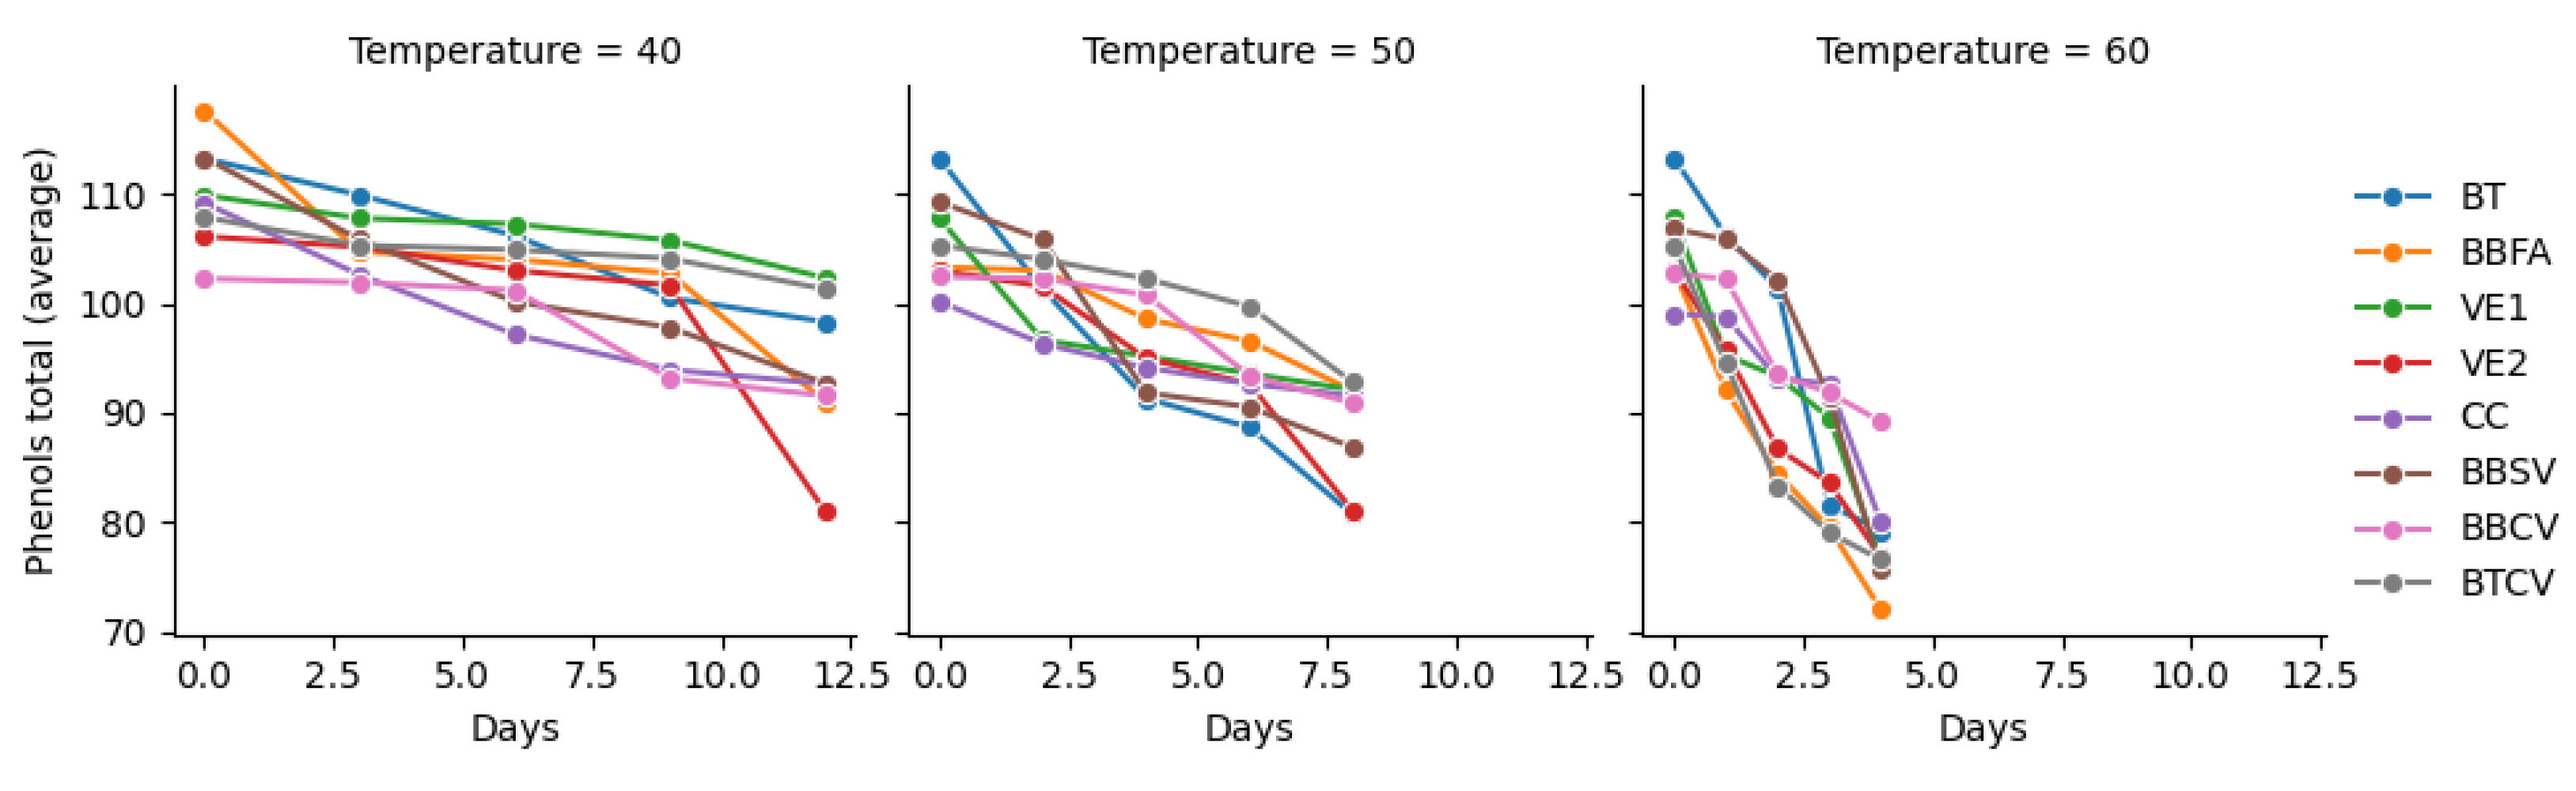
Figure 4.
Heat map of total polyphenol degradation in specialty coffee during accelerated storage. BT: Tocuyo bag with green beans. BBFA: Bilaminated aluminum bag with green beans. VE1: Ecotac vacuum bag with green beans. VE2: Ecotac vacuum bag with roasted beans. CC: Pressed cardboard box with ground roasted coffee. BBSV: Bilaminated bag without valve, with window and zipper, with ground roasted coffee. BBCV: bilaminate bag with degassing valve and zipper with ground roasted coffee. BTCV: trilaminate bag with degassing valve and zipper with ground roasted coffee.
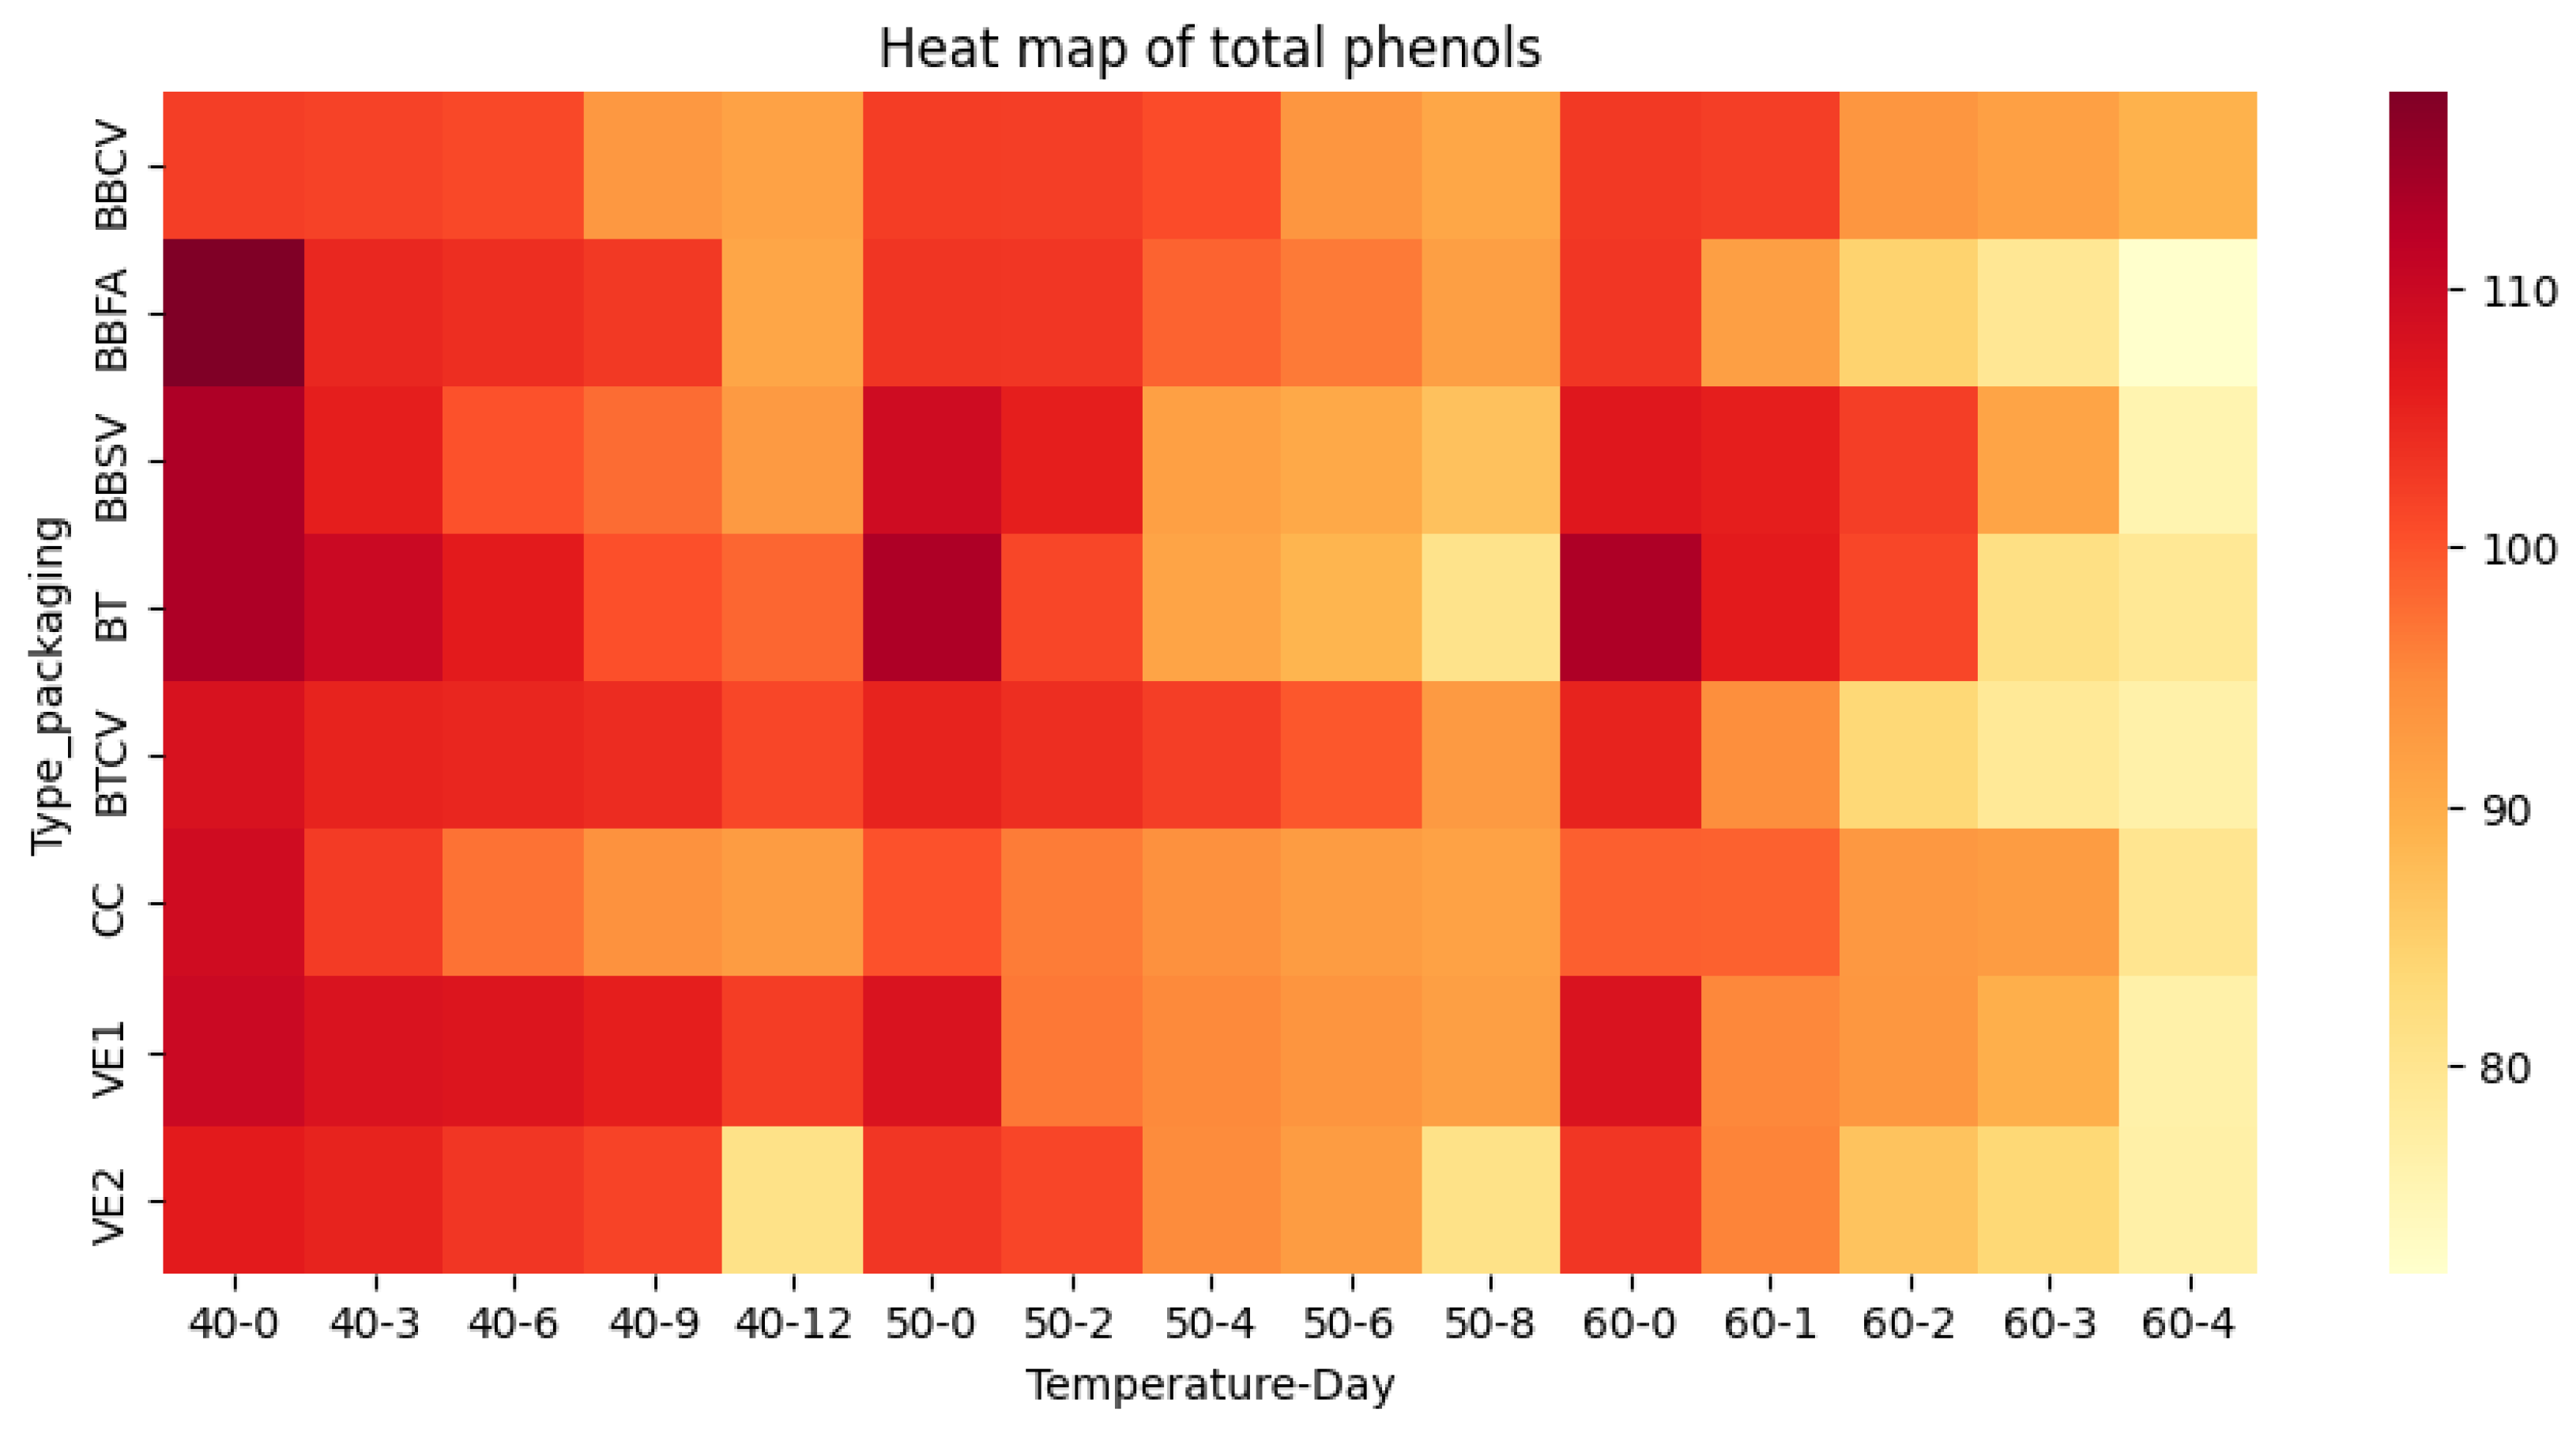

Table 1.
Total polyphenol values during storage at 40 °C.
| Days | Total polyphenol content (mg/L) | ||||||||
| T 40°C / HR 65% | |||||||||
| Green bean | Roasted bean | Ground roast | |||||||
| BT | BBFA | VE1 | VE2 | CC | BBSV | BBCV | BTCV | ||
| 0 | 113.250.02a | 117.610.01a | 109.890.01a | 106.110.00a | 109.180.02a | 113.310.09a | 102.250.02a | 107.870.01a | |
| 3 | 109.890.02a | 104.710.00b | 107.780.03a | 105.150.01ab | 102.610.01c | 105.820.02b | 101.900.00c | 105.300.03ab | |
| 6 | 106.200.01a | 104.010.01a | 107.250.02a | 103.010.03ab | 97.170.02d | 100.150.01c | 101.200.05bc | 104.890.02a | |
| 9 | 100.500.01b | 102.750.02a | 105.760.01a | 101.640.01b | 93.920.03d | 97.780.01c | 93.130.02d | 104.100.01a | |
| 12 | 98.310.01b | 91.030.02c | 102.340.02a | 81.030.02e | 92.630.02c | 92.690.02c | 91.550.01c | 101.290.01a | |
BT: tocuyo bag. BBFA: bilaminated aluminum foil bag. VE1: Ecotac vacuum bag with green beans. VE2: Ecotac vacuum bag with roasted beans. CC: pressed cardboard box. BBSV: bilaminated bag without valve, with window and zipper. BBCV: bilaminated bag with degassing valve and zipper. BTCV: trilaminate bag with degassing valve and zipper. ±: Mean Standard Deviation for 6 repetitions. Different letters represent significant differences between treatments according to Tukey’s test (p<0.05).
Table 2.
Total polyphenol values during storage at 50 °C.
| Days | Total polyphenol content (mg/L) | ||||||||
| T 50°C / HR 65% | |||||||||
| Green bean | Roasted bean | Ground roast | |||||||
| BT | BBFA | VE1 | VE2 | CC | BBSV | BBCV | BTCV | ||
| 0 | 113.250.02a | 103.310.01c | 107.780.03b | 103.010.03c | 100.150.01d | 109.270.01b | 102.430.04c | 105.300.03c | |
| 2 | 101.290.01c | 102.750.02bc | 96.640.00e | 101.550.00c | 96.290.02e | 105.820.02a | 102.250.02bc | 104.010.03ab | |
| 4 | 91.290.00e | 98.570.02c | 95.150.01d | 94.970.01d | 94.100.01d | 91.820.02e | 100.760.02b | 102.250.03a | |
| 6 | 88.660.03d | 96.550.02b | 93.570.01c | 92.610.01c | 92.630.02c | 90.500.03d | 93.390.00c | 99.710.01a | |
| 8 | 80.680.02e | 91.990.04b | 92.080.01b | 81.030.01e | 91.550.01b | 86.820.03d | 90.850.03c | 92.780.03b | |
BT: tocuyo bag. BBFA: bilaminated aluminum foil bag. VE1: Ecotac vacuum bag with green beans. VE2: Ecotac vacuum bag with roasted beans. CC: pressed cardboard box. BBSV: bilaminated bag without valve, with window and zipper. BBCV: bilaminated bag with degassing valve and zipper. BTCV: trilaminate bag with degassing valve and zipper. ±: Mean Standard Deviation for 6 repetitions. Different letters represent significant differences between treatments according to Tukey’s test (p<0.05).
Table 3.
Total polyphenol values during storage at 60 °C.
| Days | Total polyphenol content (mg/L) | |||||||
| T 60°C / HR 65% | ||||||||
| Green bean | Roasted bean | Ground roast | ||||||
| BT | BBFA | VE1 | VE2 | CC | BBSV | BBCV | BTCV | |
| 0 | 113.250.02a | 102.750.02c | 107.780.03b | 103.010.03c | 99.010.03d | 106.820.03b | 102.690.03c | 105.300.03bc |
| 1 | 106.200.01a | 92.080.04e | 95.240.03d | 95.680.01d | 98.750.02c | 105.820.02a | 102.250.02b | 94.540.01de |
| 2 | 101.380.02a | 84.450.00f | 93.310.02c | 86.730.03ef | 93.130.01cd | 102.170.04a | 93.480.02c | 83.310.01f |
| 3 | 81.550.01d | 79.450.03d | 89.540.01b | 83.570.05cd | 92.630.02a | 91.380.01a | 91.820.06a | 79.010.02d |
| 4 | 79.180.01c | 71.990.00d | 76.460.01c | 76.820.00c | 79.970.00c | 75.590.00c | 89.180.04a | 76.550.01c |
BT: tocuyo bag. BBFA: bilaminated aluminum foil bag. VE1: Ecotac vacuum bag with green beans. VE2: Ecotac vacuum bag with roasted beans. CC: pressed cardboard box. BBSV: bilaminated bag without valve, with window and zipper. BBCV: bilaminated bag with degassing valve and zipper. BTCV: trilaminate bag with degassing valve and zipper. ±: Mean Standard Deviation for 6 repetitions. Different letters represent significant differences between treatments according to Tukey’s test (p<0.05).
Table 4.
Determination of the reaction order.
| Sample | Packaging | Order | Temperature | |||
| 40 °C | 50 °C | 60 °C | Selection | |||
|
Regression (R2) |
Regression (R2) |
Regression (R2) |
||||
| Green bean | BT | 0 | y = -1.309x + 113.48 (0.9858) | y = -3.8889x + 110.59 (0.9576) |
y = -9.2778x + 114.87 (0.9341) |
0 |
| 1 | y = -0.0124x + 4.733 (0.9849) |
y = -0.0406x + 4.7097 (0.9706) |
y = -0.098x + 4.7533 (0.9237) |
|||
| BBFA | 0 | y = -1.837x + 115.04 (0.8546) |
y = -1.4415x + 104.4 (0.9526) |
y = -7.4152x + 100.97 (0.9835) |
1 | |
| 1 | y = -0.018x + 4.7475 (0.8549) |
y = -0.0147x + 4.6494 (0.9486) |
y = -0.0859x + 4.6204 (0.9920) |
|||
| VE1 | 0 | y = -0.570x + 110.03 (0.9303) |
y = -1.7237x + 103.94 (0.763) |
y = -6.8333x + 106.13 (0.9200) |
0 | |
| 1 | y = -0.005x + 4.7011 (0.9261) |
y = -0.0174x + 4.643 (0.7781) |
y = -0.0748x + 4.6704 ( 0.9119) |
|||
| Roasted bean | VE2 | 0 | y = -1.7895x + 110.13 (0.6643) |
y = -2.6462x + 105.22 (0.9109) |
y = -6.4503x + 102.06 (0.9814) |
0 |
| 1 | y = -0.0191x + 4.7089 (0.6466) |
y = -0.0286x + 4.6609 (0.8929) |
y = -0.0722x + 4.6296 (0.9867) |
|||
| Ground roast | CC | 0 | y = -1.3928x + 107.46 (0.9369) |
y = -1.0424x + 99.114 ( 0.9356) |
y = -4.4181x + 101.54 (0.8184) |
1 |
| 1 | y = -0.0139x + 4.6777 (0.9457) |
y = -0.0109x + 4.5964 (0.9417) |
y = -0.0491x + 4.6246 (0.8003) |
|||
| BBSV | 0 | y = -1.6423x + 111.8 (0.9698) |
y = -3.0117x + 108.89 (0.9044) |
y = -7.6901x + 111.73 (0.8585) |
1 | |
| 1 | y = -0.016x + 4.7182 (0.9773) |
y = -0.0308x + 4.6922 (0.9108) |
y = -0.0838x + 4.7276 (0.8343) |
|||
| BBCV | 0 | y = -1.0058x + 104.04 (0.8365) |
y = -1.6009x + 104.34 (0.8713) |
y = -3.7456x + 103.38 (0.9101) |
0 | |
| 1 | y = -0.0104x + 4.6461 (0.8353) |
y = -0.0165x + 4.6492 (0.8692) |
y = -0.039x + 4.6394 (0.9151) |
|||
| BTCV | 0 | y = -0.4786x + 107.56 (0.9192) |
y = -1.4664x + 106.68 (0.8766) |
y = -7.3012x + 102.34 (0.9264) |
0 | |
| 1 | y = -0.0046x + 4.6782 (0.9181) |
y = -0.0148x + 4.6713 (0.8651) |
y = -0.0817x + 4.6306 (0.9421) |
|||
BT: tocuyo bag. BBFA: bilaminated aluminum foil bag. VE1: Ecotac vacuum bag with green beans. VE2: Ecotac vacuum bag with roasted beans. CC: pressed cardboard box. BBSV: bilaminated bag without valve, with window and zipper. BBCV: bilaminated bag with degassing valve and zipper. BTCV: trilaminate bag with degassing valve and zipper.
Table 5.
Ea, A0 and k values for the degradation of total polyphenols in coffee for each sample and package.
Table 5.
Ea, A0 and k values for the degradation of total polyphenols in coffee for each sample and package.
| Sample | Packaging | Ea (kJ/mol*K) | A0 | Arrhenius equation determined |
| Green bean | BT | 85.085 | 2.06E+14 | |
| BBFA | 59.714 | 1.22E+10 | ||
| VE1 | 107.67 | 4.82E+17 | ||
| Roasted bean | VE2 | 55.419 | 2.85E+09 | |
| Ground roast | CC | 49.321 | 1.75E+08 | |
| BBSV | 66.850 | 2.16E+11 | ||
| BBCV | 56.886 | 2.86E+09 | ||
| BTCV | 118.04 | 2.09E+19 |
BT: tocuyo bag. BBFA: bilaminated aluminum foil bag. VE1: Ecotac vacuum bag with green beans. VE2: Ecotac vacuum bag with roasted beans. CC: pressed cardboard box. BBSV: bilaminated bag without valve, with window and zipper. BBCV: bilaminated bag with degassing valve and zipper. BTCV: trilaminate bag with degassing valve and zipper.
Table 6.
Half-life times (t1/2) for the degradation of total polyphenols.
| Sample | Packaging | Storage temperature (°C) | k (days-1) |
t1/2 order zero (months) |
| Green bean | BT | 15 | 0.0790631 | 23.87 |
| 20 | 0.1448005 | 13.04 | ||
| 25 | 0.2598701 | 7.26 | ||
| 30 | 1.3429945 | 1.41 | ||
| 40 | 3.6884747 | 0.51 | ||
| 60 | 9.5343346 | 0.20 | ||
| BBFA | 15 | 0.1844677 | 10.63 | |
| 20 | 0.2820690 | 6.95 | ||
| 25 | 0.4252168 | 4.61 | ||
| 30 | 1.3465856 | 1.46 | ||
| 40 | 2.7363711 | 0.72 | ||
| 60 | 5.3289017 | 0.37 | ||
| VE1 | 15 | 0.0149565 | 122.45 | |
| 20 | 0.0321659 | 56.94 | ||
| 25 | 0.0674234 | 27.16 | ||
| 30 | 0.5388931 | 3.40 | ||
| 40 | 1.9353609 | 0.95 | ||
| 60 | 6.4372803 | 0.28 | ||
| Roasted bean | VE2 | 15 | 0.2592307 | 6.82 |
| 20 | 0.3844649 | 4.60 | ||
| 25 | 0.5627154 | 3.14 | ||
| 30 | 1.6402242 | 1.08 | ||
| 40 | 3.1673386 | 0.56 | ||
| 60 | 5.8794484 | 0.30 | ||
| Ground roast | CC | 15 | 0.2026485 | 8.98 |
| 20 | 0.2877919 | 6.32 | ||
| 25 | 0.4039308 | 4.50 | ||
| 30 | 1.0466383 | 1.74 | ||
| 40 | 1.8799240 | 0.97 | ||
| 60 | 3.2600315 | 0.56 | ||
| BBSV | 15 | 0.1668885 | 11.32 | |
| 20 | 0.2684727 | 7.03 | ||
| 25 | 0.4250620 | 4.44 | ||
| 30 | 1.5448715 | 1.22 | ||
| 40 | 3.4168621 | 0.55 | ||
| 60 | 7.2057031 | 0.26 | ||
| BBCV | 15 | 0.1413287 | 12.11 | |
| 20 | 0.2118019 | 8.08 | ||
| 25 | 0.3131404 | 5.47 | ||
| 30 | 0.9389597 | 1.82 | ||
| 40 | 1.8450157 | 0.93 | ||
| 60 | 3.4813704 | 0.49 | ||
| BTCV | 15 | 0.0085808 | 209.52 | |
| 20 | 0.0198655 | 90.50 | ||
| 25 | 0.0447145 | 40.21 | ||
| 30 | 0.4365327 | 4.12 | ||
| 40 | 1.7730255 | 1.01 | ||
| 60 | 6.6204522 | 0.27 |
BT: tocuyo bag. BBFA: bilaminated aluminum foil bag. VE1: Ecotac vacuum bag with green beans. VE2: Ecotac vacuum bag with roasted beans. CC: pressed cardboard box. BBSV: bilaminated bag without valve, with window and zipper. BBCV: bilaminated bag with degassing valve and zipper. BTCV: trilaminate bag with degassing valve and zipper.
Disclaimer/Publisher’s Note: The statements, opinions and data contained in all publications are solely those of the individual author(s) and contributor(s) and not of MDPI and/or the editor(s). MDPI and/or the editor(s) disclaim responsibility for any injury to people or property resulting from any ideas, methods, instructions or products referred to in the content. |
© 2025 by the authors. Licensee MDPI, Basel, Switzerland. This article is an open access article distributed under the terms and conditions of the Creative Commons Attribution (CC BY) license (http://creativecommons.org/licenses/by/4.0/).
Copyright: This open access article is published under a Creative Commons CC BY 4.0 license, which permit the free download, distribution, and reuse, provided that the author and preprint are cited in any reuse.


