
Submitted:
05 September 2025
Posted:
08 September 2025
You are already at the latest version
Abstract
Shallow-landslide susceptibility assessment is an essential research activity for land management and risk assessment. In this research, a GIS-based approach has been developed to assess the rain-induced landslide susceptibility in the Municipality of Genoa, a Mediterranean anthropized area historically characterized by intense rainfall events triggering shallow landslides with high destructive power. Based on a detailed inventory of landslide phenomena, a semi-quantitative method has been applied to assess the role of seven natural and anthropogenic landslide causal factors. The areas of differing rain-induced shallow landslide susceptibility have been discriminated into five classes, indicative of areas on slopes where newly triggered landslides may occur. The landslide susceptibility map was subsequently cross-referenced with the map of gas and water utilities, thus obtaining an early-stage risk assessment, useful for adequate planning and integrated asset management in a context of climate change.
Keywords:
shallow landslides
; landslide susceptibility mapping
; risk assessment
; underground services
; Genoa Municipality
1. Introduction
Among the natural hazards categories, landslides are the ones that cause damage and significant socio-economic losses in the territory every year [1,2,3]. Shallow landslides and debris/mudflows are the most frequent processes that cause damage to buildings and infrastructures, inducing often the loss of human lives [4]: triggering is caused by intense rainfall and usually generates limited volumes landslides, which are often spread on the territory and characterized by a sudden evolution and high speed of propagation [5,6,7]. The high kinetic energy of small but quickly moving masses may cause serious damage to buildings and infrastructures.
Landslide risk may be defined as the probability of occurrence of a potentially damaging event in a defined area and for a determined return period [8,9]. Risk assessment requires estimation of landslide volume, time frequency and location [10]. The extent and recurrence time of the event are difficult parameters to predict, as they are linked to the natural processes that control gravity dynamics. Besides, landslide inventories are relatively recent [11,12,13].
The spatial distribution of potentially unstable areas can be obtained through the probability of an event occurrence based on local geological and physical-geographical features [14]. The definition of landslide susceptibility represents the first step in risk assessment [15]: the identification and mapping of areas in which slope instability processes have occurred in the past or with similar geotechnical characteristics are useful information for predicting the location of first-born shallow landslides [16]. Landslide susceptibility assessment therefore becomes an essential tool for risk management, supporting authorities and decision-makers in sustainable spatial planning and for the definition of mitigation measures, including monitoring and warning activities [17,18,19].
Over the past decades, several methods have been developed to assess landslide susceptibility, combining parameters in a GIS environment and collecting data with precision remote sensing techniques such as ALS (Airborne Laser Scanning) surveys [20,21,22,23,24].The methods used to assess landslide susceptibility can be distinguished into [25,26,27,28]: 1) geomorphological survey and inventory map of landslide phenomena; 2) semi-quantitative approach based on the combination of partial parameters, linked to geomorphological processes and landslide factors; 3) physically-based methods [29], linked to the constitutive laws of the geomaterials that characterize the stratigraphic sequence of the investigated slopes.
The definition of rainfall-induced shallow landslide susceptibility is thus the first key step in risk assessment, which is done through subsequent cross-referencing with hazard-exposed elements. Much research has been carried out for rainfall-induced shallow landslide risk assessment with reference to buildings and large infrastructures.
Rainfall-induced shallow landslides are also an important element of risk for vulnerable elements such as underground services. Scientific research over the past 20 years has been conducted mainly on oil and gas pipelines, with interesting case studies in China, Turkey, Albania and Romania, related to transcontinental oil and gas pipelines affected by landslides.
Research was focused on the strains of underground gas pipeline subjected to landslide movement [30], on expert determination approach to define a consensus for the estimate of the risk for a gas pipeline [31], on a quantitative model for regional risk assessment through an analysis of the patterns of historical landslide disasters along oil and gas pipelines, with an interesting dual approach both on susceptibility and vulnerability assessment [32], an appropriate methodology for using the Tunnel Boring Machine to construct a micro-tunnelling to bury a natural gas pipeline beneath an active landslide [33], on the assessment of landslide susceptibility at a damaged gas pipeline, through the application of both statistical index and weightings factor, in a GIS environment [34], on a risk assessment model performed for buried pipeline geohazard like landslide, sinkhole phenomena and running water processes [35], on the geotechnical finite element approach for a landslide hazard case for an underground gas pipeline [36], and on what maximum susceptibility conditions an underground pipeline subject to leakage and rupture as a result of a landslide can reach [37).
An interesting scientific contribution is addressed on the susceptibility assessment of soil erosion for shallow underground pipelines; the method analyses geotechnical soil parameters and through an AHP procedure, the susceptibility values of potential erosion are assessed [38].
There is no research in the scientific literature on risk assessment for underground services, such as gas and water networks, in urban areas located in hilly and mountainous environments, which represent an important criticality in terms of land management.
In this research, a semi-quantitative method was adopted to assess the shallow landslide susceptibility in the municipality of Genoa, located in NW Italy: this is a hilly-mountainous territory close to a narrow fluvial-coastal strip (Figure 1) internationally known for its cultural and landscape heritage, but also historically affected by natural hazards such as landslides, debris flows and floods [39].
Starting from the landslide inventory map, seven landslide causal factors were selected and classified according to the statistics of recent events. The weighted combination of the predisposing factors resulted in five different landslide susceptibility classes, whose reliability was tested by means of a model calibration process. Finally, the landslide susceptibility map obtained was cross-referenced with the gas and water sub-services vulnerability maps (Figure 2), categorized according to pipe diameter (and thus directly related to the exposed value), thus obtaining a preliminary geo-hydrological risk assessment.
These results are a useful decision support tool for an adequate planning and integrated asset management in a context of climate change.
2. Materials and Methods
2.1. Geographical and Geological Outline
Genoa is a coastal city and the capital of Liguria region, located in the north-western Italian macro-region (Figure 1); it extends over approximately 240 km2, mostly distributed along a coastal strip stretching for 30 km from east to west (Figure 1). Only subordinately the city also extends along the two main drainage axes that are orthogonal to the coastline: the Bisagno and Polcevera streams (Figure 1), which limit the morphological amphitheater on which the historic city center has been built over time [40].
The resident population of Genoa is about 560,000, but in the 1970s, when the industrial sector especially related to the port was at its peak, it reached 800,000. In that condition the urban planning had already foreseen a city of 1 million inhabitants.
The port area is one of the most important in the Mediterranean: it is the original settlement of the city and still today represents the main focus of industrial, commercial and transport activities. The extensive waterfront, which has been achieved by land filling and the consequent advancement of the coastline since historic times, clearly shows the anthropic transformations of the city that have occurred over the last 150 years due to the socio-economic growth and evolution.
From the administrative point of view, Genoa is divided into nine municipalities (Middle-East, Middle-West, Lower Bisagno Valley, Middle Bisagno Valley, Polcevera Valley, Middle-West, West, Middle-East, East) and 71 census sections. The population density reaches the highest values in the central part of the municipal area, particularly in the final stretch of the alluvial plain of the Bisagno stream, in the historical amphitheater behind the port area and near the mouth of the Polcevera stream. The highest value reaches 25,000 inhabitants/km2 in Marassi (Lower Bisagno Valley) at the east from the amphitheater in an area of high flood hazard, and west from it in Sampierdarena district (Middle West).
The physical-geographical features of Genoa are peculiar, both in terms of meteorological-climatic aspects and for the landscape. The meteo-climatic structure of Genoa is particular and has long been studied by researchers and meteorology experts. Due to its location at the northern apex of the western Mediterranean, in the late summer-autumn period the depression over the Gulf of Genoa is frequent, bringing intense and high intensity rainfall: the metropolitan city of Genoa in fact shows rainfall records at a Mediterranean scale. The highest values have been topped in occasion of the major flooding events: on 7-8 October 1970 (948 mm/24 h), 4 November 2011 (181 mm/h) and 4 October 2021 (883. 8 mm/24 h, 740.6/12h, 496 mm/6h and 377.8 mm/3h).
This last event, which was particularly intense, affected the hinterland to the west of the city but avoiding the municipal territory, causing many shallow landslides. During this event, the maximum values recorded over 12, 6 and 3 h exceeded the previous maximums that had been measured during the 1970 and 2011 phenomena.
On average, winters are mild and summers warm, with significant rainy periods in autumn and spring. The average annual rainfall is 1250 mm in the city center and varies significantly with altitude. Figure 3 shows the average monthly values recorded at the Genoa University station, which has been operating since 1833. The higher value of the annual rainfall corresponds to some catastrophic events that occurred in the past, while the higher monthly values mainly occur in fall and, secondarily in spring.
Evidence of climate change in Genoa can be witnessed by an increase in the average annual air temperature and a decrease in the number of rainy days, resulting in an increase in the intensity of rainfall, leading to more frequent occurrences of floods and landslides [41,42]. Besides, proxies related to extreme rain events shows statistically significant increase over the period 1979-2019 [43]. The last significant events occurred in December 2022 triggering a rock-fall that affected some buildings in the central-eastern sector of the city and in August 2023 when a very intense but highly concentrated rainfall in terms of space and time caused heavy ground effects in Genoa’s historic center [44].
The Apennine Mountain range surrounds the city of Genoa with peaks reaching a maximum altitude of almost 1200 m in the eastern sector (Mt. Reixa, 1183) and over 1000 m in the eastern sector (Mt. Candelozzo, 1036 m). The area includes a large number of catchment basins mainly oriented perpendicular to the coastline. Not all the watersheds belong entirely to the municipality of Genoa: for example, both the upper Bisagno basin and the upper Polcevera one are included in other municipalities.
Based on the distance of the watershed from the coastline and the nature of the rock masses, slope gradients are generally high, especially in the eastern and western sectors of the municipal area (e.g., basins of the Nervi, Leira and Cerusa streams) where values above 50% are prevailing.
The morphometric and elevation features of the basins (Figure 1) represent one of the most significant landslide factors, which results in a widespread hazard: during heavy rainfall, the reduced runoff time of small basins results in extremely rapid runoff (even less than 30’) and flash floods hit the floodplain resulting in high risk due to the high urbanization.
During flood events, often of flash flood type, shallow landslides are triggered and, depending on the morphological features of the territory, also debris-mudflows. These quickly moving masses cause a high hazard to the directly exposed elements such as buildings and infrastructure, and an indirect one related to the saturation of the culverts which are diffusively present in the urban area. The effects on the ground can be very serious and also include loss of life as well as substantial economic damage.
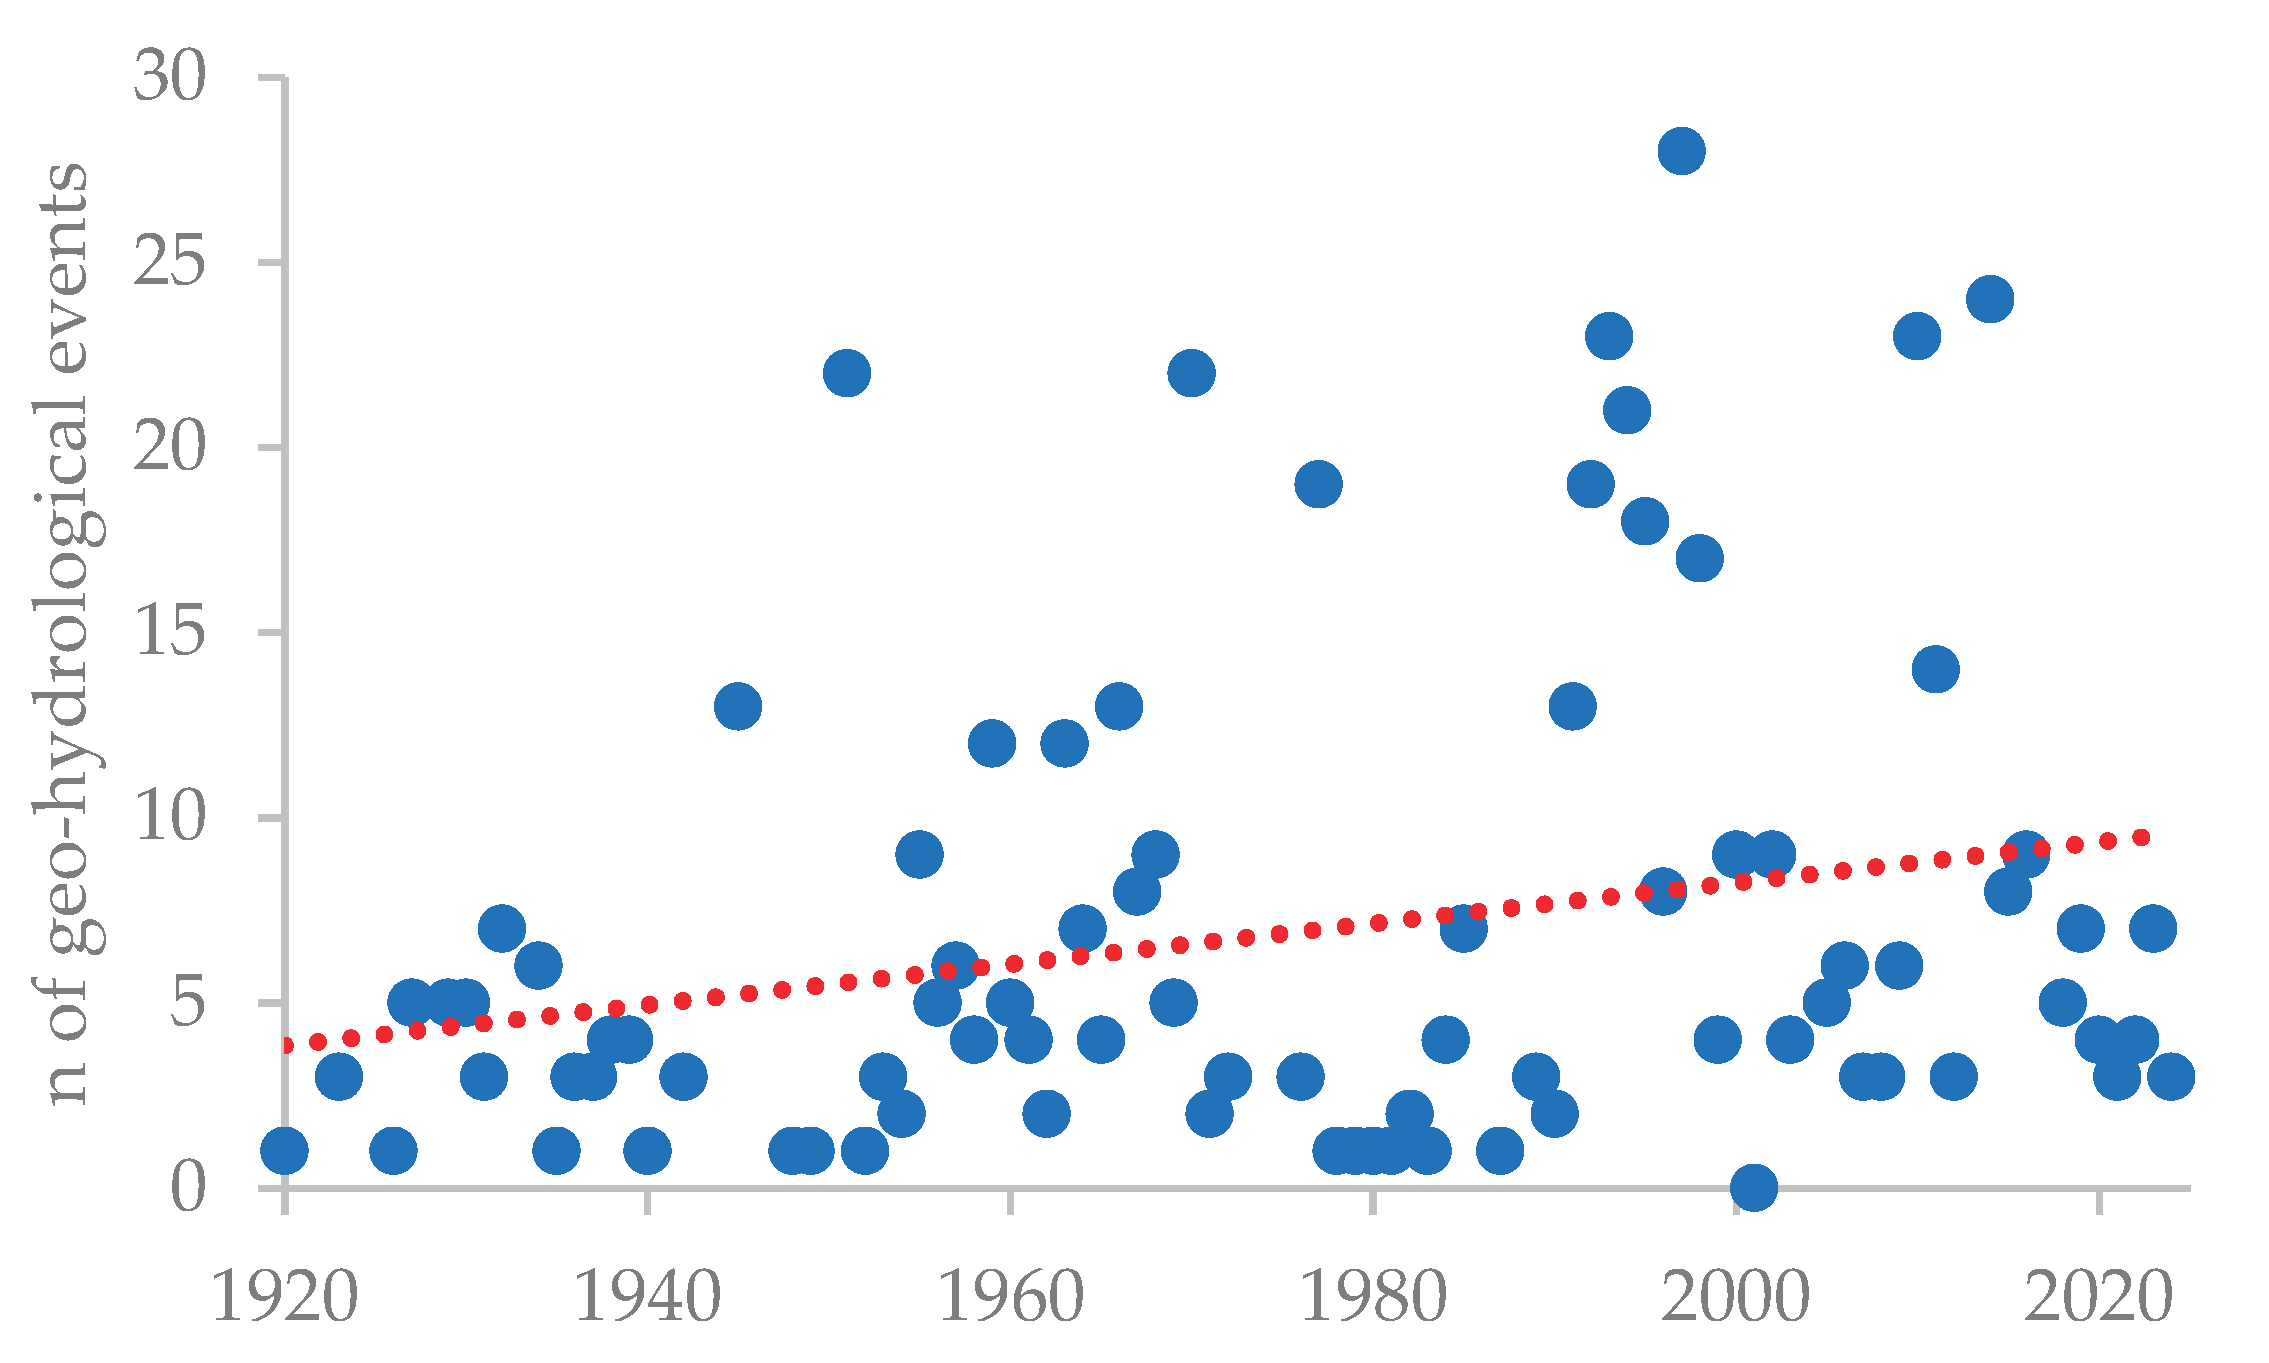
Table 1 shows the geo-hydrological hazard events that have characterized the Genoese territory in the last 100 years based on AVI project database [59] properly updated.
The city of Genoa geologic features contribute substantially to the slope instability processes, then inducing the natural hazard: Figure 4 schematically shows the rock masses of the Genoa area, predominantly of sedimentary type in the East (limestone-marly flysch), and of ophiolitic type in the West (serpentinites and calcareous schist). The central sector is particularly complex and characterized by argillitic and siltitic flysch, basalts, and dolomites.
The geological history undergone by the rock formations, both ductile and brittle, and the consequent pattern of deformations occurred, together with the frequent coupling of geomaterials with different strength and deformability, is an additional predisposing element for slope instability and for triggering landslides characterized by different kinematics processes.
2.2. Research Methods
The susceptibility assessment for shallow landslides on the territory of the Municipality of Genoa was carried out by employing a semi-quantitative approach, which means combining a quantitative and a qualitative method. This approach makes it possible to combine numerical criteria with subjective analysis skills and experience. The objective component is based on descriptive statistics of census phenomena at the regional scale, while the subjective component is based on geomorphological analysis and evaluation.
The method, schematized in Figure 5, is based on identifying a set of descriptive parameters of the area as predisposing factors for the triggering of rapid runoff phenomena and related descriptive statistical evaluation. Then, the results of the descriptive statistics are assigned as weights to the different classes into which each predisposing factor has been divided, and the different factors are appropriately reclassified [45].
The different factors are combined by means of other weights, the identification of which is done by applying the heuristic method AHP Analytic Hierarchy Process [46,47,48,49] by combining subjective evaluations by experts [50,51]. This methodology is a modified version of the one already proposed and tested in Mediterranean environment [17] in a previous research. Further, the susceptibility analysis results are applied to the risk assessment of the gas and water distribution pipelines in the Genoa Municipality.
AHP is a semi-quantitative multi-criteria decision-support technique used to compare heterogeneous physical quantities and widely applied in natural hazard management [52] and landslide susceptibility analysis [6,7,17,53,54,55,56]. The assignment of weights to each identified factor and their subsequent normalized combination allowed to obtain a shallow landslide susceptibility map [57,58].
The basic data used is the inventory of landslide phenomena in Italy from the IFFI project, from data collected through the Copernicus system following the most recent intense events, and from data acquired by the governing authority of the basin plans involving the municipal area [59]: from the combination of several geodatabases, 485 phenomena of rapid landslides and fast-developing shallow landslides that occurred in the municipal area were extracted.
The case history of such phenomena in Liguria and beyond is wide and increasing since the year 2000 [43]: the events that occurred in western Liguria in 2000, the hundreds of shallow landslides triggered during the flash flood that affected the Cinque Terre/Vara Valley in 2011, the events of October/November 2014 in Genoa Province, and the landslide that in Leivi, in the hinterland 50 km east from Genoa, claimed two lives, the 2016 Lavina di Rezzo (Imperia) rapid flow and the 2019 landslides in Cava Lupara (Genoa), Cenova di Rezzo (Imperia) and Madonna del Monte (Savona) that caused the collapse of the viaduct along the A6 highway.
The set of census events at the municipal scale was divided by random extraction into two subsets: a training set of 388 phenomena accounting for 80 percent of the total and a calibration set of 97 phenomena accounting for the remaining 20 percent (Figure 6).
The first set has been used to obtain descriptive statistics of phenomena with respect to the seven identified predisposing factors (Figure 7): slope gradient, slope aspect, lithology, land-use, planar curvature and tangential surface curvature, and presence of slope debris cover.
These data, whose characteristics are summarized in Table 2, were partly obtained from the available data of regional databases at the scale 1:10,000, and partly obtained by application of processing algorithms to the 5 m mesh DTM made by the Region of Liguria. Debris covers are also considered to play a major role in terms of the probability of triggering shallow landslides. Therefore, basing on evidences of recent phenomena occurring in the area, it was decided to additionally include the slope cover factor in the analysis of shallow landslide susceptibility: this geomorphological data was obtained by composing the informative layer included in the geological map made by the Municipality of Genoa, with original field surveys and remote sensing analysis that allowed a more detailed recognition and mapping of the anthropogenic terraces widely spread in the Ligurian territory.
The presence of anthropogenic terraces has often been found to be crucial in triggering the phenomenon that have affected the region over the past 20 years. Their identification has been conducted through a dedicated analysis according to the methods identified in the same morpho-climatic environment [60,61,62] in other researches. The analysis has been fulfilled using the DTM obtained from the ALS survey acquired by the Municipality of Genoa in 2018 with 1m resolution. The analysis is based on the computation of the SVF -Sky View Factor (SAGA GIS algorithm), whose reliability and accuracy was deemed satisfactory for the purposes at hand [63].
The predisposing factors identification has been conducted according to the extensive bibliography available and allows the evaluation of both geological-morphological-morphometric characteristics and anthropogenic influence through land use. Descriptive statistics made it possible to objectively assign different weights to the relevant classes into which each factor has been divided. The weights in the combination of the seven factors were assigned by adapting the values obtained through the AHP technique developed and applied in recent research in a surrounding area [17]. The weights between factors used are shown in Table 3. The reliability of the result was subsequently verified by the calibration process, i.e., by checking the susceptibility classes corresponding to the 97 landslides in the calibration set.
The risk assessment of the water and gas distribution networks has been approached evaluating the vulnerability of the twos through the local diameter of the pipes and then calculating the related risk [64,65,66]. The following Table 4 identifies the 5 vulnerability classes that have been defined according to the pipe’s diameters, which ranges from 10 to 900 cm for the water network, and from 15 to 800 cm for the gas one. Then, the 5 risk classes have been obtained combining the vulnerability classes with the hazard ones identified by the susceptibility computation: figures in the risk matrix have been obtained after the product of the hazard score and the vulnerability score. Finally, the results have been conservatively classified in the 5 risk classes in Figure 8.
3. Results
Statistical analysis of the shallow instability phenomena belonging to the training set produced the results shown in Table 5. Statistics have been used as weights for the reclassification process of every predisposing factor. As it can be seen from Table 5, the highest occurrence frequency of shallow landslides for the area of Genoa municipality is related to: exposures to the southern quadrants, slopes of intermediate classes, cultivated land uses, i.e., the presence of terraces, meadow and forest, and lithotypes of schist, quarzitic, flysch and ophiolitic rock masses. In addition, the possibility of development even in the absence of cover, as its presence was defined, i.e., for thicknesses greater than 1 m or in the presence of terraces, although it may seem incongruent, is to be attributed to the development of phenomena of modest size or to cases in which the presence of cover was not precisely recognized.
The network of underground utilities, shown in Figure 2, was cross-referenced with the susceptibility mapping obtained according to the aforementioned procedure. Areas made impermeable by urbanization were excluded from the assessment because they substantially lack potential source material for rapid runoff phenomena. This type of phenomena shows the highest capacity to generate damage on structures and infrastructures [67,68,69] because of the high speed of movement that, even in the presence of relatively moderate masses, results in high kinetic energy. Moreover, their evolution, whose triggering is driven by high rainfall intensities, occurs extremely rapidly, preventing any kind of intervention during the event. Sealed surfaces can play the role of concentrating the runoff and thus possibly contribute to the triggering of a downstream runoff phenomenon, as may occur through “gutter effect” by a road with inadequate or possibly occluded surface drainage.
The achieved susceptibility map (Figure 8) shows a large concentration of areas in the highest class at Polcevera and Bisagno Valleys and in the small catchment areas of the western portion of the municipality. The latter are developed in the proximity of the municipality’s highest elevations, which exceed 1,000 m above sea level at a very short distance from the coastline, thus in the presence of extremely high slope gradients. In addition, also due to these morphometric characteristics, they are historically affected by higher and more intense rainfall values than the eastern parts of the municipal territory.
Figure 8.
The shallow landslide susceptibility map.
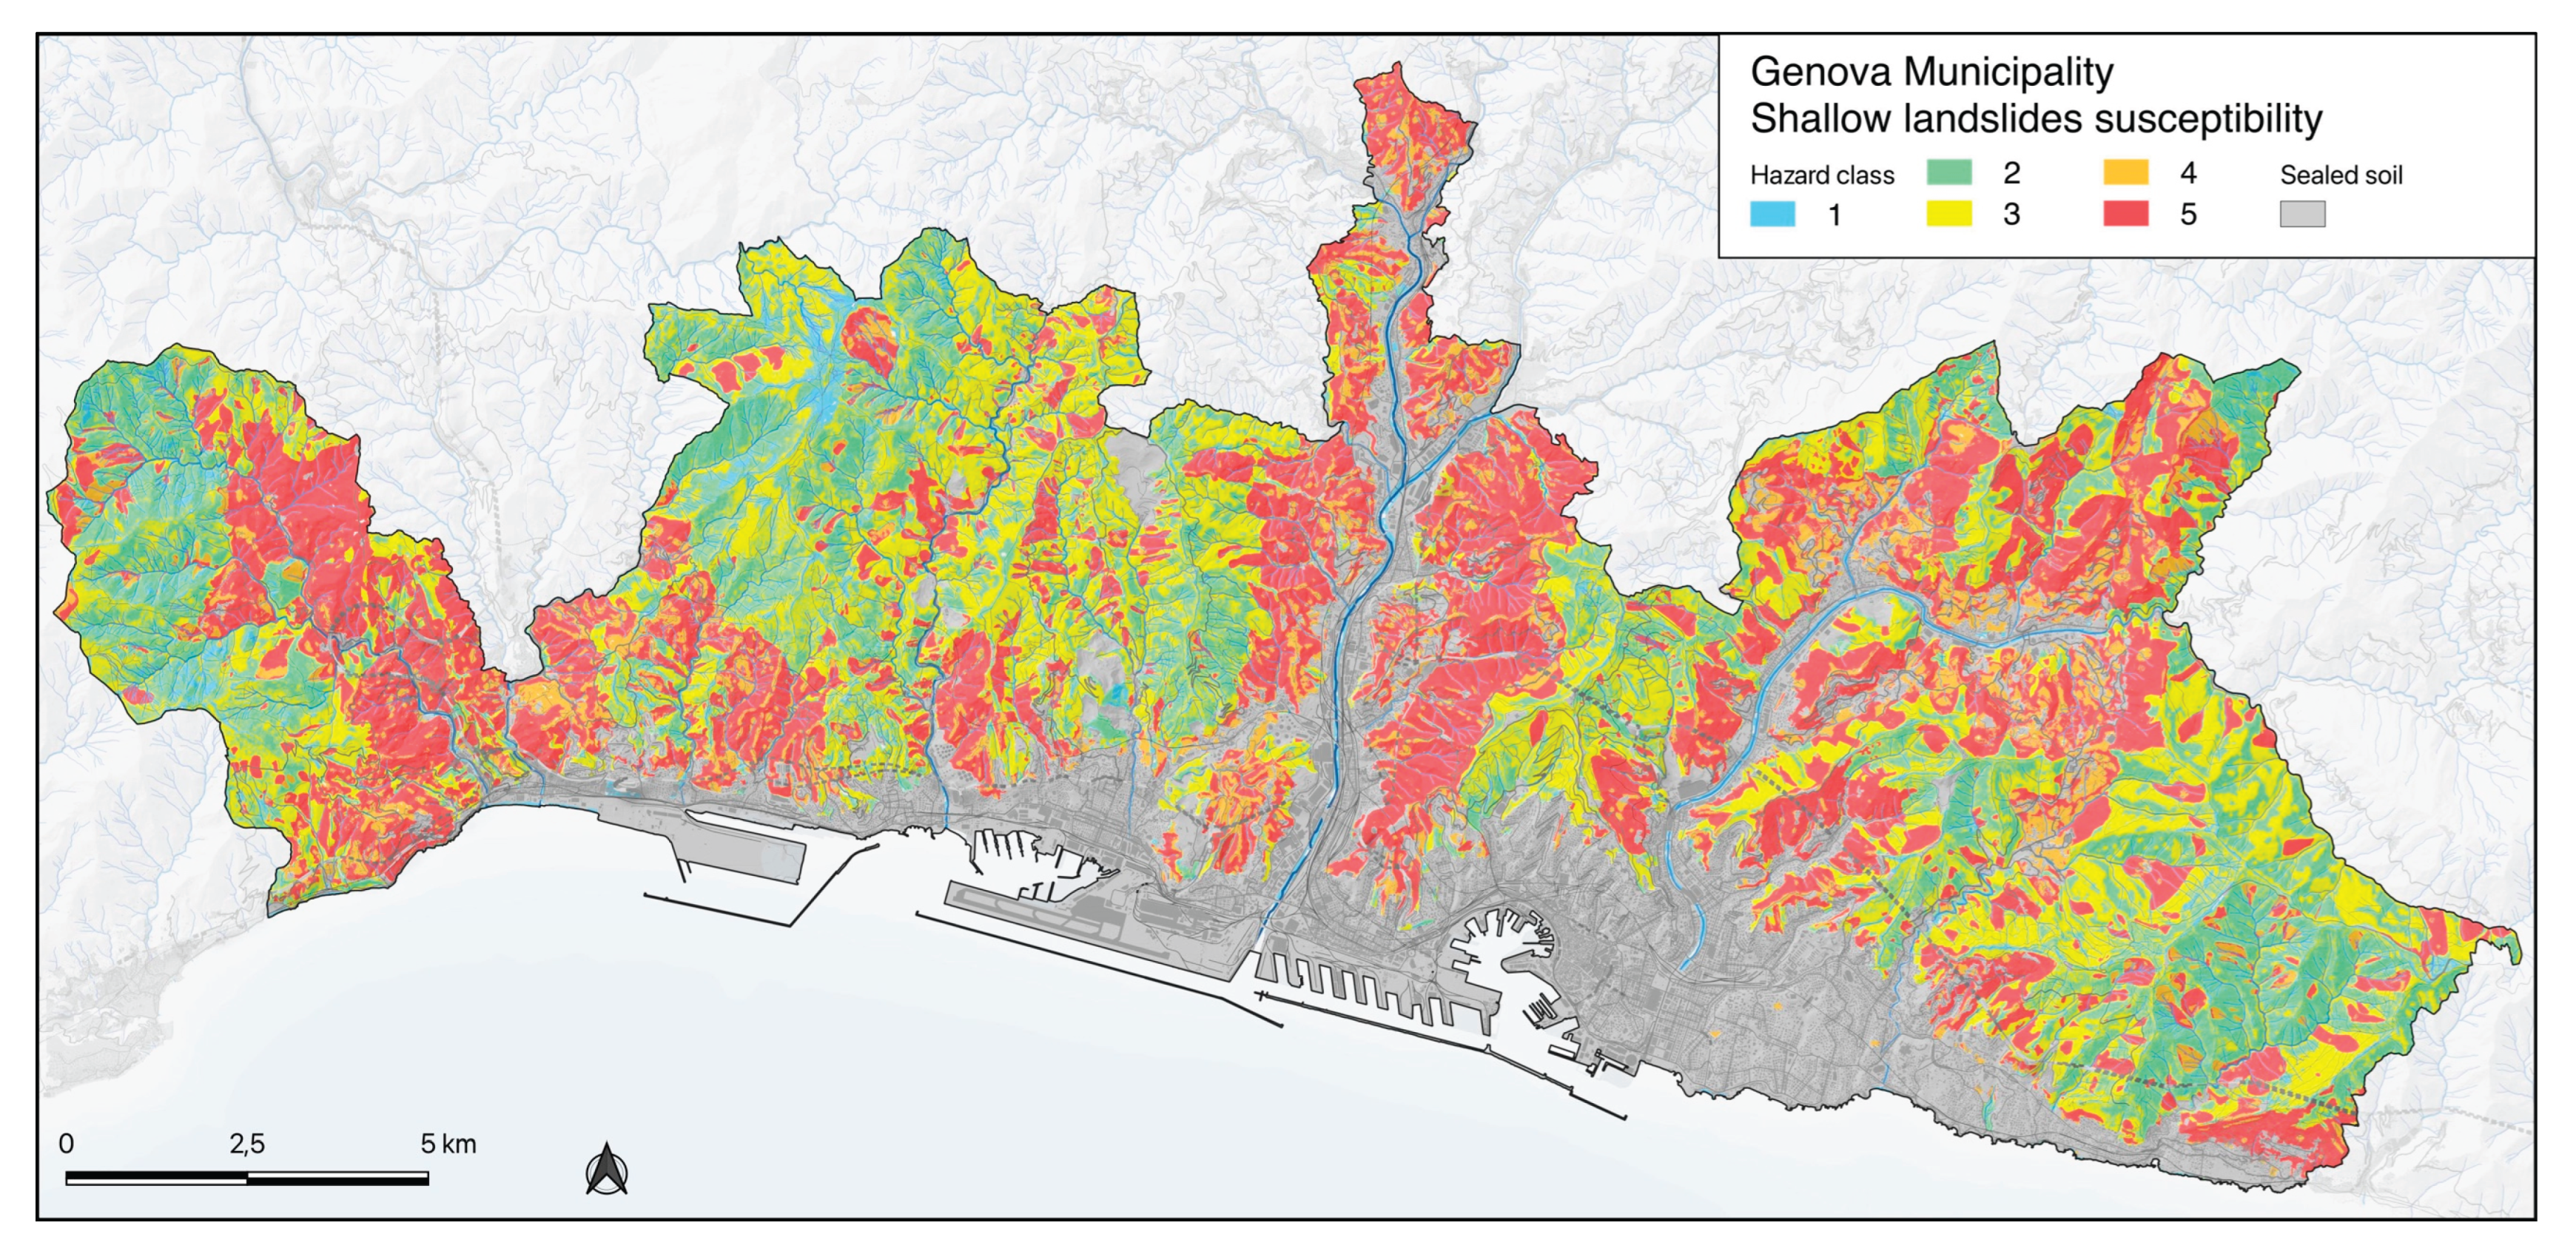
More generally, the susceptibility classes and their spatialization can also be ascribed to the different proneness to the triggering of fast-developing landslides by the different lithologies that make up the geological bedrock, which emerged from the statistics of the phenomena, as well as the lower presence of cover, including terraces. The high slope gradient also results in a high erosive power, preventing or significantly reducing debris and soil accumulations.
The calibration process made it possible to verify the reliability of the susceptibility assessment model. The results, obtained by cross-referencing the events in the calibration set (Figure 6) with the landslide susceptibility mapping, are shown in Table 6: 92 percent of the landslides in the calibration set fall in landslide susceptibility zones of classes 4 and 5, and 73 percent fall in class 5. These results testify the reliability of the developed model.
Then, the obtained landslide susceptibility map has been used as an assessment of the hazard to which the underground utilities are exposed to in relation to the development of fast shallow landslides. Considering the association of vulnerability to the pipe’s diameters defined in Table 4 and the following definition of risk classes in Figure 8, the networks risk maps are presented in Figure 9. In Figure 10 a detail related to a hilly area is shown, while Figure 11 exposes the distribution of length in percentage for the different risk classes.
In urban areas, where the shallow landslides hazard is absent (class 0), in order to highlight the potential presence of risk factors determined by falls or wall collapses, pipes sections have been classified as follows: i) where the slope gradient is under 5° the hazard is absent and then the associated risk; ii) in areas steeper than 5° the fall hazard has been considered belonging to one class and the associated risk has been obtained considering the vulnerability as previously identified (Table 4). Then, in Figure 9 is present the classification of the two networks in terms of risk for shallow landslides occurrence in classes form 1 to 5 and the one in terms of fall risk from 1f to 5f. The 0 class denotes absence of the two risk factors.
The detail maps in Figure 10 belongs to steep slopes and highlights the mixing and co-penetration between natural cover areas and scattered built-up ones: high risk zones are present at the edge of areas of intermediate or even low risk. In addition, Figure 10 shows the assessment of running water concentration, as obtained by the application of the corresponding algorithm (SAGA GIS) to the DTM: this parameter represents the potential triggering factor of potential fast-developing landslides, and its spatial analysis in relation to the landslide’s susceptibility allows a further assessment of the shallow landslides induced risk. Then, the combination of the two analysis helps in identifying both a potential shallow landslide and its development path, allowing to point out, through the subsequent spatial analysis, the potential exposed elements.
Finally, in Figure11 the percentage distribution of gas and water networks in Genoa Municipality exposed to the risk is shown. The performed calculation evidences that 12% of the water network and 11% of the gas network belong to risk classes 4 and 5, then are exposed to the highest risk. Considering Figure 9, these high-risk stretches are widely spread along the slopes where the networks expand from the urban sealed soil area to the sparse buildings one.
5. Discussion
The research activity allowed to obtain the susceptibility map for rainfall-induced shallow landslides in the Municipality of Genoa, following a qualitative-quantitative approach and then the risk related map for the water and gas networks. The descriptive statistics method, based on the evaluation and analysis of 485 rapid-developing surface landslide events recognized in the municipal territory, was combined with the AHP method, which is part of the heuristic techniques for evaluation and decision support. The methodology was applied by employing seven predisposing factors for the initiation of rain-induced surface landslides and using baseline and remote sensing survey data combined and analyzed in a GIS environment. The model was tested with a calibration process that confirmed its good reliability: 92% of the calibration set, which include 97 landslides, belonging to the that two highest susceptibility classes.
The result was subsequently cross-referenced with the underground utility networks vulnerability as defined in terms of the pipe’s diameter, in order to evaluate the risk and provide an early prevention tool. This first assessment can be further refined and developed by including the analysis of runoff water flow accumulation, i.e., by including the triggering factor for rainfall-induced shallow landslides and by carrying out periodic on-site checks in the most critical areas. The possible approach is presented in the detail Figure 10. The availability of detailed information on the characteristics of the networks, and especially on how they are laid, may allow subsequent refinement of the risk assessment by assigning further differentiated vulnerability values. The potential risk related to wall’s collapse or rockfall in urban areas, where shallow landslides hazard is considered absent, has been included in the risk evaluation in order to give a more complete evaluation of the two networks.
Furthermore, it is necessary to highlight how the susceptibility map for the fast-developing shallow landslides was obtained basing on the events that occurred on the municipal territory over the past 2-3 decades [39; 41-42]. Although their number represents a robust statistical basis, it should be emphasized that their occurrence is determined by intense rainfall, which in the area and for the short duration intervals present the maximum at the national and European scale with 180 mm/1h recorded in 2011 [70]. Such high-intensity phenomena exhibit strong spatial localization, then it is possible that the areas where the landslide phenomena have developed less frequently (Figure 6) have not yet been affected by extremely high rainfall intensities, but they could be in the future. Further research developments may additionally investigate both this aspect and include more descriptive parameters of utilities network vulnerability to risk. Besides, the presented approach to the vulnerability assessment and then the following risk evaluation, represents an evolution of previous research activities dedicated to the hazard assessment [5,6,17,24,55].
The performed analysis allows to plan and design a possible mitigation strategy. At first, the distribution of the two networks in risk classes constitutes a priority scale of attention along the very long networks. Then, depending on the local situation, and considering the shallow nature of the considered landslides, the necessary prevention measures may include NBS—Nature Based Solutions—techniques [71,72,73,74,75]. These measures are successfully used to improve slopes’ stability in particular in presence of abandoned man-made terraces which represent a possible source of risk [60,62,63,76,77]. Besides, NBS prevention measures present other co-benefits: i) the small and low-cost measures may be widely adopted along the Municipality with a proper planning of resources and interventions; ii) the short extension of the measures allows to overcome access issues that may arise in some steep or critical areas.
Finally, the importance of prevention activities is increasingly necessary and urgent considering the rainfall trend in the study area that sees a reduction in rainy days in the face of annual averages that remain substantially unchanged [78]. Figure 12 shows the annual maximum rainfall intensities in 1h, 3h and 6h registered between 1960 and 2024 by 3 rain stations whose localization is shown in Figure 1. The absolute values are relevant for all the time intervals and for all the stations, underlining the high hazard for pluvial induced phenomena in the area. Table 7 shows the statistics for the intervals and for the stations: the maximum exceeds 120 mm/1h, 260 mm/3h and 330 mm/6h. Besides, the trends look to be increasing in the 64 years period: Table 8 shows the Mann-Kendall trend test performed at 95% of significance and the Sen’s slope trend estimation with the relative confidence intervals. The analysis shows that the 1h yearly maximum intensity increase is statistically significant for the Fiorino station, which is located in the western portion of the Municipality (Figure 1). All the other diagrams present an increasing trend, even if not statistically significant. Finally, these results are coherent with other research conducted on extreme pluvial events meteorological proxies [43].
4. Conclusions
The research allowed to assess the shallow landslides risk for the two water and gas distribution network in the Genoa municipality. The assessment has been conducted evaluating the hazard according to a methodology previously developed in a contiguous area [17,55] which has been modified and adapted to the territory features. Besides, the methodology has been adapted to the study area using a statistically robust set of 485 events which has been randomly split between a training set and a calibration set of, respectively, 80% and 20% of the total events. The large number of events and the rigorous approach allowed to perform a good evaluation of the occurrence of the shallow landslide in relation to the considered seven conditioning factors. The high percentage obtain after the calibration test attests the reliability of the adopted model.
Moreover, it must be underlined that, comparing to previous works [17,55], the conditioning factors set has been modified decreasing its number and introducing new ones related to the morphometry features. The conditioning factors number reduction, obtained including all the anthropogenic features into the land use factor, allows a more agile model application without loosing the reliability, as testified by the calibration process result. Besides, the crucial factor related to the presence of man-made terraces that belong to the human modification of the landscape, has been maintained as their presence has been precisely identified using results belonging to previous researches [62,63] and including them into the slope deposit factor. Finally, the availability of a recent and precise LiDAR derived 1 m resolution DTM allowed an accurate evaluation of the landscape morphometric features, and the presence of terraces.
The increasing instability of the slopes due to shallow landslides triggering and the effects in the peri-urban areas causes more and more damages every year and often involves the water and gas distribution networks. The effect is related to the increasing intensity of rainfall that hit the study area, as it has been underlined by the 95% statistically significant increase of the 1h duration maximum intensity at one meteorological station in the studied area.
Then, these results contribute to underline the necessity of adopting prevention measures for the ground effects related to high intensity rainfall [79] in order to mitigate the risk level of the two vulnerable networks, which represent critical exposed elements. The developed risk assessment tool represents the basis of a decision support tool for planning and adopting a series of small prevention measures at the Municipality scale. A further development of the obtained results may eventually implement other network’s technical data for an additional vulnerability assessment.
Author Contributions
Conceptualization, G.P., M.T.; methodology, G.P., M.T. and F.F.; software, G.P., F.F.; validation, G.P., M.T. and F.F.; formal analysis, G.P., F.F.; investigation, M.T., F.F.; resources, F.F.; data curation, G.P., M.T. and F.F.; writing—original draft preparation, G.P., F.F.; writing—review & editing, G.P., F.F.; visualization, N.B., A.M.; supervision, N.B., F.F.; project administration, A.M., F.F.; funding acquisition, F.F., A.M. All authors have read and agreed to the published version of the manuscript.
Funding
This research was funded by Regione Liguria and Fondazione AMGA in the framework of the projects: (a) Monitor (Technologies for integrated monitoring and mitigation of landslide risk in the management of underground services), Operational Program of Liguria Region 2014-2020, European social fund axis 3—education and training; (b) Project 4.0 (Integrated asset management in the context of geo-hydrological risk and climate change).
Data Availability Statement
The data presented in this study are available on the article, further inquiries can be directed to the corresponding author.
Acknowledgments
In this section, you can acknowledge any support given which is not covered by the author contribution or funding sections. This may include administrative and technical support, or donations in kind (e.g., materials used for experiments).
Conflicts of Interest
The authors declare no conflict of interest.
References
- Petley, D. Global patterns of loss of life from landslides. Geology 2012, 40, 927–930. [Google Scholar] [CrossRef]
- Froude, M.J.; Petley, D.N. Global fatal landslide occurrence from 2004 to 2016. Nat. Hazards Earth Syst. Sci. 2018, 18, 2161–2181. [Google Scholar] [CrossRef]
- Haque, U.; da Silva, P.F.; Devoli, G.; Pilz, J.; Zhao, B.; Khaloua, A.; Wilopo, W.; Andersen, P.; Lu, P.; Lee, J.; et al. The human cost of global warming: Deadly landslides and their triggers (1994–2014). Sci. Total.Environ. 2019, 682, 673–684. [Google Scholar] [CrossRef] [PubMed]
- Alexander, D. On the causes of landslides: Human activities, perception, and natural processes. Environ. Geol. Water Sci. 1992, 20, 165–179. [Google Scholar] [CrossRef]
- Crosta, G. B.; Frattini, P. Distributed modelling of shallow landslides triggered by intense rainfall. Nat. Hazards Earth Syst. Sci. 2003, 3, 81–93. [Google Scholar] [CrossRef]
- Cignetti, M.; Godone, D.; Giordan, D. Shallow landslide susceptibility, Rupinaro catchment, Liguria (northwestern Italy). J. Maps 2019, 15, 333–345. [Google Scholar] [CrossRef]
- Giordan, D.; Cignetti, M.; Baldo, M.; Godone, D. Relationship between man-made environment and slope stability: The case of 2014 rainfall events in the terraced landscape of the Liguria region (northwestern Italy). Geomat. Nat. Haz. Risk 2017, 8, 1833–1852. [Google Scholar] [CrossRef]
- Glade, T.; Anderson, M.; Crozier, M.J. Landslide Hazard and Risk; John Wiley & Sons Ltd., New York, 2005; pp. 824.
- Cascini, L.; Bonnard, C.; Corominas, J.; Jibson, R.; Montero-Olarte, J. Landslide hazard and risk zoning for urban planning and development. In Landslide Risk Management; Taylor and Francis: London, UK, 2005; pp. 199–235. [Google Scholar]
- Dai, F.C.; Lee, C.F.; Ngai, Y.Y. Landslide risk assessment and management: An overview. Eng Geol. 2002, 64, 65–87. [Google Scholar] [CrossRef]
- Corominas, J.; Van Westen, C.; Frattini, P. Recommendations for the quantitative analysis of landslide risk. Bull. Eng. Geol. Environ. 2014, 73, 209–263. [Google Scholar] [CrossRef]
- Van Westen, C.J.; Rengers, N.; Soeters, R. Use of Geomorphological Information in Indirect Landslide Susceptibility Assessment. Nat. Hazards 2003, 30, 399–419. [Google Scholar] [CrossRef]
- Van Westen, C.J.; Van Asch, T.W.J.; Soeters, R. Landslide hazard and risk zonation: Why is it still so difficult? Bull. Eng. Geol. Env. 2006, 65, 167–184. [Google Scholar] [CrossRef]
- Tsangaratos, P.; Loupasakis, C.; Nikolakopoulos, K.; Angelitsa, V.; Ilia, I. Developing a landslide susceptibility map based on remote sensing, fuzzy logic and expert knowledge of the Island of Lefkada, Greece. Environ. Earth Sci. 2018, 77, 363. [Google Scholar] [CrossRef]
- Aleotti, P.; Chowdhury, R. Landslide hazard assessment: Summary review and new perspectives. Bull. Eng. Geol. Environ. 1999, 58, 21–44. [Google Scholar] [CrossRef]
- Fedato, E.; Fubelli, G.; Kurilla, L.; Tiranti, D. Predisposing Factors for Shallow Landslides in Alpine and Hilly/Apennines Environments: A Case Study from Piemonte, Italy. Geosciences 2023, 13, 252. [Google Scholar] [CrossRef]
- Roccati, A.; Paliaga, G.; Luino, F.; Faccini, F.; Turconi, L. GIS-based landslide susceptibility mapping for land use planning and risk assessment. Land 2021, 10, 162. [Google Scholar] [CrossRef]
- Marsala, V.; Galli, A.; Paglia, G.; Miccadei, E. Landslide Susceptibility Assessment of Mauritius Island (Indian Ocean). Geosciences 2019, 9, 493. [Google Scholar] [CrossRef]
- Baeza, C.; Lantada, N.; Amorim, S. Statistical and spatial analysis of landslide susceptibility maps with different classification systems. Environ. Earth Sci. 2016, 75, 1318. [Google Scholar] [CrossRef]
- Yong, C. , Jinlong, D., Fei, G. et al. Review of landslide susceptibility assessment based on knowledge mapping. Stoch Environ Res Risk Assess 2022, 36, 2399–2417. [Google Scholar] [CrossRef]
- Lai, J.-S.; Tsai, F. Improving GIS-based Landslide Susceptibility Assessments with Multi-temporal Remote Sensing and Machine Learning. Sensors 2019, 19, 3717. [Google Scholar] [CrossRef]
- Dou, J.; Yunus, A.P.; Tien Bui, D.; Sahana, M.; Chen, C.W.; Zhu, Z.; Weidong, W.; Thai Pham, B. Evaluating GIS-based multiple statistical models and data mining for earthquake and rainfall-induced landslide susceptibility using the LiDAR DEM. Remote Sens. 2019, 11, 638. [Google Scholar] [CrossRef]
- Ayalew, L.; Yamagishi, H.; Ugawa, N. Landslide susceptibility mapping using GIS-based weighted linear combination, the case in Tsugawa area of Agano River, Niigata Prefecture, Japan. Landslides 2004, 1, 73–81. [Google Scholar] [CrossRef]
- Pellicani, R.; Argentiero, I.; Spilotro, G. GIS-based predictive models for regional-scale landslide susceptibility assessment and risk mapping along road corridors. Geomat. Nat. Haz. Risk 2017, 8, 1012–1033. [Google Scholar] [CrossRef]
- Guzzetti, F.; Carrara, A.; Cardinali, M.; Reichenbach, P. Landslide hazard evaluation: A review of current techniques and their application in a multi-scale study, Central Italy. Geomorphology 1999, 31, 181–216. [Google Scholar] [CrossRef]
- Fell, R.; Corominas, J.; Bonnard, C.; Cascini, L.; Leroi, E.; Savage, W.Z. Guidelines for landslide susceptibility, hazard and risk zoning for land use planning. Eng. Geol. 2008, 102, 85–98. [Google Scholar] [CrossRef]
- Huang, Y.; Zhao, L. Review on landslide susceptibility mapping using support vector machines. Catena 2018, 165, 520–529. [Google Scholar] [CrossRef]
- Reichenbach, P.; Rossi, M.; Malamud, B.M.; Mihir, M.; Guzzetti, F. A review of statistically-based landslide susceptibility models. Earth Sci. Rev. 2018, 180, 60–91. [Google Scholar] [CrossRef]
- Montgomery, D.R.; Dietrich, W.E. A physically based model for the topographic control on shallow landsliding. Water Resour. Res. 1994, 30, 1153–1171. [Google Scholar] [CrossRef]
- Zahid, U.; Godio, A.; Mauro, S. An analytical procedure for modelling pipeline-landslide interaction in gas pipelines. Journal of Natural Gas Science and Engineering 2020, 81, 103474. [Google Scholar] [CrossRef]
- Marinos, V.; Stoumpos, G.; Papazachos, C. Landslide Hazard and Risk Assessment for a Natural Gas Pipeline Project: The Case of the Trans Adriatic Pipeline, Albania Section. Geosciences 2019, 9, 61. [Google Scholar] [CrossRef]
- Xiong, J.; Sun, M.; Zhang, H.; Cheng, W.; Yang, Y.; Sun, M.; Cao, Y.; Wang, J. Application of the Levenburg–Marquardt back propagation neural network approach for landslide risk assessments. Nat. Hazards Earth Syst. Sci. 2019, 19, 629–653. [Google Scholar] [CrossRef]
- Marinos, V.; Stoumpos, G.; Papouli, D.; Papazachos, C.B. Selection of TBM and geotechnical assessment of a microtunnel in a difficult geological environment: a case of a natural gas pipeline beneath an active landslide (Albania). Bull Eng Geol Environ 2019, 78, 1795–1813. [Google Scholar] [CrossRef]
- Çevik, E.; Topal, T. GIS-based landslide susceptibility mapping for a problematic segment of the natural gas pipeline, Hendek (Turkey). Env Geol 2003, 44, 949–962. [Google Scholar] [CrossRef]
- Hongyuan, J.; Jianbin, H.; Bing, H.; Zhangzhong, W. Semi-quantitative assessment technology of geohazard risk for pipeline. In Proc. International Conference on Pipelines and Trenchless Technology 2009, ICPTT 2009: Advances and Experiences with Pipelines and Trenchless Technology for Water, Sewer, Gas, and Oil Applications. International Conference on Pipelines and Trenchless Technology 2009, Advances and Experiences with Pipelines and Trenchless Technology for Water, Sewer, Gas, and Oil Applications, 18 October-21 October 2009. Vol. 1, pp. 1542–1551.
- Li, C.; Huiming, T.; Liangqing, W.; Jing, H. Hazard evaluation method study on pipeline of underground crossing landslide area. In Proc. International Conference on Pipelines and Trenchless Technology 2009, ICPTT 2009: Advances and Experiences with Pipelines and Trenchless Technology for Water, Sewer, Gas, and Oil Applications. International Conference on Pipelines and Trenchless Technology 2009, Advances and Experiences with Pipelines and Trenchless Technology for Water, Sewer, Gas, and Oil Applications, 18 October-21 October 2009. Vol. 1, pp. 1081-1092.
- Nasirov, H. M.; Suleymanov, T.I.; Asadov, H.H. Developing a method for construction of underground pipeline taking into account landslide hazards. OIJ 2021, 4, 114–117. [Google Scholar] [CrossRef]
- Wang, Q.; Zhang, Y.; Lv, Q.; Xiang, C.; Xia, X.; Liu, J. Susceptibility assessment of soil erosion in overlaying diluvial fan of shallow underground pipelines. Bull Eng Geol Environ 2021, 80, 2573–2585. [Google Scholar] [CrossRef]
- Paliaga, G.; Luino, F.; Turconi, L.; Faccini, F. Inventory of geo-hydrological phenomena in Genova municipality (NW Italy). Journal of Maps 2018, 15, 28–37. [Google Scholar] [CrossRef]
- Faccini, F.; Giardino, M.; Paliaga, G.; Perotti, L.; Brandolini, P. Urban geomorphology of Genoa old city (Italy). Journal of Maps 2020, 17, 51–64. [Google Scholar] [CrossRef]
- Acquaotta, F.; Faccini, F.; Fratianni, S.; Paliaga, G.; Sacchini, A. Rainfall intensity in the Genoa metropolitan area: Secular variations and consequences. Weather 2018, 73, 356–362. [Google Scholar] [CrossRef]
- Acquaotta, F.; Faccini, F.; Fratianni, S.; Paliaga, G.; Sacchini, A.; Vilímek, V. Increased flash flooding in Genoa Metropolitan Area: A combination of climate changes and soil consumption? Meteorol. Atmos. Phys. 2019, 131, 1099–1110. [Google Scholar] [CrossRef]
- Paliaga, G.; Parodi, A. Geo-Hydrological Events and Temporal Trends in CAPE and TCWV over the Main Cities Facing the Mediterranean Sea in the Period 1979–2018. Atmosphere 2022, 13, 89. [Google Scholar] [CrossRef]
- Loglisci, N.; Boni, G.; Cauteruccio, A.; Faccini, F.; Milelli, M.; Paliaga, G.; Parodi, A. , The role of citizen science to assess the spatiotemporal pattern of rainfall events in urban areas: a case study in the city of Genoa, Italy, Nat. Haz. Earth Sys. Sc. 2024, in press. [Google Scholar] [CrossRef]
- Lee, S.; Ryu, J.-H.; Won, J.-S.; Park, H.-J. Determination and application of the weights for landslide susceptibility mapping using an artificial neural network. Eng. Geol. 2004, 71, 289–302. [Google Scholar] [CrossRef]
- Saaty, T.L. A scaling method for priorities in hierarchical structures. J. Math. Psychol. 1977, 15, 234–281. [Google Scholar] [CrossRef]
- Saaty, T.L. The Analytic Hierarchy Process; M. Graw-Hill: New York, NY, USA, 1980. [Google Scholar]
- Saaty, T.L. Decision Making for Leaders: The Analytic Hierarchy Process for Decisions in a Complex World; RWS publications: Pittsburgh, PA, USA, 2001. [Google Scholar]
- Saaty, T.L.; Vargas, L.G. Models, Methods, Concepts and Applications of the Analytic Hierarchy Process; Springer Science+Business Media: New York, NY, USA, 2012; p. 175. [Google Scholar]
- Goepel, K.D. Implementing the Analytic Hierarchy Process as a Standard Method for Multi-Criteria Decision Making. In Corporate Enterprises—A New AHP Excel Template with Multiple Inputs, Proceedings of the International Symposium on the Analytic Hierarchy Process, Kuala Lampur, Malaysia, 23–26 June 2013; Creative Decisions Foundation: Kuala Lampur, Malaysia, 2013; Volume 2. [Google Scholar]
- Alonso, J.A.; Lamata, M.T. Consistency in the analytic hierarchy process: A new approach. Int. J. Uncertain. Fuzz. 2006, 14, 445–459. [Google Scholar] [CrossRef]
- Gamper, C.D.; Thöni, M.; Weck-Hannemann, H. A conceptual approach to the use of Cost Benefit and Multi Criteria Analysis in natural hazard management. Nat. Hazards Earth Syst. Sci. 2006, 6, 293–302. [Google Scholar] [CrossRef]
- Yalcin, A. GIS-based landslide susceptibility mapping using analytical hierarchy process and bivariate statistics in Ardesen (Turkey): Comparisons of results and confirmations. Catena 2008, 72, 1–12. [Google Scholar] [CrossRef]
- Pourghasemi, H.R.; Pradhan, B.; Gokceoglu, C. Application of fuzzy logic and analytical hierarchy process (AHP) to landslide susceptibility mapping at Haraz watershed, Iran. Nat. Hazards 2012, 63, 965–996. [Google Scholar] [CrossRef]
- Roccati, A.; Faccini, F.; Luino, F.; Ciampalini, A.; Turconi, L. Heavy rainfall triggering shallow landslides: A susceptibility assessment by a GIS-approach in a Ligurian Apennine Catchment (Italy). Water 2019, 11, 605. [Google Scholar] [CrossRef]
- Panchal, S.; Shrivastava, A.K. Application of analytic hierarchy process in landslide susceptibility mapping at regional scale in GIS environment. J. Stat. Manag. Syst. 2020, 23, 199–206. [Google Scholar] [CrossRef]
- Komac, M. A landslide susceptibility model using the analytical hierarchy process method and multivariate statistics in perialpine Slovenia. Geomorphology 2006, 74, 17–28. [Google Scholar] [CrossRef]
- Fan, W.; Wei, X.S.; Cao, Y.B.; Zheng, B. Landslide susceptibility assessment using the certainty factor and analytic hierarchy process. J. Mt. Sci. 2017, 14, 906–925. [Google Scholar] [CrossRef]
- Guzzetti, F.; Cardinali, M.; Reichenbach, P. The AVI Project: A bibliographical and archive inventory of landslides and floods in Italy. Environ. Manag. 1994, 18, 623–633. [Google Scholar] [CrossRef]
- Tarolli, P.; Preti, F.; Romano, N. Terraced landscapes: From an old best practice to a potential hazard for soil degradation due to land abandonment. Anthropocene 2014, 6, 10–25. [Google Scholar] [CrossRef]
- Agnoletti, M.; Errico, A.; Santoro, A.; Dani, A.; Preti, F. Terraced landscapes and hydrogeological risk. Effects of land abandonment in Cinque Terre (Italy) during severe rainfall events. Sustainability 2019, 11, 235. [Google Scholar] [CrossRef]
- Paliaga, G.; Luino, F.; Turconi, L.; De Graff, J.V.; Faccini, F. Terraced landscapes on Portofino promontory (Italy): Identification, geo-hydrological hazard and management. Water 2020, 12, 435. [Google Scholar] [CrossRef]
- Paliaga, G.; Luino, F.; Turconi, L.; Profeta, M.; Vojinovic, Z.; Cucchiaro, S.; Faccini, F. Terraced Landscapes as NBSs for Geo-Hydrological Hazard Mitigation: Towards a Methodology for Debris and Soil Volume Estimations through a LiDAR Survey. Remote Sens. 2022, 14, 3586. [Google Scholar] [CrossRef]
- Kanungo, D. P.; Arora, M. K.; Gupta, R. P.; Sarkar, S. Landslide risk assessment using concepts of danger pixels and fuzzy set theory in Darjeeling Himalayas. Landslides 2008, 5, 407–416. [Google Scholar] [CrossRef]
- Porter, M.; Lato, M.; Quinn, P.; Whittall, J. Challenges with use of risk matrices for geohazard risk management for resource development projects. In J. Wesseloo (ed.), MGR 2019: Proceedings of the First International Conference on Mining Geomechanical Risk, Australian Centre for Geomechanics, Perth, 71-84. [CrossRef]
- Ivanov, P.; Dobrev, N.; Berov, B.; Frantzova, A.; Krastanov, M.; Nankin, R. Landslide risk for the territory of Bulgaria by administrative districts. Geologica Balcanica 2022, 51, 21–28. [Google Scholar] [CrossRef]
- Cruden, D.M.; Varnes, D.J. Landslide Types and Processes, Transportation Research Board, U.S. National Academy of Sciences, Special Report, 247, 1996; pp. 36-75.
- Hungr, O.; Evans, S.G.; Bovis, M.J.; Hutchinson, J.N. A review of the classification of landslides of the flow type. Environ. Eng. Geosci. 2001, 7, 221–238. [Google Scholar] [CrossRef]
- Hungr, O.; Leroueil, S.; Picarelli, L. The Varnes classification of landslide types, an update. Landslides 2014, 1, 167–194. [Google Scholar] [CrossRef]
- Paliaga, G.; Donadio, C.; Bernardi, M.; Faccini, F. High-resolution lightning detection and possible relationship with rainfall events over the Central Mediterranean Area. Remote Sens. 2019, 11, 1601. [Google Scholar] [CrossRef]
- Singh, A.K. Bioengineering techniques of slope stabilization and landsl.ide mitigation. Disaster Prev. Manag. Int. J. 2010, 19, 384–397. [Google Scholar] [CrossRef]
- Bovolenta, R.; Mazzuoli, M.; Berardi, R. Soil bio-engineering techniques to protect slopes and prevent shallow landslides. Riv. Ital. Geotec. 2018, 52, 44–65. [Google Scholar]
- Punetha, P.; Samanta, M.; Sarkar, S. Bioengineering as an effective and ecofriendly soil slope stabilization method: A review. In Landslides: Theory, Practice and Modelling; Springer: Cham, Switzerland, 2019; pp. 201–224. [Google Scholar]
- Turconi, L.; Faccini, F.; Marchese, A.; Paliaga, G.; Casazza, M.; Vojinovic, Z.; Luino, F. Implementation of nature-based solutions for hydro-meteorological risk reduction in small mediterranean catchments: The case of Portofino Natural Regional Park, Italy. Sustainability 2020, 12, 1240. [Google Scholar] [CrossRef]
- Devanand, V.B.; Mubeen, A.; Vojinovic, Z.; Sanchez Torres, A.; Paliaga, G.; Abdullah, A.F.; Leitão, J.P.; Manojlovic, N.; Fröhle, P. Innovative Methods for Mapping the Suitability of Nature-Based Solutions for Landslide Risk Reduction. Land 2023, 12, 1357. [Google Scholar] [CrossRef]
- Moreno-de-las-Heras, M.; Lindenberger, F.; Latron, J.; Lana-Renault, N.; Llorens, P.; Arnáez, J.; Romero-Díaz, A.; Gallart, F. Hydro-geomorphological consequences of the abandonment of agricultural terraces in the Mediterranean region: Key controlling factors and landscape stability patterns. Geomorphology 2019, 333, 73–91. [Google Scholar] [CrossRef]
- Paliaga, G.; Faccini, F.; Luino, F.; Turconi, L. A spatial multicriteria prioritizing approach for geo-hydrological risk mitigation planning in small and densely urbanized Mediterranean basins. Natural Hazards and Earth System Sciences 2019, 19, 53–69. [Google Scholar] [CrossRef]
- Roccati, A.; Paliaga, G.; Luino, F.; Faccini, F.; Turconi, L. Rainfall threshold for shallow landslides initiation and analysis of long-term rainfall trends in a Mediterranean area. Atmosphere 2020, 11, 1367. [Google Scholar] [CrossRef]
- Anagnostopoulou, C.; Tolika, K.; Flocas, H.; Maheras, P. Cyclones in the Mediterranean region: Present and future climate scenarios derived from a general circulation model (HadAM3P). Adv. Geosci. 2006, 7, 9–14. [Google Scholar] [CrossRef]
Figure 1.
The study area, i.e., the Municipality of Genoa, is characterized by fairly developed hydrographic networks, small catchments, and an elevation between sea level and more than 1,000 m above sea level at a reduced distance as the crow flies from the sea. The red box is the reference for Figure 10. In 1 the Polcevera stream and in 2 the Bisagno stream.
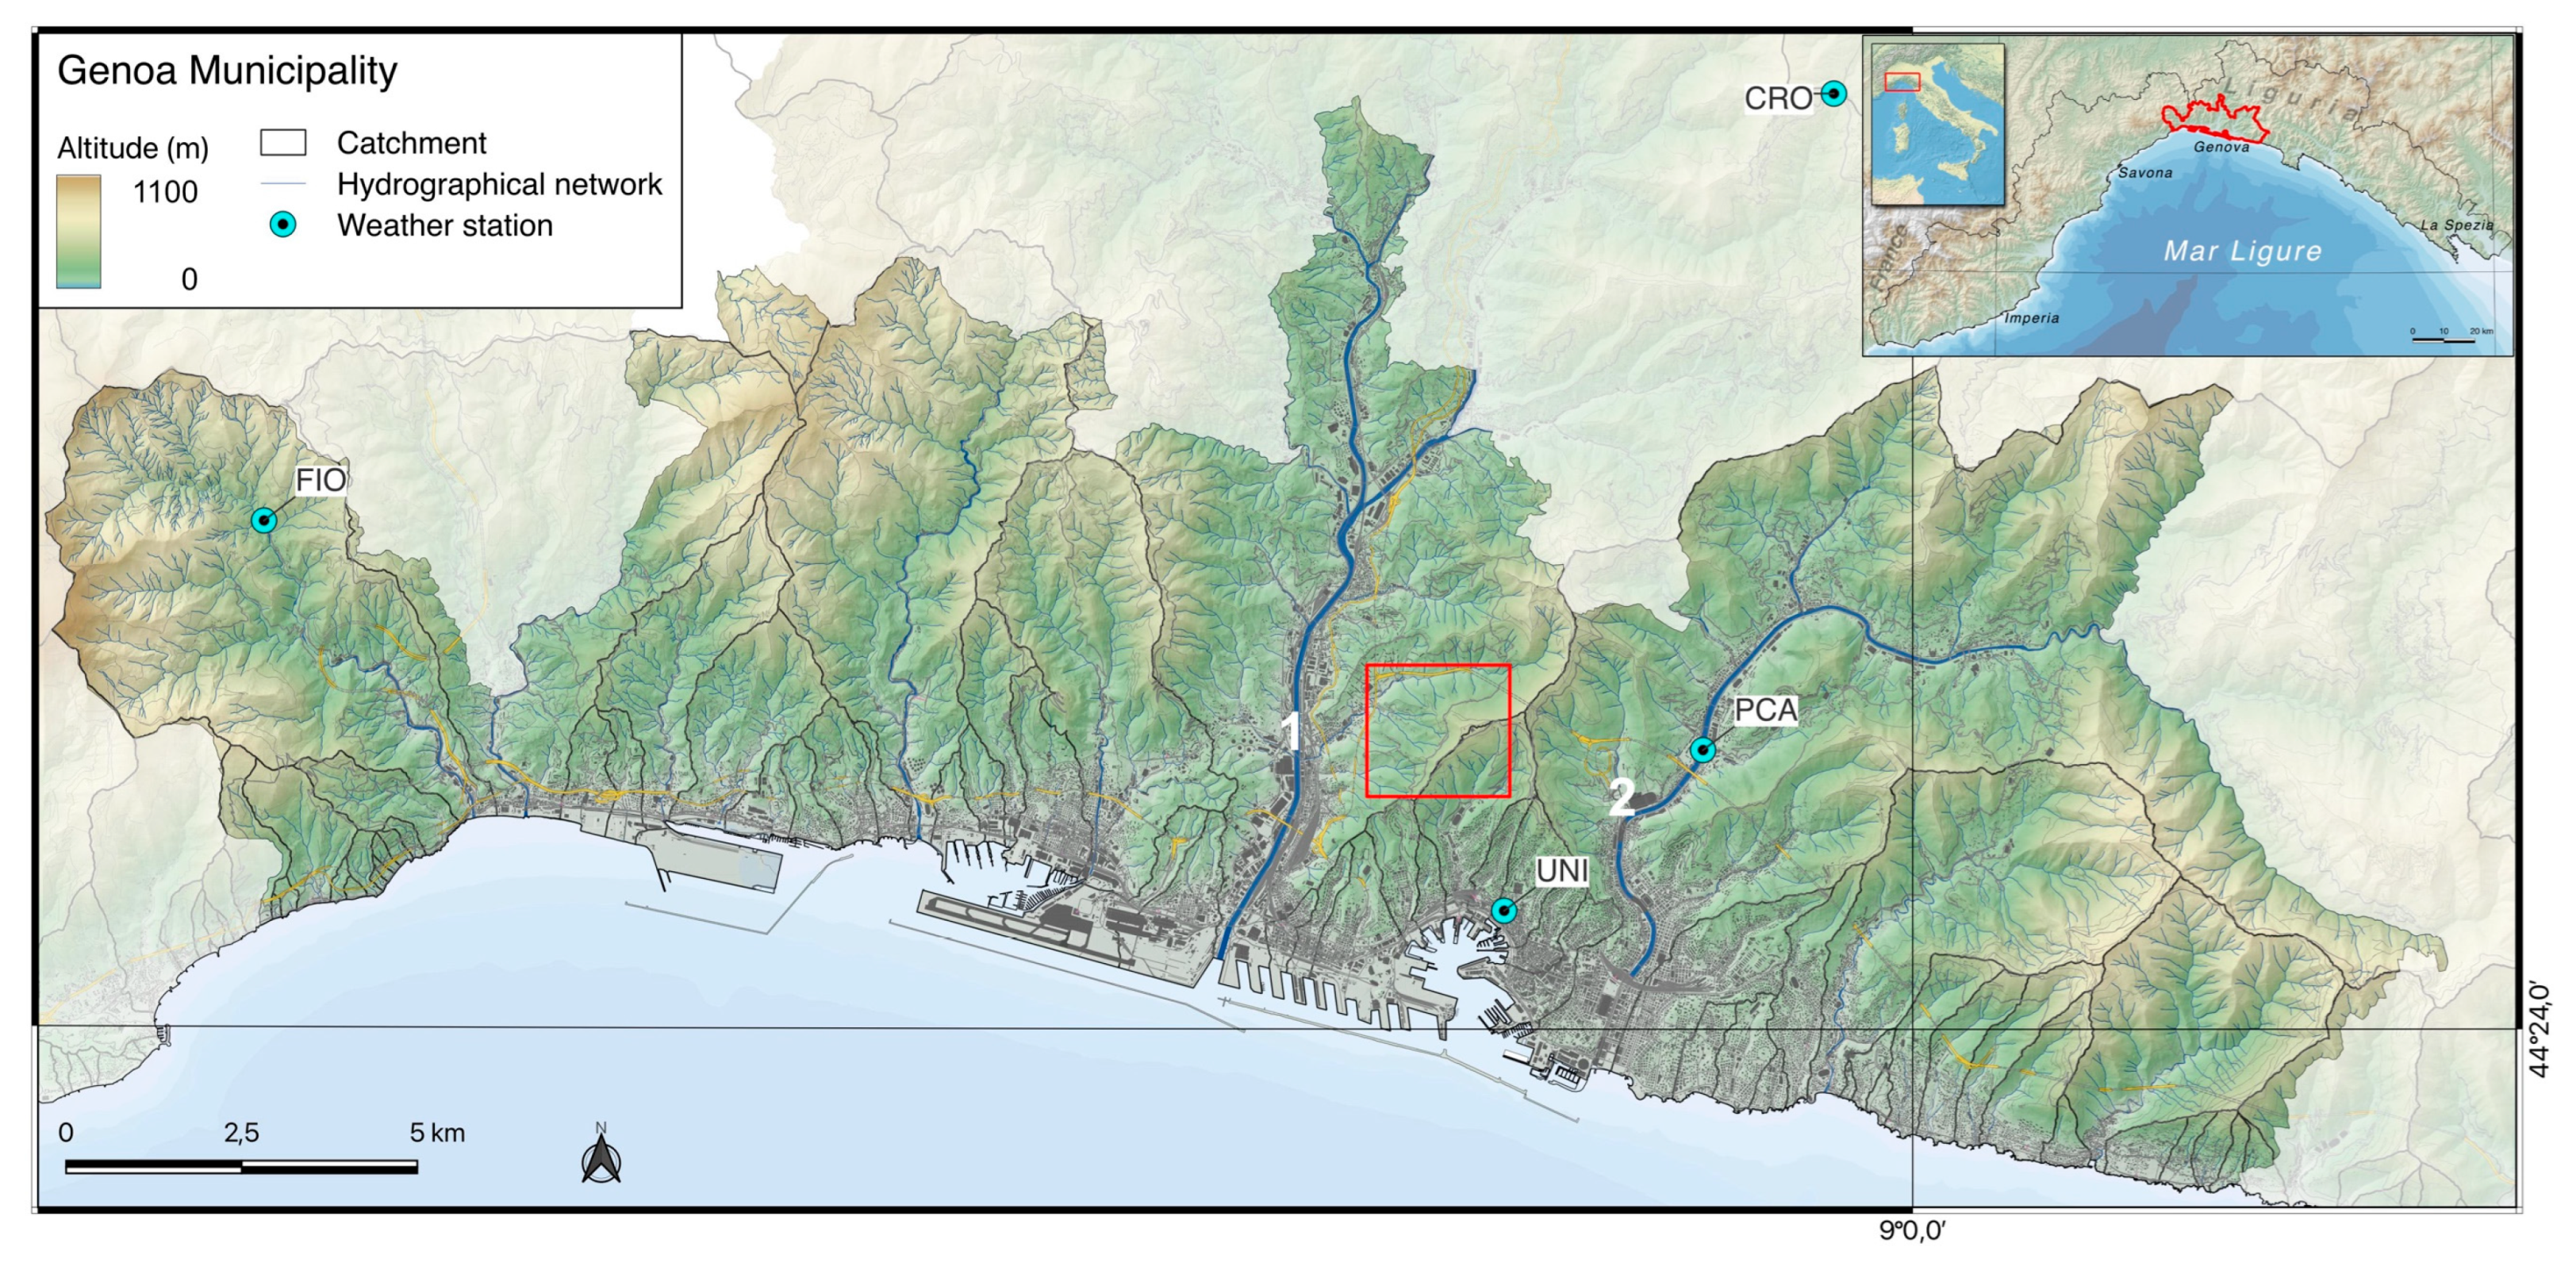
Figure 2.
Development of the water (A) and gas (B) distribution network in Genoa Municipality.
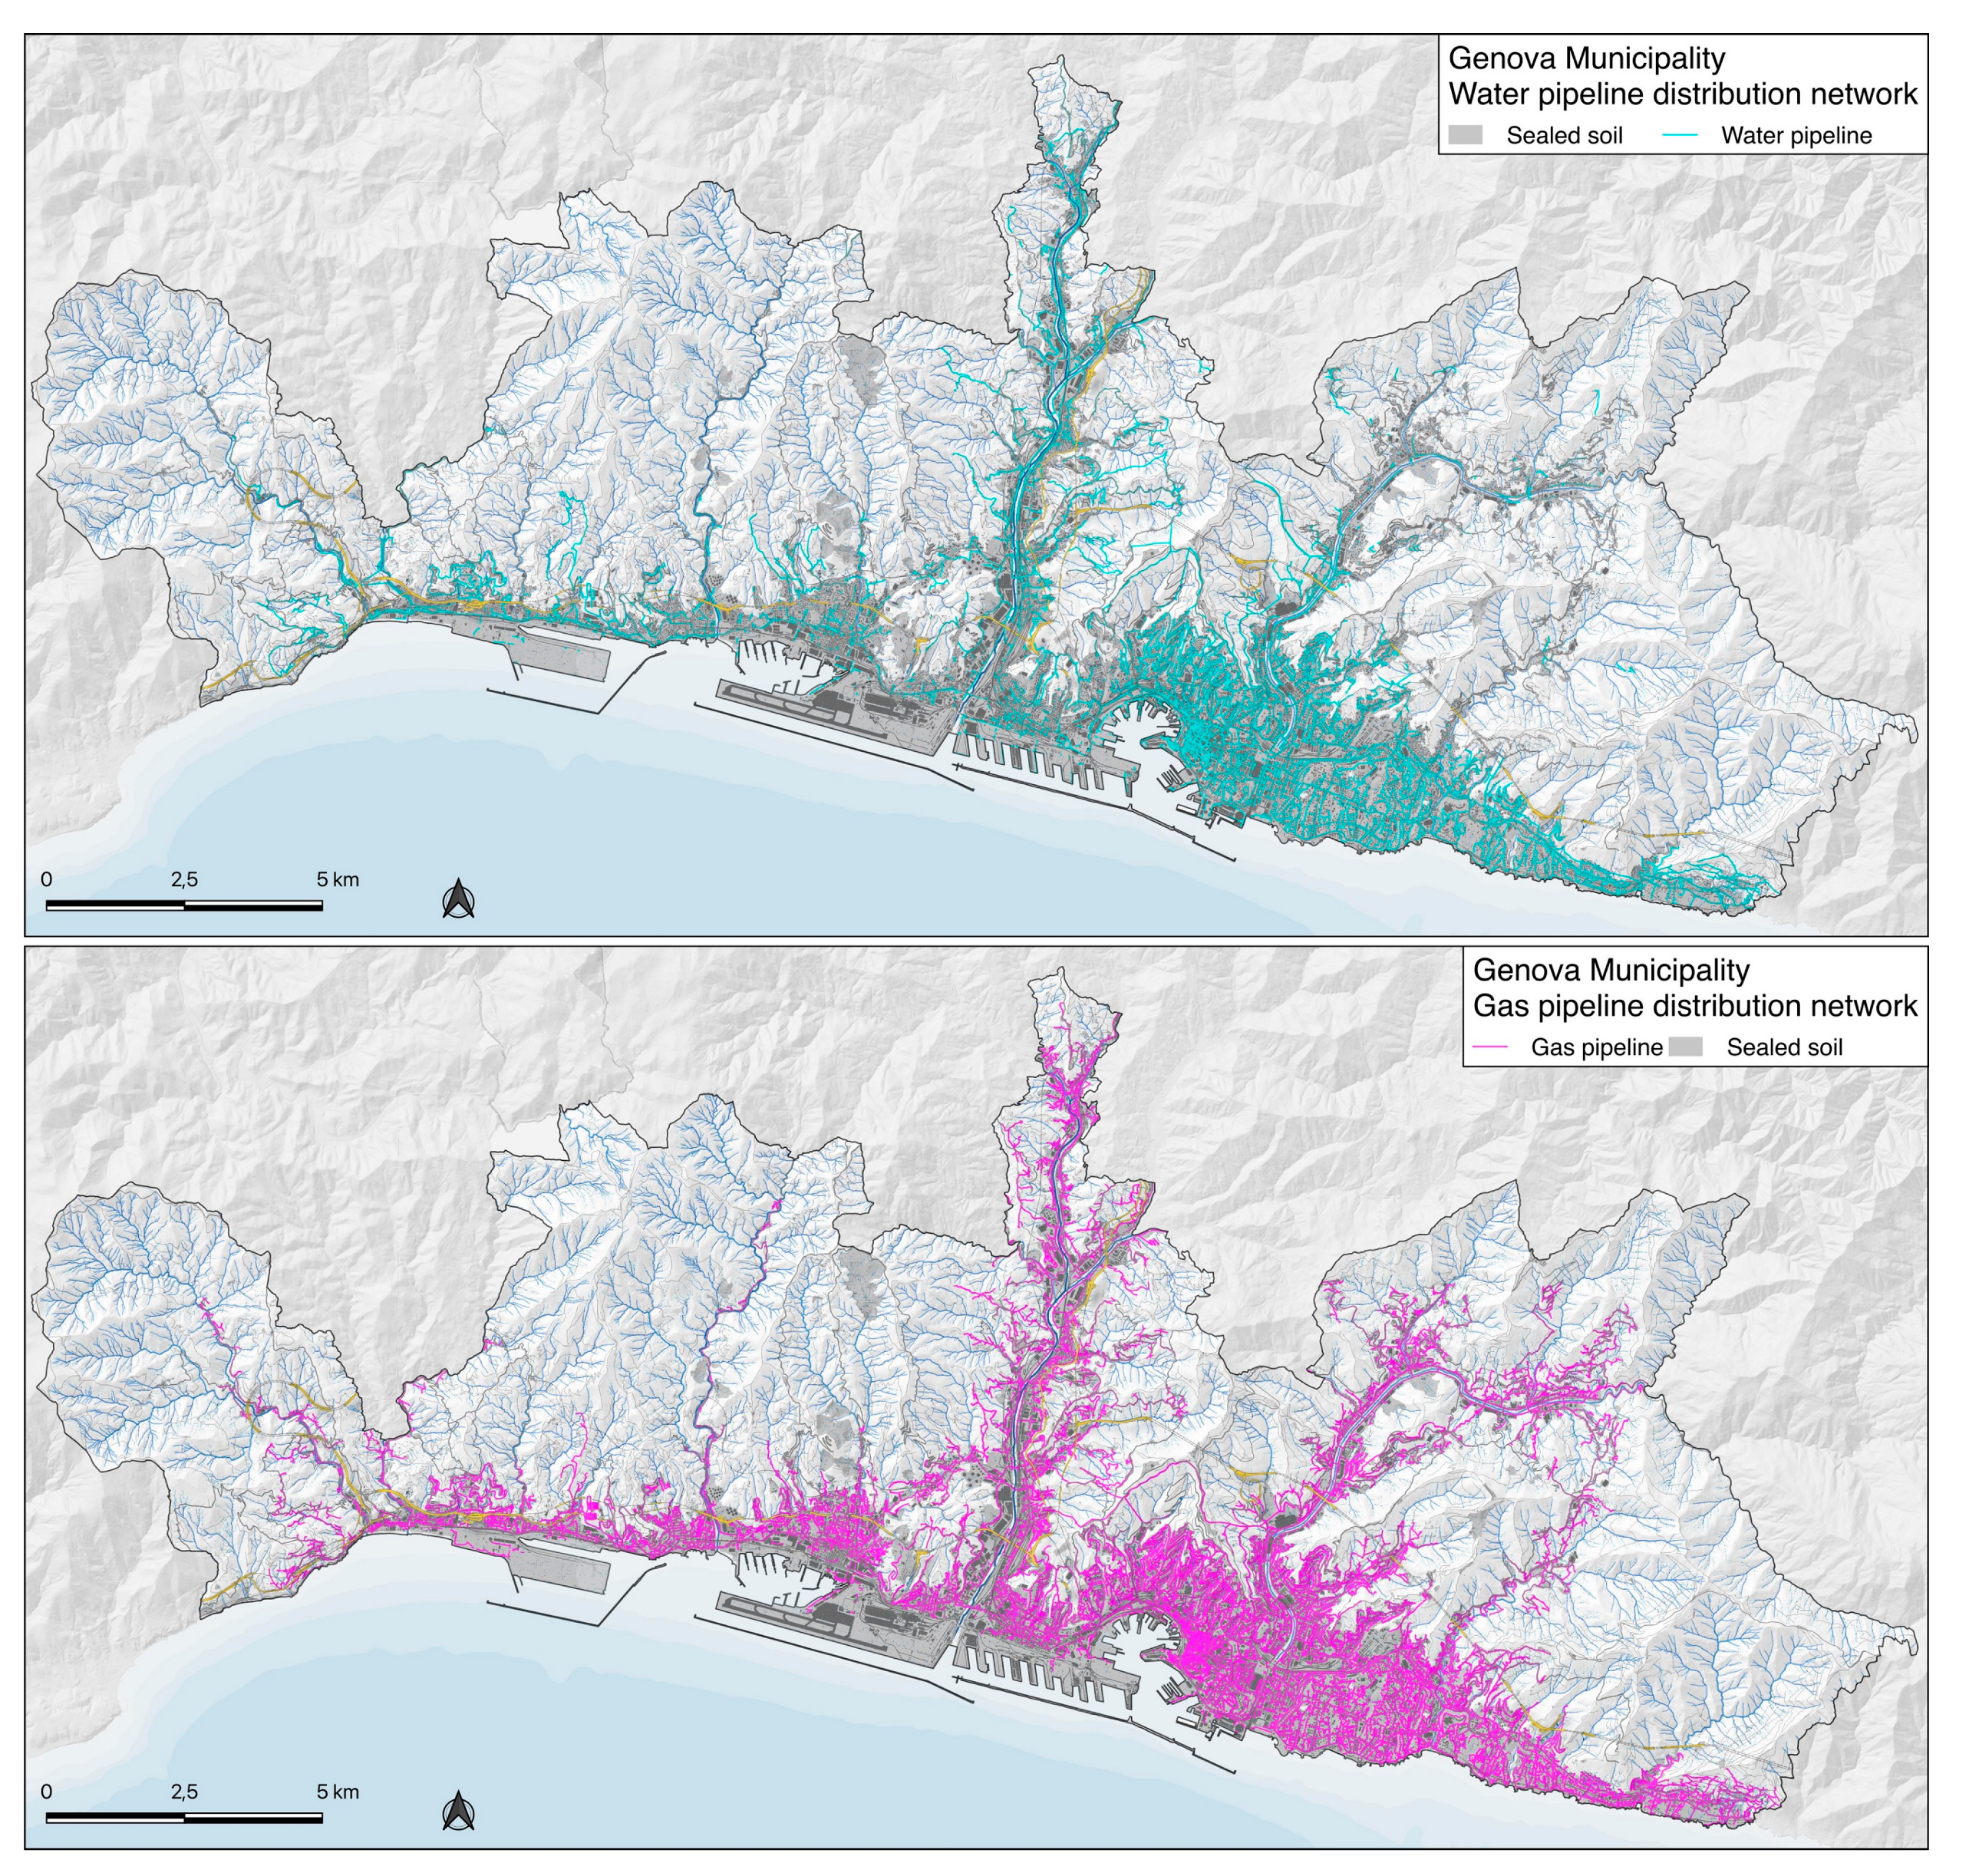
Figure 3.
Monthly mean rainfall recorded at Genoa University weather station (35 m a.s.l.) in the 1833-2023 period and annual rainfall.
Figure 3.
Monthly mean rainfall recorded at Genoa University weather station (35 m a.s.l.) in the 1833-2023 period and annual rainfall.
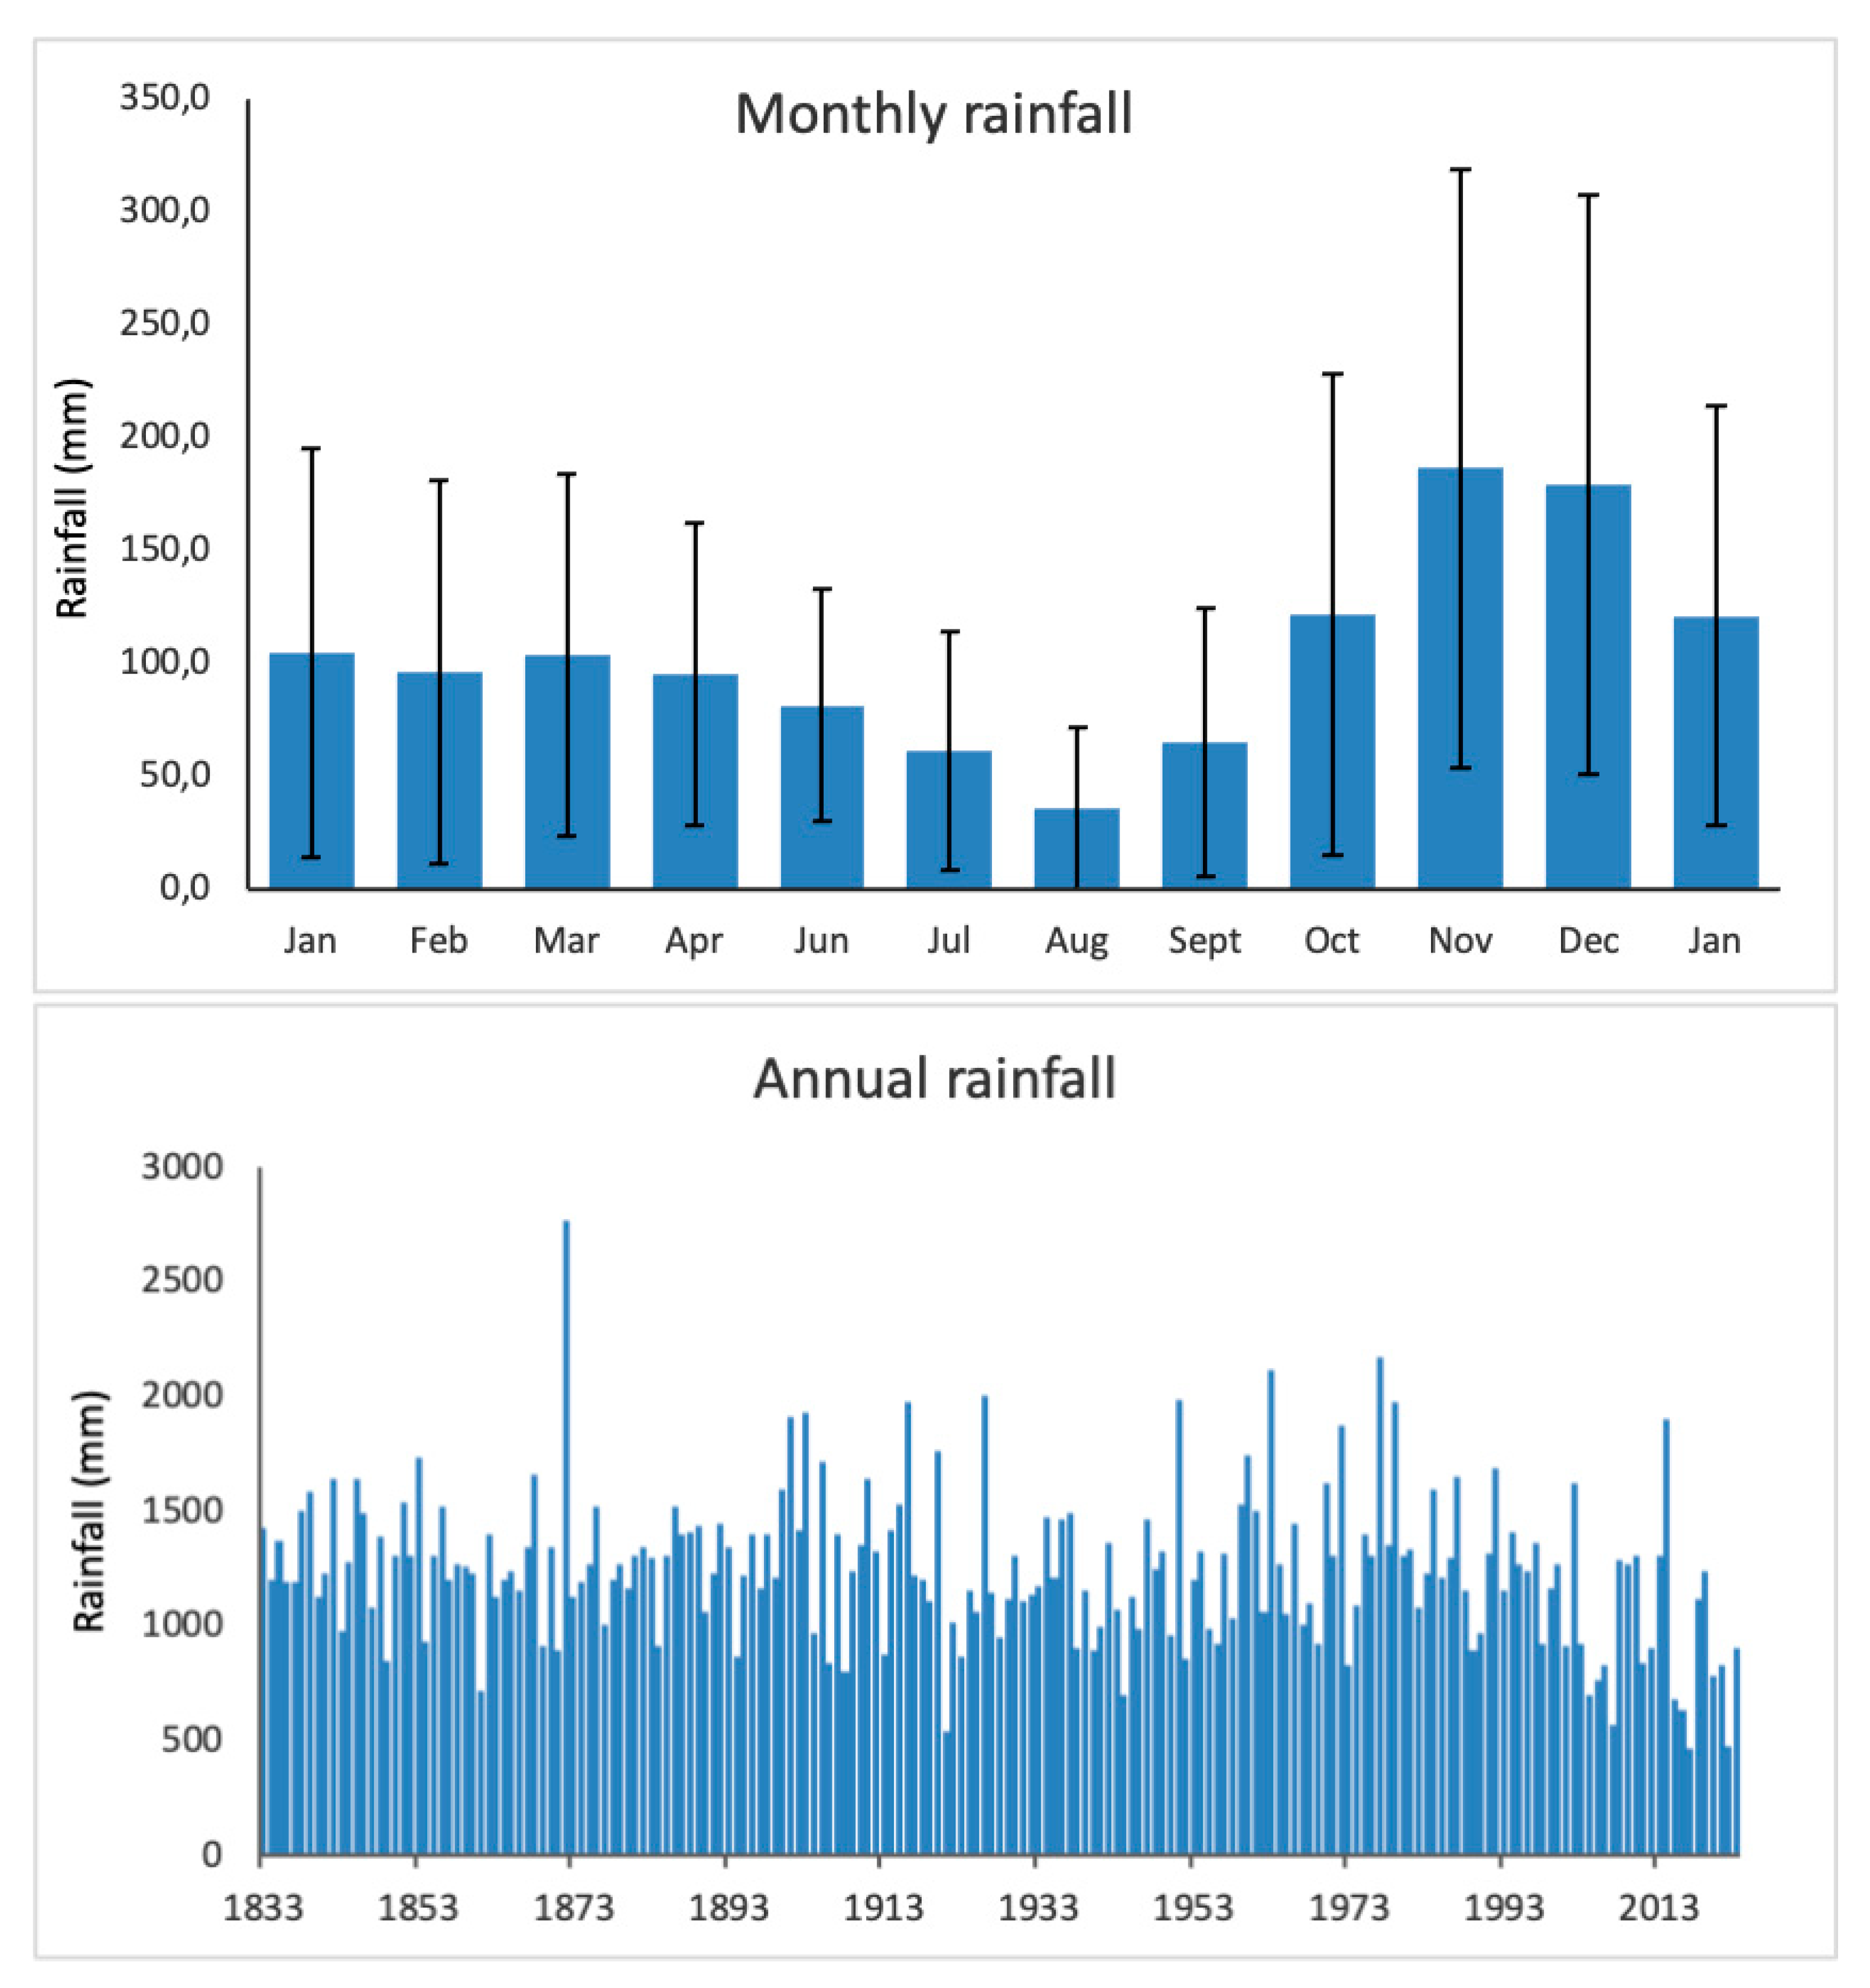
Figure 4.
Lithological sketch map of the Municipality of Genoa area. 1 alluvial deposit; 2 coastal deposits; 3 Plio-Quaternary deposits; 4 Flysch rock masses; 5 Ophiolitic rocks; 6 Carbonate rocks; 7 Conglomerate; 8 Shales and schists; 9 quartzite and cherts; 10 ancient landslides.
Figure 4.
Lithological sketch map of the Municipality of Genoa area. 1 alluvial deposit; 2 coastal deposits; 3 Plio-Quaternary deposits; 4 Flysch rock masses; 5 Ophiolitic rocks; 6 Carbonate rocks; 7 Conglomerate; 8 Shales and schists; 9 quartzite and cherts; 10 ancient landslides.
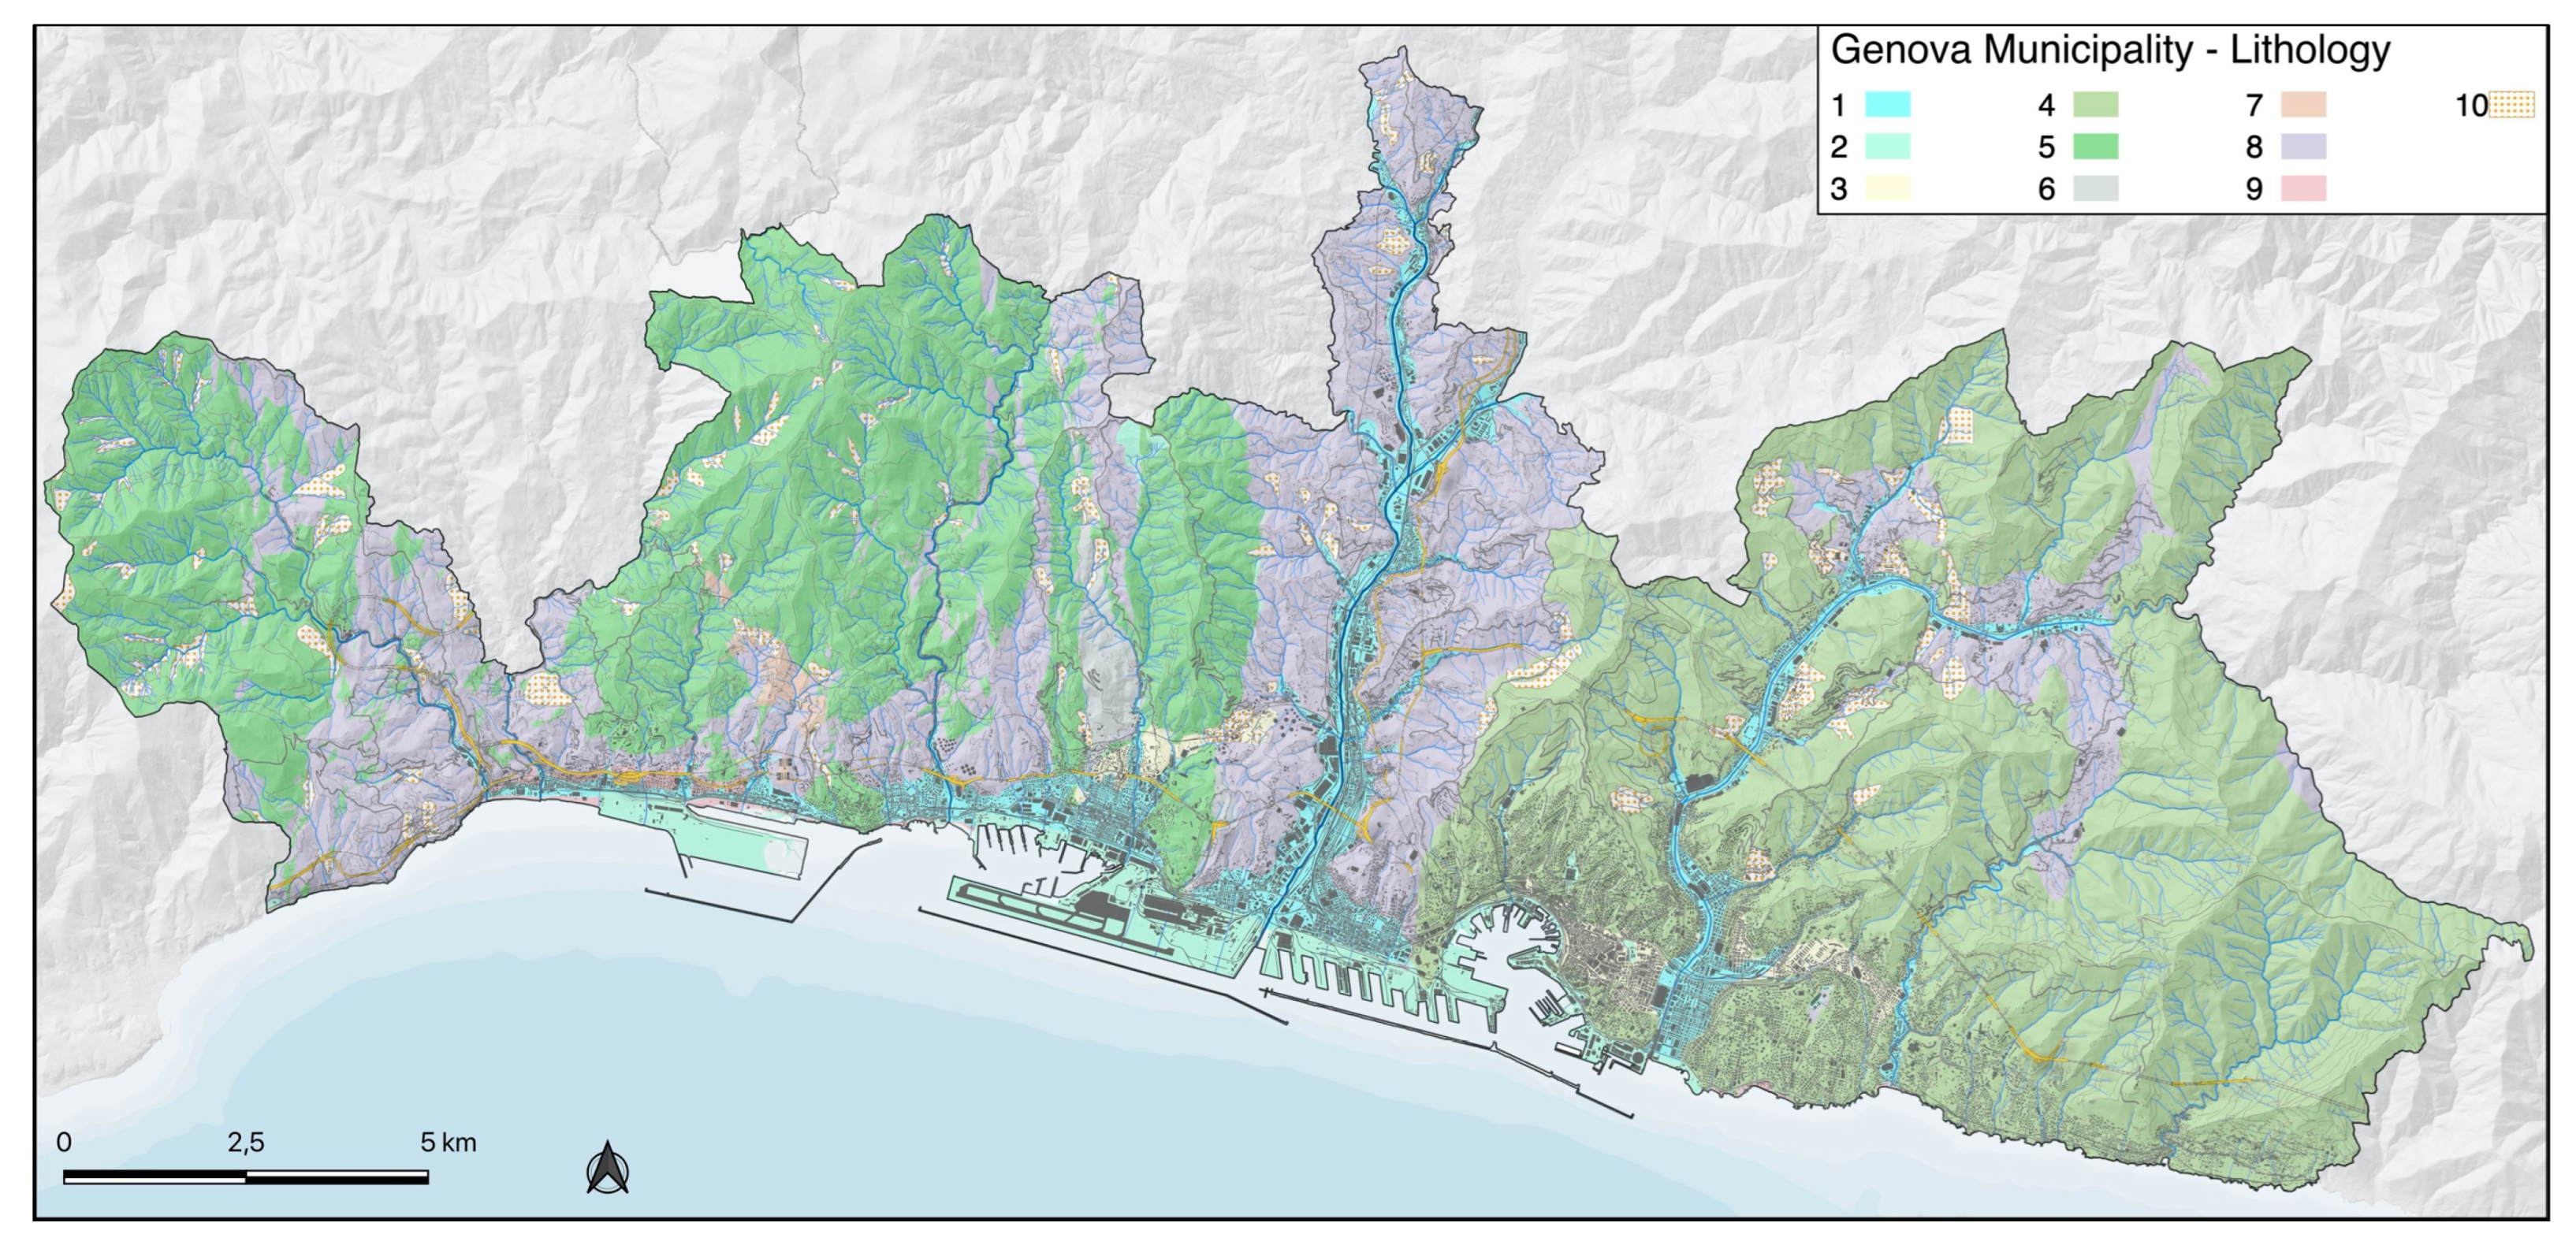
Figure 5.
Logical flow of the process of landslide susceptibility map evaluation: the database of 485 shallow landslides identified in the Municipality of Genoa area was randomly divided into two subsets corresponding to 80% and 20%, respectively, used to estimate the occurrence according to the seven causal factors and to calibrate the susceptibility evaluation model.
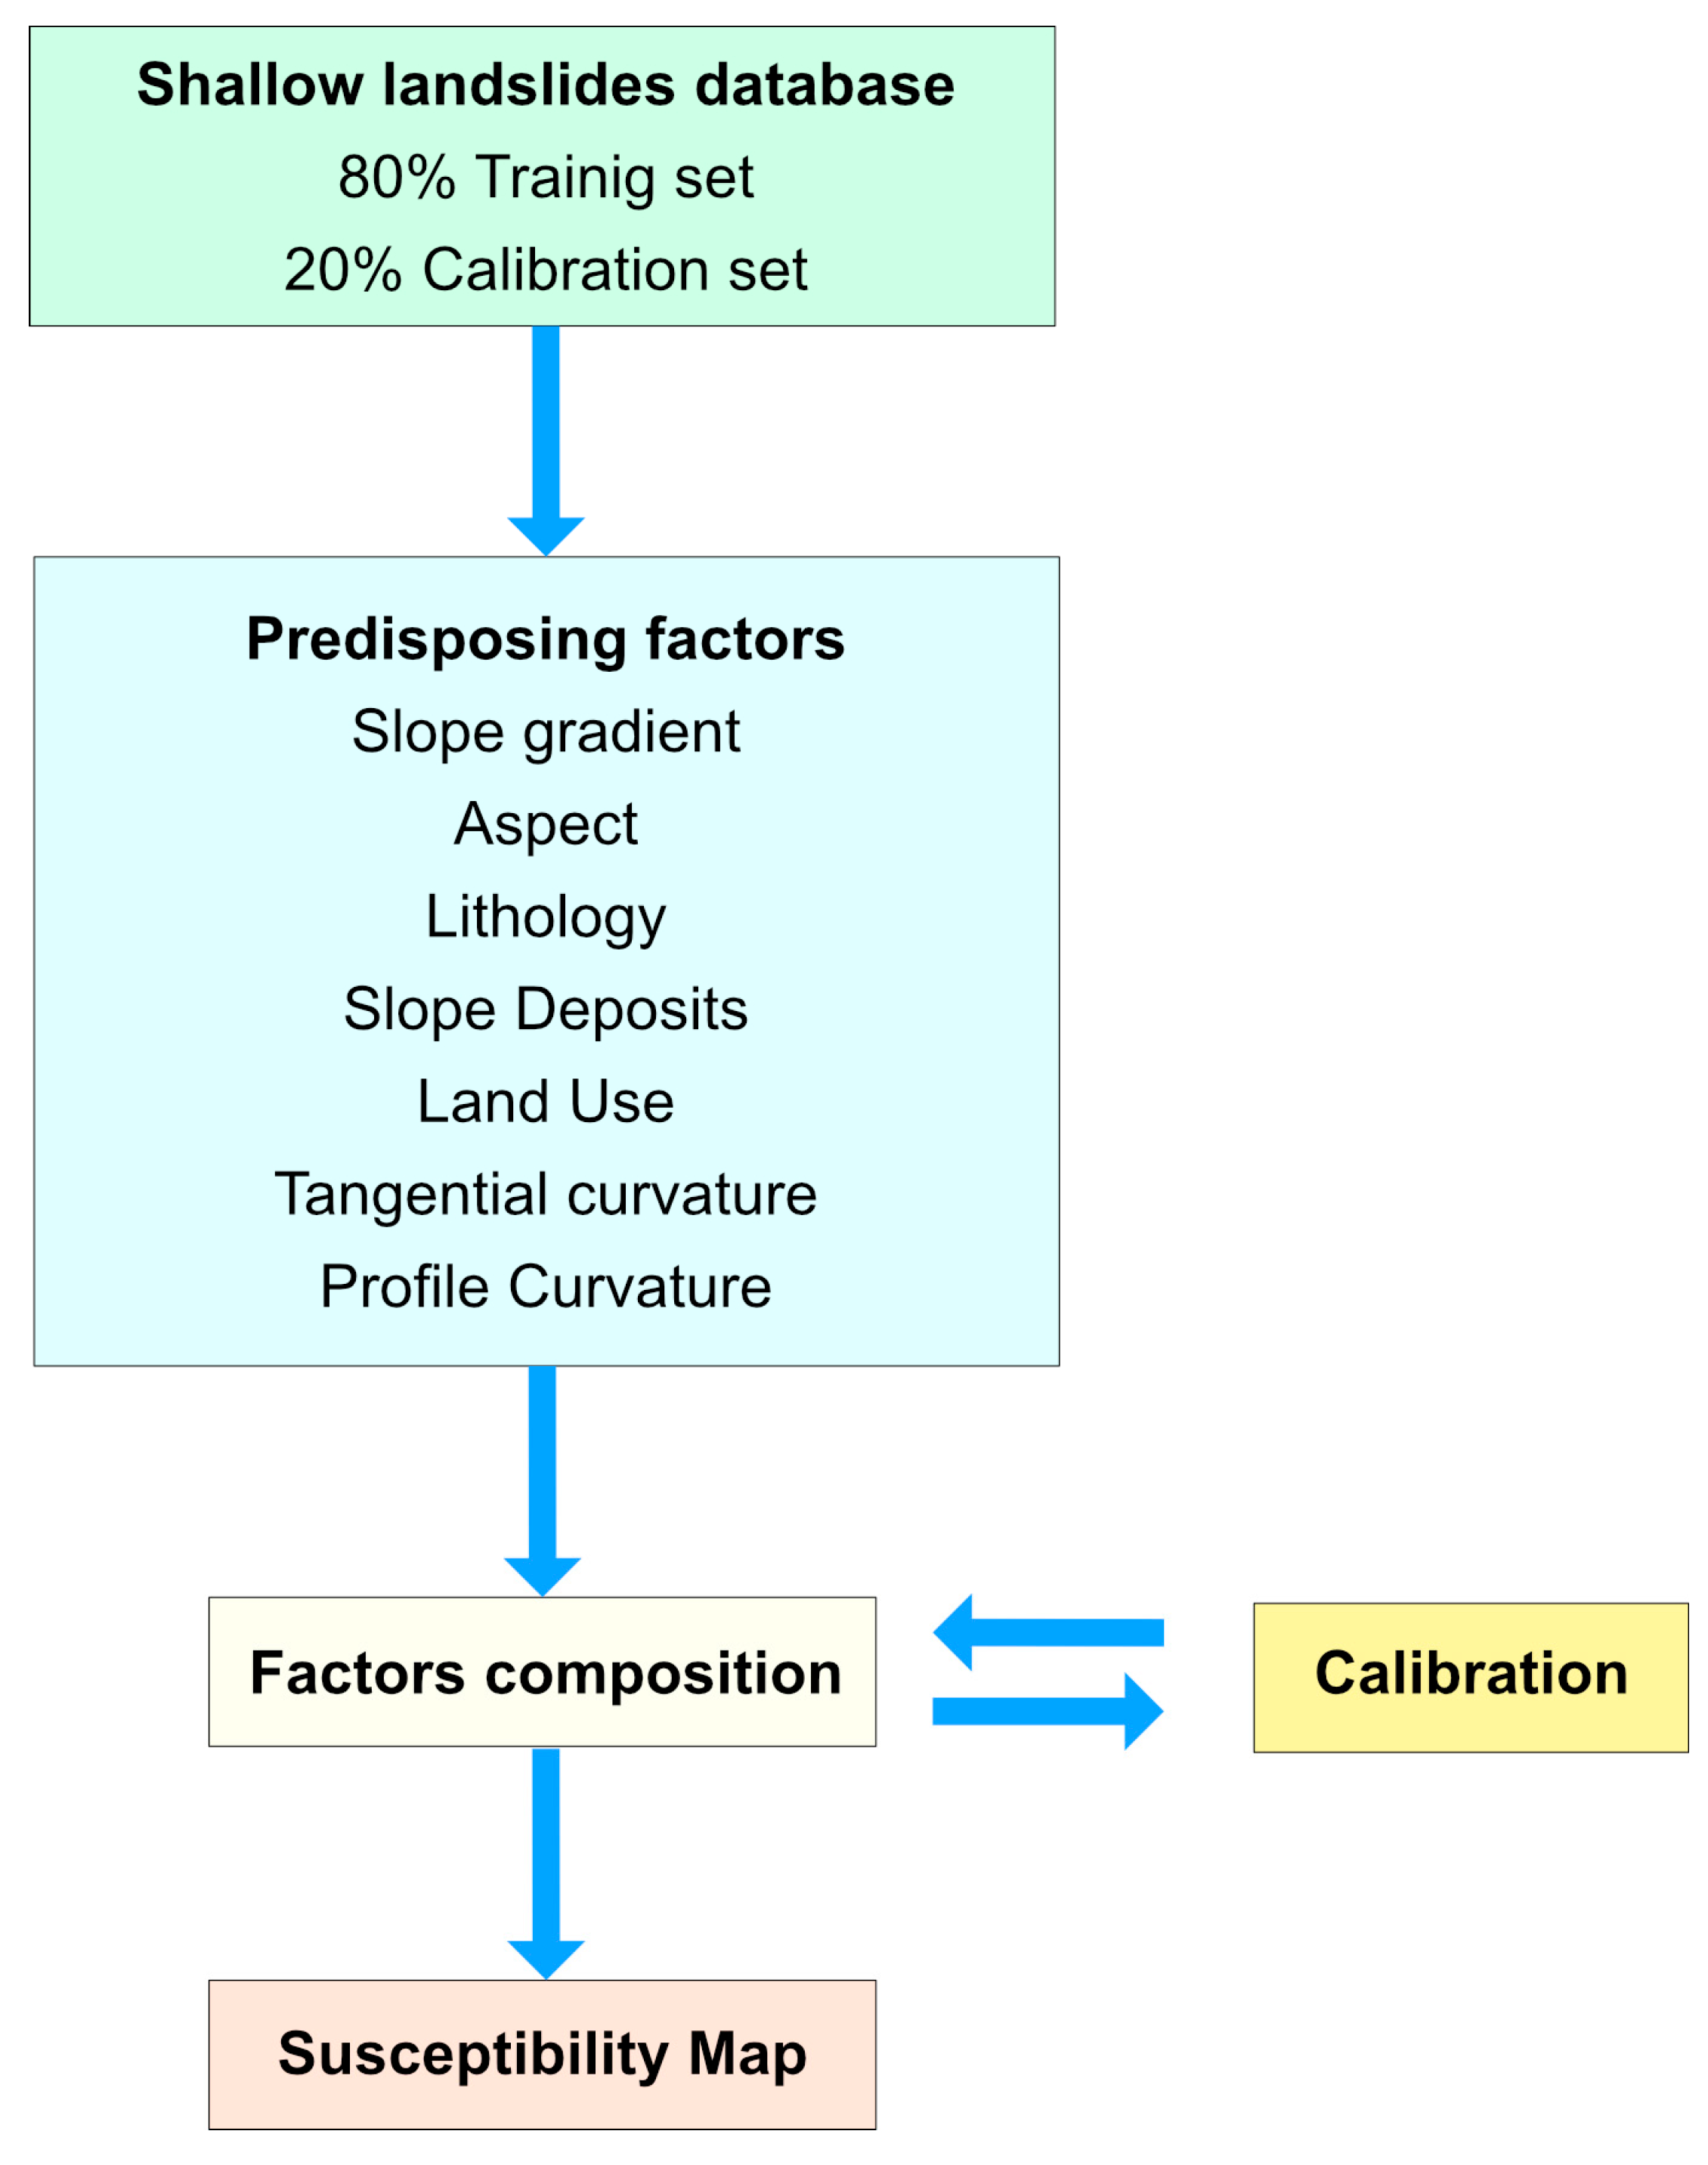
Figure 6.
Representation of the 485 surface landslides recorded in the municipal area, distributed by a random extraction process between a training set (80%) and a calibration set (20%).
Figure 6.
Representation of the 485 surface landslides recorded in the municipal area, distributed by a random extraction process between a training set (80%) and a calibration set (20%).
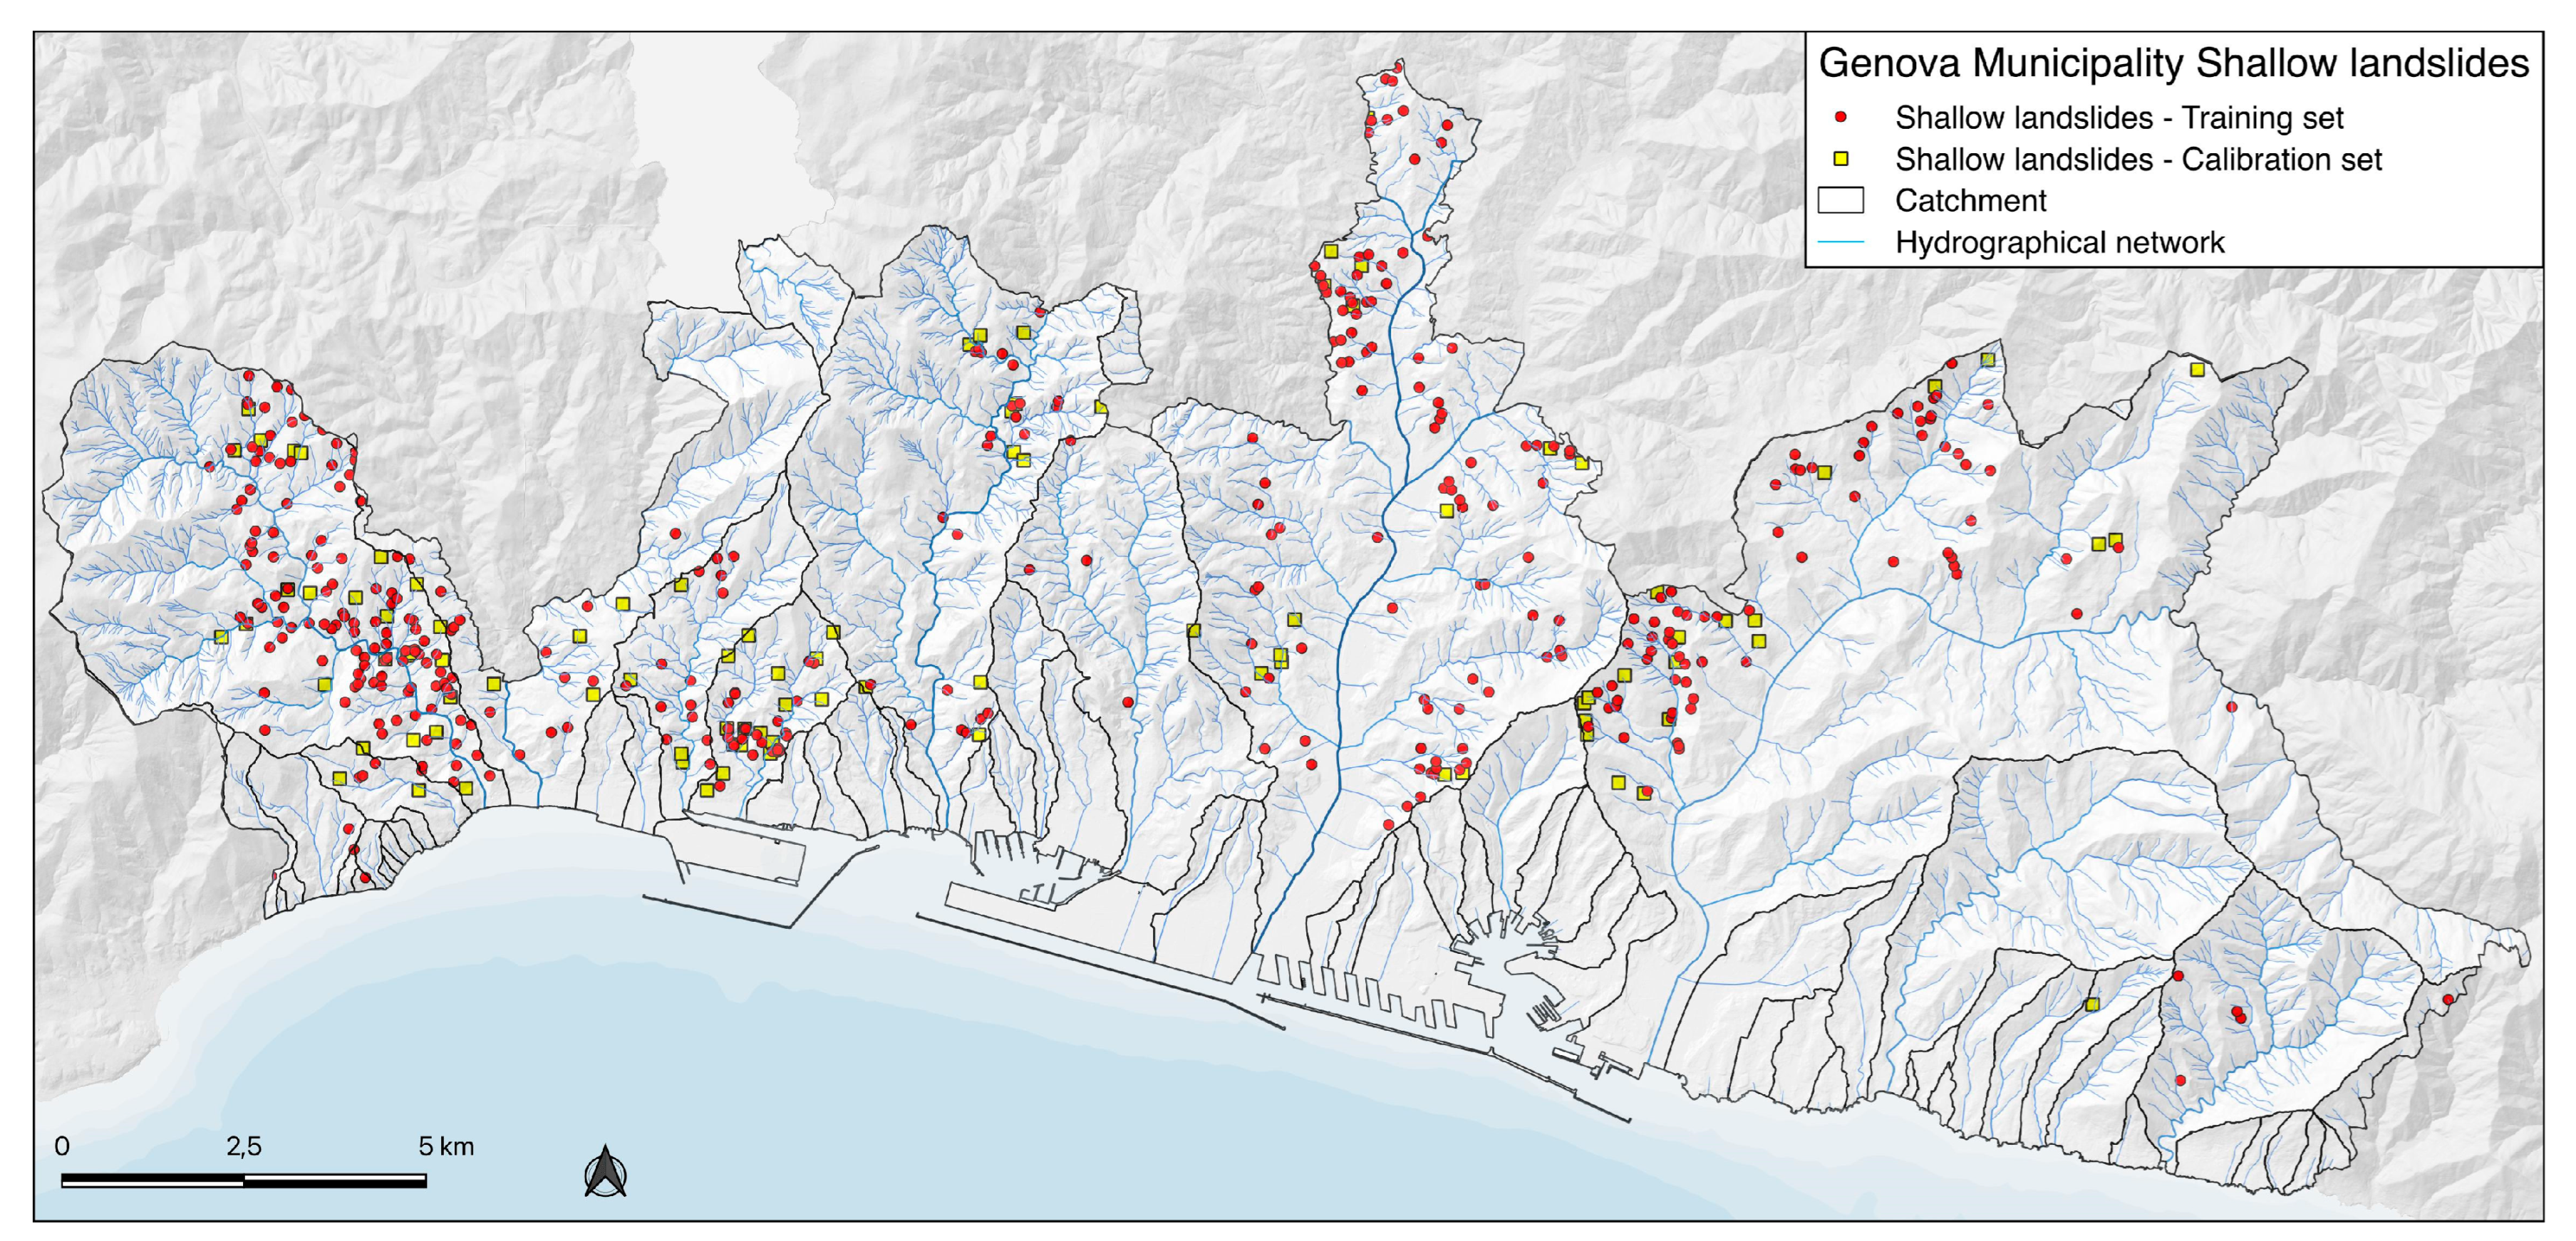
Figure 7.
Cartographic representation of causal factors used in the assessment of shallow landslide susceptibility: (A) slope gradient; (B) slope aspect; (C) lithotype; (D) slope and terrace deposits of estimated thickness greater than 1m; (E) tangential surface curvature; (F) profile surface curvature; (G) land-use.
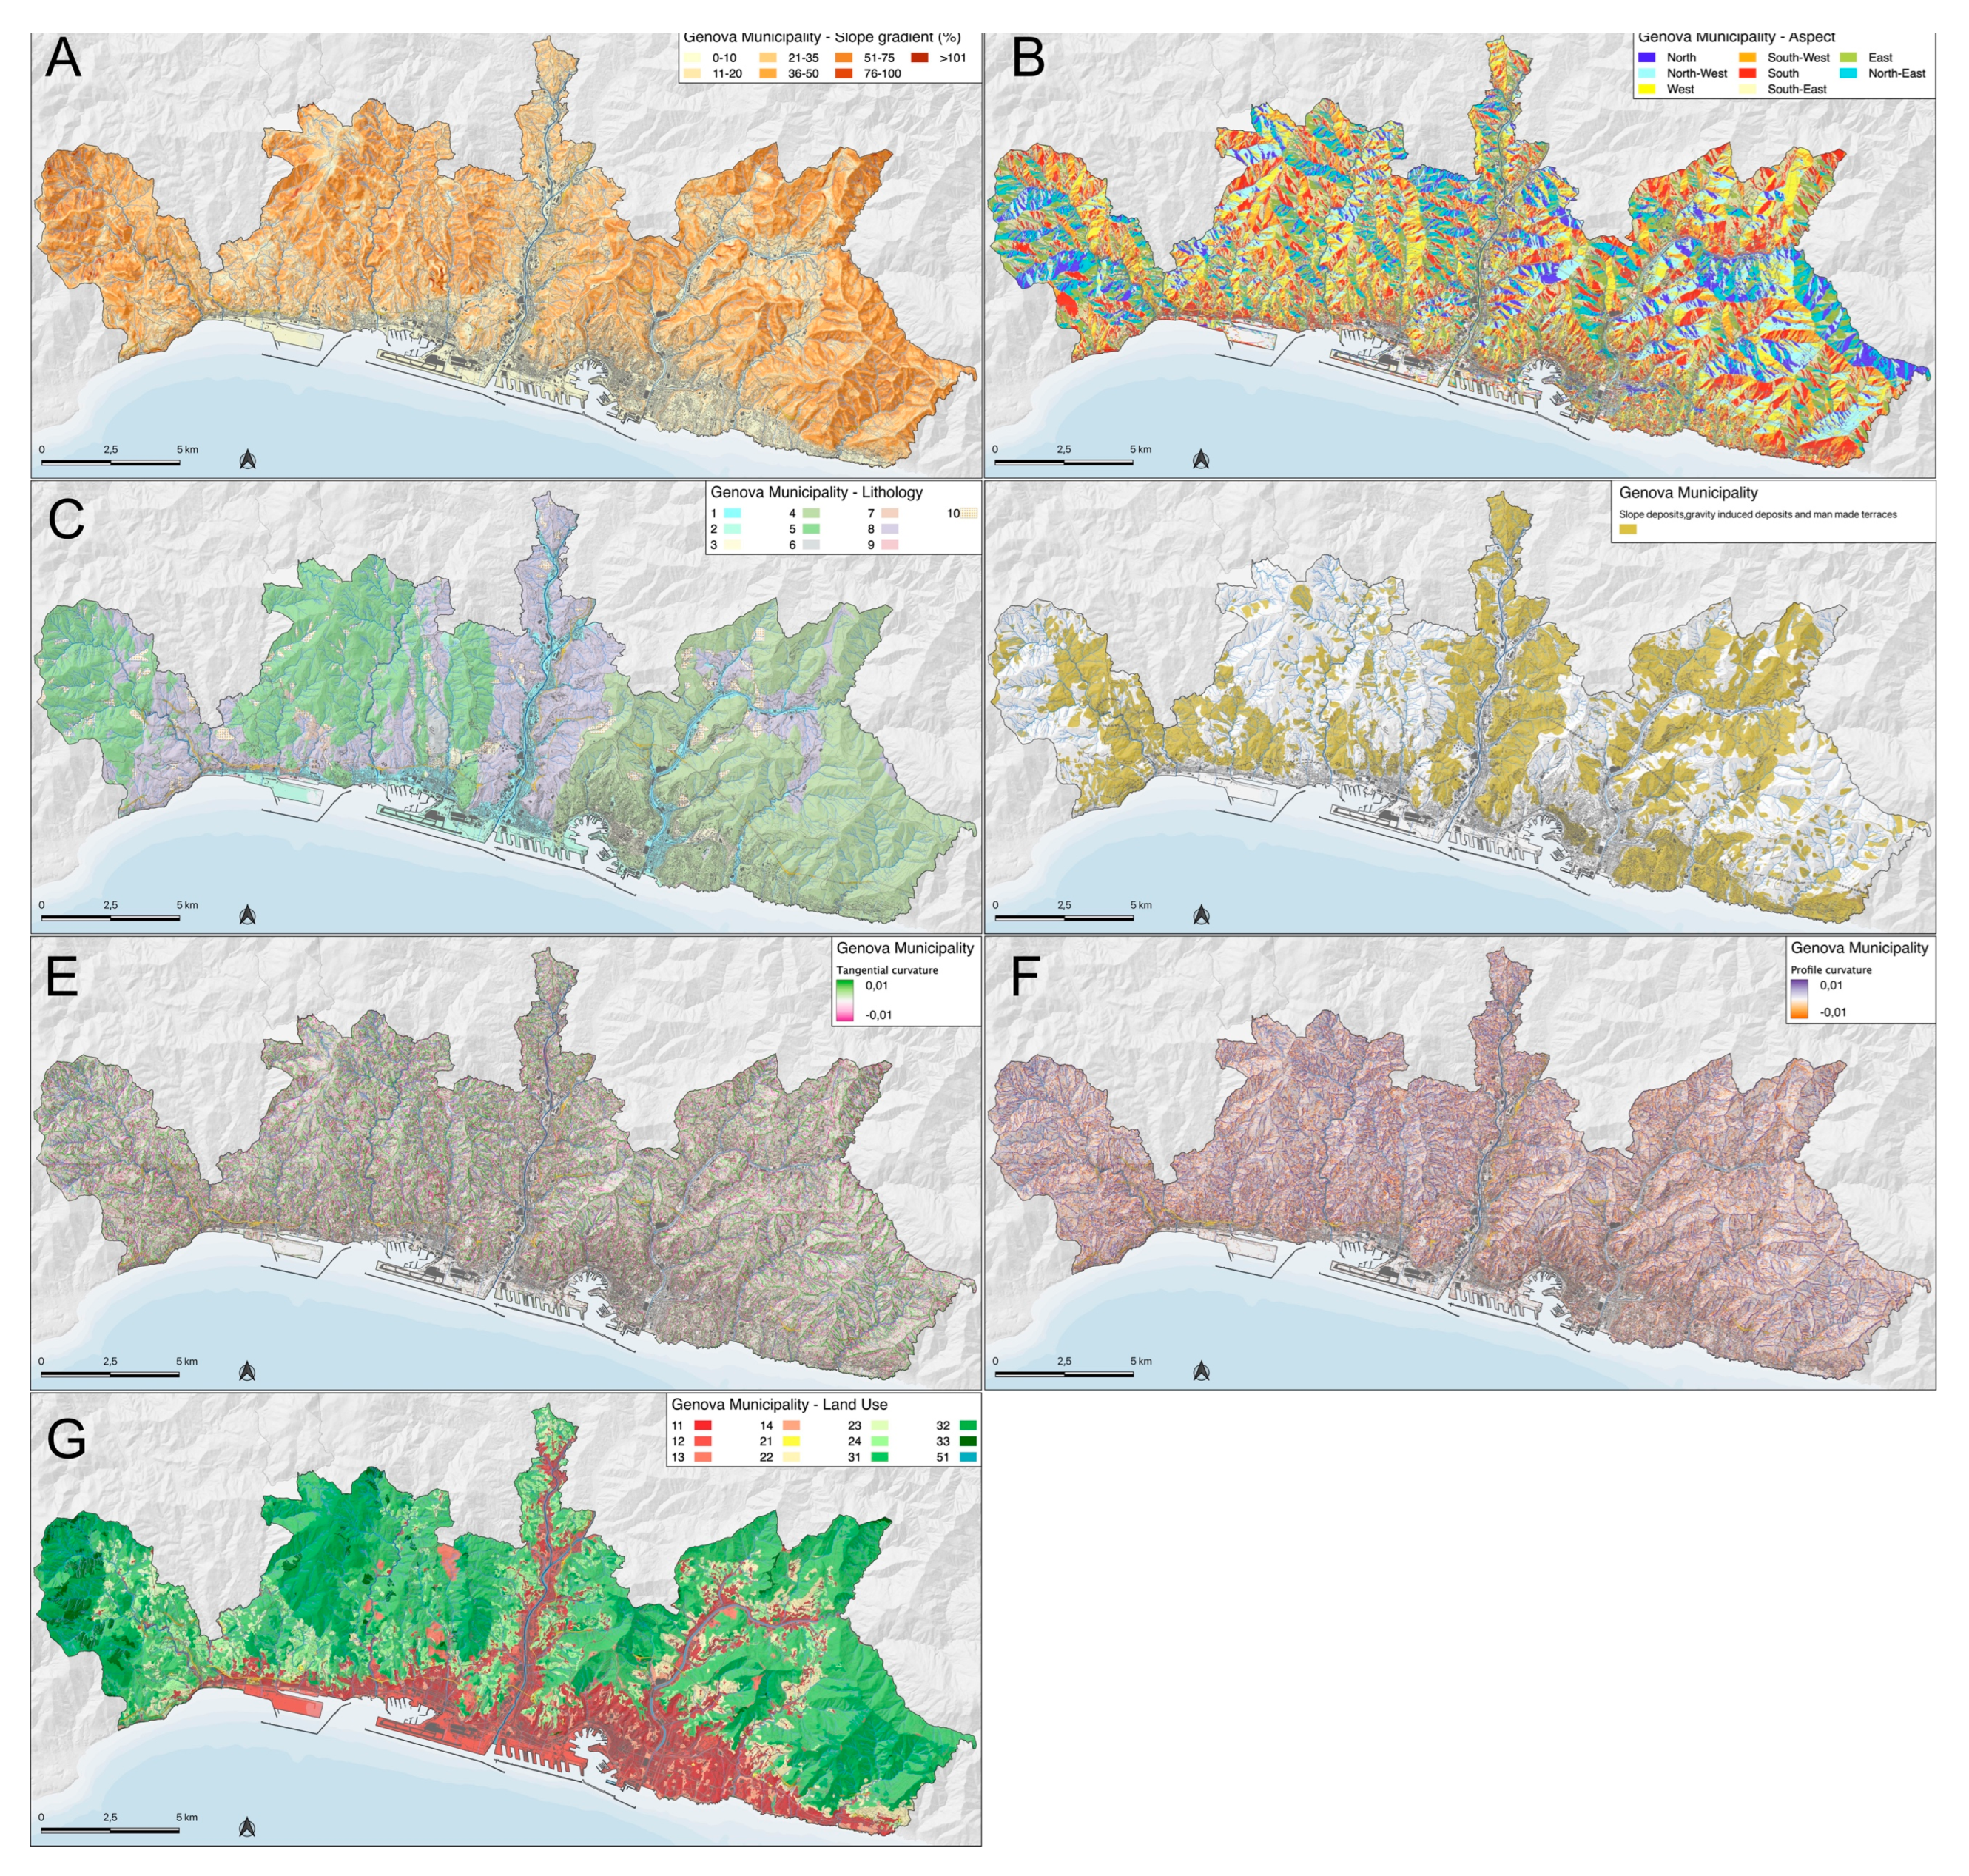
Figure 8.
The risk matrix, obtained by the combination of the 5 hazard and 5 vulnerability classes.
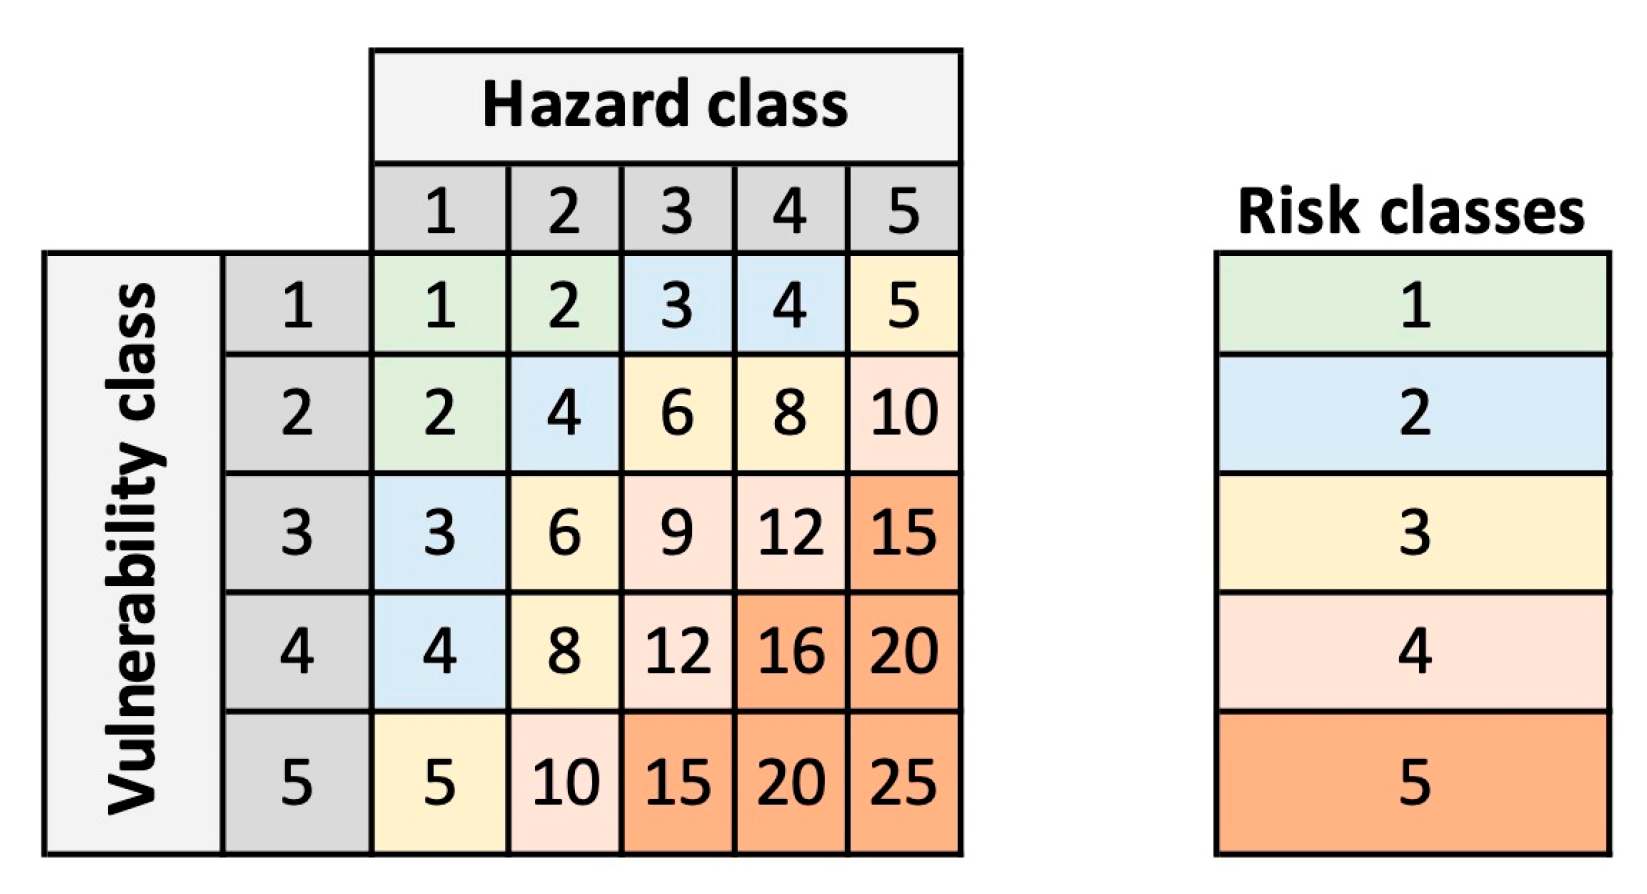
Figure 9.
Risk map for the gas (A) and water (B) distribution network, obtained considering the vulnerability as a unit and using the susceptibility map for hazard assessment. The networks are classified into sections corresponding to increasing risk classes 1 to 5. The suffix f denotes rockfall or collapse risk classes.
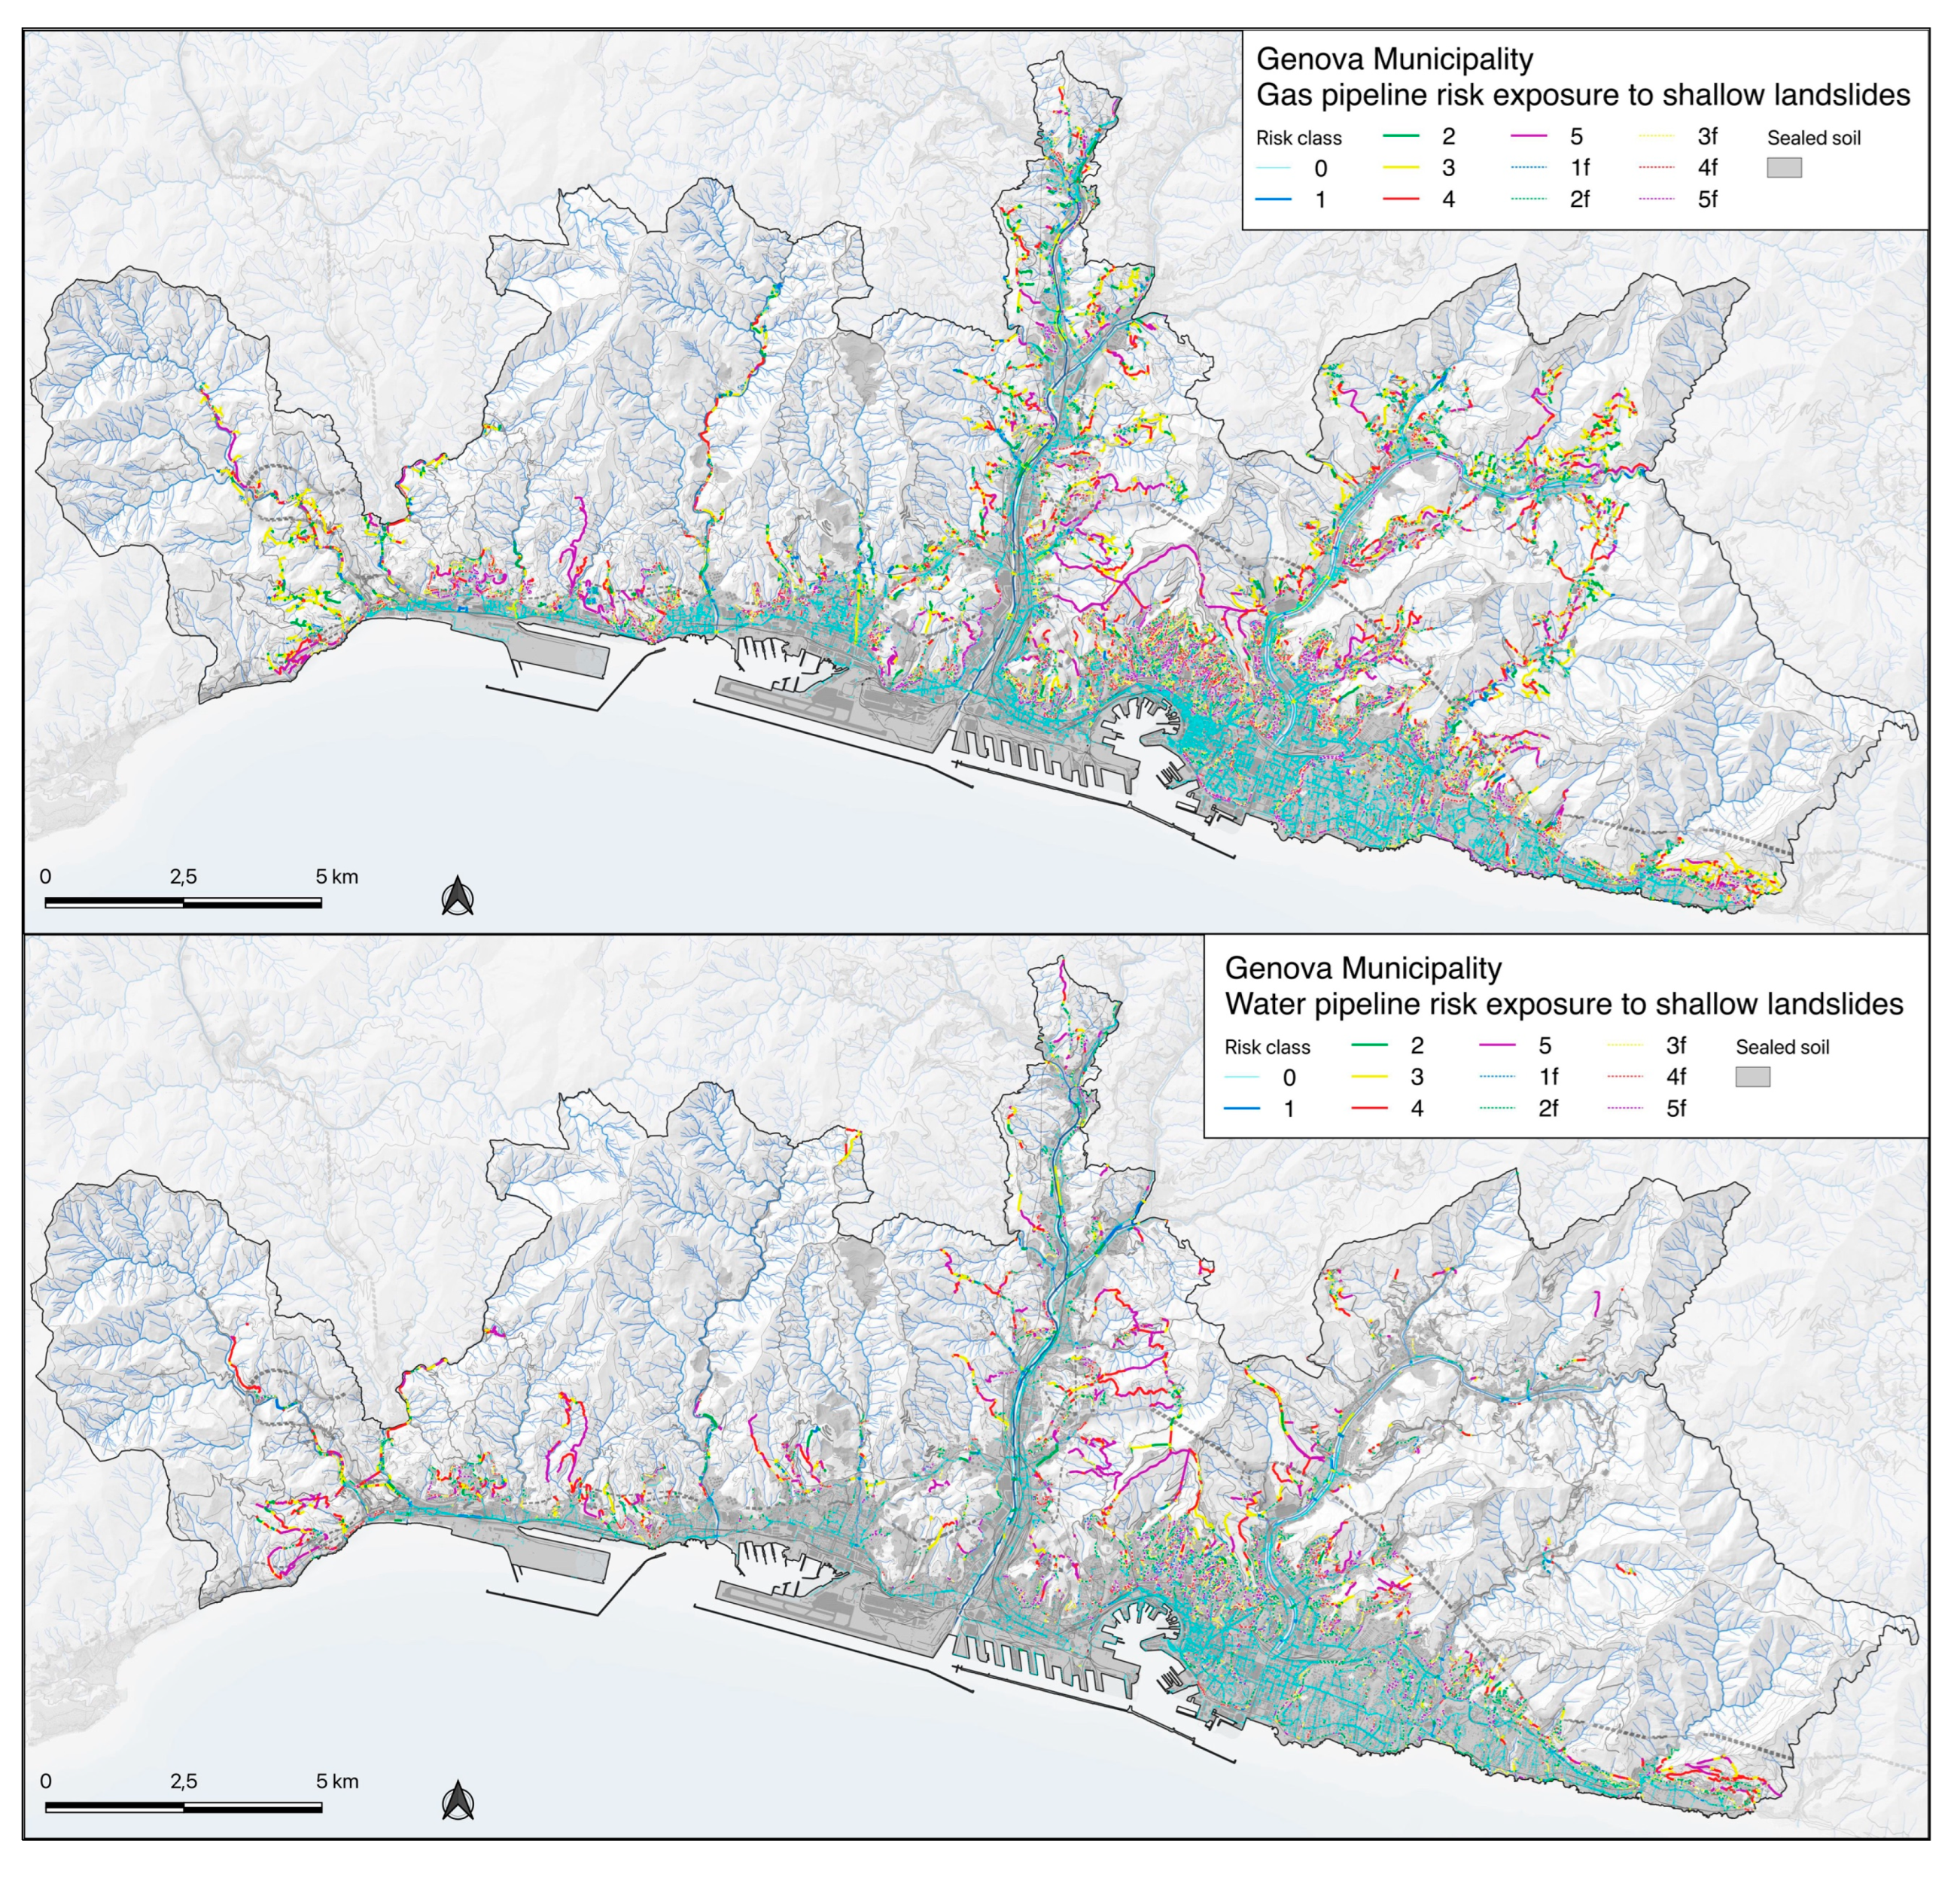
Figure 10.
Details of the risk assessment for the water and gas distribution network. The networks are subdivided into sections corresponding to increasing risk classes from 1 to 5 for both the shallow landslides risk and the rockfall or collapse one.
Figure 10.
Details of the risk assessment for the water and gas distribution network. The networks are subdivided into sections corresponding to increasing risk classes from 1 to 5 for both the shallow landslides risk and the rockfall or collapse one.
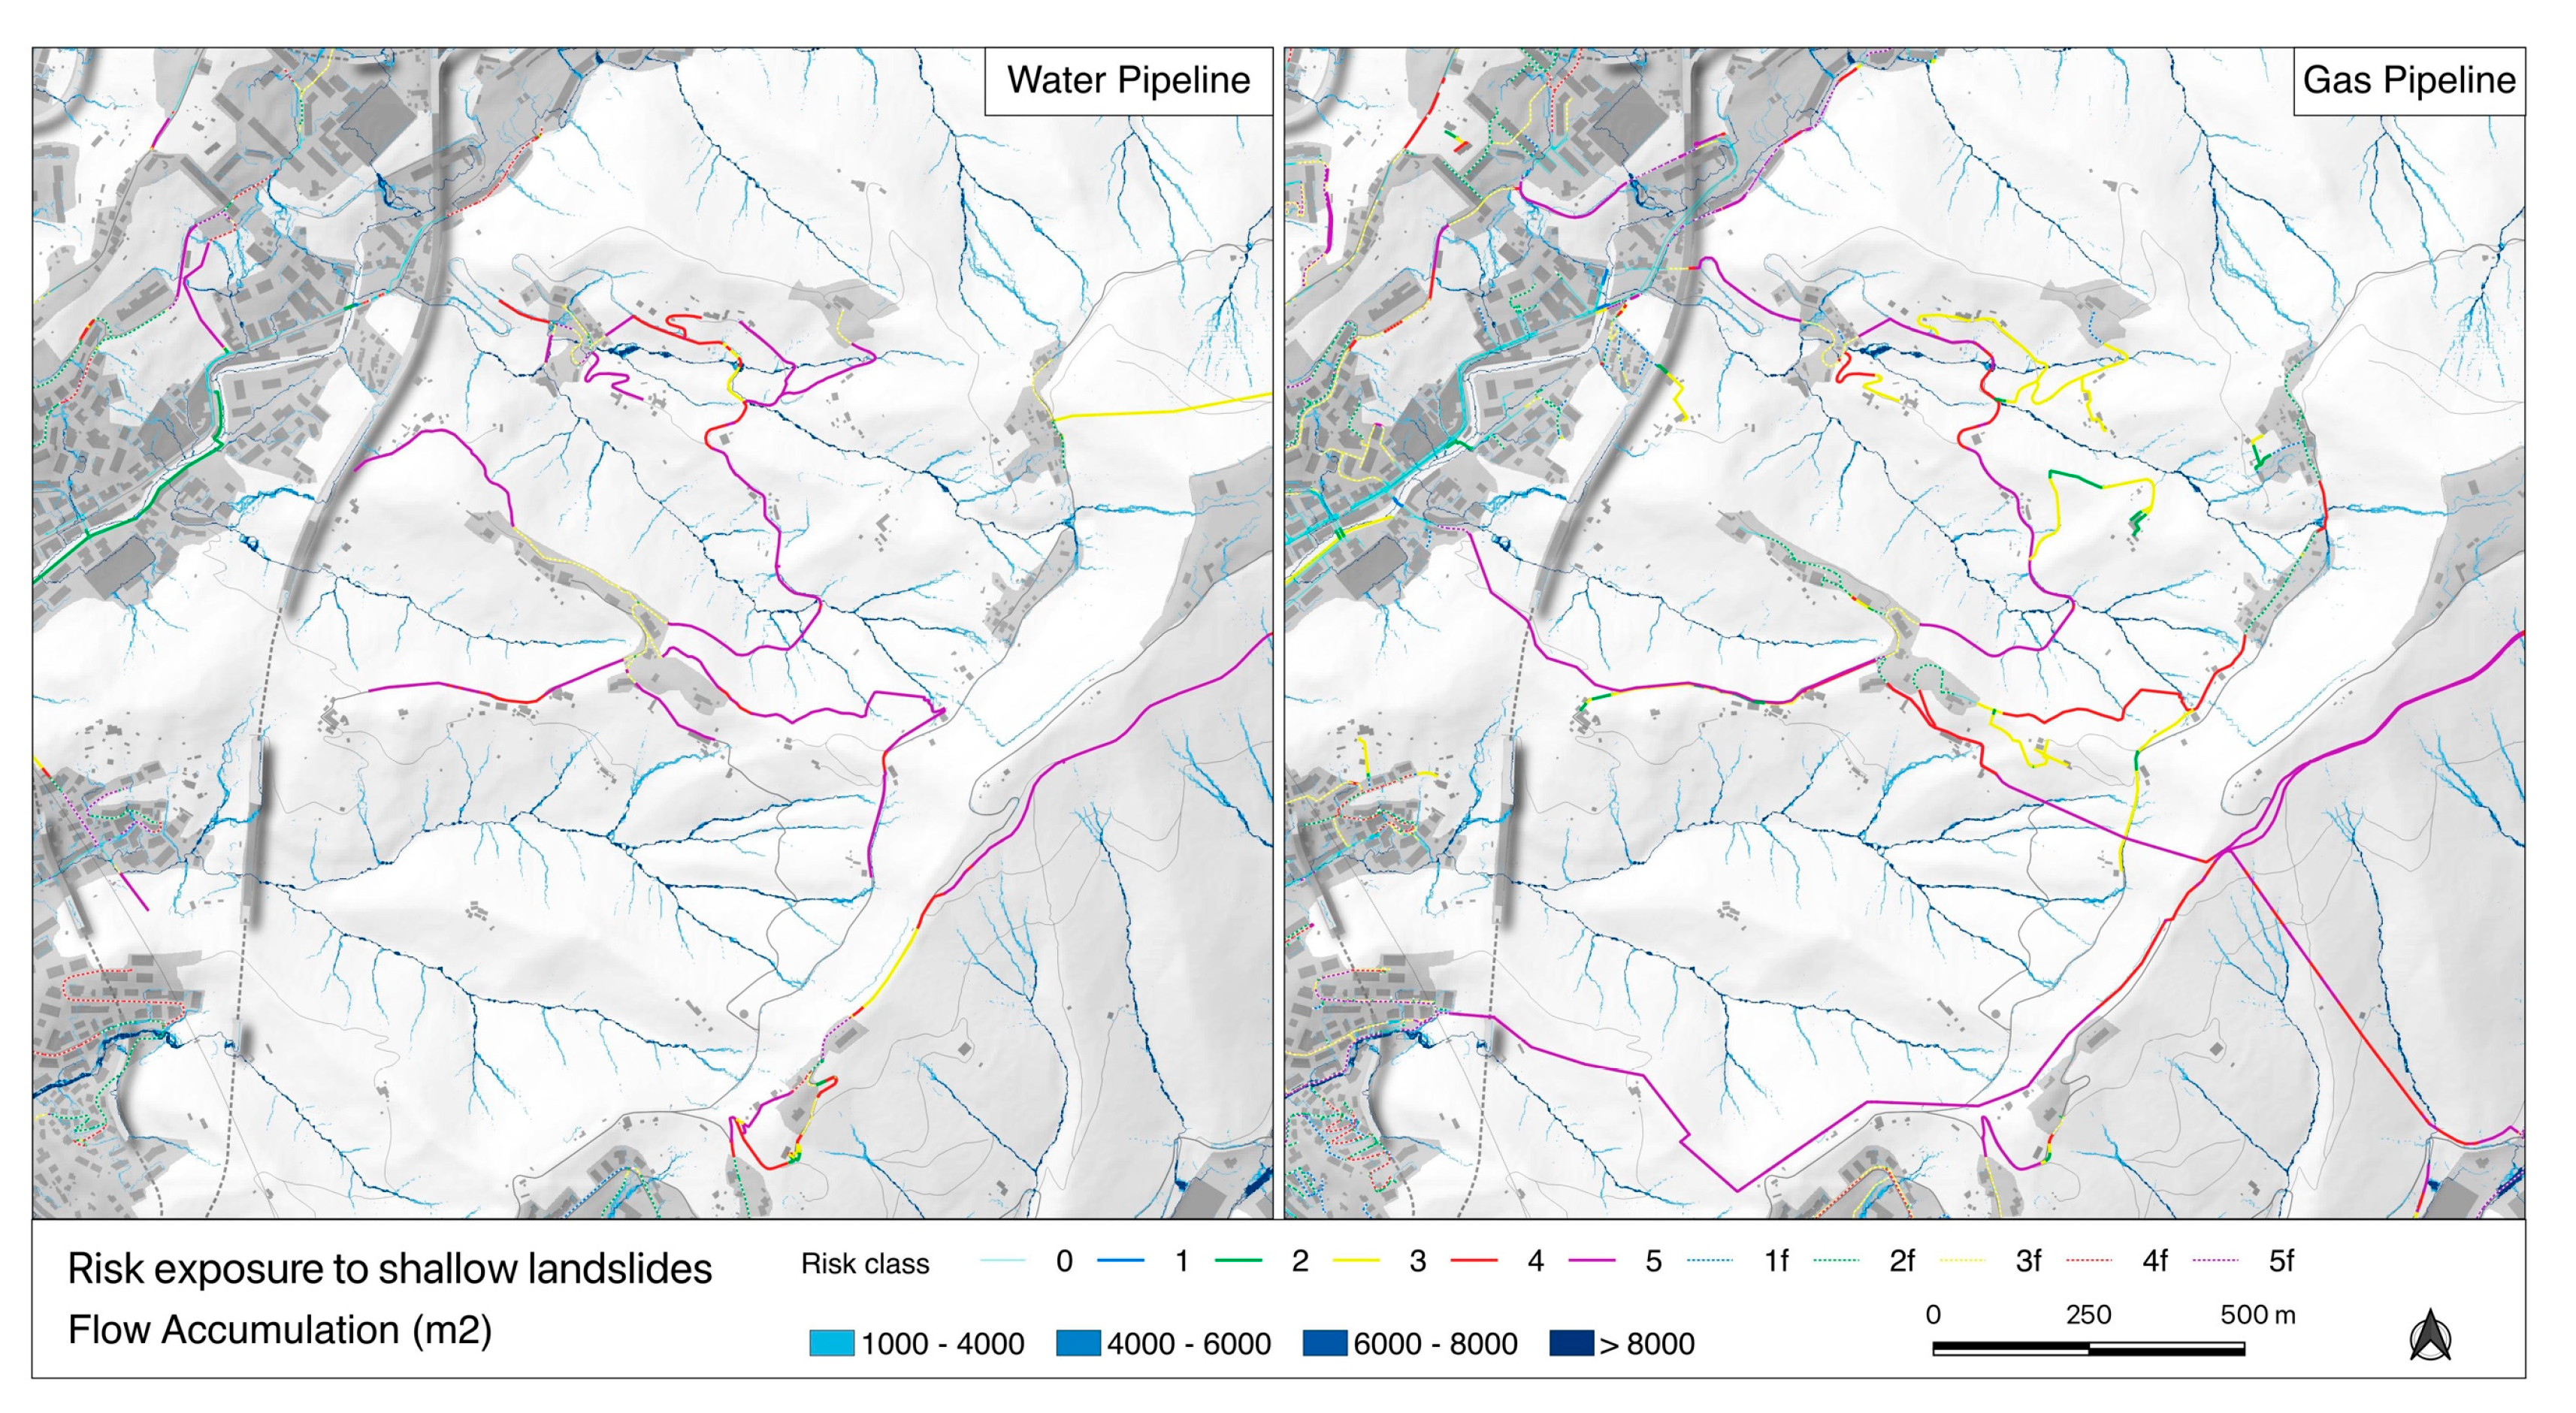
Figure 11.
Distribution of the gas and water networks according to the different risk classes.
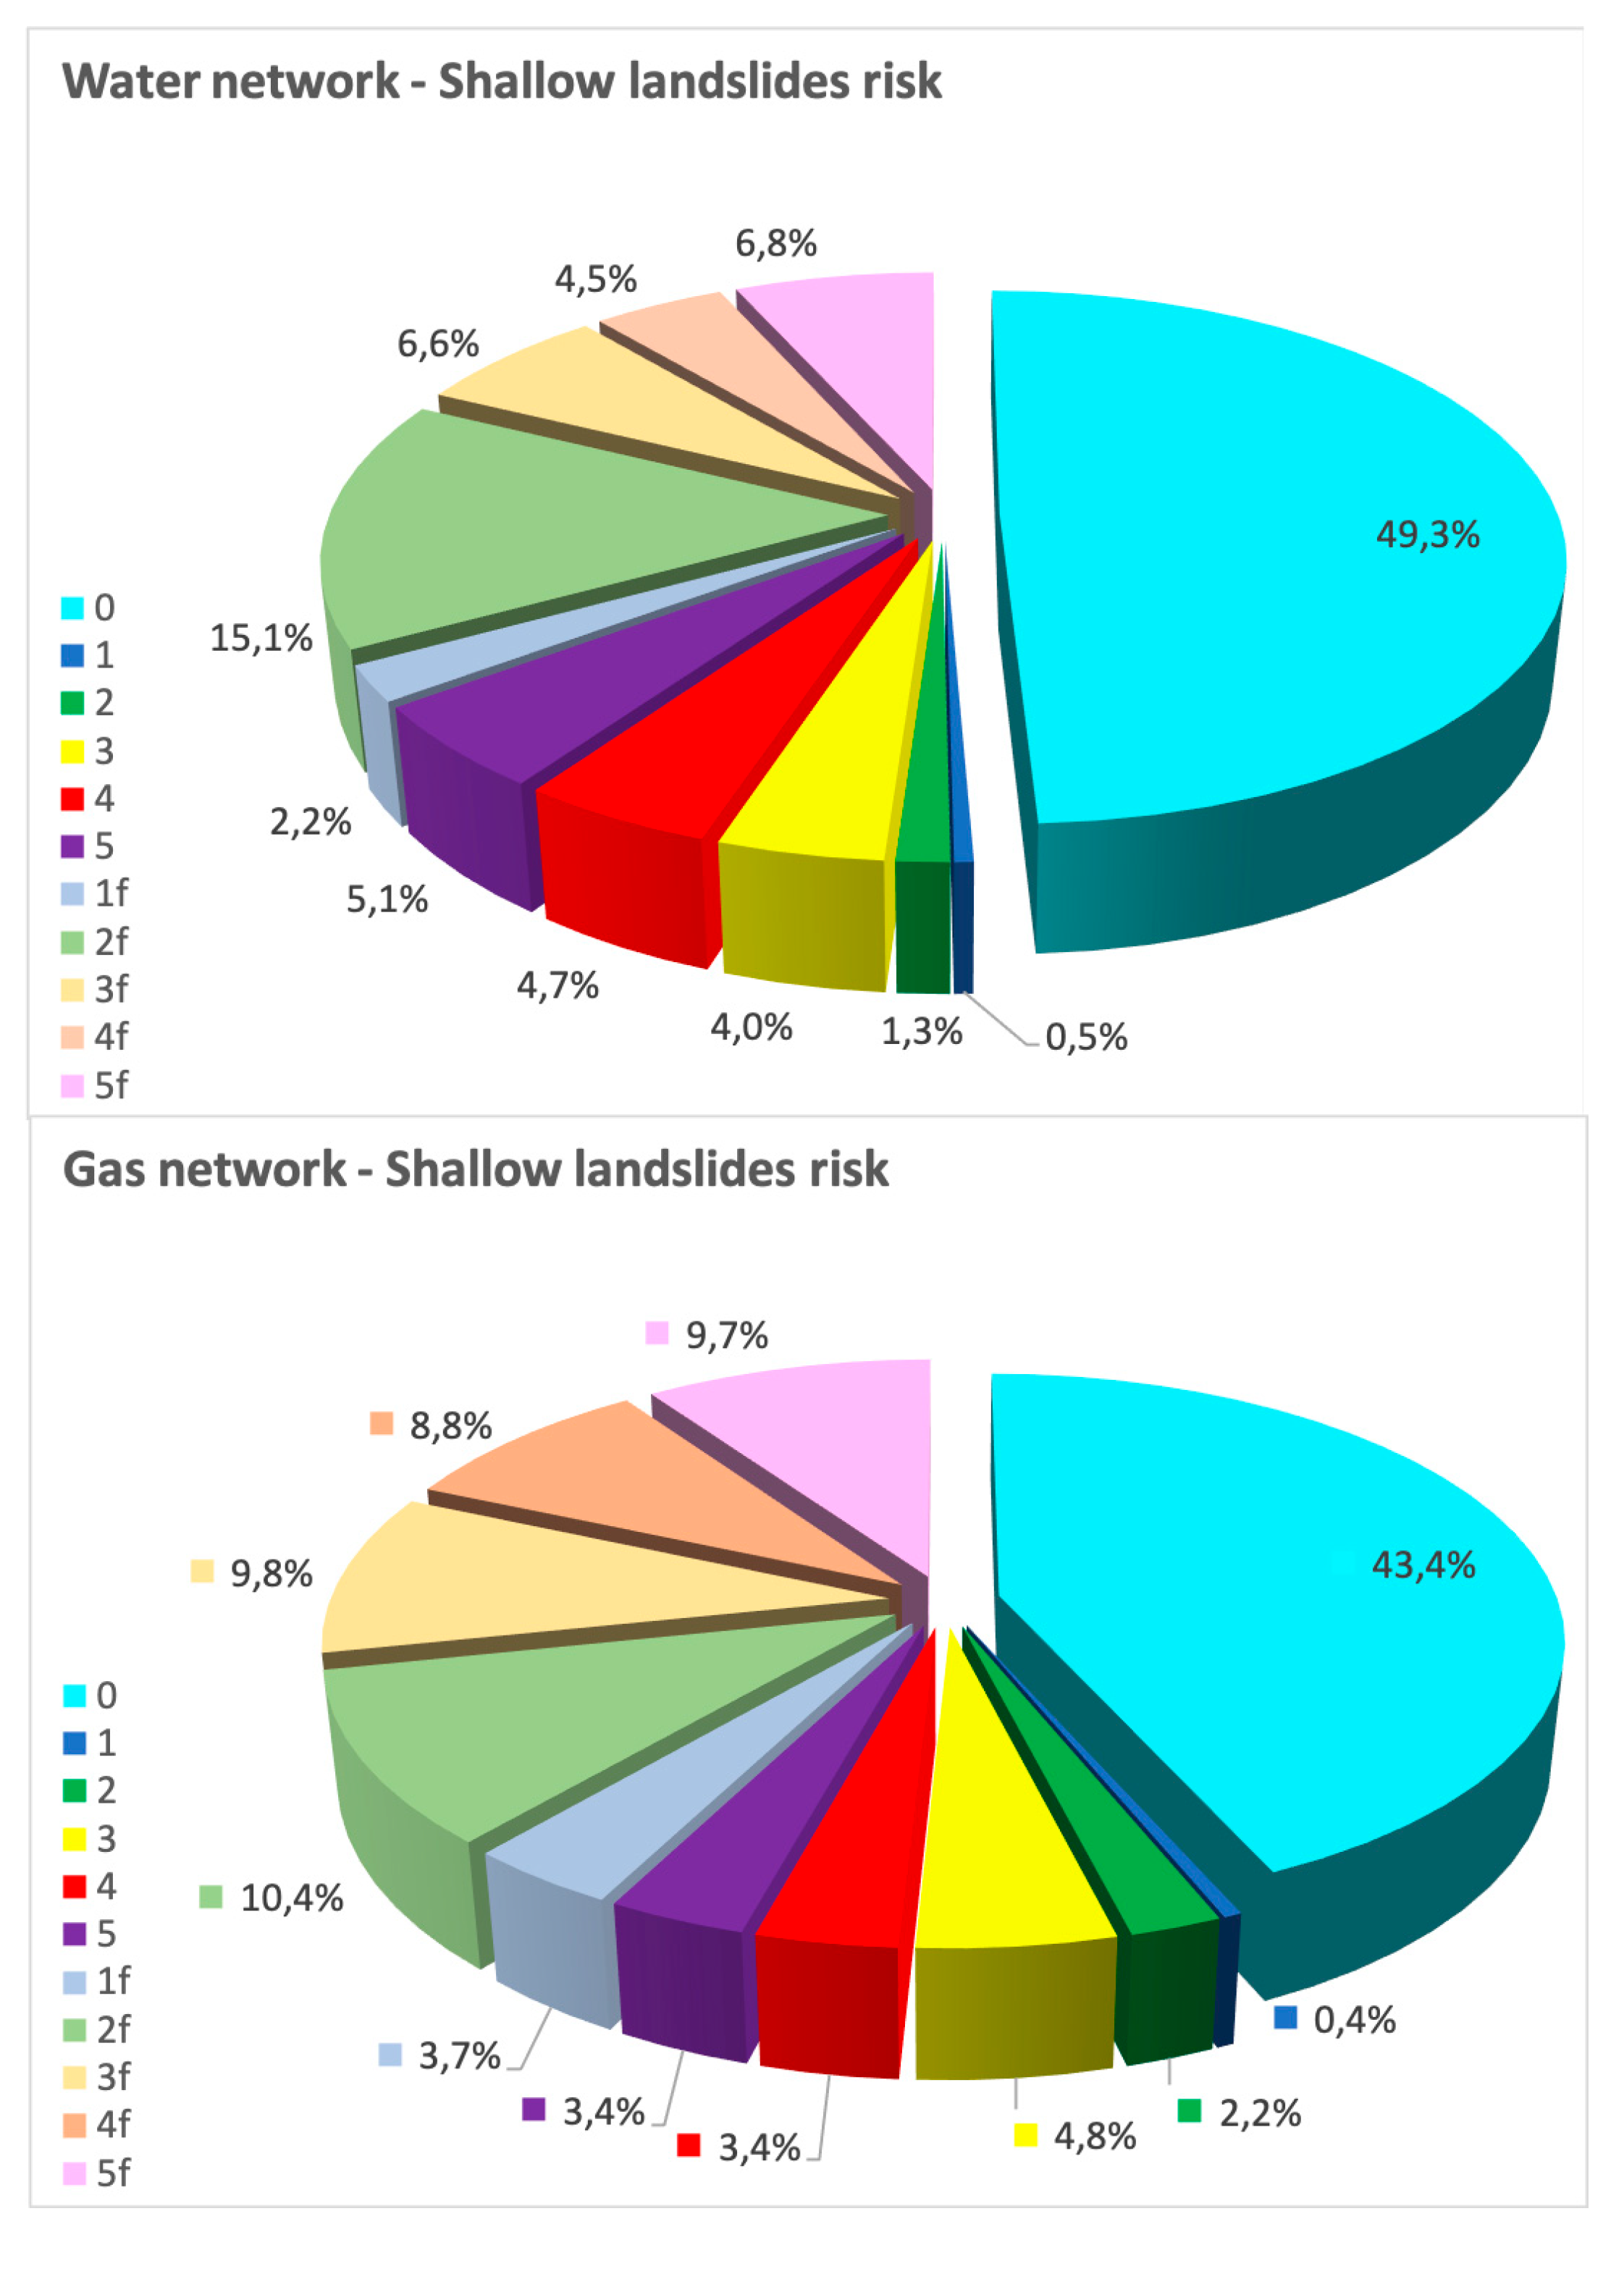
Figure 12.
annual rainfall cumulative amounts for FIO. PCA and CRO rain gauge stations.
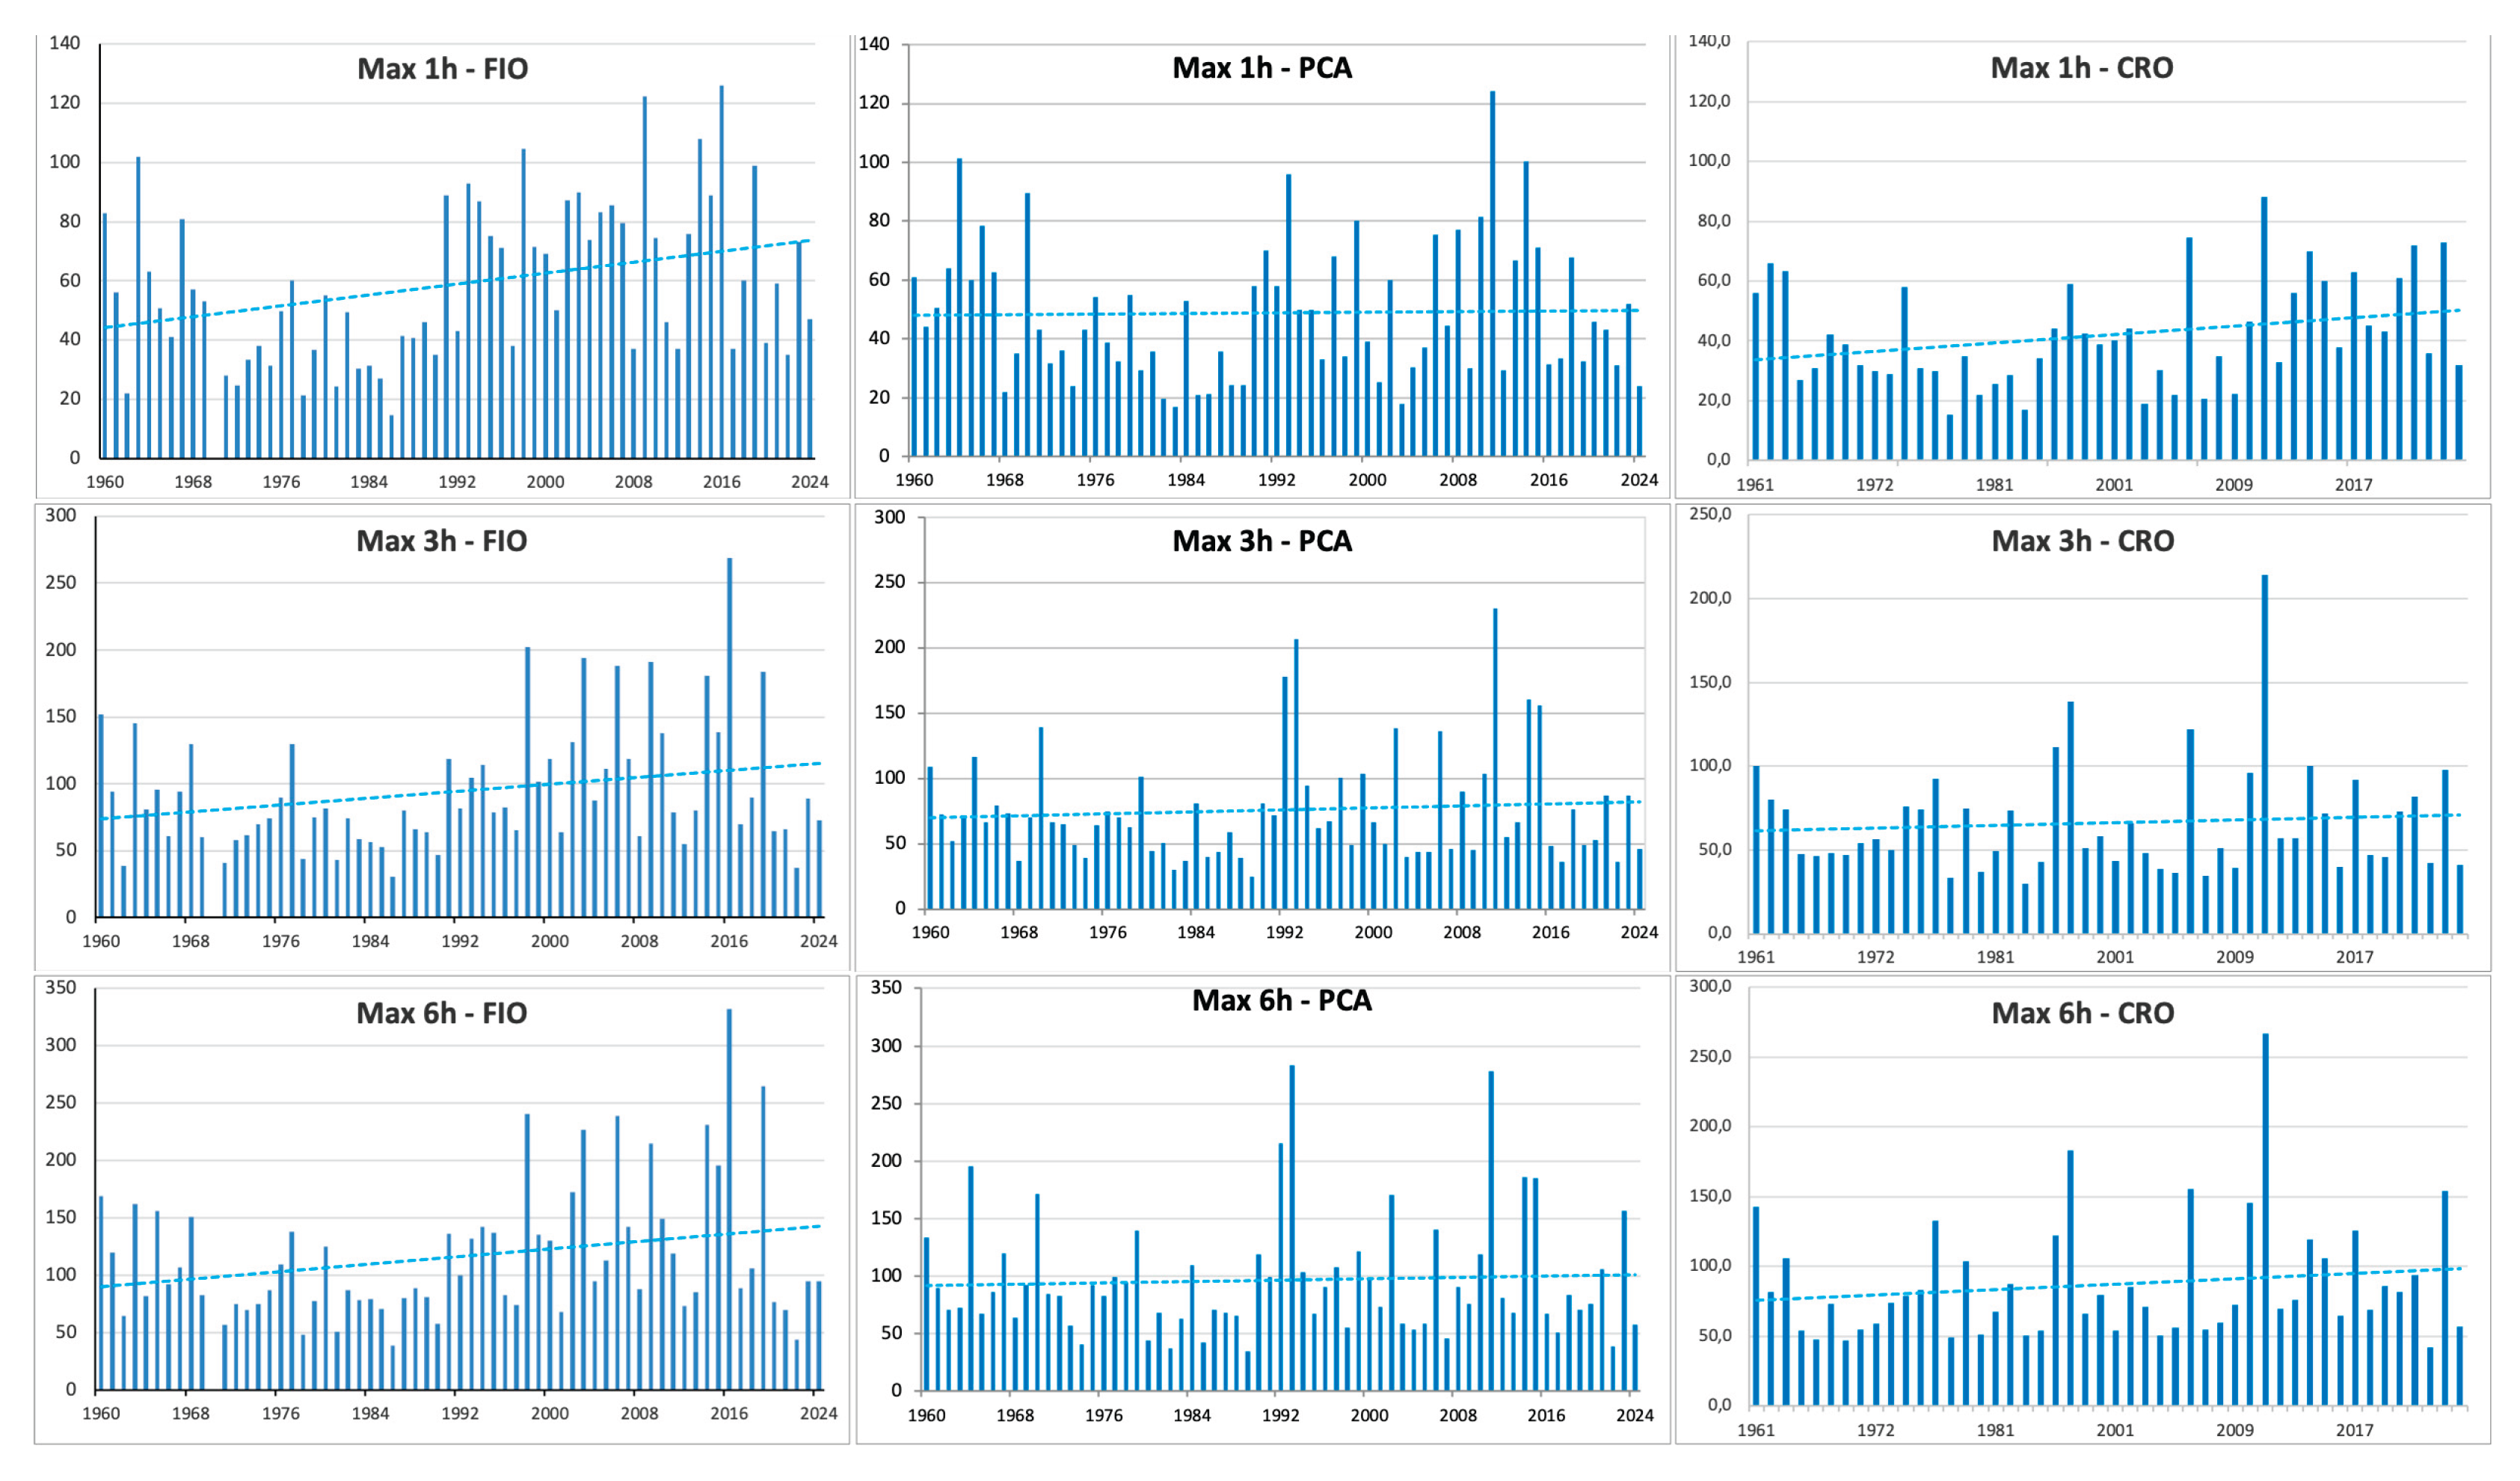

Table 1.
Rainfall events triggering geo-hydrological phenomena with ground effects occurred in the City of Genoa in the 1920-present day period, organized in decades (database AVI project available at https://sici.irpi.cnr.it/storici.htm). For each year, the number in round brackets represents the number of rainfalls events that triggering geo-hydrological phenomena.
| Period | Date, Number of Events |
|---|---|
| 1920-1929 | 1920(1), 1923(1), 1926(1), 1927(5), 1929(5) |
| 1930-1939 | 1930(5), 1931(3), 1932(7), 1934(6), 1935(1), 1936(3), 1937(3), 1938 (4), 1939(4) |
| 1940-1949 | 1940(1), 1942(3), 1945(13), 1948(1), 1949(1) |
| 1950-1959 | 1951(32), 1952(1), 1953 (3), 1954(2), 1955(9), 1956(5), 1957(6), 1958(4), 1959(12) |
| 1960-1969 | 1960(5), 1961(4), 1962(2), 1963(12), 1964(7), 1965(4), 1966(13), 1967(8), 1968 (9), 1969(5) |
| 1970-1979 | 1970 (22), 1971(2), 1972(3), 1976(3), 1977(19), 1978(1), 1979(1) |
| 1980-1989 | 1980(1), 1981(1), 1982(2), 1983(1), 1984(4), 1985(7), 1987(2), 1989(3) |
| 1990-1999 | 1990(2), 1991(13), 1992 (19), 1993(23), 1994(21), 1995(18), 1996(8), 1997(28), 1998(17), 1999(4) |
| 2000-2009 | 2000 (9), 2002 (9), 2003(2), 2005(2), 2006(6), 2007(3), 2008(3), 2009(2) |
| 2010-2019 | 2010 (12), 2011 (10), 2012(1), 2014 (24), 2016(2), 2018(2), 2019 (4) |
| 2020-2024 | 2020 (2), 2021(1), 2022 (3), 2023 (3) |
Table 2.
list of data, in raster and vector formats, used in the assessment of shallow landslide susceptibility.
Table 2.
list of data, in raster and vector formats, used in the assessment of shallow landslide susceptibility.
| Name | Source | Scala/Pixel | Date | Type |
|---|---|---|---|---|
| Administrative Unit | Liguria Region | 1:5,000 | 2018 | V |
| Aspect | Liguria Region | 1:10,000 | 2007 | V |
| CORINE Land Use (II Level) | Liguria Region | 1:10,000 | 2018-2019 | V |
| CTR (Regional Technical Map) | Liguria Region | 1:5,000 | 1990-2006 | R |
| DEM (Digital Elevation Model) | Liguria Region | 5 m | 2016 | R |
| Hydrographic Network and Catchments | Liguria Region | 1:10,000 | 2019 | V |
| Landslide—Project IFFI | Liguria Region | 1:10,000 | 2014 | V |
| Lithology | Liguria Region | 1:10,000 | 2017 | V |
| Slope | Liguria Region | 1:10,000 | 2016 | V |
| DEM | Genoa Municipality | 1 m | 2018 | R |
| Geomorphological map | Genoa Municipality | 1:5,000 | 2015 | V |
Table 3.
Weights assigned to the 7 causal factors for shallow landslide susceptibility assessment.
| Landslide Factor | Weight |
|---|---|
| Lithology | 0.08 |
| Aspect | 0.06 |
| Slope gradient | 28.0 |
| Land Use | 13.0 |
| Slope deposits | 29.0 |
| Tangential curvature | 0.09 |
| Profile curvature | 0.07 |
Table 4.
The water and gas networks vulnerability classes according to the pipe’s diameters.
| Pipe Diameter (cm) | Vulnerability Class |
|---|---|
| d<=50 | 1 |
| 50<d<=100 | 2 |
| 100<d<=200 | 3 |
| 200<d<=300 | 4 |
| d>300 | 5 |
Table 5.
Occurrence of shallow landslides for the 7 identified causal factors grouped into classes and corresponding weights used to assess landslide susceptibility.
Table 5.
Occurrence of shallow landslides for the 7 identified causal factors grouped into classes and corresponding weights used to assess landslide susceptibility.
| Slope (%) | Shallow landslides | Weight |
| 0-10 | 2 | 0.0052 |
| 11-20 | 36 | 0.0935 |
| 21-35 | 153 | 0.3974 |
| 36-50 | 139 | 0.3610 |
| 51-75 | 54 | 0.1403 |
| >75 | 1 | 0.0026 |
| Aspect | Shallow landslides | Weight |
| South | 67 | 0.1740 |
| East | 44 | 0.1143 |
| West | 59 | 0.1532 |
| North | 22 | 0.0571 |
| North-East | 34 | 0.0883 |
| South-East | 69 | 0.1792 |
| South-West | 68 | 0.1766 |
| North-West | 22 | 0.0571 |
| Lithology | Shallow landslides | Weight |
| Schists and shales | 103 | 0.2675 |
| Carbonate rocks | 5 | 0.0130 |
| Alluvial deposits | 18 | 0.0468 |
| Conglomerate | 2 | 0.0052 |
| Flysch | 72 | 0.1870 |
| Quartzite and cherts | 91 | 0.2364 |
| Ophiolitic rocks | 94 | 0.2442 |
| Land Use | Shallow landslides | Weight |
| Artificial areas | 8 | 0.0208 |
| Crop and meadows | 119 | 0.3091 |
| Wood | 195 | 0.5065 |
| Scrub and herbaceous areas | 61 | 0.1584 |
| Peri-fluvial areas | 2 | 0.0052 |
| Tangential curvature | Shallow landslides | Weight |
| < -0,025 | 0 | 0.0000 |
| -0,025/-0,01 | 55 | 0.429 |
| -0,01/- 0,0025 | 92 | 0.2390 |
| -0,0025/0,0025 | 98 | 0.2545 |
| 0,0025/0,01 | 85 | 0.2208 |
| 0,01/0,025 | 47 | 0.1221 |
| >0,025 | 8 | 0.0208 |
| Profile curvature | Shallow landslides | Weight |
| < -0,025 | 0 | 0.0000 |
| -0,025/-0,01 | 44 | 0.1143 |
| -0,01/- 0,0025 | 97 | 0.2519 |
| -0,0025/0,0025 | 134 | 0.3481 |
| 0,0025/0,01 | 86 | 0.2234 |
| 0,01/0,025 | 23 | 0.0597 |
| >0,025 | 1 | 0.0026 |
| Slope deposits | Shallow landslides | Weight |
| Presence | 359 | 0.9325 |
| Absence | 26 | 0.0675 |
Table 6.
A majority of the landslides in the calibration set, 92 per cent of the total of 97 landslides, fall into the two maximum susceptibility categories, testifying to the model’s level of reliability.
Table 6.
A majority of the landslides in the calibration set, 92 per cent of the total of 97 landslides, fall into the two maximum susceptibility categories, testifying to the model’s level of reliability.
| Susceptibility Class | Shallow Landslides—Calibration Set |
|---|---|
| 1 | 0 |
| 2 | 3 |
| 3 | 5 |
| 4 | 18 |
| 5 | 71 |
| Total | 97 |
Table 7.
Descriptive statistics of hourly rainfall at Fiorino (FIO 1960–2024), Ponte Carrega (PCO 1960-2024) and Crocetta d’Orero (CRO 1961–2024) rain gauges.
Table 7.
Descriptive statistics of hourly rainfall at Fiorino (FIO 1960–2024), Ponte Carrega (PCO 1960-2024) and Crocetta d’Orero (CRO 1961–2024) rain gauges.
| Statistics | FIO | PCA | CRO | ||||||
|---|---|---|---|---|---|---|---|---|---|
| 1 h | 3 h | 6 h | 1 h | 3 h | 6 h | 1 h | 3 h | 6 h | |
| Mean | 59.1 | 95.0 | 116.5 | 48.9 | 75.9 | 96.8 | 42.1 | 66.3 | 86.9 |
| Median | 54.2 | 80.5 | 94.7 | 43.0 | 66.4 | 83.0 | 38.4 | 55.1 | 73.7 |
| Maximum | 126.0 | 269.0 | 332.0 | 124.2 | 230.0 | 283.6 | 88.0 | 214.0 | 267.0 |
| Minimum | 14.8 | 31 | 38.8 | 17.0 | 24.6 | 35.0 | 15.2 | 29.6 | 42.0 |
Table 8.
Mann-Kendall trend test results at 95% confidence for hourly rainfall series at Fiorino (FIO 1960–2024), Ponte Carrega (PCO 1960-2024) and Crocetta d’Orero (CRO 1961–2024) rain gauges.
Table 8.
Mann-Kendall trend test results at 95% confidence for hourly rainfall series at Fiorino (FIO 1960–2024), Ponte Carrega (PCO 1960-2024) and Crocetta d’Orero (CRO 1961–2024) rain gauges.
| Statistics | FIO | PCA | CRO | ||||||
|---|---|---|---|---|---|---|---|---|---|
| 1 h | 3 h | 6 h | 1 h | 3 h | 6 h | 1 h | 3 h | 6 h | |
| z-stat | 2.40470 | 1.73823 | 1.54695 | -0.12457 | -0.283092 | -0.192505 | 1.92901 | -0.04445 | 1.29781 |
| p-value | 0.01619 | 0.08217 | 0.12188 | 0.90086 | 0.777101 | 0.847347 | 0.05373 | 0.96455 | 0.19435 |
| trend | yes | no | no | no | no | no | no | no | no |
| Sen’ slope | 0.44721 | 0.42311 | 0.39500 | -0.01847 | -0.051355 | -0.03333 | 0.31623 | -0.01456 | 0.34170 |
| Lower | 0.09268 | -0.07143 | -0.13600 | -0.31111 | -0.426229 | -0.50345 | -0.01053 | -0.45000 | -0.23125 |
| Upper | 0.82857 | 0.98571 | 1.05625 | 0.28 | 0.333333 | 0.51429 | 0.70769 | 0.50625 | 0.94595 |
Disclaimer/Publisher’s Note: The statements, opinions and data contained in all publications are solely those of the individual author(s) and contributor(s) and not of MDPI and/or the editor(s). MDPI and/or the editor(s) disclaim responsibility for any injury to people or property resulting from any ideas, methods, instructions or products referred to in the content. |
© 2025 by the authors. Licensee MDPI, Basel, Switzerland. This article is an open access article distributed under the terms and conditions of the Creative Commons Attribution (CC BY) license (http://creativecommons.org/licenses/by/4.0/).
Copyright: This open access article is published under a Creative Commons CC BY 4.0 license, which permit the free download, distribution, and reuse, provided that the author and preprint are cited in any reuse.


