Submitted:
05 September 2025
Posted:
08 September 2025
You are already at the latest version
Abstract
The Free Water Knock Out (FWKO) vessel is a critical device in the oil sands treatment process, responsible for separating water, oil, and gas. This study investigates the gas–oil interface within the FWKO and analyzes the flow characteristics of the unresolved mixture near the interface. To enhance the separation efficiency by increasing the residence time of the mixture, a concave-shaped weir was introduced. Numerical simulations were conducted using ANSYS Fluent 2023 R1, applying the Volume of Fluid (VOF) model to capture the multiphase flow behavior. Optimization was performed using a genetic algorithm, and the optimal weir curvature with a minor radius of 0.017333 m and a major radius of 0.19032 m yielded the highest separation efficiency. The model incorporating the optimized weir demonstrated a 1.26% improvement in separation efficiency compared to the reference model, and a 2.13% improvement over the baseline model without curvature. These results are expected to contribute to improved separation processes in the oil sands industry.
Keywords:
FWKO (Free Water Knock Out)
; Oil sands
; Multiphase flow
; CFD (Computational fluid dynamics)
1. Introduction
The demand for petroleum resources continues to rise, but conventional extraction methods alone are no longer sufficient to meet global energy needs. As a result, unconventional oil production technologies have gained attention, with oil sands plants in particular being highlighted due to their vast potential reserves and steadily increasing output. Oil sands are deeply buried in a highly viscous state, and extraction is typically carried out using the Steam Assisted Gravity Drainage (SAGD) process. This method involves injecting high-temperature steam into the oil sands reservoir to reduce viscosity, thereby enabling oil recovery [1,2,3,4].
The SAGD process produces a mixture of water, oil, and gas, which must be separated to obtain clean oil. For this purpose, a Free Water Knock Out (FWKO) unit is used. The FWKO is a gravity separator that utilizes density differences to achieve phase separation. Its basic principle is that bitumen enters the vessel and, during its residence time, separates based on the density difference between oil and water. Oil accumulates at the top and is discharged over the weir.
The key factors determining the separation performance of the FWKO include residence time, oil–water interfacial area, density difference between the fluids, and the presence of slugging flow [5]. Without altering the inflow conditions or operating parameters, improving the separation efficiency through geometric modifications of the FWKO mainly involves increasing the residence time or expanding the interfacial area, thus allowing more time and space for phase separation.
Various studies have been conducted to enhance FWKO separation efficiency. Kang et al. [6] numerically demonstrated that changing the curvature and area of the vane distributor at the inlet alters the internal flow field, thereby improving oil–water separation. Son et al. [7] showed through CFD that increasing the thickness of a porous baffle reduces the average flow velocity and increases the residence time, enhancing separation performance. Some studies have attempted to improve separation efficiency by modifying the shape of the weir. Jung and Kim [8] numerically analyzed the impact of weir angle on separator performance, confirming that increasing the angle expands the oil–water interfacial area and improves separation. Yang et al. [9] investigated the effects of weir top geometry and fluid viscosity on separation efficiency, showing that changes in weir top shape increased the air–oil interface and prolonged residence time. However, while existing studies primarily focus on increasing interfacial area through weir shape modification, little attention has been given to controlling the flow of the mixture to increase residence time. Therefore, this study explores a new approach to improve separation efficiency by modifying the weir shape to control the flow of the unresolved mixture and extend its residence time.
The genetic algorithm (GA) is a global optimization technique capable of finding effective solutions in complex and nonlinear search spaces. It is not constrained by the form or differentiability of the objective function and can flexibly handle various constraints and discrete variables. GA searches multiple candidate solutions simultaneously, making it less prone to local optima and highly suitable for solving multi-objective optimization problems through Pareto-optimal solutions. Due to these advantages, GA has been widely applied in engineering optimization and often combined with CFD. For example, Zheng et al. [14] integrated GA and CFD using a Windows socket-based platform to optimize the porosity distribution of multilayer porous inserts in tubular heat exchangers, demonstrating improved thermo-hydraulic performance. Similarly, Liu et al. [15] conducted a CFD-based NSGA-II multi-objective optimization of a plate-fin heat exchanger for hydraulic retarders, confirming enhanced heat transfer and reduced flow resistance.
This study aims to improve the separation efficiency of the FWKO by modifying the shape of the weir. First, the flow behavior at the gas–oil interface is examined, as the fluid in this region directly flows over the weir, making it a critical zone for separation. Then, design variables and candidate weir geometries are selected to enhance separation efficiency. Finally, the optimal weir shape is derived using a genetic algorithm.
2. Numerical Analysis
This section presents the geometry and mesh of the FWKO used for numerical simulation, followed by a description of the governing equations and boundary conditions applied in the analysis. Subsequently, the flow characteristics of the mixture at the gas–oil interface are examined, based on interface analysis, and an appropriate weir geometry is selected to enhance the separation efficiency.
2.1. 3-Phases Separator Model
As the analysis model, a horizontal-type FWKO was considered, as shown in Figure 1. Compared to vertical-type FWKOs, the horizontal configuration offers a longer residence time, leading to higher separation efficiency. To further improve performance, a porous baffle and a dish-head type inlet device were installed [16,17]. These components reduce the kinetic energy of the incoming mixture, enabling greater separation efficiency through extended residence time. The pressure vessel has a length of L = 1.63 m and a diameter of D = 0.3328 m.
The mesh used in the simulation is shown in Figure 2. In the FWKO, the unresolved oil–water mixture crossing over the weir along with the oil at the gas–oil interface leads to a decrease in separation efficiency. Therefore, to accurately capture the behavior near the gas–oil interface, a refined mesh was applied in this region. As shown in the figure, the mesh is densely distributed around the perforated baffle and the gas–oil interface. In addition, to precisely analyze the effect of weir geometry on separation performance, the mesh near the weir was also densely generated. Based on the results of a grid dependency test (GDT), the total number of mesh elements was determined to be 1.6 million. The GDT results are also presented in Figure 2. The minimum orthogonal quality is 0.3, and the maximum skewness is 0.85. The Y+ value for evaluating near-wall viscous flow behavior in the turbulence model is 1.0308.
2.2. Equations
In this study, numerical analysis was performed using the commercial software ANSYS Fluent 2023 R1. For turbulence modeling, the realizable k-ε model was employed, and to simulate multiphase flow, the volume of fluid (VOF) method based on the Eulerian–Eulerian approach was applied. The VOF model is a widely used multiphase flow technique for tracking the interface between immiscible fluids. It enables accurate tracking of the free surface based on the volume fraction in each cell without requiring mesh deformation, ensuring high numerical stability. This method is effectively applied to a variety of engineering problems such as wave motion, droplet formation, and free-surface flows [18,19]. The following equations represent the governing equations used in the numerical simulation.
The continuity equation for each phase is expressed as follows. Here, denotes the volume fraction of phase , represents the density of phase , and indicates the velocity vector of phase q.
The momentum equation for each phase is expressed as follows. Here, denotes the pressure, is the viscous stress tensor, is the gravitational acceleration, and represents the interfacial interaction force between phases.
The surface tension model is considered as an additional term in the VOF method, and the surface tension force can be expressed as follows. Here, is the surface tension coefficient, and denotes the curvature.
In the realizable k-ε model, the transport equations for the turbulent kinetic energy (k) and the turbulent dissipation rate (ε) are given as follows. Here, is the turbulent viscosity, is the production term of turbulent kinetic energy, is the buoyancy term, and are empirical turbulent model constants, and are empirical coefficients, and S denotes the magnitude of the strain rate tensor.
In multiphase flow using the VOF method, the volume fraction tracking equation is expressed as follows.
2.3. Boundary Conditions
In the FWKO, a mixture of water, oil, and air enters through the inlet, and each phase is discharged through its designated outlet. The physical properties of each phase are presented in Table 1.
At the inlet where the mixture enters, the flow velocity was calculated and set to satisfy 60 BPD with an SOR of 2.2. The air outlet was defined with a gauge pressure of 0, while the oil and water outlets were assigned constant pressure values to simulate the effect of valves installed in actual FWKO systems for maintaining the interface level. According to Behin and Azimi [20], the highest separation efficiency is achieved when the oil–water interface is maintained at half the diameter of the vessel, which was reflected in the boundary condition settings. Detailed values are provided in Table 2.
To facilitate faster convergence, initial conditions were defined using patching, as shown in Figure 1. The water region was initialized from the bottom of the vessel up to half the height of the weir, while the oil region was set directly above the water region, extending up to the full height of the weir.
2.4. Analysis of the Gas–Oil Interface
In this section, a numerical simulation was performed on the FWKO model without any curvature applied to the weir, based on the conditions described earlier. The gas–oil interface behavior was examined accordingly. To validate the accuracy of the simulation results, a comparison was made with a previous study [21] that analyzed separation efficiency under the same FWKO geometry but with different baffle designs. The simulation conducted under identical conditions showed minimal deviation in separation efficiency compared to the prior study, thereby providing qualitative validation of the present numerical model.
Flow behavior within the FWKO was observed over a simulation time of 800 seconds. The separation efficiency () was calculated using the average values from 700 to 800 seconds, as expressed in Eq. (9). Here, N represents the number of time steps between 700 and 800 seconds, is the mass flow rate of oil at the oil outlet, and is the mass flow rate of water discharged through the oil outlet. The separation efficiency for the model without weir curvature was found to be 95.31%.
As shown in Figure 3, in the FWKO without weir curvature, the unresolved oil–water mixture flows along the wall and exits toward the oil outlet at the gas–oil interface. It was observed that the average water content in the mixture near the wall was approximately 15.6% higher than that at the center of the interface, indicating significant phase imbalance and incomplete separation near the boundary.

Table 3.
Water volume fraction distribution at the gas–oil Interface.
| Location | water volume fraction | difference [%] | |
|---|---|---|---|
| Top | 0.2467 | 0.2520(average) | 15.60% |
| Bottom | 0.2573 | ||
| Middle | 0.2126 | ||
Figure 4a shows the velocity vectors of the incoming mixture at the inlet. As seen in Figure 4a and Figure 4b, the mixture enters, collides with the dish head, and then strikes the front wall of the FWKO before flowing along the wall surface. This indicates that the flow behavior of the mixture inside the FWKO is significantly influenced by the inlet configuration. When the mixture enters in the direction of the front wall, as in the case with the dish head inlet, it flows along the wall surface, resulting in wall-guided flow within the FWKO.
This section confirms through gas–oil interface analysis that the unresolved mixture predominantly remains near the wall region of the interface. Based on this observation, introducing curvature to the weir to raise its height near the wall can help control the wall-guided flow of the mixture. This is expected to increase residence time and contribute to improved separation efficiency.
3. Optimization
This section presents the optimization of a concave weir shape based on the previous analysis. To identify the optimal curvature of the concave weir, an elliptical profile was applied. The minor radius r, which determines the height near the wall, and the major radius R, which defines the curvature, were selected as the geometric design variables. Equation (8) represents the equation of an ellipse, and Eq. (9) describes the curvature as a function of position. As can be seen from both equations, the curvature at each point on the ellipse is determined by the lengths of the major and minor axes.
The weir geometry was designed by placing an ellipse with major radius R and minor radius r tangent to the top surface of the weir. The ellipse was trimmed at the intersection with the vessel wall, resulting in increased weir height near the wall, as shown in Figure 5.
Before proceeding with the optimization, a reference model was analyzed by setting the major radius R to 0.1664 m, which is half the diameter of the FWKO vessel, and the minor radius to 0.02 m. Numerical simulation was then performed based on these parameters.
3.1. Design of Experiment (DoE)
Next, a design of experiments (DoE) was conducted to examine the correlation between the design variables and and the separation efficiency, with the goal of identifying an optimal design point. The DoE type was Latin hypercube sampling (LHS) with CCD (Central Composite Design) samples. The LHS method is particularly effective for simulations with high experimental or computational costs, as it ensures a well-distributed sampling with fewer points compared to traditional grid-based methods, enabling efficient experimental planning [22,23,24]. The CCD-based DoE generates y sample points according to the number of design variables k′, as described in Eq. (10). Based on the reference values of R = 0.1664 m and r = 0.02 m, a total of 9 design combinations were created. A constraint was imposed to ensure that R does not fall below 0.1664 m, the radius of the FWKO vessel.
Table 4.
DoE results at the design points.
| Case | R [m] | ] | |
|---|---|---|---|
| 1 | 0.18167 | 0.016667 | 0.9646 |
| 2 | 0.19167 | 0.025556 | 0.9653 |
| 3 | 0.17167 | 0.012222 | 0.9537 |
| 4 | 0.18833 | 0.03 | 0.9460 |
| 5 | 0.175 | 0.043333 | 0.9515 |
| 6 | 0.19833 | 0.021111 | 0.9590 |
| 7 | 0.185 | 0.047778 | 0.9348 |
| 8 | 0.195 | 0.038889 | 0.9486 |
| 9 | 0.17833 | 0.034444 | 0.9567 |
3.2. Response Surface Method (RSM)
The response surface methodology (RSM) was used to approximate the relationship between separation efficiency and the design variables based on data obtained from numerical simulations. Among various RSM techniques, non-parametric regression (NPR) was adopted in this study. NPR utilizes kernel functions to estimate values based on local information, offering the advantage of smoothly connecting data and effectively predicting function values at specific points [25,26,27]. As shown in the graph in Figure 6a, the predicted values obtained using NPR are plotted against the observed values from numerical simulations. The close alignment of the data points along the diagonal indicates that the NPR model provides reliable predictions for the present analysis.
In addition, quantitative indicators related to model reliability were evaluated. The coefficient of determination (R2) was found to be 0.999 (best value = 1), and the root mean square error (RMSE) was 0.0003 (best value = 0), further confirming the high accuracy and reliability of the model.
The sensitivity analysis results using NPR are presented in Figure 6b. In the graph, the horizontal axis represents the normalized values of the input variables (scaled relative to their full range), and the vertical axis indicates the separation efficiency. As explained in Sec. 3.1, since R cannot be smaller than the radius of the FWKO vessel, only values above 0.5 (represented by the dotted line) are meaningful. R shows a nonlinear trend, initially decreasing and then increasing. Similarly, also exhibits a non-monotonic behavior, following a curve that decreases and then rises. These results indicate that both variables have a nonlinear relationship with separation efficiency, rather than a simple linear one. Based on this, it can be inferred that the optimal value of likely exists in the region greater than the reference value of 0.1664 m, while the optimal value of is likely to be found in the region smaller than the reference value of 0.02 m.
3.3. Genetic Algorithm
To optimize the weir geometry, the screening method based on a genetic algorithm was applied. The objective was to maximize separation efficiency, with the constraints set as separation efficiency < 1, < 0.1664 m, and > 0.1664 m. The optimization predicted the optimal values of and to be 0.017333 m and 0.19032 m, respectively, with a separation efficiency of 97.51%. To validate the result, a numerical simulation was performed under the same conditions, yielding an actual separation efficiency of 97.34%. The prediction error was only 0.17%, confirming the high accuracy. Compared to the reference model, the optimized model showed a 1.26% improvement in separation efficiency.
Table 5 compares the non-curved model, reference model, optimized model, and the models with the smallest and largest curvature from the DoE results. The “difference” column shows the percentage change in separation efficiency relative to the non-curved model, and the final column lists the curvature measured at the point on the weir closest to the center of the ellipse.
The analysis shows that as curvature increases (the weir becomes more concave), separation efficiency initially improves and then drops sharply. The improvement occurs because the curved weir redirects the flow along the gas–oil interface, increasing residence time. The subsequent decline in efficiency is due to the narrowed flow passage above the weir caused by excessive curvature, which accelerates the flow and results in the unresolved mixture exiting before sufficient separation occurs. Figure 7 presents velocity contours over the top of each weir, with the gray region indicating the weir. Case 7, which had the lowest separation efficiency, shows relatively high velocity over the weir.
To better examine the effect of weir curvature, Case 3 from the DoE, which had the largest curvature (most gradual slope), was analyzed. The curvature was 1149 [m−1], and the separation efficiency was 95.37%. This result indicates that higher curvature does not always lead to better separation. As seen in the non-curved model, the presence and proper design of curvature are critical factors, and optimal separation performance can be achieved by selecting an appropriate curvature.
Finally, Figure 8 compares the mixture residence time and turbulence intensity near the weir for the reference and optimized models. The residence time was measured based on the point at which the mixture first crossed the weir. In the optimized model, the residence time increased from 243 seconds to 250 seconds, a gain of 7 seconds. This indicates that the change in weir curvature altered the flow structure at the gas–oil interface, allowing the mixture to remain inside the FWKO for a longer duration. The increase in residence time contributed to improved flow stability and a reduction in turbulence intensity. Specifically, the turbulence intensity measured just before the weir was noticeably lower in the optimized model compared to the reference model. According to Kim [21], turbulence intensity plays a critical role in promoting oil–water mixing inside the FWKO. As turbulence weakens, interphase mixing is suppressed and a more distinct interface can form. Therefore, the observed increase in residence time and corresponding reduction in turbulence intensity in the optimized model indicate enhanced interface stability, which ultimately supports improved separation efficiency.
4. Conclusion
In this study, the flow characteristics at the gas–oil interface were first analyzed to improve the separation efficiency of the FWKO. The analysis revealed that due to the dish-head inlet configuration, the unresolved mixture predominantly flows along the vessel wall. Based on this finding, curvature was introduced to the weir to increase its height near the wall, thereby redirecting the wall-guided flow and increasing the residence time of the mixture. For optimal design, the major and minor radii () of the elliptical weir were selected as design variables, and nine design points were generated using Latin hypercube sampling (LHS)-based DoE. Sensitivity analysis and optimal point identification were conducted using non-parametric regression (NPR) and the screening method. As a result, the model incorporating the optimized weir curvature showed improvements in separation efficiency of 1.26% compared to the reference model, 2.13% compared to the non-curved baseline model, and 3.97% compared to the lowest-efficiency design point. It was also found that separation efficiency does not follow a simple linear trend with curvature, but is instead influenced by a nonlinear interaction between flow deflection intensity and velocity changes. These results provide a practical design strategy for improving separation performance through internal flow control in FWKO systems. Furthermore, this study demonstrates the effectiveness of coupling CFD with optimization techniques offering a scalable approach for other multiphase separation systems in the oil sands industry and beyond.
Acknowledgments
This research was supported by the Korea Agency for Infrastructure Technology Advancement (KAIA) grant funded by the Ministry of Land, Infrastructure, and Transport, grant number (RS-2022-00142936).
References
- Berkowitz, N.; Speight, J.G. The oil sands of Alberta. Fuel 1975, 54 (3), 138-149. [CrossRef]
- Charpentier, A.D.; Bergerson, J.A.; MacLean, H.L. Understanding the Canadian oil sands industry’s greenhouse gas emissions. Environmental research letters 2009, 4 (1), 014005. [CrossRef]
- Giacchetta, G.; Leporini, M.; Marchetti, B. Economic and environmental analysis of a Steam Assisted Gravity Drainage (SAGD) facility for oil recovery from Canadian oil sands. Applied Energy 2015, 142, 1-9. [CrossRef]
- Kisman, K.; Yeung, K. Numerical study of the SAGD process in the Burnt Lake oil sands lease. In SPE International Thermal Operations and Heavy Oil Symposium, 1995; SPE: pp SPE-30276-MS.
- Kim, Y. Effect of inlet device geometry on the separation efficiency of FWKO pressure vessel. Journal of Plant Engineering 2017, 46 (11), 16–24.
- Kang, J.; Lee, J.; Kim, Y. Effect of inlet vane geometry variation on the separation efficiency of FWKO. Proceedings of the KSME Spring and Autumn Conference 2016, 605–610.
- Son, C.; Kim, Y. Effect of perforated baffle thickness on the separation efficiency of FWKO. Proceedings of the KSME Spring and Autumn Conference 2025, 125-126.
- Jung, K.J.; Kim, Y.-J. Effect of weir configurations on the performance of oil-water separator. International Journal of Fluid Machinery and Systems 2020, 13 (4), 759-766. [CrossRef]
- Yang, H.; Kang, H.; Kim, Y. Effect of weir geometry and oil viscosity variation on the performance of an oil-water separator. Journal of the Korean Society for Fluid Machinery 2024, 27 (1), 110-115. [CrossRef]
- Forrest, S. Genetic algorithms. ACM computing surveys (CSUR) 1996, 28 (1), 77-80. [CrossRef]
- Haldurai, L.; Madhubala, T.; Rajalakshmi, R. A study on genetic algorithm and its applications. Int. J. Comput. Sci. Eng 2016, 4 (10), 139-143.
- Moiz, A.A.; Pal, P.; Probst, D.; Pei, Y.; Zhang, Y.; Som, S.; Kodavasal, J. A machine learning-genetic algorithm (ML-GA) approach for rapid optimization using high-performance computing. SAE International journal of commercial vehicles 2018, 11 (2018-01-0190), 291-306. [CrossRef]
- Katoch, S.; Chauhan, S.S.; Kumar, V. A review on genetic algorithm: past, present, and future. Multimedia tools and applications 2021, 80 (5), 8091-8126. [CrossRef]
- Zheng, Z.-J.; Li, M.-J.; He, Y.-L. Optimization of porous insert configurations for heat transfer enhancement in tubes based on genetic algorithm and CFD. International Journal of Heat and Mass Transfer 2015, 87, 376-379. [CrossRef]
- Liu, C.; Bu, W.; Xu, D. Multi-objective shape optimization of a plate-fin heat exchanger using CFD and multi-objective genetic algorithm. International Journal of Heat and Mass Transfer 2017, 111, 65-82. [CrossRef]
- Lu, Y.; Lee, J.M.; Phelps, D.; Chase, R. Effect of internal baffles on volumetric utilization of an FWKO—a CFD evaluation. In SPE Annual Technical Conference and Exhibition?, 2007; SPE: pp SPE-109944-MS.
- Kim, H.G.; Kim, S.B.; Bae, S.H.; Jeong, H.S.; Kim, Y.-J. Effect of Inlet Configurations on the Separation Efficiency of Free Water Knock Out Vessel. In Proceedings of the World Congress on Mechanical, Chemical, and Material Engineering, 2024; Avestia Publishing.
- Cw, H. Volume of fluid (VOF) method for the dynamics of free boundaries. J Comp Phys 1981, 39, 201-225.
- Sun, X.; Sakai, M. Three-dimensional simulation of gas–solid–liquid flows using the DEM–VOF method. Chemical Engineering Science 2015, 134, 531-548. [CrossRef]
- Behin, J.; Azimi, S. Experimental and computational analysis on influence of water level on oil-water separator efficiency. Separation Science and Technology 2015, 50 (11), 1695-1700. [CrossRef]
- Kim, S.; Kim, H.; Jeong, H.S.; Kim, Y. Optimal design of perforated baffles for enhancing oil-water separation performance using genetic algorithms. Results in Engineering 2025, 26, 104668. [CrossRef]
- Stocki, R. A method to improve design reliability using optimal Latin hypercube sampling. Computer Assisted Mechanics and Engineering Sciences 2005, 12 (4), 393.
- Shields, M.D.; Zhang, J. The generalization of Latin hypercube sampling. Reliability Engineering & System Safety 2016, 148, 96-108. [CrossRef]
- Gumina, J.M.; Whitcomb, C.; Hernandez, A.S. Latin Hypercube Sampling Strategies Applied to Set-Based Design. In SNAME Maritime Convention, 2019; SNAME: p D033S005R008.
- Bezerra, M.A.; Santelli, R.E.; Oliveira, E.P.; Villar, L.S.; Escaleira, L.A. Response surface methodology (RSM) as a tool for optimization in analytical chemistry. Talanta 2008, 76 (5), 965-977. [CrossRef]
- Donnelly, A.; Misstear, B.; Broderick, B. Real time air quality forecasting using integrated parametric and non-parametric regression techniques. Atmospheric Environment 2015, 103, 53-65. [CrossRef]
- Pérez-Rodríguez, P.; Gianola, D.; González-Camacho, J.M.; Crossa, J.; Manès, Y.; Dreisigacker, S. Comparison between linear and non-parametric regression models for genome-enabled prediction in wheat. G3: Genes| Genomes| Genetics 2012, 2 (12), 1595-1605. [CrossRef]
Figure 1.
Schematic of the modelled FWKO vessel.
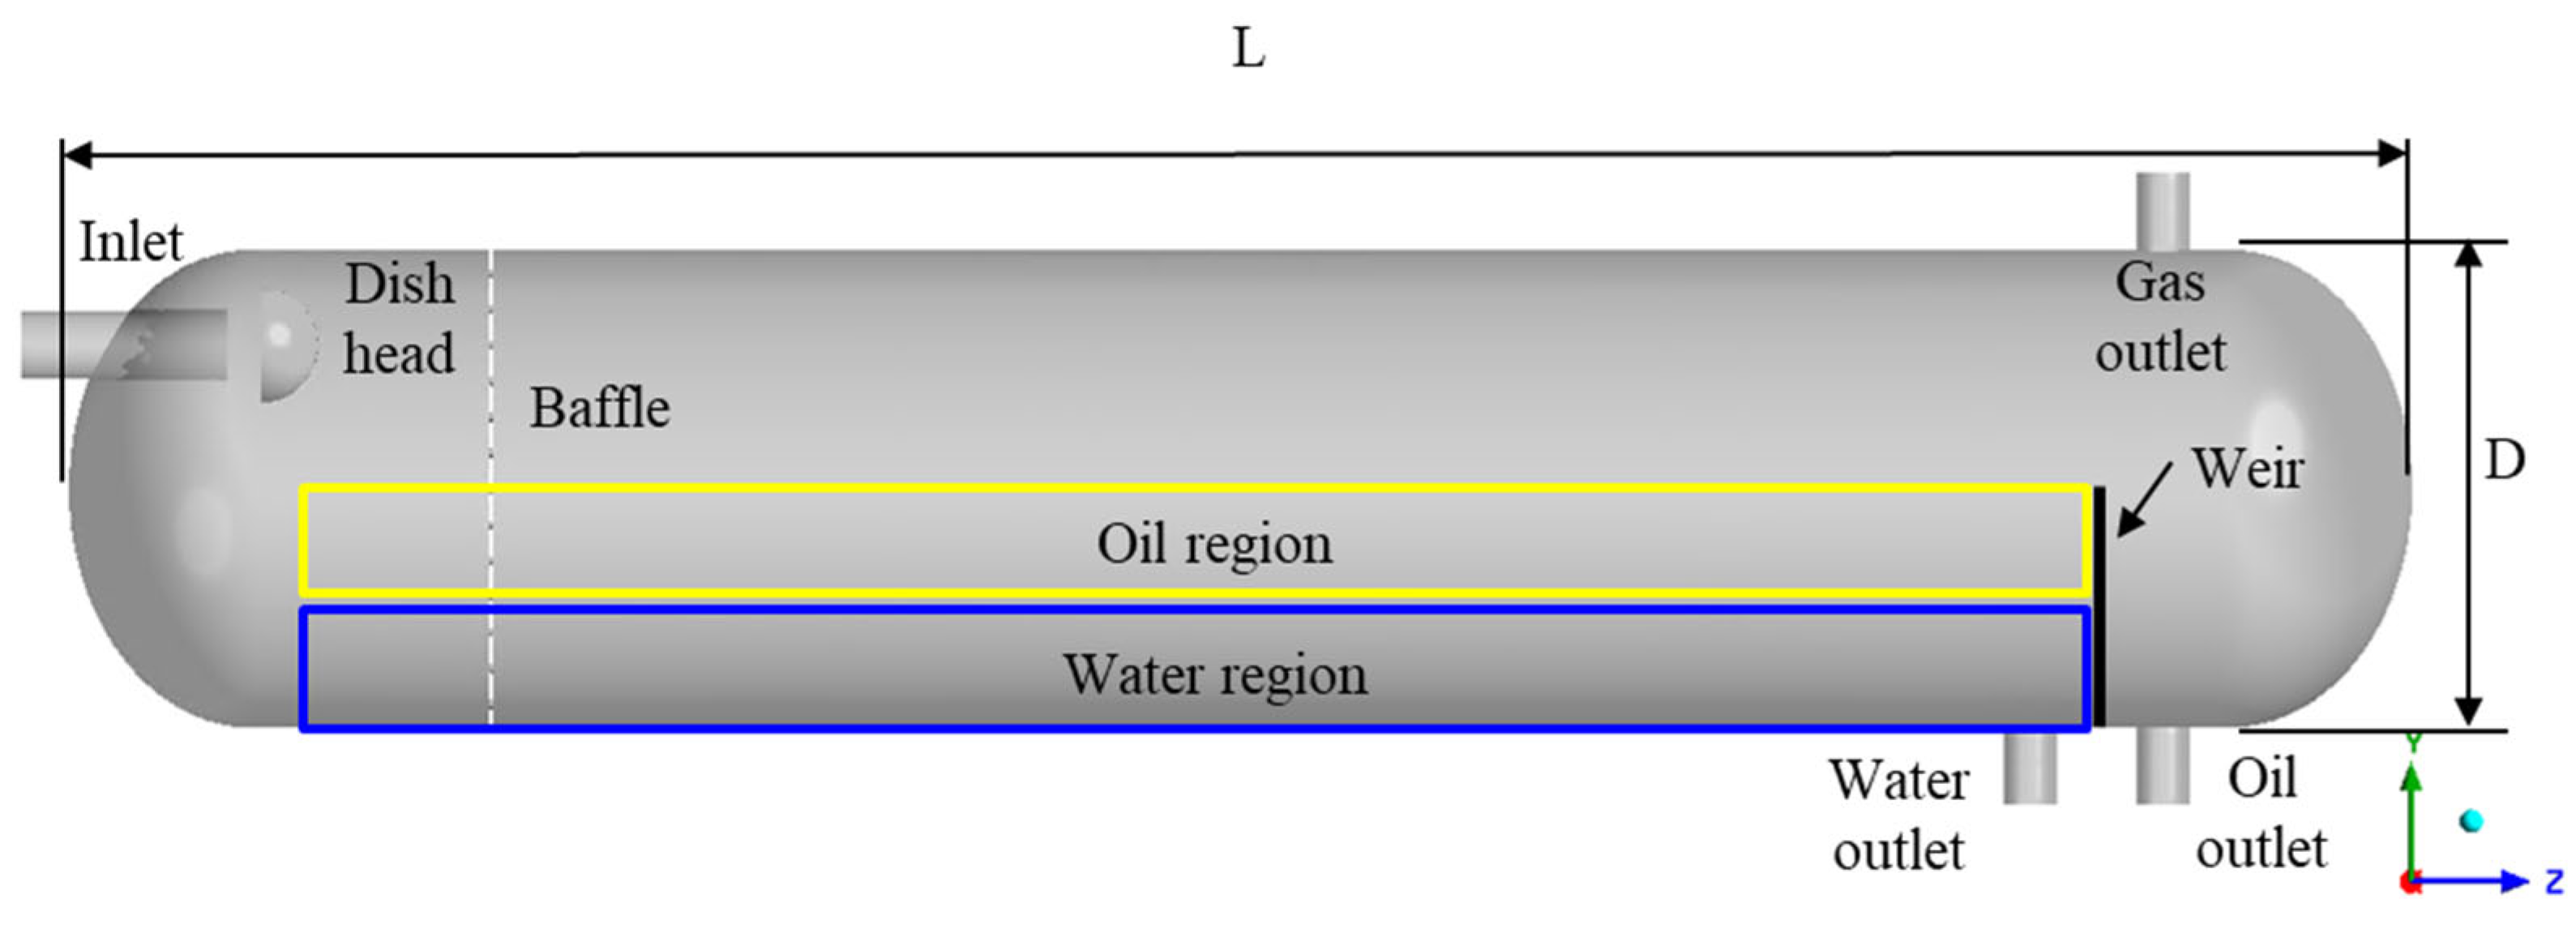
Figure 2.
(a) Mesh configuration; (b) The result of grid dependency test.
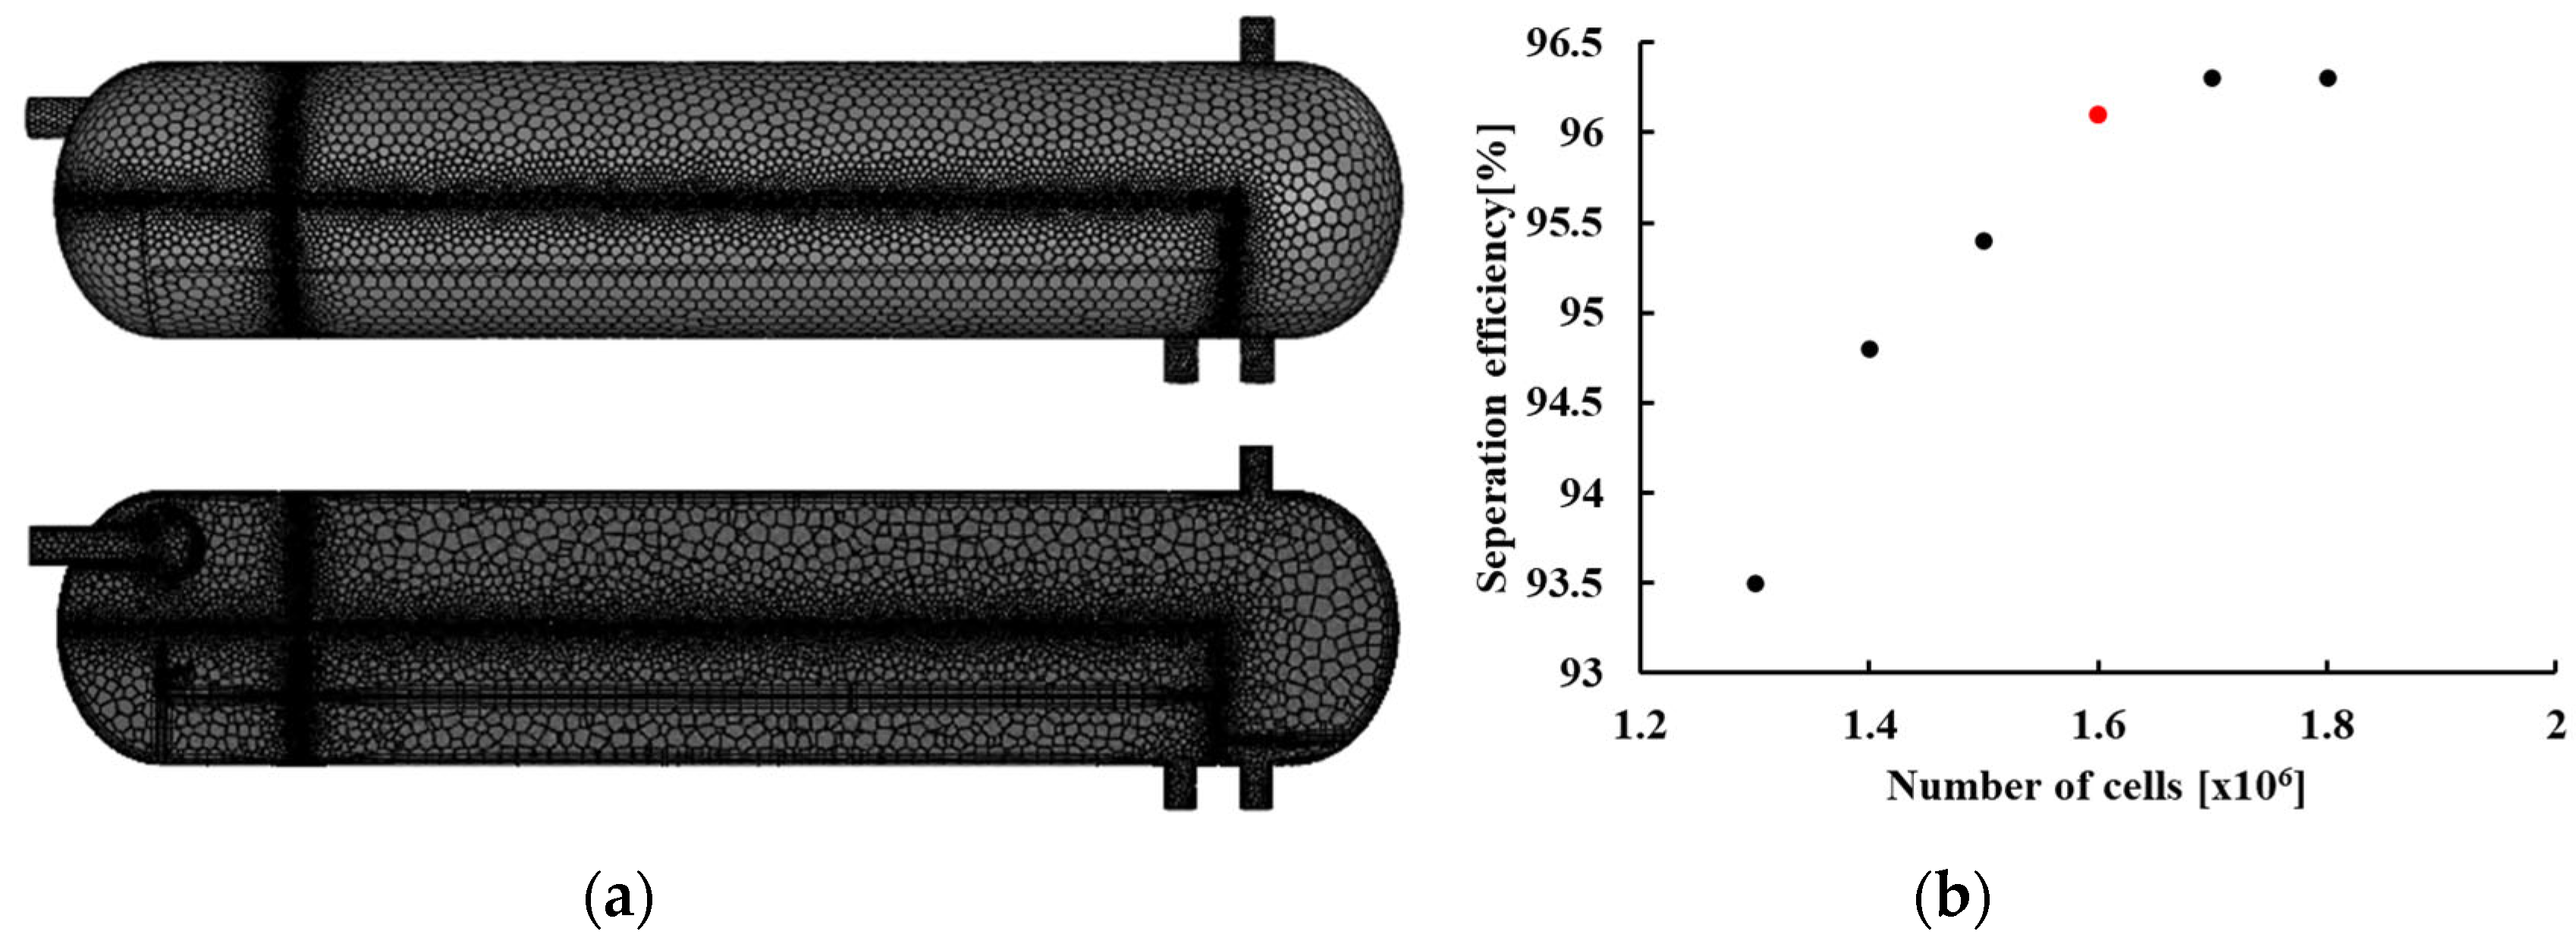
Figure 3.
Water Volume Fraction Contour at the Gas–Oil Interface.
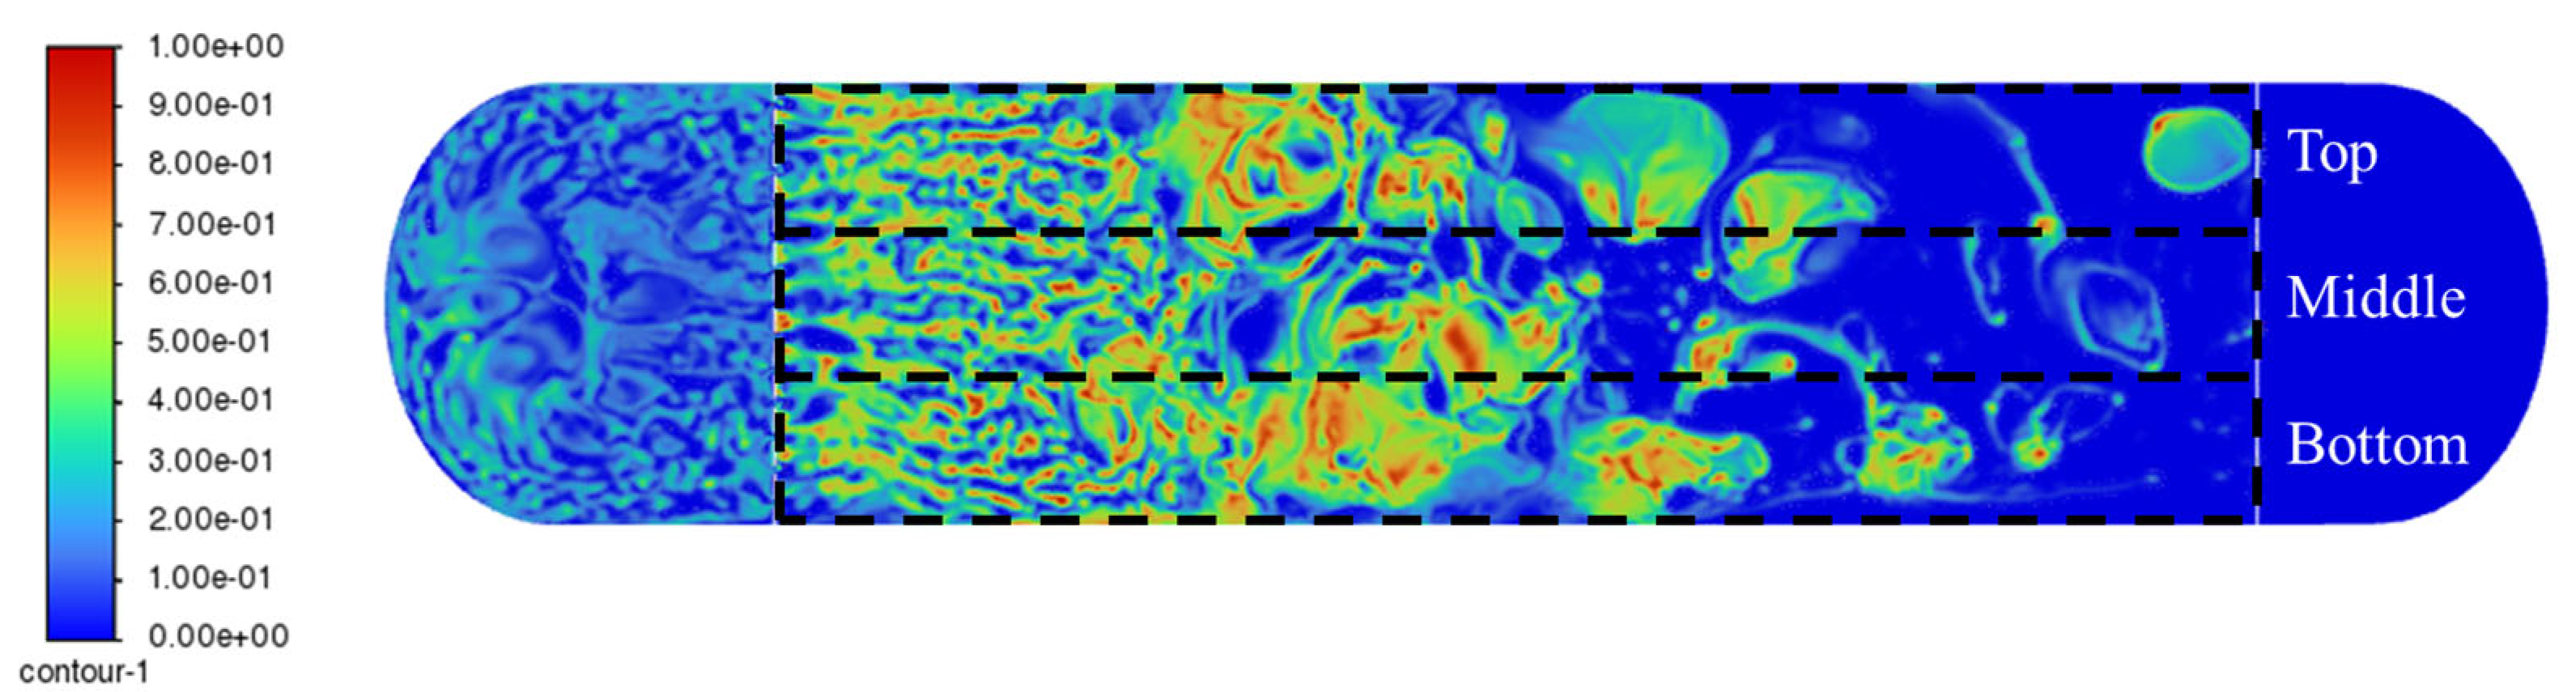
Figure 4.
(a) Velocity vector at the gas–oil interface near the inlet; (b) Water volume fraction contour.
Figure 4.
(a) Velocity vector at the gas–oil interface near the inlet; (b) Water volume fraction contour.
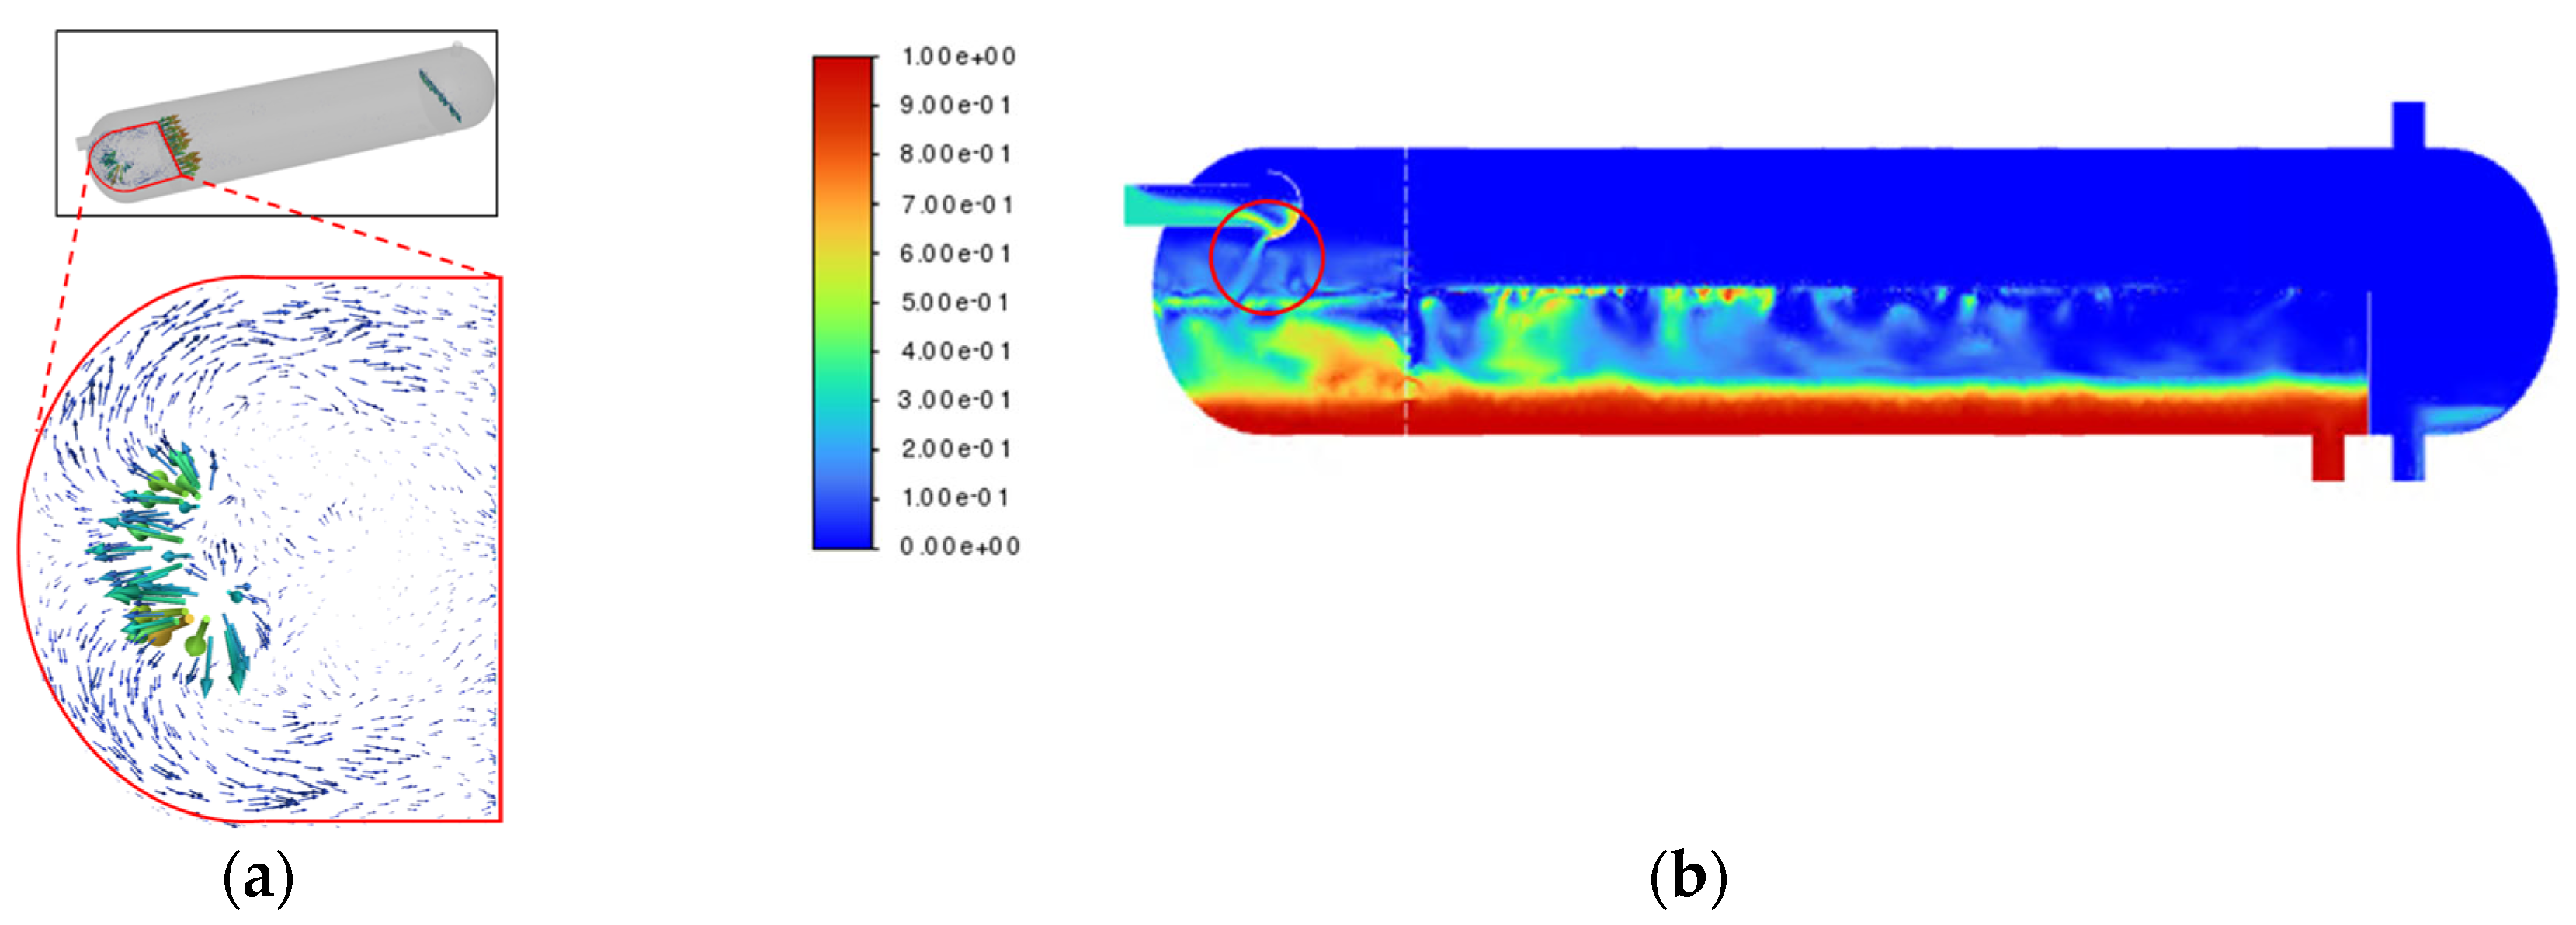
Figure 5.
Water volume fraction contour at the gas–oil Interface.
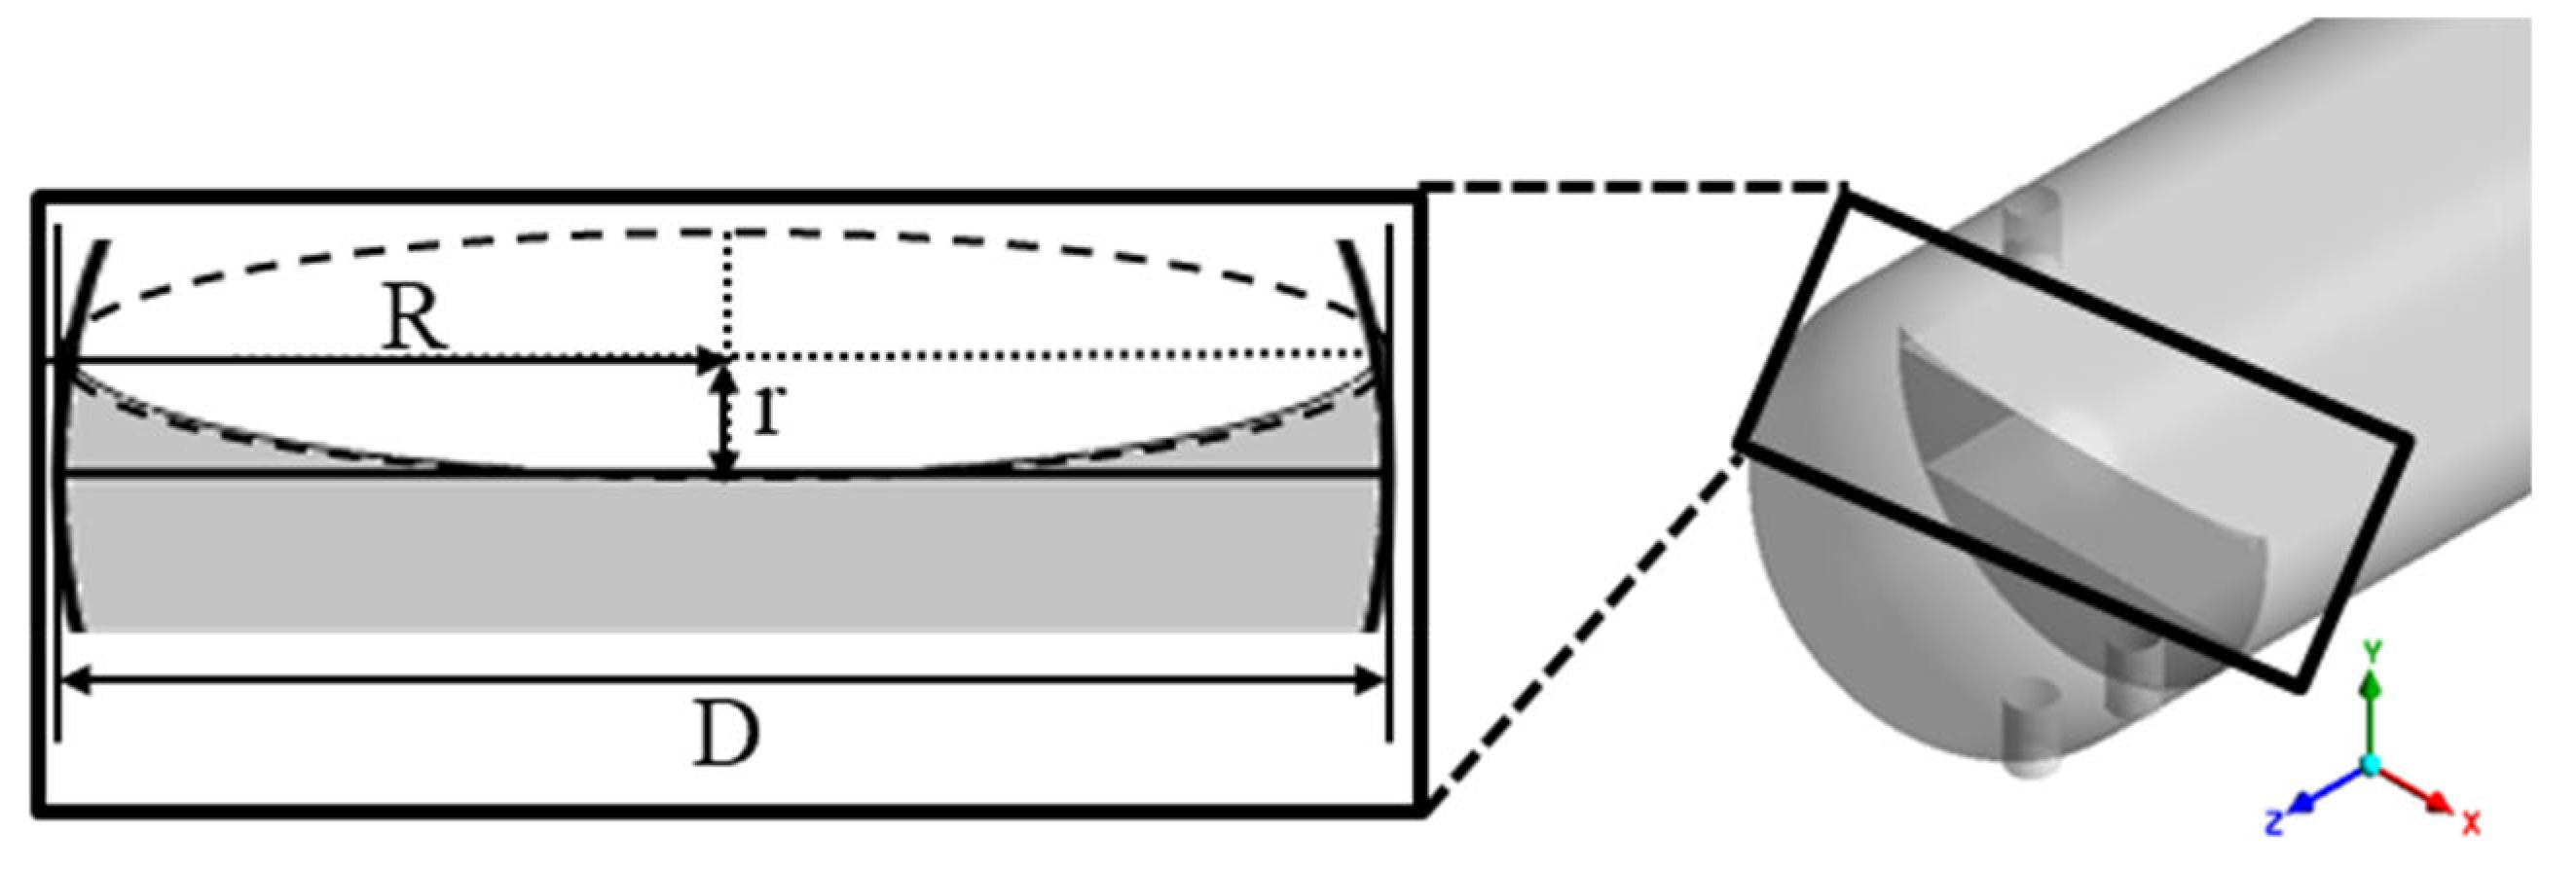
Figure 6.
(a) Comparison of the predicted value and the observed value; (b) Local sensitivity analysis results.
Figure 6.
(a) Comparison of the predicted value and the observed value; (b) Local sensitivity analysis results.
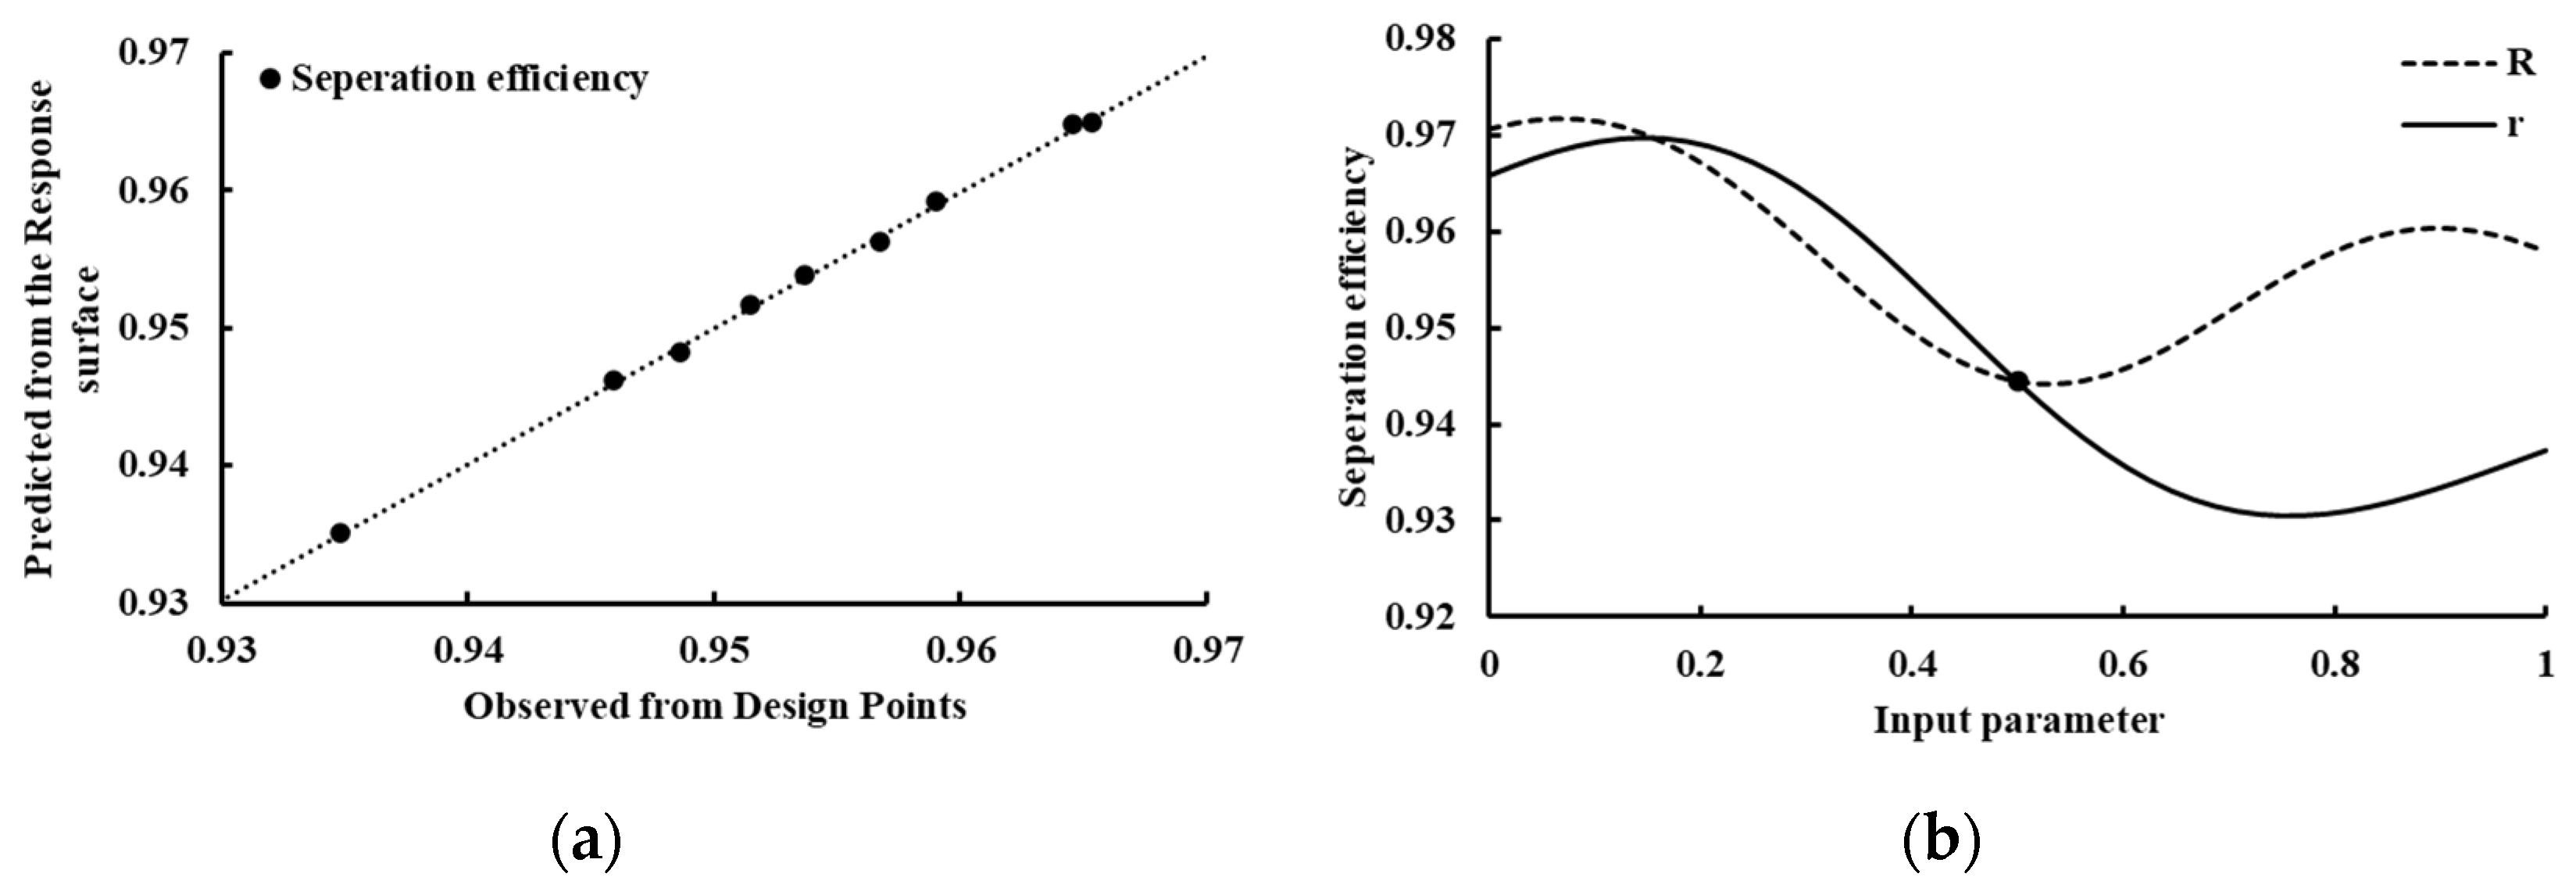
Figure 7.
Comparison of velocity contours for three models.
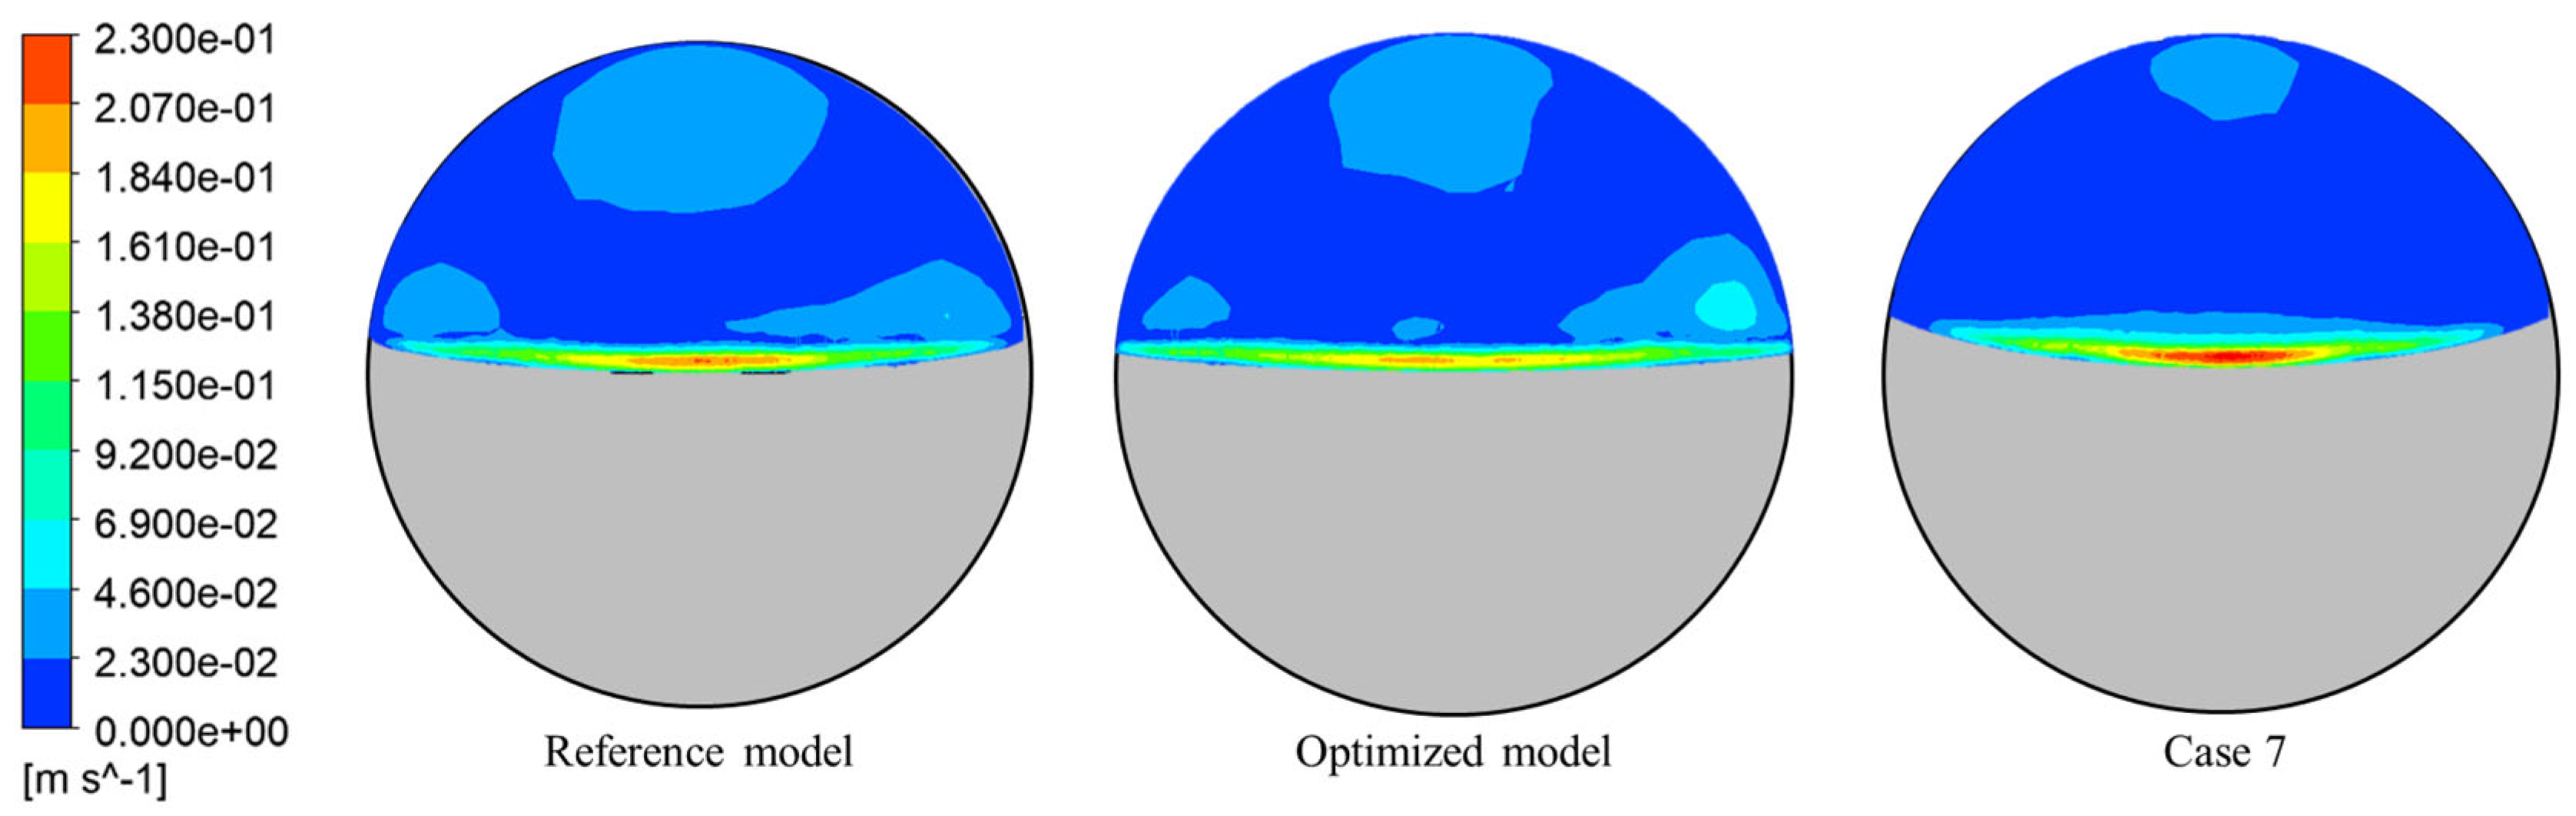
Figure 8.
Comparison of residence time and turbulence intensity just before the weir between the reference model and the optimized model.
Figure 8.
Comparison of residence time and turbulence intensity just before the weir between the reference model and the optimized model.
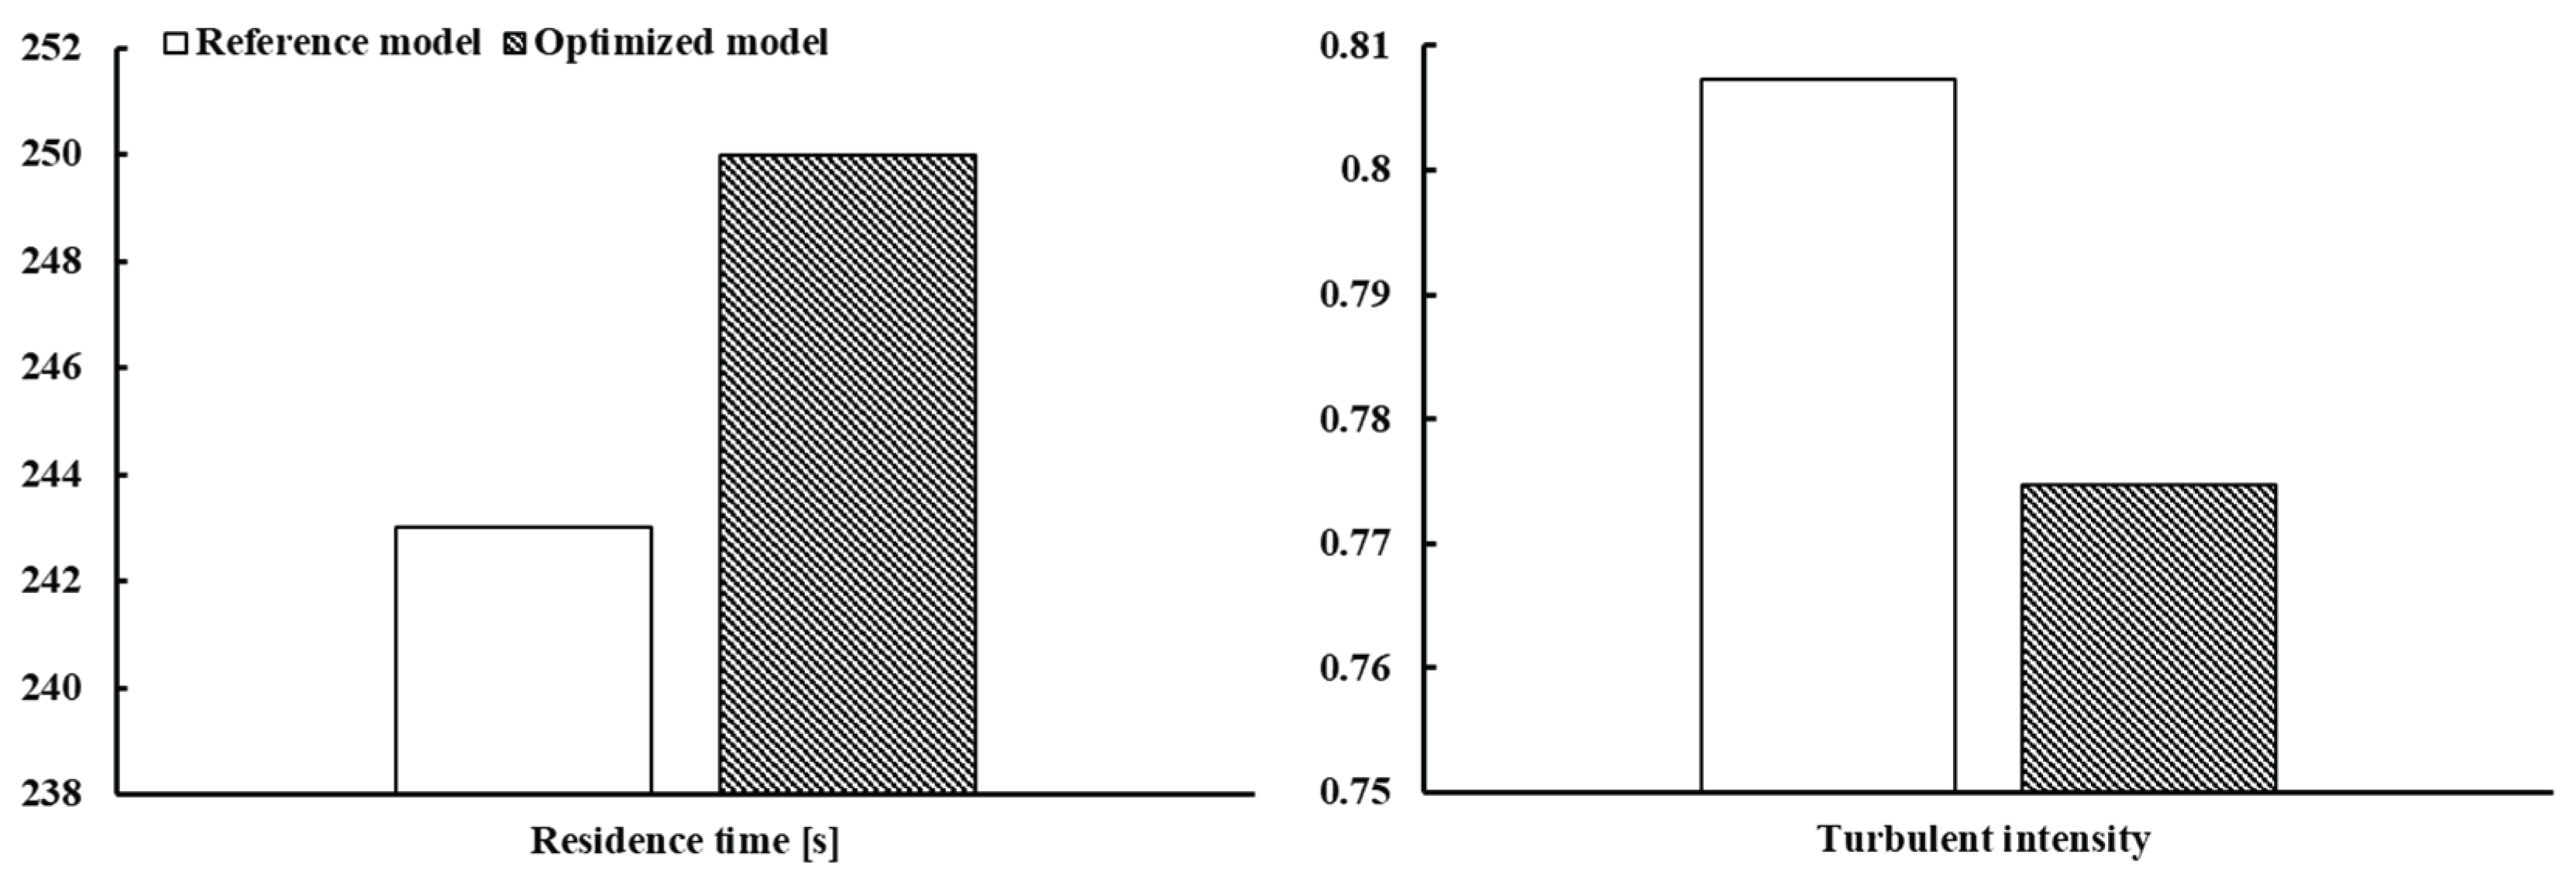
Table 1.
Material properties.
| Phase | Density [kg/m3] | Viscosity [Pa∙s] | Surface tension [N/m] |
|---|---|---|---|
| Gas | 1.225 | 1.7894×10⁻⁵ | - |
| Oil | 830 | 0.1 | 0.027 (with gas) |
| Water | 998.2 | 0.001003 | 0.072 (with gas) 0.04 (with oil) |
Table 2.
Material properties.
| Phase | Phase | Variable | Value |
|---|---|---|---|
| Inlet | Mixture | Velocity | 0.31056 m/s |
| Outlet | Gas | Gauge pressure | 0 Pa |
| Oil | Static pressure | 677.44 Pa | |
| Water | Static pressure | 1983.78 Pa |
Table 5.
Comparison of three models results.
| Case | difference [%] | ] | |
|---|---|---|---|
| Model without curvature |
0.9531 | - | - |
| Reference model | 0.9613 | 0.860 | 416 |
| Optimized model | 0.9734 | 2.13 | 633 |
| Model with the smallest curvature (Case 7) | 0.9348 | 1.92 | 81 |
| Model with the largest curvature (Case 3) | 0.9537 | 0.0630 | 1149 |
Disclaimer/Publisher’s Note: The statements, opinions and data contained in all publications are solely those of the individual author(s) and contributor(s) and not of MDPI and/or the editor(s). MDPI and/or the editor(s) disclaim responsibility for any injury to people or property resulting from any ideas, methods, instructions or products referred to in the content. |
© 2025 by the authors. Licensee MDPI, Basel, Switzerland. This article is an open access article distributed under the terms and conditions of the Creative Commons Attribution (CC BY) license (http://creativecommons.org/licenses/by/4.0/).
Copyright: This open access article is published under a Creative Commons CC BY 4.0 license, which permit the free download, distribution, and reuse, provided that the author and preprint are cited in any reuse.


