Submitted:
03 September 2025
Posted:
05 September 2025
Read the latest preprint version here
Abstract
Background: Myalgic Encephalomyelitis/Chronic Fatigue Syndrome (ME/CFS) is marked by heterogeneous symptom clusters and only partial or short-lived responses to interventions. A unifying mechanistic model which can explain either patient clusters or treatment responses has been lacking. Methods: This hypothesis generating research examined symptom cluster data from Vaes et al. (2023)[@vaes2023] and interpreted the largest clusters through the lens of paracellular gut-barrier physiology. We considered both leak and pore pathways across four regions of the gastrointestinal tract (duodenum/jejunum, ileum, proximal colon, distal colon), with special attention to the gating role of the distal colon mucus barrier. Results: Mapping cluster symptoms to regional barrier dysfunction suggests that symptom heterogeneity can be explained by a single underlying mechanism—pathological paracellular permeability—manifesting at varying sites and intensities. In this framework, all clusters show proximal colon involvement, while roughly half display additional multi-site patterns extending from the duodenum to the distal colon.
Keywords:
ME/CFS
; Myalgic Encephalomyelitis
; gut barrier
; paracellular permeability
; proximal colon
; microbial metabolites
; patient clustering
; leak pathways
; claudin pores
1. Introduction
Dr. Anouk W. Vaes and collaborators at CIRO performed one of the largest systematic surveys of ME/CFS symptom patterns, applying clustering methods to patient-reported outcomes in order to identify recurring constellations of symptoms [1]. The study demonstrated that ME/CFS can be partitioned into multiple reproducible subgroups, each with distinct symptom burdens and emphases. While this clustering approach highlighted the extent of heterogeneity in ME/CFS, it also left unresolved the question of why certain symptoms consistently co-occur, and what biological processes might underlie the observed patterns.
Here, we turn to that dataset and reinterpret the patient clusters through the lens of gut physiology in order to provide a possible mechanistic explanation for the variety of symptoms observed. This is a theoretical synthesis paper that generates specific, testable hypotheses about ME/CFS pathophysiology. We analyze existing data through a new lens to identify patterns that suggest regional gut barrier dysfunction as a unifying mechanism. While we cannot experimentally validate these hypotheses ourselves, we provide a detailed framework for the research community to test.
Our model is grounded in the subgroups reported by Vaes and established features of paracellular gut physiology:
- Two major paracellular pathways, leak and pore, can transport metabolites from the lumen into the extra-luminal space.
- The location of the open pathway along the gut (duodenum/jejunum, ileum, proximal colon, distal colon) determines which metabolites are available to be pathologically exported.
- The combination of pathway type and location shapes the resulting patient phenotype.
With these principles in place one can begin to imagine how a disorder such as ME/CFS could emerge: a single disrupted system with multiple patient presentations. The investigator’s challenge is to disentangle how specific symptom clusters reflect particular pathway–location combinations, which is the central aim of this study and the closest we can get to proof without further testing.
In the sections that follow we will:
- Review the current literature and how our model is aligned with it.
- Discuss the salient aspects of paracellular pathways.
- Describe how we performed the mapping from symptoms to pathways and locations.
- Summarize our results.
2. Literature Review
A reading of the literature for evidence for or against this model showed past research has not yet been able to specify a specific gut dysbiosis mechanism to fully explain ME/CFS symptom variability or indeed treatment variability. However, the failure of anti-inflammatories to provide more than limited relief together with the emerging successes of broad-based probiotics in long running trials does suggest that ME/CFS is a complex gut centric disease. Our reading of the literature of probiotic treatments is, generally broken down into these categories:
- Anti-inflammatories: Limited benefits
- Narrow probiotics and short term trials: Mixed results
- Broad spectrum probiotics and long term trials: More promising
A recent review of probiotic research undertaken by Jurek (2024) [2] emphasized that while disturbances of the gut microbiome are consistently observed in ME/CFS and long COVID, clinical studies of probiotics to date have shown inconsistent or modest effects. We quote from Jurek (2024) who notes the limited benefit in narrow probiotic targeting but ends with this observation:
“Nevertheless, the emerging strategy of combining multi-strain probiotics with other functional ingredients previously implicated with anti-inflammatory and anti-oxidative properties (e.g., polyphenols, omega-3 fatty acids, vitamin D, l-carnitine, and coenzyme Q10) is a promising approach that may offer significant advantages for not only reducing fatigue but also increasing the well-being of patients with post-viral syndromes.” [2]
Stallmach et al. (2024) [3] critically evaluated the microbiome’s role in ME/CFS and noted that despite consistent associations with immunometabolic shifts and barrier dysfunction, no causal relationship has yet been established, highlighting the urgent need for targeted probiotic strategies grounded in mechanistic understanding rather than broad empirical use.
We believe our framework aligns with emerging research and may help to fill the mechanistic gap Stallmach is searching for.
We note that the studies we have seen regarding ME/CFS appear to all be lacking significant testing for or against the involvement of the small intestine or the proximal colon specifically. This point will become important in critical evaluation of our results, below, and we’ll fully discuss this fully in Results, below.
3. Paracellular Pathways
To fully explain our model we must review our understanding of paracellular pathways in the gut before we can discuss our methods. Two major paracellular pathway types are recognized in the gut epithelium: claudin pores and the leak pathway [4,5].
3.1. Locations
Claudin pores are expressed throughout the gastrointestinal tract, from the stomach to the distal colon. Leak pathways can also open at these same regions.
While the stomach has both types of pathways we ignore them for our model because we were unable to find evidence of associated symptoms to ME/CFS from these pathways. Perhaps this is due to the scarcity of bacteria except for the now famous H. pylori found by Barry Marshall and J. Robin Warren in 1983 [6].
3.2. Characteristics
We characterize each pathway by:
- The size range of molecules transported
- Charge selectivity (cations, anions, or both)
- Whether they can be activated independently of overt inflammation
- Mechanisms of closure or deactivation
In normal physiology, claudin pores accelerate the passage of small, charged molecules in a tightly regulated manner, while the leak pathway accommodates larger, less selective solutes during processes such as epithelial turnover. When dysregulated, these same routes can become conduits for gut-derived metabolites.
- Anion-selective pores favor lactate and other organic acids.
- Cation-selective pores favor histamine and polyamines.
- Leak pathway is less selective, admitting medium to large molecules during periods of inflammation or cytoskeletal stress [7].
In contrast to claudin pores, leak pathways do not provide high-conductance channels for ions. Their permeability is passive and limited to existing gradients, so they do not drive rapid entry of small charged metabolites. As a result, leak can admit ions and small solutes, but not at the rate or efficiency seen with pore pathways.
Chronic dysbiosis may alter not only pore signaling but, with time, pore distribution. In this case, the number and type of pores present in each gut segment may shift, and clinical symptom improvement may require months for epithelial remodeling to stabilize into a new healthy population of channels.

Table 1.
Summary of Gut Paracellular Pathways
| Pathway | Size Range | Activation | Closure/Deactivation |
| Leak | Up to a few kDa | Inflammatory / cytoskeletal stress | Requires resolution of inflammation / cytoskeletal reset |
| Anion Pore | Small molecules (< 6–8 Å) | Claudin isoform–specific signals | Rapid closure via tight junction proteins |
| Cation Pore | Small molecules (< 6–8 Å) | Claudin isoform–specific signals | Rapid closure via tight junction proteins |
These pathways are not mutually exclusive—simultaneous opening of leak and pore routes provides an explanation for the partial effects of interventions that address only one pathway [4] as well as symptom complexity.
3.3. Pathway Interventions
Understanding how each pathway does or does not respond to interventions such as anti-inflammatories is key to interpreting our framework proposal in light of existing research.
Leak: Experimental physiology shows that leak pathway openings are driven primarily by inflammatory and cytoskeletal processes [7]. These can be rapidly reversed once inflammation resolves, but they do not close in response to ion-channel or charge-selective signals.
Pore: In contrast, pore-mediated transport is regulated by claudin-specific, charge-selective signaling [4,5]. These pores can open or close independently of inflammation, often with rapid gating in response to ionic or metabolic cues, even in the absence of inflammation.
Thus, interventions that resolve inflammation act most directly on the leak pathway, whereas interventions that modulate charge-selective signaling act on pores.
3.4. Mucosal Membrane
The presence or absence of a healthy mucosal membrane in the distal colon will prevent or enable both the leak and pore paths from being able to flood metabolites outside of the lumen, as well as contain gaseous metabolites. This is an important distinction which is needed to fully understand the symptom alignments we’ll discuss below.
3.5. Established vs. Emerging Disorders
Paracellular barrier dysfunction is well established in a range of gastrointestinal diseases. Inflammatory bowel disease, celiac disease, and irritable bowel syndrome all demonstrate reproducible evidence of leak and pore activity. In these conditions, barrier dysfunction has moved from speculation to accepted mechanism, guiding both diagnostic and therapeutic research. These diseases are marked by being obviously gut-centered and having strong paracellular disruption.
Emerging research points us to a second, less intense, tier of barrier dysfunction, in which the barriers do not break down to the same degree and which may not present as GI diseases at all.
Intestinal barrier dysfunction has been associated with various diseases, from autoimmune (inflammatory bowel diseases [IBDs], type 1 diabetes mellitus, celiac disease, multiple sclerosis, etc.) to neurological ones (mood disorders, autism spectrum disorders, Parkinson’s disease, Alzheimer’s disease), playing the role of a primer or aggravating factor in their evolution. Camilleri (2021). [8]
Our hypothetical ME/CFS framework makes this the central and first real inferential step from established pathology and physiology and into the emergent: That ME/CFS requires gut barrier disruption which is significant enough to leak metabolites out of the lumen but, mostly, not significant enough to evidence itself as a gut-centric disease.
In order to demonstrate how this framework fits ME/CFS, we will illustrate how the Vaes clusters would map to regions, pathways and metabolites.
4. Symptom Path Mapping
Vaes (2023) reported 40 distinct patient clusters, ranging from low-symptom groups to subgroups dominated by cognitive, autonomic, gastrointestinal, or neuroinflammatory features. These clusters were reproducible across analyses, and subsequent work has broadly confirmed the stability of this subgrouping approach. The present study relies upon the original subtype tables and uses them as the basis for a mechanistic interpretation.
To interpret the Vaes clusters through gut-barrier physiology, we define several working assumptions. We note that these are not proven assumptions, but a starting point for generating our symptom path maps:
- Most ME/CFS symptoms directly arise from gut-derived metabolites entering the extra-luminal space.
- Histamine-related symptoms reflect cation-selective pore activity.
- Leak pathways enable only limited movement of ionic compounds compared to pores.
- Pore channels permit high-conductance flux at a rate proportional to their population in the lumen.
- Distal-colon permeability requires breakdown of the protective mucosal layer.
Previous efforts for other diseases have attempted to associate symptoms with specific metabolites, but to our knowledge this is the first attempt to map symptoms simultaneously to either pathway type or anatomical location. This necessarily involves inferential steps and will require prospective clinical validation.
We acknowledge that many different causes for ME/CFS have been put forth such as mitochondrial dysfunction or immunological agents. We don’t actually mean to prove by our methods here that they are not primary. Rather, that for the purposes of generating a hypothetical symptom, barrier, metabolite mapping we put them aside, as we do for secondary effects. The resulting complexity of the model then becomes impossible to assess.
4.1. Expectations
We must first describe what we expect to find for each type of pathway dysfunction and location before we can illustrate our findings. This requires two steps:
- Linking the location, metabolites and paths
- Linking the location, symptoms and paths
The first step (metabolite assignment) follows established physiology, whereas the second step (symptom assignment) is inferential and should be considered hypothesis-level. The strength of metabolite-to-symptom evidence varies: some associations are well-established in human disease, others are supported only by preclinical or mechanistic data. The complete list of metabolites, their supporting evidence, and references are provided in Appendix A.
We start with location and most significant metabolites, relying on pore channels to excel at transporting charged particles vs. leak pathways.
Table 2.
Expected metabolite exposures by location and pathway dysfunction (ions excluded from leak).
Table 2.
Expected metabolite exposures by location and pathway dysfunction (ions excluded from leak).
| Location | Leak metabolites (larger/relatively uncharged) | Pore metabolites (small, charged) |
|---|---|---|
| Duodenum/Jejunum | Dietary/microbial peptides; endotoxin fragments (LPS pieces); acetaldehyde | D-lactate−; histamine+; ammonium+; small bile-acid anions |
| Ileum | Microbial peptides; antigenic fragments; partially deconjugated bile acids (neutral fraction) | Bile-acid anions; tryptamine/serotonin-pathway small ions/amines |
| Proximal Colon | Microbial peptides; endotoxin fragments; larger fermentation products (neutral phenolics) | SCFA anions (acetate−, propionate−, succinate−); D-lactate-;histamine+ |
| Distal Colon* | Neutral aromatic phenolics (e.g., p-cresol); indole/phenyl derivatives; endotoxin fragments | Indoxyl sulfate−; p-cresyl sulfate−; thiosulfate− |
* Distal colon permeability is conditional on mucus barrier breakdown.
With the expected metabolites, location and pathway in place we extrapolate which symptoms each pathway may contribute based on the expected metabolite.
Table 3.
Expected symptom patterns by location and pathway dysfunction.
| Location | Leak Symptoms | Pore Symptoms |
|---|---|---|
| Duodenum/Jejunum | GI distress, alcohol/smell intolerance, post-prandial fatigue | Acute dizziness, anxiety, dysautonomia, rapid brain fog from D-lactate/histamine |
| Ileum | Bile acid diarrhea, abdominal pain, immune flares | Sleep rhythm disturbance, mood instability (bile acids, tryptamine spill) |
| Proximal Colon | Systemic malaise, low-grade inflammation, diffuse fatigue | Heaviness, orthostatic intolerance (succinate, SCFAs) |
| Distal Colon* | Toxic-feeling flares, chemical/odor sensitivity, inflammatory hits | Severe brain fog, vascular headaches, pruritus, dizziness, nausea (indoxyl sulfate, p-cresyl sulfate, sulfide) |
* Distal colon symptoms conditional on mucus barrier breakdown.
4.2. Gaseous Metabolites
Certain small molecules whose symptoms are relevant to ME/CFS are not restricted to leak or pore pathways, but cross the epithelium directly by diffusion. The most important candidates are hydrogen sulfide (H2S) and ammonia (NH3/NH4+). Ammonia and hydrogen sulfide are produced throughout the gut, but under normal physiology they are either detoxified locally or sequestered by the distal colonic mucus barrier. They become clinically relevant only when that mucus barrier is disrupted, allowing them to diffuse across the epithelium in toxic amounts.
- H2S is generated in the distal colon by sulfate-reducing bacteria. Normally detoxified by colonocytes, it becomes clinically relevant when the distal mucus layer is disrupted, producing headache, dizziness, and nausea.
- Ammonia is produced by urea-splitting bacteria throughout the gut. In equilibrium, the uncharged NH3 fraction can diffuse across membranes, while the NH4+ fraction requires pore-mediated transport. Excess systemic exposure is associated with confusion, fatigue, and mood disturbance.
These gaseous metabolites represent a third class of permeability risk, conditional on both mucus integrity and local detoxification capacity. For simplicity in our model we assume the distal colon to be the most likely source and only when the mucous membrane is disturbed.
Table 4.
Gaseous metabolites relevant to ME/CFS.
| Gas | Source organisms/location | Transport route | Symptom associations |
|---|---|---|---|
| H2S | Sulfate-reducing bacteria (e.g., Desulfovibrio) in distal colon | Passive diffusion across membranes (conditional on mucus loss) | Headache, dizziness, nausea, “toxic” flare sensations |
| NH3 / NH4+ | Urease-positive bacteria (e.g., Proteus, Klebsiella, E. coli) throughout gut | NH3 diffuses freely; NH4+ requires pores | Confusion, mood lability, irritability, fatigue |
4.3. Symptom Evidence Summary
To clarify the strength of clinical support, we stratified metabolites into two categories: Established, where symptom associations are documented in patients (ME/CFS or other human diseases), and Mechanistic, where links are biologically plausible but not yet validated in human cohorts.
Table 5.
Metabolite Symptom Evidence Summary
| Metabolite | Key Symptoms Associated | Evidence Level | Notes (Human Disease Context) |
| Acetaldehyde | Cognitive fog, headache, dizziness, GI discomfort | Mechanistic | Preclinical and case-level data (yeast, alcohol intolerance); no large cohort validation. |
| Ammonia / Ammonium (NH3) | Confusion, cognitive dysfunction, fatigue | Established | Robust evidence in hepatic encephalopathy and urea cycle disorders. |
| Bile acids | Diarrhea, urgency, circadian/mood disturbance | Established | Bile acid diarrhea, ileal resection, IBS-D. |
| D-lactate | Neurocognitive dysfunction, dizziness, fatigue, acidosis | Established | Documented in D-lactic acidosis and dysbiosis syndromes. |
| Histamine | Flushing, tachycardia, anxiety, pruritus, headaches | Established | Strong clinical links in MCAS, allergy, IBS, IBD. |
| Hydrogen sulfide (H2S) | Headache, nausea, sensory overload, visceral pain | Mechanistic | Strong toxicology/preclinical evidence; no direct human cohort validation. |
| Indoxyl sulfate | Fatigue, vascular dysfunction, neurocognitive effects | Established | Major uremic toxin in CKD; robust patient-level data. |
| LPS fragments / peptides | Inflammatory malaise, fever, gut permeability, fatigue | Established | Elevated in IBD, sepsis; systemic inflammation in patients. |
| Neutral phenolics (generic fermentation products) | Cognitive fog, gut irritation, behavioral effects | Mechanistic | Mostly preclinical; only p-cresol itself has strong human evidence. |
| p-Cresol | Cognitive fog, gut irritation, behavioral symptoms | Established | Elevated in autism and CKD patient cohorts. |
| p-Cresyl sulfate | Fatigue, vascular and CNS dysfunction | Established | Major uremic toxin in CKD; robust clinical evidence. |
| SCFAs (acetate, propionate, succinate) | Heaviness, fatigue, “crash” symptoms, inflammation | Established | Succinate (colitis), propionate (autism), acetate (systemic energy regulation). |
| Thiosulfate | Headache, nausea, sensory burden, GI pain | Mechanistic | Detected in humans as a sulfide metabolite marker, but weak symptom-level data. |
| Tryptamine / serotonin-pathway amines | Mood disturbance, circadian disruption, sleep issues | Mechanistic | Microbiome and preclinical links; human associations indirect, causality unproven. |
4.4. Mapping Procedure
- Data source: Symptom severity from Vaes (2023).
- Exclusion: Remove PEM and fatigue, as these are non-specific across clusters.
- Order of analysis: Leak → Pore → Gas → Anatomical location. Clusters may receive multiple assignments if multi-system burden is evident.
-
Pathway assignments:
- Leak (PCx): Inflammatory pain, malaise, pressure-type burdens.
-
Pore:
- −
- DJ: Alcohol/smell intolerance, dizziness, anxiety (histamine, D-lactate).
- −
- IL: Diarrhea, mood/circadian disturbance (bile acids, tryptamine).
- −
- PA (PC anion pore): SCFA/succinate features (heaviness, crash-like fatigue).
- −
- PC (PC cation pore): Orthostatic intolerance, autonomic dysfunction.
- Gas (DC): Sensory overload, vascular headache, chemical sensitivity, pruritus; requires severe GI burden and presumed mucus breakdown.
-
Strength levels:
- ++ = dominant or multiple relevant symptoms.
- + = moderate/secondary evidence.
- – = absent.
5. Results
5.1. Vaes Patient Cluster Mapping
Assigning symptoms from Vaes (2023) to specific metabolites and pathways necessarily involves subjective interpretation, and our inferences should be viewed as provisional. Some symptoms, such as fatigue, map plausibly to anionic pore transport of multiple metabolites, while others are less straightforward. Despite this uncertainty, the overall framework provides strong explanatory power for the observed heterogeneity and merits refinement in future studies.
We emphasize that these mappings were done after removing PEM/fatigue symptoms. This will become relevant in the next section. We use only mean symptom severity for the 13 largest clusters numbered from 2-40.
Table 6.
Cluster mapping to regional pathways by cluster ID
| Vaes cluster (n) | DJ-pore (–) | DJ-leak | IL-pore (–) | IL-leak | PC-pore (–) | PC-pore (+) | PC-leak | DC-pore (–) | DC-leak | DC-gas | Rationale |
| 2 (24) | – | – | – | – | – | – | – | – | – | – | Low-burden profile; little to localize. |
| 4 (23) | – | – | – | – | ++ | – | + | – | – | – | Orthostatic HR → PC-pore (–); inflammatory “drag” → PC-leak. |
| 7 (30) | – | – | – | – | ++ | + | – | – | – | – | Cognition-dominant → PC-pore (–); minor autonomic hints → PC-pore (+). |
| 9 (26) | ++ | – | – | – | + | – | – | – | – | – | Alcohol/smell intolerance, dizziness → DJ-pore (–); minor PC-pore (–) plausible. |
| 11 (17) | – | – | ++ | – | + | – | – | – | – | – | Day–night/mood + loose stools → IL-pore (–); occasional PC-pore (–). |
| 19 (19) | – | – | – | – | – | – | – | – | – | – | Low symptom load; unassigned. |
| 24 (43) | – | – | – | – | ++ | – | + | – | – | – | Sound sensitivity/sleep + PEM → PC-pore (–); inflammatory fatigue hints → PC-leak. |
| 26 (18) | – | – | – | – | + | – | ++ | – | – | – | Temperature/pressure pain → PC-leak++; some autonomic → PC-pore (–). Distal-colon gas less likely without severe GI. |
| 28 (38) | – | – | – | – | – | – | – | – | – | – | Low, nonspecific. |
| 31 (15) | ++ | – | – | – | + | – | – | – | – | – | “Stomach/bowel” + mast-cellish sensitivities → DJ-pore (–); PC-pore (–) possible. |
| 36 (10) | + | – | + | – | ++ | ++ | + | ++ | + | ++ | Highest burden: broad multi-pathway involvement; DJ/IL contributions; PC-pore (–/+) and PC-leak; DC-pore/leak present; DC-gas++ justified by severe burden/mucus loss. |
| 37 (18) | – | – | – | – | – | – | – | – | – | – | Lowest burden; unassigned. |
| 40 (20) | – | – | + | – | – | – | + | – | – | – | Diarrhea/sleep/mood → IL-pore (–); inflammatory drag → PC-leak. |
Legend
- DJ-pore (–): Duodenum/jejunum, anion-selective pore (histamine, D-lactate).
- DJ-leak: Duodenum/jejunum leak (larger peptides, acetaldehyde).
- IL-pore (–): Ileum, anion-selective pore (bile acids, tryptamine).
- IL-leak: Ileum leak (antigenic peptides, immune activation).
- PC-pore (–): Proximal colon, anion-selective pore (succinate, SCFAs).
- PC-pore (+): Proximal colon, cation-selective pore (histamine, polyamines).
- PC-leak: Proximal colon leak (inflammatory “drag,” pressure pain).
- DC-pore (–): Distal colon pore (aromatic phenolics, sulfates, conditional on mucus loss).
- DC-leak: Distal colon leak (endotoxin fragments, aromatic phenolics, mucus loss required).
- DC-gas: Distal colon gaseous metabolites (H2S, NH3), only when mucus integrity fails.
5.2. Vaes Clusters by GI Location
The table, above, was sorted in order of the Vaes cluster IDs, but we noticed significant clustering around locations, so we create a new heat map to better visualize the clusters according to occurrence in the gut. We sort them below by “first seen” symptoms, and count each plus (from the table above) as adding 1 to the heat map. There is a clear association of symptoms by location in the gut, except for the clusters with the weakest and most severe symptoms.
Figure: Cluster to Location Heat map
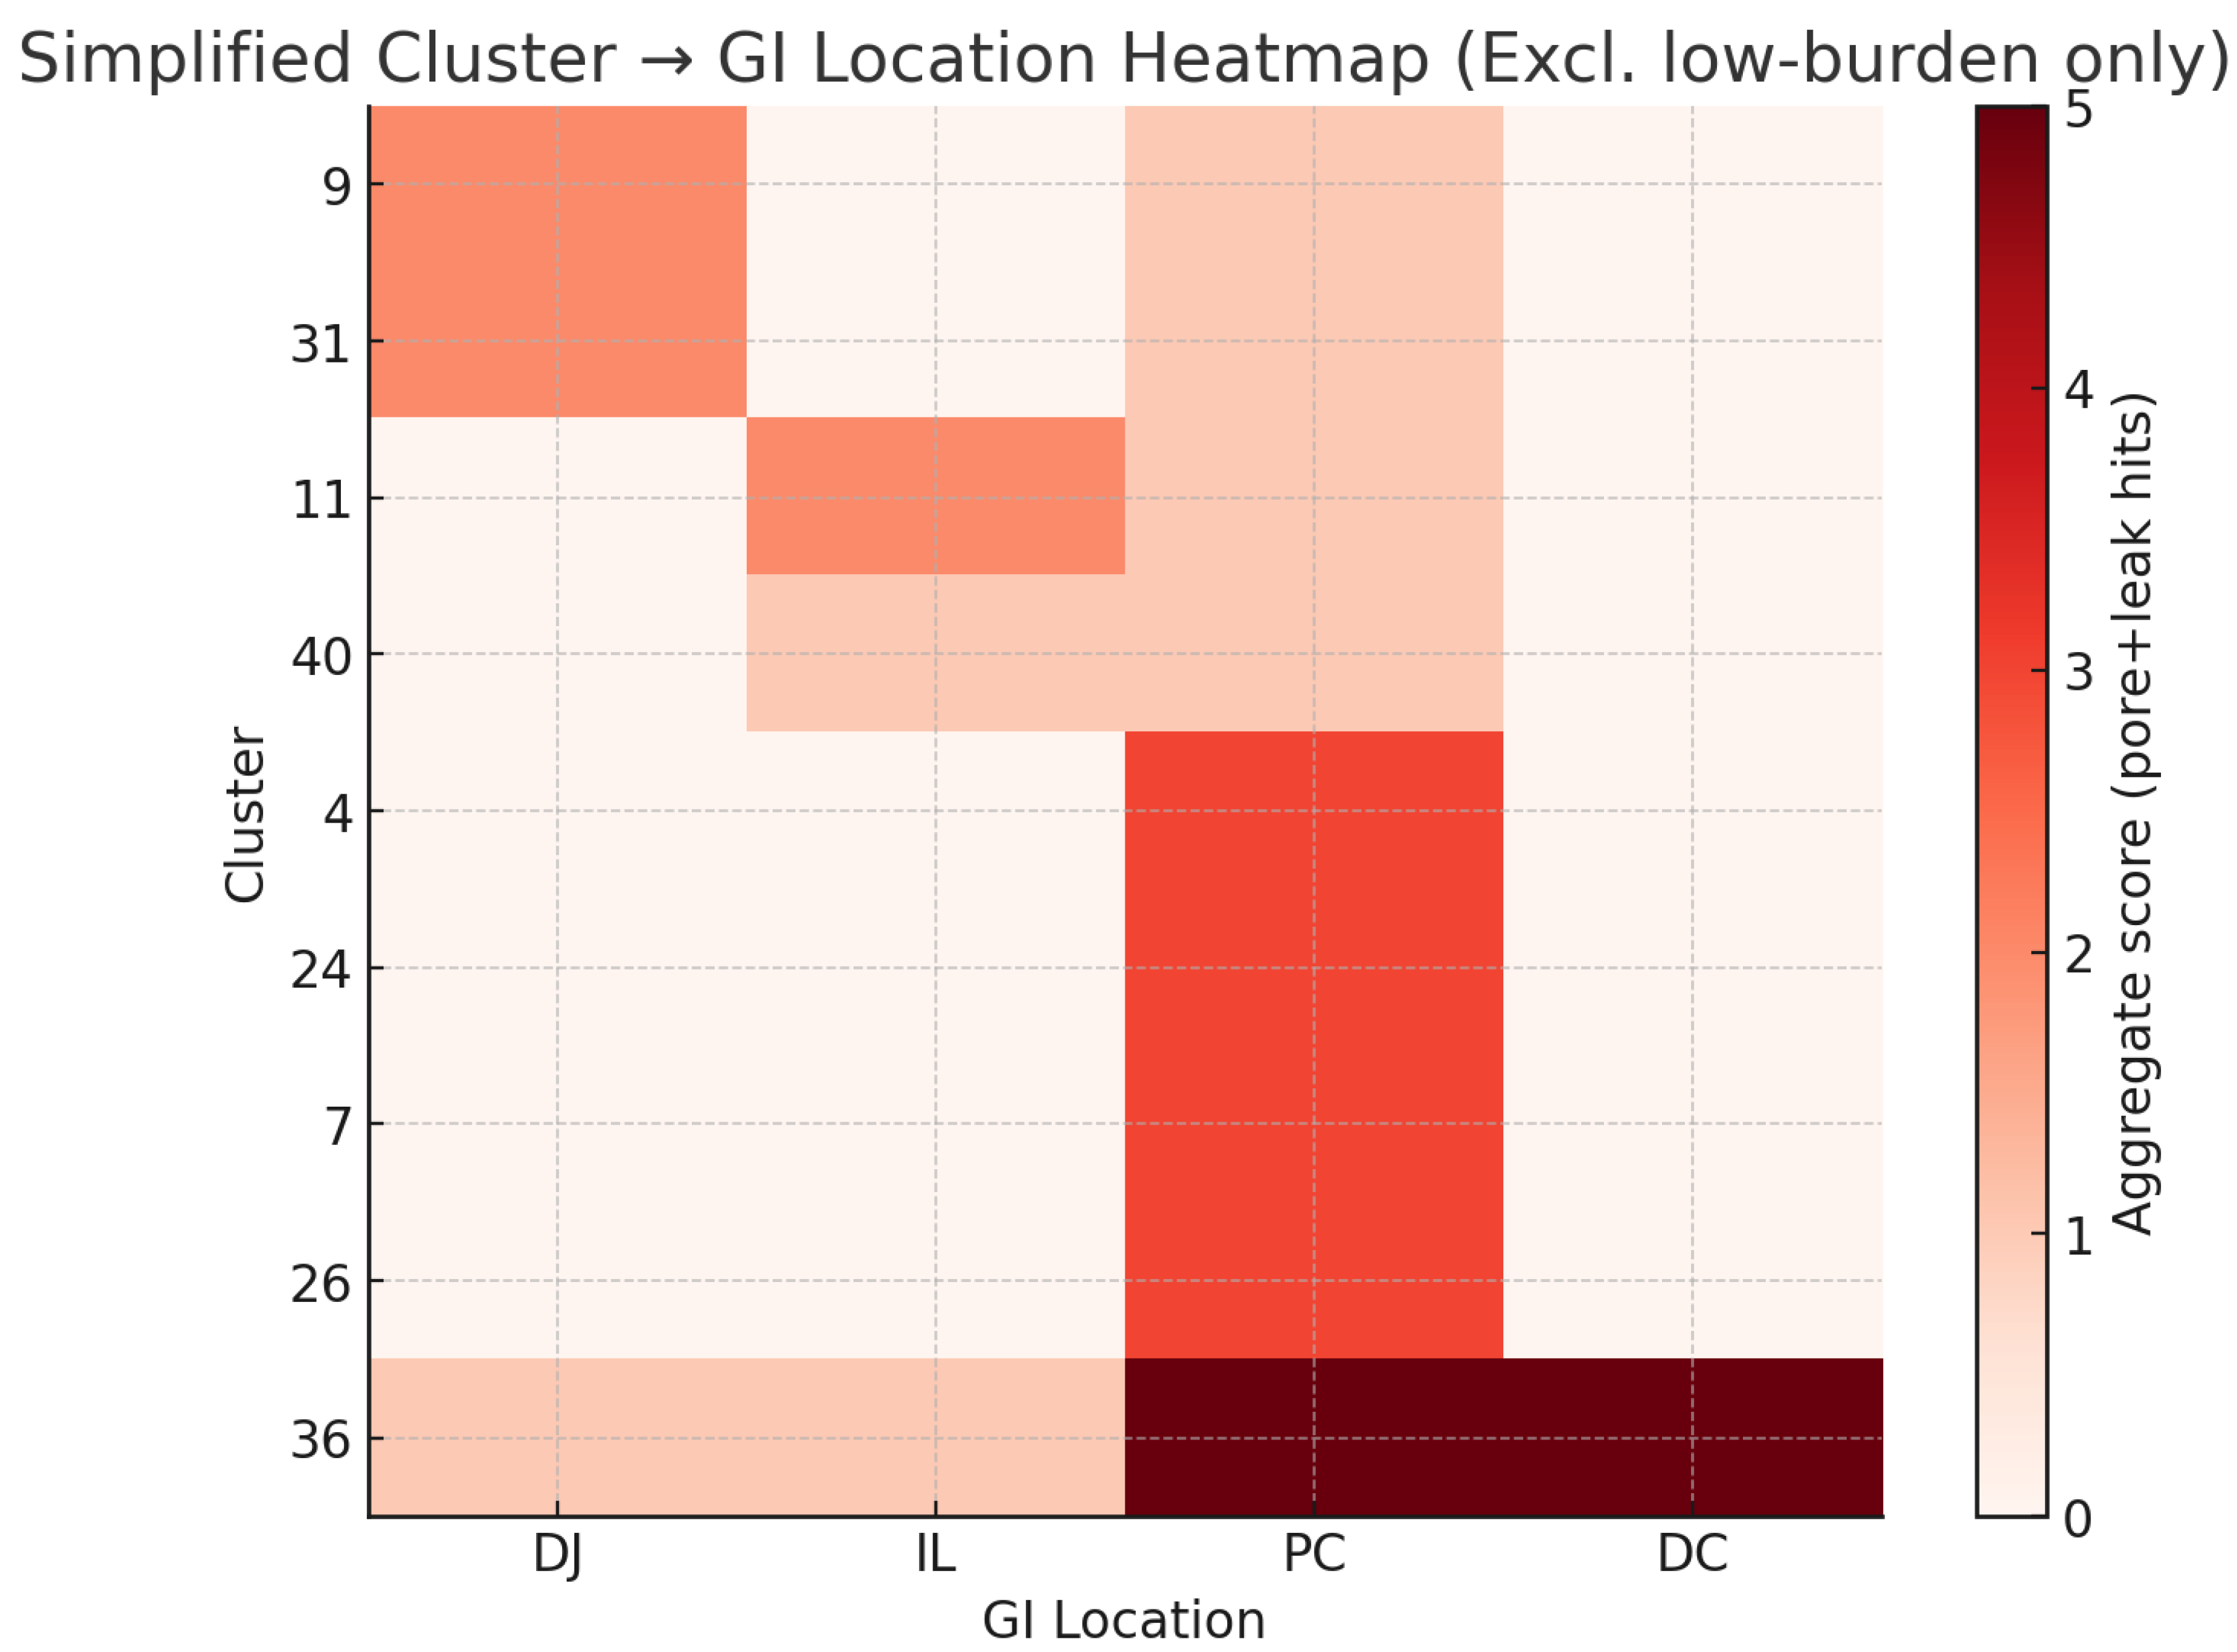
Figure 1.
GI Location Heat Map.
The heat map shows that all clusters involve the proximal colon, even with PEM and fatigue excluded. Clusters 9 and 31 localize primarily to the duodenum/jejunum, while clusters 11 and 40 are associated with the ileum. Cluster 36 reflects broad dysfunction across the entire GI tract. In contrast, clusters 4, 7, 24, and 26 appear to be single-site clusters.
We further note that the number of proximal colon signals increase from the top of the chart to the bottom, perhaps indicating the intensity of the proximal colon symptoms is not directly tied to the intensity of the duodenum or ileum symptoms.
5.3. Sensitivity Analysis
When restricted to established metabolites only, the overall mapping remained stable: proximal colon signals persisted across clusters, and multi-site involvement remained frequent, though assignments tied to ileal tryptamine and distal-colon H2S/thiosulfate weakened.
5.4. Result Summary
This model provides a structured framework for interpreting ME/CFS involvement with gut barrier dysfunction with the following hypothesized features, when we remove the mildest symptom clusters:
- Proximal colon signals ME/CFS even after exclusion of PEM and fatigue from the mapping process.
- Five clusters show evidence of multiple site involvement.
- Four clusters did not show clear evidence of multi-site involvement.
5.5. Proximal Colon
The prominence of the proximal colon in our results should be viewed with caution. Because this region generates the richest diversity of microbial metabolites, its signals in the map and table above could be critically interpreted in several ways:
- Causative: The multiple metabolite flood and dysbiosis is exactly what is needed to explain ME/CFS.
- Coincidental: So many suspects with so many possible symptoms makes it impossible not to find clusters with similar signals.
- Accidental: The proximal colon signals could be an artifact of our mapping of symptoms to metabolites without stronger clinical evidence for each metabolite.
We cannot disambiguate these possibilities from literature reading alone, and will need to rely on future research to make a final determination, and repeat ourselves in mentioning that we are unable to find prior evidence for or against proximal colon involvement in ME/CFS. We discuss this gap more fully below.
5.6. The Proximal Colon in Literature
The absence of evidence for or against proximal colon involvement in ME/CFS research may reflect methodological limitations rather than true absence of pathology. Current gut assessment methods have critical blind spots:
Standard fecal testing limitations: - Fecal samples represent the distal colon/rectal microbiome after extensive bacterial modification - Metabolites produced in the proximal colon are absorbed or metabolized before reaching stool - Transit time (24-72 hours) means fecal samples cannot capture real-time proximal colon events
Intestinal permeability tests miss the proximal colon: - The lactulose/mannitol test primarily assesses small intestinal permeability, with sugars absorbed before reaching the colon - 51Cr-EDTA testing provides whole-gut permeability but cannot differentiate regional dysfunction - No validated clinical test specifically measures proximal colon barrier function
Procedural and practical constraints: - Full colonoscopy to the cecum (required for proximal colon access) is more invasive and costly than sigmoidoscopy - Proximal colon biopsies are rarely taken in research due to increased procedural risk and patient burden - Wireless capsule endoscopy provides imaging but cannot sample tissue or measure permeability
Metabolomic timing issues: - Serum metabolomics reflects post-hepatic processing, obscuring gut regional origins - Portal vein sampling (which would show pre-hepatic metabolites) is too invasive for ME/CFS research
These methodological constraints mean proximal colon dysfunction could be common in ME/CFS yet remain completely undetected by current standard protocols. This identifies a critical gap in how ME/CFS has been studied to date and presents a prime opportunity for future research to validate or invalidate the hypothesis of proximal colon involvement.
6. Discussion
This framework offers a path to reconcile how ME/CFS is anchored by two near-universal symptoms (PEM and brain fog) while at the same time presenting as a constellation of heterogeneous syndromes with little apparent connection to one another in terms of symptoms or biomarker evidence.
Being self-critical we acknowledge that while we feel this model is aligned with patient subtypes, and interventional trials the number of inferences needed to accept this framework as explanatory of ME/CFS symptoms are significant.
Lastly, we include in Appendix B evidence for stratification of CRP biomarkers in ME/CFS patients which may align well with our framework.
7. Conclusions
We have proposed an ambitious inferential model for ME/CFS that is aligned with known gut physiology and situated between established gut-barrier disorders and emerging research but lacks substantial clinical validation. The model suggests that ME/CFS symptom clusters can be coherently explained by:
- Proximal colon dysfunction as the base layer.
- Regional dysfunction elsewhere in the gut explain additional symptoms.
- Distal colon involvement contingent on mucus breakdown, serving as a gating mechanism.
This regional model helps to reconcile the paradox of near-universal symptoms (PEM and brain fog) alongside striking heterogeneity, by identifying the proximal colon as a common denominator while attributing cluster-specific features to additional sites of dysfunction. These dysfunctions could be seen as multiple, simultaneous pathologies, but the underlying gut pathway framework with the required involvement of the proximal colon ties them together into a single explanatory model.
What has long appeared as a patchwork of unrelated syndromes may instead reflect a single anatomical gradient along the gut.
Framed this way, gut-barrier pathways provide a coherent lens through which to reinterpret both symptom clustering and the mixed results of interventional studies. This framework highlights testable hypotheses for biomarker development and future clinical trials. It may also provide structural context to unify research in ME/CFS, long-COVID, and assist in understanding overlapping symptom clusters in conditions such as ADHD and bipolar disorder.
Appendix A. Metabolites, Symptoms and Paths
The full list of metabolites, their key symptoms and the smallest pathway they would take are below.
In developing the pathway–location framework, we began with a broad list of gut- and microbiome-derived metabolites that have been associated with inflammation, fatigue, or neurocognitive symptoms in ME/CFS, long COVID, and related conditions. This initial list included dozens of candidates reported in the literature, ranging from small charged acids and amines to larger peptides, lipopolysaccharide fragments, and fermentation products.
For the purposes of cluster mapping, however, we reduced this list to a smaller subset. The reduction followed three criteria:
- Pathway feasibility — excluded molecules too large or otherwise implausible for passage via leak or pore routes.
- Gut origin plausibility — excluded metabolites lacking a credible microbial or dietary source in the gut.
- Phenotypic specificity — excluded metabolites whose symptom associations were redundant with better-documented candidates.
The reduced set (presented in the main text “Expectations” tables) was then used for symptom-to-pathway assignments. The broader list is included here for completeness, together with literature references for metabolite origin, pathway feasibility, and symptom associations.
Table A1.
Metabolite, Symptom and Pathway Details
| Metabolite | Key Symptoms | Pathway |
| Acetaldehyde*1 | headache, flushing, nausea, brain fog | Leak |
| Bile acids (deconjugated)*2 | gastrointestinal problems, barrier dysfunction, abdominal pain, fatigue | Leak |
| Indoxyl sulfate*3 | fatigue, vascular dysfunction, pruritus, sleep problems | Leak |
| p-Cresol sulfate*4 | cognitive problems, fatigue, headache | Leak |
| Serotonin (5-HT)*5 | nausea, gastrointestinal problems, anxiety, headache, sleep problems | Leak |
| Norepinephrine*6 | tachycardia, anxiety, insomnia, gastrointestinal problems | Leak |
| Acetate**7 | fatigue, gastrointestinal problems | Pore-Anion |
| D-lactate | fatigue, brain fog, coordination problems, confusion, headache, nausea | Pore-Anion |
| Succinate**8 | fatigue, inflammation, brain fog, abdominal pain, GI problems | Pore-Anion |
| Formate**9 | headache, visual disturbances, dizziness, fatigue, confusion, nausea | Pore-Anion |
| Propionate**10 | fatigue, nausea, brain fog | Pore-Anion |
| Ammonium (NH4+) | brain fog, drowsiness, irritability, nausea, headache | Pore-Cation |
| Cadaverine**11 | nausea, gastrointestinal problems, dizziness, headache | Pore-Cation |
| Histamine | flushing, tachycardia, pruritus, GI problems, anxiety, sleep | Pore-Cation |
| Tyramine | migraine, blood pressure swings, palpitations, anxiety, insomnia | Pore-Cation |
| Putrescine**12 | GI problems, cognitive problems, headache, irritability | Pore-Cation |
Legend:
No mark = clinically established;
= supported in human disease contexts;
* = preclinical/mechanistic anchors.
Appendix B. CRP Strata in ME/CFS
In light of our emergent hypothetical framework we want to include this uniquely useful study as corroborating evidence as well as perhaps a guide for further research.
Groeger et al. (2013) [29] measured the effects of Bifidobacterium infantis 35624 on plasma CRP, TNF-, and IL-6 in psoriasis, ulcerative colitis, and CFS/ME. The CFS/ME group exhibited a striking multi-modal CRP distribution: one subgroup spreading from control levels to 2.0 mg/L, a second at 4.0 mg/L, and a third around 20 mg/L. This layered pattern supports the possibilities of either multiple simultaneous leak sites or of different sites showing different levels of CRP activation. There is also, arguably, a split between the 4.0 mg/L group and another just above it at about 5.0 mg/L
The curious tri-modal CRP distribution observed by Groeger et al. (2013) currently lacks explanation in the ME/CFS literature. Our framework suggests a possible interpretation: each CRP tier may represent different combinations of regional involvement and pathway activation. While we cannot map specific CRP levels to specific regions without further research, the existence of distinct inflammatory strata rather than a continuous distribution may help quantify our hypothesis of discrete pathological patterns rather than a single disease process with varying severity.
Figure A1.
CRP Stratification.
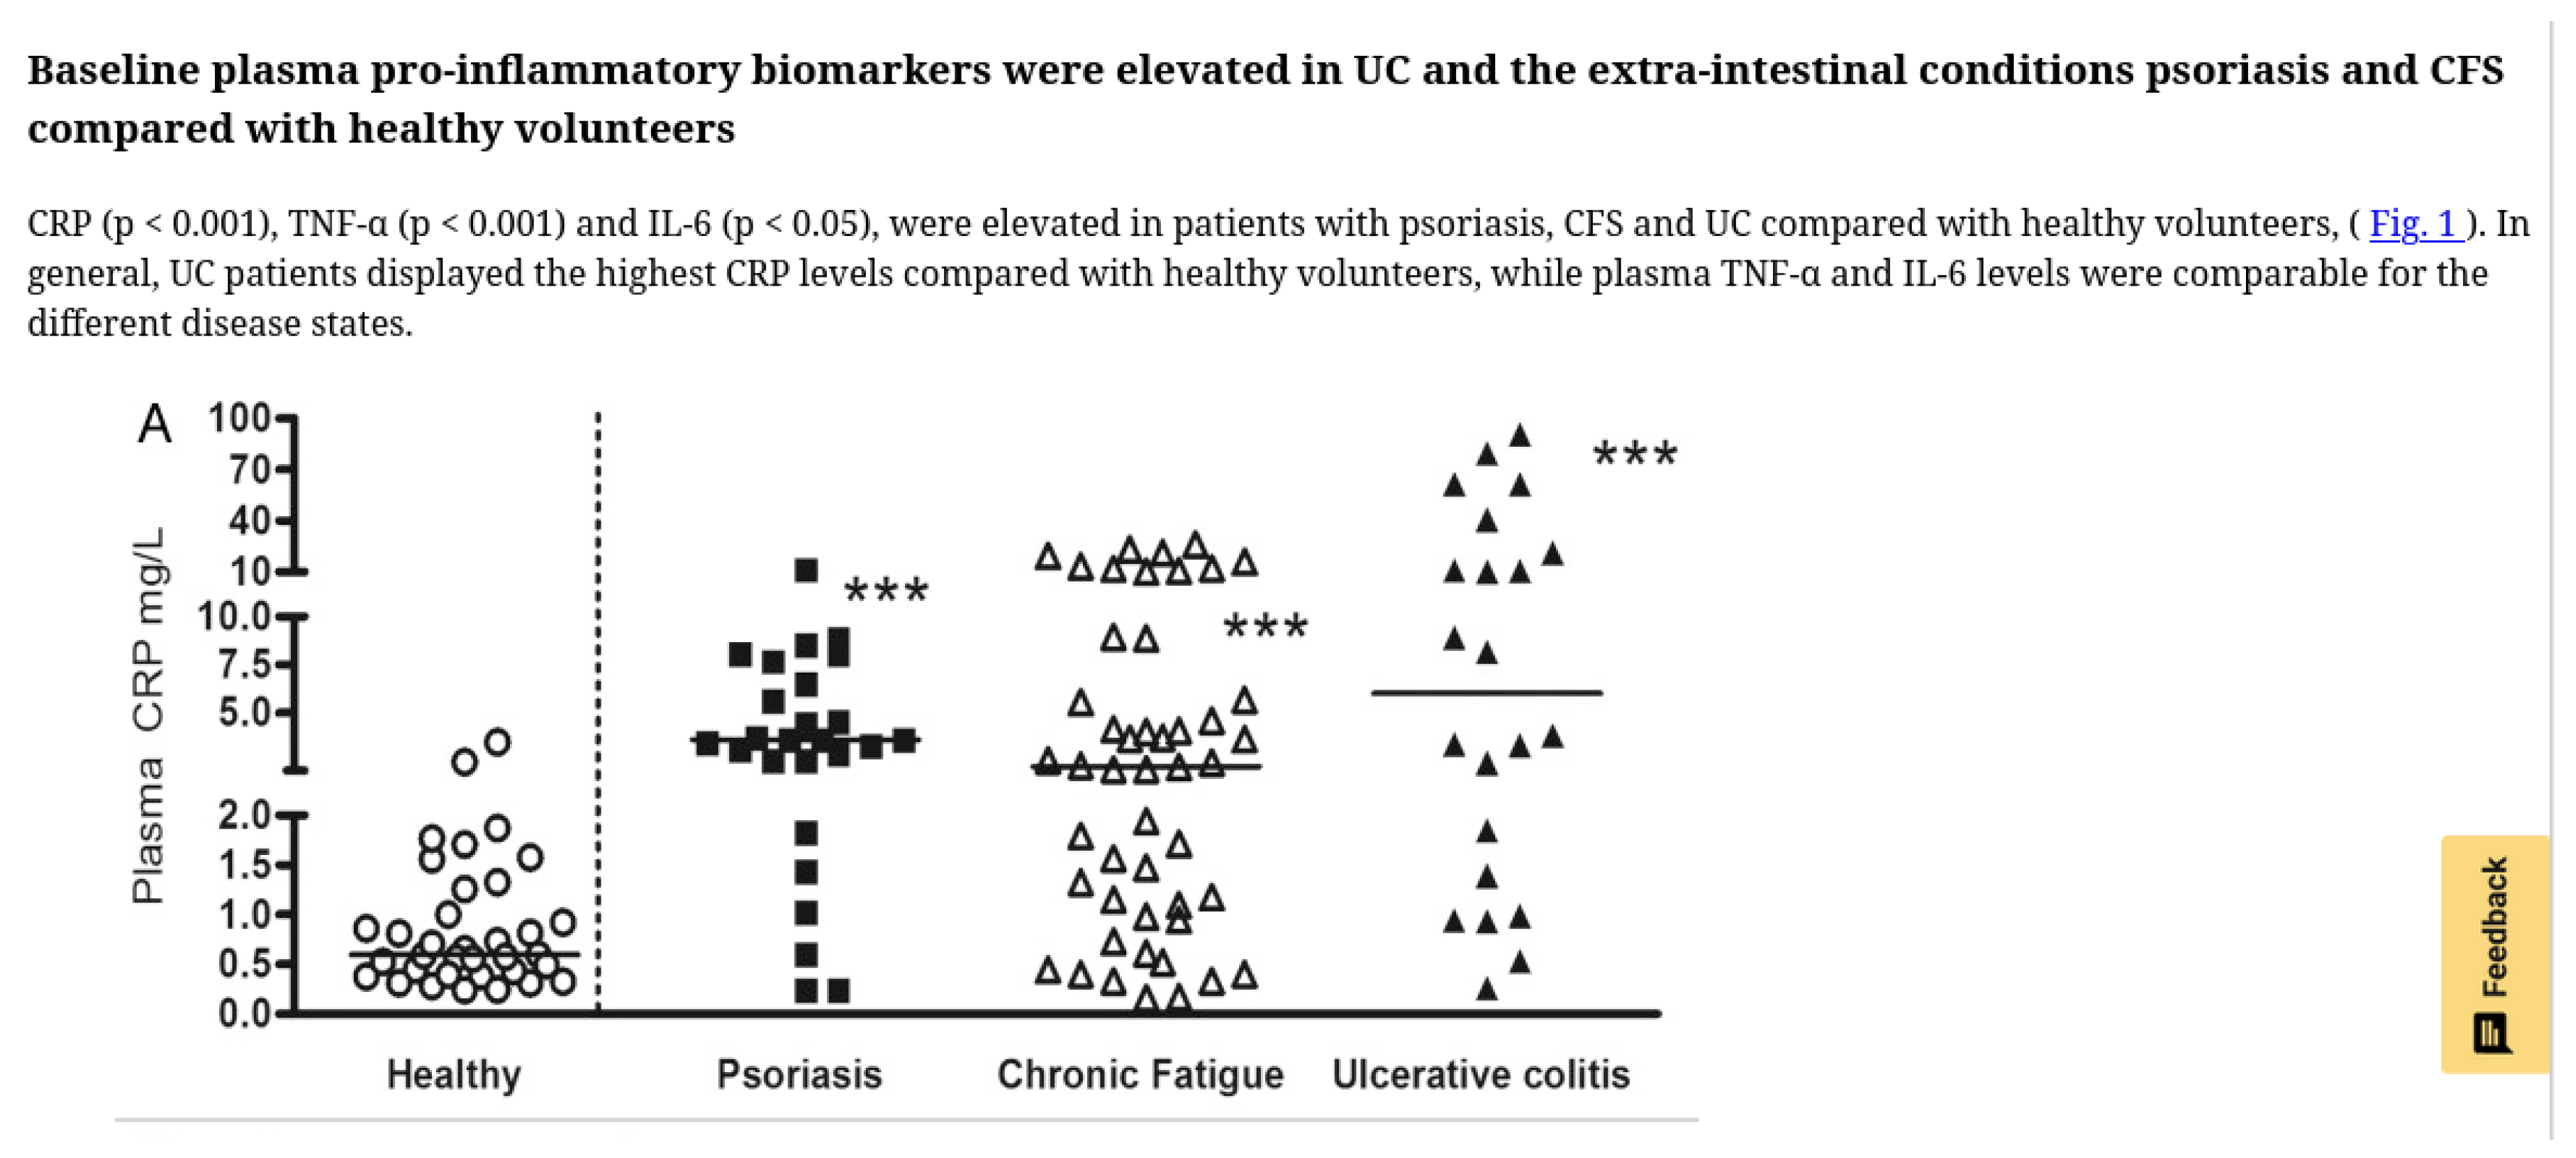
Reproduced from Groeger et al., Gut Microbes 2013, doi:10.4161/gmic.25487, under CC-BY license.
We were unable to quickly find any other study where individual patient CRP levels were presented this way as opposed to simpler statistical summaries.
The Groeger study only showed improvement in plasma CRP in the top tier non-placebo group (above 10 mg/L) of patients but did not report on symptom responses. The curious stratification and treatment response suggests routinely reporting the plasma CRP levels of inidividual ME/CFS patients could, together with symptom mapping, further illustrate the disease.
Appendix C. Vaes Symptom Severity Data
This table is derived from the publicly available dataset provided by Vaes (2023). Values are rounded and we removed cluster sizes, symptom frequencies, and standard deviation to reflect all of the data we used for this analysis. The original dataset is available in Vaes (2023). Numbers presented were rounded for ease of publication.
| Symptomgroup | Symptoms | 2 | 4 | 7 | 9 | 11 | 19 | 24 | 26 | 28 | 31 | 36 | 37 | 40 |
| fatigue | Fatigue/Extreme tiredness | 2.79 | 3.13 | 3.20 | 2.85 | 2.94 | 2.53 | 2.95 | 3.28 | 2.50 | 2.73 | 3.50 | 2.39 | 2.8 |
| PEM | Dead, heavy feeling after starting exercise | 2.17 | 2.00 | 2.60 | 2.35 | 1.76 | 1.79 | 2.21 | 2.78 | 1.18 | 2.00 | 3.20 | 0.94 | 1.85 |
| PEM | Next-day soreness or fatigue after everyday activities | 2.46 | 2.39 | 2.73 | 2.77 | 2.18 | 2.00 | 2.58 | 2.78 | 2.05 | 2.13 | 3.30 | 2.00 | 2.5 |
| PEM | Mentally tired after the slightest effort | 2.29 | 2.52 | 3.00 | 2.62 | 2.71 | 2.37 | 2.65 | 3.00 | 2.11 | 1.87 | 3.40 | 1.50 | 2.35 |
| PEM | Physically tired after minimum exercise | 2.67 | 2.78 | 3.10 | 2.65 | 2.65 | 1.95 | 2.84 | 3.06 | 2.18 | 2.27 | 3.30 | 1.72 | 2.35 |
| PEM | Physically drained or sick after mild activity | 2.38 | 2.65 | 2.80 | 2.69 | 2.59 | 2.05 | 2.65 | 2.89 | 2.00 | 2.13 | 3.10 | 1.61 | 2.05 |
| PEM | Muscle fatigue after mild physical activity | 2.33 | 2.48 | 3.00 | 2.65 | 2.12 | 2.21 | 2.74 | 3.00 | 1.47 | 2.47 | 3.40 | 1.39 | 1.6 |
| PEM | Worsening of symptoms after mild physical activity | 2.67 | 2.70 | 3.07 | 2.65 | 2.47 | 2.00 | 2.91 | 3.11 | 2.11 | 2.53 | 3.60 | 1.61 | 1.6 |
| PEM | Worsening of symptoms after mild mental activity | 2.21 | 2.52 | 2.97 | 2.73 | 2.53 | 2.05 | 2.65 | 2.67 | 1.84 | 2.20 | 3.50 | 1.17 | 1.45 |
| PEM | Difficulty reading (dyslexia) after mild physical or mental activity | 1.67 | 1.78 | 2.43 | 2.69 | 1.47 | 1.47 | 1.60 | 2.11 | 0.61 | 1.87 | 3.40 | 0.50 | 0.85 |
| Sleep | Unrefreshing sleep | 2.33 | 2.96 | 2.90 | 2.77 | 2.65 | 2.26 | 3.07 | 2.89 | 2.39 | 2.60 | 3.40 | 1.56 | 2.1 |
| Sleep | Need to nap daily | 2.58 | 1.96 | 2.70 | 2.77 | 3.24 | 2.26 | 2.67 | 2.61 | 1.71 | 1.20 | 3.10 | 2.11 | 1.9 |
| Sleep | Problems falling asleep | 1.17 | 2.04 | 1.90 | 2.00 | 2.88 | 1.32 | 2.16 | 2.67 | 1.84 | 1.80 | 2.10 | 1.11 | 2.25 |
| Sleep | Problems staying asleep | 1.21 | 1.61 | 2.43 | 2.23 | 2.47 | 2.21 | 2.47 | 2.67 | 1.53 | 1.27 | 3.10 | 1.17 | 2.7 |
| Sleep | Waking up early in the morning (e.g. 3 AM) | 0.96 | 1.17 | 2.30 | 1.85 | 1.94 | 2.11 | 2.19 | 2.22 | 0.95 | 1.53 | 2.70 | 1.06 | 2.35 |
| Sleep | Sleeping all day and staying awake all night | 0.33 | 0.22 | 1.20 | 1.19 | 2.18 | 0.58 | 0.84 | 1.33 | 0.58 | 0.20 | 1.60 | 0.61 | 0.5 |
| Sleep | Daytime drowsiness | 2.00 | 1.78 | 2.67 | 2.62 | 2.59 | 1.63 | 1.93 | 2.44 | 1.92 | 1.60 | 3.20 | 1.39 | 1.3 |
| pain | Pain or aching in muscles | 2.29 | 2.09 | 2.70 | 2.15 | 2.06 | 2.05 | 2.56 | 3.17 | 1.26 | 2.20 | 3.40 | 1.89 | 2.3 |
| pain | Joint pain | 1.79 | 1.70 | 2.63 | 2.08 | 1.41 | 1.42 | 2.47 | 3.00 | 0.97 | 2.20 | 3.20 | 1.06 | 2.5 |
| pain | Eye pain | 0.62 | 1.39 | 1.73 | 1.58 | 1.65 | 1.11 | 1.63 | 2.28 | 1.00 | 1.47 | 2.50 | 0.39 | 0.75 |
| pain | Chest pain | 0.50 | 0.83 | 1.53 | 1.38 | 1.06 | 0.84 | 1.35 | 1.83 | 0.50 | 1.20 | 2.50 | 0.33 | 0.85 |
| pain | Bloating | 0.92 | 1.39 | 1.97 | 1.77 | 1.47 | 0.89 | 1.70 | 2.44 | 1.32 | 2.13 | 2.10 | 0.44 | 2.25 |
| pain | Abdomen / stomach pain | 0.54 | 1.65 | 1.73 | 1.96 | 1.53 | 0.95 | 1.70 | 2.44 | 1.55 | 2.33 | 2.30 | 0.61 | 1.75 |
| pain | Headaches | 2.25 | 2.57 | 2.40 | 2.42 | 2.47 | 1.68 | 1.86 | 2.67 | 1.82 | 2.13 | 3.20 | 1.17 | 1.55 |
| pain | Aching of the eyes or behind the eyes | 0.79 | 1.35 | 1.70 | 1.92 | 1.65 | 0.84 | 1.51 | 1.83 | 0.79 | 1.47 | 2.50 | 0.50 | 0.6 |
| pain | Sensitivity to pain | 0.88 | 0.52 | 1.97 | 1.73 | 0.18 | 0.84 | 1.26 | 2.06 | 0.53 | 1.20 | 3.20 | 0.50 | 1.05 |
| pain | Myofascial pain | 0.62 | 0.35 | 1.43 | 0.77 | 0.12 | 0.63 | 0.49 | 2.06 | 0.29 | 0.47 | 2.70 | 0.06 | 0.4 |
| neurocognitive | Muscle twitches | 0.96 | 1.13 | 1.70 | 1.62 | 0.76 | 1.63 | 1.28 | 2.17 | 0.21 | 1.27 | 2.40 | 0.67 | 1.3 |
| neurocognitive | Muscle weakness | 1.67 | 2.39 | 2.43 | 2.46 | 0.94 | 2.11 | 2.14 | 2.28 | 0.95 | 1.73 | 3.30 | 0.83 | 1.55 |
| neurocognitive | Sensitivity to noise | 1.50 | 2.00 | 2.53 | 2.85 | 2.12 | 2.26 | 2.63 | 3.06 | 1.66 | 1.67 | 3.30 | 0.83 | 2.1 |
| neurocognitive | Sensitivity to bright lights | 1.38 | 1.96 | 2.53 | 2.65 | 1.65 | 1.79 | 2.14 | 2.50 | 1.34 | 2.13 | 2.90 | 0.61 | 1.6 |
| neurocognitive | Problems remembering things | 1.83 | 2.22 | 2.87 | 2.38 | 1.94 | 2.58 | 2.05 | 2.89 | 1.71 | 2.07 | 3.30 | 1.06 | 1.65 |
| neurocognitive | Difficulty paying attention for a long period of time | 2.21 | 2.78 | 3.13 | 2.85 | 2.53 | 2.58 | 2.49 | 2.94 | 1.68 | 2.27 | 3.60 | 1.00 | 1.7 |
| neurocognitive | Difficulty finding the right word to say, or expressing thoughts | 1.67 | 2.30 | 2.83 | 2.35 | 1.94 | 2.26 | 2.07 | 2.50 | 1.42 | 1.87 | 3.20 | 0.89 | 1.7 |
| neurocognitive | Difficulty understanding things | 1.54 | 1.83 | 2.30 | 2.46 | 1.06 | 2.11 | 1.49 | 1.72 | 0.79 | 1.07 | 3.00 | 0.39 | 0.8 |
| neurocognitive | Only able to focus on one thing at a time | 2.00 | 2.17 | 2.90 | 2.62 | 2.12 | 2.42 | 2.37 | 2.56 | 1.50 | 2.07 | 3.50 | 0.78 | 1.3 |
| neurocognitive | Unable to focus vision | 0.75 | 0.74 | 1.80 | 1.50 | 0.71 | 1.00 | 1.02 | 1.33 | 0.37 | 0.53 | 2.70 | 0.11 | 0.5 |
| neurocognitive | Unable to focus attention | 1.17 | 1.91 | 2.10 | 2.31 | 1.88 | 1.89 | 1.70 | 2.00 | 0.71 | 0.93 | 3.20 | 0.22 | 1.1 |
| neurocognitive | Loss of depth perception | 0.29 | 0.78 | 1.67 | 1.77 | 0.24 | 1.16 | 0.70 | 1.00 | 0.32 | 0.60 | 2.90 | 0.11 | 0.55 |
| neurocognitive | Slowness of thought | 1.75 | 2.39 | 2.77 | 2.69 | 1.94 | 2.16 | 1.84 | 2.56 | 1.24 | 1.73 | 3.30 | 0.33 | 1.35 |
| neurocognitive | Absent-mindedness or forgetfulness | 1.38 | 2.17 | 2.83 | 2.54 | 1.88 | 2.26 | 1.88 | 2.50 | 1.26 | 1.33 | 3.30 | 0.83 | 1.25 |
| neurocognitive | Feeling disoriented | 0.46 | 0.83 | 1.97 | 1.96 | 0.47 | 1.00 | 0.72 | 1.50 | 0.29 | 1.07 | 2.90 | 0.17 | 0.2 |
| neurocognitive | Slowed speech | 0.54 | 1.43 | 1.90 | 1.65 | 0.47 | 1.32 | 0.60 | 1.22 | 0.39 | 0.73 | 2.50 | 0.11 | 0.2 |
| neurocognitive | Poor coordination | 1.04 | 1.39 | 2.03 | 2.12 | 0.41 | 1.53 | 1.23 | 1.89 | 0.50 | 1.27 | 3.30 | 0.44 | 0.6 |
| autonomic | Bladder problems | 0.88 | 0.30 | 1.00 | 1.65 | 0.41 | 0.89 | 1.05 | 1.72 | 0.29 | 1.27 | 2.10 | 0.22 | 0.9 |
| autonomic | Irritable bowel problems | 0.62 | 1.39 | 1.87 | 2.15 | 1.29 | 0.58 | 1.58 | 2.61 | 1.39 | 2.33 | 2.80 | 0.61 | 2.3 |
| autonomic | Nausea | 0.71 | 1.43 | 1.53 | 1.88 | 1.35 | 0.63 | 1.12 | 2.00 | 1.29 | 1.53 | 2.40 | 0.33 | 1 |
| autonomic | Feeling unsteady on feet | 0.96 | 2.04 | 1.73 | 2.54 | 1.12 | 1.68 | 1.81 | 1.83 | 0.79 | 1.27 | 3.10 | 0.44 | 1.35 |
| autonomic | Shortness of breath or trouble catching breath | 0.83 | 1.39 | 1.60 | 1.85 | 1.41 | 1.26 | 1.35 | 1.94 | 0.82 | 1.20 | 2.80 | 0.22 | 0.85 |
| autonomic | Dizziness or fainting | 0.62 | 1.87 | 1.47 | 2.23 | 1.35 | 1.74 | 1.70 | 2.00 | 1.05 | 1.00 | 2.60 | 0.39 | 1 |
| autonomic | Irregular heart beats | 1.04 | 1.22 | 1.33 | 1.62 | 1.18 | 1.21 | 1.53 | 1.94 | 0.92 | 1.27 | 2.20 | 0.50 | 0.55 |
| autonomic | Heart beats quickly after standing | 0.92 | 2.17 | 1.33 | 2.31 | 1.41 | 0.84 | 1.21 | 1.89 | 0.71 | 1.20 | 2.50 | 0.39 | 0.45 |
| autonomic | Blurred or tunnel vision after standing | 0.33 | 1.74 | 1.30 | 2.19 | 0.47 | 0.79 | 0.79 | 1.28 | 0.47 | 0.87 | 2.60 | 0.39 | 0.05 |
| autonomic | Graying or blacking out after standing | 0.42 | 2.09 | 1.83 | 2.50 | 1.35 | 1.21 | 1.72 | 1.78 | 1.08 | 1.33 | 2.80 | 0.44 | 0.55 |
| autonomic | Urinary urgency | 1.29 | 0.35 | 1.47 | 2.54 | 1.24 | 1.68 | 1.77 | 1.78 | 0.89 | 1.80 | 2.40 | 0.83 | 1.2 |
| autonomic | Waking up at night to urinate | 1.33 | 0.70 | 1.90 | 2.46 | 1.76 | 1.68 | 2.14 | 1.67 | 1.37 | 1.67 | 2.60 | 1.00 | 1.75 |
| autonomic | Inability to tolerate an upright position | 0.62 | 2.09 | 1.20 | 2.50 | 0.35 | 1.26 | 1.60 | 2.11 | 0.61 | 0.93 | 3.00 | 0.22 | 0.55 |
| neuroendocrine | Losing weight without trying | 0.08 | 0.43 | 0.27 | 0.38 | 0.12 | 0.11 | 0.07 | 0.61 | 0.11 | 0.53 | 0.70 | 0.00 | 0.5 |
| neuroendocrine | Gaining weight without trying | 0.38 | 0.52 | 1.33 | 1.19 | 0.35 | 1.05 | 0.98 | 0.61 | 0.34 | 0.53 | 1.40 | 0.33 | 0.7 |
| neuroendocrine | Lack of appetite | 0.42 | 1.13 | 0.87 | 1.38 | 0.71 | 0.89 | 0.47 | 1.50 | 0.55 | 1.27 | 1.40 | 0.22 | 1 |
| neuroendocrine | Sweating hands | 0.46 | 0.74 | 0.50 | 0.81 | 0.35 | 0.37 | 0.65 | 1.06 | 0.21 | 0.33 | 1.20 | 0.11 | 0 |
| neuroendocrine | Night sweats | 0.71 | 1.52 | 1.47 | 1.73 | 1.41 | 0.63 | 1.86 | 1.56 | 1.21 | 1.00 | 2.60 | 0.72 | 1 |
| neuroendocrine | Cold limbs | 1.96 | 2.22 | 2.27 | 2.38 | 1.71 | 2.05 | 2.00 | 2.67 | 1.55 | 2.13 | 3.00 | 1.06 | 1.85 |
| neuroendocrine | Feeling chills or shivers | 1.42 | 1.48 | 1.87 | 2.04 | 1.00 | 1.05 | 1.44 | 2.06 | 0.87 | 1.80 | 2.80 | 0.17 | 1.05 |
| neuroendocrine | Feeling hot or cold for no reason | 1.71 | 1.83 | 2.00 | 2.35 | 1.29 | 1.37 | 1.93 | 2.89 | 1.42 | 1.67 | 2.90 | 0.61 | 1.45 |
| neuroendocrine | Feeling like you have a high temperature | 1.38 | 1.57 | 1.43 | 1.81 | 1.06 | 0.68 | 1.51 | 2.50 | 0.87 | 0.73 | 2.70 | 0.67 | 1 |
| neuroendocrine | Feeling like you have a low temperature | 1.17 | 0.39 | 1.20 | 1.50 | 0.47 | 0.16 | 0.74 | 1.22 | 0.53 | 1.47 | 2.30 | 0.00 | 0.95 |
| neuroendocrine | Alcohol intolerance | 0.17 | 0.35 | 0.27 | 1.85 | 0.47 | 0.68 | 0.21 | 0.78 | 0.37 | 0.80 | 1.90 | 0.00 | 0.1 |
| neuroendocrine | Intolerance to extremes of temperature | 0.92 | 1.22 | 2.00 | 2.54 | 0.82 | 0.95 | 2.30 | 2.50 | 0.97 | 2.40 | 3.40 | 0.39 | 1 |
| neuroendocrine | Fluctuations in temperature throughout the day | 1.12 | 1.26 | 1.10 | 1.85 | 0.53 | 0.32 | 1.19 | 2.67 | 0.87 | 1.07 | 2.50 | 0.50 | 1.05 |
| Immune | Sore throat | 1.00 | 1.00 | 1.47 | 1.73 | 1.47 | 1.11 | 1.33 | 1.83 | 0.97 | 1.40 | 2.20 | 0.28 | 0.85 |
| Immune | Tender/sore lymph nodes | 0.71 | 0.91 | 1.50 | 1.69 | 0.76 | 0.42 | 1.07 | 1.72 | 0.42 | 1.07 | 2.40 | 0.22 | 0.45 |
| Immune | Fever | 0.62 | 0.52 | 0.37 | 0.69 | 0.53 | 0.16 | 0.37 | 1.11 | 0.34 | 0.20 | 1.60 | 0.11 | 0.1 |
| Immune | Flu-like symptoms | 2.00 | 1.61 | 2.00 | 2.04 | 1.94 | 1.00 | 1.70 | 2.33 | 0.92 | 1.20 | 2.80 | 0.72 | 1.05 |
| Immune | Sensitivity to smells, food, medications, or chemicals | 0.25 | 0.70 | 1.40 | 2.46 | 1.06 | 1.00 | 1.19 | 1.67 | 0.76 | 1.53 | 2.30 | 0.17 | 0.8 |
| Immune | Sinus infections | 0.08 | 0.61 | 0.73 | 0.85 | 1.47 | 0.74 | 0.44 | 1.94 | 0.34 | 0.47 | 2.30 | 0.06 | 0.6 |
| Immune | Viral infections with prolonged recovery periods | 0.62 | 1.17 | 0.77 | 1.23 | 0.94 | 0.37 | 0.51 | 1.94 | 0.50 | 0.60 | 2.70 | 0.06 | 0.55 |
| other | Sensitivity to mold | 0.25 | 0.22 | 0.47 | 1.23 | 0.24 | 0.63 | 0.37 | 1.67 | 0.34 | 1.67 | 1.60 | 0.33 | 0.75 |
| other | Sensitivity to vibration | 0.29 | 0.96 | 1.60 | 1.96 | 0.47 | 0.58 | 0.84 | 1.89 | 0.26 | 1.20 | 2.60 | 0.11 | 0.6 |
Author Contributions
Erik K. Squires conceived the study, performed the analysis, and wrote the manuscript. This work presents an original investigative method and resulting framework which were both developed and first reported by the author in this preprint.
Funding
This work received no external funding.
Data Availability Statement
This study reanalyzed publicly available trial reports and published symptom cluster data (Vaes 2023). No new patient data were collected.
Acknowledgments
This paper could not exist without the foundational work of Anouk W. Vaes and her colleagues at CIRO, whose clustering study and publicly available cluster summary data provided the basis for our analysis. We are deeply grateful for their contribution to the field. Vaes had no role in the writing of this paper, and all errors or misinterpretations are the responsibility of the author.
Conflicts of Interest
The author declares no competing interests.
| 1 | e.g. alcohol/yeast metabolism9,10. |
| 2 | |
| 3 | |
| 4 | |
| 5 | serotonin syndrome features [17]. |
| 6 | autonomic dysfunction, norepinephrine physiology [18]. |
| 7 | |
| 8 | |
| 9 | |
| 10 | |
| 11 | polyamine toxicity, food spoilage [28]. |
| 12 |
References
- Vaes, A. W. et al. Symptom-based clusters in people with ME/CFS: An illustration of clinical variety in a cross-sectional cohort. Journal of Translational Medicine 21, 112 (2023). [CrossRef]
- Jurek, M., Lee, J., Patel, S. & al., et. Biotic interventions in ME/CFS: Systematic review. Nutrients 16, 201 (2024). [CrossRef]
- Stallmach, A., Quickert, S., Puta, C. & Reuken, P. A. The gastrointestinal microbiota in the development of ME/CFS: A critical view and potential perspectives. Frontiers in Immunology 15, 1352744 (2024). [CrossRef]
- Günzel, D. & Yu, A. S. L. Claudins and the regulation of tight junction permeability. Physiological Reviews 93, 525–569 (2013). [CrossRef]
- Van Itallie, C. M. & Anderson, J. M. Claudins and epithelial paracellular transport. Annual Review of Physiology 68, 403–429 (2006). [CrossRef]
- Warren, J. R. & Marshall, B. J. Unidentified curved bacilli on gastric epithelium in active chronic gastritis. The Lancet 321, 1273–1275 (1983). [CrossRef]
- Shen, L. et al. Myosin light chain kinase-dependent epithelial barrier dysfunction is regulated by NF-κb. Proceedings of the National Academy of Sciences 108, 409–414 (2011). [CrossRef]
- Camilleri, M. Intestinal barrier function in health and gastrointestinal disease. International Journal of Environmental Research and Public Health 18, 12836 (2021). [CrossRef]
- Eriksson, C. J. Acetaldehyde metabolism in humans after ethanol ingestion: Role of polymorphisms in alcohol and aldehyde dehydrogenases. Alcoholism: Clinical and Experimental Research 14, 713–715 (1990).
- Kim, D. Y. et al. Acetaldehyde induces gut barrier dysfunction and microbial dysbiosis. Alcohol Research: Current Reviews 40, e1–e10 (2019).
- Camilleri, M. Bile acid diarrhea: Prevalence, pathogenesis, and therapy. Gut 58, 1364–1374 (2009). [CrossRef]
- Ridlon, J. M., Harris, S. C., Bhowmik, S., Kang, D. J. & Hylemon, P. B. Consequences of bile salt biotransformations by intestinal bacteria. Gut Microbes 7, 22–39 (2016). [CrossRef]
- Vanholder, R. et al. Uremic toxins: The middle molecules. Kidney International 63, 1934–1943 (2003).
- Niwa, T. Indoxyl sulfate is a nephro-vascular toxin. Journal of Renal Nutrition 20, S2–S6 (2010). [CrossRef]
- Sirich, T. L., Aronov, P. A., Plummer, N. S., Hostetter, T. H. & Meyer, T.W. P-cresol sulfate and indoxyl sulfate in hemodialysis patients. Journal of the American Society of Nephrology 24, 969–977 (2013).
- Vanholder, R., Pletinck, A., Schepers, E. & Glorieux, G. Uremic toxicity: Present state of the art. International Journal of Artificial Organs 37, 746–756 (2014).
- Boyer, E. W. & Shannon, M. Serotonin syndrome. New England Journal of Medicine 352, 1112–1120 (2005).
- Goldstein, D. S. Catecholamine regulation of blood pressure in humans. Journal of Hypertension 24, 2311–2321 (2006).
- Frost, G. et al. The short-chain fatty acid acetate reduces appetite via a central homeostatic mechanism. Nature Communications 5, 3611 (2014). [CrossRef]
- Silva, Y. P., Bernardi, A. & Frozza, R. L. Effects of acetate on metabolic health and disease. Nutrients 12, 419 (2020).
- Mills, E. L. et al. Succinate receptor 1 (SUCNR1) mediates intestinal inflammation and fibrosis. Nature 563, 346–350 (2018).
- Connors, J., Dawe, N. & Van Limbergen, J. Succinate and intestinal inflammation: The role of succinate dehydrogenase and succinate receptor 1. Cellular and Molecular Gastroenterology and Hepatology 6, 229–238 (2018).
- Jacobsen, D. & McMartin, K. E. Methanol and ethylene glycol poisonings: Mechanism of toxicity, clinical course, diagnosis and treatment. Medical Toxicology 1, 309–334 (1986).
- Tephly, T. R. The toxicity of methanol. Life Sciences 48, 1031–1041 (1991).
- MacFabe, D. F. et al. Neurobiological effects of intraventricular propionic acid in rats: Possible role of short chain fatty acids on the pathogenesis and characteristics of autism spectrum disorders. Behavioural Brain Research 176, 149–169 (2007). [CrossRef]
- Fattorusso, A., Di Genova, L., Dell’Isola, G. B., Mencaroni, E. & Esposito, S. Altered gut microbiota and SCFA in children with autism spectrum disorder. Autism Research 12, 1373–1384 (2019).
- Lopes, C., Costa, A. & Brito, M. A. Polyamines in human health and disease. Clinical Nutrition 40, 5158–5170 (2021).
- Miller, K. A., Wang, Y. & Brooks, A. E. Putrescine and cadaverine: Intestinal microbiota-derived polyamines and their role in human health. Nutrients 13, 2705 (2021).
- Groeger, D. et al. Bifidobacterium infantis 35624 modulates host inflammatory processes beyond the gut. Gut Microbes 4, 325–339 (2013). [CrossRef]
Disclaimer/Publisher’s Note: The statements, opinions and data contained in all publications are solely those of the individual author(s) and contributor(s) and not of MDPI and/or the editor(s). MDPI and/or the editor(s) disclaim responsibility for any injury to people or property resulting from any ideas, methods, instructions or products referred to in the content. |
© 2025 by the authors. Licensee MDPI, Basel, Switzerland. This article is an open access article distributed under the terms and conditions of the Creative Commons Attribution (CC BY) license (http://creativecommons.org/licenses/by/4.0/).
Copyright: This open access article is published under a Creative Commons CC BY 4.0 license, which permit the free download, distribution, and reuse, provided that the author and preprint are cited in any reuse.


