
Submitted:
02 September 2025
Posted:
03 September 2025
You are already at the latest version
Abstract
Human metapneumovirus (HMPV) is a leading cause of acute respiratory infection worldwide, with most of the population over the age of ten having been infected. Despite its high revalence, pathogenesis is still not entirely elucidated. Many cell types are susceptible to HMPV infection, including stem cells. Our previous results suggested the susceptibility and permissiveness of mesenchymal stem cells (MSC) to HMPV. We focused specifically on the expression and localization of the cytoskeleton proteins and their role during syncytium formation, implicating either the actin or the microtubule network, however, we only observed changes in the distribution of actin without modifications of tubulin. We also studied the annexin V, this biomarker is a molecule associated with cytoskeleton proteins. Annexin V was increased by HMPV infection as a result of the membrane modification via viral entry caused by fusion and/or viral exit by gemmation/budding. The plasticity of MSC was studied using a differentiation protocol and soluble mediators, specifically growth factors Angiopoietin-2 (Ang-2), EGF, EPO, FGF-basic, G-CSF, GM-CSF, HGF, M-CSF, PDGF-AA, PDGF-BB, SCF, TGF-α, and VEGF) which were determined by flow cytometry. Finally, we demonstrate that the HMPV infection induces a significant decrease in EGF and VEGF secretion compared to the mock-infected cultures; in contrast, Ang-2 and PDGF-AA were significantly elevated in infected MSC compared
to the mock-infected cells. These data suggest that this increment might be associated with migration and proliferation of both resident and migratory MSC, to resolve the lung injury caused by a severe HMPV infection.
Keywords:
human metapneumovirus
; respiratory virus infections
; human mesenchymal 34 stem cells
; cytoskeleton
; cell differentiation
; soluble growth factors
1. Introduction
Mesenchymal stem cells (MSC) constitute a multipotent cell-adherent population of fibroblast-like morphology with high renewal capacity. They can differentiate into adipocytes, osteocytes, and chondrocytes, among other cell types [1]. MSC are positive for CD90, CD105, and CD73 and negative for CD45, CD19, CD14, CD11b, CD34, and DR hu-man leukocyte antigens (HLA-DR) [2]. In addition, they express the transcription factors of pluripotency, PUO5F1 (previously Oct-4), Sox-2, and Nanog [3], which indicate the un-differentiated state of the cell. The undifferentiated cells have the potential to become specialized cells, such as muscle cells, blood cells, and brain cells [4]. MSC possess immuno-regulatory properties [5] through cell-to-cell contact and cytokine secretion [6]. The secretome of MSC includes cytokines and growth factors, among them are transforming growth factor beta (TGF β), hepatocyte growth factor (HGF), vascular endothelial growth factor (VEGF), endothelial growth factor (EGF), platelet derived growth factor (PDGF) and Angiopoietin-2 (Ang2) [7].
Human metapneumovirus (HMPV) is a member of the Pneumoviridae family [8,9]. HMPV is a ubiquitous and frequent respiratory pathogen considered one of the leading causes of lower respiratory tract infections in children, the elderly and the immunosuppressed population [10]. HMPV infects more than 85% of the population by age ten. According to epidemiological reports conducted by the World Health Organization, 5% to 15% of all respiratory tract infections of children under the age of 5 are caused by HMPV, making it the second most common cause of hospitalization of young children after hu-man respiratory syncytial virus (hRSV) [11,12]. The HMPV infection starts in the upper respiratory tract but can spread to the lower airways, including the bronchi, bronchioles, and alveoli [13]. It has a tropism for polarized respiratory epithelial cells, mainly the apical ciliated cells [14]. A wide variety of cells are susceptible to HMPV infection, including dendritic cells, macrophages and MSC [15,16,17]. MSC are highly susceptible and per-missive to viral infections associated with the expression of diverse cell surface receptors [17]. This variety of potential viral receptors may facilitate viral entry. Several viruses mediate their entrance using the fusion of the viral envelope with the cellular membrane and exit from the infected cell as a way of budding from the cellular membrane. Both processes imply modifications and redistribution of the components of the cytoskeleton and associated molecules such as annexin V. HMPV infection is not the exception; the infection with this virus modifies the cytoarchitecture of MSC [17]. The viral infection of MSC also modifies some of their biological properties, like plasticity and the production of soluble mediators such as chemokines and growth factors [18]. These observations are reported for herpes simplex virus type 1 [19], which infect MSC and modify their secretome and their ability to differentiate. Thus, the present study is aimed towards analyzing the changes in the phenotype, the differentiation capacity, the secretome and the cytoskeleton of placental MSC (PL-MSC) after infection with HMPV.
2. Materials and Methods
2.1. Cells and Viruses
Human laryngeal epithelial type 2 cells (HEp-2; ATCC CCL23, USA), reported to be contaminated with HeLa cells, were used to isolate HMPV from a clinical sample in our laboratory as described elsewhere [20] and to multiply the viral isolates. The procedures for propagating the virus and assessing viral infectivity are described in [21].
2.2. MSC Cultures
The 6 batches of placental MSC (MSC-PL) cultures were obtained from 4 donors characterized by the mesenchymal stem cell laboratory in charge of Dr. Montesinos. [22]. Research Committees of the Research Division of the Faculty of Medicine of UNAM (FMED/CI/SPLR/004/2016). The MSC cultures were maintained with Dulbecco’s Modified Eagle Medium Nutrient Mixture F12 (DMEM F12;) supplemented with fetal bovine serum (BioWest). Cells were seeded at a 1 × 10³ cells/cm2 density and the medium was changed every seven days. When cells reached 80% of confluence, the monolayer was detached (trypsin 0.05%, ethylenediaminetetraacetic acid 0.02%) and reseeded at 1 × 10³ cells/cm2 density. This step was repeated until the cells reached R5.
2.3. Characterization of the PL-MSC
The presence (CD105, CD90, CD73 and HLA-ABC) and absence (CD45, and HLA-DR) of PL-MSC markers was evaluated by flow cytometry analysis with monoclonal antibodies coupled with fluorescein isothiocyanate (FITC), phycoerythrin (PE), phycoerythrin-cyanine 7 (PE-Cy7) and allophycocyanin (APC) (BD Biosciences). CD105, CD45, and HLA-DR were coupled to PE, CD90 was coupled to FITC, respectively, HLA-ABC was coupled to PE-Cy7 and CD73 was coupled to APC. Stained cells were evaluated with a FACS CANTO II Flow Cytometer (BD Biosciences) with at least 10,000 events per sample. The data were analyzed with FlowJo 10 (FlowJo LLC.). Isotype controls were run in parallel for each marker. Adipogenic differentiation was induced using an adipogenic medium for 21 days as described in [23], which contains insulin 10μM and indomethacin 200μM. As follows, adipogenesis was confirmed by Oil Red O Staining (Sigma-Aldrich) that stains the lipids contained in adipocytes. Osteogenic differentiation was induced by using a commercial kit of osteogenic differentiation medium (Osteogenic Differentiation Kit STEMPRO® Osteogenesis Differentiation Kit, Gibco) supplemented with 0.1 M dexamethasone, 50 µg/mL ascorbic acid, and 10 mM β-glycerol phosphate for 21 days. Osteogenesis was confirmed by Alizarin Red S staining (Sigma-Aldrich), which stains this characteristic enzyme produced by osteoblast. Chondrogenic differentiation was induced with the commercial kit Chondrocyte Differentiation Medium supplemented with 0.1 µM dexamethasone, ascorbate 50 µM, Insulin–Transferrin–Selenium 1 mL/50 mL supplement, sodium pyruvate, proline, and L-glutamine, supplemented with 10 ng/mL TGF-β3 (used for 21 days). Chondrogenesis was confirmed through alcian blue staining (Sigma-Aldrich), which stains mucopolysaccharides generated by chondrocytes.
2.4. HMPV Infection
We previously reported [17] the kinetics of viral infection of PL-MSC; according to these data, our experiments were done at a multiplicity of infection (MOI) of 1.0 for 48 hours postinfection. After 2 hours of infection at 37°C, the viral input was replaced with fresh DMEM without fetal bovine serum for 2 days at 37 °C in a 5% CO2 atmosphere. The supernatants were collected at 48 h postinfection and were titrated by TCID50 (Tissue Culture Infectious Dose). The viral titer by TCID50 was calculated according to the Kärber formula [21]. Crystal violet staining was performed to visualize the syncytia.
2.5. Immunofluorescence Assay
a. Detection of HMPV by commercial anti-N Mabs (Monoclonal antibodies)
The culture medium was removed from the culture slides for the immunofluorescence assay. The monolayers were washed twice with phosphate-buffered saline (PBS) and fixed with 4% paraformaldehyde for 8 min. Then, they were washed thrice with PBS and cleaned with cold acetone for 5 min. After this, they were washed once with PBS and blocked with a PBS solution with 2% of Bovine Serum Albumin (BSA) (Sigma-Aldrich) for 1 h at room temperature. 0.05% Triton X-100 (Sigma-Aldrich) in PBS was added for 30 min to permeabilize the cells. The anti-N Mabs were used at 1:300 dilution (anti-mouse IgG NOVUS), and Alexa Fluor 594 were used as a secondary antibody. To visualize cell nuclei, the samples were washed with PBS and incubated with 4’, 6-diamidino-2-phenylindole (DAPI; Sigma-Aldrich) for 30 min in the dark. Last, they were washed and mounted on slides covered with the commercial solution Vectashield® (Vector H-1200) at room temperature.
b. Determination of the distribution of the cytoskeleton proteins and annexin V in HMPV infected mesenchymal stem cultures.
The immunofluorescence assay was done as previously described. For the immuno-detection of annexin V (Merck Millipore) and tubulin (Sigma-Aldrich), the cells were incubated with the corresponding primary antibodies at a dilution of 1:200 overnight at 4 °C in humidity. Then, the layers were washed five times with PBS and incubated with the secondary antibody (anti-mouse IgG conjugated to FITC; Zymed) at a dilution of 1:100 for 1 h in the darkness. The immunodetection of filamentous actin was performed by direct labeling with Alexa Fluor 594 phalloidin (Invitrogen) used at a dilution of 1:100. For the visualization of cell nuclei, the samples were washed with PBS, incubated with 4’,6-diamidino-2-phenylindole (DAPI; Sigma-Aldrich) for 30 min in the dark. Last, they were washed and mounted on slides covered with the commercial solution Vectashield® (Vector H-1200) at room temperature.
All the immunofluorescence-stained images were analyzed with a Nikon TS100 microscope (Nikon Co.) using the microscopy program NIS-Elements Viewer 4.2 (Nikon Co.) and analyzed on Image J. All the assays were performed in parallel with mock-infected cells.
2.6. Differentiation Assay
In the case of the cell differentiation experiments, the cells were fixed with methanol, stained with crystal violet for 3 min for controls, and finally stained with Oil Red O for adipocytes, Alcian blue for chondrocytes, and Alizarin Red S for osteocytes.
2.7. Profile of Growth Factors
PL-MSC were infected with HMPV for 48 h. The control condition was PL-MSC cultures without viral infection, defined as mock-infected. Then, the cell culture supernatants were collected, freeze-dried, and resuspended at 100 µg/mL. A volume of 100 µL was used for the LEGENDplex assay with BioLegend’s LEGENDplex human Growth Factor Panel (13-plex). This assay evaluates the following growth factors: Ang-2, EGF, EPO, FGF-basic, G-CSF, GM-CSF, HGF, M-CSF, PDGF-AA, PDGF-BB, SCF, TGF-α, and VEGF (BioLegend). The data were analyzed using BioLegend’s software Qognit, V. The data were expressed in pg/mL.
2.8. Statistical Analysis
The non-parametric Mann-Whitney test was performed, and the Unpaired t test was used to perform the statistical analysis of the growth factors secreted by the cells infected and non-infected with the GraphPad Prism version 8 program. The statistical tests applied to the cell surface markers and Immunofluorescence assays consisted of an unpaired t-test with a p value < 0.05. Each experiment included at least 7 replicates. Data were analyzed using ImageJ (Schneider et al., 2012) and GraphPad Prism (GraphPad Software, San Diego, CA).
3. Results
3.1. Characterization of PL-MSC
We characterized the PL-MSC isolated from healthy donors according to the criteria proposed by the Mesenchymal and Tissue Stem Cell Committee of the International Society for Cellular Therapy/International Society for Cellular Therapy (ISCT). The ISCT established diverse requirements to fulfill as PL-MSC cultures: first, an elongated morphology (Figure 1A); second, their capacity to grow as an adherent monolayer over the substrate usually used to subculture them (Figure 1A); third, their phenotype, the PL-MSC are to differentiate into mesoderm lineages like adipocytes, chondrocytes, and osteocytes, as we demonstrate with our results after the differential stain of the PL-MSC cultures pas-sage 5 (Figure 1C).
3.2. HMPV Infection of PL-MSC
Our previous results demonstrate the susceptibility and permissiveness of the PL-MSC [17]; according to this information, we designed the experimental assay at a multiplicity of infection of 1.0 during 48 hours of infection (Figure 2A). After this, the supernatant of infected PL-MSC was collected, and the viral titer was 1.3 × 10³ TCID50/mL. These data corroborate the susceptibility and permissiveness of PL-MSC and their capacity to generate a productive infection. The infected PL-MSC lost their spindle shape at 48 h of viral infection. Moreover, the cell morphology modifications (syncytium) were stained with crystal violet and visualized by light microscopy. These modifications were more evident as the days of postinfection passed, as demonstrated on days fifth and seventh (Figure 2). We also evaluated the presence of the HMPV in the cytoplasm of the infected cells, labeling the N protein from the virus with commercial Mabs (Figure 2F). These changes in cell morphology suggest modifications in the distribution and/or organization level of the cytoskeleton proteins.
3.3. The HMPV Infection of PL-MSC Induces Changes in the Cytoskeletal Organization and Annexin V Localization
The HMPV induced morphological changes in PL-MSC led to the evaluation of the distribution of cytoskeleton proteins, specifically, the proteins actin, tubulin, and annexin V (Figure 3). Actin filaments in infected PL-MSC are organized differently than in the control cells, probably because the infected cells showed retraction of the cytoplasm; thus, they were thinner and less elongated. On the other hand, the distribution of tubulin has not shown modifications throughout the cytoplasm in infected cells, nor do mock-infected cells but expression of tubulin increases significantly in infected cells. Regarding annexin V, notable differences were observed between infected and control cells. In some control cells, annexin V expression was absent, while others had only slight expression, mainly around the cell nucleus. After infection, annexin V was widely expressed in all cells throughout the cytoplasm (Figure 3E,F).
3.4. HMPV Infection Changes the Expression of PL-MSC Surface Markers
Next to the characterization of the PL-MSC cultures, we wondered if the HMPV infection caused modifications to their characteristics and surface markers CD105, CD73, CD90. Infected cells presented a decrease in the expression of CD90. (Figure 4). In this regard, our findings show that HLA-ABC class I molecules decreased in the HMPV-infected PL-MSC; these data suggest possible negative modulatory changes in the immune response or possible effects of viral evasion of the host immune response. On the contrary, no changes were observed in the transcriptional factors that are related to the differentiation potential [24,25], so the viral infection might not be implicated in their capacity to differentiate into the mesoderm lineages.
3.5. HMPV Does Not Modify the Differentiation Capacity of PL-MSC
The effect of HMPV on the differentiation capacity of PL-MSC toward adipocytes, chondrocytes, and osteocytes was evaluated alongside observing the distribution of cyto-skeletal proteins. The infected cells that differentiated into adipocytes increased in size along with a high concentration of actin surrounding the nuclei (Figure 5A), an effect we did not observe in the mock-infected cells. Meanwhile, the distribution of tubulin was high in mock-infected PL-MSC. However, there was a decline in the production of tubulin associated with viral infection, an effect we could not observe in the mock-infected cells. Regarding annexin expression, the protein was preferentially localized around the nucleus in infected cells and diffused in the cytoplasm in the mock-infected cells, which is to say annexin was highly present in infected cells in contrast with mock-infected cells.
In the case of differentiated chondrocytes, these cells showed an elongated morphology with a heterogeneous orientation (Figure 5B). A notable increase in cell size was observed after HMPV infection. Furthermore, actin filaments were extended along the cyto-plasm; this fiber elongation probably involves modification of the cell architecture and induces interaction between the infected cell membranes, resulting in a syncytium formation. In the meantime, the production and distribution of tubulin is more plentiful throughout the cytoplasm of the infected MSC than in mock-infected cells (Figure 5B). Finally, in the PL-MSC infected cultures, the annexin were concentrated in small clusters throughout the cytoplasm and unequally distributed; contrary to the mock-infected cells, the annexin showed a heterogeneous distribution along the cytoplasm. (Figure 5B).
The differentiation of PL-MSC infected cultures to the lineage of osteocytes shows a higher tubulin production in infected cells in contrast to mock-infected. (Figure 5C) The infected PL-MSC showed more compacted structures of tubulin than the mock-infected cells. In conclusion, the HMPV infection does not modify the differentiation process, although it modifies the production and distribution of cytoskeleton proteins as well annexin V cell distribution.
3.6. HMPV Infection Modifies the Secretory Profile of PL-MSC
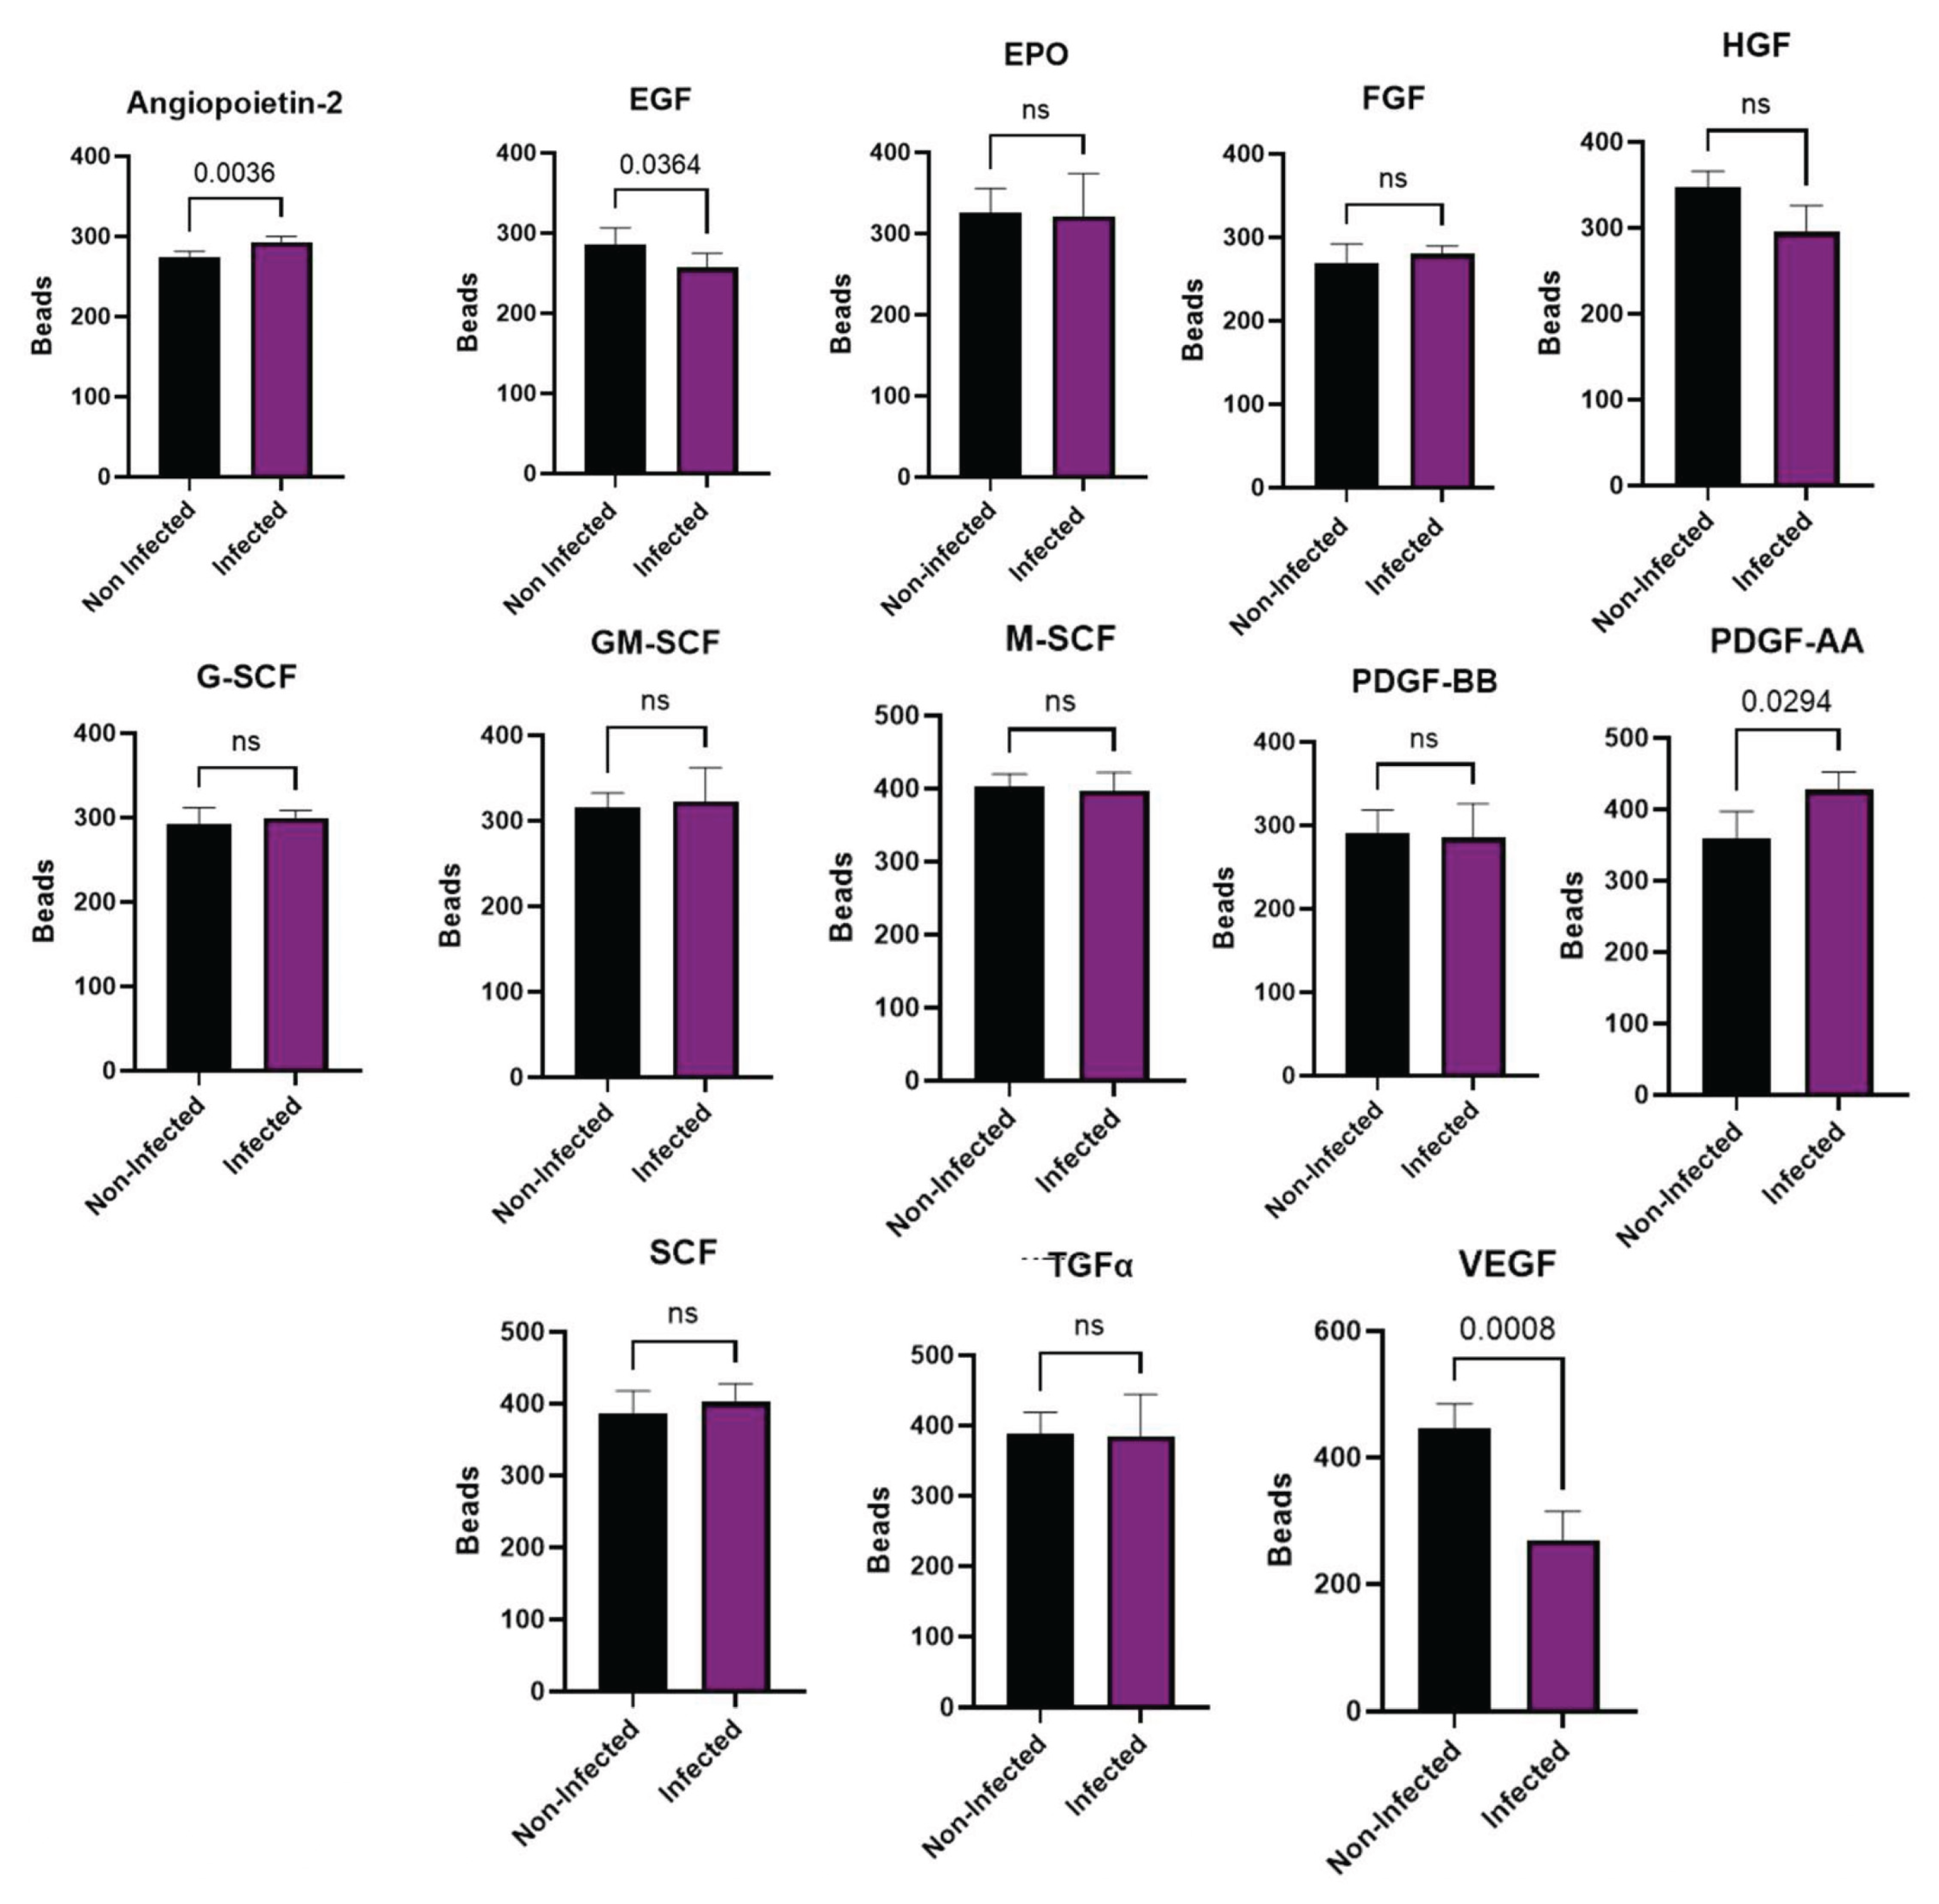
As described previously, one of the roles of the PL-MSC is to promote the repair of damaged tissue and the cell proliferation. Thus, we wondered if viral infection modifies the pattern of growth factors secreted by the PL-MSC. Our results demonstrate a significant decrease in EGF and VEGF secretion due to viral infection of PL-MSC compared to the mock-infected cultures (Figure 6). In contrast, Ang-2 and PDGF-AA were significantly elevated in infected PL-MSC compared to the mock-infected cells (Figure 6).
4. Discussion
Our in vitro model aims to study the effect of HMPV infection on different biological activities of PL-MSC and the way in which the viral infection could induce modification in the cytoskeleton organization. First, our model demonstrated the susceptibility and permissiveness of PL-MSC to HMPV, as previously reported [17]. We could detect by immunofluorescence assay, both the viral presence and the distribution of the cytoskeleton proteins. We also demonstrated that the HMPV infection induces changes in the morphology of the PL-MSC associated with the rearrangement of the cytoskeleton proteins. Regarding these modifications, the morphological changes were due to the differential distribution of cytoskeletal filament proteins. The cytoskeletal filaments are dynamically involved in cell shape and size, contributing to various cellular processes such as cell division, migration, endocytosis, and exocytosis. In the case of some viral infections, the reorganization of the cytoskeleton is essential for the formation of vesicles to release the viral particles from the infected host cells [26]. Also, this filament modification participates in the viral exit by budding and the passing of viral particles by cell-to-cell fusion.
Moreover, during viral replication, the modification of cytoskeletal filaments trans-ports newly synthesized proteins from the sites of viral replication, called inclusion bodies, to viral assembly sites [27]. In our study, the cytoskeletal filaments of HMPV-infected PL-MSC were modified. The modifications of actin filaments and microtubules may indicate that the transport of proteins from the inclusion bodies was completed. This has been previously observed in HMPV-infected cells [28]. It has been shown that modifications in the cytoskeleton filaments, particularly an increase in actin filaments, are associated with the release of viral particles and the syncytia formation (cell-to-cell fusion) [26,28]. As de-scribed for hRSV and HMPV, both induce the reorganization of actin filaments to promote virus transmission through cell-to-cell contact [29].
The HMPV-infected PL-MSC culture exhibited morphological changes, including the formation of cell clusters without inner cytoplasmic boundaries and with multiple nuclei, indicating the formation of syncytia. Under the microscope, syncytia can be observed as large cytoplasmic masses with several nuclei [30]. It has been documented that HMPV, like other fusogenic viruses, can induce the formation of syncytia to increase the viral production capacity and improve mobility and survival capacities [31]. It has also been shown that syncytia formation can be induced by the rearrangement of cytoskeletal filaments, particularly actin filaments [32]. The actin cytoskeleton filaments are essential for the nonlytic egress of several viruses [33], as is the case with HMPV. In addition, the effect of the virus on cell morphology is at the level of the host cell plasma membrane, the insertion of newly synthesized viral antigens inducing a depolymerization of actin filaments [34]. Of course, the rearrangement of the cytoskeleton of HMPV-infected MSC has functional implications. For instance, an increase in the migratory capacity of stromal fibroblasts concomitant with increased actin filaments has been documented [35].
The cytoskeleton-associated protein annexin V participates in various cellular processes, including blood coagulation, inflammation, and responses to cellular stress [36]. In the studies of influenza virus infection, the concentration of annexin V increases in the cell membranes of infected cells [37]. At the same time, it has also been observed that annexin V is incorporated into viral particles [36]. Our data shows that the HMPV infection of PL-MSC induces the expression of annexin V, particularly in cytoplasm. This increase may be related to viral replication since it was only observed in the cytoplasm of infected cells and cell membranes. Without a doubt, the HMPV infection modifies the cell architecture, favoring the annexin V expose since it functions as an associated cytoskeleton molecule.
Some RNA viruses use tubulin microtubules for transport their viral components [38]. The microtubule network is often hijacked by viruses to transport themselves to inclusion bodies and for facilitate their exit from the cell [39].
Additionally, the HMPV infection changes the cytokine secretion pattern of PL-MSC without altering their differentiation capacity. Therefore, we analyzed the production of growth factors that participate in tissue repair, the migration of progenitor and stem cells, and the regulation of inflammation. HMPV infection of PL-MSC significantly increased the secretion of Ang-2 and PDGF-AA while significantly decreasing EGF and VEGF secretion without affecting the rest of the tested growth factors. Numerous viruses, including some respiratory viruses, increase VEGF expression and its receptors, which is related to the pathophysiology of viral infections and aggravates the clinical condition of the patients [40]. VEGF decreases the cytotoxic and antiviral activity of NK and T CD8 cells [41]. Our results show that the HMPV infection of PL-MSC causes a decrease in VEGF secretion; it might stop the viral infection due to an increase in NK cell cytotoxicity. Further-more, VEGF has been shown to induce tolerance through the polarization of M2 macro-phages [42]. Thus, a decrease in VEGF secretion by PL-MSC can maintain polarization to M1 macrophages, which may contribute to the limitation of viral infection through the de-creased secretion of VEGF. In the case of EGF secretion by PL-MSC, we observed a de-crease in post-infection. Our results suggest that this factor could decrease EGFR activation, which, in turn, could induce a reduction in HMPV levels as occurs with hRSV [43]. Although the mechanisms are still poorly understood, it has been demonstrated that inhibition of EGFR during viral infection increases IRF1 and IFN-k and decreases hRSV titers [44]. An increased EGF secretion or an upregulation of its receptors (EGFR) increases the innate immune response, mucus secretion, the flux of neutrophils, and IL-8 secretion [45]. Increased EGF secretion and, very significantly, the upregulation of EGFRs induces an antiviral response [46].
Notably, PL-MSC infected with HMPV had a significant increase in the secretion of Ang-2 and PDGF-AA compared to mock-infected PL-MSC. Other viruses, such as hepatitis B, have been shown to promote the secretion of Ang-2 [47]. In an in vitro wound model of endothelial cells, the factors VEGF and angiopoietin-1 induced rapid wound closure. In contrast, the addition of PDGF and Ang-2 to the culture induced a decrease in wound closure [48,49]. This is central to maintaining the integrity of blood vessels. Effective angiogenesis requires stabilizing the newly formed vessels, including the formation of tight junctions between endothelial cells, and the lumen in the new blood vessel. This stabilization is induced by angiopoietin 1 [50]. In contrast, Ang-2, in the absence or decrease of VEGF, as is the case in our data, opposes angiopoietin-1 by inducing destabilization of newly formed vessels, with the death of endothelial cells and pericytes and an increase in the rupture of tight junctions between endothelial cells [51,52]. The destabilization of blood vessels can lead to an increase in edema of the surrounding tissue, which is particularly important in viral infections [44]. Our results suggest that HMPV infected PL-MSC in lung tissue could increase damage, mainly due to vascular destabilization and edema, exacerbating the HMPV lung infection. This could be further exacerbated considering that, in our experiments, PL-MSC continued to produce viral particles ten days after the infection, probably acting as a transport or reservoir of the infection. Once the infectious process decreases, lung stem cells can promote lung tissue repair, as has been demonstrated with hRSV [30]. This can also be proposed in the case of HMPV infection, since our study, we observed that the expression of stem cell markers varied after HMPV infection. Specifically, CD105 and CD73 antigens decreased in infected cells (Figure 4), suggesting that the potentiality of PL-MSC may decrease after infection. Exposure to cytokine-related stimuli or stress factors, such as hypoxia, can induce variations in the expression of these markers during stem cell differentiation [53].
Interestingly, our results showed that the differentiation capacity of PL-MSC following HMPV infection was not modified, in contrast to previous studies reporting that viral infections of MSC affect their ability to proliferate and differentiate into other cell types. For instance, the Chikungunya virus reduces the ability of MSC to differentiate into osteoblasts [54], also the Zika virus reduces the ability of MSC to differentiate into osteoblasts [55].
5. Conclusions
The present study confirms that PL-MSC are susceptible to HMPV infection, which induces the production of infectious viral particles. At the same time, the infection modified the cytoskeleton of these cells, resulting in changes in cell shape and syncytium formation. Furthermore, HMPV infection decreased the expression of the markers CD105 and CD73 without modifying the expression of NANOG, POU5F1, and SOX2 as previously reported [51], which was related to the capacity of MSC to still differentiate into osteocytes, chondrocytes, and adipocytes. Finally, modifications in the production of growth factors, particularly the decrease in EGF and VEGF, may imply PL-MSC tissue reparation, even though the increase in the secretion of Ang-2 and PDGF-AA points in the opposite direction, reflecting the damage caused by HMPV.
Author Contributions
Conceptualization, R.T.M. and M.L.M.; methodology, M.L.M, K.J.Y.; software, K.J.Y. and M.L.M.; validation, K.J.Y.; formal analysis, A.E.C.R.; investigation, M.L.M.; resources, J.R.A.H.; data curation, K.J.Y.; writing—original draft preparation, M.L.M.; writing—review and editing, R.TM. and A.E.C.R..; visualization, M.L.M and K.J.Y.; supervision, A.E.C.R.; project administration, R.T.M. and A.E.C.R.; funding acquisition, J.R.A.H., R.T.M. and A.E.C.R. All authors have read and agreed to the published version of the manuscript.
Funding
This research was funded by the Dirección General de Asuntos del Personal Académico (DGAPA PAPIIT; IN217519) and Facultad de Medicina, UNAM.
Institutional Review Board Statement
Not applicable
Informed Consent Statement
Informed consent was obtained from all subjects involved in the study. The informed consent letters were approved by the Committee of Ethics and Research of the División de Investigación de la Facultad de Medicina de la UNAM (FMED/CI/SPLR/004/2016) applicable.
Acknowledgments
The authors dedicate this work to the memory of Dr. Javier Ambrosio-Hernández, who started this project, and thank him for his friendship and legacy. This article is a requisite for the obtainment of a PhD degree for Mariana López-Mejía, who received academic support from the Biological Sciences Postgraduate program, UNAM, and financial support from CONACYT (737194). Finally, the authors want to thank PhD Lilian Hernandez Mendoza, QFB Laura Guadalupe Chávez Gomez and QFB César Alexis Rosales Velázquez for proofreading and post editing, María Gernandt Ortiz for proofreading and editing the English version of the manuscript.
Conflicts of Interest
The authors declare no conflicts of interest.
Abbreviations
The following abbreviations are used in this manuscript:
| HMPV | Human Metapneumovirus |
| MSC | Human Mesenchymal Stem Cells |
| PL-MSC | Human Placental Mesenchymal Stem Cells |
| POU5F1/OCT-4 | POU domain, class 5, transcription factor 1 |
| SOX2 | Sex-determining region Y-box 2 |
| NANOG | Nanog homeobox |
| HEp-2 | Human laryngeal epithelial type 2 cells |
| TCID50 | Tissue Culture Infectious Dose |
| PBS | Phosphate-Buffered Saline |
| BSA | Bovine Serum Albumin |
| DAPI | 4’, 6-diamidino-2-phenylindole |
| Ang-2 | Angiopoietin-2 |
| EGF | Endothelial Growth Factor |
| EPO | Erythropoietin |
| FGF-basic | Fibroblast growth factor 2 |
| G-CSF | Granulocyte Colony-Stimulating Factor |
| GM-CSF | Granulocyte Macrophage-Colony Stimulating Factor |
| HGF | Hepatocyte Growth Factor |
| M-CSF | Macrophage-Colony Stimulating Factor |
| PDGF-AA | Platelet Derived Growth Factor homodimer AA |
| PDGF-BB | Platelet Derived Growth Factor homodimer BB |
| SCF | Stem Cell Factor |
| TGF-α | Transforming Growth Factor alpha |
| VEGF | Vascular Endothelial Growth Factor |
| HLA-DR | Human Leukocyte Antigen – DR isotype |
| FITCI | Fluorescein Isothiocyanate |
| PE | Phycoerythrin |
| APC | Allophycocyanin |
References
- Nombela, C.; Ritz, J.; Silberstein, L. The elusive nature and function of mesenchymal stem cells. Nat Rev Mol Cell Biol, 2011, 12. 126-131 pp. [CrossRef]
- Moreno, R. (2021). Mesenchymal stem cells and oncolytic viruses: joining forces against cancer. Journal for ImmunoTherapy of Cancer, 2021, 9(2). [CrossRef]
- Carlin, R.; Davis, D.; Weiss, M.; Schultz, B.; Troyer, D. Expression of early transcription factors Oct-4, Sox-2 and Nanog by porcine umbilical cord (PUC) matrix cells. Reprod Biol Endocrinol, 2006, 4. [CrossRef]
- McCulloch, E., Till, J. Perspectives on the properties of stem cells. Nature Medicine, 2008, 11. 1026-1028 pp. [CrossRef]
- Naji, A.; Eitoku, M.; Favier, B.; Deschaseaux, F.; Rouas, N.; Suganuma, N. Biological functions of mesenchymal stem cells and clinical implications. Cell Mol Life Sci, 2019, 76. 3323-3348 pp. [CrossRef]
- Aggarwal, S.; Pittenger, M. (2005). Human mesenchymal stem cells modulate allogeneic immune cell responses. Blood, 2005, 105(4). 1815-1822. [CrossRef]
- Ferreira, J., Teixeira, G., Santos, S., Barbosa, M., Almeida, G., Gonçalves, R. Mesenchymal Stromal Cell Secretome: Influencing Therapeutic Potential by Cellular Pre-conditioning. Front Immunol, 2018, 9. [CrossRef]
- Afonso, C., Amarasinghe, G., Bányai, K., Bào, Y., Basler, C., Bavari, S., et al. (2016). Taxonomy of the order Mononegavirales: update 2016. Arch Virol, 2016, 161(8). 2351-2360 pp. [CrossRef]
- Solís, M., Alpuche, Á., Tirado, R. Metapneumovirus humano: epidemiología y posibles tratamientos profilácticos. Rev Fac Med (Méx.), 2020, 63(3). 7-18 pp.
- Panda, S., Mohakud, N., Pena, L., Kumar, S. Human metapneumovirus: review of an important respiratory pathogen. International Journal of Infectious Diseases, 2014, 25. 45-52 pp. [CrossRef]
- Boivin, G., De Serres, G., Côté, S., Gilca, R., Abed, Y., Rochette, L., Bergeron, M., Déry, P. Human metapneumovirus infections in hospitalized children. Emerg Infect Dis, 2003, 9(6). 634-6340 pp. [CrossRef]
- Lu, G., Gonzalez, R., Guo, L., Wu, C., Wu, J., Vernet, G., Paranhos, G., Wang, J., Hung, T. Large-scale seroprevalence analysis of human metapneumovirus and human respiratory syncytial virus infections in Beijing, China. Virology Journal, 2011, 8. [CrossRef]
- Weston, S., Frieman, M.. Respiratory Viruses. In Encyclopedia of Microbiology. 2019, 85 pp. Recovered: July 2025. [CrossRef]
- Kinder, J., Moncman, C., Barrett, C., Jin, H., Kallewaard, N., Dutch, R. (2020) Respiratory Syncytial Virus and Human Metapneumovirus Infections in Three-Dimensional Human Airway Tissues Expose an Interesting Dichotomy in Viral Replication, Spread, and Inhibition by Neutralizing Antibodies. J Virol., 2020, (94). [CrossRef]
- Kolli, D., Gupta, M., Sbrana, E., Velayutham, T., Chao, H., Casola, A., Garofalo, R. (2014). Alveolar macrophages contribute to the pathogenesis of human metapneumovirus infection while protecting against respiratory syncytial virus infection. Am J Respir Cell Mol Biol, 2014, 51(4). [CrossRef]
- Adedokun, K., Adekola, S., Tajudeen, A., Bello, A., Babandina, M., Magwe, E., Bello, A. Rising global threat of human metapneumovirus (hMPV in 2024/2025): pathogenesis, immune dynamics, vulnerabilities in immunocompromised individuals, and lessons from past pandemics. Journal of Rare Diseases, 2025, 4. [CrossRef]
- Zarate, K., Ambriz, X., Ambrosio, J., Tirado, R. (2022). In vitro Pneumovirus and Paramixovirus infection is modulated by the passage of mesenchymal stem cells. SCIREA Journal of Clinical Medicine, 2022, 7(3). [CrossRef]
- Taechangam, N., Kol, A., Arzi, B., Borjesson, D. Multipotent Stromal Cells and Viral Interaction: Current Implications for Therapy. Stem Cell Rev Rep, 2022, 18(1). 214-227 pp. [CrossRef]
- Kun, A., Gubán, B., Miklós, V., Parvaneh, S., Guba, M., Szücs, D., Monostori, T., Varga, J., Varga, Á., Rázga, Z., et al. Herpes Simplex Virus Infection Alters the Immunological Properties of Adipose-Tissue-Derived Mesenchymal-Stem Cells. Int J Mol Sci, 2023, 24(15). [CrossRef]
- Cerezo, G., Zárate, K., Alpuche, S., Cabello, C., Tato, P., Tirado, R. Diagnóstico molecular para la detección de metapneumovirus humano a partir de aislados virales en pacientes pediátricos con infección respiratoria aguda. Investigación en Discapacidad, 2016, 5(2). 88-95 pp. https://www.medigraphic.com/cgi-bin/new/resumen.cgi?IDARTICULO=65493.
- Payment, P.; Trudel, M. Isolation and identification of viruses. In Methods and Techiniques in Virology; Payment, P., Trudel, M., Eds.; Dekker, Inc.: New York, NY, USA, 1993; pp. 32–33, ISBN 0-8247-9101-0.
- Fajardo, G., Mayani, H., Flores, P., Flores, E., Hernández, E., Castro, M., Piña, P., Arriaga, L., Gómez, A., Alarcón, G., Balvanera, O., Montesinos, J. Human Mesenchymal Stem/Stromal Cells from Umbilical Cord Blood and Placenta Exhibit Similar Capacities to Promote Expansion of Hematopoietic Progenitor Cells In Vitro. Stem Cells Int, 2017, (1). [CrossRef]
- Chaires, C., Ambriz, X., Montesinos, J., Hernández, B., Piñón, G., Herrera, M., Hernández, É., Ambrosio, J., Castell, A. Differential adhesion and fibrinolytic activity of mesenchymal stem cells from human bone marrow, placenta, and Wharton’s jelly cultured in a fibrin hydrogel. J Tissue Eng. 2019. [CrossRef]
- Rosales Velázquez, C.A.; Chavéz Gómez, L.G.; Félix Espinosa, C.A.; Moreno-Eutimio, M.A.; Montesinos, J.J.; Fajardo-Orduña, G.R.; Tirado Mendoza, R. Respiratory Syncytial Virus-Infected Human Mesenchymal Stem Cells Overexpress Toll-like Receptors and Change the Pattern of Distribution of Their Cytoskeleton. Viruses, 2025, 17, 763. [CrossRef]
- Swain, N., Thakur, M., Pathak, J., Swain, B. SOX2, OCT4 and NANOG: The core embryonic stem cell pluripotency regulators in oral carcinogenesis. J Oral Maxillofac Pathol, 2020, 24(2). 368-373 pp. [CrossRef]
- Shahriari, S., Gordon, J., Ghildyal, R.. Host cytoskeleton in respiratory syncytial virus assembly and budding. Virol J, 2016, 13. [CrossRef]
- Cifuentes, N., Branttie, J., Slaughter, K., Dutch, R. (2017). Human Metapneumovirus Induces Formation of Inclusion Bodies for Efficient Genome Replication and Transcription. J Virol, 2017, 91(24). [CrossRef]
- Rodríguez, P., Gil, P., Cámara, J., Cámara, A., Paglini, M. Actin cytoskeleton dynamics affect replication of Human Metapneumovirus. bioRxiv. 2022 . [CrossRef]
- Linfield, D., Gao, N., Raduka, A., Harford, T., Piedimonte, G., Rezaee, F. RSV attenuates epithelial cell restitution by inhibiting actin cytoskeleton-dependent cell migration. American Journal of Physiology, 2021, 321(1). L189-L203 pp. [CrossRef]
- Brügger, M., Démoulins, T., Tuba, G., Zumkehr, B., Oliveira, B., Mehinagic, K., Haas, Q., Schögler, A., Rameix, M., Eléouët, J., et al. Pulmonary mesenchymal stem cells are engaged in distinct steps of host response to respiratory syncytial virus infection. PLoS Pathogens, 2021, 17(7). [CrossRef]
- El, F., Cifuentes, N., Chen, J., Zhu, H., Buchholz, U., Moncman, C., Dutch, R. Human metapneumovirus Induces Reorganization of the Actin Cytoskeleton for Direct Cell-to-Cell Spread. PLoS Pathogens, 2016, 12(9). [CrossRef]
- Shahriari, S., Wei, K., Ghildyal R.. Respiratory Syncytial Virus Matrix (M) Protein Interacts with Actin In Vitro and in Cell Culture. Viruses, 2018, 10(10). [CrossRef]
- Dietzel, E., Kolesnikova, Maisner, A. Actin filaments disruption and stabilization affect measles virus maturation by different mechanisms. Virol J, 2013, 10. [CrossRef]
- Genty, N., Bussereau, F. Is cytoskeleton involved in vesicular stomatitis virus reproduction? J Virol, 1980, 34(3), 777-781 pp. [CrossRef]
- Kim, D., Kin, E., Jung, D., Kim, J. (2019). Cytoskeletal alteration modulates cancer cell invasion through RhoA-YAP signaling in stromal fibroblast. PLoS ONE, 2019, 14(3). [CrossRef]
- Berri, F., Haffar, G., Lê, V. B., Sadewasser, A., Paki, K., Lina, B., Wolff, T., & Riteau, B. Annexin V incorporated into influenza virus particles inhibits gamma interferon signaling and promotes viral replication. Journal of virology, 2014, 88(19), 11215–11228. [CrossRef]
- Ampomah, P. B., Kong, W. T., Zharkova, O., Chua, S. C. J. H., Perumal Samy, R., & Lim, L. H. K. (2018). Annexins in Influenza Virus Replication and Pathogenesis. Frontiers in pharmacology, 2018, 9, 1282. [CrossRef]
- Requena, S.; Sanchez-Madid, F.; Matin-Cofreces, N.B. Post- trasncriptional modificactions and stabilization of microtubules regulate transport of viral factor during infections. Biochemical Society Transactions, 2021, 49 (4) 1735-1748 . [CrossRef]
- Seo, D.; Gammon, D.B. Manipulation of Host Microtubule Networks by Viral Microtubule-Associated Proteins. Viruses 2022, 14, 979. [CrossRef]
- Alkharsah, K.R. VEGF Upregulation in Viral Infections and Its Possible Therapeutic Implications. Int. J. Mol. Sci. 2018, 19, 1642. [CrossRef]
- Bourhis, M.; Palle, J.; Galy-Fauroux, I.; Terme, M. Direct and Indirect Modulation of T Cells by VEGF-A Counteracted by Anti-Angiogenic Treatment. Front. Immunol. 2021, 12:616837. [CrossRef]
- Wheeler, K.C.; Jena, M.K., Pradhan, B.S.; Nayak, N.; Das, S.; Carur-Dong, H.; Wheeler, D.S.; Chen, K.; Nayar, N.R. VEGF may contribute to macrophage recruitment and M2 polarization in the decidua. PLOS ONE, 2018, 13(1): e0191040. [CrossRef]
- Kalinowski, A., Galen, B. T., Ueki, I. F., Sun, Y., Mulenos, A., Osafo-Addo, A., Clark, B., Joerns, J., Liu, W., Nadel, J. A., et al. Respiratory syncytial virus activates epidermal growth factor receptor to suppress interferon regulatory factor 1-dependent interferon-lambda and antiviral defense in airway epithelium. Mucosal immunology, 2018, 11(3), 958–967. [CrossRef]
- Fosse, J.H.; Haraldsen, G.; Falk, K.; Edelmann, R. (2021) Endothelial Cells in Emerging Viral Infections. Front. Cardiovasc. Med. 2021, 8:619690. [CrossRef]
- Burgel, P. R., & Nadel, J. A. (2008). Epidermal growth factor receptor-mediated innate immune responses and their roles in airway diseases. The European respiratory journal, 2008, 32(4), 1068–1081. [CrossRef]
- Carlin, C.R. Role of EGF Receptor Regulatory Networks in the Host Response to Viral Infections. Front. Cell. Infect. Microbiol. 2022, 11:820355. [CrossRef]
- Sanz-Cameno, P., Martín-Vílchez, S., Lara-Pezzi, E., Borque, M. J., Salmerón, J., Muñoz de Rueda, P., Solís, J. A., López-Cabrera, M., & Moreno-Otero, R. Hepatitis B virus promotes angiopoietin-2 expression in liver tissue: role of HBV x protein. The American journal of pathology, 2006, 169(4), 1215–1222. [CrossRef]
- Alter, A., Schmiedeck, D., Fussnegger, M. R., Pries, A. R., Freesmeyer, W. B., & Zakrzewicz, A. (2009). Angiopoietin-1, but not platelet-derived growth factor-AB, is a cooperative stimulator of vascular endothelial growth factor A-accelerated endothelial cell scratch closure. Annals of vascular surgery, 2009, 23(2), 239–245. [CrossRef]
- Fiedler, U., & Augustin, H. G. (2006). Angiopoietins: a link between angiogenesis and inflammation. Trends in immunology, 2006, 27(12), 552–558. [CrossRef]
- Thurston, G., Rudge, J. S., Ioffe, E., Zhou, H., Ross, L., Croll, S. D., Glazer, N., Holash, J., McDonald, D. M., & Yancopoulos, G. D. Angiopoietin-1 protects the adult vasculature against plasma leakage. Nature medicine, 2000, 6(4), 460–463. [CrossRef]
- Carlson, T. R., Feng, Y., Maisonpierre, P. C., Mrksich, M., & Morla, A. O. Direct cell adhesion to the angiopoietins mediated by integrins. The Journal of biological chemistry, 2001, 276(28), 26516–26525. [CrossRef]
- Akwii, R.G.; Sajib, M.S.; Zahra, F.T.; Mikelis, C.M. Role of Angiopoietin-2 in Vascular Physiology and Pathophysiology. Cells 2019, 8, 471. [CrossRef]
- Patil, S., Fageeh, H. N., Fageeh, H. I., Ibraheem, W., Alshehri, A. S., Al-Brakati, A., Almoammar, S., Almagbol, M., Dewan, H., Khan, S. S., et al. Hypoxia, a dynamic tool to amplify the gingival mesenchymal stem cells potential for neurotrophic factor secretion. Saudi journal of biological sciences, 2022, 29(5), 3568–3576. [CrossRef]
- Roy, E., Shi, W., Duan, B., & Reid, S. P. Chikungunya Virus Infection Impairs the Function of Osteogenic Cells. mSphere, 2020, 5(3), e00347-20. [CrossRef]
- Mumtaz, N., Dudakovic, A., Nair, A., Koedam, M., van Leeuwen, J. P. T. M., Koopmans, M. P. G., Rockx, B., van Wijnen, A. J., & van der Eerden, B. C. J. Zika virus alters osteogenic lineage progression of human mesenchymal stromal cells. Journal of cellular physiology, 2023, 238(2), 379–392. [CrossRef]
Figure 1.
Characterization of placental mesenchymal stem cells (PL-MSC). Briefly, the first criterion for the characterization is morphology, (A) Representative phase-contrast photomicrograph showing a spindle-shaped morphology in the culture that demonstrates adherence to plastic (magnification 20×). The second criterion is the detection of the cell-surface molecule characteristics of PL-MSC. (B) The cell-surface markers were analyzed using flow cytometry. Positive markers: CD90, CD105, CD73 and HLA-ABC. Negative markers: HLA-DR, CD45 and CD34. Isotype controls were run in parallel for each marker; and the third criterion is the differentiation process, (C) Adipogenic differentiation was indicated by accumulation of neutral lipid vacuoles that were stained with Oil Red O (ADIPO; magnification 20×); Osteogenic differentiation was indicated by Alizarin Red S which binds to the calcium deposits (OSTEO; magnification 20×) and Chondrogenic differentiation was indicated by chondrogenic matrix colored with Alcian blue (CHONDRO; magnification 20×).
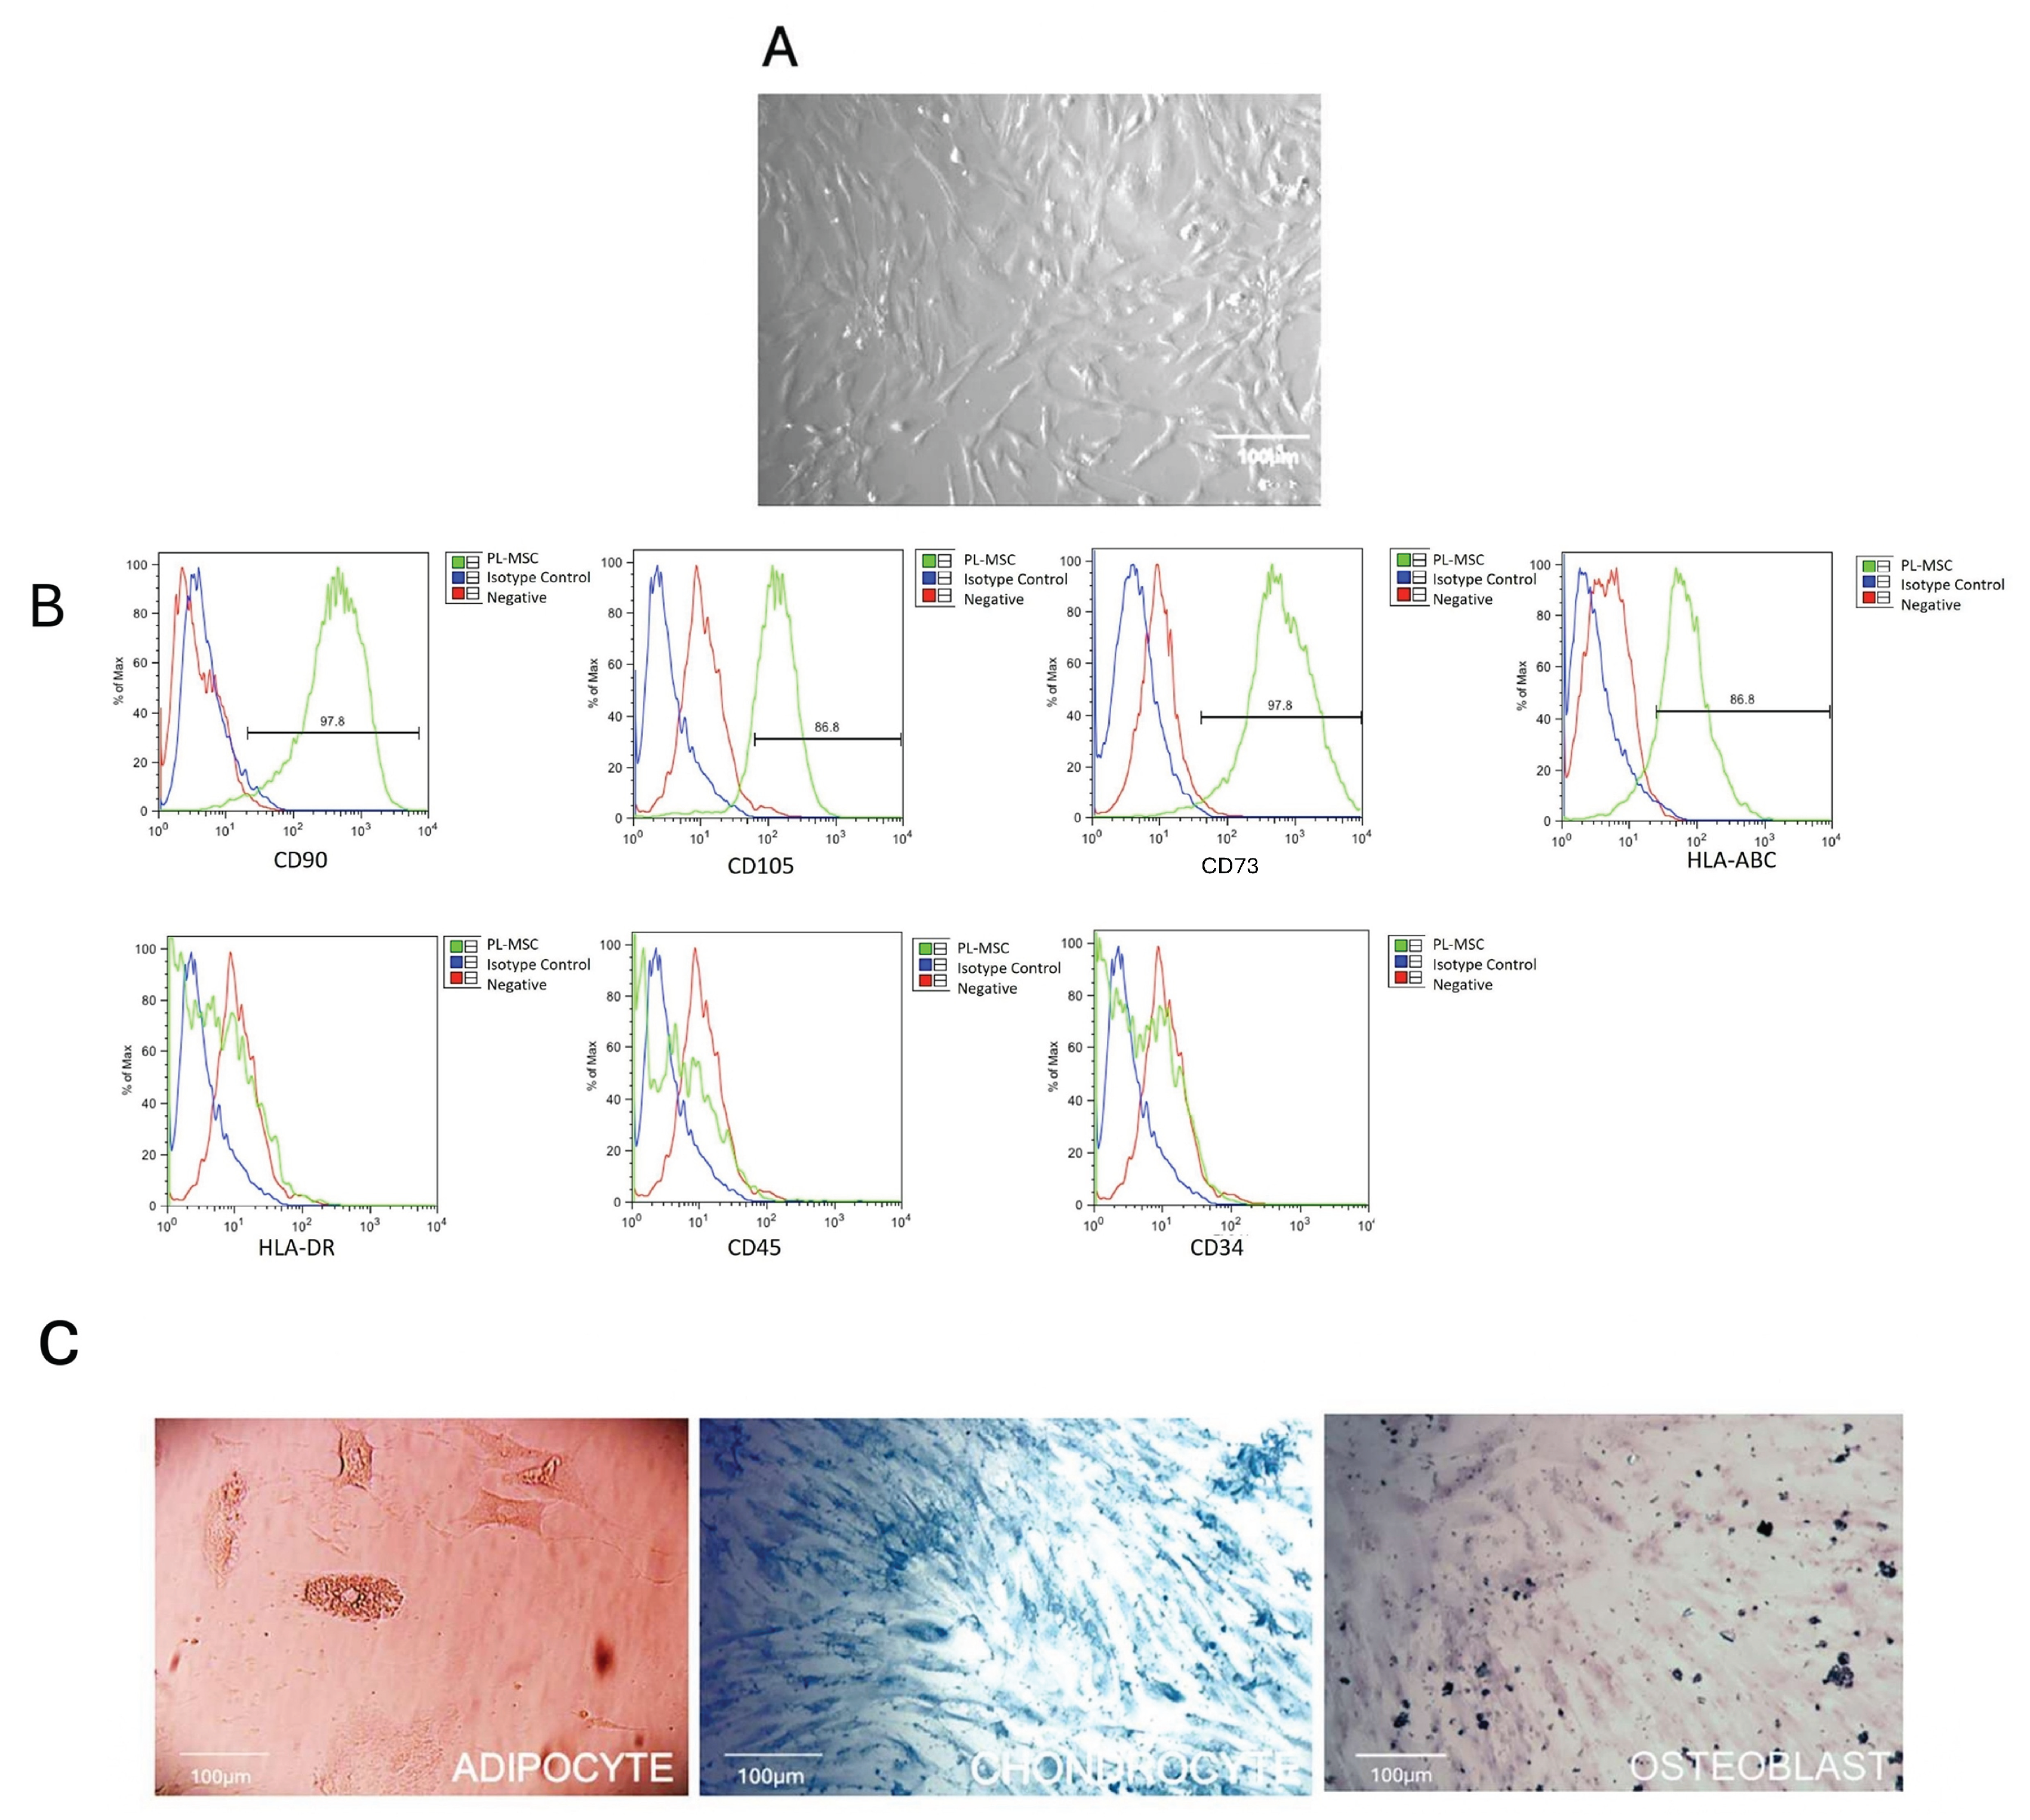
Figure 2.
Morphology of the infected PL-MSC. To visualize the changes in cellular morphology, the mesenchymal stem cell cultures were fixed with methanol (5 minutes), stained with crystal violet (3 minutes) and washed with a jet of water (magnification 20×). (A) control PL-MSC at 5 days of culture; (B) infected PL-MSC at 5 days post-infection; (C) control PL-MSC at 7 days of culture; (D) infected PL-MSC ay 7 days post-infection. The morphological changes or cytopathic effect (syncytia) were circularized to facilitate the identification of the syncytia in each point of the HMPV infection. (E) Immunofluorescence staining for control cells, the nucleus of each cell was stained in blue by DAPI. (F) The HMPV infected cells were labeled red by anti-N commercial monoclonal antibody and Alexa Fluor 594 as a secondary antibody and the nucleus stained in blue by DAPI.
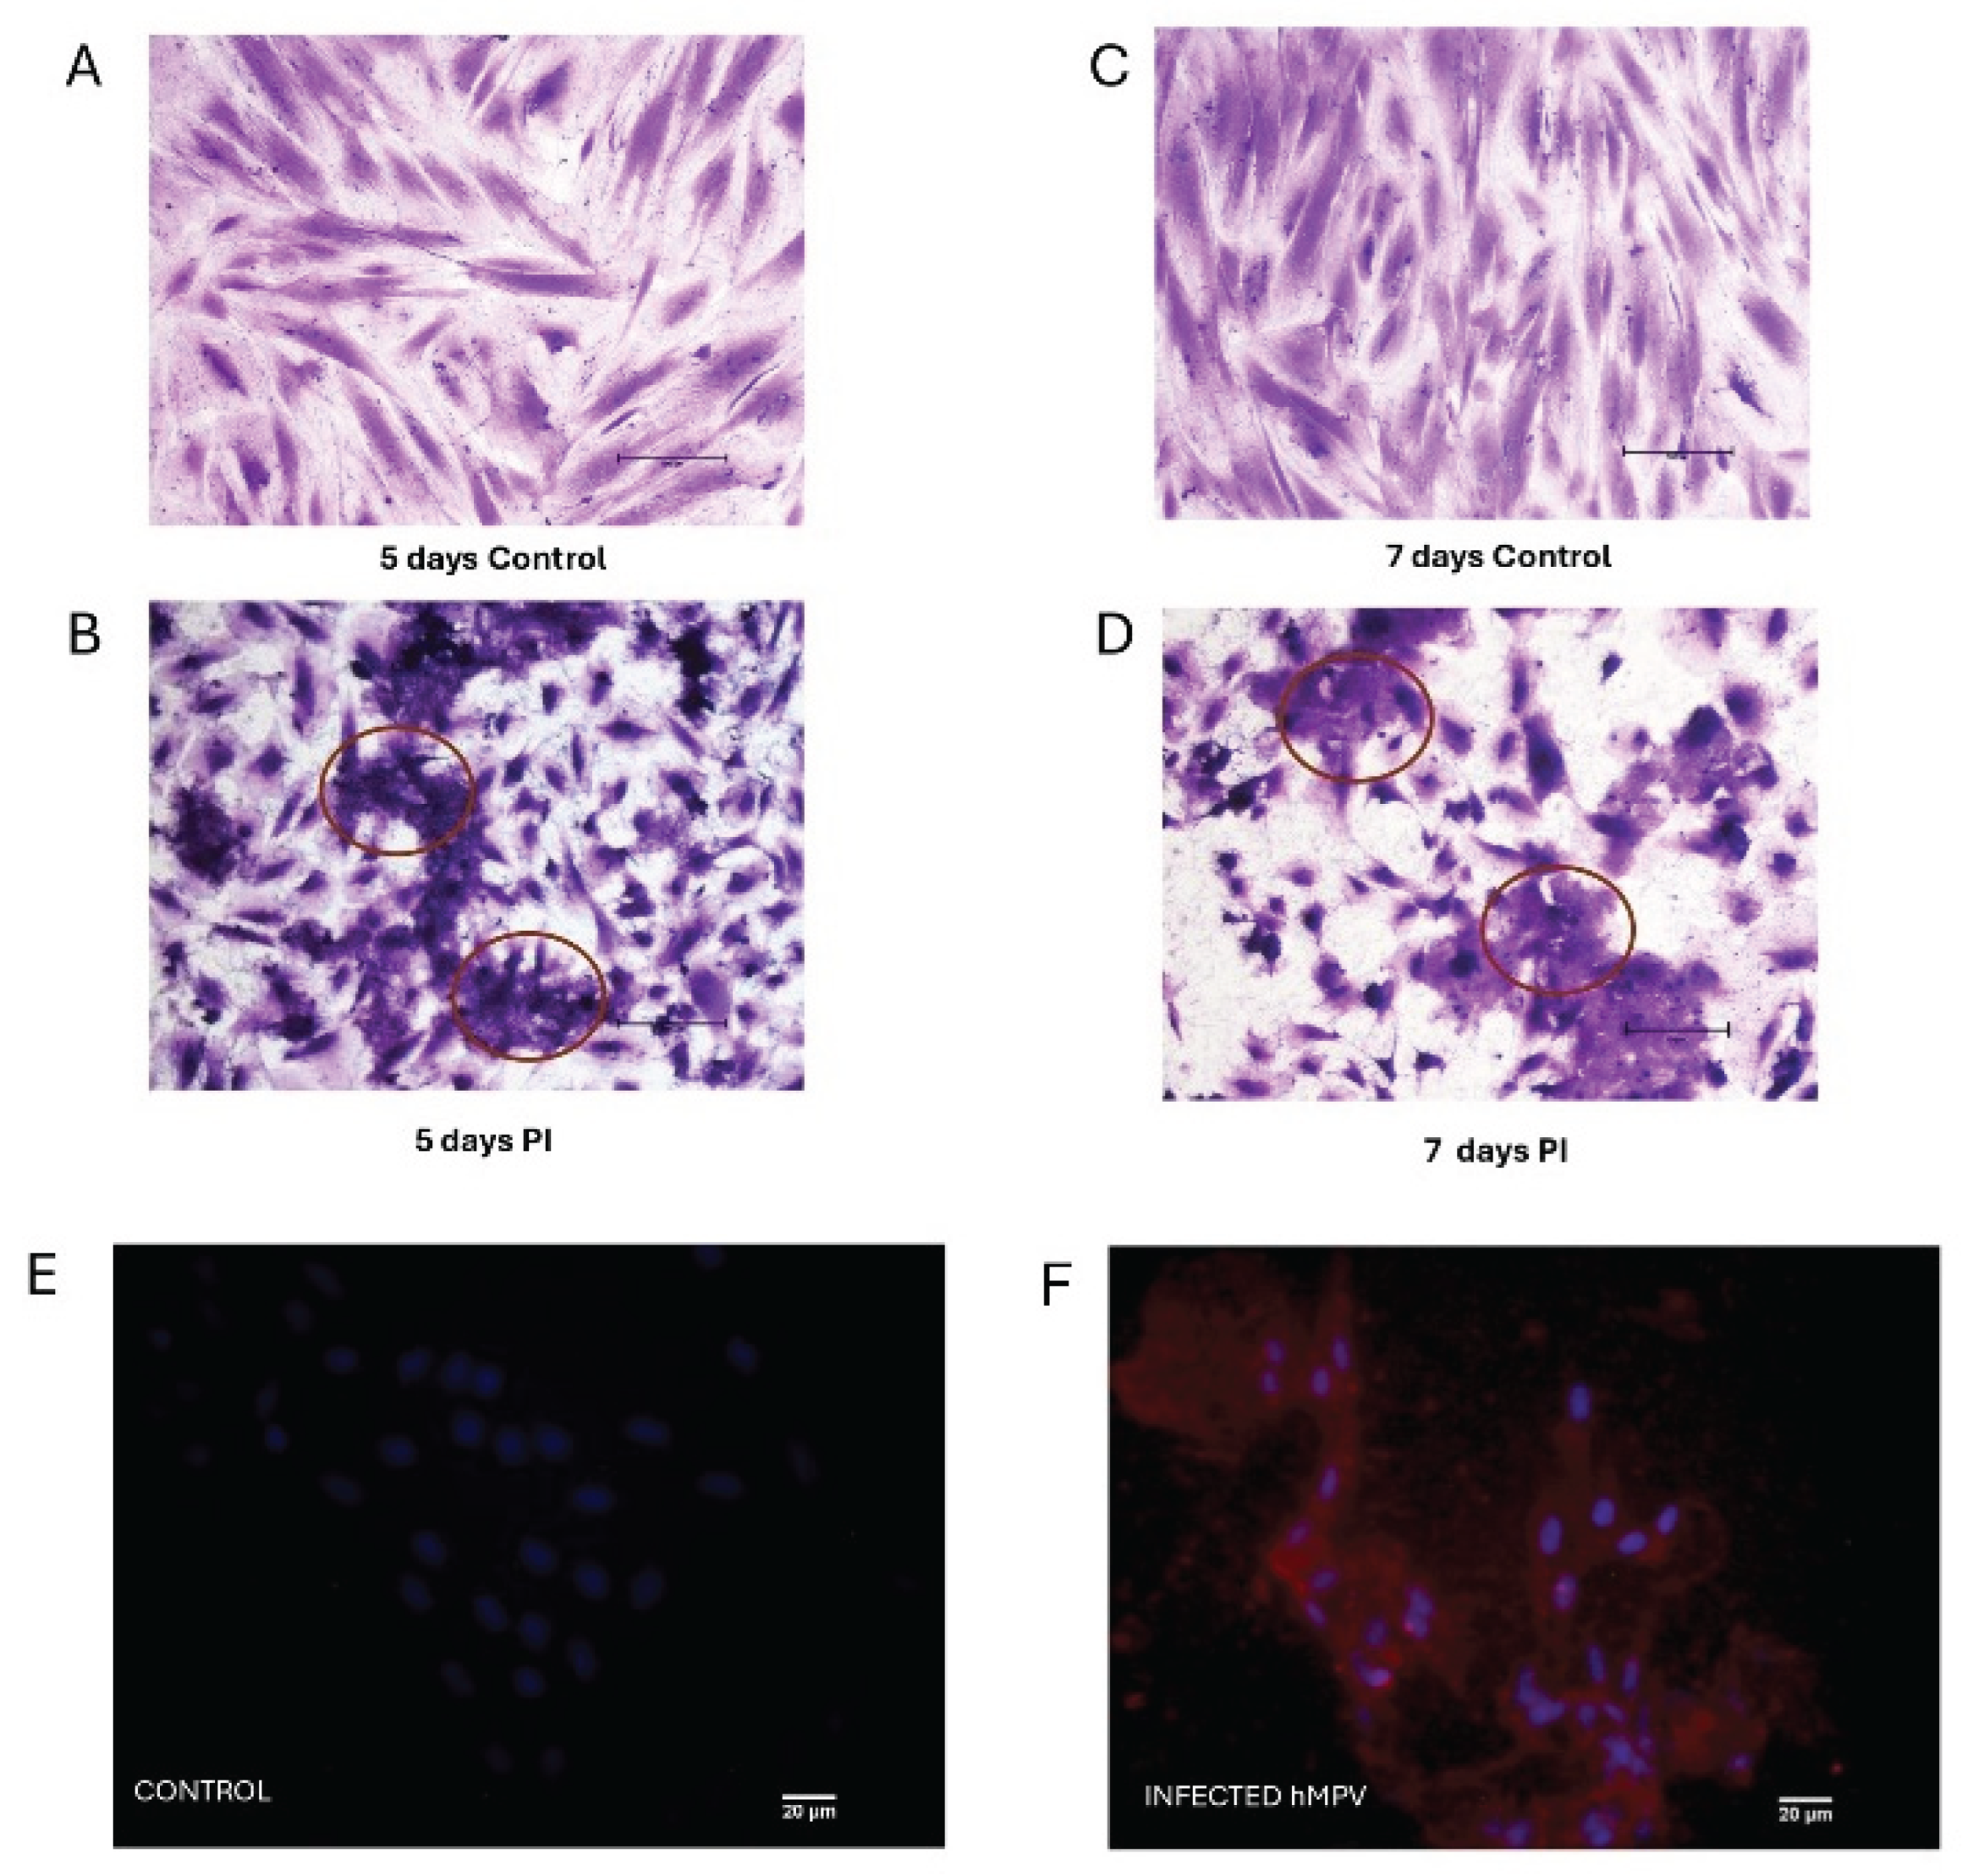
Figure 3.
Changes in the cytoskeletal organization and annexin V localization in PL-MSC. The changes in the pattern of distribution of the cytoskeleton proteins and annexin V as an accessory cytoskeleton protein were studied by immunofluorescence. PL-MSC cultures (magnification 20×) were stained in red with Alexa Fluor 594 phalloidin to detect the actin filaments (A) control; (B) HMPV infected cells. Tubulin filaments were in green because this protein was detected by a specific primary antibody and revealed by a secondary antibody coupled to FITC. (C) Control; (D) HMPV infected cells. The changes in annexin V were detected by a primary antibody coupled to FITC, thus the cells were stained in green. (E) Control; (F) HMPV infected cells. A mounting medium with DAPI was used for nuclear counterstaining, therefore the nucleus was stained in blue. In order to observe the changes in the actin filaments, an amplification of the section in the box was performed. (G and H). (I) Bar graphs show the mean fluorescence intensity for each marker, under control conditions and after infection with HMPV. Statistical analysis was performed using an unpaired t-test. All results were considered significant when p ≤ 0.05, ns (not statistically significant).
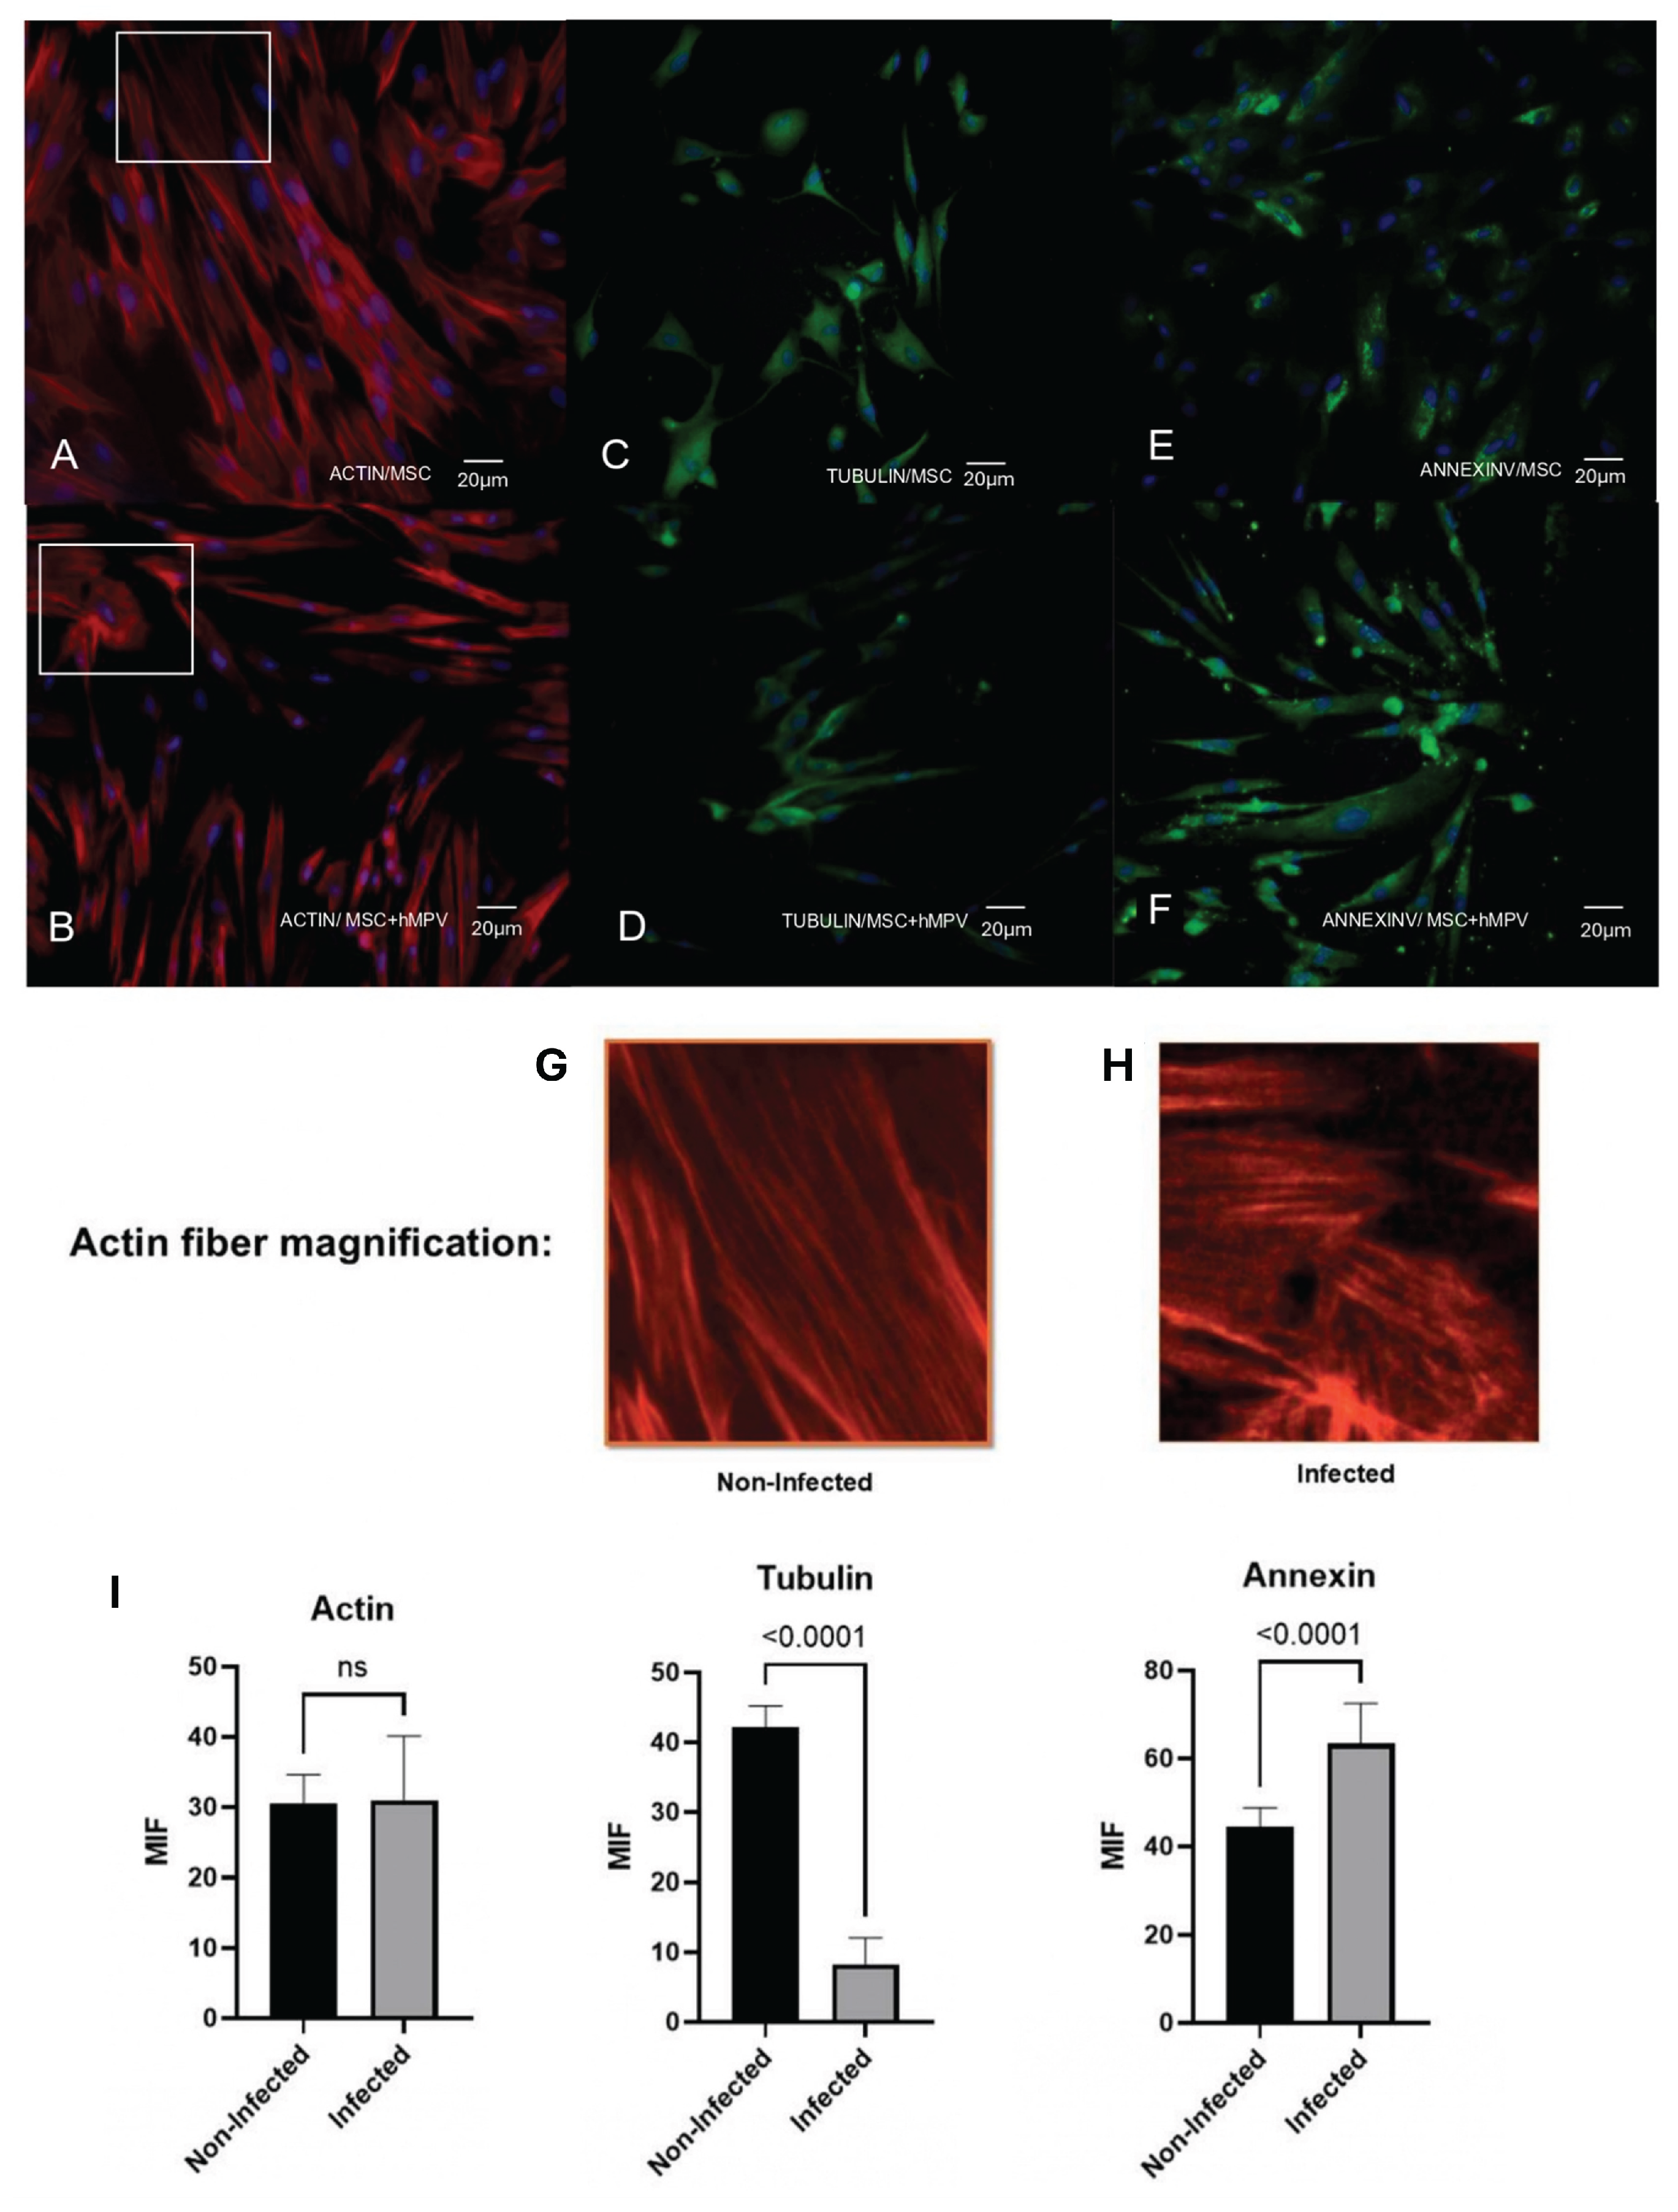
Figure 4.
Flow cytometry analysis of PL-MSC surface markers. Representative histograms show the per-centage of positive markers: CD90, CD105, CD73 and HLA ABC under control conditions and after infection with HMPV. Isotype controls are shown in blue. Negative markers: HLA-DR, CD45 and CD34 and isotype controls (blue) were run in parallel. The bar graphs represent the mean fluorescence intensity (MFI) for the positive markers, with and without HMPV infection. Statistical analysis was performed using an unpaired t-test. All results were considered significant when p ≤ 0.05, ns (not statistically significant).
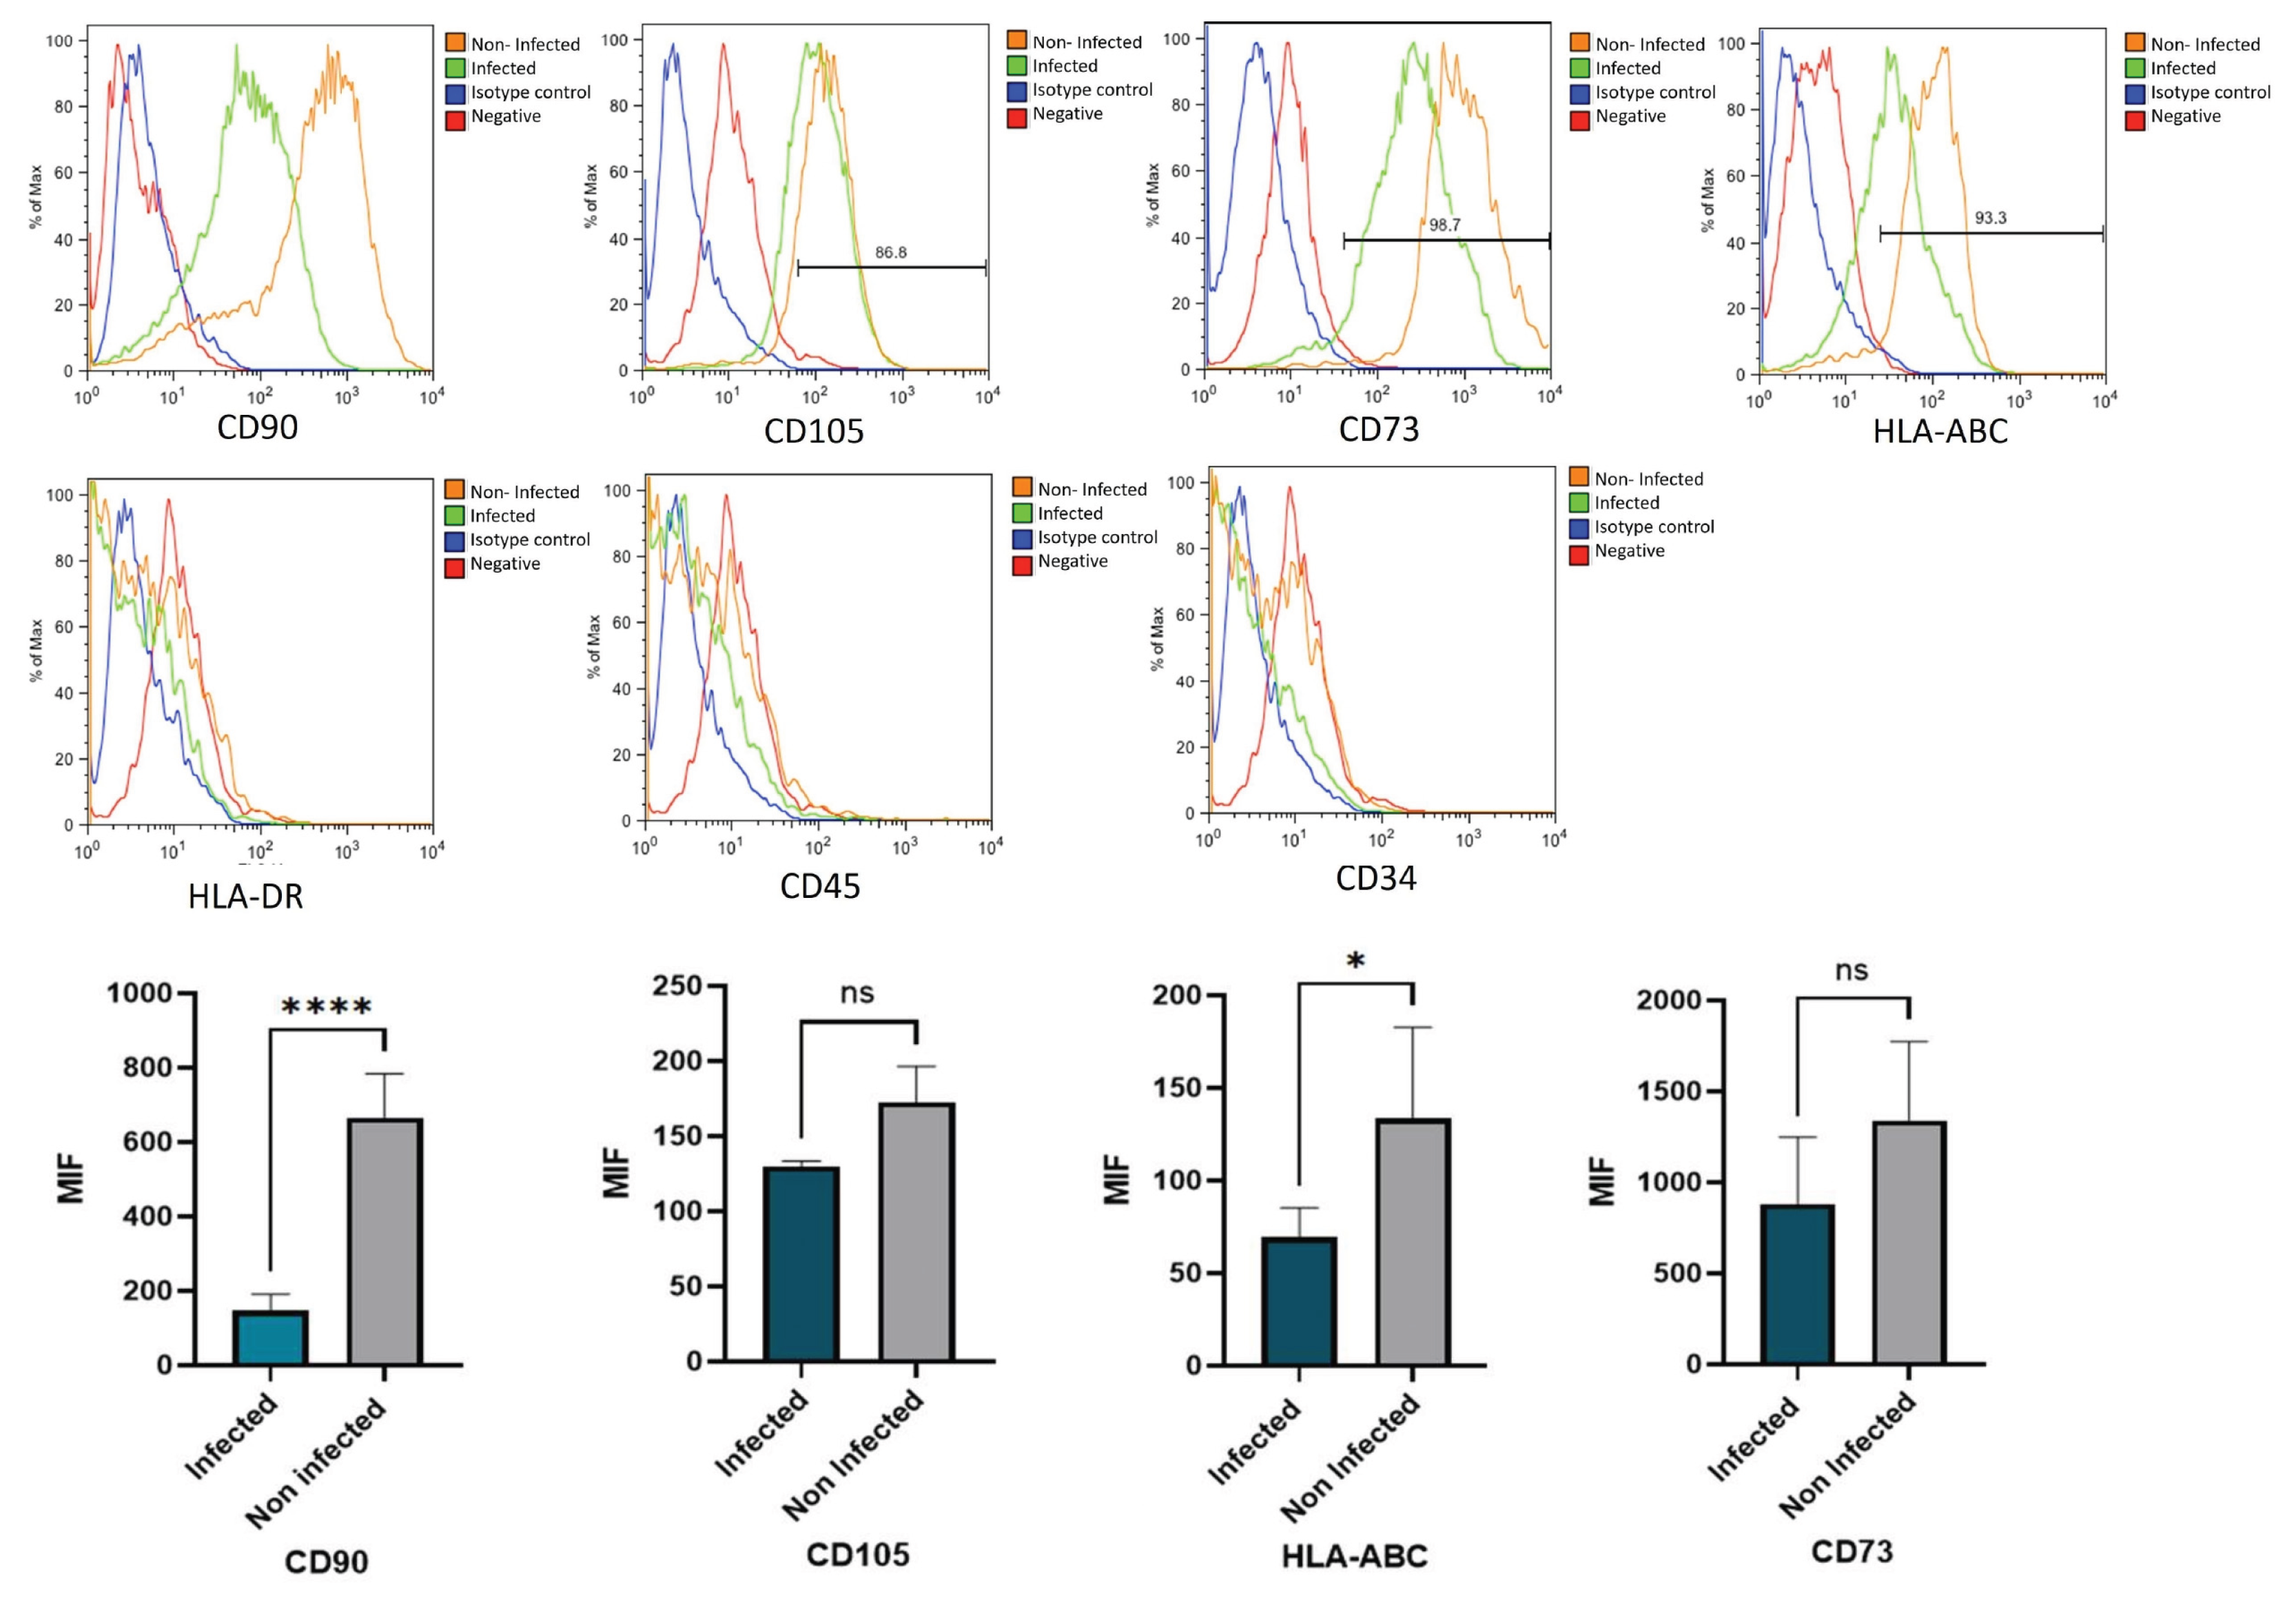
Figure 5.
Capacity of differentiation of PL-MSC. The PL-MSC were differentiated in the three main lineages (Adipocytes, Chondrocytes and Osteocytes), for this process the cells were cultured with differential mediums for 10 days. Briefly, the PL-MSC were cultured with adipogenic medium (insulin and indomethacin); chondrogenic medium (dexamethasone, ascorbic acid, and β-glycerol) and osteogenic medium (dexamethasone, ascorbate, insulin–transferrin–selenium supplement, sodium pyruvate). PL-MSC cultures (magnification 20×) were stained in red with Alexa Fluor 594 phalloidin to detect the actin filaments. Tubulin filaments were in green because this protein was detected by a specific primary antibody and revealed by a secondary antibody coupled to FITC. Annexin V was detected by a primary antibody coupled to FITC, thus the cells were stained in green. Nuclear counter-staining was performed with DAPI (blue). (A) Adipocytes; (B) Chondrocytes; (C) Osteocytes. Bar graphs show the mean fluorescence intensity for each marker, under control conditions and after infection with HMPV. Statistical analysis was performed using an unpaired Mann-Whitney test. All results were considered significant when p ≤ 0.05, ns (not statistically significant).
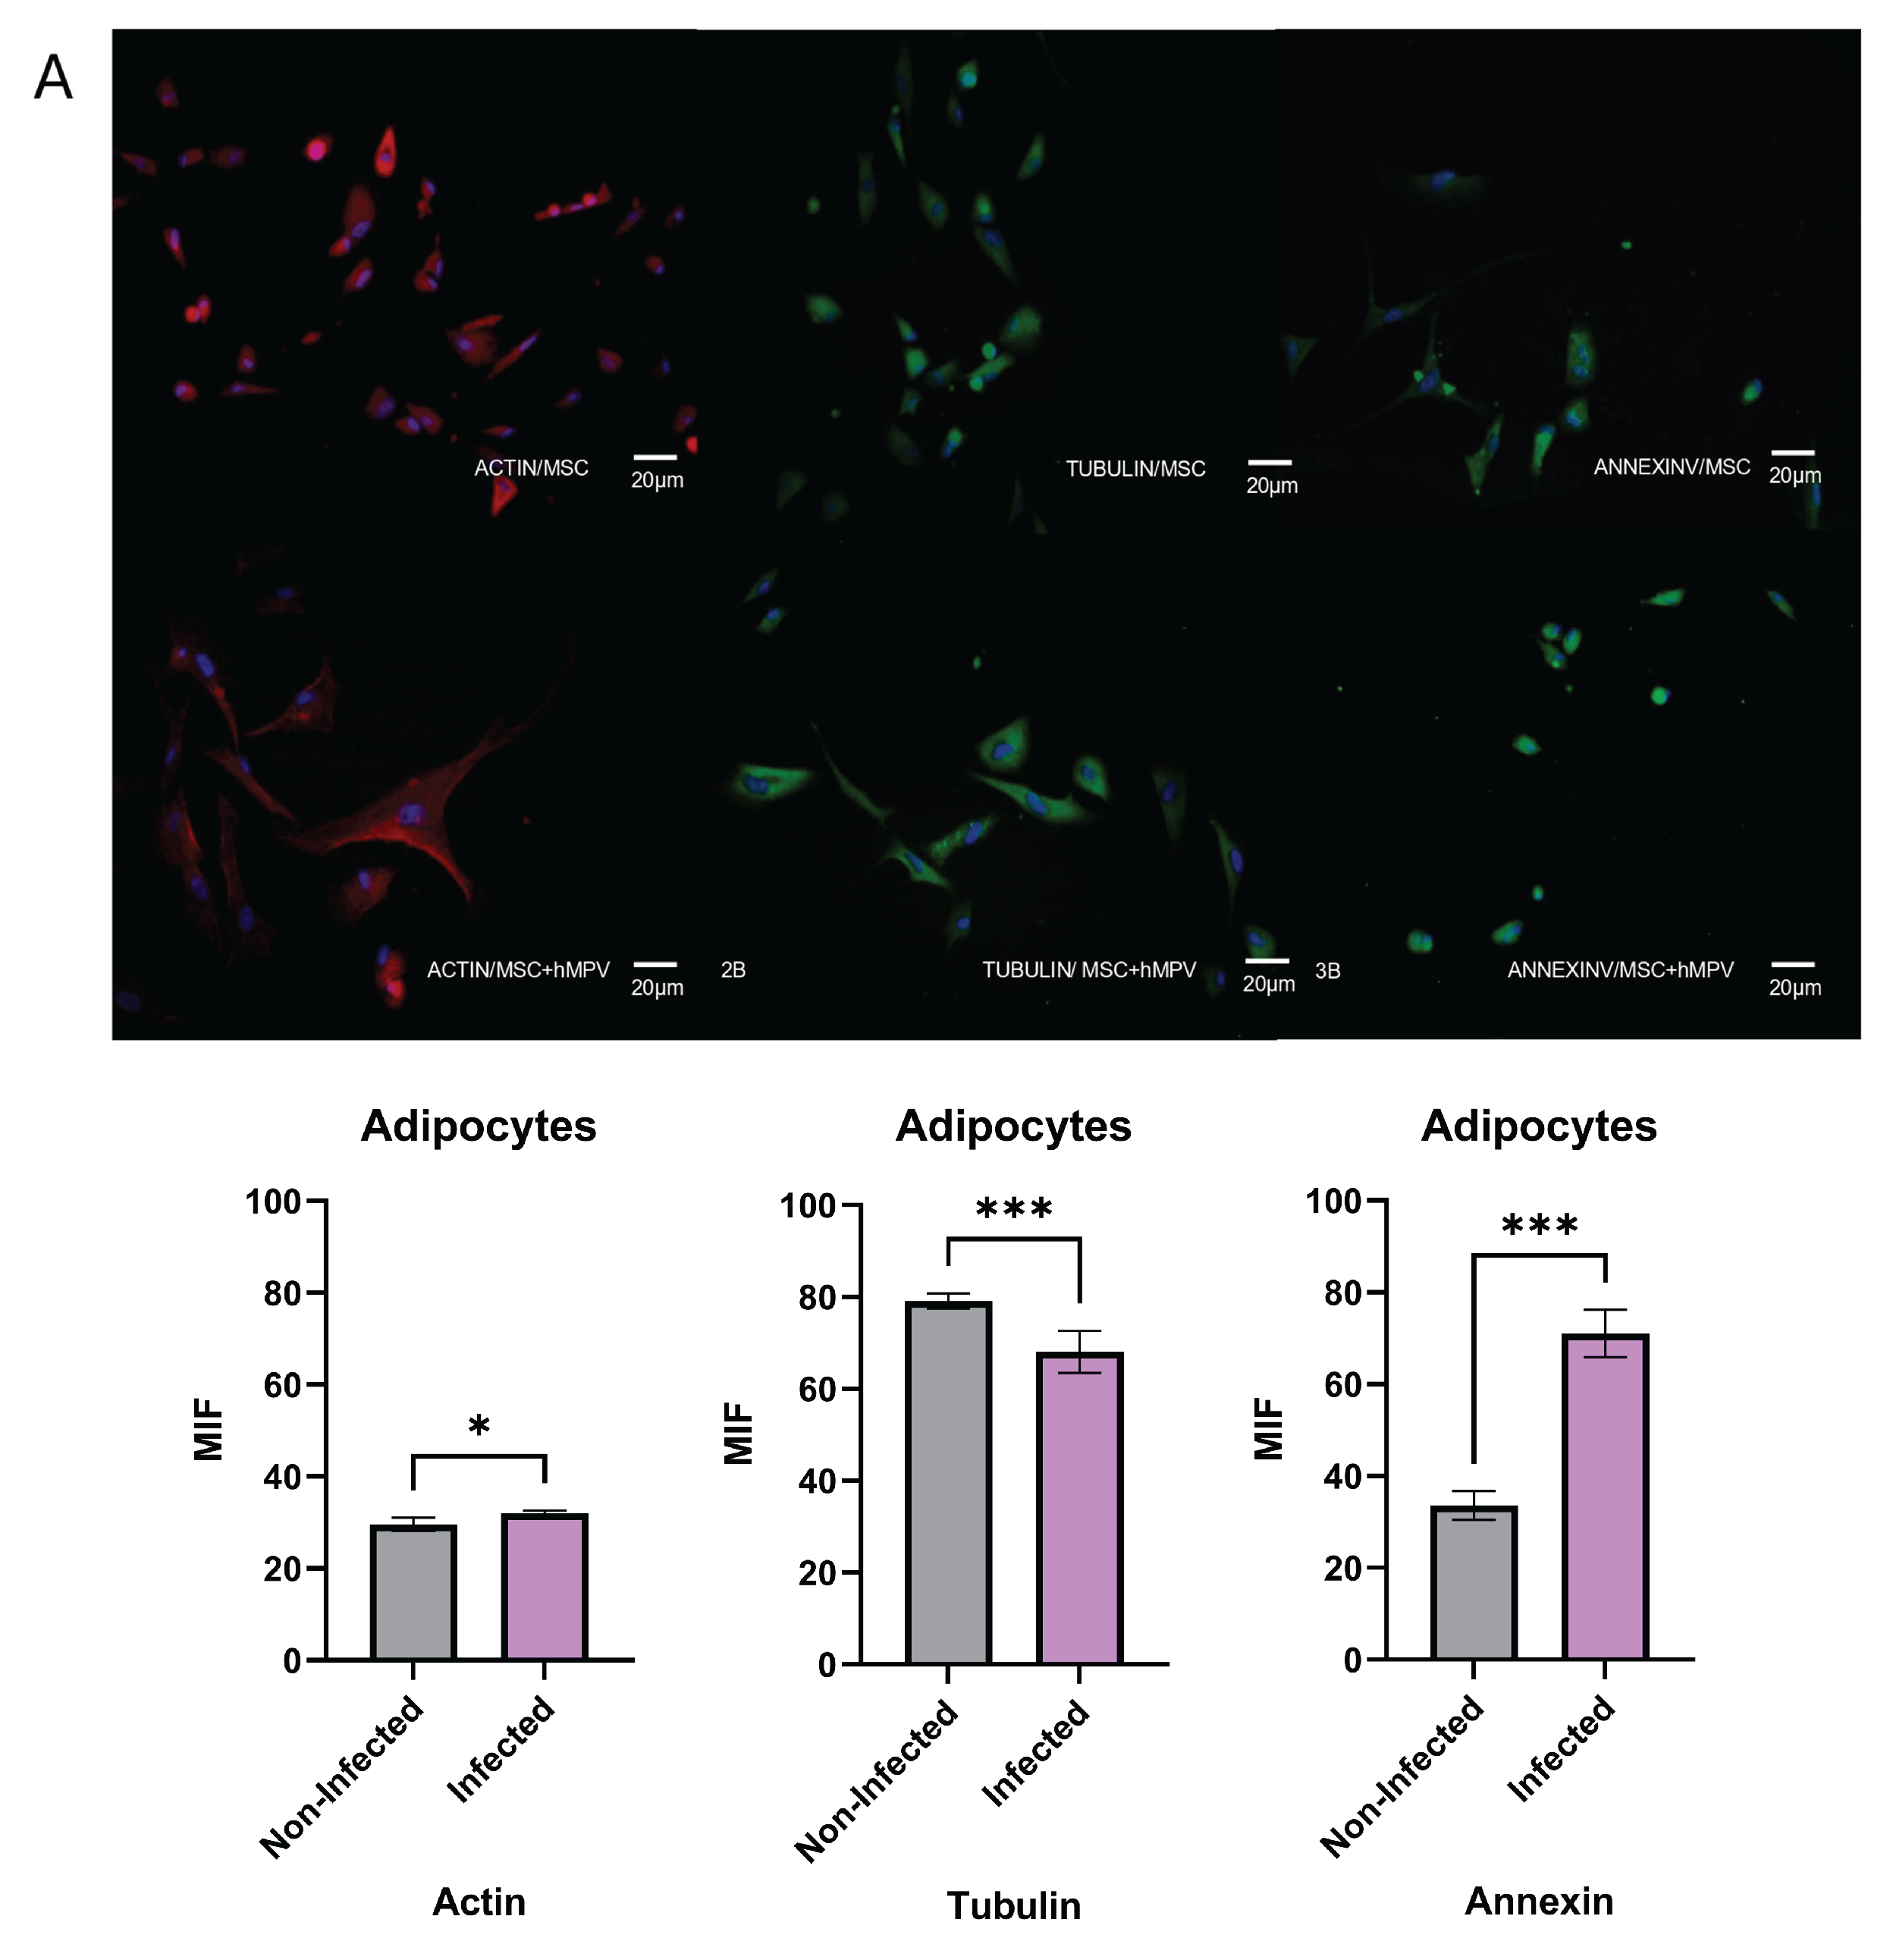
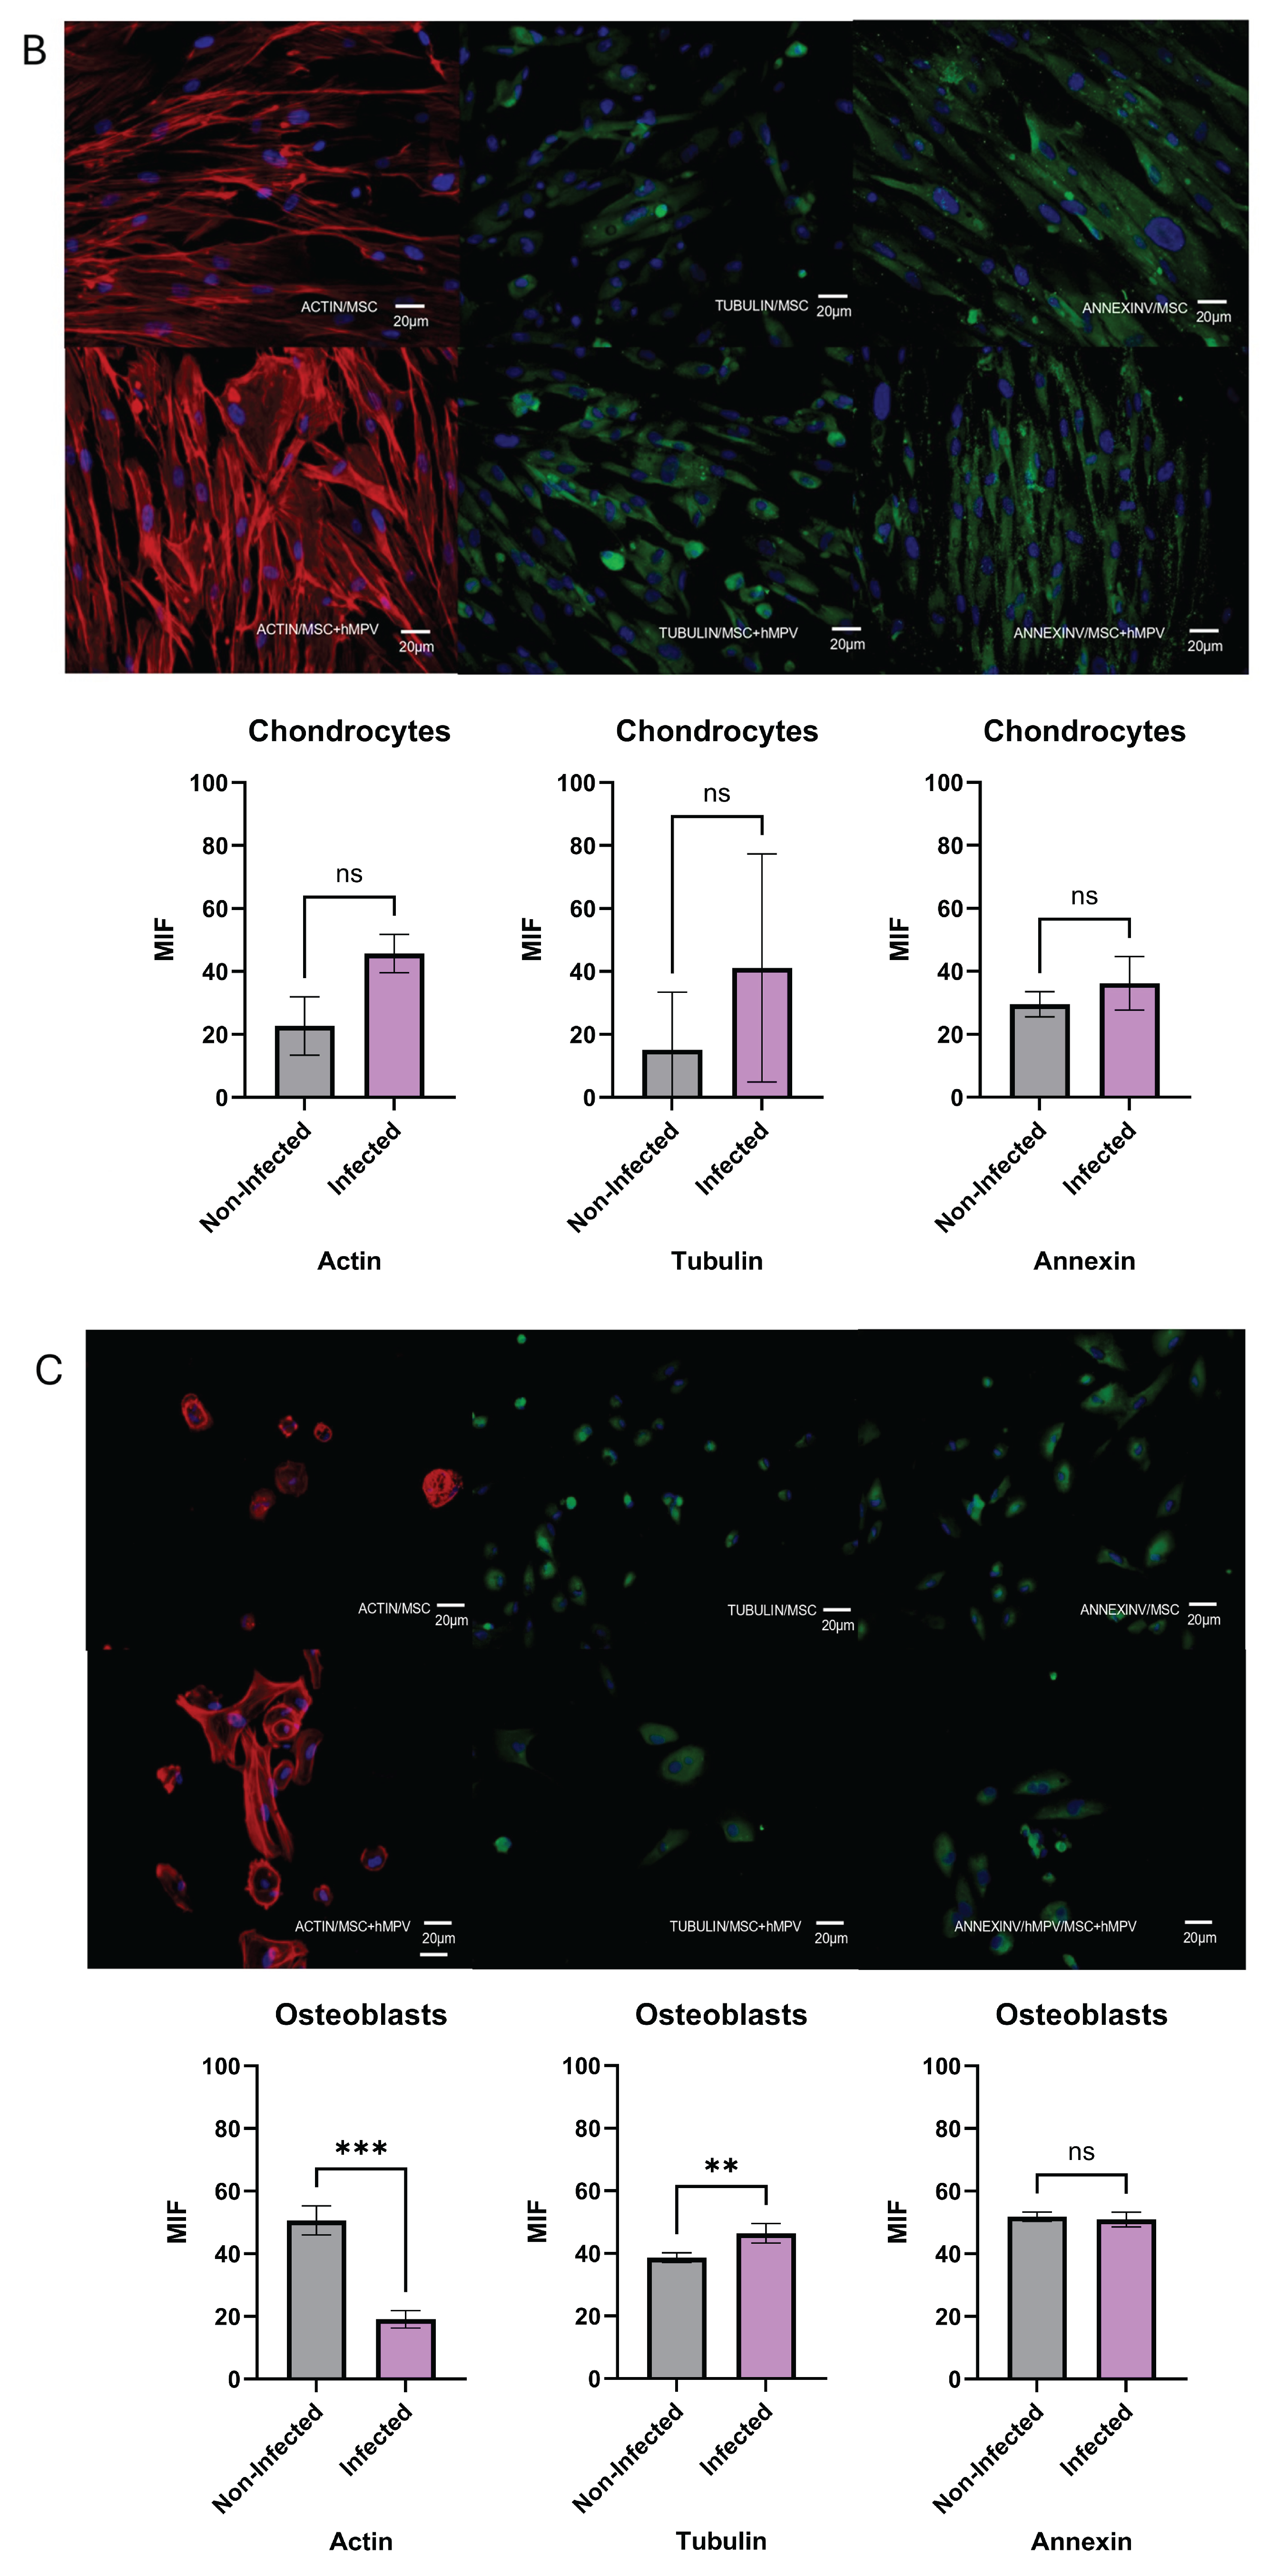
Figure 6.
Secretory profile of PL-MSC. PL-MSC growth factors were analyzed by LEGENDplex. Briefly, the supernatants were collected from the control cells and the HMPV infected cells after 48 hpi. The supernatants under control conditions and after infection with HMPV were quantified with Bio-Legend’s LEGENDplex human Growth Factor Panel (13-plex). Angiopoietin-2 (Ang-2), EGF, EPO, FGF-basic, G-CSF, GM-CSF, HGF, M-CSF, PDGF-AA, PDGF-BB, SCF, TGF-α, and VEGF (Bio-Legend). The data were analyzed using Bio-Legend’s software Qognit V. The data were expressed in pg/mL. Statistical analysis was performed using an unpaired t-test. All results were considered significant when p ≤ 0.05, ns (not statistically significant).
Disclaimer/Publisher’s Note: The statements, opinions and data contained in all publications are solely those of the individual author(s) and contributor(s) and not of MDPI and/or the editor(s). MDPI and/or the editor(s) disclaim responsibility for any injury to people or property resulting from any ideas, methods, instructions or products referred to in the content. |
© 2025 by the authors. Licensee MDPI, Basel, Switzerland. This article is an open access article distributed under the terms and conditions of the Creative Commons Attribution (CC BY) license (http://creativecommons.org/licenses/by/4.0/).
Copyright: This open access article is published under a Creative Commons CC BY 4.0 license, which permit the free download, distribution, and reuse, provided that the author and preprint are cited in any reuse.


