Submitted:
31 August 2025
Posted:
03 September 2025
You are already at the latest version
Abstract
Titanium dioxide nanoparticles were synthesized via hydrothermal treatment of tetrabutyl titanate in sulfuric acid, with controlled reaction times (10 h and 24 h) and zinc sulfate as a modifier. XRD confirmed exclusive formation of the anatase phase, with longer reaction times promoting crystallite growth. SEM and BET analyses revealed that Zn addition suppressed agglomeration, reduced particle size, and altered porosity, while all samples retained mesoporous character. UV–Vis diffuse reflectance spectroscopy showed a band gap near 3.2 eV, unaffected by Zn content or morphology. Photoconductivity studies demonstrated that under vacuum, conductivity increased by several orders of magnitude, particularly for 24 h Zn-modified samples, due to the generation of oxygen vacancies and Ti3+ states that prolong carrier lifetime. In particular, the TS24Z8 sample exhibited a photoconductivity enhancement of five orders of magnitude relative to its dark conductivity, and nearly 30 times higher than that of the commercial P25 benchmark. In contrast, in air, photoconductivity remained low because of strong surface recombination with adsorbed oxygen. These results highlight the key role of hydrothermal duration and zinc modification in tailoring the defect structure and electronic response of TiO2, offering insights for improved photocatalytic and optoelectronic applications.
Keywords:
Hydrothermal synthesis
; Photoconductivity
; Titanium dioxide
; Zinc modification
; Oxygen Vacancies
1. Introduction
Titanium dioxide (TiO2) is one of the most extensively studied semiconductor materials due to its excellent chemical stability, non-toxicity, and unique electronic and optical properties. These characteristics make it highly suitable for applications such as photocatalysis, solar energy conversion, and environmental remediation [1]. However, the practical performance of pristine is often limited by its wide band gap, which restricts absorption to the ultraviolet region, and by the rapid recombination of photogenerated electron-hole pairs [2]. As a result, strategies to enhance its visible-light activity and charge separation efficiency have become a major focus in material science research [3].
Beyond its fundamental scientific significance, has established itself as one of the most versatile functional materials, with applications spanning both environmental and energy-related fields. In environmental remediation, -based photocatalysts are widely utilized for the degradation of organic contaminants in wastewater treatment [4,5,6], removal of volatile pollutants in air purification [7,8,9], and as self-cleaning and anti-fogging coatings on glass [10,11,12], ceramics [13], and construction surfaces [14]. The strong oxidative capability of under irradiation has also enabled its use in antimicrobial and antibacterial coatings [15,16,17], with growing interest in healthcare and food packaging industries [18]. In the field of energy conversion and storage, has been incorporated as a photoanode material in dye-sensitized and perovskite solar cells [19,20,21], as an electrode material in lithium-ion and sodium-ion batteries [22,23,24], and as a photoelectrode in water-splitting systems for sustainable hydrogen production [25,26,27]. More recently, nanostructures have been explored for applications in gas sensors [28], supercapacitors [29], and even biomedical devices such as drug delivery systems [30]. These diverse applications demonstrate the wide technological impact of , while at the same time highlighting the urgency of addressing its intrinsic drawbacks in order to optimize efficiency and extend its practical utility in real-world systems.
To achieve materials with desirable properties, a variety of synthesis techniques have been developed and widely studied [31]. Conventional methods such as sol-gel processing, precipitation, and chemical vapor deposition (CVD) allow for the preparation of with controlled particle size and phase composition, while approaches like hydrothermal and solvothermal synthesis provide additional advantages in adjusting morphology, crystallinity, and surface area. More advanced strategies, including atomic layer deposition (ALD) and electrochemical methods, have been employed for fabricating thin films and nanostructures with precise dimensional control. Each of these routes offers distinct benefits and limitations, and the choice of synthesis method often determines the resulting photocatalytic and electronic performance of -based materials. In this work of ours [32], /ZnO nanocomposite thin films were synthesized via the sol-gel method, and their photoconductivity was studied at 300 K. The composites exhibited significantly reduced photoconductivity compared to the pure oxides, with O showing around 2.60 in vacuum and 3.8 in air, indicating enhanced electron-hole recombination. Rajkumar and Arunachalam [33] synthesized Lanthanum-doped using the co-precipitation method and annealed it at C. Structural and morphological analyses confirm improved crystallinity and needle-like particle formation upon doping and annealing. Photoconductivity studies in air show that exhibits a photosensitivity of 2.40, compared to 0.28 for pure , corresponding to an 8.6-fold enhancement, attributed to reduced recombination centers and prolonged carrier lifetimes due to effective photodesorption of surface oxygen molecules. Fukuhara et al. [34] synthesized fine powders via chemical vapor deposition (CVD) using titanium tetraisopropoxide and studied their photocatalytic activity. produced at C was amorphous and inactive, while higher temperatures (up to C) yielded crystalline particles with improved activity despite reduced surface area. Calcination at C further enhanced the performance of low-temperature powders by increasing crystallinity. Notably, although the C had a smaller surface area than commercial JRC-TIO-4, its activity per unit surface area was higher, demonstrating that controlled CVD synthesis can yield more efficient photocatalysts. In this work [35], we studied Zn-modified /ZnO nanocomposites prepared via a one-step hydrothermal/solvothermal method. Zn incorporation promoted anatase crystallization, reduced aggregation, and slightly modified the band gap. The 8% Zn sample (TZ8) showed the highest photoconductivity ( = 5.80) in vacuum, 46% higher than and 65% higher than P25, corresponding to enhanced photocatalytic NOx degradation under UV light. Sasinska et al. [36] investigated the effect of hydrogen plasma treatment on thin films grown by atomic layer deposition to enhance photoanode performance. Plasma-treated showed improved visible-light absorption, likely due to surface reduction, with XPS confirming the formation of states. Photocurrent densities increased eightfold ( at 0.8 V vs. NHE) compared to untreated (), attributed to localized mid-gap states that improve separation and transport of photoexcited charge carriers under UV illumination. Kamble et al. [37] prepared amorphous thin films on FTO glass via low-cost chemical bath deposition. FE-SEM revealed creamy, high-surface-area morphology, and UV–Vis/PL studies showed band gaps of 2.84-3.43 eV. Photoelectrochemical measurements indicated a 3.24% conversion efficiency with a 0.43 fill factor, demonstrating the films potential for solar cell applications.
In this work, nanoparticles were synthesized via hydrothermal treatment of tetrabutyl titanate in sulfuric acid, with zinc sulfate as a modifier and reaction times of 10 h and 24 h. XRD confirmed pure anatase formation, with longer durations promoting crystallite growth. SEM and BET analyses showed that Zn incorporation suppressed agglomeration, reduced particle size, and modified porosity while maintaining mesoporous character. UV–Vis spectroscopy indicated a stable band gap of approximately 3.2 eV, independent of Zn content. Photoconductivity measurements revealed a strong enhancement under vacuum, particularly for 24 h Zn-modified samples, due to oxygen vacancies and states that prolong carrier lifetime, while in air, recombination with adsorbed oxygen limited conductivity. This study highlights the novel use of controlled hydrothermal duration combined with Zn modification to engineer defect structures and electronic properties of , providing a strategic approach to improve photocatalytic activity and optoelectronic performance.
2. Materials and Methods
During the preparation of titanium dioxide, the raw materials and reagents listed in Table 1 were used. Titanium alkoxide, specifically tetrabutyl titanate (TBT), served as the precursor. Deionized water was employed for hydrolysis, while ions were introduced as modifiers. The acidic environment provided by sulfuric acid was employed to control the phase formation of . Figure 1 schematically illustrates the stages involved in the synthesis of the titanium dioxide powder.
For the synthesis, 5.50 ml of was added to 100 ml of deionized water to prepare a 1 M sulfuric acid solution. Then, 3.32 ml of TBT was added dropwise, keeping the solution transparent. In some syntheses, specified amounts of O were also incorporated. The solution was stirred for approximately 30 minutes and then transferred into Teflon-lined autoclaves, filled to 80% of their volume. After sealing the autoclaves in steel containers, they were placed in an oven at for either 10 or 24 hours. Following the reaction, the autoclaves were removed from the oven and allowed to cool to room temperature. The mixture was collected, and the precipitate was separated from the supernatant by centrifugation. The precipitate was washed several times with deionized water until the sulfuric acid was completely removed and the pH reached neutrality. Finally, the washed sample was placed in a glass dish and dried in an oven at overnight to remove residual moisture. Table 2 summarizes the compositions of the samples along with their respective reaction times.
The crystalline phases of the prepared samples were analyzed using an X-ray diffractometer (Siemens D500), with diffraction patterns recorded within the 2 range of , employing a step size of 0. and a counting time of 4 s per step. The surface morphology and nanostructural features were investigated by scanning electron microscopy (SEM) using an FEI Inspect instrument, operating with a tungsten filament at 25 kV and utilizing a secondary electron detector for image acquisition. Textural properties, including porosity and surface area, were determined through nitrogen adsorption-desorption analysis carried out at liquid nitrogen temperature using a Quantachrome Autosorb-iQ system. The specific surface area was calculated by the Brunauer–Emmett–Teller (BET) method, while pore size distribution was obtained using the Barrett–Joyner–Halenda (BJH) approach. Finally, the optical characteristics were assessed by UV–Vis diffuse reflectance spectroscopy with a Shimadzu UV-2100 spectrophotometer equipped with an integrating sphere, employing as the non-absorbing reference material.
Photoconductivity experiments were carried out in vacuum and air at room temperature (300 K). The powdered samples were compressed into pellets with a diameter of 10 mm, and coplanar silver electrodes were deposited under vacuum using an evaporation system. Each electrode measured 7 mm in length with a spacing of 0.8 mm between them. A bias voltage of 5 V was applied during testing, as current-voltage curves indicated ohmic response within the 1-10 V range. Measurements were performed inside a vacuum cryostat, where photocurrent was monitored under both illumination and dark conditions using a Keithley 6517A electrometer, with data collected at 10 s intervals. Illumination was provided by a 100 W xenon lamp equipped with a heat filter to minimize thermal artifacts. The light intensity at the sample surface was adjusted to , measured using an Ophir PD300-BB radiometer head. Each specimen was exposed to two light cycles of 1200 s, interspersed with two dark intervals of equal duration. Prior to testing, the pellets were annealed at C for 90 min to remove any residual photogenerated effects, then stored overnight in darkness to stabilize at ambient temperature.
3. Results and Discussion
3.1. Crystalline Structures
Figure 2 show the X-ray diffraction (XRD) patterns of sample series after 10 and 24 hours of reaction times. All samples crystallized exclusively into the anatase phase, in agreement with the reference pattern [JCPDS No. 73-1764], indicating that the acidic environment, and in particular the presence of sulfate ions, favors the selective formation of anatase [38]. No peaks corresponding to zinc were detected, likely due to its removal during washing. Using the Scherrer equation, the crystallite sizes were calculated from the three main anatase reflections, and the results are summarized in Table 3.
For the TS10 series, crystallite sizes range from 15.5 to 16.6 nm, suggesting that the gradual addition of Zn results in only a slight increase in size, while in the TS24 series, the progressive addition of ZS produces a significant increase, with values between 17.5 and 22 nm. These findings indicate that longer reaction times (i.e., extended hydrothermal treatment in the autoclave) promote further crystallite growth [39,40,41]. Moreover, the XRD pattern of the TS10Z4 sample exhibits anisotropic crystallite growth along different crystallographic directions: broadening of the (004) reflection alongside a narrower (200) peak suggests smaller dimensions along the c-axis and larger ones along the a-axis [42,43]. Consequently, the (001) surface of anatase is larger than the (101) surface, implying that the spherical particles predominantly expose (001) facets [43].
3.2. Morphology and Band Gap Analysis
The morphology of the samples was examined using scanning electron microscopy (SEM). Figure 3 present SEM images for all samples, illustrating both particle size and surface morphology. The TS10 sample exhibits an average particle size of approximately 160 nm and shows evidence of agglomeration. With the addition of 4%Zn and 8%Zn, the average particle size decreases to 90 nm and 77 nm, respectively, accompanied by a slight reduction in agglomerates. The TS24 sample displays a smaller average particle size of about 85 nm, which further decreases to 78 nm and 68 nm upon the addition of 4%Zn and 8%Zn, respectively. This indicates that Zn addition reduces particle size and agglomeration in both series. A comparison between the two series reveals that the TS10 samples generally exhibit larger particle sizes than those of the TS24 series. Moreover, the 24-hour samples show fewer agglomerates, suggesting that prolonged hydrothermal treatment in the autoclave (i.e., increased reaction time) promotes more pronounced crystal growth [39,40,41].
In order to determine the reflection and absorption regions of the samples in the UV-Vis range, they were analyzed using UV-Vis spectroscopy. The data obtained from the spectra were then used, along with the Kubelka–Munk function [44] to calculate the band gap energy () of the samples, with the results summarized in Table 4. Figure 4a,c show the diffuse reflectance spectra of this series of titania samples, while Figure 4b,d presents the plot of [F(R) versus photon energy (eV), illustrating the method used to determine . The calculated band gap values indicate that all samples absorb around 3.2 eV, consistent with the anatase band gap. Furthermore, the band gap appears to be independent of the crystallographic structure and morphology of the samples.
3.3. Specific Surface Area
>Figure 5 present the nitrogen adsorption - desorption isotherms and the pore size distribution curves of the samples, while Table 5 summarize the results obtained from Brunauer–Emmett–Teller (BET) surface area analysis, including pore diameter, pore volume, and porosity percentage.
The adsorption - desorption isotherms are of type IV [45], characteristic of mesoporous materials, with an H3 hysteresis loop. Within the TS10 series, the sample TS10Z4 exhibits the highest specific surface area, consistent with the XRD results indicating exposure of the 001 facets; this agrees with literature reports that anatase crystals with exposed 001 facets possess the highest specific surface area [46,47,48]. In the TS24 series, the highest surface area is observed for the undoped TS24 sample, with only minor variations among the samples. Pore size distribution curves show that the pore diameters of both the TS10 and TS24 series fall within the range of 7 - 25 nm, which is typical of mesoporous materials according to IUPAC classification [46,47,48]. Finally, it is observed that the addition of ZS modifies the pore diameter across all samples, acting as an additional structural modifier.
3.4. Photoconductivity
3.4.1. Vacuum
Figure 6 shows the photoconductivity () as a function of time at 300 K under vacuum for all samples, along with commercial titania P25, which is used as a reference material for comparison. During the first illumination cycle, the photoconductivity values of this series increase by 2-3 orders of magnitude relative to the dark conductivity. Specifically, at the initial stages of illumination, a rapid rise in photoconductivity is observed, followed by a slower increase over time, with the rate varying among the samples and exhibiting sublinear behavior [49]. In the TS10Z4 and TS10Z8 samples, the recombination rate is more pronounced, leading to lower photoconductivity values. After the first illumination, an initial sharp decrease occurs due to strong carrier recombination, followed by a linear decrease, indicating that the rates of thermal excitation and recombination change over time in the same manner. During the second illumination cycle, the photoconductivity reaches higher values than in the first, suggesting that some traps remain filled at the end of the first dark period and contribute during subsequent illumination. Furthermore, the photoconductivity of the TS10 sample exceeds that of P25, while the values for the 4%Zn and 8%Zn samples are slightly lower than those of P25.
Following the transient photoconductivity plots for the TS24 sample series at 300 K under vacuum, as in the previous case, the photoconductivity values exhibit a sharp increase during the initial stages of illumination, followed by a slower rise as the carrier recombination rate becomes significant. In this series, the photoconductivity increases by 4-5 orders of magnitude. Under acidic conditions, the photoconductivity reaches higher values compared to basic conditions. This behavior is attributed to the formation of anatase in acidic media, whereas in basic media both rutile and anatase phases are present [35]. Regarding reaction time, it is observed that a longer duration (24 h compared to 10 h) leads to higher photoconductivity values, as longer treatment favors improved particle formation, which is also supported by the SEM images. Another crucial factor in enhancing photoconductivity, as noted in the introduction, is the presence of oxygen vacancies. These vacancies, or self-doping with , can create intermediate energy states within the band gap. The mechanism of self-doping is based on the trapping of photogenerated electrons, which subsequently reduce ions to [50], while the photogenerated holes oxidize anions to or even molecular . The detailed steps of oxygen vacancy formation are presented in Figure 7 which illustrates the states within the band gap.
It has also been reported that the hydrothermal method [51,52], the solvothermal method [53,54], and the metal reduction method [55,56] are among the most suitable techniques for generating oxygen vacancies or self-doping. Wang et al. [51] demonstrated that by adjusting the hydrothermal conditions, the concentration of oxygen vacancies could be controlled. Zinc acts as a reducing agent (metal reduction method), creating oxygen vacancies or self-doping [56], which serve as electron donors. In addition to functioning as a reducing agent, Zn can also stabilize oxygen vacancies and, consequently, states on the sample surface. Metal ions can weaken oxygen bonds at the surface, thereby increasing the likelihood of oxygen removal. As a result, the remaining electrons can be trapped by ions, reducing them to [57]. The presence of oxygen vacancies or states, either on the surface or within the bulk, can suppress electron-hole recombination. It is well established that the Fermi level (EF) lies very close to the conduction band when the concentration of oxygen vacancies is high. These vacancies represent defect states located near the conduction band (Figure 7), facilitating easier transfer of photogenerated carriers between bands. Since oxygen vacancies carry a positive charge, centers are formed near the conduction band. Moreover, ions act as hole traps, hindering carrier recombination and thereby extending the lifetime of the charge carriers.
The rise and decay behavior of the photoconductivity response is strongly influenced by defect states acting either as trapping sites or recombination centers. Hence, analysis of the photoconductivity transients provides insights into their nature and distribution [58]. The carrier lifetime can be extracted by fitting a double-exponential function to either the rising or the decaying part of the photoconductivity curve, as illustrated in Figure 6. The decay process is described by Eq: 1:
where represents the initial photoconductivity (at the instant when illumination is switched off), and are time constants corresponding to the lifetimes of photogenerated carriers, and , are pre-exponential factors. The constants and correspond to two different recombination pathways. In the first case, recombination through deep traps is characterized by a short (fast process), while in the second case, carriers captured in shallow traps exhibit a longer (slow process) [59,60]. The trap depth can be estimated using Eq: 2:
where is the Boltzmann constant and S is the “attempt-to-escape” frequency, typically on the order of at room temperature [58,61].
Based on the above discussion, it becomes evident that zinc promotes the formation of oxygen vacancies, as confirmed by the higher photoconductivity values observed for the TS24Z8 sample in the TS24 series. In contrast, such behavior is not observed in the TS10 series, where the addition of Zn does not lead to increased photoconductivity. This suggests that preparation conditions, such as longer reaction times, play a crucial role in the generation of oxygen vacancies. Table 6 summarizes the dark conductivity, the photoconductivity during the first and second illumination cycles under vacuum, and the corresponding trap energies.
3.4.2. Air
Figure 8 presents the transient photoconductivity as a function of time for all samples in air at 300 K and Table 7 summarizes the values of dark conductivity and photoconductivity at the end of the first illumination. It is evident that the photoconductivity values are very low compared to vacuum, which is attributed to the strong carrier recombination during illumination.
When the sample is exposed to air, oxygen strongly influences its photoconductivity. Upon illumination, electron-hole pairs are generated, and adsorbed oxygen molecules on the material’s surface act as electron scavengers. By capturing the photo-generated electrons, these oxygen molecules reduce carrier lifetimes, keeping the photoconductivity low ( + - ). The photo-generated holes migrate to the surface, where they neutralize the adsorbed - ions, triggering the photo-desorption of oxygen from the metal oxide surface (- + ). Thus, the balance between photo-adsorption and photo-desorption governs the amount of oxygen adsorbed on the surface [62]. Reports indicate that photo-adsorption dominates, leading to reduced photoconductivity in air [63]. Additionally, the mobility of holes in is much lower than that of electrons, making electrons the primary charge carriers [64].
Specifically, the TS10 and TS10Z8 samples exhibit a maximum photoconductivity within the first seconds of illumination, followed by a decrease due to intense recombination persisting until the end of illumination. In contrast, the TS10Z4 sample shows a slower rate of decrease. After the first illumination, the TS10 and TS10Z8 samples display a sharp drop caused by fast recombination, followed by a significant thermal release that increases photoconductivity. For the TS10Z4 sample, the decrease in photoconductivity during the dark period is initially smaller and continues more gradually until the end of the dark interval. Concerning the TS24 series, A similar behavior is observed for all samples: an initial maximum at the beginning of illumination, followed by strong carrier recombination. Additionally, during the dark period, the TS24Z4 sample exhibits a slight increase in photoconductivity, which is attributed to thermal excitation. Finally, it should be noted that the extremely low values of photoconductivity in air, for both the TS10 and TS24 series, are due to the strong electron trapping by oxygen molecules adsorbed on the surface.
3.5. Comparison Results
The optoelectronic and catalytic performance of -based materials is highly dependent on the synthesis route, as even similar compositions can exhibit drastically different behaviors. For instance, /ZnO films prepared by the sol–gel method showed suppressed photoconductivity [32], whereas the same system synthesized hydrothermally exhibited a 65% improvement under vacuum [35], underscoring the decisive role of synthesis conditions in charge transport. Similarly, precipitation-derived La-doped powders displayed an 8.6-fold activity enhancement in air [33], while CVD-synthesized powders achieved improved surface area and catalytic performance [34]. Thin films produced via ALD showed an eightfold increase in photocurrent density [36], and electrochemical methods further enhanced conversion efficiency [37]. Within this context, our hydrothermally synthesized Zn-modified powders demonstrated a remarkable 30-fold increase in photoconductivity under vacuum compared to commercial P25, highlighting not only the critical influence of synthesis strategy but also the potential of defect engineering to tailor for advanced photocatalytic and optoelectronic applications.

Table 8.
Comparison of -based materials synthesized by different methods, highlighting their targeted properties and corresponding performance changes.
Table 8.
Comparison of -based materials synthesized by different methods, highlighting their targeted properties and corresponding performance changes.
| Ref. | Synthesis method | Material | Property | Change |
|---|---|---|---|---|
| [32] | Sol-gel | /ZnO film | Photoconductivity | Performance reduced |
| [33] | Percipitation | powder | // | x8.6 increase in air |
| [34] | Chemical vapor deposition (CVD) | powder | Surface area | Increased activity |
| [35] | Hydrothermal/solvothermal | /ZnO powder | Photoconductivity | 65 % increase in vacuum |
| [36] | Atomic layer deposition (ALD) | film | Photocurrent density | x8 increase |
| [37] | Electrochemical | film | Conversion efficiency | Improved |
| CW | Hydrothermal | powder | Photoconductivity | x30 increase in vacuum |
4. Conclusions
This work demonstrates that the interplay between hydrothermal synthesis duration and zinc incorporation is critical for engineering the defect structure and electronic properties of . Structural and morphological analyses confirmed that extended hydrothermal treatment promotes crystallite growth, while Zn addition suppresses agglomeration, reduces particle size, and modifies porosity without compromising the mesoporous framework. Optical studies showed that the band gap remains stable near 3.2 eV, independent of reaction conditions.
Photoconductivity investigations revealed striking differences between vacuum and air environments. Under vacuum, Zn-modified samples synthesized for 24 h displayed conductivity enhancements of up to five orders of magnitude relative to dark conditions. In particular, the TS24Z8 sample exhibited nearly 30-fold higher photoconductivity than commercial P25, a performance attributed to the synergistic effects of prolonged hydrothermal treatment and Zn-induced oxygen states that prolong carrier lifetimes. Conversely, in air, strong surface recombination with adsorbed oxygen suppressed photoconductivity across all samples.
These results highlight hydrothermal synthesis, combined with controlled Zn modification, as an effective strategy to tune charge carrier dynamics and defect chemistry in . The approach provides a pathway toward designing high-performance photocatalysts and optoelectronic devices, where precise defect engineering is essential for achieving superior activity and stability.
Author Contributions
Conceptualization, T.G., G.S., N.T. and K.P.; methodology, T.G., G.S. and N.T.; software, T.G.; validation T.G. and G.S.; formal analysis, T.G. and G.S.; investigation, T.G.; resources, C.T. and K.P.; data curation, T.G. and G.S.; writing—original draft preparation, T.G. and G.S.; writing—review and editing, T.G., G.S., N.T. and K.P.; visualization, T.G. and G.S.; supervision, C.T. and K.P.; project administration, N.T. All authors have read and agreed to the published version of the manuscript.
Funding
This research received no external funding.
Data Availability Statement
Data available on request from the authors.
Conflicts of Interest
The authors declare no conflict of interest.
References
- Kang, X.; Liu, S.; Dai, Z.; He, Y.; Song, X.; Tan, Z. Titanium dioxide: from engineering to applications. Catalysts 2019, 9, 191. [Google Scholar] [CrossRef]
- Ijaz, M.; Zafar, M. Titanium dioxide nanostructures as efficient photocatalyst: Progress, challenges and perspective. International Journal of Energy Research 2021, 45, 3569–3589. [Google Scholar] [CrossRef]
- Pelaez, M.; Nolan, N.T.; Pillai, S.C.; Seery, M.K.; Falaras, P.; Kontos, A.G.; Dunlop, P.S.; Hamilton, J.W.; Byrne, J.A.; O’shea, K.; et al. A review on the visible light active titanium dioxide photocatalysts for environmental applications. Applied Catalysis B: Environmental 2012, 125, 331–349. [Google Scholar] [CrossRef]
- Agócs, T.Z.; Puskás, I.; Varga, E.; Molnár, M.; Fenyvesi, É. Stabilization of nanosized titanium dioxide by cyclodextrin polymers and its photocatalytic effect on the degradation of wastewater pollutants. Beilstein Journal of Organic Chemistry 2016, 12, 2873–2882. [Google Scholar] [CrossRef] [PubMed]
- Areerachakul, N.; Sakulkhaemaruethai, S.; Johir, M.; Kandasamy, J.; Vigneswaran, S. Photocatalytic degradation of organic pollutants from wastewater using aluminium doped titanium dioxide. Journal of water process engineering 2019, 27, 177–184. [Google Scholar] [CrossRef]
- Zhang, C.; Guo, D.; Shen, T.; Hou, X.; Zhu, M.; Liu, S.; Hu, Q. Titanium dioxide/magnetic metal-organic framework preparation for organic pollutants removal from water under visible light. Colloids and Surfaces A: Physicochemical and Engineering Aspects 2020, 589, 124484. [Google Scholar] [CrossRef]
- O’Keeffe, C.; Gannon, P.; Gilson, P.; Kafizas, A.; Parkin, I.P.; Binions, R. Air purification by heterogeneous photocatalytic oxidation with multi-doped thin film titanium dioxide. Thin Solid Films 2013, 537, 131–136. [Google Scholar] [CrossRef]
- Leng, Z.; Yu, H. Novel method of coating titanium dioxide on to asphalt mixture based on the breath figure process for air-purifying purpose. Journal of Materials in Civil Engineering 2016, 28, 04015188. [Google Scholar] [CrossRef]
- Verma, S.; Kumar, N.; Kim, K.H.; Park, J. Photocatalytic efficacy of air purifiers equipped with self-cleaning titanium dioxide xerogel coatings against gaseous formaldehyde: A study using DRIFTS and DFT analysis. Chemical Engineering Journal 2024, 486, 150269. [Google Scholar] [CrossRef]
- Kasanen, J.; Suvanto, M.; Pakkanen, T.T. Self-cleaning, titanium dioxide based, multilayer coating fabricated on polymer and glass surfaces. Journal of Applied Polymer Science 2009, 111, 2597–2606. [Google Scholar] [CrossRef]
- Kayani, Z.N.; Saleem, Z.; Riaz, S.; Naseem, S.; Saleemi, F. Deposition of porous titanium oxide thin films as anti-fogging and anti-reflecting medium. Optik 2016, 127, 5124–5127. [Google Scholar] [CrossRef]
- Syafiq, A.; Balakrishnan, V.; Rahim, N.A. Durable self-cleaning nano-titanium dioxide superhydrophilic coating with anti-fog property. Pigment & Resin Technology 2024, 53, 261–270. [Google Scholar]
- Chao, S.; Petrovsky, V.; Dogan, F. Effects of sintering temperature on the microstructure and dielectric properties of titanium dioxide ceramics. Journal of materials science 2010, 45, 6685–6693. [Google Scholar] [CrossRef]
- Taiwo, L.A.; Obianyo, I.I.; Amu, O.O.; Omoniyi, A.O.; Onwualu, A.P.; Soboyejo, A.B. Effects of titanium dioxide coatings on building composites for sustainable construction applications. Cogent Engineering 2022, 9, 2151168. [Google Scholar] [CrossRef]
- Felice, B.; Seitz, V.; Bach, M.; Rapp, C.; Wintermantel, E. Antimicrobial polymers: Antibacterial efficacy of silicone rubber–titanium dioxide composites. Journal of Composite Materials 2017, 51, 2253–2262. [Google Scholar] [CrossRef]
- Abdulazeem, L.; Al-Amiedi, B.; Alrubaei, H.A.; AL-Mawlah, Y.H. Titanium dioxide nanoparticles as antibacterial agents against some pathogenic bacteria. Drug Invention Today 2019, 12, 963–967. [Google Scholar]
- Yao, Y.; Lin, P.; Ye, D.; Miao, H.; Cao, L.; Zhang, P.; Xu, J.; Dai, L. Enhanced Long-Term Antibacterial and Osteogenic Properties of Silver-Loaded Titanium Dioxide Nanotube Arrays for Implant Applications. International Journal of Nanomedicine 2025, 3749–3764. [Google Scholar] [CrossRef]
- Li, J.; Zhang, D.; Hou, C. Application of nano-titanium dioxide in food antibacterial packaging materials. Bioengineering 2024, 12, 19. [Google Scholar] [CrossRef] [PubMed]
- Shen, P.S.; Tseng, C.M.; Kuo, T.C.; Shih, C.K.; Li, M.H.; Chen, P. Microwave-assisted synthesis of titanium dioxide nanocrystalline for efficient dye-sensitized and perovskite solar cells. Solar Energy 2015, 120, 345–356. [Google Scholar] [CrossRef]
- Balis, N.; Zaky, A.A.; Perganti, D.; Kaltzoglou, A.; Sygellou, L.; Katsaros, F.; Stergiopoulos, T.; Kontos, A.G.; Falaras, P. Dye sensitization of titania compact layer for efficient and stable perovskite solar cells. ACS Applied Energy Materials 2018, 1, 6161–6171. [Google Scholar] [CrossRef]
- Hsu, C.Y.; Al-Salman, H.; Hussein, H.H.; Juraev, N.; Mahmoud, Z.H.; Al-Shuwaili, S.J.; Ahmed, H.H.; Ami, A.A.; Ahmed, N.M.; Azat, S.; et al. Experimental and theoretical study of improved mesoporous titanium dioxide perovskite solar cell: The impact of modification with graphene oxide. Heliyon 2024, 10. [Google Scholar] [CrossRef] [PubMed]
- Yan, Z.; Liu, L.; Tan, J.; Zhou, Q.; Huang, Z.; Xia, D.; Shu, H.; Yang, X.; Wang, X. One-pot synthesis of bicrystalline titanium dioxide spheres with a core–shell structure as anode materials for lithium and sodium ion batteries. Journal of Power Sources 2014, 269, 37–45. [Google Scholar] [CrossRef]
- Lou, S.; Zhao, Y.; Wang, J.; Yin, G.; Du, C.; Sun, X. Ti-based oxide anode materials for advanced electrochemical energy storage: lithium/sodium ion batteries and hybrid pseudocapacitors. Small 2019, 15, 1904740. [Google Scholar] [CrossRef] [PubMed]
- Li, X.; Zhang, K.; Ao, H.; Gong, Y.; Yu, K.; Liang, C. Template-free synthesis of hollow titanium dioxide microspheres and amorphous titanium dioxide microspheres with superior lithium and sodium storage performance. Journal of Energy Storage 2025, 105, 114759. [Google Scholar] [CrossRef]
- Li, R.; Weng, Y.; Zhou, X.; Wang, X.; Mi, Y.; Chong, R.; Han, H.; Li, C. Achieving overall water splitting using titanium dioxide-based photocatalysts of different phases. Energy & Environmental Science 2015, 8, 2377–2382. [Google Scholar] [CrossRef]
- Miyoshi, A.; Nishioka, S.; Maeda, K. Water splitting on rutile TiO2-based photocatalysts. Chemistry–A European Journal 2018, 24, 18204–18219. [Google Scholar] [CrossRef]
- Kumar, V.; Prasad Singh, G.; Kumar, M.; Kumar, A.; Singh, P.; Ansu, A.K.; Sharma, A.; Alam, T.; Yadav, A.S.; Dobrota, D. Nanocomposite marvels: Unveiling breakthroughs in photocatalytic water splitting for enhanced hydrogen evolution. ACS omega 2024, 9, 6147–6164. [Google Scholar] [CrossRef]
- Ramanavicius, S.; Jagminas, A.; Ramanavicius, A. Gas sensors based on titanium oxides. Coatings 2022, 12, 699. [Google Scholar] [CrossRef]
- Singh, G.; Kumar, Y.; Husain, S. Fabrication of symmetric polyaniline/nano-titanium dioxide/activated carbon supercapacitor device in different electrolytic mediums: role of high surface area of carbon and facile interactions with nano-titanium dioxide for high-performance supercapacitor. Energy Technology 2023, 11, 2200931. [Google Scholar] [CrossRef]
- Zuo, F.; Zhu, Y.; Wu, T.; Li, C.; Liu, Y.; Wu, X.; Ma, J.; Zhang, K.; Ouyang, H.; Qiu, X.; et al. Titanium dioxide nanomaterials: Progress in synthesis and application in drug delivery. Pharmaceutics 2024, 16, 1214. [Google Scholar] [CrossRef] [PubMed]
- Chandoliya, R.; Sharma, S.; Sharma, V.; Joshi, R.; Sivanesan, I. Titanium dioxide nanoparticle: A comprehensive review on synthesis, applications and toxicity. Plants 2024, 13, 2964. [Google Scholar] [CrossRef] [PubMed]
- Georgakopoulos, T.; Todorova, N.; Pomoni, K.; Trapalis, C. On the transient photoconductivity behavior of sol–gel TiO2/ZnO composite thin films. Journal of Non-Crystalline Solids 2015, 410, 135–141. [Google Scholar] [CrossRef]
- Rajkumar, C.; Arulraj, A. One-step synthesis of needle-like lanthanum-doped TiO2 nanomaterials and their photoconductivity activity in air medium. Materials Letters 2025, 380, 137733. [Google Scholar]
- Fukuhara, Y.; Yamakawa, T.; Sakai, Y.; YAMASAKI, A.; SATOKAWA, S.; KOJIMA, T. Synthesis of TiO2 by CVD using Titanium Tetraisopropoxide and their Photocatalytic Activity. Journal of Ecotechnology Research 2010, 15, 85–89. [Google Scholar]
- Georgakopoulos, T.; Todorova, N.; Boukos, N.; Pomoni, K.; Trapalis, C. Evaluation of the photoconductive and photocatalytic properties of nanocrystalline TiO2/ZnO powder systems prepared by one-step hydro-solvothermal method. Materials Science and Engineering: B 2025, 322, 118637. [Google Scholar] [CrossRef]
- Sasinska, A.; Singh, T.; Wang, S.; Mathur, S.; Kraehnert, R. Enhanced photocatalytic performance in atomic layer deposition grown TiO2 thin films via hydrogen plasma treatment. Journal of Vacuum Science & Technology A 2015, 33. [Google Scholar]
- Kamble, A.A.; Ubale, P.A.; Jadhav, A.L.; Jadhav, S.L.; Kadam, A.V.; Kanamadi, C.M.; Bhuse, V.M. Studies on optical, structure, and photoconductivity of titanium dioxide thin films prepared by chemical bath deposition via aqueous route. In Proceedings of the Macromolecular Symposia. Wiley Online Library, Vol. 400; 2021; p. 2100020. [Google Scholar]
- Zhao, Z.; Sun, Z.; Zhao, H.; Zheng, M.; Du, P.; Zhao, J.; Fan, H. Phase control of hierarchically structured mesoporous anatase TiO 2 microspheres covered with {001} facets. Journal of Materials Chemistry 2012, 22, 21965–21971. [Google Scholar] [CrossRef]
- Yanagisawa, K.; Yamamoto, Y.; Feng, Q.; Yamasaki, N. Formation mechanism of fine anatase crystals from amorphous titania under hydrothermal conditions. Journal of materials research 1998, 13, 825–829. [Google Scholar] [CrossRef]
- Yanagisawa, K.; Ovenstone, J. Crystallization of anatase from amorphous titania using the hydrothermal technique: effects of starting material and temperature. The Journal of Physical Chemistry B 1999, 103, 7781–7787. [Google Scholar] [CrossRef]
- Li, H.; Li, T.; Liu, H.; Huang, B.; Zhang, Q. Hierarchical flower-like nanostructures of anatase TiO2 nanosheets dominated by {001} facets. Journal of Alloys and Compounds 2016, 657, 1–7. [Google Scholar] [CrossRef]
- Ong, W.J.; Tan, L.L.; Chai, S.P.; Yong, S.T.; Mohamed, A.R. Highly reactive {001} facets of TiO 2-based composites: synthesis, formation mechanism and characterization. Nanoscale 2014, 6, 1946–2008. [Google Scholar] [CrossRef]
- Sofianou, M.V.; Tassi, M.; Psycharis, V.; Boukos, N.; Thanos, S.; Vaimakis, T.; Yu, J.; Trapalis, C. Solvothermal synthesis and photocatalytic performance of Mn4+-doped anatase nanoplates with exposed {0 0 1} facets. Applied Catalysis B: Environmental 2015, 162, 27–33. [Google Scholar] [CrossRef]
- Murphy, A. Modified Kubelka–Munk model for calculation of the reflectance of coatings with optically-rough surfaces. Journal of Physics D: Applied Physics 2006, 39, 3571. [Google Scholar] [CrossRef]
- Brunauer, S.; Emmett, P. The use of van der waals adsorption isotherms in determining the surface area of iron synthetic ammonia catalysts. Journal of the American Chemical Society 1935, 57, 1754–1755. [Google Scholar] [CrossRef]
- Emmett, P.H.; Brunauer, S. The use of low temperature van der Waals adsorption isotherms in determining the surface area of iron synthetic ammonia catalysts. Journal of the American Chemical Society 1937, 59, 1553–1564. [Google Scholar] [CrossRef]
- Sing, K.S. Reporting physisorption data for gas/solid systems with special reference to the determination of surface area and porosity (Recommendations 1984). Pure and applied chemistry 1985, 57, 603–619. [Google Scholar] [CrossRef]
- Rouquerol, J.; Avnir, D.; Everett, D.; Fairbridge, C.; Haynes, M.; Pernicone, N.; Ramsay, J.; Sing, K.; Unger, K. Guidelines for the characterization of porous solids. In Studies in surface science and catalysis; Elsevier, 1994; Vol. 87, pp. 1–9.
- Jiang, X.; Zhang, Y.; Jiang, J.; Rong, Y.; Wang, Y.; Wu, Y.; Pan, C. Characterization of oxygen vacancy associates within hydrogenated TiO2: a positron annihilation study. The Journal of Physical Chemistry C 2012, 116, 22619–22624. [Google Scholar] [CrossRef]
- Xiao-Quan, C.; Huan-Bin, L.; Guo-Bang, G. Preparation of nanometer crystalline TiO2 with high photo-catalytic activity by pyrolysis of titanyl organic compounds and photo-catalytic mechanism. Materials Chemistry and Physics 2005, 91, 317–324. [Google Scholar] [CrossRef]
- Wang, X.; Li, Y.; Liu, X.; Gao, S.; Huang, B.; Dai, Y. Preparation of Ti3+ self-doped TiO2 nanoparticles and their visible light photocatalytic activity. Chinese Journal of Catalysis 2015, 36, 389–399. [Google Scholar] [CrossRef]
- Qiu, B.; Zhou, Y.; Ma, Y.; Yang, X.; Sheng, W.; Xing, M.; Zhang, J. Facile synthesis of the Ti3+ self-doped TiO2-graphene nanosheet composites with enhanced photocatalysis. Scientific reports 2015, 5, 8591. [Google Scholar] [CrossRef]
- Sirisuk, A.; Klansorn, E.; Praserthdam, P. Effects of reaction medium and crystallite size on Ti3+ surface defects in titanium dioxide nanoparticles prepared by solvothermal method. Catalysis Communications 2008, 9, 1810–1814. [Google Scholar] [CrossRef]
- Xin, X.; Xu, T.; Yin, J.; Wang, L.; Wang, C. Management on the location and concentration of Ti3+ in anatase TiO2 for defects-induced visible-light photocatalysis. Applied Catalysis B: Environmental 2015, 176, 354–362. [Google Scholar] [CrossRef]
- Satuf, M.L.; Brandi, R.J.; Cassano, A.E.; Alfano, O.M. Photocatalytic degradation of 4-chlorophenol: a kinetic study. Applied Catalysis B: Environmental 2008, 82, 37–49. [Google Scholar] [CrossRef]
- Si, L.; Huang, Z.; Lv, K.; Tang, D.; Yang, C. Facile preparation of Ti3+ self-doped TiO2 nanosheets with dominant {0 0 1} facets using zinc powder as reductant. Journal of alloys and compounds 2014, 601, 88–93. [Google Scholar] [CrossRef]
- Zheng, Z.; Huang, B.; Meng, X.; Wang, J.; Wang, S.; Lou, Z.; Wang, Z.; Qin, X.; Zhang, X.; Dai, Y. Metallic zinc-assisted synthesis of Ti 3+ self-doped TiO 2 with tunable phase composition and visible-light photocatalytic activity. Chemical Communications 2013, 49, 868–870. [Google Scholar] [CrossRef]
- Georgakopoulos, T.; Apostolopoulou, A.; Todorova, N.; Pomoni, K.; Trapalis, C.; Stathatos, E. Evaluation of photoconductive and photoelectrochemical properties of mesoporous nanocrystalline TiO2 powders and films prepared in acidic and alkaline media. Journal of Alloys and Compounds 2017, 692, 313–321. [Google Scholar] [CrossRef]
- Mahesh, A.; Jawahar, I.; Biju, V. Photogenerated charge carrier processes in carbonate derived nanocrystalline ZnO: photoluminescence, photocurrent response and photocatalytic activity. Applied Physics A 2024, 130, 360. [Google Scholar] [CrossRef]
- Ruda, H.E. Photoconductivity of Nanowire Systems. Photoconductivity and Photoconductive Materials: Fundamentals, Techniques and Applications 2022, 2, 493–522. [Google Scholar]
- Randall, J.T.; Wilkins, M.H.F. Phosphorescence and electron traps-I. The study of trap distributions. Proceedings of the Royal Society of London. Series A. Mathematical and Physical Sciences 1945, 184, 365–389. [Google Scholar]
- Georgakopoulos, T.; Sofianou, M.; Pomoni, K.; Todorova, N.; Giannakopoulou, T.; Trapalis, C. The environment effect on the electrical conductivity and photoconductivity of anatase TiO2 nanoplates with silver nanoparticles photodeposited on {101} crystal facets. Materials Science in Semiconductor Processing 2016, 56, 386–393. [Google Scholar] [CrossRef]
- Chen, H.; Liu, Y.; Xie, C.; Wu, J.; Zeng, D.; Liao, Y. A comparative study on UV light activated porous TiO2 and ZnO film sensors for gas sensing at room temperature. Ceramics International 2012, 38, 503–509. [Google Scholar] [CrossRef]
- Timoshenko, V.Y.; Duzhko, V.; Dittrich, T. Diffusion photovoltage in porous semiconductors and dielectrics. physica status solidi (a) 2000, 182, 227–232. [Google Scholar] [CrossRef]
Figure 1.
Schematic representation of the titanium dioxide powder synthesis stages.
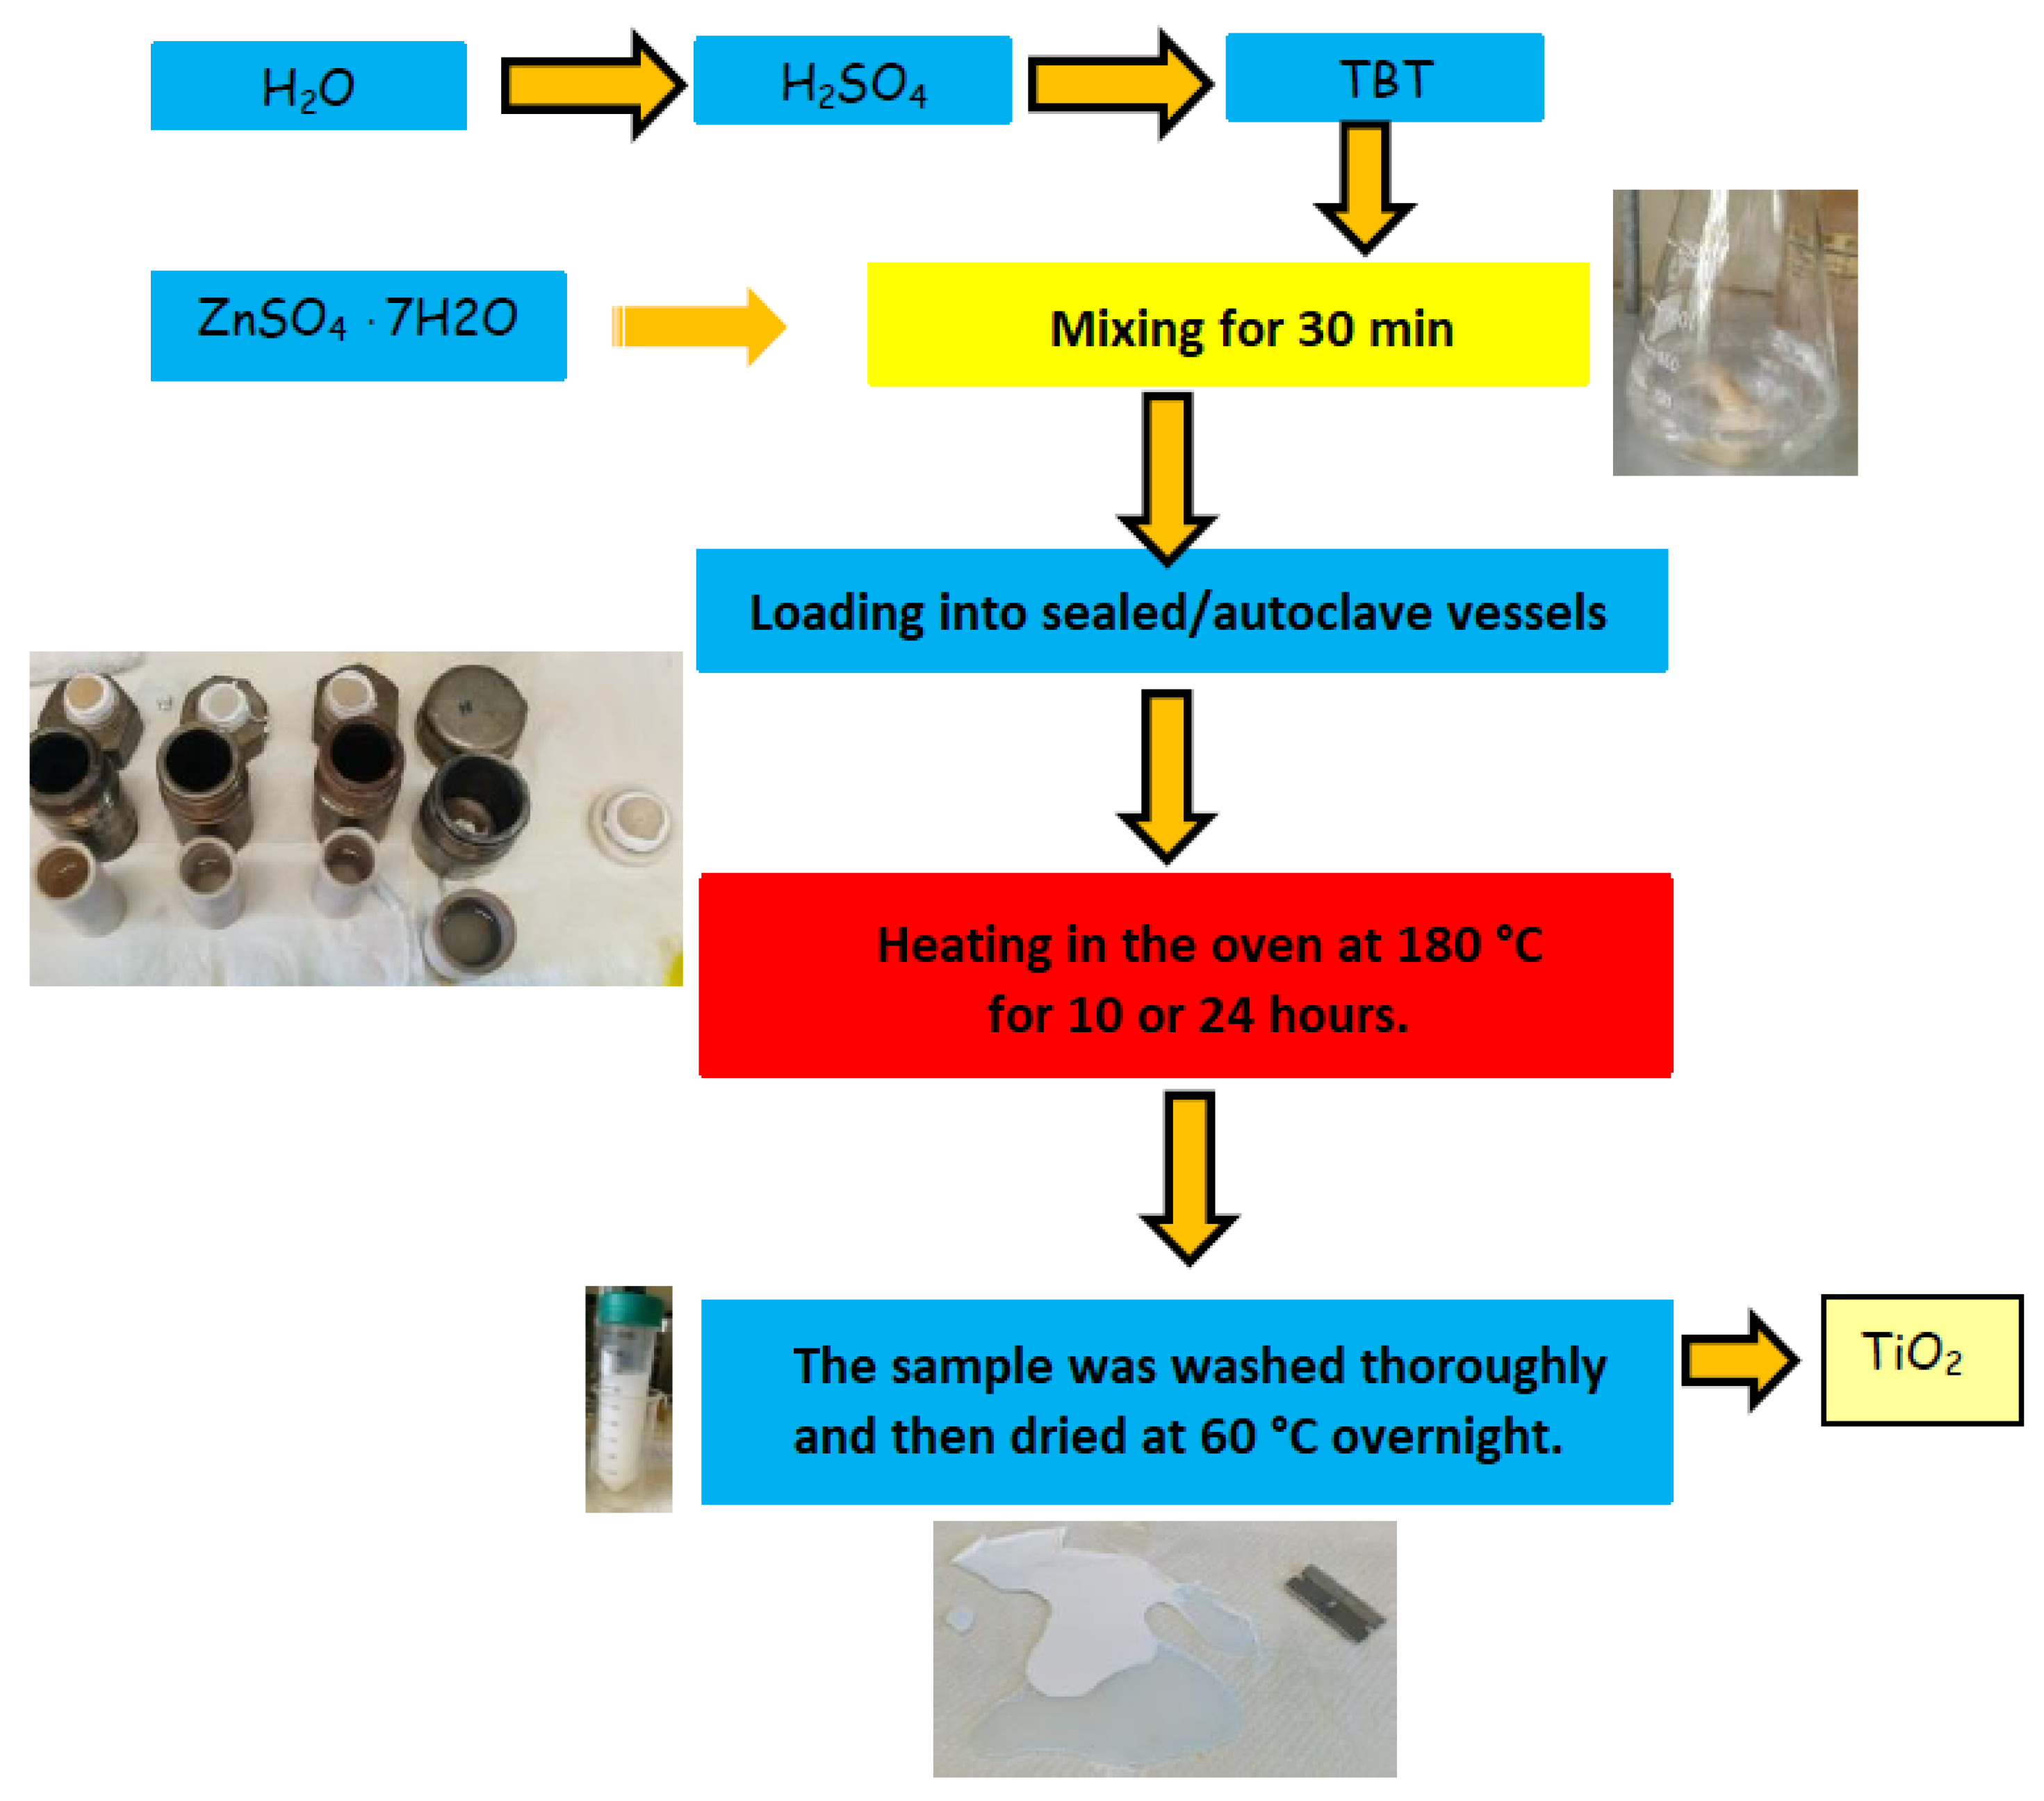
Figure 2.
X-ray diffraction (XRD) patterns of the samples together with the corresponding JCPDS reference pattern. Sample series after (a) 10h and (b) 24h reaction time.
Figure 2.
X-ray diffraction (XRD) patterns of the samples together with the corresponding JCPDS reference pattern. Sample series after (a) 10h and (b) 24h reaction time.
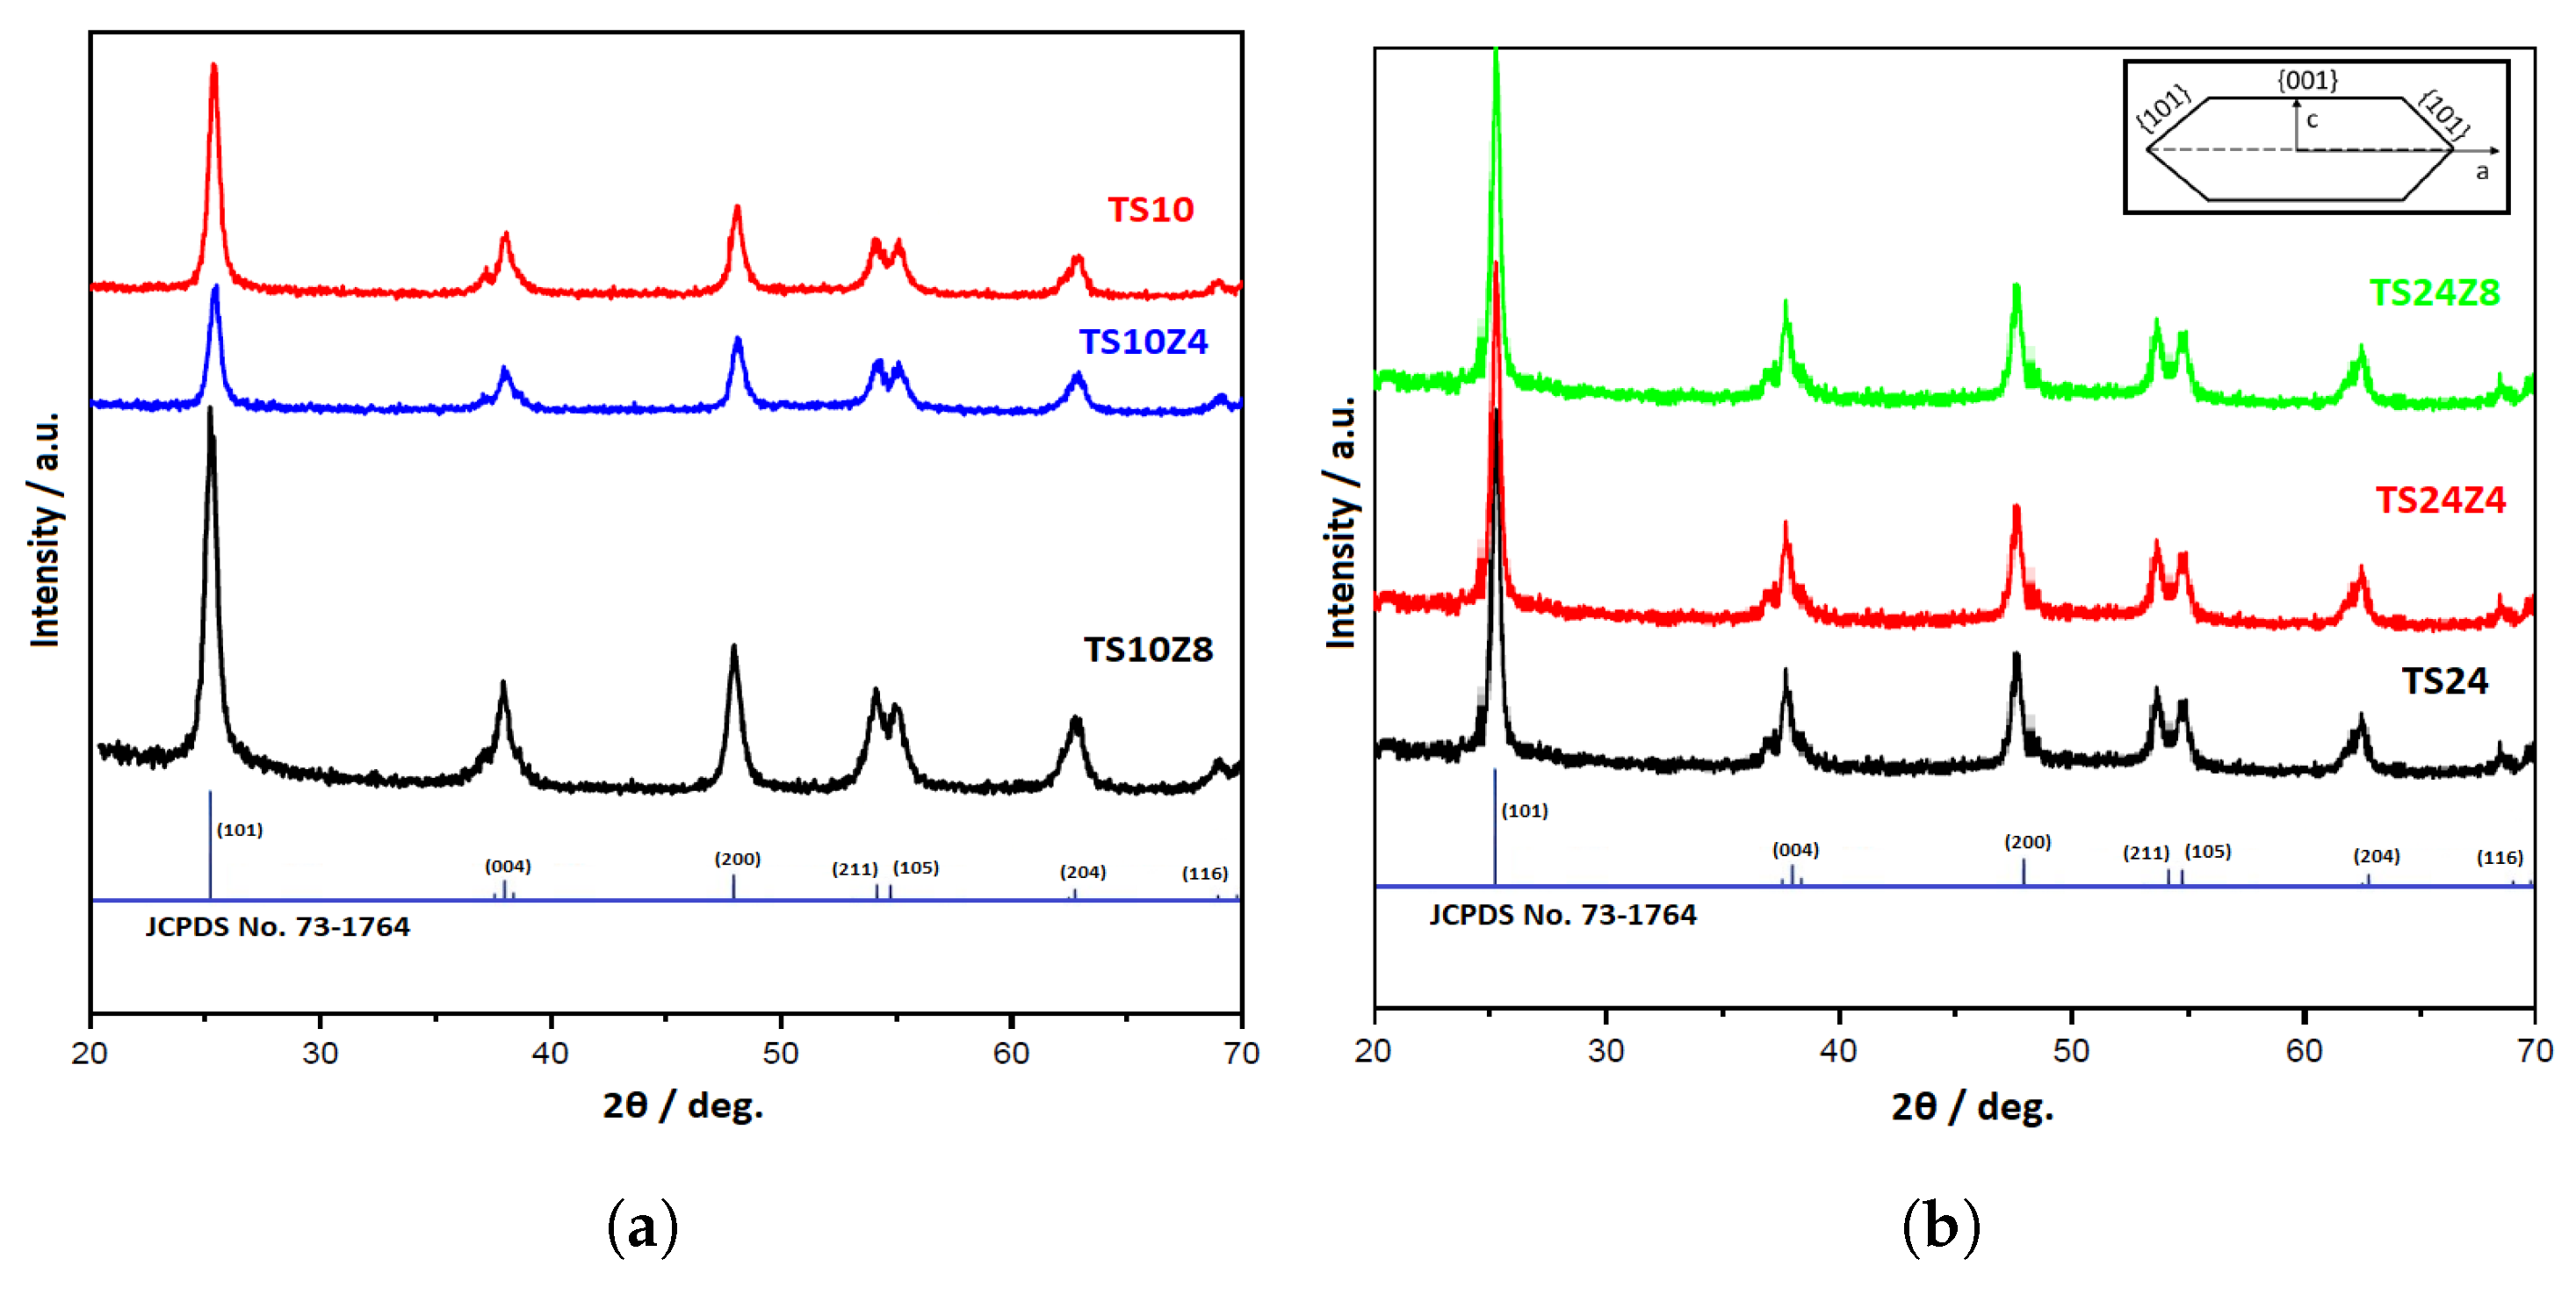
Figure 3.
Samples morphology as they were display in SEM images: (a) TS10, (b) TS24, (c) TS10Z4, (d) TS24Z4, (e) TS10Z8 and (f) TS24Z8.
Figure 3.
Samples morphology as they were display in SEM images: (a) TS10, (b) TS24, (c) TS10Z4, (d) TS24Z4, (e) TS10Z8 and (f) TS24Z8.
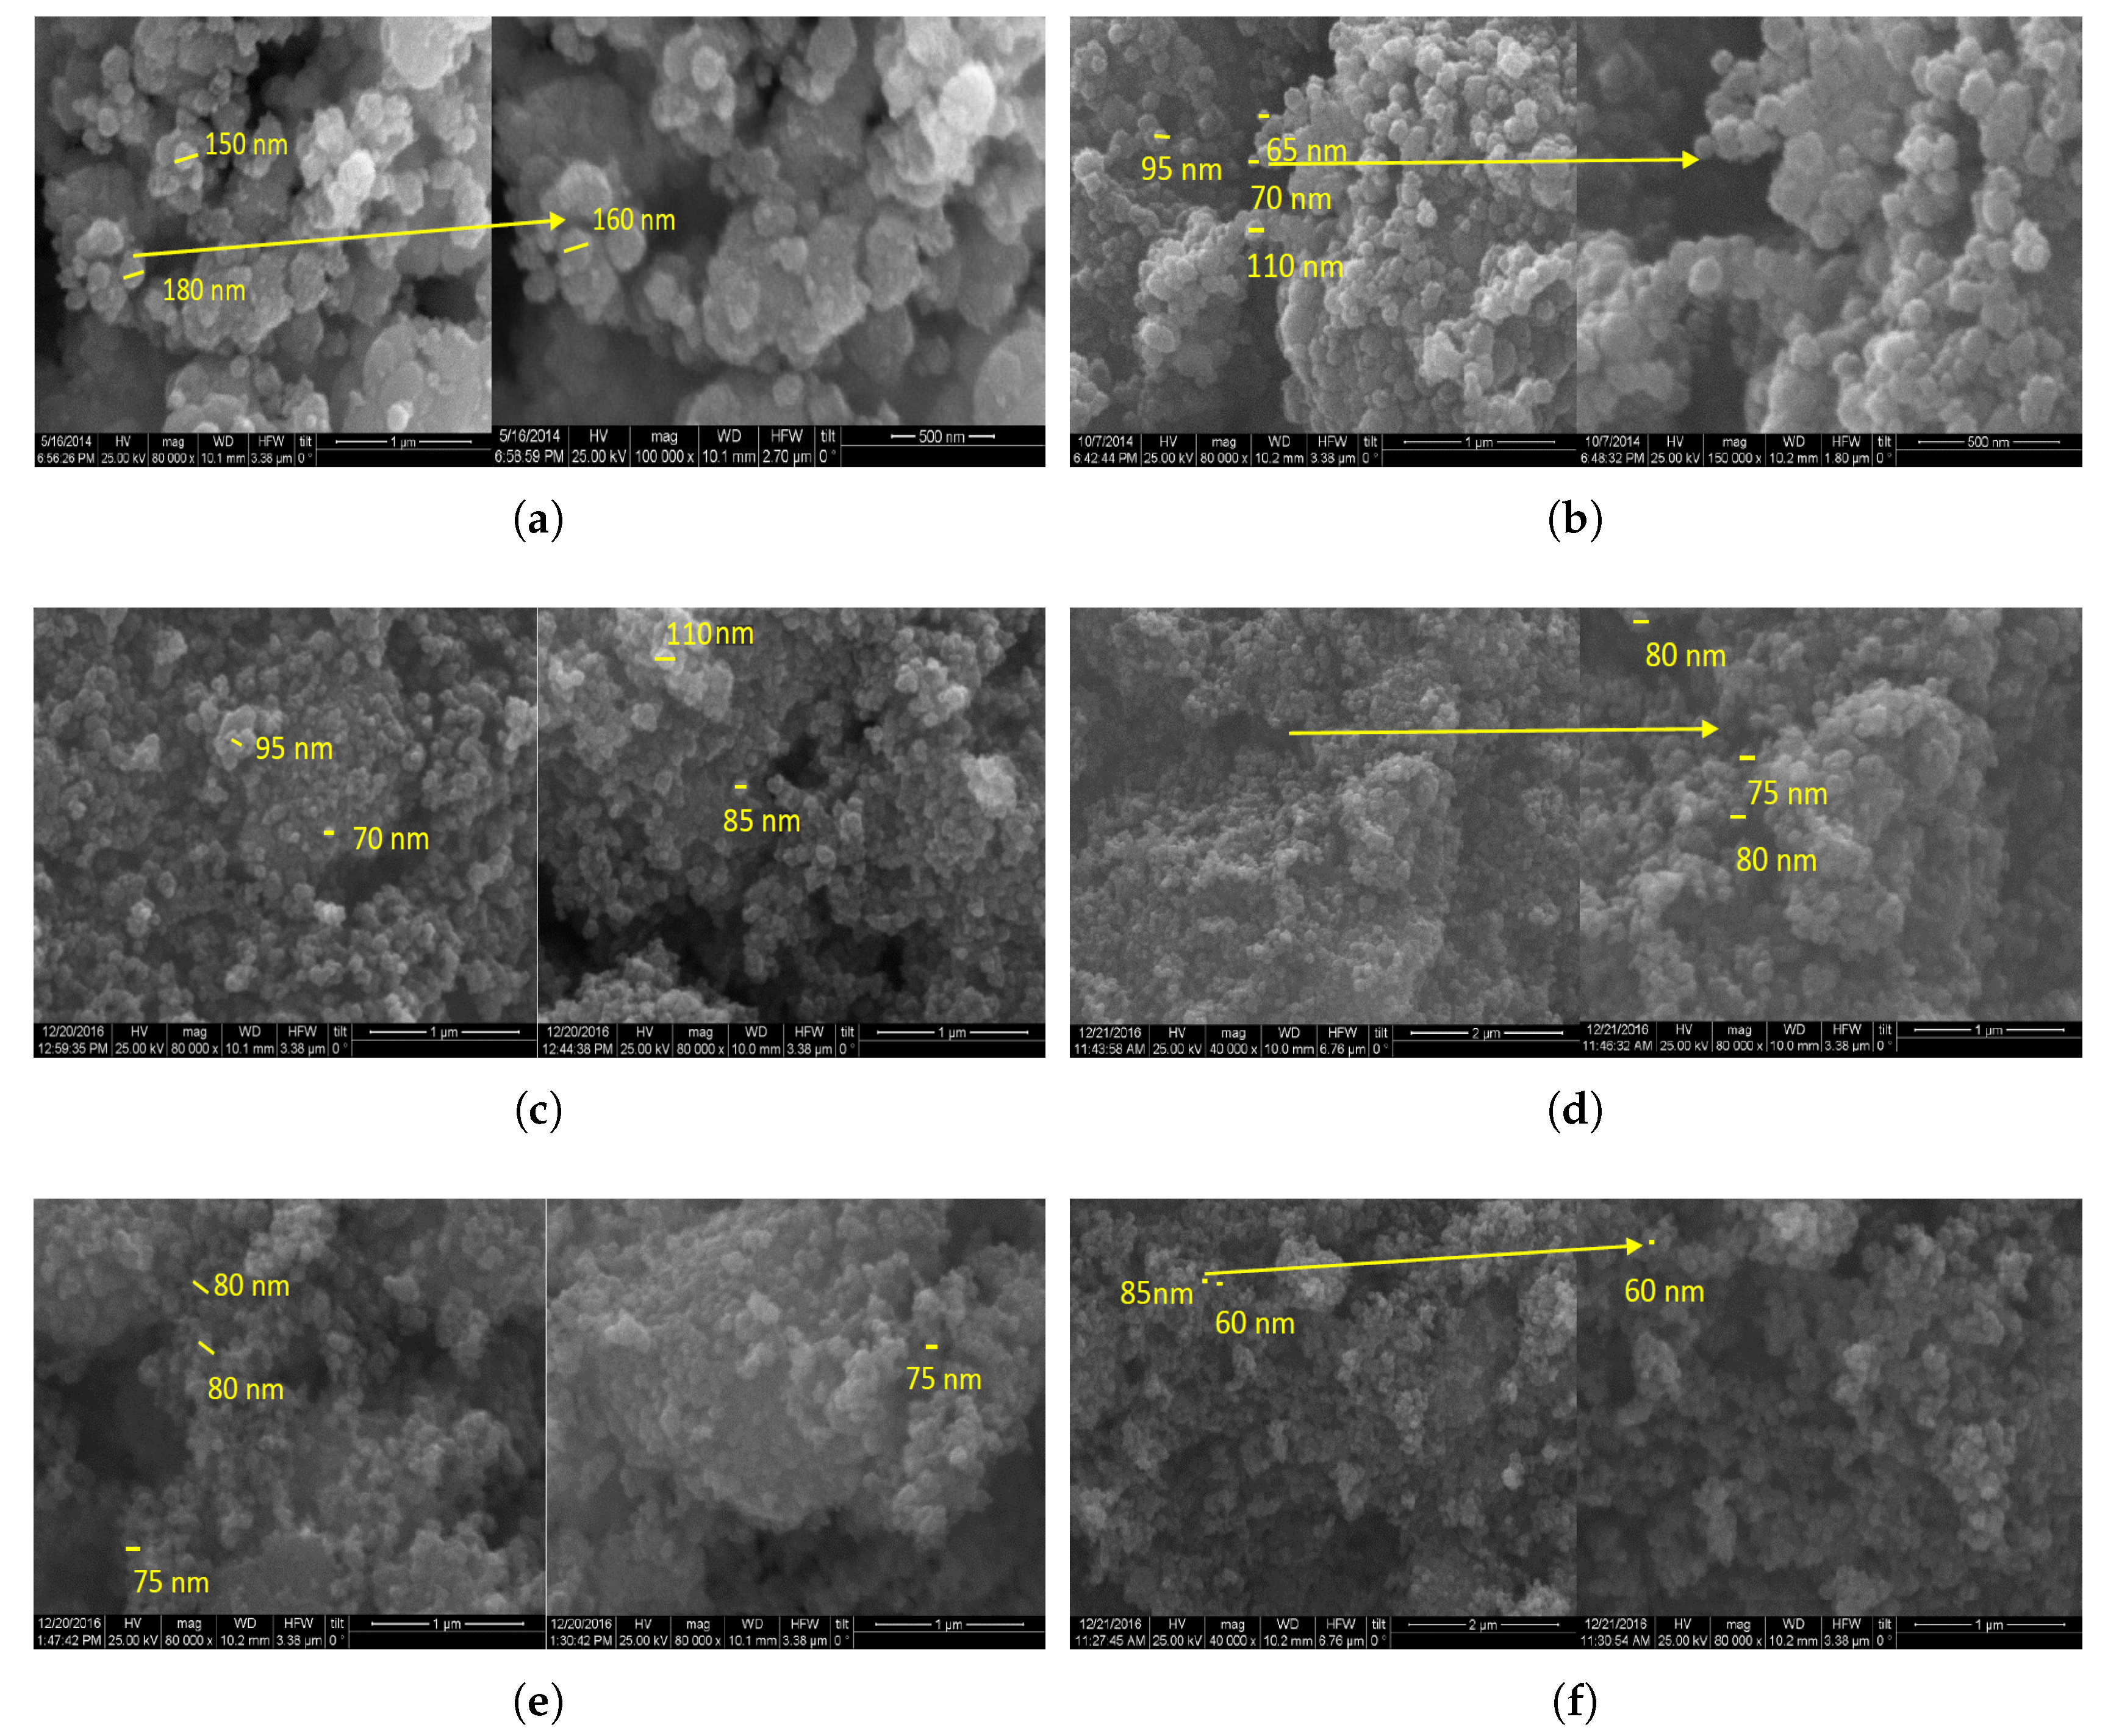
Figure 4.
Diffuse reflectance spectra of the (a) TS10 and (c) TS24 sample series, and determination of the band gap energies using the Kubelka–Munk function for the (b) TS10 and (d) TS24 sample series.
Figure 4.
Diffuse reflectance spectra of the (a) TS10 and (c) TS24 sample series, and determination of the band gap energies using the Kubelka–Munk function for the (b) TS10 and (d) TS24 sample series.
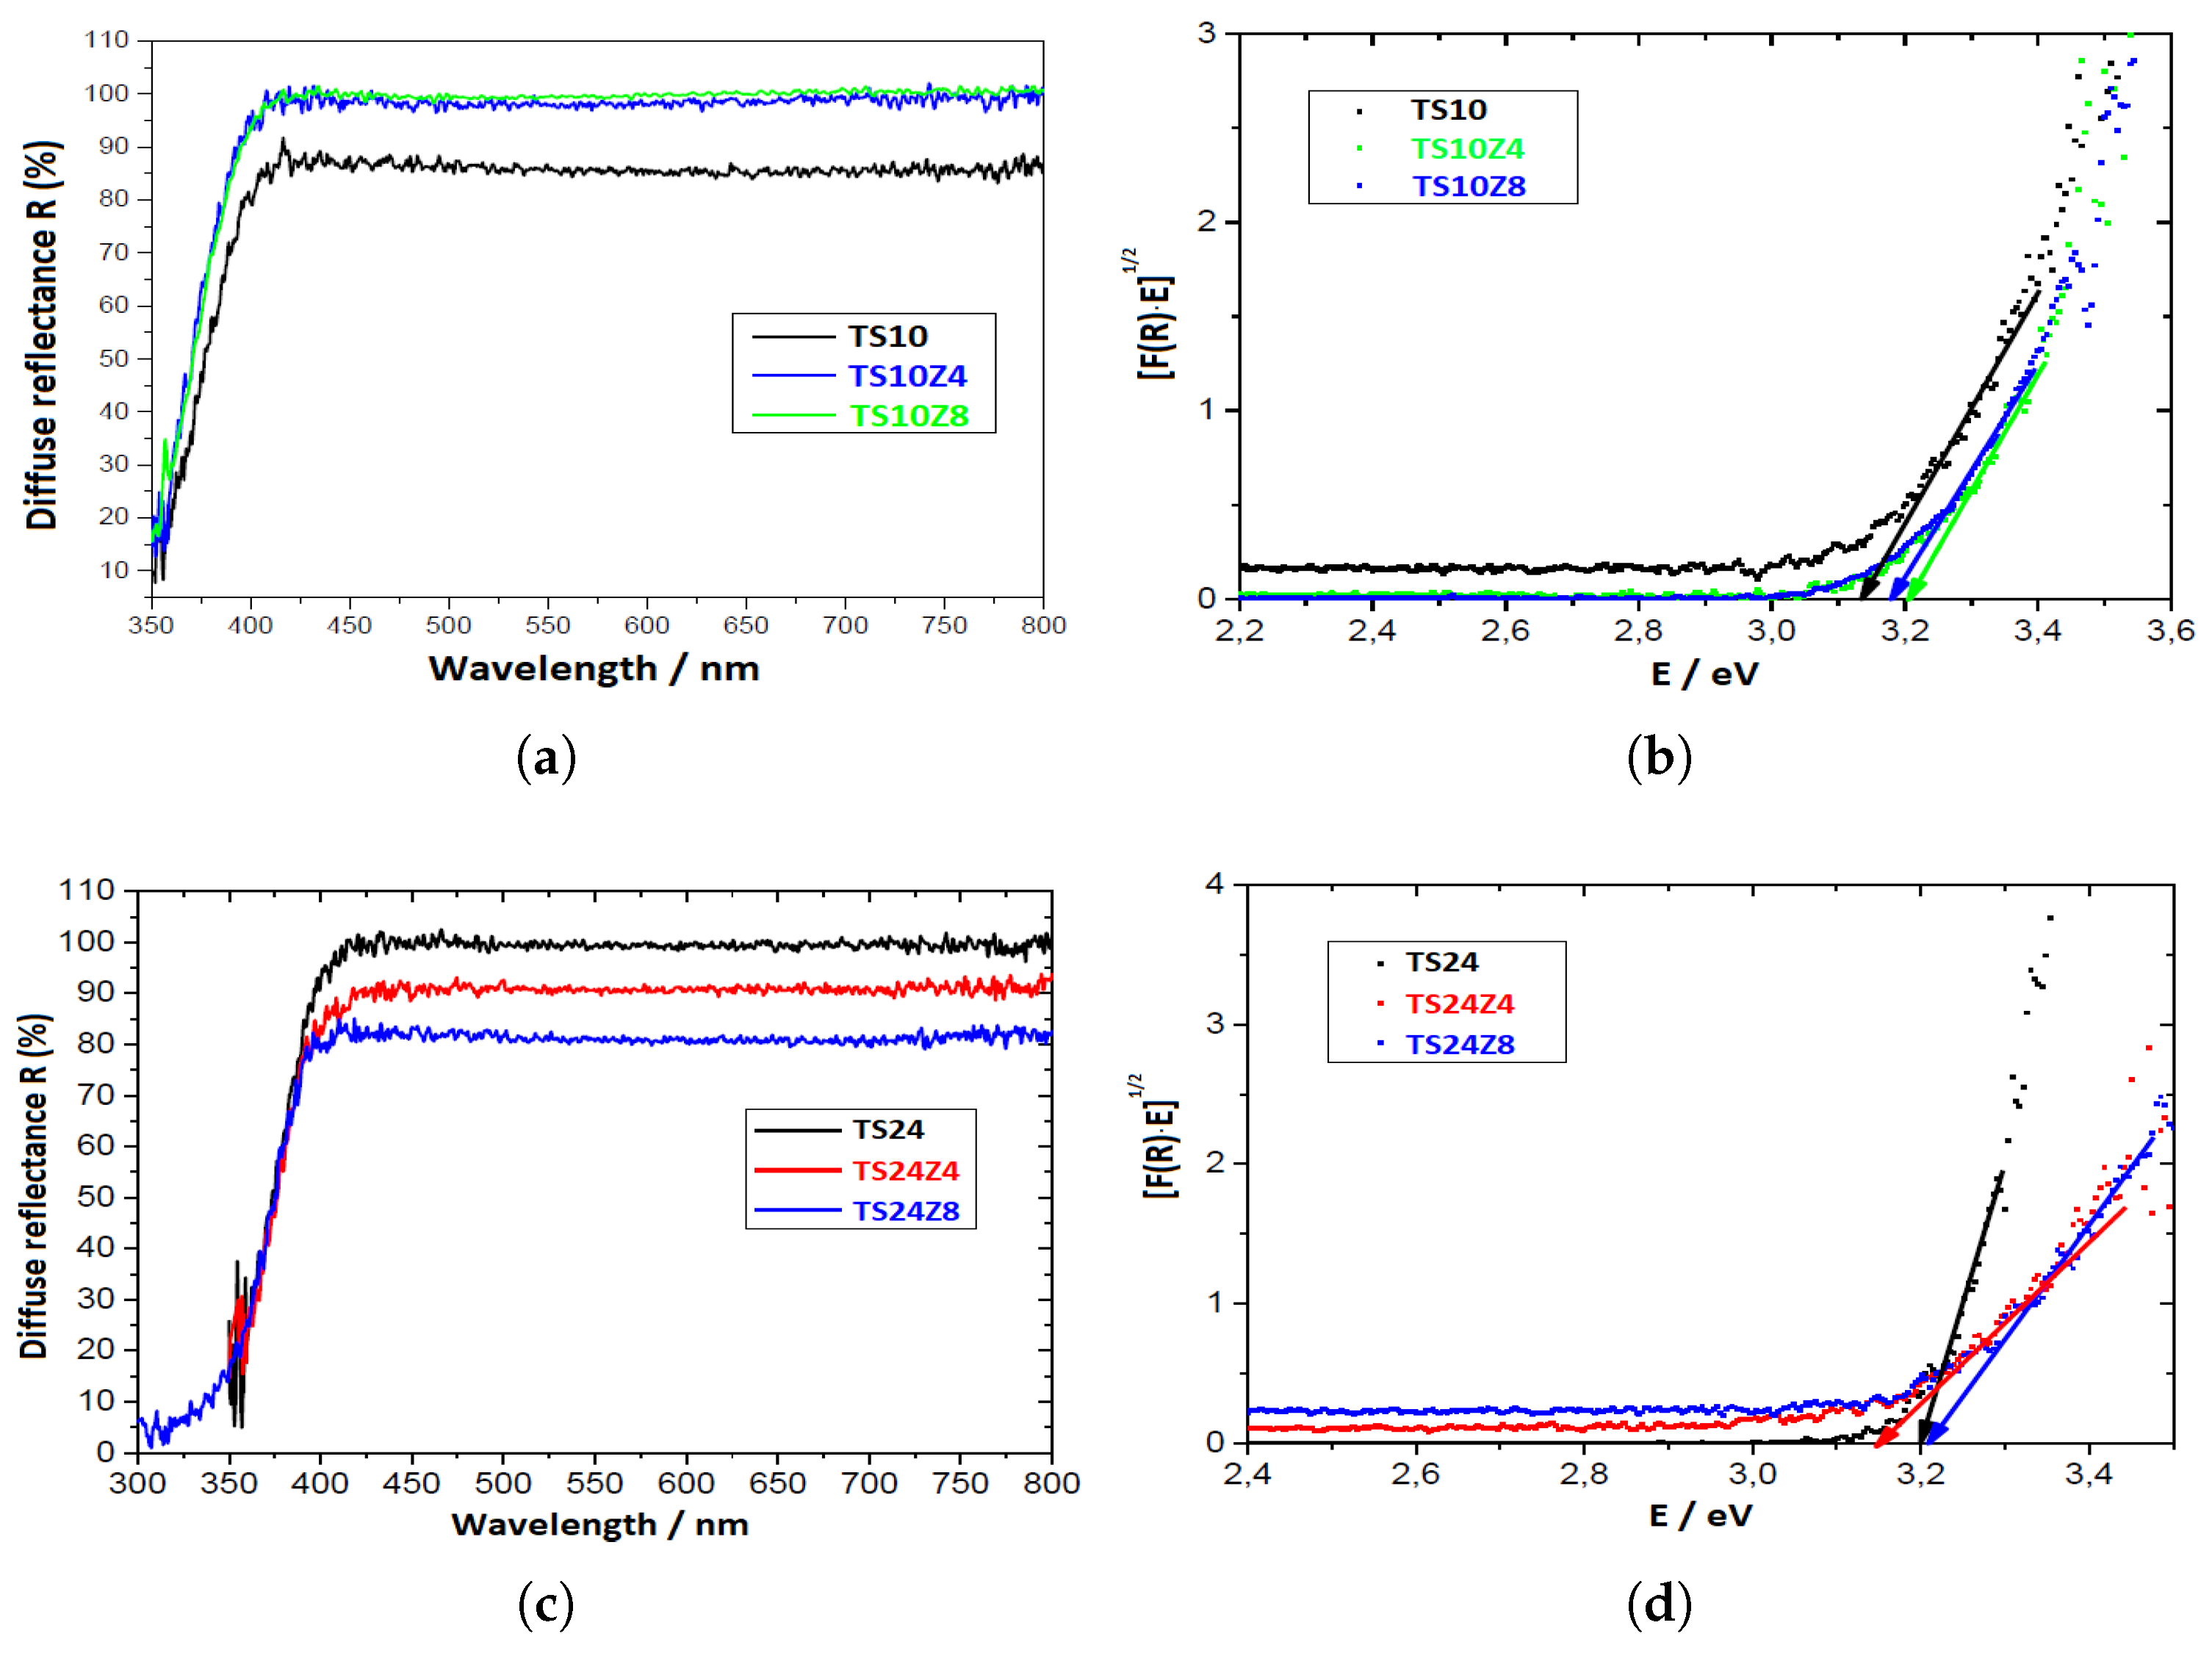
Figure 5.
Representation of nitrogen adsorption - desorption isotherms for (a) TS10 and (c) TS24, and pore size distribution curves of (b) TS10 and (d) TS24 sample series.
Figure 5.
Representation of nitrogen adsorption - desorption isotherms for (a) TS10 and (c) TS24, and pore size distribution curves of (b) TS10 and (d) TS24 sample series.
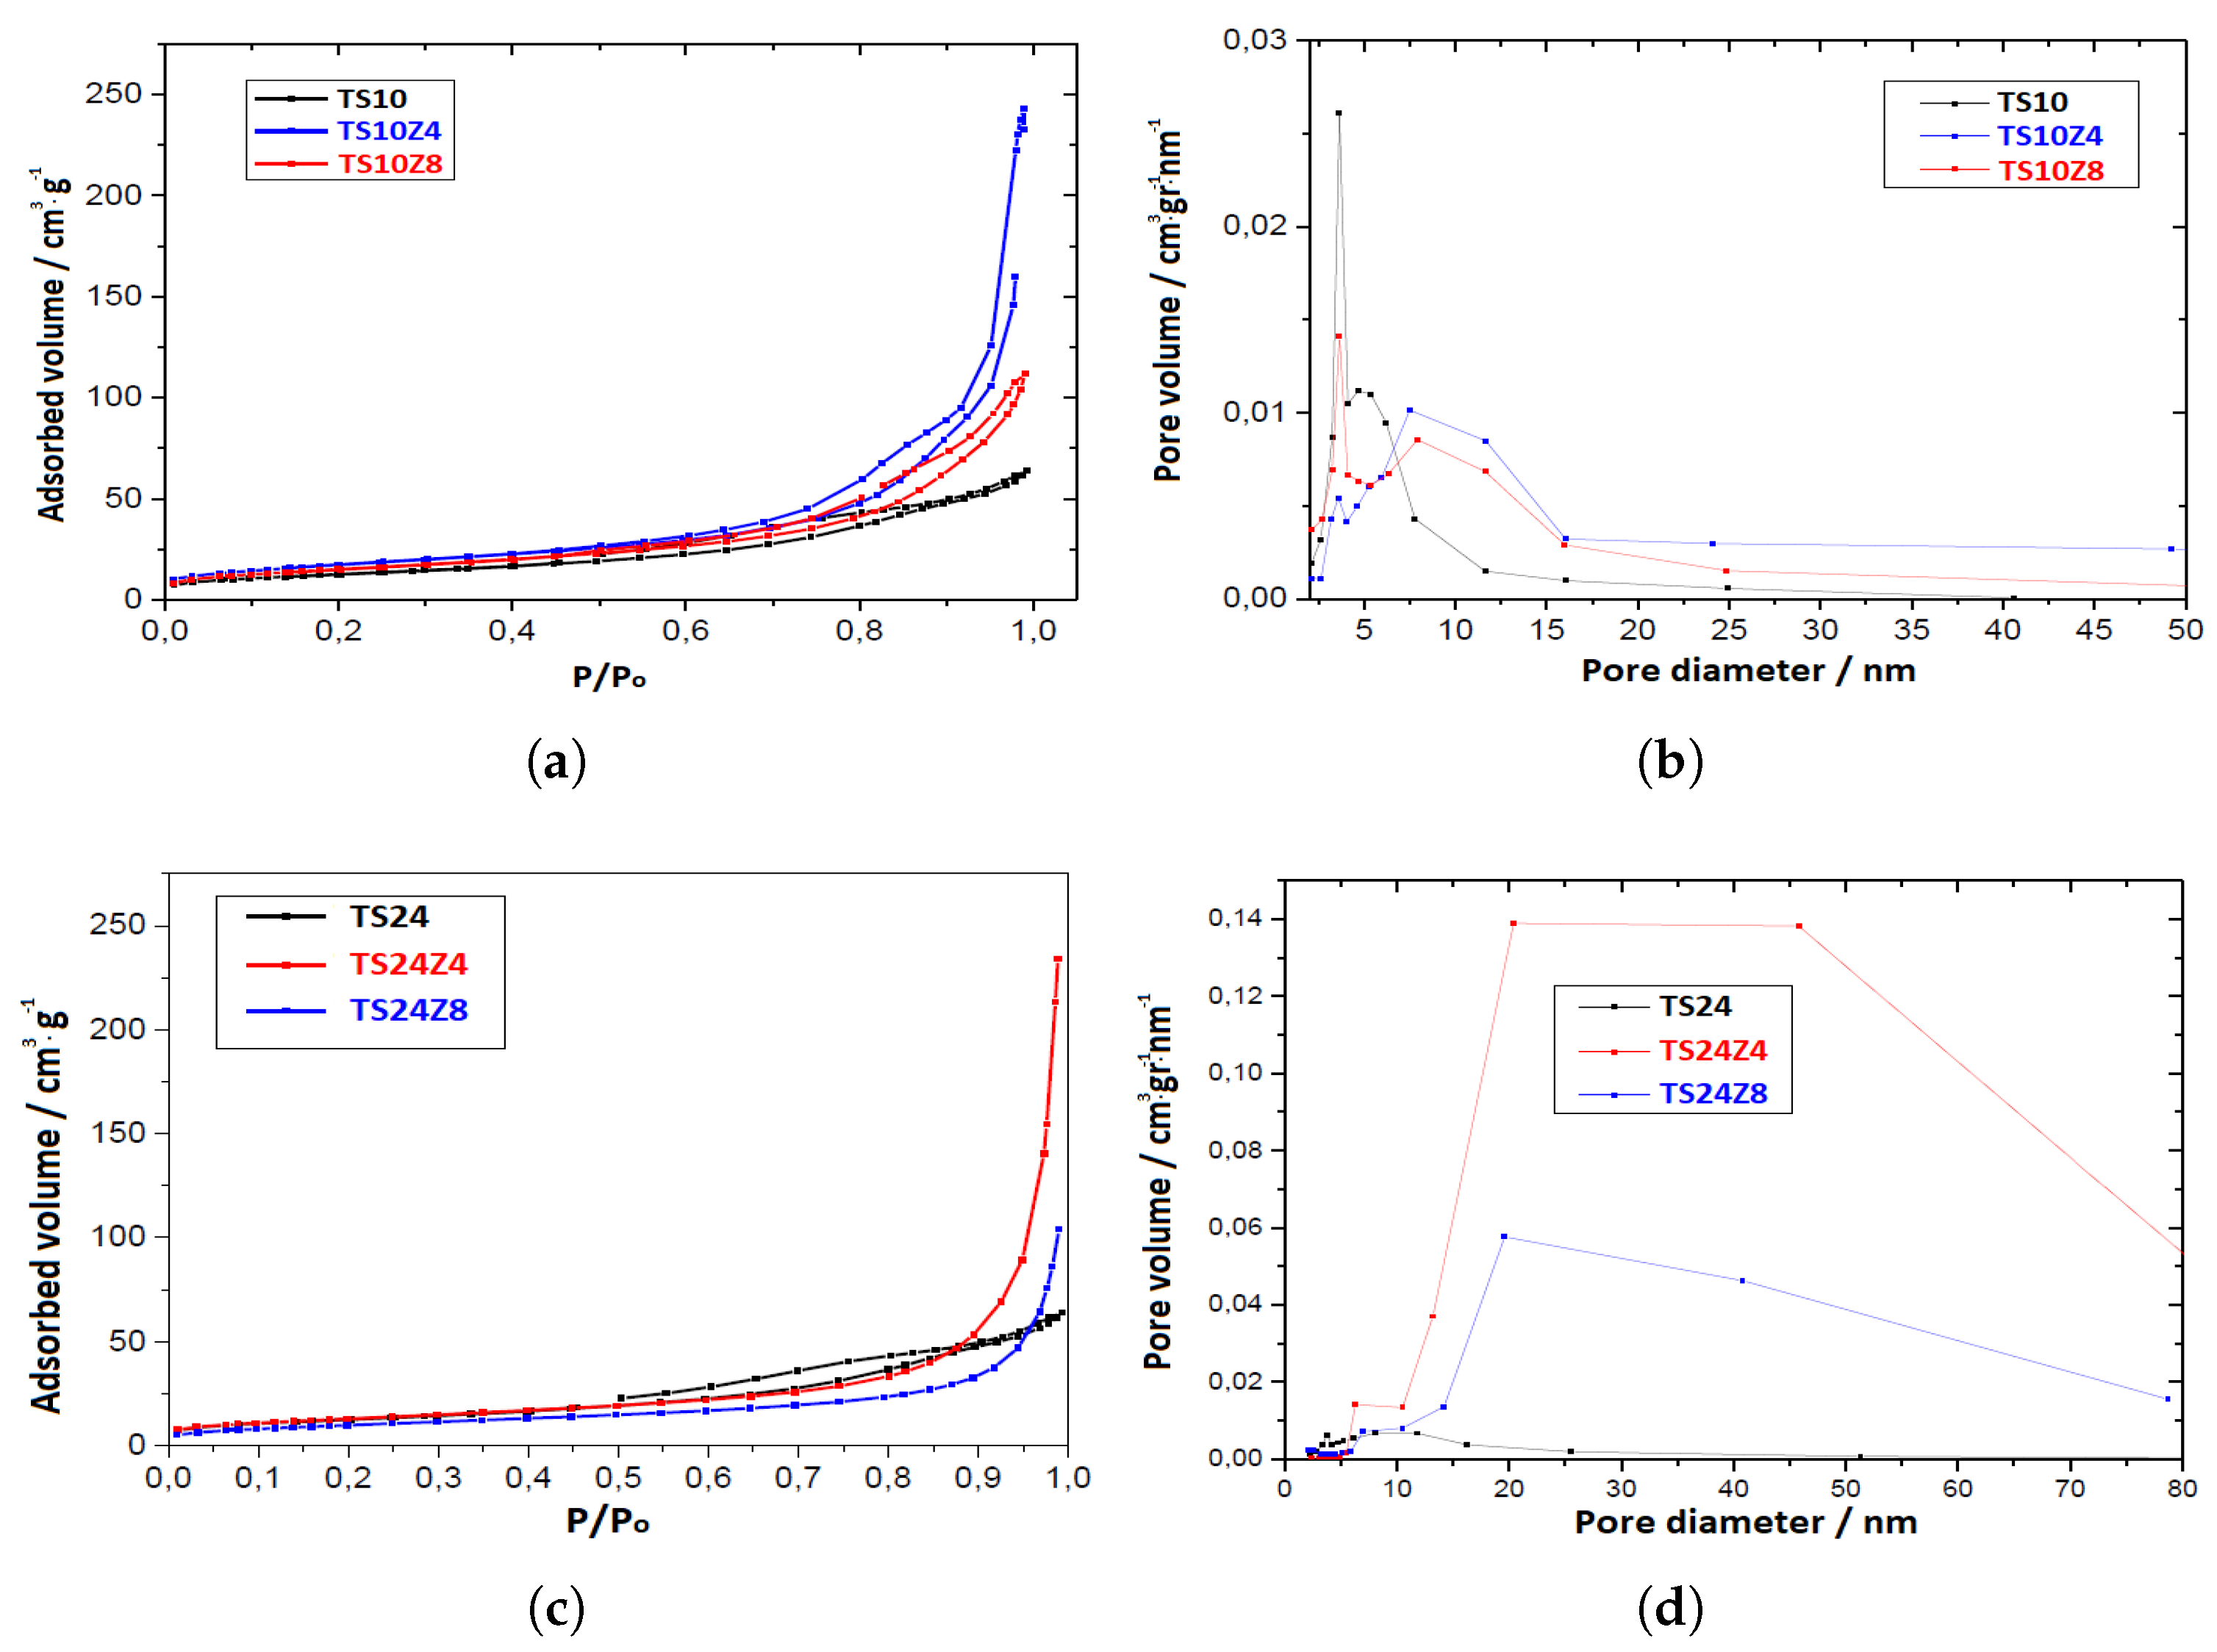
Figure 6.
Transient photoconductivity at 300 K under vacuum for all prepared samples.
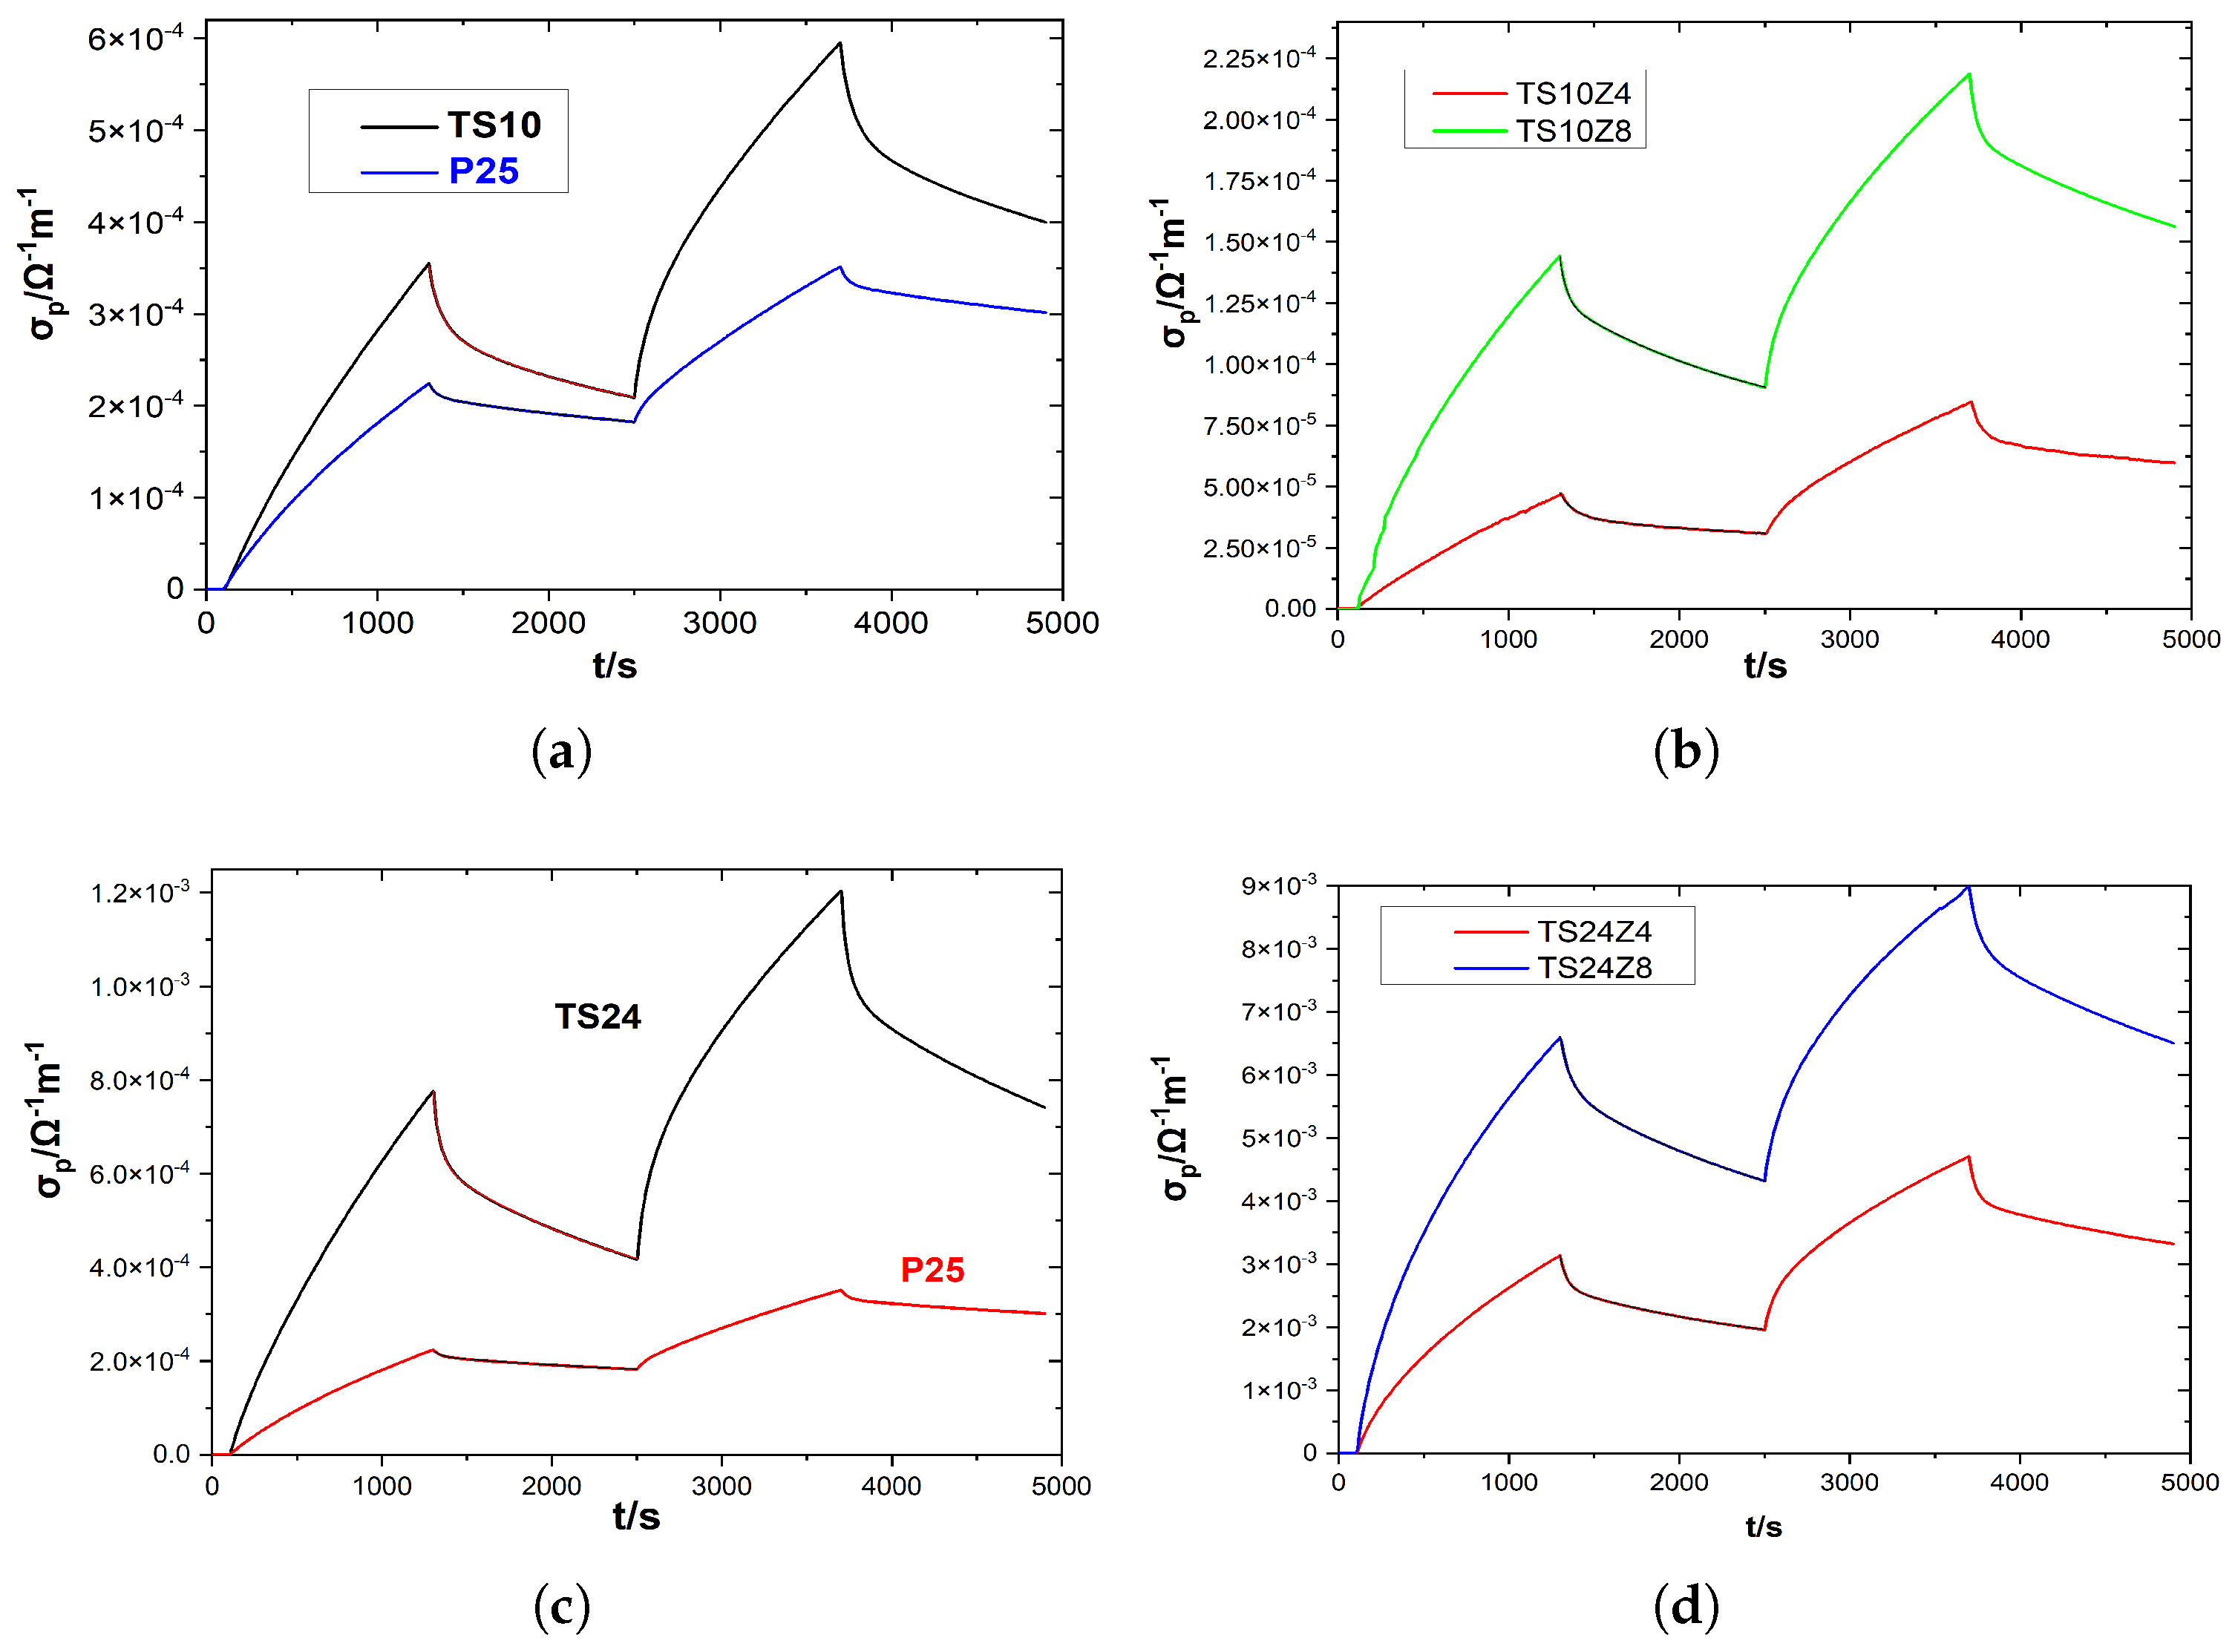
Figure 7.
Representation of states within the band gap of .
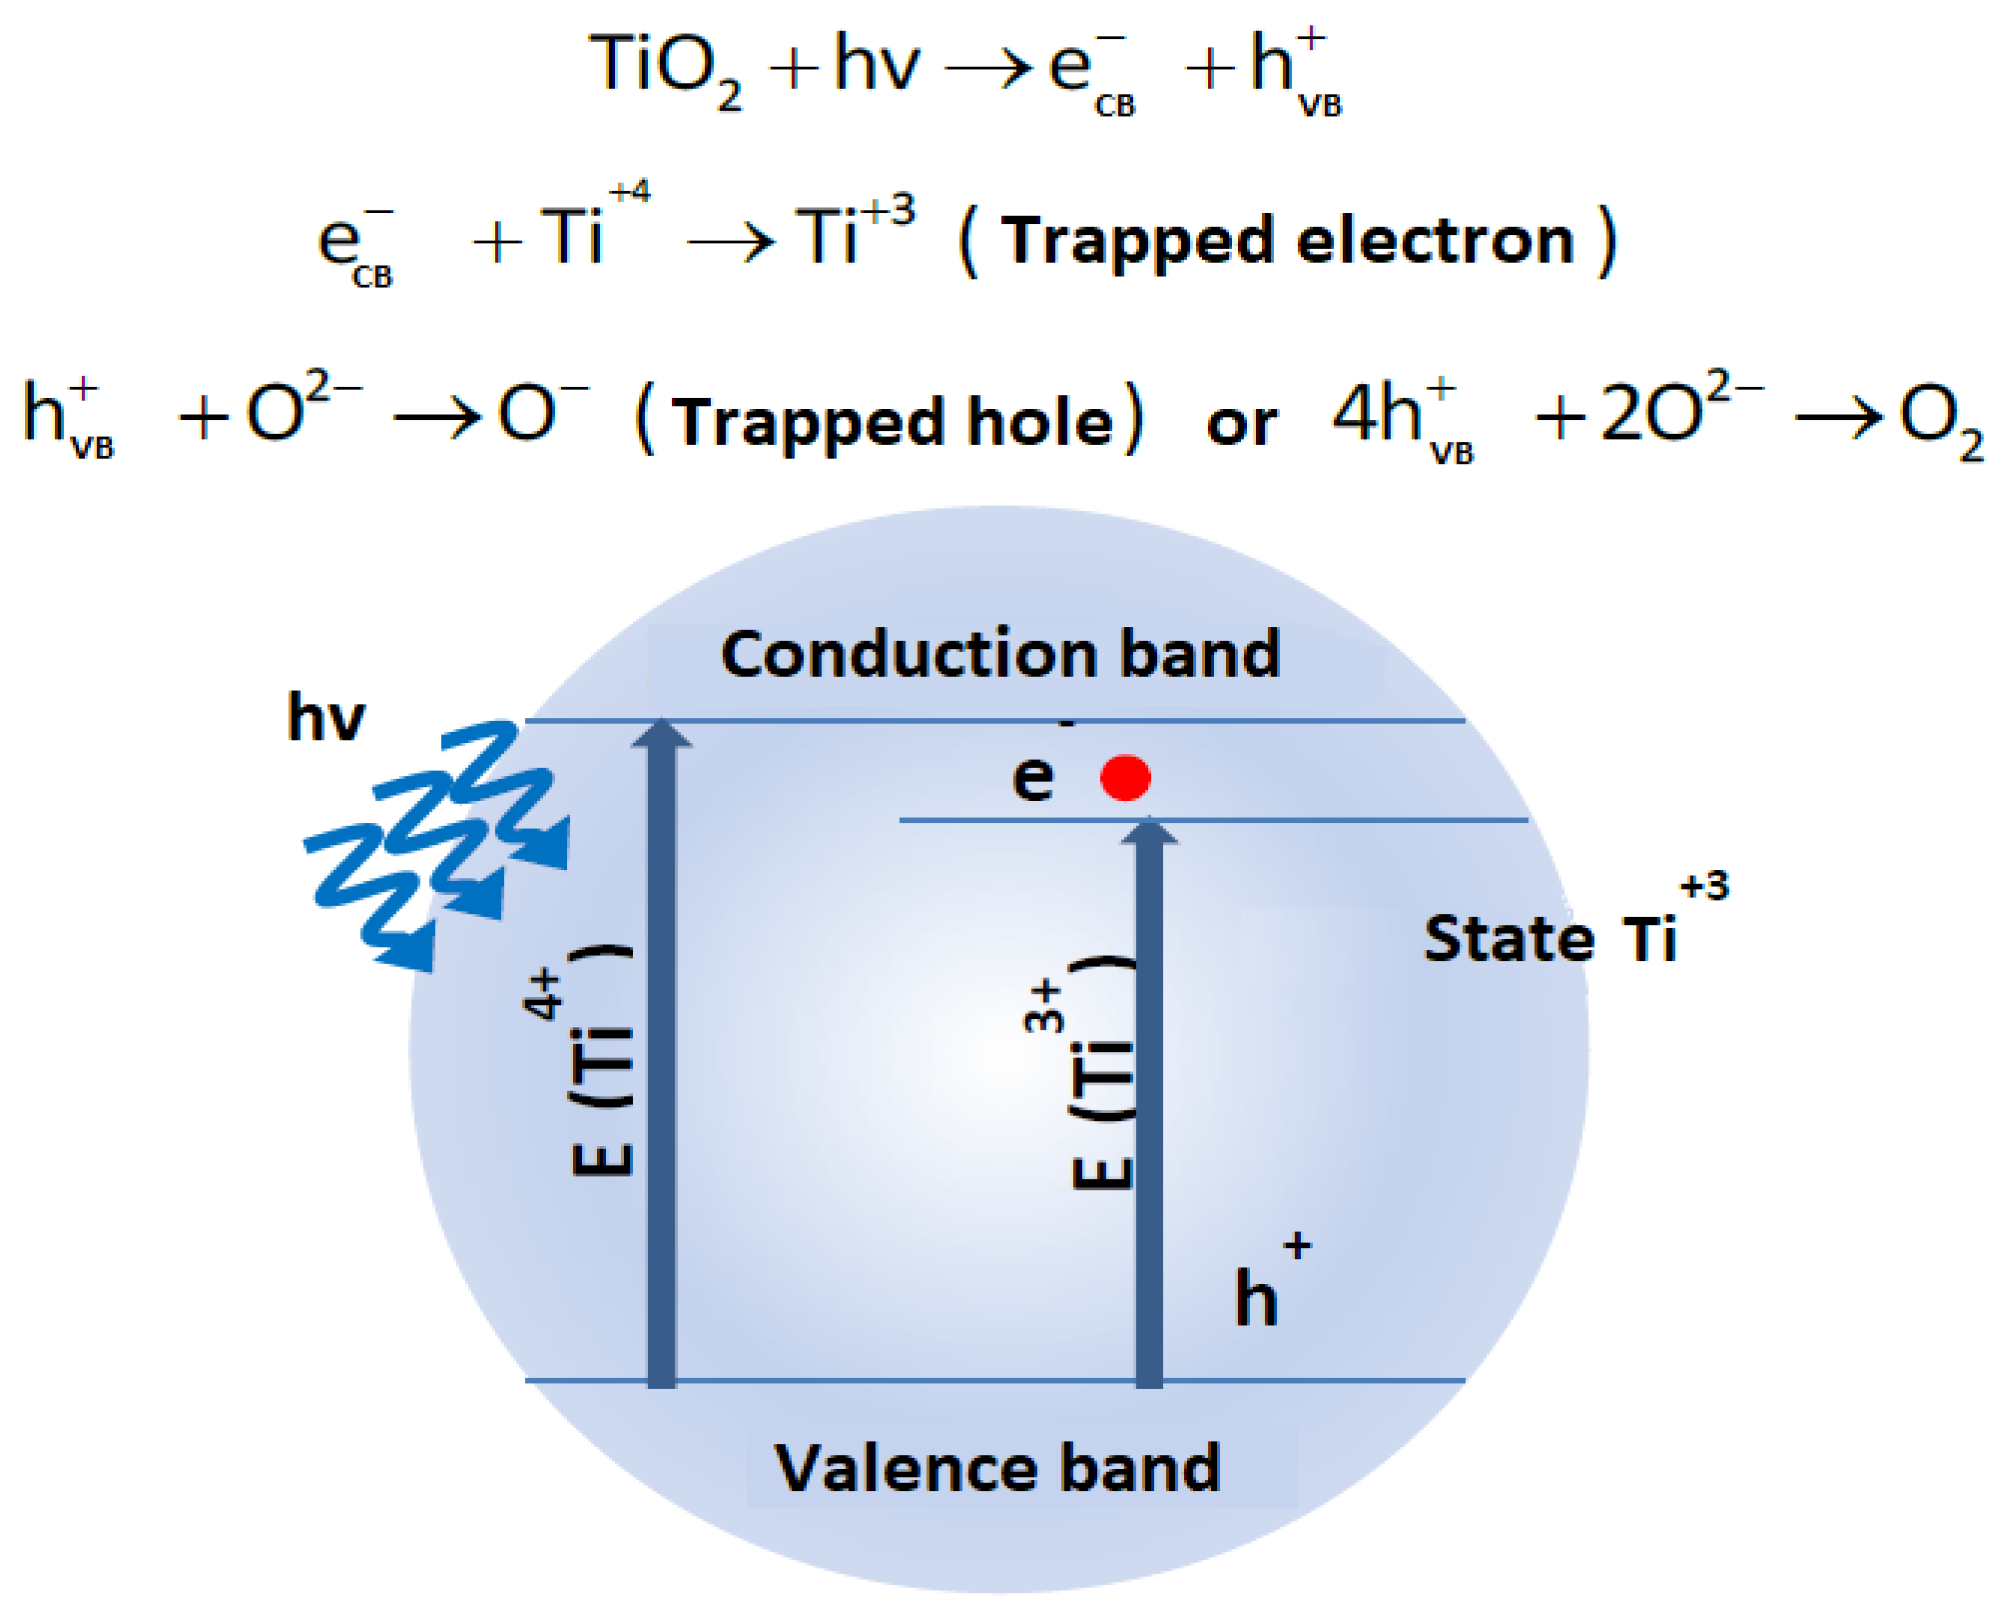
Figure 8.
Transient photoconductivity at 300 K in air for all prepared samples.
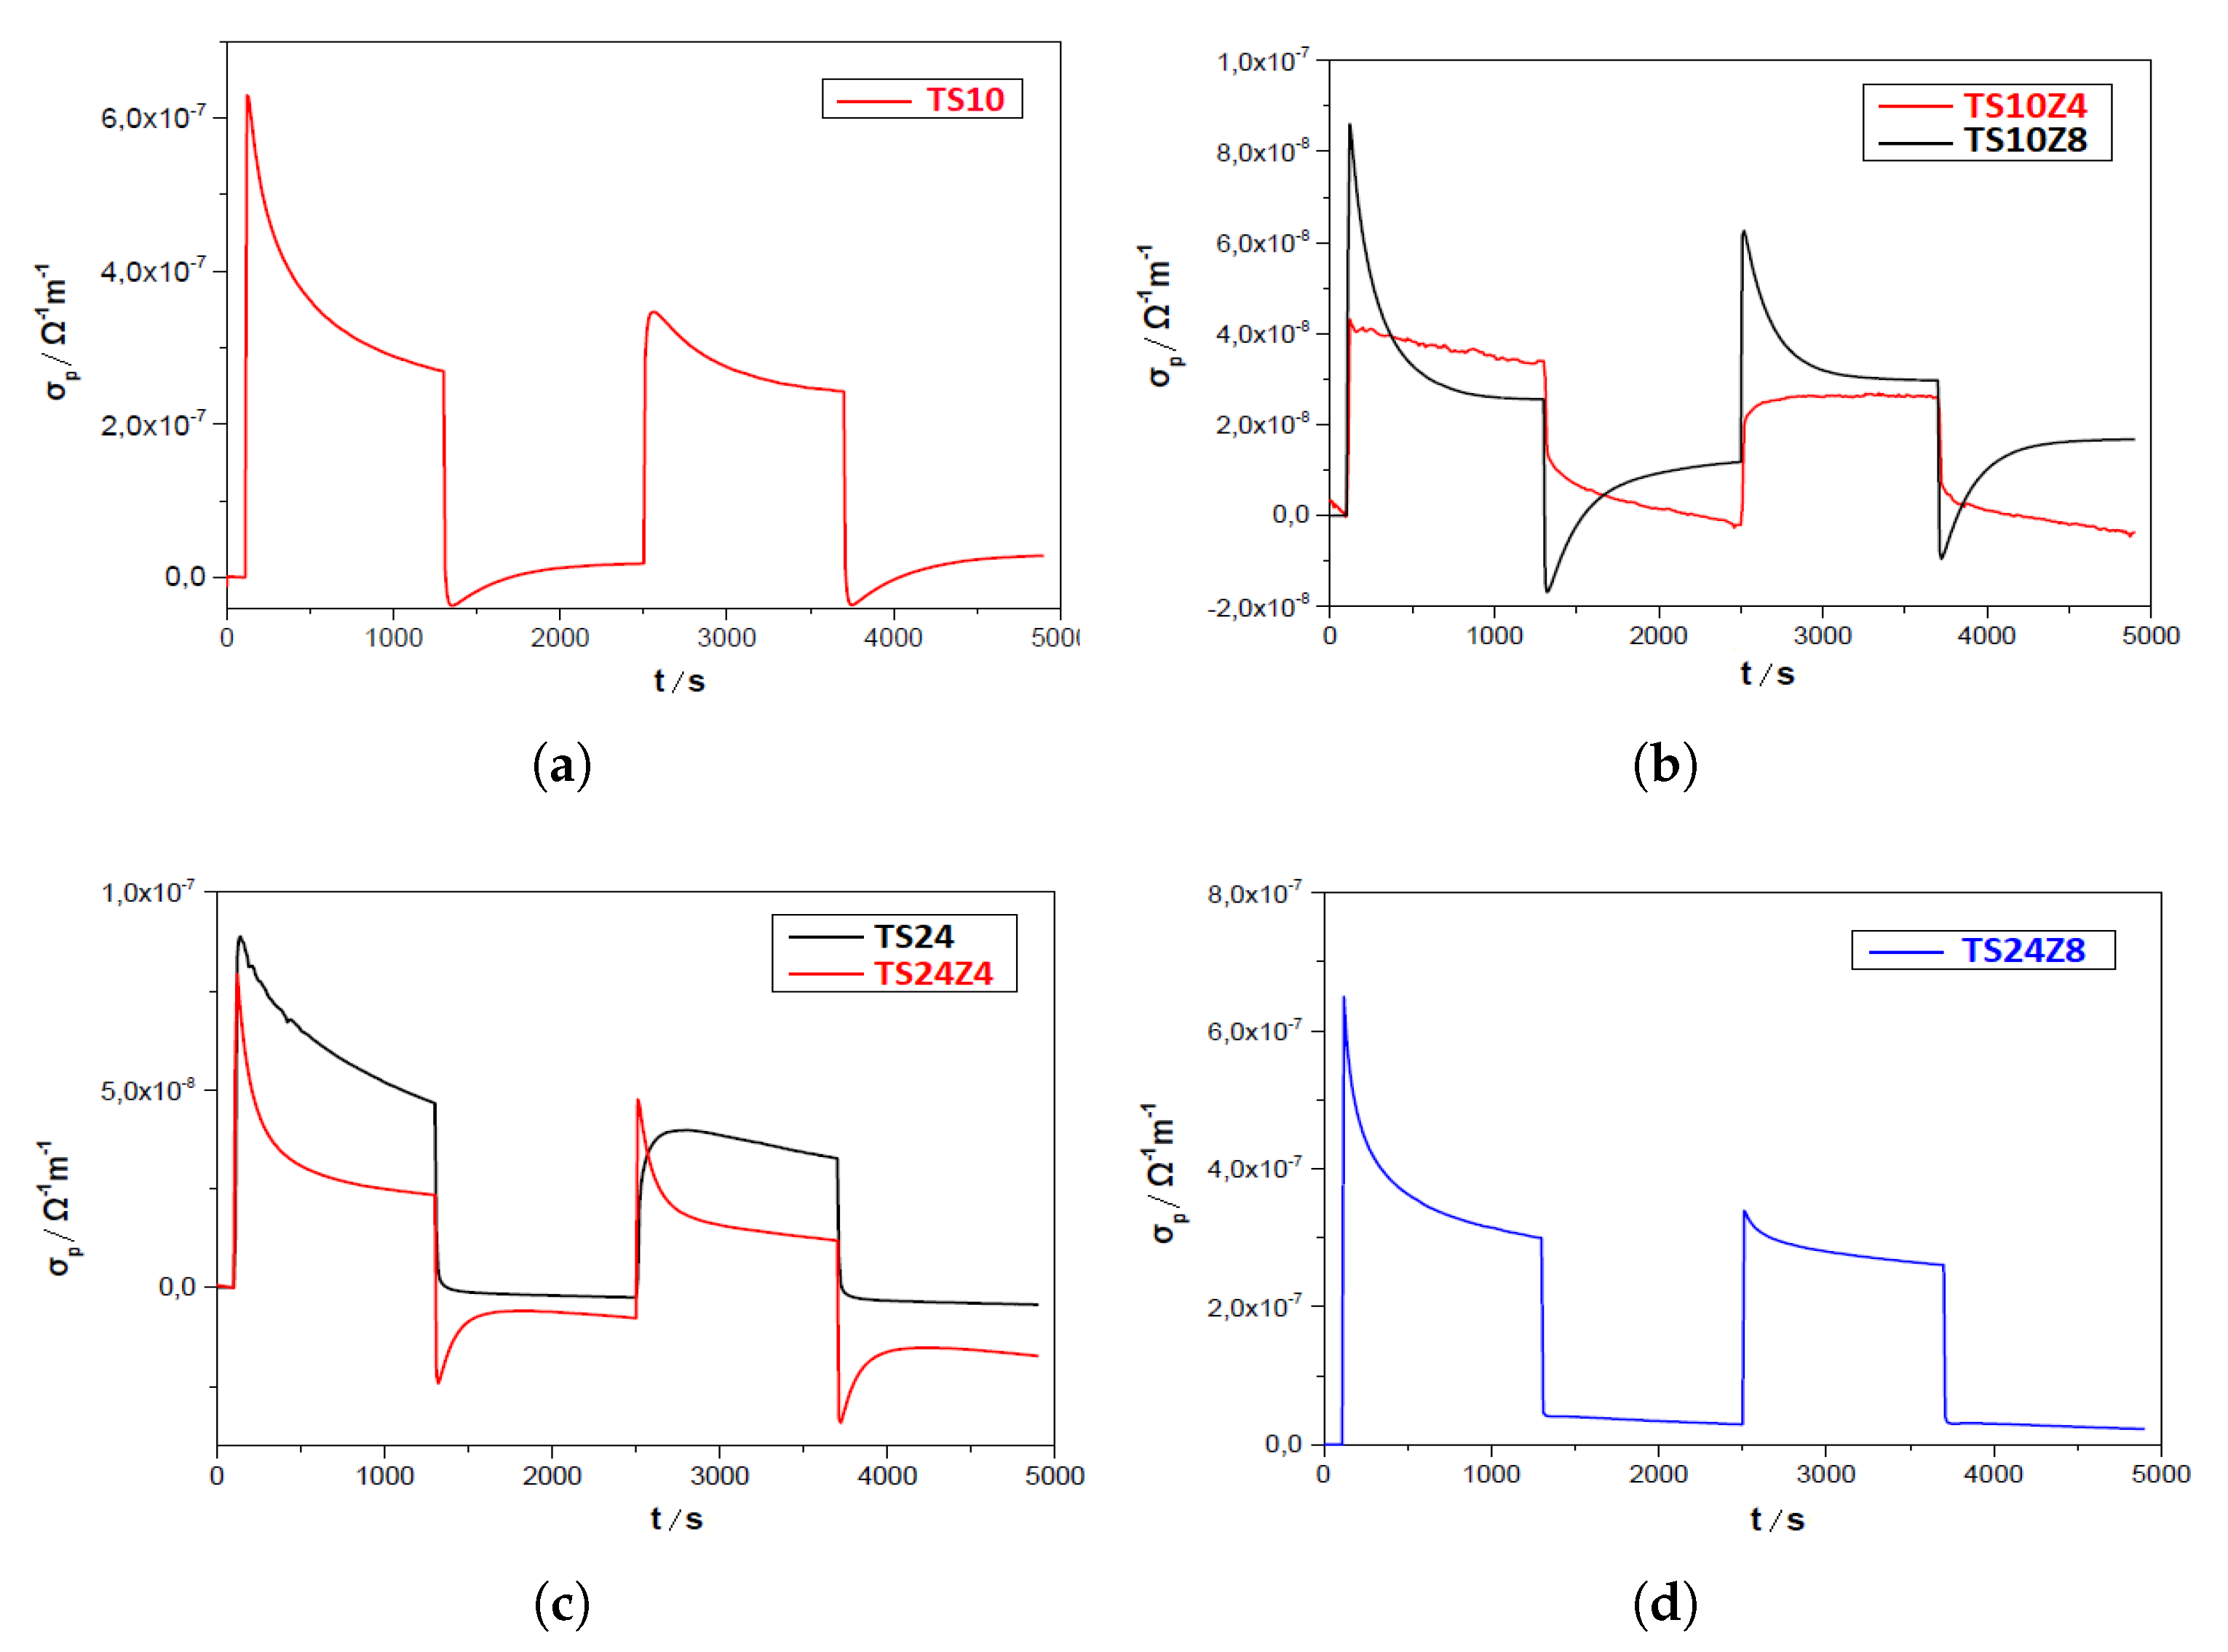
Table 1.
The chemical substances, with their abbreviations, sources, and properties, are listed here.
Table 1.
The chemical substances, with their abbreviations, sources, and properties, are listed here.
| Reagent / Material | Abbreviation | Source | Characteristics |
|---|---|---|---|
| Titanium butoxide (Ti) | TBT | Merck | M = 340.36 g/mol = 1.00 kg/L |
| Sulfuric acid () | SA | Fluka | M = 98.08 g/mol = 1.84 kg/L |
| Zinc sulfate heptahydrate (O) | ZS | Sigma-Aldrich | M = 287.53 g/mol = 2.07 kg/L |
Table 2.
Compositions of the samples along with their respective reaction times.
| Samples | ZS (g) | Abbreviation | Reaction time (h) |
|---|---|---|---|
| 10h | 0 | TS10 | 10 |
| 10h 4% ZS | 0.120 | TS10Z4 | 10 |
| 10h 8% ZS | 0.183 | TS10Z8 | 10 |
| 24h | 0 | TS24 | 24 |
| 24h 4% ZS | 0.120 | TS24Z4 | 24 |
| 24h 8% ZS | 0.183 | TS24Z8 | 24 |
Table 3.
Crystallite size of the main anatase peaks for the sample series.
| Samples | d(101) nm | d(004) nm | d(200) nm |
|---|---|---|---|
| TS10 | 15.77 | 17.95 | 15.04 |
| TS10Z4 | 16.06 | 15.28 | 16.13 |
| TS10Z8 | 16.65 | 18.14 | 16.50 |
| TS24 | 17.50 | 21.69 | 17.80 |
| TS24Z4 | 19.71 | 18.62 | 19.27 |
| TS24Z8 | 22.18 | 24.34 | 22.65 |
Table 4.
Band gap energies of the samples.
| Samples | (eV) |
|---|---|
| TS10 | 3.16 |
| TS10Z4 | 3.21 |
| TS10Z8 | 3.19 |
| TS24 | 3.20 |
| TS24Z4 | 3.12 |
| TS24Z8 | 3.21 |
Table 5.
Summarized surface analysis results.
| Samples | S(/g) | (/g) | (nm) | (%) |
|---|---|---|---|---|
| TS10 | 45.33 | 0.099 | 7.28 | 27.26 |
| TS10Z4 | 62.48 | 0.376 | 19.64 | 58.82 |
| TS10Z8 | 54.85 | 0.173 | 10.65 | 39.64 |
| TS24 | 47.63 | 0.173 | 13.41 | 39.68 |
| TS24Z4 | 46.20 | 0.362 | 24.54 | 57.92 |
| TS24Z8 | 36.15 | 0.161 | 16.17 | 37.91 |
Table 6.
Values of dark conductivity () before the first illumination and photoconductivity () at the end of the first and second illumination cycles, along with the trap energies under vacuum.
Table 6.
Values of dark conductivity () before the first illumination and photoconductivity () at the end of the first and second illumination cycles, along with the trap energies under vacuum.
| Samples | (eV) | (eV) | |||
|---|---|---|---|---|---|
| P25 | 1.53 | 2.24 | 3.52 | 0.671 | 0.671 |
| TS10 | 1.46 | 3.55 | 5.96 | 0.682 | 0.614 |
| TS10Z4 | 4.66 | 4.66 | 8.43 | 0.689 | 0.620 |
| TS10Z8 | 6.22 | 1.44 | 2.20 | 0.688 | 0.602 |
| TS24 | 1.44 | 7.78 | 1.20 | 0.690 | 0.604 |
| TS24Z4 | 6.04 | 3.14 | 4.71 | 0.688 | 0.602 |
| TS24Z8 | 9.98 | 6.70 | 9.00 | 0.692 | 0.613 |
Table 7.
Values of dark conductivity () before the first illumination and photoconductivity () at the end of the first illumination.
Table 7.
Values of dark conductivity () before the first illumination and photoconductivity () at the end of the first illumination.
| Samples | ||
|---|---|---|
| TS10 | 1.46 | 2.65 |
| TS10Z4 | 2.78 | 3.40 |
| TS10Z8 | 2.26 | 2.55 |
| TS24 | 3.50 | 4.46 |
| TS24Z4 | 3.49 | 2.34 |
| TS24Z8 | 2.76 | 4.89 |
Disclaimer/Publisher’s Note: The statements, opinions and data contained in all publications are solely those of the individual author(s) and contributor(s) and not of MDPI and/or the editor(s). MDPI and/or the editor(s) disclaim responsibility for any injury to people or property resulting from any ideas, methods, instructions or products referred to in the content. |
© 2025 by the authors. Licensee MDPI, Basel, Switzerland. This article is an open access article distributed under the terms and conditions of the Creative Commons Attribution (CC BY) license (http://creativecommons.org/licenses/by/4.0/).
Copyright: This open access article is published under a Creative Commons CC BY 4.0 license, which permit the free download, distribution, and reuse, provided that the author and preprint are cited in any reuse.


