

Submitted:
29 August 2025
Posted:
03 September 2025
You are already at the latest version
Preprints on COVID-19 and SARS-CoV-2
Abstract
In recent years, several events have occurred that may have impacted the economic performance of the entire poultry sector and of individual farms. In particular, in the period 2019-2022, recurrent events, such as the avian influenza epidemics, occurred in conjunction with the exceptional COVID-19 pandemic. This study carries out a finan-cial analysis of a subpopulation of Italian poultry farms over this period, with the aim of assessing the effects on individual farms and identifying different perfor-mance-based profiles. Italy is one of the leading producers of poultry products in Eu-rope, and the poultry sector is a significant part of the national livestock economy. The study applies descriptive statistics and cluster analysis to several items drawn from the balance sheets and income statements of farms. The descriptive analysis reveals that the sector has generally recovered from the negative effects of external shocks. The segmentation analysis reveals the groups of farms with the best financial profiles in terms of economic sustainability, solidity and recoverability, as well as those that emerged from the period in a worse situation.
Keywords:
poultry farm
; COVID-19
; budget analysis
; financial ratio
; cluster analysis
; Italy
1. Introduction
In recent years, the poultry sector in several countries has been affected by various events, including the exceptional event of the global pandemic caused by the SARS-CoV-2 virus and recurrent events such as avian influenza epidemics [1].
The European Union accounts for around 9.3% of the global poultry meat production value and is the third largest exporter after Brazil and the United States [2]. The European poultry sector experienced a slight decline in production in 2022 (-0.9%), but quickly recovered on both the demand and supply sides. Demand is expected to grow.
Italy is the fifth-largest producer of poultry meat in the EU [3], accounting for around 10% of European production after Poland (20.6%), Spain (12.9%), Germany (11.7%) and France (11.5%). The sector accounts for 7.8% of national agricultural production and 3.9% of agro-industrial turnover, representing a significant portion of the national livestock market. From 2019 to 2021, the Italian sector experienced a decline in production volumes and was unable to meet domestic demand. Following a challenging 2021, chicken prices found new momentum in 2022 due to a significant supply shortage caused by highly pathogenic avian influenza [4] and increased raw material costs, primarily energy costs, which surged by over 80% compared to 2021, as well as feed costs, which rose by over 27%. These factors had a substantial impact on production costs and net profits. Since then, the situation of domestic poultry production has normalised and the domestic production volume has been in line with the volumes attained before the outbreaks of epidemics and pandemics in 2019; in addition, raw material prices have decreased and poultry prices at source have decreased by 18% [5].
The above data provides an overall picture of a sector that is resilient to external shocks. However, it does not elucidate changes that may have occurred at the level of individual farms. External shocks may affect farms with different intensities and in different ways, highlighting some resilient segments of the industry and others that were significantly affected, with lasting effects on their characteristics. Finally, there are segments that have recovered from the negative impacts and improved their performance.
The study aimed to address the research gap by investigating the impact of the observed turbulent period on the financial performance of individual poultry farms, and whether groups of farms with specific performance profiles emerged.
To this end, the study analyses the profitability and financial performance dynamics of Italian poultry farms over the period 2019–2022. The aim is to investigate how firms faced the effects of external shocks and whether different farm profiles emerged from a segmentation analysis. The focus on Italy is motivated by its importance in the EU poultry sector, as mentioned above, as well as by the importance of the sector within the national livestock industry. The 2019–2022 period was chosen because serious shocks to the national poultry sector occurred simultaneously during these years.
The ultimate goal of the study is to draw lessons from the effects of epidemics and pandemics on farms, and to make suggestions for dealing with future external shocks.
The study is inspired by literature focusing on the economic pillar of sustainability [6, 7 ], as well as by studies adopting an economic perspective and referring to the efficient use of resources, competitiveness, and the viability of the sector [8,9].
Several studies have investigated the impact of the pandemic caused by the SARS-CoV-2 virus and other diseases, such as avian influenza, on poultry production and its supply chain. Indeed, most studies on the impact of the pandemic focused on the early phase or the period during which it was ongoing. Studies concerning the initial pandemic period assessed the negative effects of the virus on poultry production and costs, demand, and international trade. However, the impacts varied substantially from one country to another, as reviewed by [10]. Other studies have addressed problems in the poultry supply chain, proposing the storage of production inputs to mitigate the effects of market turbulence [11,12], and have investigated the negative effects on smallholder poultry farmers due to low demand and high feed costs in the early phase of the pandemic [13, 14].
The effects of the pandemic on consumption patterns, transportation logistics and the economic performance of poultry farming and the entire poultry supply chain have been significant [15]. Conversely, studies investigating the effects of the pandemic or covering the entire period (pre- and post-pandemic) are scarce and have produced conflicting results [16].
As regards the avian influenza epidemic, the literature on its impact on livestock farming is richer than that on the impact of COVID-19, which is clearly due to the extent of avian influenza outbreaks, the recurrence of the disease, and the fact that these situations have occurred in many countries [17,18,19].
Previous studies have adopted various approaches. Studies that have measured the economic effects of shocks at the onset and during the period of shocks have primarily relied on qualitative methods, such as direct surveys of producers and consumers, or a combination of qualitative and quantitative approaches. During the pandemic, impact analyses have primarily used official data on sectoral production, prices and other variables available at an intra-annual frequency. However, financial data has not been used as it is only available at the end of each year and relates to the previous year.
Studies that deal with the ex post effects of epidemic/pandemic events on firms take into consideration the value of production and production costs, such as the costs of raw materials, veterinary costs and labour costs [20, 21, 22, 23]. Profitability indexes, such as return on total investment (ROI), return on sales (ROS), return on equity (ROE) and capital turnover (CTO), are commonly used to measure farm performance and provide an overview of a sector's economic and financial situation [24].
The economic literature emphasises the importance of maintaining consistency in the evaluation methods and rules applied to financial statements from one reference period to another in order to analyse and compare firms' performance correctly. For this reason, analyses should be based on homogeneous data and recognised standard rules, such as those set out in EU Directive 2013/34/EU and its amendments on annual financial statements. These are the accounting standards that apply in the context of the study and ensure the comparability of firms' financial statements across organisations and years.
The consistency of rules and standards is particularly important due to certain features of poultry farms.
One such feature is the intensive management method, which is used to guarantee rapid growth and achieve the size and weight required by the market. Another feature is the multiple production cycles that occur within one calendar year. These characteristics make it difficult to measure assets, liabilities and owner’s equity, all of which are indicators of farm performance, especially operating profit. This difficulty may explain the lack of literature on the profitability of the poultry sector and of individual poultry farms [25].
Another feature of the poultry sector is the broiler contract, which is a production agreement between industries and livestock farms, primarily those involved in meat production (broilers). In brief, a broiler contract involves the transfer of possession, but not ownership, of livestock to a farmer (the bailee) for a period of time. During this period, the farmer is responsible for the growth of the chickens and covers the costs of providing energy, fuel, water and waste management. Meanwhile, the owner of the chickens (the bailor) is responsible for the technical management of the farm, providing feed and technical and veterinary services, as well as transporting and delivering the poultry and collecting the chickens at the end of the contract. The bailee has no bargaining power over the price of the final product. However, this formula has clear advantages [26]: by bypassing the problems linked to increased production costs and market price and raw material volatility, it can safeguard the profitability of poultry farms [27, 28].
In addition to the characteristics of the farm, poultry production is affected by external variables, such as legislative restrictions on animal welfare and quality standards for meat and meat products, as well as rules, guidelines and procedures for preventing livestock diseases. The cost of maintaining high hygiene standards and good manufacturing practices on poultry farms reduces their profitability [29, 30], although spending on environmental and animal health reduces the loss of raw materials, thus reducing costs and improving financial efficiency [31]. Finally, external events, such as those that occurred during the study period, may affect poultry farms and their economic sustainability.
2. Materials and Methods
2.1. The Dataset
The data of Italian poultry farms were retrieved from the AIDA database managed by Bureau van Dijk, which collects the financial statements of Italian firms in accordance with the EU IV EEC Directive 2013/34/EU on annual financial statements. For each firm, AIDA provides the detailed balance sheet and income statement, historical series and original optical balance sheet filed in the Register of the Italian Chambers of Commerce.
All firms having the NACE Rev. 2.1 code 01.47 ‘Raising of poultry’ as their main economic activity, with entries in the dataset for the year 2022 and a value of production not lower than one million euros, were considered, giving a total of 88 farms. The dataset was further focused on farms whose historical series went back to year 2019, for a total of 79 farms included in the final subpopulation.
The filter for the minimum value of the production was fixed based on various considerations. On the one hand, Article 2435-bis of the Italian Civil Code allows small farms to choose to draft a simplified version of their balance sheet and income statement with a significant reduction in information content -in terms of the sheet model and in the level of detail of the reported items-, so that simplified sheets are not fully comparable with ordinary financial statements. It was therefore necessary to identify a criterion based on the economic size of the farm in order to extract from the AIDA database a population of farms – large farms – that must adopt the most informative ordinary model for their balance sheet and income statements. In addition, considering that the classification adopted at EU level within the Farm Accountancy Data Network sets eight classes, with increasing values of the total standard output of the farm, the selection criterion for the extraction of firms and their financial statements was set to include the final class of farms with a total standard output value equal to or greater than one million euros, in order to include only those farms that had drawn up an ordinary model of financial statement.
In light of the above considerations about filtering criteria, the analysis of the financial statements was applied to a population of comparable farms that included all large poultry farms active in the Italian poultry sector in the period 2019-2022.
The dataset was mainly composed of farms located in the Emilia-Romagna region (23% in the year 2022) –with a concentration in the province of Forlì-Cesena (19%)–, in Sicily (13%), and in the Campania and Lombardy regions (11% each). In all, 92.4% of the farms had limited liability as their legal form, 5.1% were cooperatives, while the remaining 2.5% were joint-stock companies. The sector presents a high concentration in both economic and geographical terms, being characterised by the presence of some holdings: in a decreasing ranking, the first holding grouping 10 farms -mainly located in the Emilia Romagna region- accounted for 22% of the total sales of the farms in the dataset (year 2022); and the second holding grouping 5 industries -located in the Marche region- accounted for 8.7% of the total sales. In total, the poultry farms in the dataset had sales revenue of 3.256 billion euros, a total value of production of 3.473 billion euros, and a net profit of about 81 million euros. Finally, 60% of the farms in the dataset started their business in year 2000 or later (with the six youngest farms having been founded in 2017), 28% date back to the 1980s, and the remaining farms (24%) were founded even earlier.
2.2. Methods
Based on the data reported in the financial statements retrieved from the AIDA database, several ratios were calculated to describe the financial profile of the business units. Ratio analysis is a quantitative method for gaining insight into a company’s liquidity, operational efficiency. As reported in the literature section, four of the most common ratios were chosen as the basis for the subsequent analyses.
Return On Investment (ROI) is a measure of overall profitability and expresses the net profit a firm produces with its investment. It is calculated as the ratio of the operating profit after tax to the total capital (as a value or a percentage). It is used to measure the efficiency of corporate investment by comparing the benefits generated to the costs incurred. ROI is a fundamental tool for making informed decisions on new projects, acquisitions, and other investment initiatives.
Return On Equity (ROE) is the ratio between net profit and equity, and measures how much profit a firm generates per unit of equity invested in the company. It measures the return on shareholders’ equity, reflecting the effectiveness of management in creating value for shareholders. ROI and ROE are profitability ratios, but ROI adopts a wider perspective than ROE since it refers to investment in the firm and ROE is focused on shareholders’ equity.
Return On Sales (ROS) measures a firm’s operational efficiency and expresses how much profit is produced per net sales. This indicator is useful for assessing the operational profitability of a company and demonstrates the company’s ability to convert sales into operating profits.
The asset turnover (CTO) measures the value of sales relative to the value of assets and expresses the efficiency of a company in using its assets to generate revenue. It examines efficiency in working capital.
After applying descriptive statistics to summarize the farm dataset, segmentation analyses were carried out over the study period to detect the existence of groups of farms with different characteristics and performance as measured by the four financial ratios.
The Ward’s linkage method was applied to aggregate the farms into homogeneous clusters, that is, groups of firms with similar profitability characteristics, facilitating the identification of common patterns and trends. The Euclidean distance between each pair of poultry farms was calculated, creating a distance matrix representing the similarity between the profitability profiles of different firms. Ward’s method minimises the increase in the within-groups variance when merging two clusters; it is one of the most employed algorithms in hierarchical clustering, since it is particularly useful when the goal is to identify compact, well-separated clusters. For this reason, it was deemed appropriate to evaluate the quality of the partitions using a validity criterion based on the decomposition of the total deviance of the four profitability indexes considered. The R^2 index allowed for the evaluation of the degree of internal cohesion, identifying the most satisfactory partition derived from the possible aggregations.
Once the two partitions (one for year 2019, and the other for year 2022) were finally obtained, the Rand index was calculated as a measure of the similarity between the data partitions over the two budget years. The Rand index can take values between 0 and 1, with 0 indicating that the two data partitions do not agree on any pair of points, and 1 indicating that the two chosen partitions are the same.
All analyses were performed with the R software package version 4.1.
3. Results
3.1. The Dynamics of the Balance Sheet Ratios
The aim of the profitability analysis was to measure the economic and financial performances of the Italian poultry sector both before and after the period of epidemics and pandemic. This aim was achieved through a detailed and comprehensive assessment of the performance of each selected farm by using the key ratios of ROE, ROI, ROS, and CTO.
The trends for the years 2019-2022 are shown in the following Figure 1 that reports the mean value of the four ratios at firms’ level
Figure 1.a shows the ROE trend. This plot highlights the significant decline of the profitability of the poultry farms in the first years oof the external shocks followed by a gradual but noticeable recovery. This trend stresses the importance of the resilience and adaptability of businesses in the face of global crises, as well as the effectiveness of strategies to restore and enhance profitability in the long term. In particular, in 2020 there was a significant decline in ROE; this phenomenon coincides with the onset of the COVID-19 pandemic and the adoption of lockdown measures. In 2021, ROE began to recover, and it went on growing in 2022, when it surpassed pre-pandemic levels. This pattern indicates not only recovery but also a potential strengthening of the competitive position of the poultry farms. The increase could stem from the consolidation of strategies adopted during the crisis and renewed momentum in the post-pandemic market.
The ROI trend during the four-year period from 2019 to 2022 is shown in Figure 1.b. The fluctuations of ROI during the period under analysis reflect the challenges and opportunities faced by farms in generating returns on investment under the influence of economic variables, operational decisions, and market dynamics. In 2020, ROI started declining: market turbulence and economic uncertainties contributed to an overall reduction in corporate profitability. The year 2021 saw a significant drop, highlighting the challenges faced by poultry farms in restoring their profitability in the post-events context. However, in 2022 the index had a noticeable increase, suggesting a significant recovery which could be attributed to effective recovery strategies and/or improvements in market conditions and/or positive adjustments in business operations.
Figure 1.c shows the trend in ROS. Between 2020 and 2021, ROS decreased, suggesting serious difficulties in maintaining operational profitability in an uncertain economic environment. In 2022, ROS reported a significant improvement, returning to a level higher than that in 2019: this dynamic may be due to the same factors impacting on the ROI ratio.
Finally, Figure 1.d shows the pattern of the CTO ratio from 2019 to 2022. Initially, the poultry farms demonstrated a good ability to convert their assets into cash, suggesting efficient working capital management. A sudden and sharp reduction in the CTO was experienced in years 2020 and 2021; this decline could be attributed to several factors, including possible increases in accounts receivable collection times and difficulties in inventory management, which slowed down the asset-to-cash conversion process. A slight improvement in CTO was observed in 2022, suggesting that farms began to regain control over working capital management.
The dynamics of the four ratios, based on the average values of the ratios in the sector, highlight that on average the negative performances recorded in the most critical years of the outbreaks were overcome, albeit with different intensity. These trends support literature that highlighted the high impact and financial losses incurred by poultry production in the early stages of the pandemic, such as the study by [32] referring to developing countries; as well as studies [33, 34] which reported severe impacts in the first phase of the pandemic but a recovery in subsequent years. However, within this global picture, intrasectoral specificities do not emerge and this provides the basis for the implementation of the segmentation analysis.
The fluctuating trends of the four selected profitability indexes provide a crucial insight for setting the subsequent multivariate analysis. The previous figures show that the ratios calculated for the years 2020 and 2021 can be considered exceptional with respect to the ‘normal’ values recorded in the two extreme years preceding and following the occurrence of external shocks. This observation suggested applying the segmentation analysis to the values of the profitability ratios in 2019, before epidemic events, and in 2022, after them.
3.2. The Segmentation Analysis
The segmentation analysis was carried out in order to group farms based on similarities in their financial and operational characteristics and to identify common patterns and tendencies. As described in the previous section, the cluster analysis compared the performances of poultry farms in the fiscal years 2019 and 2022 which represent the pre- and post-pandemic years. The results reveal an optimal solution with six groups for each analysis. Indeed, based on the index measures, the classification with six groups for each of the two years explains over 70% of the total deviance of the four profitability ratios and therefore can be considered satisfactory; specifically, the index for the year 2019 is 0.80, while for the year 2022 it is 0.74.
Table 1 reports the average value of the four ratios calculated at farm level by cluster.
A preliminary look at results for 2019 highlights that the clusters are quite different in size, with one big group including more than 40% of the farms, four much smaller groups, and a group containing only one farm. The distribution of farms by cluster in year 2022 is partly similar to that in 2019 for the presence of one large group, but two medium-sized clusters and three smaller groups are observed.
For both years, the emergence of numerous groups reveals the existence of different poultry farm profiles within the observed population. As described below, the profiles of the six groups in each of the two years show similarities in the performance of the ratios, highlighting the profiles that are the worst or the best overall, the groups with positive but not excellent financial performances, and, finally, the groups positively or negatively characterised by the value of single ratios, the ROE and the ROS. In the following subsections, each cluster is named (along with the cluster number and reference year) and described based on the performance of the four ratios and of the balance sheet items.
3.2.1. Segmentation Results in 2019, the Pre Epi-Pandemic Year
In year 2019, the biggest group (Cluster 3) was classified as the worst, while the smallest (Cluster 4), leaving aside the sixth group with a single farm, was categorised as the best group. Cluster 4, consisting of seven poultry farms, emerges as the ‘best overall’ group, reporting high values of ROE, ROI, and ROS, indicating effective capital and operational management. In particular, Cluster 4 is by far the best group in terms of ROE, indicating that farms in the group are highly effective in generating profits relative to their invested equity. Conversely, Cluster 3 is the ‘worst overall’ group; it shows weak performance across all ratios, with negative or very low values of ROE, ROI, ROS, and CTO; this cluster may require significant interventions to improve its financial and operational situation.
The 30.0% of ROE in Cluster 2 (with ‘good performance’) is notable and may indicate a concentration of farms with particularly profitable strategies; however, the value of ROE in the group is lower than the figure in Cluster 4, suggesting there may be room for further improvements in the performance of the farms in the group.
Clusters 1(with ‘moderate performance’) and 5 (with ‘best return on sales’) both show moderate ROE. In 2019, Cluster 1 has a slight advantage over Cluster 5, but both could benefit from strategies to increase their return on equity. Cluster 5 stands out for having the best ROS, indicating a high profit margin on sales; farms here may have a competitive advantage through effective pricing strategies or cost management. On the other hand, Cluster 5 has a very low CTO, indicating that the use of working capital to generate sales is not so efficient; farms here demonstrate excellent management of operational cash flow, with the ability to generate significant sales while deploying fewer financial resources.
Finally, the farm in Cluster 6 (with the ‘worst return on equity’) stands out for its extremely negative ROE, indicating that the farm has incurred significant losses relative to its invested equity and should identify corrective measures to improve its financial situation. Despite a negative ROE, Cluster 6 shows the best ROI, indicating that the farm is achieving a good return on overall investments, while having difficulties with equity capital.
In order to give a more detailed description of the profile of each cluster, Table 2 reports the average value of some items resulting from the financial statements of farms, of the earnings before interest and taxes (EBIT) and the earnings before interest, taxes, depreciation and amortisation (EBITDA) by cluster.
The data for 2019 show that Cluster 1 consists of the largest farms, with a production value more than double the total average, and much higher than in the other clusters. However, high costs reduce net profits, bringing them to the same level as Cluster 2, which maintains strong financial and management indexes despite lower production values. Cluster 4 is in an intermediate position, with a production value that is relatively low compared to the average, but quite a balanced cost structure. Cluster 3, despite showing low profitability indexes, has a relatively discrete profile and ability to generate a positive EBITDA; this seems to indicate that these farms operate in environments with very narrow profit margins and need to expand or restructure to improve their overall performance. Cluster 6 (one farm) is confirmed to be in a position of significant structural and financial weakness, with a need for substantial interventions to improve efficiency and return profitability to the positive sign: the production value is significantly below the average and the farm shows a net loss caused by a cost of production that, although relatively low in absolute terms, is not compensated by revenues, while the financial situation is equally fragile. Cluster 5 represents a model of operational efficiency, capable of achieving high margins even with a modest production structure.
To the above description of the groups with positive performances, it can be added that although Cluster 4 reveals a better combination of positive and high indicators -which justify its efficiency in generating returns on invested capital, in controlling costs and in the profitability relative to sales-, Cluster 1 shows higher revenues and better operating margins. This is because, while Cluster 4 excels in terms of returns on invested capital and operational efficiency, Cluster 1 has a higher revenue base, greater production value, and is able to maintain higher operating margins, thanks to a more efficient use of resources and a more optimized cost management. This could be due to the adoption of different strategic business models that explain the varying performances: while Cluster 1 focuses on large-scale growth with higher revenues, Cluster 4 stands out for a more efficient management of resources and costs, aiming for higher profitability per individual investment.
Regarding the clusters with greater criticalities, it can be stated that Cluster 6 faces a direct financial problem but demonstrates better relative management of assets and cost structure compared to Cluster 3, which struggles both operationally and financially. In Cluster 6, costs exceed revenues, resulting in a negative net profit; however, compared to the third Cluster, Cluster 6 appears to have a more contained cost base and financial structure, which mitigates the impact on its indicators. Cluster 3 is globally inefficient: although it does not generate losses, the revenues generated aren’t sufficient to enhance the value of the company’s assets, and the operating profitability relative to sales is limited, indicating cost efficiency issues in relation to turnover.
3.2.2. Segmentation Results in 2022, the Post Epi-Pandemic Year
Results for the year 2022 show that the groups are more concentrated than in the year 2019, with one large group comprising 43% of the farms, two medium-sized groups each with around 20% of the population, and three remaining much smaller groups; fortunately, the group with the worst overall performance is made up of only two farms.
Cluster 2 (the ‘best overall’) shows convincing performances across various profitability ratios, indicating solid financial management and effective business strategies in generating profits, return on investments, and profit margin on sales; it emerges with the highest ROE, indicating excellent profitability generation relative to invested equity.
At the opposite, Cluster 5 –with only three companies– is distinguished as the ‘worst overall’ group; it exhibits very weak financial and operational performance, as expressed by the ROI and ROS profitability indexes as well as by the asset turnover. The return on equity is not as critical as the other ratios, but its value is not particularly high.
Cluster 1 (with ‘moderate performance’) is the biggest group containing 43% of the farms, and exhibits a modest ROE, indicating that the farms here are generating profits but at a lower rate compared to other clusters; the ROI is positive but low, and so is the ROS value. Cluster 3 (with a ‘good performance’) is smaller than the first group but shows good values on all ratios in terms of return on equity, investment and sales.
Cluster 4, with ‘worst return on equity’, owes its name to its negative ROE (it is the only cluster with this feature), indicating losses relative to invested equity; ROI and ROS ratios are positive but quite low.
Finally, Cluster 6 (with the ‘best return on sales’) stands out for having the highest ROS, indicating a significant profit margin on sales; here, farms demonstrate a remarkable ability to generate profits relative to sales volume.
As done previously for 2019, Table 3 presents a more comprehensive depiction of the characteristics of each cluster in 2022, reporting the mean values of selected indicators derived from the farms’ financial statements, together with the earnings before interest and taxes (EBIT) and the earnings before interest, taxes, depreciation, and amortisation (EBITDA) for each cluster.
In 2022, Cluster 1 emerges as a strong player in terms of production capacity, but with narrow operating margins and a financial position that could pose a long-term risk: while it demonstrates a solid ability to generate revenue, ensuring a positive but modest income, it is marked by significant total liabilities that far exceed its equity, indicating a highly leveraged financial structure. Cluster 2_22 is the best in terms of operational efficiency and net profitability, with a strong balance between growth and cost management; it is one of the top performers economically, as the farms manage to maintain a balance between revenue generation and cost control, showing excellent ability to sustain a particularly high EBITDA and EBIT compared to the average. In contrast to this group is Cluster 5_22, which appears to be weak and to face significant operational sustainability issues, probably due to poor cost management and limited development potential.
The negative net profit indicates a clear profitability problem and, although its total liabilities are relatively modest, its net equity is very low, which limits its capacity to face further losses or access new financing. Cluster 4_22 also presents significant challenges: it has the highest loss in our population of farms and a negative EBIT that indicates serious operational inefficiencies. The negative EBITDA reflects a lack of ability to generate profits even before considering depreciation and financial charges, indicating structural problems in the business model; additionally, despite the group possessing an important amount of total assets, the level of liabilities suggests a strong dependence on debt. The farms belonging to Clusters 3 and 6 in year 2022 are positively distinguished by their ability to optimise resources and generate significant operating profits.
Considering Table 1 and Table 3, Cluster 2_22 proves to be the best among all, not only due to the selected indicators but also based on the economic and financial items, thanks to its ability to generate the highest profit for the fiscal year and maintain a solid net equity value. These are signals of efficient management and a strong capacity for accumulating resources, both essential for supporting future growth and withstanding potential economic challenges. This performance reflects solid management and a robust financial structure, which provide a competitive advantage over other clusters. The Cluster 6_22 represents a model of excellence in profitability, with strict cost management and operational efficiency that allow for high margins even with low production volumes. This configuration may be typical of companies with a strong competitive advantage or a high value-added business model, where quality and specialization prevail over production scale. Clusters 4_22 and 5_22 stand out negatively compared to the other groups, showing clear signs of critical issues in terms of profitability, as well as operational and financial management: while the first suffers from inefficient financial management, with significant losses that erode equity, making it the worst in terms of return on equity, the second faces widespread issues across multiple areas, such as negative profitability, operational inefficiency and financial weakness, justifying its classification as the worst overall.
Overall, among the farms in the subpopulation, from 2019 and 2022 the average value of all items increased, both for revenues and costs, for assets, liabilities and shares; the net profit on average also increased over the period.
3.3. The dynamics of Clusters
Comparing the groups between the two years, Table 4 presents the changes in the distribution of units according to the profiles of the clusters.
As can be observed, taking the final year 2022 as the reference point (100% of units in each cluster), most of the changes in the membership of the units involved groups with a positive profile, signalling an improvement in the type of performance of the farms. For example, the 59% of farms belonging to the cluster with a moderate performance in 2022 (Cluster 1_22) were included in the worst overall group in the year 2019 (Cluster 6_19). The units in the best overall cluster in 2022 (Cluster 2_22) were in the moderate (35% of farms), good (35% of farms) and, even more interestingly, worst overall performance clusters in 2019 (24% of farms). On the other hand, some of the farms with the worst return on equity or the worst overall performance in 2022 (Clusters 4 and 5) had a better profile in the earlier year; it must be said that these farms are quite few in number (less than 10% of the population).
The observations described so far suggest to summarise the comparison between the partitions for the two chosen years. The Rand index was calculated accordingly: it gave a value of 0.66, indicating a similarity of about two-thirds of the maximum possible similarity, which demonstrates a certain resilience in the profile of companies between the years before and after the epidemic/pandemic shocks.
4. Discussion
In a global context where Italian poultry farms showed robustness and resilience in 2022, with a recovery in production values, assets, costs, liabilities and net profits, the segmentation analysis reveals that this situation was not widespread, highlighting profiles that performed better or worse than others.
The results of the analyses show that epidemics and pandemics have had different effects on the profitability and financial performance of the analysed poultry farms, although the whole sector has recovered from the initial negative impact.
In summary, the segmentation results show that, besides the different sizes of groups with similar performance in the two years, the profile of farms with the best overall profitability in 2022 is characterised by an increase in average profit and net equity compared to the similar profile in the pre-outbreak year. The same is true for the group of farms categorised as having the best return on sales profile. In contrast, the two groups with the worst performance in 2022, both overall and in terms of return on equity, experienced a significant decline in profits and equity compared to the average profile of their counterparts in 2019.
For farms with good performance, these results confirm the studies that stated the pandemic did not significantly affect the sector's financial performance [34, 35]. On the other hand, for lower-performing farms, the results are consistent with literature emphasising the importance of farm characteristics in facing the pandemic's impacts [33] and reporting a worsening situation for farms during and after the pandemic [36].
By considering the different profiles of clusters of farms, ranging from those that have suffered most to the most robust farms that recover from shocks and perform best, policymakers and farm organisations can draw inspiration for specific measures and strategies adapted to farmers' specific needs. This will help to reduce the negative effects of exogenous shocks on weaker enterprises and accelerate the transition and recovery of more resilient enterprises.
During a period of pandemic and exceptional crisis, intervention policies could provide relief to poultry farms in the form of financial aid to mitigate temporary negative financial effects. Other measures could include centralised storage of production inputs, such as feed, to counteract market fluctuations, maintain production and sales levels, and satisfy customers. For farms that continue to suffer negative impacts in the post-pandemic period, public policies should be stronger and more appropriate by linking public support to losses and lasting impacts on individual poultry farms, where applicable. To this end, the financial performance of individual poultry farms should be assessed to determine their eligibility for public funding and support measures.
In addition, the role and effectiveness of broiler production contracts should be considered. These contracts provide for some costs to be borne by the owner of the birds, thus reducing the effect of changes in input prices and market turbulence. However, production management can still pose significant financial risks to contract growers, despite the stability of the compensation rate. Therefore, better management of inputs is necessary.
5. Conclusions
All of the analysed profitability ratios regained and exceeded pre-outbreak levels, demonstrating the effectiveness of the strategies implemented by Italian poultry farms to boost their long-term profitability.
The segmentation analysis reveals groups of farms with different profitability profiles, ranging from the best to the worst, based on specific or general profitability ratios.
Another interesting result of the study is that, while in 2019 the size of the groups with negative or positive performance was balanced, in 2022 the clusters with positive performance – categorised as moderate, good or best – predominated within the Italian farming population.
The study has sought to highlight the intra-sectoral differences in the effects of epidemics and pandemics on the financial performance of different groups of poultry farms, differences which fail to emerge when analyses are performed at an aggregate level.
The study has some limitations. Firstly, the analysis only included the largest farms operating in the Italian poultry sector that adopted comparable balance sheet and income statement models. Another limitation is that the analysis does not enable us to verify whether farm profitability is a feature of the sector and farm management, or to what extent public support provided during the observed years had a positive impact.
Author Contributions
Conceptualization, MB.F. and V.G.; methodology, MB.F.; software, P.D.; validation, MB.F. and V.G. and P.D.; formal analysis, MB.F. and P.D.; investigation, MB.F.; resources, MB.F. and V.G.; data curation, MB.F. and P.D.; writing—original draft preparation, MB.F , V.G. and P.D.; writing—review and editing, MB.F. and V.G. All authors have read and agreed to the published version of the manuscript.
Funding
This research received no external funding.
Institutional Review Board Statement
Not applicable
Informed Consent Statement
Not applicable
Data Availability Statement
Dataset available on request from the authors
Acknowledgments
The authors have reviewed and edited the output and take full responsibility for the content of this publication.
Conflicts of Interest
The authors declare no conflicts of interest.
Abbreviations
The following abbreviations are used in this manuscript:
| AIDA | Analisi Informatizzata delle Aziende Italiane (Computerized Analysis of Italian Companies) |
| NACE | Nomenclature statistique des activités économiques dans la Communauté européenne (Statistical classification of economic activities in the European Community) |
| ROI | Return on total capital |
| ROS | Return on sales |
| ROE | Return on equity |
| CTO | Capital Turnover |
| EBIT | Earnings before interest and taxes |
| EBITDA | Earnings before interest, taxes, depreciation and amortisation |
References
- Hafez, H.M.; Attia, Y.A.; Bovera, F.; Abd El-Hack, M.E.; Khafaga, A.F.; de Oliveira, M.C. Influence of COVID-19 on the poultry production and environment. Environmental Science and Pollution Research 2021, 28, 44833–44844. [Google Scholar] [CrossRef]
- OECD/FAO. Agricultural Outlook 2024-2033. OECD Publishing. 2024. Rome, June, 2024.
- European Commission. EU Market Situation for Poultry. 2024 Expert Group for Agricultural Markets: Bruxelles, 2024.
- Fornasiero, D.; Fusaro, A.; Zecchin, B.; Mazzucato, M.; Scolamacchia, F.; Manca, G. ;...; Mulatti, P. Integration of Epidemiological and Genomic Data to Investigate H5N1 HPAI Outbreaks in Northern Italy in 2021–2022. Pathogens 2023, 12, 100. [Google Scholar] [CrossRef]
- ISMEA. Avicoli e uova; Istituto di Servizi per il Mercato Agricolo Alimentare: Rome, Italy, 2022. [Google Scholar]
- Rai, S.S.; Rai, S.; Singh, N.K. Organizational resilience and social-economic sustainability: COVID-19 perspective. Environment, Development and Sustainability 2021, 23, 12006–12023. [Google Scholar] [CrossRef]
- Ruggerio, C. A. Sustainability and sustainable development: A review of principles and definitions. Science of the Total Environment 2021, 786. [Google Scholar] [CrossRef]
- Coppola, A.; Amato, M.; Vistocco, D.; Verneau, F. Measuring the economic sustainability of Italian farms using FADN data. Agricultural Economics 2022, 68. [Google Scholar] [CrossRef]
- Spicka, J.; Hlavsa, T.; Soukupova, K.; Stolbova, M. Approaches to estimation the farm-level economic viability and sustainability in agriculture: A literature review. Agricultural Economics 2019, 65. [Google Scholar] [CrossRef]
- Hafez, H.M.; Attia, J. Challenges to the poultry industry: current perspectives and strategic future after the COVID-19 outbreak. Frontiers in Veterinary Science, 2020; 7, 516. [Google Scholar]
- Yazdekhasti, A., J.; Wang, L.; Zhang,; Ma, J. A. Multi-period multi-modal stochastic supply chain model under COVID pandemic: A poultry industry case study in Mississippi. Transportation Research Part E: Logistics and Transportation Review, 2021. Vol. 154:102463.
- Nkgadima, K.; Muchopa, C.L. Do Import Tariff Adjustments Bolster Domestic Production? Analysis of the South African-Brazilian Poultry Market Case. Economies, 2022, 10, 318. [Google Scholar] [CrossRef]
- Amin, M.R.; Alam, G.M.; Parvin, M.T.; Acharjee, D.C. Impact of COVID-19 on poultry market in Bangladesh. Heliyon 2023, 9. [Google Scholar] [CrossRef] [PubMed]
- Tonetto, J.L.; Pique, J.M.; Fochezatto, A.; Rapetti, C. Survival Analysis of Small Business during COVID-19 Pandemic, a Brazilian Case Study. Economies 2024, 12, 184. [Google Scholar] [CrossRef]
- Maples, J. , Thompson, J.; Anderson, J.; Anderson, D.P.; Gundersen, C. Estimating COVID-19. Impacts on the Broiler Industry. Applied Economic Perspectives and Policy 2020, 43. [Google Scholar]
- Prabha, S.; Siotra, V. Pandemic and poultry: A study of poultry farming in Kathua block of union territory of J&K during covid 19 period. Sustainability, Agri, Food and Environmental Research 2024, 12. [Google Scholar]
- Gashaw, M. A review on avian influenza and its economic and public health impact. International Journal of Veterinary Science & Technology 2020, 4, 15–27. [Google Scholar]
- Kumar, S. Planning for avian flu disruptions on global operations: a DMAIC case study. International Journal of Health Care Quality Assurance 2012, 25(3), 197–215. [Google Scholar] [CrossRef]
- Zamani, O.; Bittmann, T.; Ortega, D.L. The effect of avian influenza outbreaks on retail price premiums in the United States poultry market. Poultry Science 2024, 103(10), 104102. [Google Scholar] [CrossRef] [PubMed]
- Aifuwa, H.O.; Saidu, M.; Aifuwa, S.A. Coronavirus pandemic outbreak and firms’ performance in Nigeria. Management and Human Resources Research 2020. [Google Scholar]
- Athira, A.; Ramesh, V. K.; Sinu, M. COVID-19 pandemic and firm performance: An empirical investigation using a cross-country sample. IIMB Management Review 2024, 36(3), 269–281. [Google Scholar] [CrossRef]
- Khatib, S.F.; Nour, A. The impact of corporate governance on firm performance during the COVID-19 pandemic: Evidence from Malaysia. Journal of Asian Finance, Economics and Business 2021, 8, 0943–0952. [Google Scholar]
- Kolluri, G.; Tyagi, J.S.; Sasidhar, P.V.K. Research Note: Indian poultry industry vis-à-vis coronavirus disease 2019: a situation analysis report. Poultry Science 2021, 100(3), 100828. [Google Scholar] [CrossRef]
- Zielińska-Chmielewska, A.; Kazmierczyk, J.; Jazwinski, I. Quantitative Research on Profitability Measures in the Polish Meat and Poultry Industries. Agronomy 2022, 12, 92. [Google Scholar] [CrossRef]
- Mroczek, R.P. The Meat Market in Poland in the Era of the SARS-Cov-2 Coronavirus. Meat Market Review 2018, 55, 49–51. [Google Scholar]
- Baráth, L.; Ferto, I. Productivity and Convergence in European Agriculture. Journal of Agricultural Economics 2016, 2016. 268, 228–248. [Google Scholar] [CrossRef]
- Šrédl, K.; Prášilová, M.; Severová, L.; Svoboda, R.; Štebeták, M. Social and Economic Aspects of Sustainable Development of Livestock Production and Meat Consumption in the Czech Republic. Agriculture 2021, 11, 102. [Google Scholar] [CrossRef]
- Martin, L. Navigating Production Contract Arrangements. Michigan State University, Department of Agricultural Economics: Michigan, 1999.
- Dan, S.D.; Platon, S.; Mihaiu, M.; Jecan, C.; Cordea, D.; Cordis, I.V.; Lapusan, A. Microbial Risk Assessment in the Main Steps of Poultry Slaughter. Bullettin. UASVM 2013, 70, 214–222. [Google Scholar]
- Kelly, L.A.; Gettinby, H.E.; Fazil, G.A.; Snary, E.; Wooldridge, M. Microbiological safety of poultry meat: Risk assessment as a way forward. World’s Poultry Science Journal 2003, 59, 495–508. [Google Scholar] [CrossRef]
- Zielińska-Chmielewska, A. Financial efficiency vs. environmental efficiency on the example of the meat and poultry industry in Poland. Economics and Environment 2023, 2. [Google Scholar] [CrossRef]
- Attia, Y.A.; Rahman, M.T.; Hossain, M.J.; Basiouni, S.; Khafaga, A.F.; Shehata, A.A.; Hafez, H.M. Poultry production and sustainability in developing countries under the COVID-19 crisis: Lessons learned. Animals 2022, 12(5), 644. [Google Scholar] [CrossRef]
- Gaisani, M P.; Fahmi, I.; Sasongko, H. The effect of covid-19 on the financial performance of Indonesia’s livestock industry. Jurnal Manajemen & Agribisnis 2021, 18, 229.
- Rusdiana, S.; Kostaman, T.; Priyono, P.; Kusumaningrum, D.A.; Praharani, L.; Widiawati, Y.; Iji, P.A. Impact of the COVID-19 pandemic and development strategies on broiler farming in Indonesia: a review. Advances in Animal and Veterinary Sciences 2024, 12(9), 1646–1653. [Google Scholar] [CrossRef]
- Suganda, A.; Fahmid, I. M.; Baba, S.; Salman, D. Fluctuations and disparity in broiler and carcass price before during and after covid-19 pandemic in Indonesia. Heliyon, 2024; 10. [Google Scholar]
- Belarmino, L.C.; Pabsdorf, M.N.; Padula, A.D. Impacts of the COVID-19 pandemic on the production costs and competitiveness of the Brazilian chicken meat chain. Economies 2023, 11(9), 238. [Google Scholar] [CrossRef]
Figure 1.
The dynamics of financial ratios in the Italian poultry sector. Years 2019-2022.
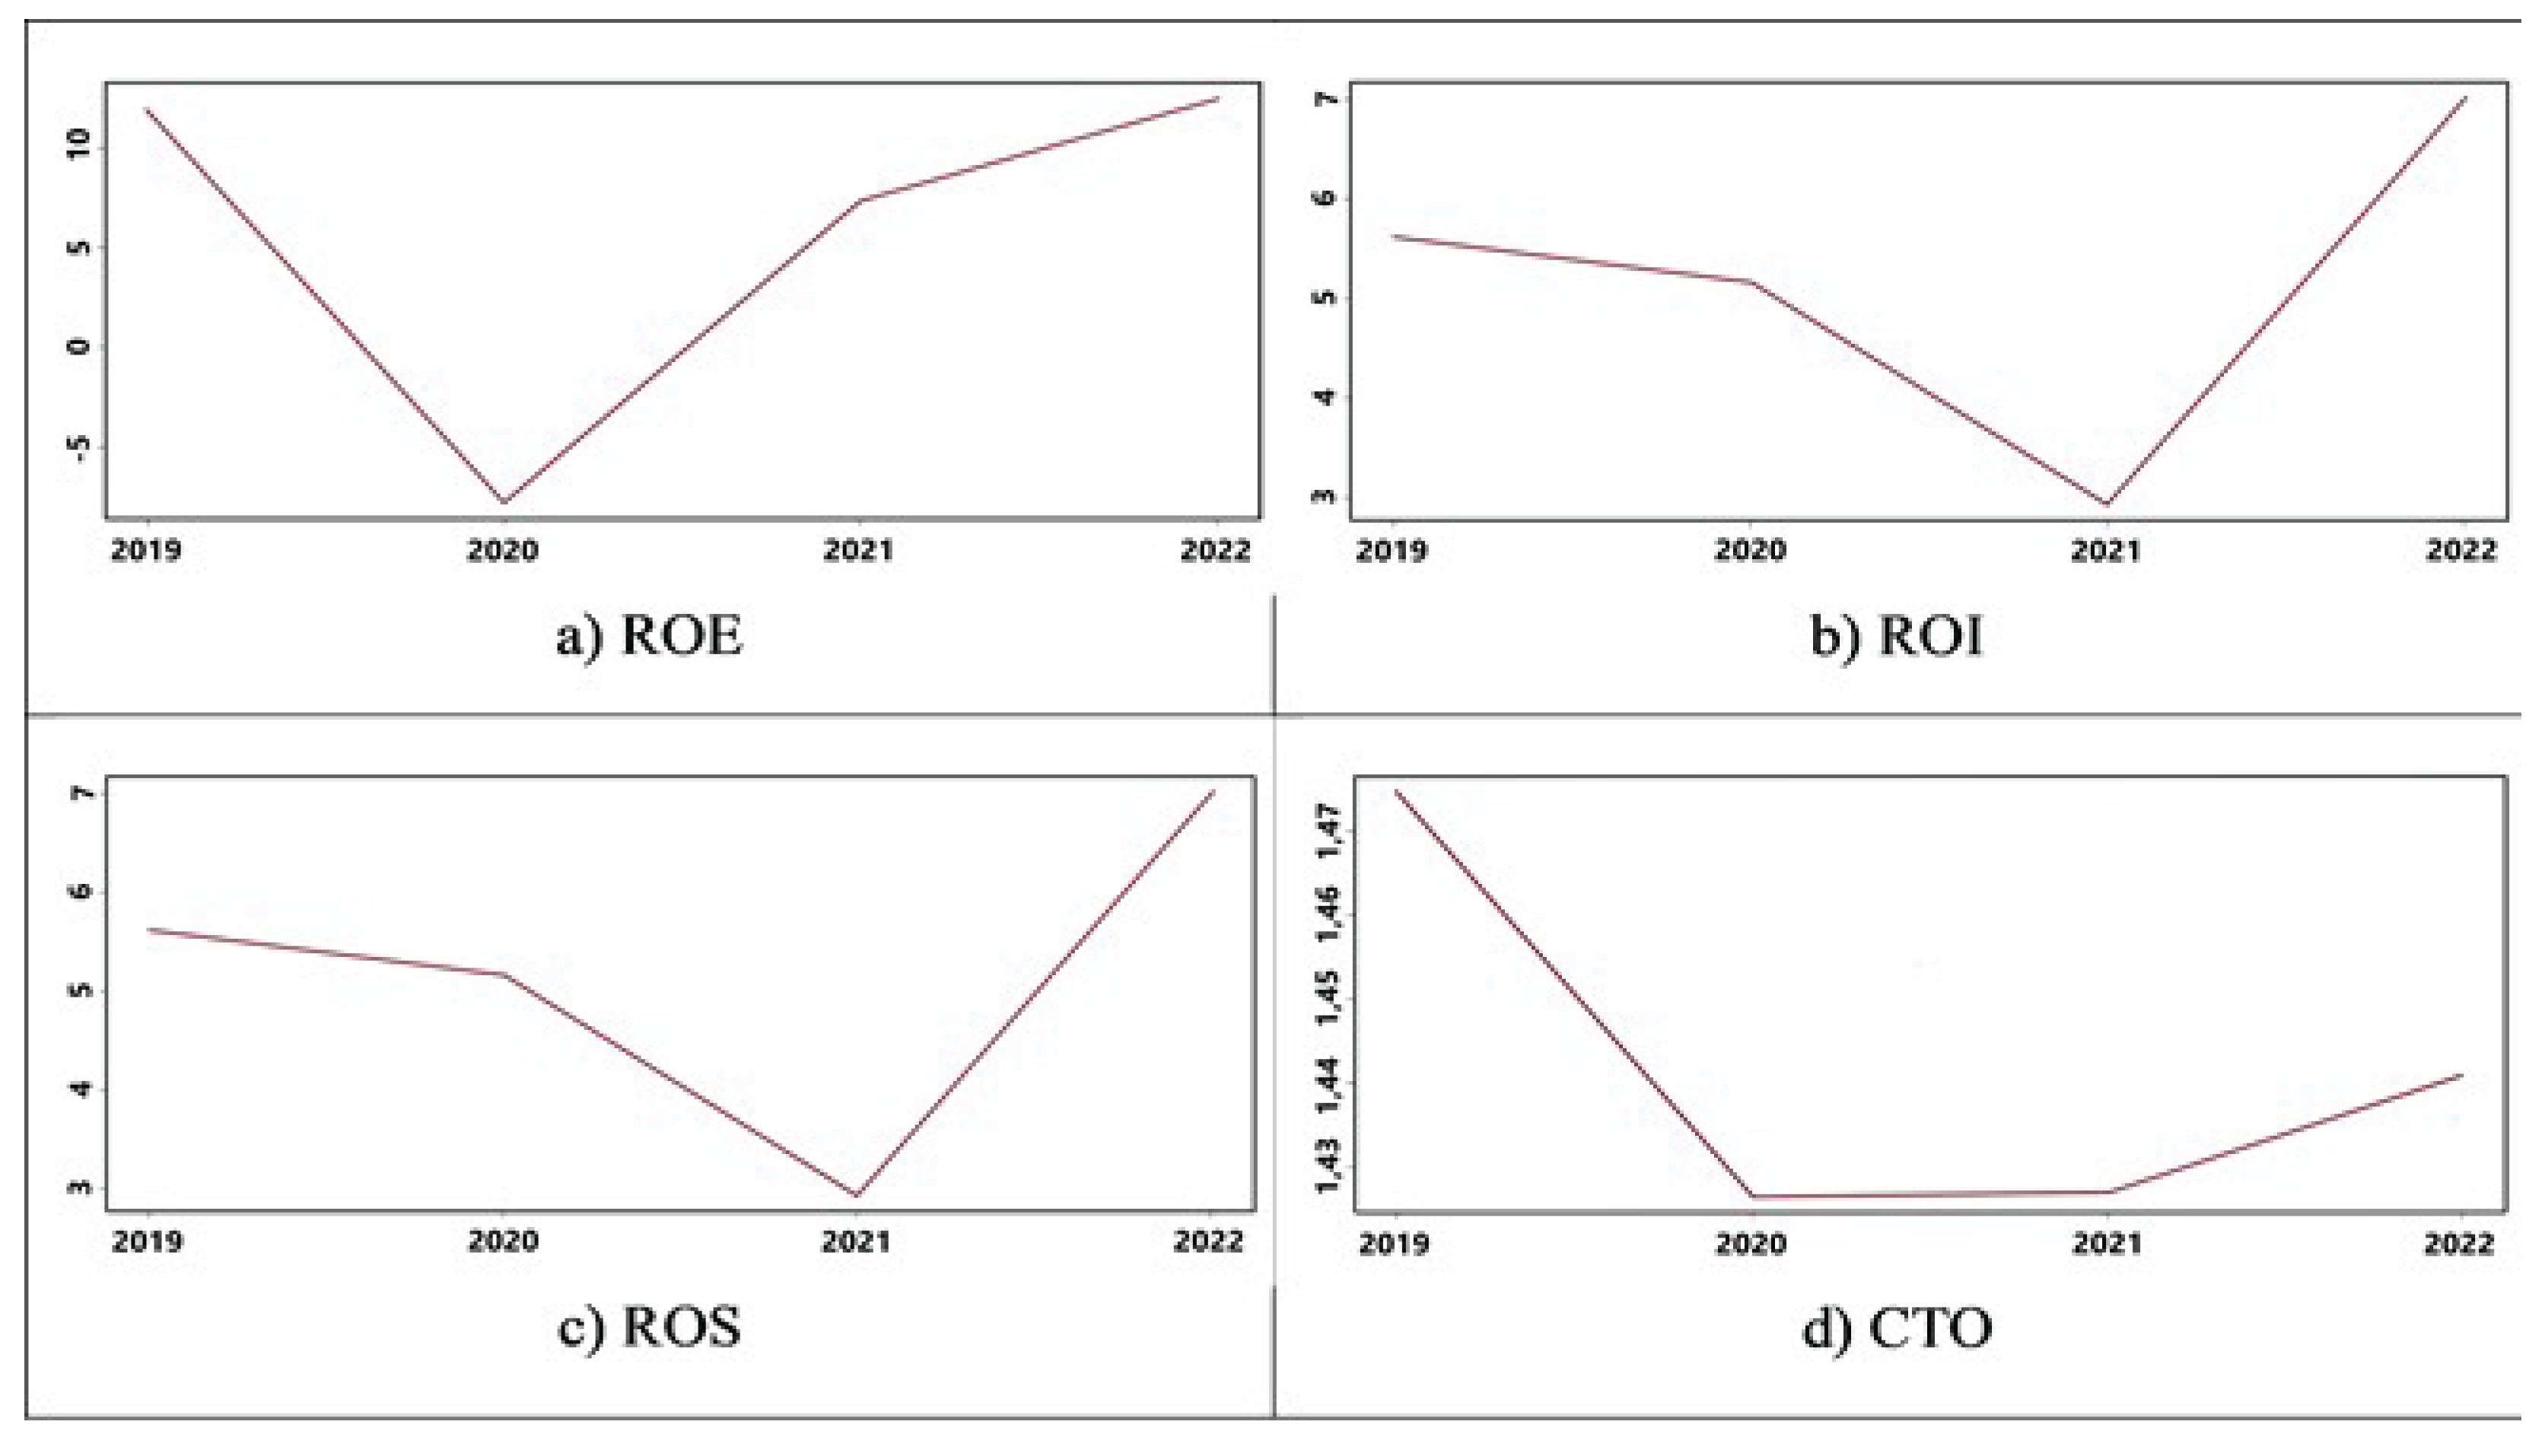

Table 1.
Average values of ratios within clusters.
| Clusters | 2019 | ||||||
| % of farms | ROE | ROI | ROS | CTO | |||
| The best overall (Cluster 4) | 8.9 | 53.1 | 11.6 | 16.4 | 1.9 | ||
| The good performances (Cluster 2) | 12.7 | 30.0 | 11.0 | 4.8 | 2.2 | ||
| The moderate performances (Cluster 1) | 26.6 | 10.9 | 8.5 | 6.0 | 1.8 | ||
| The best return on sales (Cluster 5) | 10.1 | 10.7 | 10.4 | 27.1 | 0.5 | ||
| The worst return on equity (Cluster 6) | 1.3 | -85.3 | 25.3 | 16.5 | 1.5 | ||
| The worst overall (Cluster 3) | 40.5 | 1.2 | -1.1 | -2.8 | 0.4 | ||
| Clusters | 2022 | ||||||
| % of farms | ROE | ROI | ROS | CTO | |||
| The best overall (Cluster 2) | 21.5 | 36.5 | 20.0 | 9.7 | 2.2 | ||
| The good performances (Cluster 3) | 19.0 | 14.3 | 10.0 | 10.1 | 1.3 | ||
| The moderate performances (Cluster 1) | 43.0 | 4.1 | 1.9 | 1.8 | 1.4 | ||
| The best return on sales (Cluster 6) | 6.3 | 14.6 | 12.6 | 40.1 | 0.3 | ||
| The worst return on equity (Cluster 4) | 6.3 | -20.0 | 0.5 | 4.2 | 0.9 | ||
| The worst overall (Cluster 5) | 3.8 | 12.4 | -22.4 | -29.5 | 0.8 | ||
Table 2.
Average values of financial statements items by cluster in 2019.
| Items | 2019 | ||||||
| The best overall (Cluster 4) |
The good performances (Cluster 2) |
The moderate performances (Cluster 1) | The best return on sales (Cluster 5) |
The worst return on equity (Cluster 6) |
The worst overall (Cluster 3) | Global mean | |
| Value of production | 8,075,815 | 28,454,134 | 76,612,217 | 8,262,199 | 2,944,930 | 15,383,233 | 31,787,780 |
| Sales revenue | 7,600,615 | 27,358,253 | 74,037,276 | 6,849,933 | 2,415,757 | 15,096,155 | 30,656,479 |
| Costs of raw, subsidiary and consumables | 4,458,052 | 20,432,719 | 65,854,589 | 2,117,662 | 1,596,552 | 12,718,129 | 25,873,391 |
| Costs of services | 1,483,540 | 5,234,373 | 4,306,842 | 1,319,119 | 296,456 | 1,297,430 | 2,601,763 |
| Costs of third-party assets | 451,017 | 164,628 | 367,127 | 459,471 | 51,138 | 142,034 | 263,102 |
| Total labour cost | 425,719 | 398,581 | 2,418,750 | 1,103,260 | 575,344 | 820,672 | 1,182,564 |
| Amortisation and depreciation costs | 400,371 | 381,453 | 1,326,486 | 1,382,378 | 27,122 | 325,915 | 708,718 |
| Total costs of production | 7,264,999 | 26,621,002 | 74,538,986 | 6,940,548 | 3,276,507 | 15,261,874 | 30,753,982 |
| Net profit | 773,449 | 1,288,671 | 1,478,676 | 951,803 | -336,010 | 36,933 | 731,814 |
| Total assets | 7,437,095 | 10,807,804 | 26,302,085 | 23,964,118 | 1,572,129 | 10,430,719 | 15,690,501 |
| Total liabilities | 6,039,790 | 6,608,686 | 16,116,714 | 15,316,206 | 1,178,253 | 6,492,744 | 9,851,799 |
| Net equity | 1,397,305 | 4,199,118 | 10,185,371 | 8,647,912 | 393,876 | 3,937,975 | 5,838,702 |
| EBIT | 857,116 | 1,842,382 | 2,338,375 | 1,880,314 | 398,318 | 79,029 | 1,158,219 |
| EBITDA | 1,257,487 | 2,223,835 | 3,664,893 | 3,262,693 | 425,440 | 404,961 | 1,866,952 |
Table 3.
Average values of financial statements items by cluster in 2022.
| Items | 2022 | ||||||
| The best overall (Cluster 2) |
The good performances (Cluster 3) |
The moderate performances (Cluster 1) | The best return on sales (Cluster 6) |
The worst return on equity (Cluster 4) |
The worst overall (Cluster 5) | Global mean | |
| Value of production | 51,456,548 | 14,493,712 | 64,119,005 | 5,553,495 | 30,764,299 | 6,489,802 | 43,965,462 |
| Sales revenue | 48,063,833 | 13,436,815 | 60,481,931 | 4,408,266 | 27,989,011 | 6,307,828 | 41,214,341 |
| Costs of raw, subsidiary and consumables | 38,858,270 | 10,761,381 | 57,140,386 | 1,156,744 | 25,261,013 | 3,873,979 | 36,816,394 |
| Costs of services | 6,202,405 | 1,288,922 | 2,589,809 | 1,091,284 | 4,171,982 | 1,307,116 | 3,076,745 |
| Costs of third-party assets | 137,284 | 325,837 | 257,839 | 79,914 | 843,357 | 302,269 | 272,102 |
| Total labour cost | 1,395,587 | 729,857 | 1,631,898 | 722,713 | 703,468 | 1,030,824 | 1,270,642 |
| Amortisation and depreciation costs | 398,208 | 538,484 | 1,519,962 | 692,849 | 936,339 | 1,313,350 | 995,082 |
| Total costs of production | 47,190,032 | 13,687,512 | 63,224,485 | 4,029,726 | 32,067,056 | 6,478,460 | 42,494,873 |
| Net profit | 3,152,862 | 576,463 | 170,634 | 1,255,852 | -1,124,798 | -43,483 | 1,024,485 |
| Total assets | 21,642,153 | 10,954,788 | 32,295,539 | 17,585,196 | 22,637,814 | 6,114,352 | 23,414,492 |
| Total liabilities | 12,023,749 | 7,228,837 | 22,894,598 | 8,115,831 | 14,683,879 | 4,229,616 | 15,416,963 |
| Net equity | 9,618,404 | 3,725,951 | 9,400,941 | 9,469,365 | 7,953,935 | 1,884,736 | 7,997,529 |
| EBIT | 4,464,776 | 849,231 | 979,068 | 1,812,991 | -1,151,215 | -1,337,736 | 1,534,470 |
| EBITDA | 4,862,993 | 1,387,715 | 2,499,058 | 2,505,840 | -214,976 | -24,386 | 2,529,566 |
Table 4.
Cross-tabulation of group size by cluster performance: 2022 versus 2019.
| 2019 | |||||||||
| The best overall (Cluster 4_19) | The good performances (Cluster 2_19) | The moderate performances (Cluster 1_19) | The best return on sales (Cluster 5_19) | The worst return on equity (Cluster 6_19) |
The worst overall (Cluster 3_19) | Total | |||
| 2022 | The best overall (Cluster 2_22) | 5.9 | 35.3 | 35.3 | 23.5 | 100.0 | |||
| The good performances (Cluster 3_22) | 33.3 | 26.7 | 6.7 | 6.7 | 26.7 | 100.0 | |||
| The moderate performances (Cluster 1_22) | 2.9 | 8.8 | 23.5 | 5.5 | 58.8 | 100.0 | |||
| The best return on sales (Cluster 6_22) | 60.0 | 40.0 | 100.0 | ||||||
| The worst return on equity (Cluster 4_22) | 20.0 | 40.0 | 20.0 | 20.0 | 100.0 | ||||
| The worst overall (Cluster 5_22) | 33.3 | 33.3 | 33.3 | 100.0 | |||||
Disclaimer/Publisher’s Note: The statements, opinions and data contained in all publications are solely those of the individual author(s) and contributor(s) and not of MDPI and/or the editor(s). MDPI and/or the editor(s) disclaim responsibility for any injury to people or property resulting from any ideas, methods, instructions or products referred to in the content. |
© 2025 by the authors. Licensee MDPI, Basel, Switzerland. This article is an open access article distributed under the terms and conditions of the Creative Commons Attribution (CC BY) license (http://creativecommons.org/licenses/by/4.0/).
Copyright: This open access article is published under a Creative Commons CC BY 4.0 license, which permit the free download, distribution, and reuse, provided that the author and preprint are cited in any reuse.


