Preprint
Article

This version is not peer-reviewed.

Transfer Learning with Transformer-Based Models and Explainable AI for Autism Detection Using Brain MRI

Submitted:

30 August 2025

Posted:

01 September 2025

You are already at the latest version

Abstract

Background/Objectives: Autism Spectrum Disorder (ASD) is a complex neurodevelopmental condition that remains challenging to diagnose using traditional clinical methods. Recent advances in artificial intelligence, particularly transformer-based deep learning models, have shown considerable potential for improving diagnostic accuracy in neuroimaging applications. This study aims to develop and evaluate a transformer-based framework for automated ASD detection using structural and functional brain MRI data. Methods: We developed a deep learning framework using neuroimaging data comprising structural MRI (sMRI) and functional MRI (fMRI) from the ABIDE repository. Each modality was analyzed independently through transfer learning with transformer-based pretrained architectures, including Vision Transformer (ViT), MaxViT, and Transformer-in-Transformer (TNT), fine-tuned for binary classification between ASD and typically developing controls. Data augmentation techniques were applied to address the limited sample size. Model interpretability was achieved using SHAP to identify the influential brain regions that contribute to classification decisions. Results: Our approach significantly outperformed traditional CNN-based methods and state-of-the-art baseline approaches across all evaluation metrics. The MaxViT model achieved the highest performance on sMRI (98.51% accuracy and F1-score), while both TNT and MaxViT reached 98.42% accuracy and F1-score on fMRI. SHAP analysis provided clinically relevant insights into brain regions most associated with ASD classification. Conclusions: These results demonstrate that transformer-based models, coupled with explainable AI, can deliver accurate and interpretable ASD detection from neuroimaging data. These findings highlight the potential of explainable DL frameworks to assist clinicians in diagnosing ASD and provide valuable insights into associated brain abnormalities.

Keywords: 
;  ;  ;  ;  ;  ;  

1. Introduction

Autism Spectrum Disorder (ASD) is a complex neurodevelopmental condition characterized by impairments in social communication, restricted interests, repetitive behaviors, and, in some cases, sensory processing difficulties [1]. ASD common symptoms include cognitive impairment, aggressive actions, and difficulty in performing everyday activities [1]. Symptoms typically emerge in early childhood, persist into adulthood, and vary widely in type and severity, reflecting the “spectrum” nature of the disorder. According to the World Health Organization (WHO), one in 100 children has ASD [2]. Early and accurate diagnosis is critical, as timely interventions can improve developmental outcomes, enhance quality of life, and reduce the emotional and physical burdens on families [3].
ASD is often accompanied by comorbid conditions such as epilepsy, depression, anxiety, and attention deficit hyperactivity disorder (ADHD) [4]. Intellectual ability among individuals with ASD ranges from severe impairment to exceptional cognitive performance [5]. Current research suggests that ASD develops from a combination of genetic factors, differences in brain development, and environmental influences during pregnancy, birth, and early childhood [5]. Scientists continue to study these factors to better understand how ASD occurs and how to support individuals with this condition [6]. While no cure exists, a range of interventions including behavioral management, cognitive behavioral therapy, pharmacological treatment, speech-language therapy, and social skills training, can alleviate symptoms and support functional independence [7]. These interventions are most effective when tailored to individual needs and implemented within structured and specialized programs.
Several artificial intelligence (AI)-based methods have successfully utilized different modalities, such as eye-tracking [8,9,10], facial recognition [11,12,13], and electroencephalography (EEG) [14,15,16], or combinations of them [17,18]. Although these modalities have been valuable and supportive tools in ASD detection, some challenges still limit their applicability [19]. These modalities are often prone to late or misdiagnosis, especially in early-stage autism or in people with mild symptoms. External stimuli also affect the individuals’ reactions, leading to inaccurate and unreliable results. Moreover, some individuals may exhibit behaviors similar to those of healthy individuals, making it more challenging to diagnose them accurately [6].
Given these challenges, functional magnetic resonance imaging (fMRI) and structural magnetic resonance imaging (sMRI) have emerged as promising alternatives for achieving more accurate and reliable diagnoses [20,21,22,23]. sMRI provides high-resolution anatomical images of the brain, enabling measurement of cortical thickness, surface area, and white/gray matter distribution—features often altered in individuals with ASD. fMRI, particularly resting-state fMRI, captures dynamic brain activity by measuring blood-oxygen-level-dependent (BOLD) signals, allowing assessment of functional connectivity patterns that may reveal hypo- or hyper-connectivity in specific brain regions. These complementary modalities offer both structural and functional perspectives, making them valuable for early ASD detection [20,21,22,23]. Therefore, they were selected as the primary modalities for this study.
To better understand their relevance, it is important to highlight the core features that can be extracted from sMRI and fMRI [5]. These features are the basis for AI-based classification in ASD detection. By characterizing connectivity, cortical morphology, volumetric differences, and tissue integrity, neuroimaging offers quantitative biomarkers that differentiate individuals with ASD from Typically Developing Controls (TC) populations. Table 1 and Table 2 summarize the most prominent features derived from fMRI and sMRI, respectively, their definitions, associations with ASD, and implicated brain regions.
Effective analysis of the complex, high-dimensional features generated by sMRI and fMRI requires advanced computational methods. Machine learning (ML) and deep learning (DL) have shown great promise in this domain, enabling automated feature extraction and the identification of subtle patterns that might be missed in traditional diagnostic workflow. Recent advancements in ML/DL models have revolutionized healthcare by enabling early detection and prediction of various human diseases [28,29,30], including ASD [20,22,31]. ML and DL methods can learn from high-dimensional neuroimaging data, extract unique features, and identify hidden patterns and abnormalities that may be misrecognized through traditional diagnostic procedures. Despite overlapping symptoms with other mental disorders, DL methods, particularly convolutional neural networks (CNNs) and transformer-based architectures, have demonstrated strong potential for improving ASD diagnostic accuracy [32,33]. These methods facilitate earlier detection and enable timely intervention.
While ML and DL methods prove their efficiency in detecting autism, these models operate as black boxes, which is a major challenge, especially for medical professionals who require interpretable results to understand how and why these ML/DL models make diagnosis decisions and relate them to discover biomarkers and abnormalities. Therefore, applying explainable artificial intelligence (XAI) addresses this need by providing insights into the model’s decision-making process, helping clinicians link computational findings to neurobiological evidence [34].
The primary objective of this study is to develop a comprehensive, end-to-end AI pipeline for accurate and interpretable ASD detection using sMRI and fMRI data. This pipeline leverages the advanced DL techniques integrated with transfer learning and XAI to maximize diagnostic performance. Therefore, the key contributions are:
  • End-to-End AI Pipeline: Proposing a unified framework that integrates preprocessing, data augmentation, feature extraction, classification, and explainability into a single streamlined workflow for ASD detection.
  • Comparative Modality Evaluation: Conducting a systemic comparison of sMRI and fMRI modalities, demonstrating that fMRI alone yields superior diagnostic performance compared to sMRI.
  • Leveraging Transformer-based Models: Exploring the performance of advanced transformer-based pretrained architectures to capture both complex spatial patterns and long-range dependencies in neuroimaging data.
  • Model Interpretability: Implementing SHAP-based explainable AI techniques to provide transparent, clinically relevant interpretability insights into model predictions, and ensuring clinical trust.
The remainder of this paper is organized as follows: Section 2 reviews the related literature. Section 3 describes the dataset and materials used in this study. Section 4 presents the proposed methodology and framework in detail. Section 5 outlines the experimental setup, including configurations and implementation details. Section 6 reports the prediction results and insights obtained from the explainable AI (XAI) analysis. Finally, Section 7 concludes the study and discusses potential directions for future research.

2. Related Work

2.1. Overview of AI Paradigms

Recent advances in artificial intelligence (AI) have enabled automated analysis of neuroimaging data for autism spectrum disorder (ASD) detection. Existing studies can be broadly categorized according to the AI paradigm applied: machine learning (ML) with handcrafted features, deep learning (DL) with automated feature extraction, and transfer learning (TL) leveraging pre-trained models. Figure 1 illustrates these three paradigms, outlining their general workflows in ASD neuroimaging.
ML-based approaches (Figure 4A) typically involve manual feature extraction from sMRI or fMRI, followed by training conventional classifiers such as support vector machines (SVMs), Random Forests, or artificial neural network (ANNs). While handcrafted features can capture domain-relevant biomarkers, they are often dataset-specific and may not generalize well across imaging sites. For instance, Ali et al. [35] used FreeSurfer-derived morphological features with Recursive Feature Elimination (REF) feature selection and Random Forest classifier, achieving high accuracy on ABIDE I but noting limited scalability to multi-site datasets.
DL-based approaches (Figure 4B) integrate feature extraction and classification in a unified architecture, learning subtle patterns directly from raw images. This can improve performance but also increases the risk of overfitting in small or homogeneous datasets. For instance, CNN-based models [20,36] have achieved over 98% accuracy and F1-score on single-site NYU data but dropped to ~70% - ~78% on multi-site datasets. These studies applied data preprocessing such as Configurable Pipeline for the Analysis of Connectomes (CPAC) and converted the 4D fMRI to 2D images. More advanced architectures such as sparse autoencoders and convolutional autoencoders have also been explored. A notable example is ASD-SAENet [37], trained on ABIDE I (505 ASD, 530 TC) preprocessed with CPAC. Using the CC200 atlas and Pearson’s correlation coefficient to compute functional connectivity, ASD-SAENet employed a sparse autoencoder for dimensionality reduction followed by a DNN classifier, achieving 70.8% accuracy across sites and outperforming several baselines, though still limited by sample size and interpretability.
TL-based approaches (Figure 4C) adapt models pre-trained on large-scale datasets such as ImageNet for neuroimaging, reducing training data requirements and accelerating convergence. CNN-based TL and more recent transformer-based TL using models like ViT, ConvNeXt, and Swin [38] have been applied to sMRI and fMRI. Tang et al. [39], for example, designed a multimodal model integrating fMRI scans and ROI correlation matrices into high-dimensional vectors, which were concatenated and passed through a modified 3D ResNet-18 to capture spatial–temporal patterns, alongside an MLP classifier for ROI features. Despite its sophisticated architecture, the model achieved 74% accuracy, indicating that further optimization and data diversity are required. While TL can improve generalization, its use in ASD detection is still emerging, and optimal fine-tuning strategies for neuroimaging remain under investigation.
The following subsections review studies by modality: fMRI-based approaches, sMRI-based approaches, and multimodal MRI approaches.
Figure 1. Overview of AI-based approaches for ASD detection. (A) ML-based: manual feature extraction + traditional classifiers. (B) DL-based: automated feature extraction + end-to-end classification. (C) TL-based: fine-tuning pre-trained models.
Preprints 174576 g001

2.2. MRI-Based Approaches

After outlining the general AI paradigms applied in autism detection research, this section shifts to MRI-based approaches, which include the core of recent advancements in the field. MRI modalities, particularly fMRI and sMRI, have provided the most reliable and informative biomarkers for ASD detection, enabling both functional and structural characterization of the brain. Reviewing the literature on these modalities with integrated multimodal approaches indicates how different computational methods have been employed to identify distinct neurobiological patterns in ASD.

2.2.1. fMRI-Based Approaches

Several studies have utilized fMRI data from the Autism Brain Imaging Data Exchange (ABIDE) repository to identify ASD using a range of AI methods [20,36,40,41,42,43,44,45]. These approaches have reported accuracies typically between 70% and 90%, underscoring the feasibility of functional neuroimaging-based computational models for ASD diagnosis.
One line of research has focused on optimizing preprocessing pipelines. For example, a research study published in [24] compared four preprocessing widely used pipelines: Connectome Computation System (CCS), Configurable Pipeline for the Analysis of Connectomes (CPAC), Data Preprocessing Assistant for Resting-State fMRI (DPARSF), and the Neuroimaging Analysis Kit (NIAK) on rs-fMRI data. ​​Functional connectivity features were extracted from BOLD time series and classified with multilayer perceptrons (MLPs). The configuration with 128 and 64 hidden neurons achieved the highest accuracy 75.27% and recall 74%, whereas the 256–128 configuration yielded the highest precision 78.37%.
Subsequent work has explored d feature selection strategies. Eslami and coauthors [46] proposed a framework called ASD-DiagNet for detecting ASD using rs-fMRI data from ABIDE I, which includes 505 ASD and 530 TC that were collected from 17 different sites. The data was preprocessed using the CPAC pipeline, Features were extracted using the CC200 atlas and processed through an autoencoder for dimensionality reduction, followed by a single-layer perceptron (SLP) for classification. Pearson’s correlation coefficient (PCC) was used to capture inter-regional functional connectivity. Despite data augmentation via linear interpolation, the accuracy was 70.1%, with only a marginal improvement from augmentation. In another study [42] autoencoders were combined with SLP classifiers and F1-score–based feature selection. By tuning hyperparameters such as the feature threshold (k) and the loss balance term, this method achieved a classification accuracy of 70.9%, surpassing several baseline approaches [37,47].
Other approaches have explored multimodal and deep residual networks. Tang et al. [39] designed a multimodal ASD classification model combining fMRI scans with ROI connectivity matrices. Pairwise ROI correlation coefficients were reshaped into high-dimensional vectors and concatenated before passing through fully connected layers. To capture spatial–temporal relationships, a modified ResNet-18 replaced 2D convolutions with 3D convolutions, followed by max-pooling (1 × 3 × 3, stride = 1, 2, 2) and several convolutional blocks. Average pooling reduced the output to a 512-dimensional vector for final classification. ROI features were further processed using a three-layer MLP (100 nodes each). Despite this advanced architecture, the model achieved only 74% accuracy, indicating that further optimization or supplementary data may be necessary for enhanced performance. fMRI studies highlight valuable insights into ASD-related functional connectivity but remain constrained by site heterogeneity, motion artifacts, and modest accuracy relative to sMRI.

2.2.2. sMRI-Based Approaches

Structural MRI (sMRI) has also been widely explored for ASD classification using ML, DL, and TL techniques [48,49,50,51,52,53,54] These methods leverage morphological features that characterize brain structure differences between ASD and TC populations.
One promising work direction has focused on DL ensembles. For example, Mishra and Pati [49] proposed a novel ensemble deep convolutional neural network (DCNN) model which was developed and trained with various optimizers, including RMSprop, Adam, and Nadam. On-the-fly data augmentation techniques have been employed to mitigate the overfitting issue and generate more generalized results. The DCNN architecture has five convolutional layers incorporating the LeakyRelu layer, the Max-pooling layer, the dropout layer, and the batch normalization layer. The ensemble strategy, particularly the combination of Adam and Nadam optimizers, achieved an accuracy of 77.66% under an 80:20 train-test split. These results highlight both the feasibility of sMRI for ASD detection and the potential of ensemble optimization strategies to enhance diagnostic performance.
Another important research direction has shifted toward connectivity-based modeling combined with explainable AI (XAI). In this work, Individual-level morphological covariance brain networks were constructed to estimate interregional structural connectivity, which were then analyzed using a deep residual network (ResNet) [51]. Gradient-weighted Class Activation Mapping (Grad-CAM) helps identify significant regions that contribute more to CNN’s decision. Grad-CAM is considered an important tool for providing transparency in CNN classification systems. This method outperforms other classification methods for ASD classification at multiple sites, demonstrating the effectiveness of combining TL with XAI techniques.
Another approach has emphasized the integration of traditional ML with explainable AI (XAI). Using sMRI data from ABIDE I, a computer-aided diagnostic (CAD) system was constructed in which morphological features were extracted with FreeSurfer as a preprocessing step [53]. Several classifiers were tested, and artificial neural networks (ANNs) proved the most effective, achieving an average balanced accuracy of 97% across ABIDE I sites. Importantly, interpretability was incorporated through local interpretable model-agnostic explanations (LIME), offering clinicians insights into the model’s decision process. This work demonstrates that sMRI-based CAD systems can achieve very high diagnostic performance while also addressing the crucial challenge of explainability.
Beyond these ensemble and CAD systems, autoencoder-based methods have also shown strong performance. For instance, A convolutional autoencoder (CAE) trained directly on raw T1-weighted MRI scans reconstructed brain images, with similarity metrics such as structural similarity index (SSIM), peak signal-to-noise ratio (PSNR), and mean squared error (MSE) used as features for classification [54]. The Support vector machines (SVM) and linear discriminant analysis (LDA) trained on these features achieved a remarkable 96.6% accuracy, highlighting the effectiveness of CAE-based representations in capturing fine-grained structural differences.
As all these works show, sMRI provides robust discriminative features for ASD research, with advances in ensemble architectures, autoencoder-based models, and XAI-enabled systems continuing to strengthen its role as a cornerstone modality for AI-driven diagnosis

2.2.3. Multimodal MRI Approaches (sMRI + fMRI)

Building on the strengths of sMRI and fMRI as complementary modalities, recent studies have increasingly turned to multimodal frameworks to capture both structural and functional dimensions of the brain in ASD. Whereas prior research often evaluated each modality in isolation, multimodal strategies seek to integrate features into unified pipelines, thereby improving diagnostic accuracy and model robustness [22,23,55,56,57,58,59]. While some earlier studies assessed each modality independently to better understand their distinct contributions, the focus of multimodal research has shifted toward designing integrative architectures capable of leveraging their combined predictive power.
Manikantan and Jaganathan [56] introduced a graph-based framework for ASD classification using multi-site ABIDE data, where subjects were represented as nodes with 1,024 features. Graph convolutional networks (GCNs) were then employed to model inter-individual structural similarities. Their method achieved a classification accuracy of 82.45%, outperforming several state-of-the-art graph-based approaches, including sGCN and EigenGCN. While effective, the reliance on constructing complete graphs introduced considerable computational overhead, limiting scalability to larger datasets.
In another study [22], the authors merged information from fMRI and sMRI on the ABIDE I dataset. Their pipeline involved stacked autoencoders (SAE) for unsupervised feature learning, followed by multi-layer perceptrons (MLP) and ensemble classifiers. Two fusion strategies were investigated: feature-level fusion through concatenation of structural and functional vectors, and decision-level fusion using separate pipelines combined at the classification stage. The multimodal framework achieved a peak accuracy of 85%, underscoring the added value of integrating complementary signals.
Another recent study has been proposed by Koc et al. [23], which advanced this direction of work by proposing a hybrid CNN-RNN model to process time-series data derived from the Montreal Neurological Institute (MNI) Atlas. Their architecture employed convolutional layers for spatial representation and recurrent layers for temporal modeling, with three fusion strategies (early, cross, and late) evaluated. Among these, cross-fusion integrated with Autism Diagnostic Observation Schedule (ADOS) features achieved the best performance, yielding an accuracy of 96.02%, sensitivity of 92.83%, and specificity of 85.70%. These results not only demonstrated the value of hybrid fusion strategies and behavioral integration but also outperformed single CNN and RNN baselines. Despite its strong performance, the approach remained computationally intensive, limiting its scalability for large, multi-site datasets.
More recently, Alharthi and Alzahrani [38] introduced a transfer learning framework combining pretrained vision transformers (ConvNeXt, MobileNet, Swin, and ViT) with 3D-CNN models applied to both sMRI and fMRI from the ABIDE I (NYU) site. While ConvNeXt achieved the highest performance among transformers, 3D-CNN models yielded maximum accuracies of 77% (sMRI) and 87% (fMRI). However, the study employed separate pipelines for each modality rather than full feature-level integration, limiting the extent to which structural and functional features could be jointly leveraged.
These studies show both the potential and the limitations of using multimodal MRI for ASD diagnosis. Bringing structural and functional data together often improves accuracy, since each modality captures a different aspect of brain organization. At the same time, challenges remain, such as the heavy computational cost of some models, the difficulty of handling heterogeneous data from different sites, and the limited ways features are currently fused. Tackling these issues will be key to moving multimodal MRI from experimental research into practical clinical use.

2.3. Literature Gaps

Despite progress in the field, several important gaps remain in the literature. Traditional machine learning approaches rely heavily on feature engineering and are often sensitive to dataset-specific domains, which limits scalability across diverse populations. Although advanced deep learning architectures such as deep convolutional neural networks and convolutional autoencoders have demonstrated strong performance through automated feature extraction, they typically require large-scale datasets and substantial computational resources when trained from scratch. Transfer learning with transformers remains relatively underexplored for ASD detection, particularly with optimized slicing strategies for 2D neuroimaging inputs. Another major limitation is the lack of interpretability in existing diagnostic models, which is essential for clinical trust, and there remains significant room for improvement in prediction performance.
To address these challenges, we developed an end-to-end AI pipeline leveraging advanced transformer-based architectures, optimized data preprocessing, and explainable AI techniques to enhance prediction performance and interpretability.

3. Materials

In this study, we utilized neuroimaging data from the Autism Brain Imaging Data Exchange (ABIDE) repository [60,61], a widely recognized benchmark dataset for autism research. ABIDE is a large-scale, multi-site initiative that provides sMRI and fMRI images, along with associated phenotypic information for individuals with ASD or TC. The ABIDE datasets consist of two phases.
  • ABIDE I includes data from 539 individuals with ASD and 573 TC participants, aged 7-64 years, collected across 17 international sites.
  • ABIDE II extends the first dataset with an additional 521 ASD and 593 TC participants, aged 5-64 years, collected from 19 sites worldwide.
All neuroimaging data are stored in the Neuroimaging Informatics Technology Initiative (NIfTI) format [60,61]. While ABIDE repository offers a diverse and comprehensive dataset, its multi-site nature introduces heterogeneity due to variations in different aspects such as MRI scanner manufacturers and settings, acquisition protocols, noise levels, image quality, preprocessing pipelines, and missing or corrupted data from certain sites. To ensure data quality and minimize site-specific biases, we selected only the NYU site from ABIDE I for this study. The selection was based on the following considerations:
  • It contains one of the largest subject pools with 79 ASD and 105 TC participants,
  • Prior studies have demonstrated that its scans exhibit high-quality scans with minimal artifacts [38,62,63], and
  • The imaging data undergoes reliable preprocessing steps and exhibits consistency in imaging protocols, making them suitable for model training and evaluation. Using data from a single, high-quality site reduces variability caused by site-dependent confounding factors, which is particularly important for training DL models and ensuring evaluation reliability.
Moreover, we utilized the preprocessed data provided by the ABIDE repository for the NYU site, as summarized in Table 3, instead of working with raw images. This choice significantly reduces computational overhead and eliminates the need for complex preprocessing pipelines. By leveraging high-quality preprocessed data, we ensured better resource allocation and enhanced the reliability of the experimental outcomes.

4. Methods

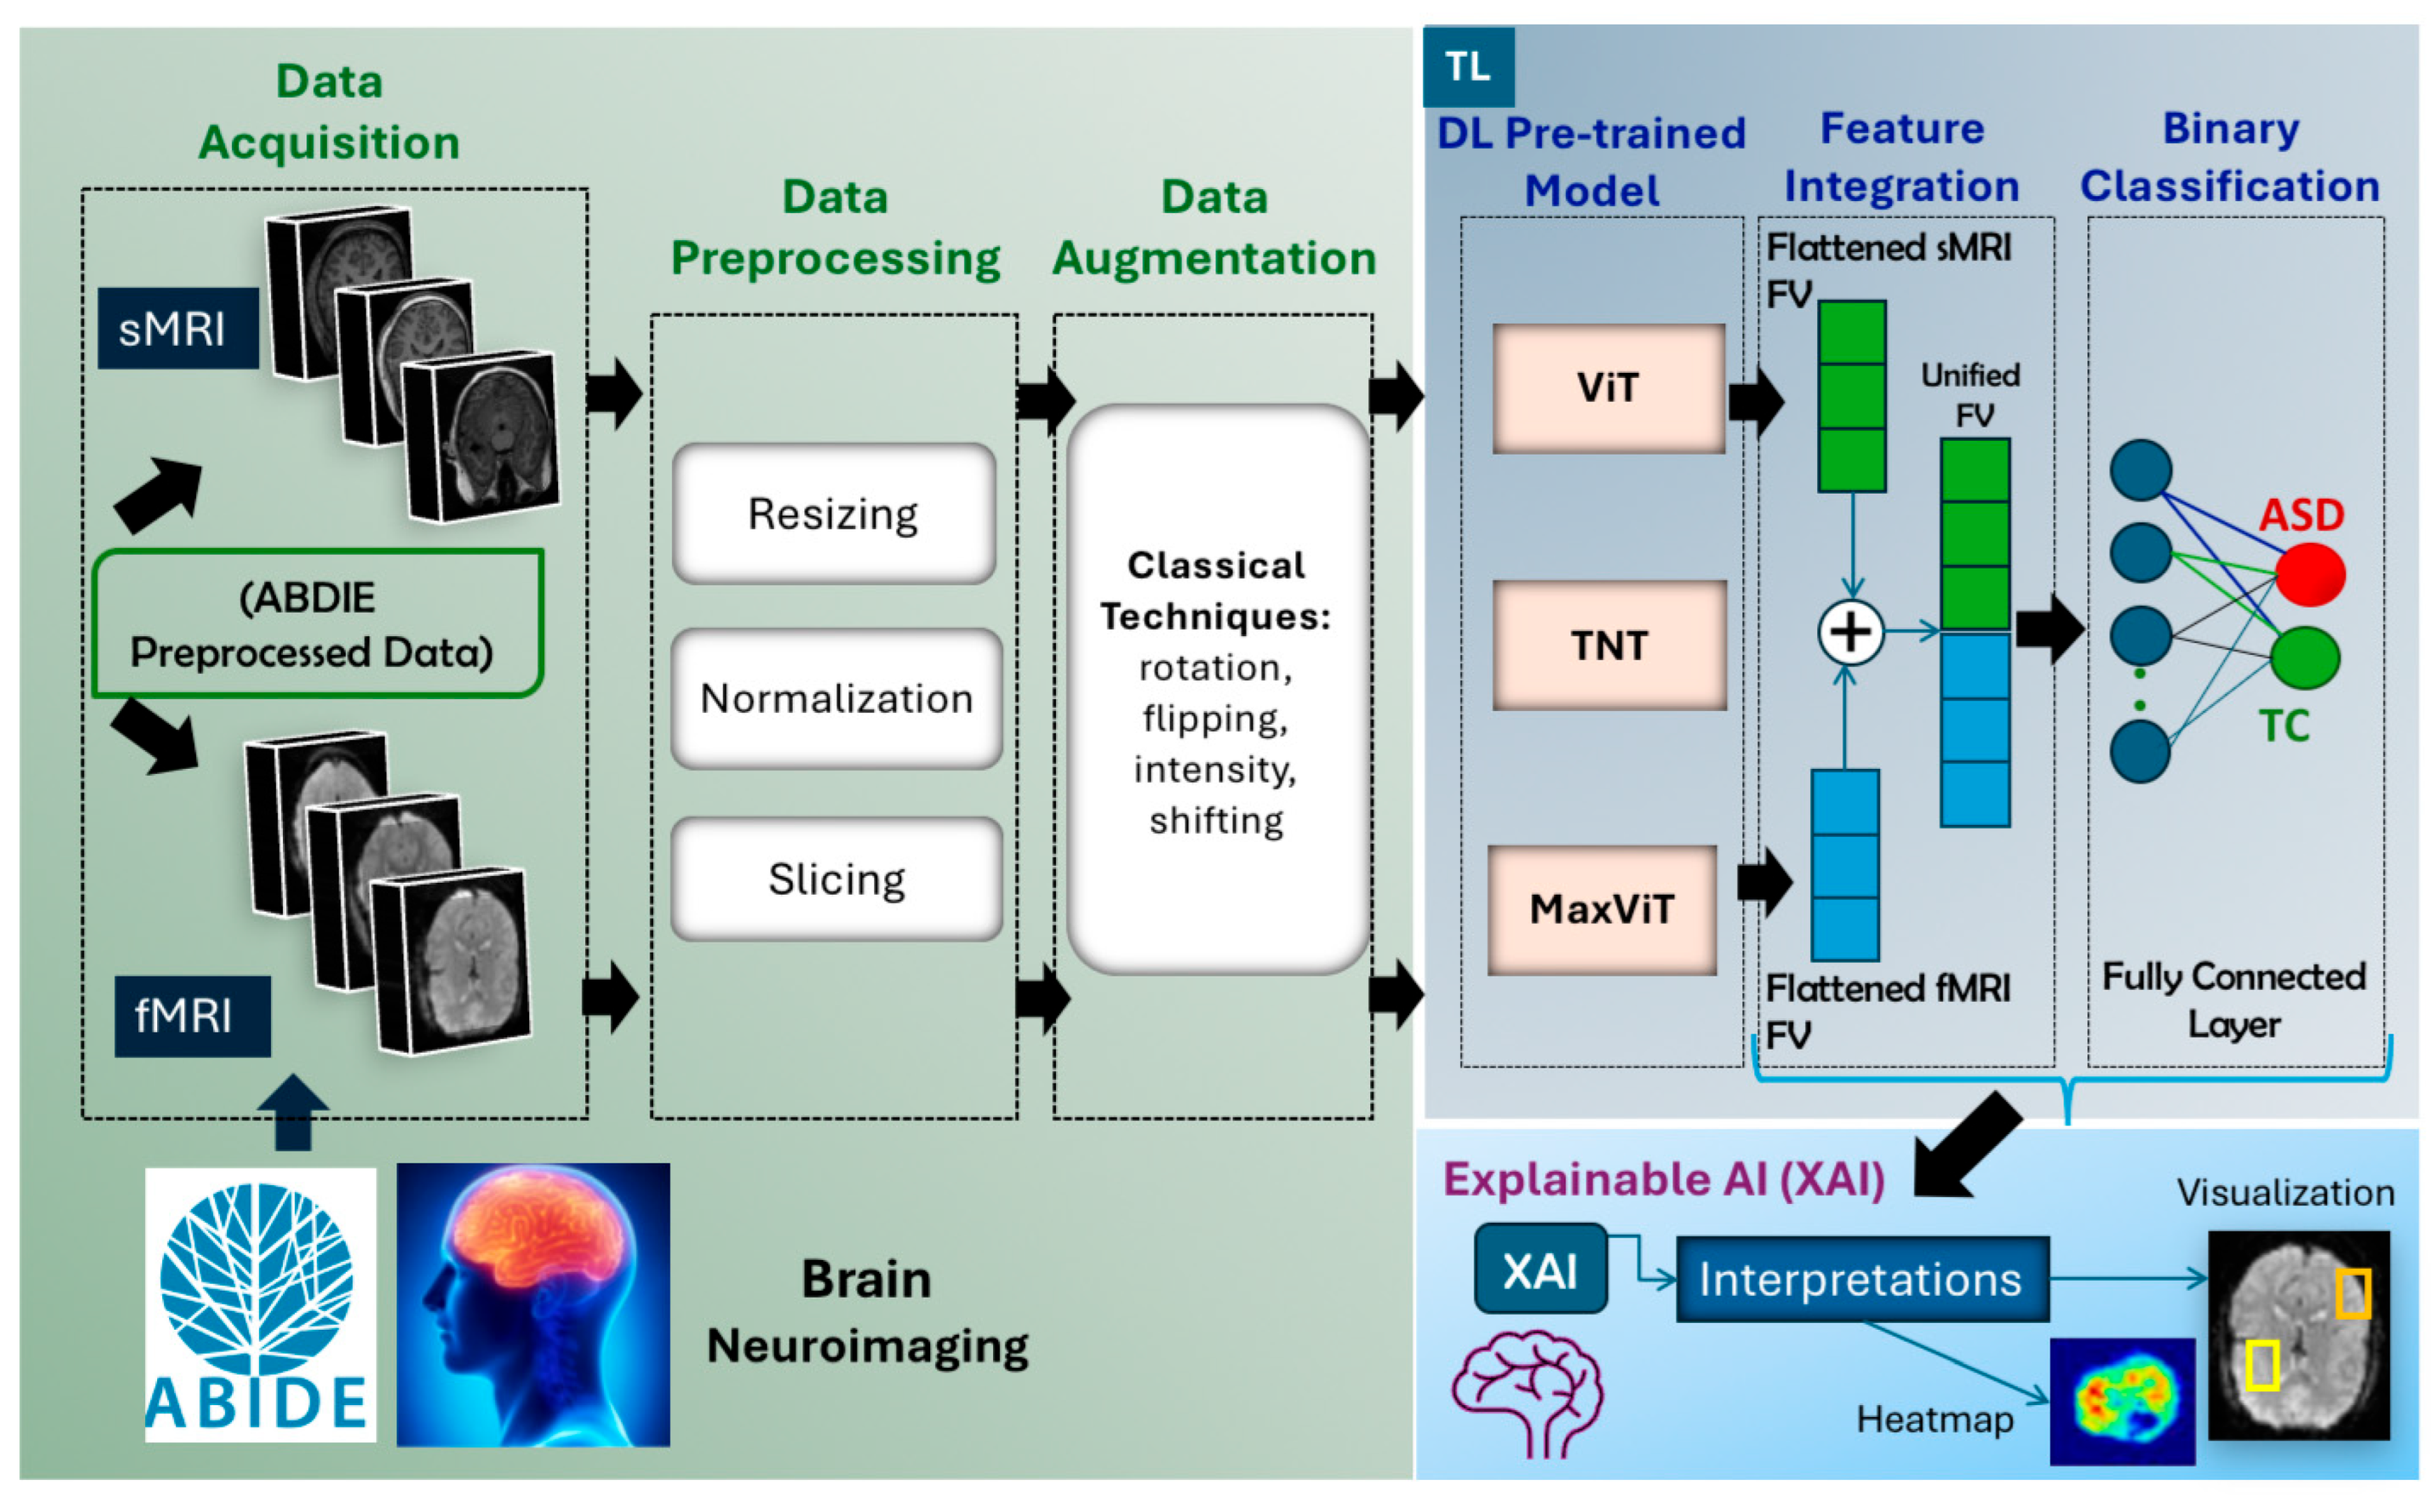
4.1. Proposed Method

We developed an end-to-end AI pipeline for automated autism spectrum disorder (ASD) classification using neuroimaging data. This framework leverages advanced data preprocessing techniques, data augmentation, and state-of-the-art pretrained models to extract features from sMRI and fMRI independently. Each modality was evaluated separately to measure its individual contribution to classification performance. The transfer learning and fine tuning were used to improve robustness and enhance predictive accuracy. Explainable AI is incorporated for interpretability and clinical relevance. Figure 2 illustrates the framework of the proposed method, and each component is explained in detail in the following subsections. As shown in Figure 2, the framework consists of the following key components:
  • Data Acquisition: sMRI and fMRI scans were obtained from the preprocessed ABIDE repository.
  • Data Preprocessing: Multiple preprocessing operations were performed separately on the sMRI and fMRI, including slicing, normalization, resizing, and channel conversion. For fMRI, 3D volumes were converted into 2D slices to match the input requirements of pretrained 2D models.
  • Data Augmentation: Classical augmentation techniques were applied to increase the diversity and volume of the training data and mitigate overfitting due to limited dataset size.
  • Feature Extraction with Pretrained Models: Instead of adapting 3D models, we extracted features by applying state-of-the-art pretrained models directly to 2D slices of fMRI and sMRI data. Separate experiments were conducted for each modality to evaluate their individual effectiveness.
  • Classification: The extracted features were passed through fully connected layers to classify subjects as either ASD or TC, with performance evaluated for each modality.
  • Explainable AI (XAI): XAI techniques were employed to interpret the model’s predictions by highlighting the most influential image regions, thereby supporting model transparency and clinical relevance.
Figure 2. Proposed framework for automated ASD classification using neuroimaging data.
Preprints 174576 g002
The implementation details for each component are presented in the sections below.

4.2. Data Preprocessing

We utilize the preprocessed data from the ABIDE repository, focusing exclusively on the NYU site because of its high quality and completeness. The dataset includes fMRI in 4D volumes and sMRI in 3D volumes stored in NIfTI format (.nii). Additional preprocessing was performed to ensure compatibility and consistency with the selected 2D vision transformer-based architectures, including ViT, MaxViT, and TNT.
In this study, the preprocessed 4D/3D MRI volumes were converted into 2D slices to leverage ImageNet-pretrained models effectively while preserving spatial information critical for ASD detection and the preprocessing steps applied to each modality.

4.2.1. fMRI Data Preprocessing

The original fMRI scans from the ABIDE dataset are provided in a 4D format with dimensions (61 × 73 × 61 × 176), where the fourth dimension corresponds to 176 time points. The preprocessing steps are as follows:
  • 4D to 3D Conversion: To enable compatibility with 2D pretrained models while maintaining spatial consistency, the 4D fMRI data were converted into 3D static volumes through temporal mean calculation. In particular, the voxel-wise mean intensity was computed across all 176 time points, resulting in a 3D static volume of size (61 × 73 × 61) representing average voxel-wise activation.
  • Fuzzy C-Means (FCM) Volume-level Normalization: The 3D volumes were normalized using FCM segmentation, which separates tissues into distinct regions, such as gray matter, white matter, and cerebrospinal fluid. This approach enhances tissue-specific representation, improving downstream feature extraction during model training for slice-based modeling using 2D pretrained architectures
  • Slice Extraction: The normalized 3D volumes (61 × 73 × 61) were decomposed into 2D slices to analyze certain regions of interest in the MRI image while reducing computational complexity. To ensure consistent representation of brain structures, slices were extracted from the central positions of each axis: axial plane → mid_z, sagittal plane → mid_x, and coronal plane → mid_y. This strategy captures the most representative cross-sectional views of the brain.
  • Slice-level Normalization: Min-Max Normalization was applied to each 2D slice, scaling pixel intensities to the range [0,255] using the formula:
    I n o r m ( x , y )   = I ( x , y ) I m i n I m a x I m i n × 255
    where: I(x, y) is the original pixel intensity at position (x, y), and I m i n and I m a x are the minimum and maximum intensity values in the image, respectively. This step standardizes the image’s intensity scale, preparing it for digital display and subsequent processing while retaining the relative distribution of the original intensities.
  • Resizing: All fMRI slices were resized from their original dimensions to ( 224 × 224   )   pixels to meet the input requirements of the selected pretrained models. The step standardizes image resolution across the dataset.
  • Channel Conversion: Since the pretrained models require three-channel RGB input, the grayscale slices were transformed into three-channel images by duplicating the single-channel intensity values across all three channels. The resulting input shape for each slice became (3 × 224 × 224).

4.2.2. sMRI Data Preprocessing

The sMRI scans consist of 3D volumetric data with dimensions (216 × 256 × 291). Preprocessing steps were designed to align closely with the fMRI pipeline while accounting for differences in data structure. The processing steps for slice-based modeling are as follows:
  • Slicing: Unlike fMRI, sMRI volumes are already in 3D format. Therefore, 2D slices were directly extracted from the volumes along the axial, coronal, and sagittal planes, following the same central slice selection strategy as fMRI (mid_z, mid_x, mid_y) to obtain consistent representations of brain structures.
  • Slice-Level Normalization: As with fMRI slices, Min-Max normalization was applied to scale pixel intensities into a uniform range of [0,255] using the same formula provided above.
  • Resizing: Each sMRI slice was resized from its original resolutions to a standard size of ( 224 × 224 ) pixels to meet the input size requirements of the selected pretrained transformer models.
  • Channel Conversion: The grayscale sMRI slices were transformed into three-channel RGB images following the same step applied to fMRI, resulting in an input shape of (3 × 224 × 224).

4.3. Pretrained Models and Feature Extraction

This study utilized two independent data sources, sMRI and fMRI, to extract modality-specific features using DL pretrained models. The extracted features were subsequently fed into a classifier head for ASD detection. This process utilizes the distinctive capabilities of transformer-based pretrained models to acquire spatial, structural, and temporal features from brain images.
Transformer-based architectures, from foundational models like Vision Transformer (ViT) to advanced versions have demonstrated exceptional efficacy in medical image analysis, achieving state-of-the-art performance in detecting diverse neurological disorders and other abnormalities by modeling hierarchical features [64,65]. Therefore, we utilized sMRI data to capture rich spatial and structural representations, while we used fMRI data to exploit the ability of transformer-based models to learn spatiotemporal dependencies inherent in brain activity time-series information.
To improve computational efficiency while preserving essential anatomical information, we converted 3D MRI data into 2D slices using a slicing technique. This allows us to leverage well-established ImageNet pretrained 2D models without major architectural modifications. This approach balances the pretrained models’ adaptability with computational efficiency and facilitates comparative evaluation of different MRI modalities, allowing investigation of whether sMRI-based or fMRI-based features are more effective for ASD detection.
The following subsections explain each pretrained model used, their architectural characteristics, the modalities applied, and the rationale for their selection.

4.3.1. Vision Transformers (ViT)

Vision Transformer (ViT), introduced by Dosovitskiy et al. [66], was the first model that adapted the transformer architecture for image classification tasks. ViT operates by dividing an input image into fixed-size patches, which are then linearly embedded into patch tokens, analogous to word embeddings in natural language processing. To maintain the spatial relationship, positional encodings are incorporated into these patches and are processed through multiple transformer encoder layers utilizing multi-head self-attention.
A key advantage of ViT is its ability to aggregate information from distant areas of the image, facilitating effective capture of global patterns. However, ViT requires substantial training data and significant computational resources for optimal performance, which may pose a limitation. In this study, ViT served as a baseline model for both sMRI and fMRI analysis, against which more advanced transformer-based architectures were compared.

4.3.2. Transformer-in-Transformer (TNT) Applied to fMRI and sMRI

Transformer-in-Transformer (TNT) [67] is a deep learning architecture extending the ViT by introducing a hierarchical structure to capture local and global dependencies. While ViT focuses primarily on global representations, TNT incorporates two parallel transformer blocks (illustrated in Figure 3), including:
  • The inner block models local-level features within each image patch, such as the connectivity inside each brain region (i.e., intra-regional connectivity).
  • The outer block captures global relationships between patches, such as connectivity between different brain regions (i.e., inter-regional connectivity across the brain).
  • In this study, we applied TNT in two experimental settings:
  • 2D fMRI slices: TNT’s ability to model both spatial and temporal dependencies (i.e., dual-level feature learning) makes it effective for analyzing and understanding functional connectivity between brain regions is essential for detecting ASD-related abnormalities.
  • 2D sMRI slices: TNT extracts fine-grained structural features from high-resolution anatomical scans, capturing both local tissue details and global anatomical relationships
Figure 3. Architecture of the Transformer-in-Transformer (TNT) model showing inner and outer transformer blocks.
Preprints 174576 g003

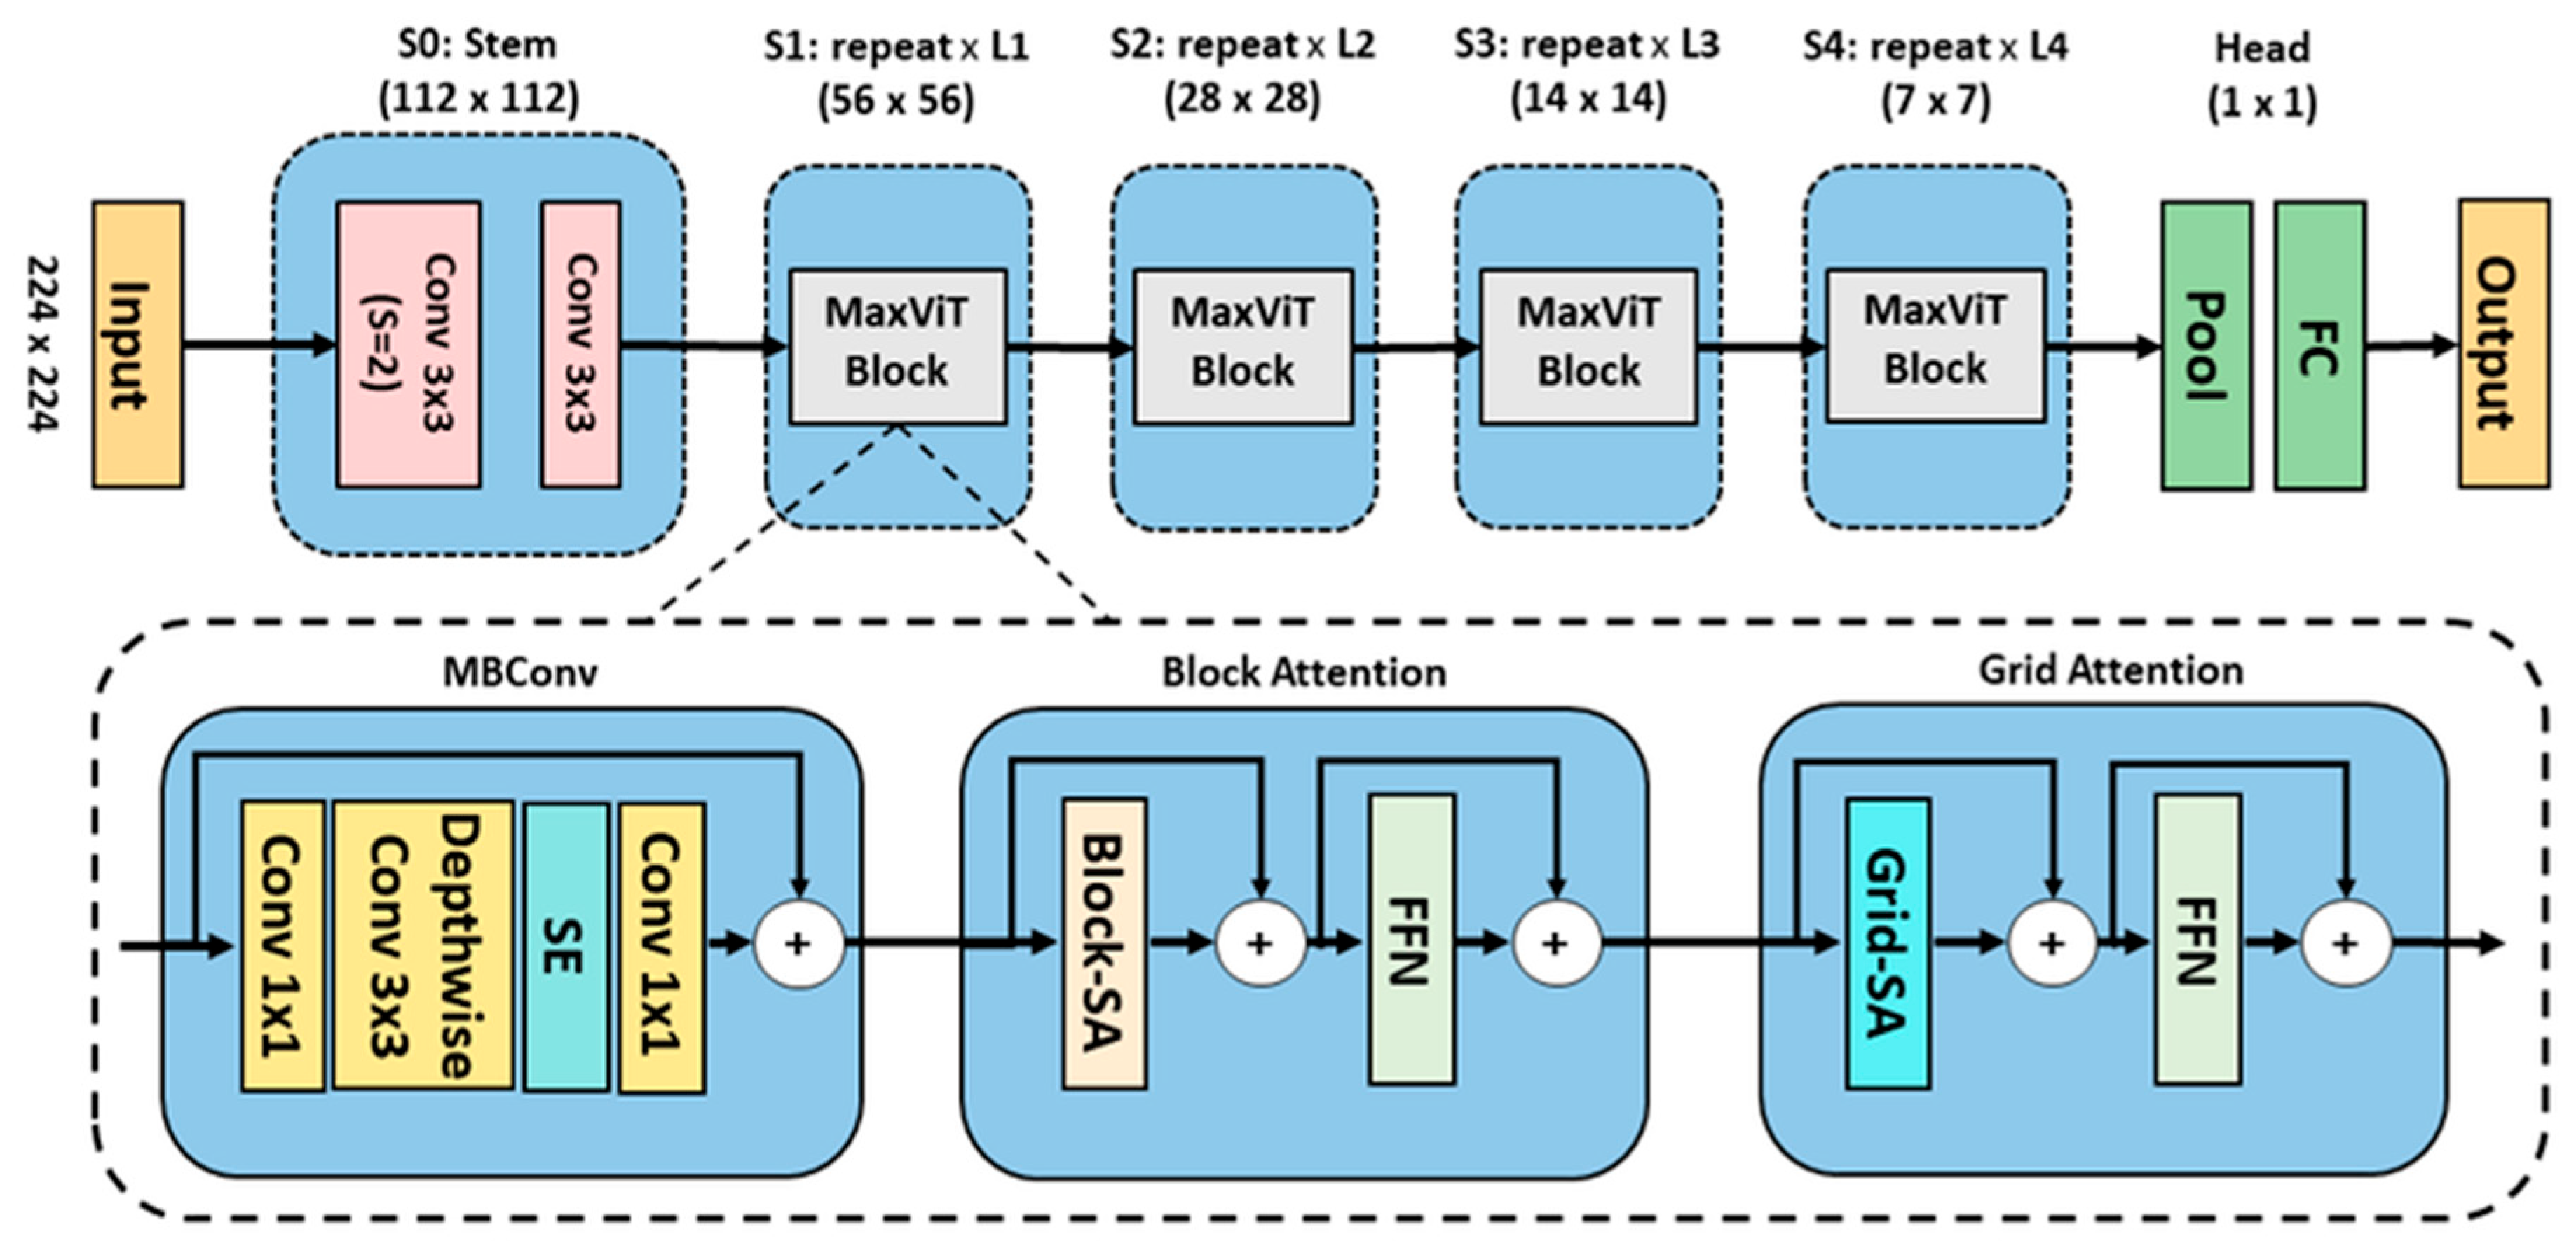
4.3.3. Maximizing Vision Transformer (MaxViT)- Applied to sMRI and fMRI

MaxViT [68] is a vision transformer model that combines CNN-based feature extraction with multi-axis self-attention mechanisms. This combination is particularly suited for capturing the spatial complexity in sMRI and the spatiotemporal dependencies in fMRI scans.
In this study, MaxViT served as the primary model due to its superior representational capacity. We applied MaxViT to both 2D sMRI slices and 2D fMRI slices, maintaining a consistent architecture across modalities. The MaxViT architecture consists of a stem stage (S0) followed by four hierarchical stages (S1–S4), as illustrated in Figure 4:
  • Stem Stage (S0): Two convolutional layers with kernel size of 3×3 to downsample the input.
  • Core Stages S1–S4: Each stage contains a MaxViT block composed of three key modules:
    • Mobile inverted residual bottleneck convolution (MBConv) Module:
      MBConv expands, processes, and compresses features using depth wise convolutions and Squeeze-and-Excitation mechanisms by computing global statistics through average pooling and channel-wise scaling using fully connected layers.
    • Block Attention Module:
      The feature map is partitioned into non-overlapping windows, where self-attention mechanisms capture localized temporal and spatial interactions within each window. A feedforward network is then applied to introduce non-linear transformations to further refine the localized representations.
    • Grid Attention Module:
      Distributes attention across a global grid structure, enabling the model to capture long-range interdependencies.
Figure 4. MaxViT model architecture [69].
Preprints 174576 g004
MaxViT incorporates a pre-normalized relative self-attention mechanism, which combines absolute positional encoding and learned relative positional biases, ensuring richer representation. Residual connections are incorporated into the MaxViT blocks, allowing the model to retain essential information and mitigate vanishing gradient issues during training. This architecture allows MaxViT to perform advanced representation learning, providing robust feature extraction capabilities for ASD detection from both neuroimaging modalities.

4.4. Transfer Learning

In this study, we employed transfer learning to leverage the representational power of pretrained models originally trained on large-scale image datasets. These models are adapted for autism classification using MRI data through two main components: model fine-tuning and classification head customization.

4.4.1. Fine Tuning

After selecting pretrained models for MRI feature extraction, we applied them using transfer learning strategy. The models, initially trained on diverse large-scale datasets, were fine-tuned on our ASD dataset to improve performance. The fine-tuning process involves the following steps:
  • Adapting the Input Layer: We prepared the MRI slices to match the input requirements of the selected models. The first convolutional layer was adjusted accordingly to accept the input format.
  • Freezing Base Layers: Initially, the convolutional layers were frozen to preserve low-level features such as edges, textures, and patterns that transfer across domains. The freezing step prevents unnecessary parameter updates during backpropagation.
  • Customizing the Fully Connected (FC) layers: We replaced the original FC layers with new layers tailored to MRI slice classification. We also add dense layers with dropout regularization to prevent overfitting.

4.4.2. Classification Model

The final classification step is implemented using a fully connected layer (FCL) which transforms the extracted feature embeddings into a binary output for ASD prediction. For the transformer-based model, contextual embeddings generated by self-attention mechanisms are fed directly into the FCL, which outputs a probability score for ASD versus typically developing controls (TC) classification.

4.5. Explainable AI (XAI) Technique

To enhance the interpretability and transparency of our model, we adopted the SHAP (SHapley Additive explanations) framework [70], a widely used explainable AI technique for understanding the contributions of individual features to model predictions. SHAP assigns importance value (Shapley value) to each input feature–in our case, individual voxels or pixels in MRI slices–, to quantify their contribution to the model’s decision (i.e., ASD or TC). Shapley values consider all possible combinations of input features to estimate the marginal contribution of each one. This process allows SHAP to handle nonlinear relationships and interactions between features.
Additionally, SHAP utilizes optimized algorithms, such as Kernel SHAP and Tree SHAP, to efficiently compute feature contributions even for large-scale datasets and deep learning models. It generates interactive visualizations to support model interpretation, including SHAP heatmaps applied to 2D MRI slices to highlight spatially significant features and Glass Brain visualizations applied to fMRI data to display voxel-level SHAP values in alignment with brain anatomy. Regions with positive SHAP values contribute toward ASD classification, while those with negative values contradict the prediction and push the decision toward TC.

5. Experiments and Evaluation

5.1. Training and Testing Strategy

In this study, we employed a train–test split strategy to evaluate pretrained models’ performance for autism prediction. To ensure a fair comparison with previous studies, we utilized the same experiment setting by adopting an 80%- 20% stratified splitting strategy for training and testing, respectively. This stratification approach ensures that each data split has the same proportion of data samples from the ASD and TC groups.

5.2. Implementation Details

We implemented all models using the Python with PyTorch framework (v2.0.1) on Google Colab Pro environment. Experiments were conducted using NVIDIA Tesla T4 GPUs with high-RAM runtime settings to ensure efficient model training and testing. Our implementation was supported by utilizing several libraries and packages as follows:
  • Scikit-learn for stratified data splitting and performance evaluation.
  • Hugging Face Transformers and Timm (PyTorch Image Models) for loading and fine tuning pretrained transformer models using timm.create_model.
  • Nibabel and Nilearn for reading and processing neuroimaging data in NIfTI format
  • PIL and NumPy for image manipulation and preprocessing.
  • Intensity-normalization (FCM-based) for standardizing voxel intensities across MR images.
  • SHAP for model interpretability and explainability.
Moreover, we utilized key hyperparameters to optimize the training process with different tested values summarized in Table 4. Examples of these hyperparameters include batch size, number of epochs, learning rate, dropout rate, and optimizer. These tested values were altered repeatedly through multiple training iterations and then carefully selected to balance model performance, training stability and computational efficiency.

5.3. Evaluation Measures

We used several evaluation metrics to evaluate our model prediction performance which are accuracy (ACC), loss, and F1-score. Those evaluation metrics are calculated based on the true positive (TP), false positive (FP), true negative (TN) and false negative (FN) values, as shown in equations 1, 2, 3, and 4 respectively.
Accuracy (ACC): measures the ratio of correct predictions to the total number of predictions. It evaluates the overall performance of the model.
ACC =   ( T P + T N )   ( T P + T N + F P + F N )
F1-score: The harmonic mean of precision and recall. It is particularly useful in imbalanced classification tasks where both false positives and false negatives are significant.
F 1   s c o r e = 2     R e c a l l     P r e c i s i o n R e c a l l + P r e c i s i o n
As shown in equation (3), we need to calculate the precision and recall computing the F1-score.
Binary cross-entropy (BCE) Loss is a loss function (known as log loss), used in binary classification problems to measure the dissimilarity between the true labels and the predicted probabilities. Mathematically, BCE is defined as:
Loss   =   1 N i = 1 N [ y i   l o g ( p i ) + ( 1   y i )   l o g   ( 1     p i ) ]
where y i is true labels and p i is the predicted probabilities.
For all evaluation metrics, higher values indicate better performance, except for the loss metric, where lower values represent better model prediction performance.

5.4. Experimental Protocol

Preprocessed neuroimaging volumes were converted into 2D slices, resized to 224×224 pixels, and fed into pretrained transformer-based models for fine-tuning. Model performance was compared across multiple architectures using identical training conditions, ensuring a fair and reproducible evaluation.

6. Results and Discussion

To evaluate the effectiveness of transformer-based architectures for autism classification, we conducted experiments on 2D slices extracted from both fMRI and sMRI data. Our analysis compared the performance of advanced models, including Transformer-in-Transformer (TNT) and MaxViT, with Vision Transformer (ViT) serving as the baseline benchmark.

6.1. Prediction Performance Using 2D fMRI Slices

We trained and evaluated three transformer-based models (ViT, TNT, and MaxViT) on 2D fMRI slices. Each model was trained independently to extract distinctive features from fMRI data, then to classify subjects into ASD or TC groups. Table 5 summarizes the prediction performance of these models, analyzed as follows:
  • ViT (baseline): Although it achieved the lowest results among the three models, its performance remains remarkably strong, obtaining 98.03% accuracy and 98.02% F1-score. Its attention-based mechanism effectively captured spatial relationships across image patches, making it a solid benchmark for comparison.
  • TNT achieved the best and most powerful performance, leveraging inner and outer attention mechanisms within and between image patches to capture fine-grained local features.
  • MaxViT, our focus model, matched TNT’s performance, reaching 98.42% accuracy and an F1-score. This outstanding performance is due to its hierarchical integration of multi-scale and multi-axis attention.
An important insight is that while MaxViT and TNT achieved the highest accuracy and F1-score, ViT showed the lowest loss (0.0788), even though its accuracy was slightly lower. Conversely, TNT and MaxViT demonstrated higher loss values (0.1242 and 0.1300, respectively) despite their strong performance. This inconsistency suggests that loss values do not always correlate with accuracy and F1-score, especially in models trained on imbalanced or sensitive data such as fMRI data. Cross-entropy loss is influenced by prediction confidence, while accuracy and F1 reflect only the correctness of final classification decisions. The metric differences emphasize the importance of evaluating models using multiple performance indicators

6.2. Prediction Performance Using 2D sMRI Slices

We also conducted experiments using sMRI slices to evaluate the models’ ability to learn structural brain features. Therefore, we trained the same three transformer-based models: ViT, TNT, and MaxViT to classify subjects into ASD or TC. Table 6 shows the prediction performance of these three models, analyzed as follows:
  • ViT (baseline): uses global attention across image patches, which helps capture overall spatial patterns. However, this approach may overlook finer local details that are important for analyzing brain structure. Consequently, it achieved moderate performance with 81.34% accuracy and 80.81% F1-score.
  • TNT: incorporates attention mechanism within and between patches, allowing it to capture more detailed structural features. It performed second best, improving over ViT by around 10% in accuracy and 11% in F1-score, reaching 91.62% accuracy and 91.65% F1-score.
  • MaxViT: once again, achieved the best performance by combining local and global attention in a hierarchical structure. This design enabled the model to deliver superior accuracy (98.51%), high F1-score (98.51%), and a very low loss (0.0409).

6.3. Comparison with the State-of-the-Art Methods

To evaluate the effectiveness of our approach, we compared the prediction performance of two state-of-the-art methods for predicting ASD, using the same dataset from the NYU site, same train-test split, and the same evaluation metrics for fair comparison. Those studies are introduced in the related works section [38,].
The first study [78] proposed a DL called DarkASDNet framework for ASD classification. It is an improved framework for DarkNet [71]. They originated 20 convolutional layers and six Max pooling layers. They used the fMRI dataset from the NYU site from ABIDE. They applied slice-time correlation and min-max normalization as data preprocessing steps. They used Cross-Entropy Loss function and Adam optimizer to optimize their CNN model.
The second study was conducted by Alharthi and Alzahrani [38] proposed a powerful two-part framework for ASD classification using sMRI and fMRI separately. The dataset was used from the NYU site, one of the multisites in the ABIDE repository. The 3D-CNN model for both sMRI and fMRI data was trained for 50 epochs, using a binary cross-entropy loss function and the Adam optimizer with a learning rate 0.001. The pre-trained models with sMRI data were ConvNeXt, MobileNet, Swim, and ViT, while the 3D-CNN model was used with fMRI data.
As shown in Table 7, our method outperformed the previous methods across all evaluation metrics. The high performance for our method can be attributed to the effective utilization of pretrained transformer-based architectures, which leverage attention mechanisms to capture complex spatial and temporal dependencies in neuroimaging data more effectively than traditional CNN-based approaches.
Additionally, as demonstrated in Table 8, our proposed framework utilizing three transformer-based models consistently outperformed the ConvNext model [38] in the baseline method across all evaluation metrics. These improvements are attributed to the inherent strength of transformer-based architectures in capturing complex spatial patterns and long-range dependencies in sMRI data, which enhances ASD prediction performance.
We can conclude that our experimental results clearly demonstrate the effectiveness of transformer-based architectures in extracting both functional and structural neuroimaging biomarkers for autism detection. By leveraging multi-scale, multi-axis, and intra-patch attention mechanisms, MaxViT and TNT consistently outperformed traditional CNN-based and standard transformer-based models. These findings verify our framework as a highly competitive benchmark for ASD classification, emphasizing its unique ability to capture subtle neuroanatomical variations often missed by traditional approaches.

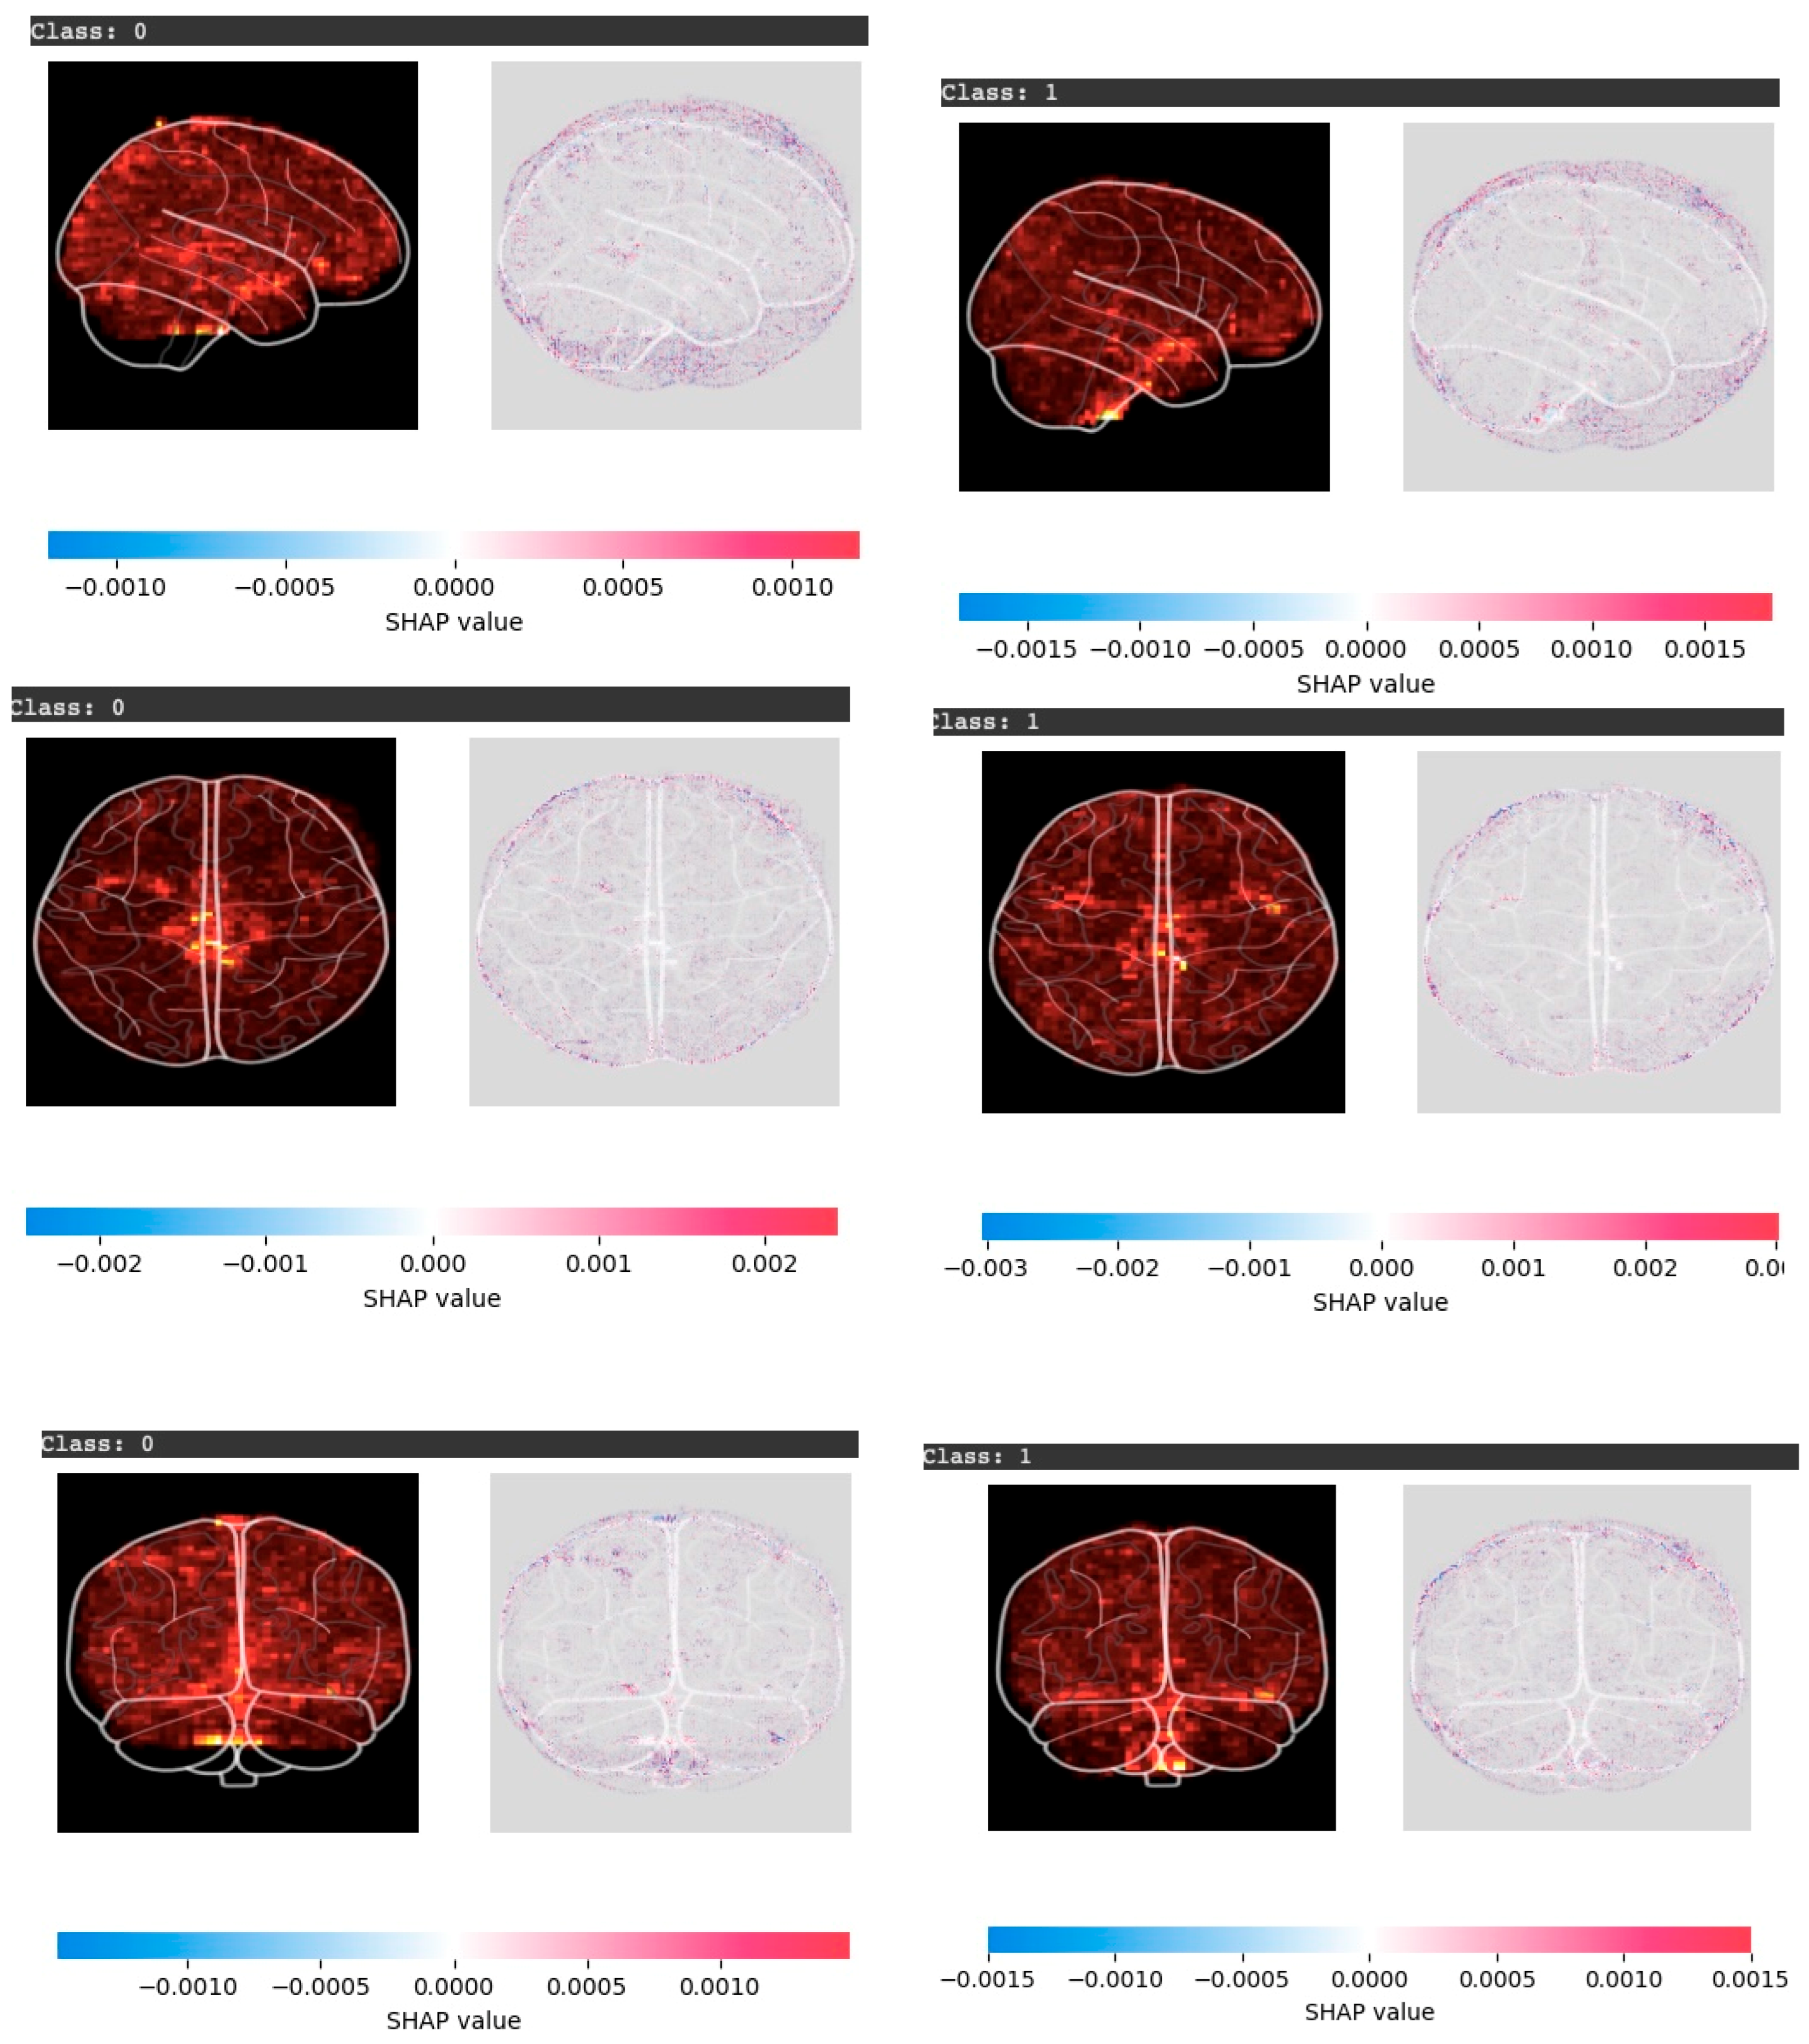
6.4. Explainable AI Results and Findings

In this study, we employed SHAP as an XAI technique to enhance the interpretability of autism prediction using fMRI data. SHAP explains how each pixel affects the model’s decision and assigns a value to each voxel, indicating its contribution to the model’s decision.
Figure 5 presents SHAP visualizations generated from the MaxViT model applied to 2D fMRI slices. The figure presents results for both classes: ASD (Class 0, left column) and TC (Class 1, right column) across three anatomical views: sagittal (top row), axial (middle row), and coronal (bottom row) rendered using Glass Brain visualizations to provide clear insights into regional contributions. To help interpret SHAP visualizations, we can consider two key observations from Figure 5:
  • 1. SHAP Value Colors Interpretation:
  • Red regions indicate positive SHAP values. These features contribute strongly to the predicted class (ASD or TC).
  • Blue regions represent negative SHAP values. These features reduce the model’s confidence in the prediction.
  • White or neutral regions have minimal influence.
This color aspect is clearly shown in Figure 5, where brighter red regions highlight the most crucial voxels influencing the model’s classification decision.
  • 2. Anatomical View Insights:
Each anatomical axis provides unique perspectives for understanding brain activity patterns [72,73], and contributes to the ASD classification.
  • Sagittal view (side): In ASD cases, the activity was stronger on one side of the brain, especially in areas related to memory and social understanding. In contrast, in the TC cases the activity appeared more balanced and spread across both sides.
  • Axial view (top-down): In ASD cases, strong activations appear in the frontal and lateral regions, linked to executive function and cognitive control. In TC cases, activations are more evenly distributed across hemispheres, reflecting balanced neural activity.
  • Coronal view (front-facing): In ASD cases, there was stronger activity in the middle and lower parts of the brain, which may affect movement and certain cognitive functions. In TC cases, the model highlighted contributions on both sides, showing patterns linked to typical memory and motor skills.
In summary, these visualizations confirm that the model focuses on meaningful brain regions associated with known ASD-related neural differences, providing stronger interpretability and transparency of model decisions.
Figure 5. SHAP visualizations for fMRI-based ASD classification using the MaxViT model. Results are shown for ASD (Class 0, left) and TC (Class 1, right) across sagittal (top), axial (middle), and coronal (bottom) views.
Preprints 174576 g005

6.5. Limitations

Despite promising results, this study has some limitations. First, our analysis was restricted to data from a single site (NYU) within the ABIDE repository; while the approach ensured data quality and consistency, it limits generalizability across sites and acquisition protocols. Second, converting 3D neuroimaging volumes to 2D slices, although computationally efficient, may result in loss of important volumetric spatial information and inter-slice relationships. Third, the sMRI and fMRI modalities were analyzed independently, potentially missing the benefits of multimodal data fusion approaches. Finally, our framework requires clinical validation in real-world diagnostic settings to establish practical clinical utility. These limitations highlight directions for future research, including multi-site validation, 3D analysis approaches, multimodal integration, and clinically grounded interpretability approaches.

7. Conclusion

This research contributes to the development of AI applications in the medical field by developing an innovative framework for neuroimaging-based ASD classification using the ABIDE dataset. We systematically explored both sMRI and fMRI modalities independently to evaluate the prediction capabilities of different types of brain imaging data in diagnosing ASD. Our framework leveraged several DL pretrained models, such as, ViT, MaxViT, and TNT, for feature extraction and binary classification (ASD vs. TC). To address the challenge of limited high-quality neuroimaging data, we implemented standard augmentation techniques to expand the training dataset. Importantly, our framework not only achieved high classification accuracy, but also provided interpretable results through explainable AI techniques (SHAP). These expected results will further establish the efficiency of our approach in detecting ASD and provide meaningful insights into the features contributing to the classification.
For future work, several enhancements can be applied, such as:
  • Apply data-level fusion by combining MRI modalities with phenotypic data to further boost prediction accuracy.
  • Utilize GAN-based augmentation for generating synthetic samples and to explore pretrained models trained on large neuroimaging datasets to improve generalizability.
  • Investigate more efficient architectures with less computational complexity, such as DeiT (Data-Efficient Image Transformers).
  • Finally, incorporate attention-based XAI techniques, such as attention maps, to further improve model transparency.
This research demonstrates the potential of transformer-based deep learning models for ASD detection and establishes a solid foundation for building interpretable, modality-specific AI systems in neuroimaging-based medical diagnostics.

Author Contributions

Conceptualization, M.A.T. and A.J.; methodology, A.J and M.A.T..; software, A.J.; validation, A.J.; formal analysis, A.J and A.A..; investigation, A.J. and A.A.; resources, A.J.; data curation, A.J.; writing—original draft preparation, A.J. and M.A.T.; writing—review and editing, M.A.T. and A.A..; visualization, A.J.; supervision, M.A.T.; project administration, M.A.T.; All authors have read and agreed to the published version of the manuscript.

Informed Consent Statement

Not applicable.

Data Availability Statement

The neuroimaging sMRI and fMRI data used in this study were obtained from the Autism Brain Imaging Data Exchange (ABIDE) repository - Preprocessed Data: (https://fcon_1000.projects.nitrc.org/indi/abide/) and were accessed and downloaded in January 2025.

Acknowledgments

The authors would like to acknowledge the Deanship of Graduate Studies and Scientific Research, Taif University for funding this work.

Conflicts of Interest

“The authors declare no conflicts of interest.”

Abbreviations

The following abbreviations are used in this manuscript:
ASD Autism Spectrum Disorder
fMRI Functional magnetic resonance imaging
sMRI Structural magnetic resonance imaging
WHO World Health Organization
ADHD Attention deficit hyperactivity disorder
EEG Electroencephalography
BOLD Blood-oxygen-level-dependent
TC Typically controls
DMN Default mode network
ROI Regions of Interest
ML Machine learning
DL Deep learning
CNNs Convolutional neural networks
XAI Explainable artificial intelligence
TL Transfer learning
SVMs Support vector machines
ANNs Artificial neural networks
REF Recursive Feature Elimination
CPAC Configurable pipeline for the analysis of connectomes
ABIDE Autism brain imaging data exchange
CCS Connectome computation system
MLPs Multilayer perceptrons
SLP Single layer perceptron
PCC Pearson’s correlation coefficient
DCNN Deep convolutional neural networks
ResNet Residual network
Grad-CAM Gradient-weighted class activation mapping
NIfTI Neuroimaging informatics technology initiative
FCM Fuzzy C-means
ViT Vision transformer
TNT Transformer in transformer
MaxViT Maximizing vision transformer
SHAP Shapley additive explanations
ACC Accuracy
BCE Binary cross entropy
DeiT Data efficient image transformers

References

  1. Hirota, T.; King, B. Autism Spectrum Disorder: A Review. JAMA 2023, 329, 157–168.
  2. World Health Organization Available online: https://www.who.int/news-room/fact-sheets/detail/autism-spectrum-disorders.
  3. Rogers, S.J.; Vismara, L.A.; Dawson, G. Coaching Parents of Young Children with Autism: Promoting Connection, Communication, and Learning; Guilford Publications, 2021; ISBN 9781462545728.
  4. Bougeard, C.; Picarel-Blanchot, F.; Schmid, R.; Campbell, R.; Buitelaar, J. Prevalence of Autism Spectrum Disorder and Co-Morbidities in Children and Adolescents: A Systematic Literature Review. Focus (Am Psychiatr Publ) 2024, 22, 212–228. [CrossRef]
  5. Hodges, H.; Fealko, C.; Soares, N. Autism Spectrum Disorder: Definition, Epidemiology, Causes, and Clinical Evaluation. Transl. Pediatr. 2020, 9, S55–S65. [CrossRef]
  6. Gelbar, N.W. Adolescents with Autism Spectrum Disorder: A Clinical Handbook; Oxford University Press, 2018; ISBN 9780190624828.
  7. Flickr, F. us on What Are the Treatments for Autism? Available online: https://www.nichd.nih.gov/health/topics/autism/conditioninfo/treatments (accessed on 20 October 2024).
  8. Ahmed, Z.A.T.; Albalawi, E.; Aldhyani, T.H.H.; Jadhav, M.E.; Janrao, P.; Obeidat, M.R.M. Applying Eye Tracking with Deep Learning Techniques for Early-Stage Detection of Autism Spectrum Disorders. Data (Basel) 2023, 8, 168. [CrossRef]
  9. Taha Ahmed, Z.A.; Jadhav, M.E. A Review of Early Detection of Autism Based on Eye-Tracking and Sensing Technology. In Proceedings of the 2020 International Conference on Inventive Computation Technologies (ICICT); IEEE, February 2020; pp. 160–166.
  10. Cilia, F.; Carette, R.; Elbattah, M.; Dequen, G.; Guérin, J.-L.; Bosche, J.; Vandromme, L.; Le Driant, B. Computer-Aided Screening of Autism Spectrum Disorder: Eye-Tracking Study Using Data Visualization and Deep Learning. JMIR Hum. Factors 2021, 8, e27706. [CrossRef]
  11. Awatramani, J.; Hasteer, N. Facial Expression Recognition Using Deep Learning for Children with Autism Spectrum Disorder. In Proceedings of the 2020 IEEE 5th International Conference on Computing Communication and Automation (ICCCA); IEEE, October 30 2020; pp. 35–39.
  12. Derbali, M.; Jarrah, M.; Randhawa, P. Autism Spectrum Disorder Detection: Video Games Based Facial Expression Diagnosis Using Deep Learning. Int. J. Adv. Comput. Sci. Appl. 2023, 14, . [CrossRef]
  13. Thapaliya, S.; Jayarathna, S.; Jaime, M. Evaluating the EEG and Eye Movements for Autism Spectrum Disorder. In Proceedings of the 2018 IEEE International Conference on Big Data (Big Data); IEEE, December 2018; pp. 2328–2336.
  14. Ibrahim, S.; Djemal, R.; Alsuwailem, A. Electroencephalography (EEG) Signal Processing for Epilepsy and Autism Spectrum Disorder Diagnosis. Biocybern. Biomed. Eng. 2018, 38, 16–26. [CrossRef]
  15. Bosl, W.J.; Tager-Flusberg, H.; Nelson, C.A. EEG Analytics for Early Detection of Autism Spectrum Disorder: A Data-Driven Approach. Sci. Rep. 2018, 8, 6828. [CrossRef]
  16. Sinha, T.; Munot, M.V.; Sreemathy, R. An Efficient Approach for Detection of Autism Spectrum Disorder Using Electroencephalography Signal. IETE J. Res. 2022, 68, 824–832. [CrossRef]
  17. Hashemian, M.; Pourghassem, H. Decision-Level Fusion-Based Structure of Autism Diagnosis Using Interpretation of EEG Signals Related to Facial Expression Modes. Neurophysiology 2017, 49, 59–71. [CrossRef]
  18. Hassouneh, A.; Mutawa, A.M.; Murugappan, M. Development of a Real-Time Emotion Recognition System Using Facial Expressions and EEG Based on Machine Learning and Deep Neural Network Methods. Inform. Med. Unlocked 2020, 20, 100372. [CrossRef]
  19. Mehdizadehfar, V.; Ghassemi, F.; Fallah, A.; Pouretemad, H. EEG Study of Facial Emotion Recognition in the Fathers of Autistic Children. Biomed. Signal Process. Control 2020, 56, 101721. [CrossRef]
  20. Feng, M.; Xu, J. Detection of ASD Children through Deep-Learning Application of FMRI. Children 2023, 10, . [CrossRef]
  21. Suri, J.; El-Baz, A.S. Neural Engineering Techniques for Autism Spectrum Disorder, Volume 2: Diagnosis and Clinical Analysis; Academic Press, 2022; ISBN 9780128244227.
  22. Rakić, M.; Cabezas, M.; Kushibar, K.; Oliver, A.; Lladó, X. Improving the Detection of Autism Spectrum Disorder by Combining Structural and Functional MRI Information. Neuroimage Clin 2020, 25, 102181. [CrossRef]
  23. Koc, E.; Kalkan, H.; Bilgen, S. Autism Spectrum Disorder Detection by Hybrid Convolutional Recurrent Neural Networks from Structural and Resting State Functional MRI Images. Autism Res. Treat. 2023, 2023, 4136087. [CrossRef]
  24. Yang, X.; Paul; Zhang, N. A Deep Neural Network Study of the ABIDE Repository on Autism Spectrum Classification. Int. J. Adv. Comput. Sci. Appl. 2020, 11, . [CrossRef]
  25. Rane, P.; Cochran, D.; Hodge, S.M.; Haselgrove, C.; Kennedy, D.N.; Frazier, J.A. Connectivity in Autism: A Review of MRI Connectivity Studies. Harv. Rev. Psychiatry 2015, 23, 223–244.
  26. Riva, D.; Bulgheroni, S.; Zappella, M. Neurobiology, Diagnosis and Treatment in Autism: An Update; John Libbey Eurotext, 2013; ISBN 9782742008360.
  27. Blackmon, K.; Ben-Avi, E.; Wang, X.; Pardoe, H.R.; Di Martino, A.; Halgren, E.; Devinsky, O.; Thesen, T.; Kuzniecky, R. Periventricular White Matter Abnormalities and Restricted Repetitive Behavior in Autism Spectrum Disorder. NeuroImage Clin. 2016, 10, 36–45. [CrossRef]
  28. Alamro, H.; Thafar, M.A.; Albaradei, S.; Gojobori, T.; Essack, M.; Gao, X. Exploiting Machine Learning Models to Identify Novel Alzheimer’s Disease Biomarkers and Potential Targets. 2023, 13, 4979. [CrossRef]
  29. Swarnkar, S.K.; Guru, A.; Chhabra, G.S.; Devarajan, H.R. Artificial Intelligence Revolutionizing Cancer Care: Precision Diagnosis and Patient-Centric Healthcare; CRC Press, 2025; ISBN 9781040271230.
  30. Zhang, H.-Q.; Arif, M.; Thafar, M.A.; Albaradei, S.; Cai, P.; Zhang, Y.; Tang, H.; Lin, H. PMPred-AE: A Computational Model for the Detection and Interpretation of Pathological Myopia Based on Artificial Intelligence. Front. Med. (Lausanne) 2025, 12, 1529335. [CrossRef]
  31. Ehsan, K.; Sultan, K.; Fatima, A.; Sheraz, M.; Chuah, T.C. Early Detection of Autism Spectrum Disorder Through Automated Machine Learning. Diagn. (Basel) 2025, 15, . [CrossRef]
  32. Alharthi, A.G.; Alzahrani, S.M. Do It the Transformer Way: A Comprehensive Review of Brain and Vision Transformers for Autism Spectrum Disorder Diagnosis and Classification. Comput Biol Med 2023, 167, 107667. [CrossRef]
  33. Ahmed, M.; Hussain, S.; Ali, F.; Gárate-Escamilla, A.K.; Amaya, I.; Ochoa-Ruiz, G.; Ortiz-Bayliss, J.C. Summarizing Recent Developments on Autism Spectrum Disorder Detection and Classification through Machine Learning and Deep Learning Techniques. Appl. Sci. (Basel) 2025, 15, 8056. [CrossRef]
  34. Chaddad, A.; Li, J.; Lu, Q.; Li, Y.; Okuwobi, I.P.; Tanougast, C.; Desrosiers, C.; Niazi, T. Can Autism Be Diagnosed with Artificial Intelligence? A Narrative Review. Diagn. (Basel) 2021, 11, . [CrossRef]
  35. Ali, M.T.; Elnakieb, Y.A.; Shalaby, A.; Mahmoud, A.; Switala, A.; Ghazal, M.; Khelifi, A.; Fraiwan, L.; Barnes, G.; El-Baz, A. Autism Classification Using SMRI: A Recursive Features Selection Based on Sampling from Multi-Level High Dimensional Spaces. In Proceedings of the 2021 IEEE 18th International Symposium on Biomedical Imaging (ISBI); IEEE, April 13 2021.
  36. Shao, L.; Fu, C.; You, Y.; Fu, D. Classification of ASD Based on FMRI Data with Deep Learning. Cogn. Neurodyn. 2021, 15, 961–974. [CrossRef]
  37. Almuqhim, F.; Saeed, F. ASD-SAENet: A Sparse Autoencoder, and Deep-Neural Network Model for Detecting Autism Spectrum Disorder (ASD) Using FMRI Data. Front. Comput. Neurosci. 2021, 15, 654315. [CrossRef]
  38. Alharthi, A.G.; Alzahrani, S.M. Multi-Slice Generation SMRI and FMRI for Autism Spectrum Disorder Diagnosis Using 3D-CNN and Vision Transformers. Brain Sci. 2023, 13, 1578. [CrossRef]
  39. Tang, M.; Kumar, P.; Chen, H.; Shrivastava, A. Deep Multimodal Learning for the Diagnosis of Autism Spectrum Disorder. J. Imaging Sci. Technol. 2020, 6, . [CrossRef]
  40. Huang, Z.-A.; Zhu, Z.; Yau, C.H.; Tan, K.C. Identifying Autism Spectrum Disorder From Resting-State FMRI Using Deep Belief Network. IEEE Trans Neural Netw Learn Syst 2021, 32, 2847–2861. [CrossRef]
  41. Yousefian, A.; Shayegh, F.; Maleki, Z. Detection of Autism Spectrum Disorder Using Graph Representation Learning Algorithms and Deep Neural Network, Based on FMRI Signals. Front. Syst. Neurosci. 2022, 16, 904770. [CrossRef]
  42. Zhang, J.; Feng, F.; Han, T.; Gong, X.; Duan, F. Detection of Autism Spectrum Disorder Using FMRI Functional Connectivity with Feature Selection and Deep Learning. Cognit. Comput. 2023, 15, 1106–1117. [CrossRef]
  43. Subah, F.Z.; Deb, K.; Dhar, P.K.; Koshiba, T. A Deep Learning Approach to Predict Autism Spectrum Disorder Using Multisite Resting-State FMRI. Appl. Sci. 2021, 11, 3636. [CrossRef]
  44. Wang, C.; Xiao, Z.; Xu, Y.; Zhang, Q.; Chen, J. A Novel Approach for ASD Recognition Based on Graph Attention Networks. Front Comput Neurosci 2024, 18, 1388083. [CrossRef]
  45. Eslami, T.; Raiker, J.S.; Saeed, F. Explainable and Scalable Machine Learning Algorithms for Detection of Autism Spectrum Disorder Using FMRI Data. In Neural Engineering Techniques for Autism Spectrum Disorder; Elsevier, 2021; pp. 39–54 ISBN 9780128228227.
  46. Eslami, T.; Mirjalili, V.; Fong, A.; Laird, A.R.; Saeed, F. ASD-DiagNet: A Hybrid Learning Approach for Detection of Autism Spectrum Disorder Using FMRI Data. Front. Neuroinform. 2019, 13, 70. [CrossRef]
  47. Heinsfeld, A.S.; Franco, A.R.; Craddock, R.C.; Buchweitz, A.; Meneguzzi, F. Identification of Autism Spectrum Disorder Using Deep Learning and the ABIDE Dataset. Neuroimage Clin 2018, 17, 16–23. [CrossRef]
  48. Duan, Y.; Zhao, W.; Luo, C.; Liu, X.; Jiang, H.; Tang, Y.; Liu, C.; Yao, D. Identifying and Predicting Autism Spectrum Disorder Based on Multi-Site Structural MRI With Machine Learning. Front. Hum. Neurosci. 2021, 15, 765517. [CrossRef]
  49. Mishra, M.; Pati, U.C. A Classification Framework for Autism Spectrum Disorder Detection Using SMRI: Optimizer Based Ensemble of Deep Convolution Neural Network with on-the-Fly Data Augmentation. Biomed. Signal Process. Control 2023, 84, 104686. [CrossRef]
  50. Sharif, H.; Khan, R.A. A Novel Machine Learning Based Framework for Detection of Autism Spectrum Disorder (ASD). Appl. Artif. Intell. 2022, 36, 1–33. [CrossRef]
  51. Gao, J.; Chen, M.; Li, Y.; Gao, Y.; Li, Y.; Cai, S.; Wang, J. Multisite Autism Spectrum Disorder Classification Using Convolutional Neural Network Classifier and Individual Morphological Brain Networks. Front Neurosci 2020, 14, 629630. [CrossRef]
  52. Nogay, H.S.; Adeli, H. Multiple Classification of Brain MRI Autism Spectrum Disorder by Age and Gender Using Deep Learning. J Med Syst 2024, 48, 15. [CrossRef]
  53. Ali, M.T.; ElNakieb, Y.; Elnakib, A.; Shalaby, A.; Mahmoud, A.; Ghazal, M.; Yousaf, J.; Abu Khalifeh, H.; Casanova, M.; Barnes, G.; et al. The Role of Structure MRI in Diagnosing Autism. Diagn. (Basel) 2022, 12, . [CrossRef]
  54. Mostafa, S.; Wu, F.-X. Diagnosis of Autism Spectrum Disorder with Convolutional Autoencoder and Structural MRI Images. In Neural Engineering Techniques for Autism Spectrum Disorder; Elsevier, 2021; pp. 23–38 ISBN 9780128228227.
  55. Yakolli, N.; Anusha, V.; Khan, A.A.; Shubhashree, A.; Chatterjee, S. Enhancing the Diagnosis of Autism Spectrum Disorder Using Phenotypic, Structural, and Functional MRI Data. Innov. Syst. Softw. Eng. 2023, . [CrossRef]
  56. Manikantan, K.; Jaganathan, S. A Model for Diagnosing Autism Patients Using Spatial and Statistical Measures Using Rs-FMRI and SMRI by Adopting Graphical Neural Networks. Diagn. (Basel) 2023, 13, . [CrossRef]
  57. Dekhil, O.; Ali, M.; Haweel, R.; Elnakib, Y.; Ghazal, M.; Hajjdiab, H.; Fraiwan, L.; Shalaby, A.; Soliman, A.; Mahmoud, A.; et al. A Comprehensive Framework for Differentiating Autism Spectrum Disorder From Neurotypicals by Fusing Structural MRI and Resting State Functional MRI. Semin Pediatr Neurol 2020, 34, 100805.
  58. Jain, S.; Tripathy, H.K.; Mallik, S.; Qin, H.; Shaalan, Y.; Shaalan, K. Autism Detection of MRI Brain Images Using Hybrid Deep CNN with DM-Resnet Classifier. IEEE Access 2023, 11, 117741–117751. [CrossRef]
  59. Itani, S.; Thanou, D. Combining Anatomical and Functional Networks for Neuropathology Identification: A Case Study on Autism Spectrum Disorder. Med Image Anal 2021, 69, 101986. [CrossRef]
  60. ABIDE Available online: https://fcon_1000.projects.nitrc.org/indi/abide/ (accessed on 17 December 2024).
  61. Cameron, C.; Yassine, B.; Carlton, C.; Francois, C.; Alan, E.; András, J.; Budhachandra, K.; John, L.; Qingyang, L.; Michael, M.; et al. The Neuro Bureau Preprocessing Initiative: Open Sharing of Preprocessed Neuroimaging Data and Derivatives. Front. Neuroinform. 2013, 7, . [CrossRef]
  62. Ahammed, M.S.; Niu, S.; Ahmed, M.R.; Dong, J.; Gao, X.; Chen, Y. DarkASDNet: Classification of ASD on Functional MRI Using Deep Neural Network. Front Neuroinform 2021, 15, 635657. [CrossRef]
  63. Yang, M.; Cao, M.; Chen, Y.; Chen, Y.; Fan, G.; Li, C.; Wang, J.; Liu, T. Large-Scale Brain Functional Network Integration for Discrimination of Autism Using a 3-D Deep Learning Model. Front Hum Neurosci 2021, 15, 687288. [CrossRef]
  64. Wang, Y.; Sheng, H.; Wang, X. Recognition and Diagnosis of Alzheimer’s Disease Using T1-Weighted Magnetic Resonance Imaging via Integrating CNN and Swin Vision Transformer. Clin. (Sao Paulo) 2025, 80, 100673. [CrossRef]
  65. Asiri, A.A.; Shaf, A.; Ali, T.; Shakeel, U.; Irfan, M.; Mehdar, K.; Halawani, H.; Alghamdi, A.H.; Alshamrani, A.F.A.; Alqhtani, S.M. Exploring the Power of Deep Learning: Fine-Tuned Vision Transformer for Accurate and Efficient Brain Tumor Detection in MRI Scans. Diagn. (Basel) 2023, 13, . [CrossRef]
  66. Dosovitskiy, A.; Beyer, L.; Kolesnikov, A.; Weissenborn, D.; Zhai, X.; Unterthiner, T.; Dehghani, M.; Minderer, M.; Heigold, G.; Gelly, S.; et al. An Image Is Worth 16x16 Words: Transformers for Image Recognition at Scale. arXiv [cs.CV] 2020.
  67. Han, K.; Xiao, A.; Wu, E.; Guo, J.; Xu, C.; Wang, Y. Transformer in Transformer. Neural Inf Process Syst 2021, 34, 15908–15919.
  68. Tu, Z.; Talebi, H.; Zhang, H.; Yang, F.; Milanfar, P.; Bovik, A.; Li, Y. MaxViT: Multi-Axis Vision Transformer. arXiv [cs.CV] 2022.
  69. Ong, K.L.; Lee, C.P.; Lim, H.S.; Lim, K.M.; Alqahtani, A. MaxMViT-MLP: Multiaxis and Multiscale Vision Transformers Fusion Network for Speech Emotion Recognition. IEEE Access 2024, 12, 18237–18250. [CrossRef]
  70. Lundberg, S.; Lee, S.-I. A Unified Approach to Interpreting Model Predictions. arXiv [cs.AI] 2017.
  71. Redmon, J.; Farhadi, A. YOLO9000: Better, Faster, Stronger. arXiv [cs.CV] 2016.
  72. Liu, M.; Wang, Z.; Chen, C.; Hu, S. Functional and Structural Brain Network Construction, Representation and Application; Frontiers Media SA, 2023; ISBN 9782832520017. [CrossRef]
  73. Nielsen, J.A.; Zielinski, B.A.; Fletcher, P.T.; Alexander, A.L.; Lange, N.; Bigler, E.D.; Lainhart, J.E.; Anderson, J.S. Multisite Functional Connectivity MRI Classification of Autism: ABIDE Results. Front. Hum. Neurosci. 2013, 7, 599. [CrossRef]
Table 1. Key features derived from fMRI Image Modality.
Feature Name Definition & Link to Autism Associated Brain Regions
Functional connectivity Measures correlation of activation time series between brain regions. ASD shows altered connectivity, especially in social-communication networks [24,25]. default mode network (DMN) and salience network.
Regions of Interest (ROIs) Selected regions with known cognitive roles. Abnormal ROI activity is linked to social and communication deficits. prefrontal cortex, amygdala, and superior temporal sulcus.
Time Series Analysis Evaluates BOLD signal fluctuations over time. Irregular patterns may indicate dysfunctional connectivity. Multiple cortical regions
Temporal Resolution Captures brain dynamics at finer time intervals. Higher resolution reveals subtle neural differences in ASD. Default mode network, Visual cortex
Table 2. Key features derived from sMRI Image Modality.
Feature Name Definition & Link to Autism Associated Brain Regions
Frontal & Temporal Lobes Volume Abnormal volumes correlate with social and cognitive impairments. Frontal cortex, Temporal cortex
Cortical Thickness Thickness of the cerebral cortex, related to higher-order cognitive functions. Prefrontal cortex, Temporal lobe
Cerebrospinal Fluid Volume Volume of the fluid surrounding the brain, involved in protection and waste removal. Increased volume may indicate early brain development abnormalities predictive of autism. Subarachnoid space
Cortical Surface Area Altered surface area affects connectivity and cognition. Prefrontal cortex, Parietal lobe
Gray Matter Volume and Density Abnormalities relate to deficits in social-emotional functions Amygdala, Hippocampus, Prefrontal cortex [26].
White Matter Integrity Reduced integrity weakens inter-regional communication Corpus callosum, Superior longitudinal fasciculus [27].
Table 3. Summary of subjects used from the NYU site for each MRI modalities.
Modality ASD TC
fMRI 74 98
sMRI 79 105
Table 4. Hyperparameters utilized for model fine tuning. Bold indicates the selected values.
Hyperparameters Values
Learning rate ​​ 1e-3, 1e-4, 1e-5
Batch size 8, 16, 32
Dropout rate 0.2, 0.3, 0.4
Optimizer Adam, AdamW
Table 5. 2D-fMRI experiment results (Bold font indicates the best-performing models; Italic font indicates the second-best).
Model Accuracy % F1-Score % Loss
ViT (baseline) 98.03 98.02 0.0788
TNT 98.42 98.42 0.1242
MaxViT 98.42 98.42 0.13
Table 6. 2D-sMRI Experiments Results (Bold font indicates the best-performing models; Italic font indicates the second-best).
Model Accuracy % F1-Score % Loss
ViT (baseline) 81.34 80.81 0.4456
TNT 91.62 91.65 0.2928
MaxViT 98.51 98.51 0.0409
Table 7. Performance comparison of our best models with baseline methods using fMRI data (Bold font indicates the best-performing models; Italic font indicates the second-best).
Study Model Best Accuracy F1-score
DarkASDNet, Ahammed et al. 2021. [78] CNN 94.7% 95%

Alharthi and Alzahrani, 2023. [38]

3D-CNN

87%

82%

Our proposed method in this study
ViT 98.03% 98.02%
TNT 98.42% 98.42%
MaxViT 98.42% 98.42%
Table 8. Performance comparison of our best models with baseline methods using sMRI data (Bold font indicates the best-performing models; Italic font indicates the second-best).
Study Model Best Accuracy F1-score
Alharthi and Alzahrani, 2023. [38] ConvNeXt 77% 76%
Our proposed method in this study ViT 81.34% 80.81%
TNT 91.62% 91.65%
MaxViT 98.51% 98.51%
Disclaimer/Publisher’s Note: The statements, opinions and data contained in all publications are solely those of the individual author(s) and contributor(s) and not of MDPI and/or the editor(s). MDPI and/or the editor(s) disclaim responsibility for any injury to people or property resulting from any ideas, methods, instructions or products referred to in the content.
Copyright: This open access article is published under a Creative Commons CC BY 4.0 license, which permit the free download, distribution, and reuse, provided that the author and preprint are cited in any reuse.
Prerpints.org logo

Preprints.org is a free preprint server supported by MDPI in Basel, Switzerland.

Subscribe

Disclaimer

Terms of Use

Privacy Policy

Privacy Settings

© 2026 MDPI (Basel, Switzerland) unless otherwise stated