Submitted:
30 August 2025
Posted:
01 September 2025
Read the latest preprint version here
Abstract
Background/Objectives
The prognosis of adult malignant melanoma differs significantly between Caucasian and non-Caucasian populations due to differences in histologic subtype prevalence. Accurate risk stratification at the time of diagnosis is essential to make treatment decisions and predict clinical outcomes. However, due to the low incidence of melanoma in Korea, pre-cise risk stratification remains challenging.
Methods
The study involved a retrospective cohort of patients with malignant melanoma at Sever-ance Hospital between January 2006 and October 2023. Patients diagnosed with cancers other than melanoma and with insufficient clinical information for analysis were ex-cluded. Only clinical and pathological variables available at the time of diagnosis were included as features. Machine learning models (decision tree, random forest, bagging, AdaBoost, GradientBoost, and XGBoost) were applied to predict 2-year time point dis-ease-free survival (DFS) status. Model performance was evaluated using accuracy, preci-sion, recall, and F1 score.
Results
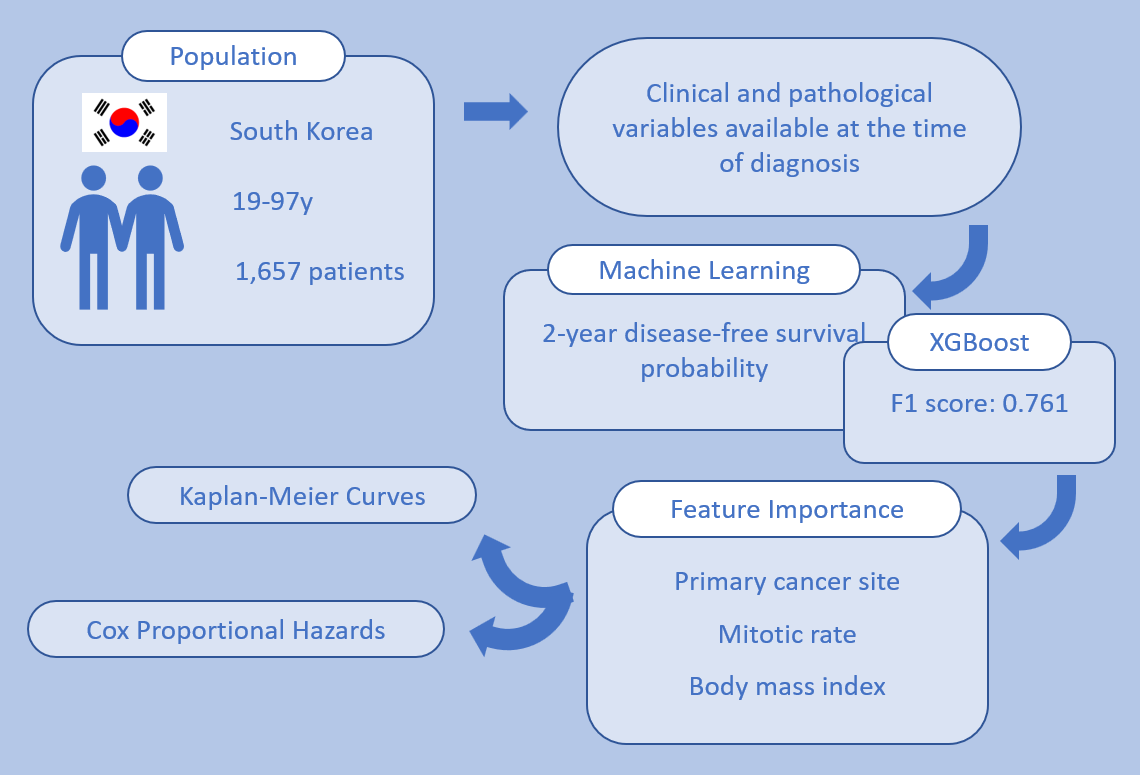
The study included 1,657 patients with 12 clinical features, showing median DFS of 63.93 months (95% CI 52.93-85.33) and a 2-year survival rate of 67.68% (95% CI: 65.16-70.00). Among the models evaluated, XGBoost demonstrated the highest F1 score of 0.761. Pri-mary cancer site, mitotic rate, and body mass index (BMI) were identified as important features predicting survival status. Kaplan-Meier curves and Cox proportional hazards analysis confirmed the clinical relevance of these features. This model suggests that these features are closely related to the DFS of Korean malignant melanoma patients.
Conclusion
The XGBoost model was the most effective for 2-year DFS probability prediction in Korean melanoma patients, and primary cancer site, mitotic rate, and BMI were identified as sig-nificant features influencing survival.
Keywords:
Malignant melanoma
; machine learning
; XGBoost
; disease-free survival
; Korean population
; prognostic model
1. Introduction
Malignant melanoma is the most rapidly progressing type of skin cancer and is the fifth most common cancer in the United States.[1] In South Korea, 674 new cases were diagnosed in 2024 alone.[2] Early and accurate diagnosis and risk stratification are essential due to its aggressive clinical course.[3] Surgical excision remains the cornerstone for histopathological diagnosis and local control, typically accompanied by sentinel lymph node biopsy for staging.
Current clinical guidelines rely on the tumor-node-metastasis (TNM) staging system, particularly emphasizing features such as metastasis, tumor thickness, ulceration, and lymph node involvement.[4,5] However, these factors—while crucial—often dominate prognosis so heavily that they obscure the potential contributions of other informative clinical or pathological features.
Importantly, malignant melanoma exhibits marked heterogeneity across ethnic groups in terms of pathogenesis, subtype distribution, and clinical outcomes.[6] In Asian populations, particularly South Koreans, acral lentiginous melanoma (ALM)—unrelated to ultraviolet radiation and often arising on palms, soles, and nail beds—predominates.[7] ALM is frequently diagnosed at advanced stages and shows higher rates of ulceration, nodal involvement, and metastasis, contributing to worse outcomes compared to superficial spreading melanoma (SSM) common in Caucasians.[8,9,10]
Melanoma is considered rare in Korea, limiting access to large-scale datasets and hindering robust, population-specific prognostic models. Machine learning (ML) offers tools for integrating heterogeneous variables, capturing non-linear relationships, and revealing risk patterns not evident in traditional models, particularly in rare cancers with subtle yet diverse predictors.
Although prior studies have applied ML to various melanoma-related tasks—including image-based lesion classification, mutation prediction, and survival estimation—few have focused specifically on risk stratification using structured clinical data in non-Western populations. [11,12,13,14] Moreover, many existing models rely heavily on TNM staging, which, while powerful, may overshadow other clinically meaningful variables that are available at the time of diagnosis.
In this study, we aimed to develop and validate a machine learning-based model to predict 2-year disease-free survival (DFS) in South Korean patients with stage I–III malignant melanoma, using exclusively clinicopathologic features independent of TNM staging. By analyzing feature importance and model interpretability, we also sought to identify key prognostic factors specific to this population. Our findings may support the development of more accurate and equitable risk stratification tools in clinical melanoma care.
2. Materials and Methods
2.1. Design and Participants
Medical records of patients with histologically confirmed malignant melanoma who received care at Severance Hospital, South Korea, between January 1, 2006, and October 31, 2023, were collected. A total of 1,910 patients aged 19 years or older were included. Data were extracted from electronic health records (EHRs) using text mining and natural language processing (NLP) techniques. The dataset included detailed information on demographics, surgical history, pathology reports, laboratory test results, treatment records, and clinical outcomes.
All data were anonymized and securely stored on an encrypted virtual server. Variables collected included: patient ID (anonymized), date of birth, sex, date of histological diagnosis, age at diagnosis, primary tumor site, baseline body mass index (BMI), baseline hematologic parameters (hemoglobin [Hb], neutrophil-to-lymphocyte ratio [NLR], platelet count [PLT], lactate dehydrogenase [LDH], C-reactive protein [CRP]), histological classification, TNM staging, Breslow thickness, ulceration, mitotic rate, metastasis status, molecular profiles (BRAF, NRAS, PD-L1), surgical information (date, type, lymph node dissection), recurrence data, use of radiotherapy, adjuvant and palliative chemotherapy, disease progression status, and survival outcomes.
2.2. Endpoints
The primary endpoint of this study was to develop a machine learning-based risk stratification model capable of predicting 2-year disease-free survival (DFS) probability in stage I-III patients diagnosed as malignant melanoma. Model performance was evaluated and validated using a held-out test and validation set.
The secondary endpoint was to assess the clinical relevance of input features through two approaches:
- analyzing feature importance derived from the best-performing ML model, and
- conducting univariate and multivariate Cox proportional hazards analyses to determine the statistical association between individual features and survival outcomes.
These findings were compared against established oncologic knowledge and real-world patient characteristics to evaluate their interpretability and potential clinical utility.
2.3. Machine Learning
All machine learning molds were implemented using Python 3.12 and Jupyter Notebook. Six algorithms were applied: decision tree, random forest, bagging, AdaBoost, GradientBoost, and XGBoost.[15] To avoid model bias from direct treatment effects, variables such as surgery details, recurrence, radiotherapy, and chemotherapy were excluded. Furthermore, variables either sparsely available (e.g., NRAS, PD-L1) or overly dominant in survival prediction (e.g., pathologic TNM staging, especially M stage) were excluded to reduce bias and enhance interpretability of feature importance.
Categorical variables were encoded using label encoding. Missing values were handled by imputing numerical features with median values (due to skewed distributions of all the collected data) and treating missing categorical data as a separate category. The dataset was randomly divided into training, validation, and test sets in an 8:1:1 ratio. The training set was used to fit the models, while the validation set was utilized exclusively for hyperparameter tuning and model selection. The test set was held out throughout the training process to provide an unbiased estimate of model performance. Model performance was evaluated using five metrics: Area Under the Receiver Operating Characteristic Curve (ROC AUC), Accuracy, Precision, Recall, F1 score.
In addition to these classical models, a deep neural network (DNN) was implemented using the Keras library with a TensorFlow backend. Hyperparameter optimization was conducted using grid search. The DNN model was trained using binary cross-entropy loss and early stopping based on validation loss.
2.4. Statistical Analysis
Kaplan–Meier survival curves were constructed to assess survival differences by sex, primary tumor site, and histological subtype. For continuous and ordinal variables, univariate and multivariate Cox proportional hazards (CPH) models were fitted to estimate hazard ratios. Variables tested included: sex, age at diagnosis, BMI, Eastern Cooperative Oncology Group (ECOG) performance status, Hb, NLR, PLT, LDH, CRP, mitotic rate, primary cancer site, and histological classification. A two-sided p-value of < 0.05 was considered statistically significant.
2.5. AI-Assisted Writing Statement
Portions of the manuscript—including language refinement, grammar correction, and formatting of the abstract and cover letter—were assisted by OpenAI’s ChatGPT (version GPT-4o, OpenAI, San Francisco, CA). The authors reviewed and verified all AI-generated content for accuracy and accountability, and take full responsibility for the final submission.
3. Results
3.1. Patient Characteristics
Between January 1, 2006, and October 31, 2023, data were collected from 1,910 South Korean patients with histologically confirmed malignant melanoma. To eliminate the influences from other malignancies, 120 patients were excluded due to: post-melanoma diagnoses of other cancers within the study period (n = 98), prior diagnoses of stage IV cancers any period before the study (n = 6), treatment history for subsequently diagnosed cancers within the study period (n = 11), recent cancer treatment within one year (n = 4), or cancer diagnosis within the past year (n = 1). Additionally, 133 stage IV melanoma at diagnosis were also excluded to focus the analysis on early- to intermediate-stage disease. . After exclusions, a total of 1,657 patients were included for analysis and model training (Supplementary Figure S1).
Baseline characteristics are summarized in Table 1. The median age was 59 years, ranging from 19 to 97 years, with female predominance (53.1%). The primary tumor site was cutaneous in 1,015 patients (61.3%), ocular in 429 (25.9%), and mucosal in 213 (12.9%). Among cutaneous melanomas, histological subtypes included acral lentiginous (22.0%), superficial spreading (9.7%), nodular (6.3%), and lentigo maligna (0.9%). ECOG performance status was available for 940 patients (56.7%), with the majority classified as ECOG 0 (841, 50.8%). Pathological staging data were available for 1,182 patients (71.3%), with stage II (27.0%) being the most common, followed by stage I (19.4%), stage III (14.2%), and carcinoma in situ (10.7%). Based on the World Health Organization (WHO) BMI classification, normal weight (18.5–24.9 kg/m²) was observed in 939 patients (56.7%). The remaining patients were classified as follows: underweight (<18.5 kg/m²), 45 patients (2.7%); overweight (25.0–29.9 kg/m²), 362 patients (21.9%); and obese (≥30.0 kg/m²), 311 patients (18.8%). At data cutoff, 555 patients (33.5%) had experienced relapse, and 1,087 patients (65.5%) were expired.
The total median DFS was 63.9 months (95% CI: 52.9-85.3), with a 2-year survival rate of 67.7% (95% CI 65.2-70.0%). The median follow-up duration was 37.3 months (95% CI 34.6-38.9) (Kaplan-Meier survival estimates are shown in Supplementary Figure S2).
3.2. Machine Learning Model Performance
Data from 1,657 patients were used to develop models predicting 2-year DFS using seven supervised learning algorithms: decision tree, random forest, bagging, AdaBoost, GradientBoost, XGBoost, and a deep neural network (DNN) implemented via Keras. The input variables included demographic, laboratory, and pathological features (e.g., sex, age at diagnosis, BMI, ECOG, Hb, NLR, PLT, LDH, CRP, tumor site, histological subtype, and mitotic rate).
For the DNN, a feedforward architecture was used consisting of two hidden layers with ReLU activation, dropout regularization (rate = 0.5), and a sigmoid output layer. Hyperparameters were optimized via grid search, resulting in a batch size of 16, 100 epochs, and the Adam optimizer.
Model performance was assessed using a randomized test set and evaluated across five metrics: ROC AUC, accuracy, precision, recall, and F1 score. As shown in Table 2, the XGBoost model outperformed others with the highest recall (0.914) and F1 score (0.761) The DNN model yielded an ROC AUC of 0.605 and F1 score of 0.724.
Given the imbalanced nature of survival data, the F1 score is considered the most robust performance metric,[16] suggesting that XGBoost is the optimal model for predicting 2-year DFS in stage I-III Korean patients with newly diagnosed melanoma.
3.3. Feature Importance
To interpret model predictions and identify key prognostic factors, feature importance was evaluated across all models (Figure 1). In the best-performing XGBoost model, the most influential predictors included primary site, mitotic rate, and baseline BMI. Other models showed consistent trends, with baseline NLR gaining more importance in decision tree and random forest models. These findings highlight the relevance of both tumor-intrinsic and host-related features in predicting survival outcomes.
Similarly, feature attribution analysis using Shapley additive explanations (SHAP) in the DNN model revealed a comparable pattern, with primary site, mitotic rate, and BMI among the top contributors (Supplementary Figure S3). Notably, sex emerged as a particularly influential variable in the DNN.
3.4. Survival Analysis Based on Key Features
To validate the prognostic relevance of variables identified through machine learning, univariate Cox proportional hazards regression was performed (Table 3). Given the non-linear relationship between body mass index (BMI) and survival, analyses were conducted using WHO BMI classification categories: underweight (<18.5 kg/m²), normal (18.5–24.9), overweight (25.0–29.9), and obese (≥30.0). The following variables were significantly associated with reduced survival: sex, age at diagnosis, LDH, NLR (all p < 0.005) and CRP (p = 0.005). ECOG performance score (p = 0.447), Hb (p = 0.412) and PLT (p = 0.139) did not reach statistical significance in this model.
Univariate Cox proportional hazards showed that mucosal melanoma (HR 2.564, p < 0.001) and nodular melanoma (HR 1.700, p < 0.001) were associated with significantly worse survival compared to the reference, acral lentiginous melanoma. In contrast, ocular melanoma was associated with improved survival (HR 0.442, p < 0.001). Superficial spreading melanoma (HR 0.846, p = 0.256) and lentigo maligna (HR 0.365, p = 0.155) did not show significant differences in survival relative to the reference.
When patients were stratified by BMI using WHO classification, and using normal BMI as the reference, obese patients had significantly worse survival (HR 2.323, p < 0.001), whereas overweight patients had significantly better survival (HR 0.694, p < 0.001). The underweight group did not show a significant difference in survival compared to the normal group (HR 0.993, p = 0.973).
Kaplan Meier curves of categorical features, along with BMI classification and pathological staging, were analyzed to visualize the survival comparison (Figure 2). List of median DFS, 2-year DFS rate, and log rank test were added (Table 4).

Table 3.
Cox proportional hazards of features.
| Features | Hazards ratio (95% CI) | p-value |
| Age | 1.014 (1.008-1.019) | < 0.005 |
| Sex (reference: female) | ||
| Male | 1.419 (1.227-1.641) | < 0.005 |
| ECOG PS* | 1.104 (0.855-1.426) | 0.447 |
| Baseline Hb | 0.976 (0.921-1.034) | 0.412 |
| Baseline PLT | 1.001 (1.000-1.002) | 0.139 |
| Baseline LDH | 1.003 (1.002-1.005) | < 0.005 |
| Baseline CRP | 1.005 (1.002-1.009) | 0.005 |
| Baseline NLR | 1.173 (1.110-1.240) | < 0.005 |
| Histological type (reference: acral lentiginous) | ||
| Superficial spreading | 0.846 (0.635-1.129) | 0.256 |
| Nodular | 1.700 (1.307-2.211) | < 0.005 |
| Lentigo maligna | 0.365 (0.091-1.464) | 0.155 |
| Ocular | 0.442 (0.367-0.533) | < 0.005 |
| Mucosal | 2.564 (2.139-3.074) | < 0.005 |
| Baseline BMI (reference: normal) | ||
| Underweight | 0.993 (0.643-1.532) | 0.973 |
| Overweight | 0.694 (0.575-0.837) | < 0.005 |
| Obese | 2.323 (1.984-2.719) | < 0.005 |
*Eastern Cooperative Oncology Group Performance Status.
4. Discussion
This study developed and validated a machine learning based model for predicting 2-year DFS in stage I-III South Korean patients with malignant melanoma using structured clinical data available at diagnosis. Using a structured EHR-derived dataset from a large, single-center cohort, a total of seven supervised learning models, including classical tree-based algorithms and a deep neural network (DNN), were implemented, and selected the best-performing model based on F1 score, which is appropriate given the moderate class imbalance in survival outcomes. Among the models tested, XGBoost achieved the most balanced performance across multiple metrics, including recall (0.914) and F1 score (0.761). Feature importance analysis from the XGBoost model revealed several key predictors of survival, notably primary site, mitotic rate, and baseline BMI.
Previous studies have explored the utility of machine learning in melanoma for various tasks, including lesion classification from dermoscopic images, mutation prediction, and treatment response modeling.[14,17,18] However, fewer studies have focused specifically on risk stratification using structured clinical variables, particularly outside of Western populations.
One multicenter study by Lee et al. (2021) applied a range of machine learning models including random forest, support vector machine, and DNN to a U.S. dataset.[19] They presented DNN (balanced accuracy 91.1%, F1 score 80.0%) and random forest (balanced accuracy 88.0%, F1 score 59.6%) as the models with the highest performance. Age, mitotic rate, T4 staging, presence of ulceration, and metastasis were highlighted as feature importances in random forest. Compared to the study by Lee et al. (2021), in which a deep neural network (DNN) achieved the highest performance (F1 score 80.0%, balanced accuracy 91.1%) among several models, our XGBoost-based approach showed a relatively lower F1 score. However, it is noteworthy that the key predictors in this model included TNM-related variables such as T4 staging and metastasis, and their dataset encompassed stage IV patients. In contrast, our study focused exclusively on stage I–III patients and intentionally excluded all TNM staging features to explore recurrence-free survival (DFS) prediction from a different perspective. This distinction may explain the performance gap, but also highlights the strength of our approach in uncovering alternative, clinically relevant predictors in earlier-stage disease.
Another study by Wan et al. (2022) shares methodological similarities with ours in applying machine learning to structured clinical and histopathologic data.[20] Their gradient boosting model achieved strong ROC AUC values (0.845 internal, 0.812 external), with Breslow thickness, mitotic rate, and age as top predictors. However, their analysis was restricted to cutaneous melanoma. In contrast, our study incorporated cutaneous, ocular, and mucosal subtypes, and identified primary site as one of the most important features both in machine learning models and Cox proportional hazards analysis. This broader scope adds value by demonstrating how anatomical subtype contributes meaningfully to DFS prediction across diverse melanoma presentations. Furthermore, our study also highlights the nonlinear correlation of baseline BMI and survival, showing a deeper insight on baseline patient characteristics.
Feature importance analysis from the XGBoost model revealed several key predictors of survival, notably primary site, mitotic rate, and baseline BMI. These findings diverge from previous studies that emphasized TNM-associated factors such as metastasis, ulceration, or tumor thickness—variables intentionally excluded in our study to avoid circular reasoning. By omitting TNM staging components, which are already well-established determinants of prognosis and used for clinical decision-making, we aimed to develop a model that could reveal complementary, staging-independent risk signals from baseline clinicopathologic data. These features were also statistically significant in Cox proportional hazards (CPH) analysis, reinforcing their independent prognostic value.
In comparing melanoma subtypes, mucosal melanoma is known to carry the poorest prognosis,[21,22] whereas ocular melanoma have been reported to show higher 5-year RFS and OS rates compared to cutaneous melanoma (RFS: 56.8% vs 30.1%; OS: 76.6% vs 68.8%).[23] These findings align with our results, wherein mucosal subtype were associated with significantly worse survival compared to acral lentiginous and ocular subtypes, reinforcing the heterogeneity in prognosis based on anatomical origin. Notably, among the subtypes of cutaneous melanoma, acral lentiginous and nodular have been reported to show poorer outcomes compared to superficial spreading.[24,25,26] This partially aligns with our study, in which nodular melanoma showed significantly worse outcomes, whereas acral lentiginous and superficial spreading showed no difference.
The prognostic significance of mitotic rate has been well-established: a large AJCC melanoma cohort study (n = 13,296, stages I–II) reported that mitotic rate was the second strongest independent predictor of melanoma-specific survival after tumor thickness. Patients with ≥ 20 mitoses/mm² had a 10-year survival of only 48% compared to 93% in those with 0 mitoses/mm² (p < 0.001).[27]
The role of BMI in melanoma prognosis has been debated. Earlier reviews suggested mixed associations between obesity and disease-free interval or melanoma-specific survival.[28] More recent studies, particularly involving immune checkpoint inhibitor–treated patients, report an “obesity paradox”—where higher BMI correlates with better treatment response and survival.[29] Our finding that obese patients had worse DFS, while overweight patients displayed relatively favorable survival, thus contributes novel insights to this evolving field.
In addition to classical ML methods, we implemented a deep neural network using Keras with optimized hyperparameters. However, the DNN underperformed relative to tree-based models, which is consistent with previous observations that deep learning may be less effective on small-to-medium–sized tabular datasets where structure and interpretability are critical.[30]
Several limitations should be acknowledged. First, this study was based on data from a single tertiary referral center in Korea, which may limit generalizability. Second, genomic variables such as BRAF, NRAS and PD-L1 mutation status were excluded due to data sparsity, and treatment-related variables were intentionally omitted to focus on baseline prognostication. Third, the absence of external validation restricts conclusions about real-world model applicability. Despite internal cross-validation, future studies should apply these models to independent external cohorts to evaluate generalizability. Additionally, deeper integration of multi-modal data—including imaging, longitudinal lab values, and richer genomic profiling—may further improve model performance and risk classification.
Nonetheless, this study demonstrates that machine learning can be effectively applied to structured clinical data to develop a high-performing, interpretable prognostic model for malignant melanoma in Asian populations. Unlike prior studies that relied on image-based or Western-biased datasets, our analysis leveraged population-specific variables and validated the clinical relevance of key predictors through both ML and conventional survival analysis. The exclusion of TNM-related features allowed the model to focus on less-explored but clinically available variables such as inflammatory markers, hematologic indices, and histologic subtype. This approach increases the interpretability of the model, avoids overfitting to known staging elements, and may facilitate early risk estimation prior to the completion of full staging workup. These findings highlight the potential of combining machine learning with EHR data to enhance risk stratification and guide early treatment planning in rare cancer settings.
5. Conclusions
This study demonstrates the feasibility and clinical utility of machine learning-based risk stratification in malignant melanoma using structured electronic health record (EHR) data. XGBoost emerged as the best-performing model, capturing both traditional and population-specific prognostic factors. These findings may aid clinicians in early identification of high-risk patients and guide more individualized management strategies.
Supplementary Materials
The following supporting information can be downloaded at the website of this paper posted on Preprints.org. Figure S1: Trial profile; Figure S2: Kaplan-Meier curve of total patients; Figure S3. Shapley additive explanations of deep neural network model.
Author Contributions
Conceptualization, Taeho Yuh; Data curation, Eun Sil Baek; Formal analysis, Taeho Yuh; Investigation, Taeho Yuh; Methodology, Taeho Yuh; Project administration, Sangjoon Shin; Resources, Kee Yang Chung, Mi Ryung Roh and Byungho Oh; Software, Taeho Yuh; Supervision, Sangjoon Shin; Validation, Taeho Yuh; Visualization, Taeho Yuh; Writing – original draft, Taeho Yuh; Writing – review & editing, Hyunwook Kim, Joong Bae Ahn, Dongwoo Chae and Sangjoon Shin. All authors will be updated at each stage of manuscript processing, including submission, revision, and revision reminder, via emails from our system or the assigned Assistant Editor.
Funding
This research received no external funding.
Institutional Review Board Statement
This study was conducted in accordance with the principles outlined in the Declaration of Helsinki and was approved by the Institutional Review Board (IRB) of Severance Hospital, Yonsei University Health System (IRB No. 4-2023-1504). Given the retrospective nature of the study and the use of fully anonymized data, informed consent was waived by the IRB. All data handling and analyses complied with institutional data protection policies and national regulations regarding patient confidentiality and privacy.
Informed Consent Statement
Patient consent was waived due to the retrospective nature of the study and the use of fully anonymized data, as approved by the Institutional Review Board of Severance Hospital.
Data Availability Statement
Due to patient privacy and institutional security policies, both the clinical data and analysis code used in this study are stored on a secure virtual server within the hospital’s internal network and are not publicly available. Access may be granted to qualified researchers upon reasonable request and subject to institutional approval.
Acknowledgments
The authors thank the Severance Hospital Biomedical Research Center for their support in data access and management. ChatGPT (OpenAI, San Francisco, CA, USA) was used to assist with language revision during manuscript preparation.
Conflicts of Interest
The authors declare no conflict of interest.
Abbreviations
The following abbreviations are used in this manuscript:
| ALM | Acral Lentiginous Melanoma |
| AUC | Area Under the Curve |
| BMI | Body Mass Index |
| CI | Confidence Interval |
| CPH | Cox Proportional Hazards |
| CRP | C-reactive Protein |
| DNN | Deep Neural Network |
| DFS | Disease-Free Survival |
| ECOG | Eastern Cooperative Oncology Group |
| EHR | Electronic Health Record |
| F1 | F1 Score (harmonic mean of precision and recall) |
| Hb | Hemoglobin |
| IRB | Institutional Review Board |
| LDH | Lactate Dehydrogenase |
| ML | Machine Learning |
| NLR | Neutrophil-to-Lymphocyte Ratio |
| PLT | Platelet Count |
| ROC | Receiver Operating Characteristic |
| SHAP | Shapley Additive Explanations |
| SSM | Superficial Spreading Melanoma |
| TNM | Tumor–Node–Metastasis |
| XGBoost | Extreme Gradient Boosting |
References
- Siegel, R.L.; Kratzer, T.B.; Giaquinto, A.N.; Sung, H.; Jemal, A. Cancer statistics, 2025. CA Cancer J Clin 2025, 75, 10-45. [CrossRef]
- Korean Central Cancer Registry, Ministry of Health and Welfare. 2024.
- Gershenwald, J.E.; Scolyer, R.A.; Hess, K.R.; Sondak, V.K.; Long, G.V.; Ross, M.I.; Lazar, A.J.; Faries, M.B.; Kirkwood, J.M.; McArthur, G.A.; et al. Melanoma staging: Evidence-based changes in the American Joint Committee on Cancer eighth edition cancer staging manual. CA Cancer J Clin 2017, 67, 472-492. [CrossRef]
- Olsen, C.M.; Whiteman, D.C. Risk stratification for melanoma. Oncotarget 2019, 10, 1868-1869. [CrossRef]
- Balch, C.M.; Gershenwald, J.E.; Soong, S.J.; Thompson, J.F.; Atkins, M.B.; Byrd, D.R.; Buzaid, A.C.; Cochran, A.J.; Coit, D.G.; Ding, S.; et al. Final version of 2009 AJCC melanoma staging and classification. J Clin Oncol 2009, 27, 6199-6206. [CrossRef]
- Kim, S.Y.; Yun, S.J. Cutaneous Melanoma in Asians. Chonnam Med J 2016, 52, 185-193. [CrossRef]
- Bradford, P.T.; Goldstein, A.M.; McMaster, M.L.; Tucker, M.A. Acral lentiginous melanoma: incidence and survival patterns in the United States, 1986-2005. Arch Dermatol 2009, 145, 427-434. [CrossRef]
- Jung, H.J.; Kweon, S.S.; Lee, J.B.; Lee, S.C.; Yun, S.J. A clinicopathologic analysis of 177 acral melanomas in Koreans: relevance of spreading pattern and physical stress. JAMA Dermatol 2013, 149, 1281-1288. [CrossRef]
- Ravaioli, G.M.; Dika, E.; Lambertini, M.; Chessa, M.A.; Fanti, P.A.; Patrizi, A. Acral melanoma: correlating the clinical presentation to the mutational status. G Ital Dermatol Venereol 2019, 154, 567-572. [CrossRef]
- Asgari, M.M.; Shen, L.; Sokil, M.M.; Yeh, I.; Jorgenson, E. Prognostic factors and survival in acral lentiginous melanoma. Br J Dermatol 2017, 177, 428-435. [CrossRef]
- Kavitha, P.; Ayyappan, G.; Jayagopal, P.; Mathivanan, S.K.; Mallik, S.; Al-Rasheed, A.; Alqahtani, M.S.; Soufiene, B.O. Detection for melanoma skin cancer through ACCF, BPPF, and CLF techniques with machine learning approach. BMC Bioinformatics 2023, 24, 458. [CrossRef]
- Li, L.; Zhang, Q.; Ding, Y.; Jiang, H.; Thiers, B.H.; Wang, J.Z. Automatic diagnosis of melanoma using machine learning methods on a spectroscopic system. BMC Med Imaging 2014, 14, 36. [CrossRef]
- Figueroa-Silva, O.; Pastur Romay, L.A.; Viruez Roca, R.D.; Rojas, M.; Suarez-Penaranda, J.M. Machine Learning Techniques in Predicting BRAF Mutation Status in Cutaneous Melanoma From Clinical and Histopathologic Features. Appl Immunohistochem Mol Morphol 2022, 30, 674-680. [CrossRef]
- Bibault, J.E.; Giraud, P.; Burgun, A. Big Data and machine learning in radiation oncology: State of the art and future prospects. Cancer Lett 2016, 382, 110-117. [CrossRef]
- Chen, T.; Guestrin, C. Xgboost: A scalable tree boosting system. In Proceedings of the Proceedings of the 22nd acm sigkdd international conference on knowledge discovery and data mining, 2016; pp. 785-794.
- DeVries, Z.; Locke, E.; Hoda, M.; Moravek, D.; Phan, K.; Stratton, A.; Kingwell, S.; Wai, E.K.; Phan, P. Using a national surgical database to predict complications following posterior lumbar surgery and comparing the area under the curve and F1-score for the assessment of prognostic capability. Spine J 2021, 21, 1135-1142. [CrossRef]
- Esteva, A.; Kuprel, B.; Novoa, R.A.; Ko, J.; Swetter, S.M.; Blau, H.M.; Thrun, S. Dermatologist-level classification of skin cancer with deep neural networks. Nature 2017, 542, 115-118. [CrossRef]
- Kawahara, J.; BenTaieb, A.; Hamarneh, G. Deep features to classify skin lesions. In Proceedings of the 2016 IEEE 13th international symposium on biomedical imaging (ISBI), 2016; pp. 1397-1400.
- Cozzolino, C.; Buja, A.; Rugge, M.; Miatton, A.; Zorzi, M.; Vecchiato, A.; Del Fiore, P.; Tropea, S.; Brazzale, A.; Damiani, G. Machine learning to predict overall short-term mortality in cutaneous melanoma. Discover Oncology 2023, 14, 13. [CrossRef]
- Wan, G.; Nguyen, N.; Liu, F.; DeSimone, M.S.; Leung, B.W.; Rajeh, A.; Collier, M.R.; Choi, M.S.; Amadife, M.; Tang, K.; et al. Prediction of early-stage melanoma recurrence using clinical and histopathologic features. NPJ Precis Oncol 2022, 6, 79. [CrossRef]
- Hahn, H.M.; Lee, K.G.; Choi, W.; Cheong, S.H.; Myung, K.B.; Hahn, H.J. An updated review of mucosal melanoma: Survival meta-analysis. Mol Clin Oncol 2019, 11, 116-126. [CrossRef]
- Bishop, K.D.; Olszewski, A.J. Epidemiology and survival outcomes of ocular and mucosal melanomas: a population-based analysis. Int J Cancer 2014, 134, 2961-2971. [CrossRef]
- Tan, L.L.Y.; Hong, J.; Goh, W.L.; Chang, E.W.Y.; Yang, V.S.; Poon, E.; Somasundaram, N.; Farid, M.; Chan, A.S.Y.; Chan, J.Y. Clinical features and survival outcomes of ocular melanoma in a multi-ethnic Asian cohort. Sci Rep 2020, 10, 16367. [CrossRef]
- Jung, J.M.; Jung, C.J.; Won, C.H.; Chang, S.E.; Lee, M.W.; Choi, J.H.; Lee, W.J. Different progression pattern between acral and nonacral melanoma: A retrospective, comparative, clinicoprognostic study of 492 cases of primary cutaneous melanoma according to tumor site. Indian Journal of Dermatology, Venereology and Leprology 2021, 87, 498-508. [CrossRef]
- Mandala, M.; Rutkowski, P.; Galli, F.; Patuzzo, R.; De Giorgi, V.; Rulli, E.; Gianatti, A.; Valeri, B.; Merelli, B.; Szumera-Cieckiewicz, A.; et al. Acral lentiginous melanoma histotype predicts outcome in clinical stage I-II melanoma patients: an International multicenter study. ESMO Open 2022, 7, 100469. [CrossRef]
- Park, S.M.; Jeong, H.Y.; Kim, H.-S.; Kwak, M.-J.; Yi, C.C.; Bae, Y.C. Epidemiology and prognostic factors of malignant melanoma among 200 Asian patients from a single medical center. Indian Journal of Surgery 2024, 86, 310-317.
- Thompson, J.F.; Soong, S.J.; Balch, C.M.; Gershenwald, J.E.; Ding, S.; Coit, D.G.; Flaherty, K.T.; Gimotty, P.A.; Johnson, T.; Johnson, M.M.; et al. Prognostic significance of mitotic rate in localized primary cutaneous melanoma: an analysis of patients in the multi-institutional American Joint Committee on Cancer melanoma staging database. J Clin Oncol 2011, 29, 2199-2205. [CrossRef]
- Deckers, E.A.; Kruijff, S.; Bastiaannet, E.; van Ginkel, R.J.; Hoekstra-Weebers, J.E.; Hoekstra, H.J. Obesity is not associated with disease-free interval, melanoma-specific survival, or overall survival in patients with clinical stage IB-II melanoma after SLNB. Journal of surgical oncology 2021, 124, 655-664. [CrossRef]
- Jansen, J.; Garmyn, M.; Guvenc, C. The Effect of Body Mass Index on Melanoma Biology, Immunotherapy Efficacy, and Clinical Outcomes: A Narrative Review. Int J Mol Sci 2024, 25. [CrossRef]
- Shwartz-Ziv, R.; Armon, A. Tabular data: Deep learning is not all you need. Information Fusion 2022, 81, 84-90. [CrossRef]
Figure 1.
Feature importances of decision tree (a), random forest (b), AdaBoost (c), GradientBoost (d), XGBoost (e).
Figure 1.
Feature importances of decision tree (a), random forest (b), AdaBoost (c), GradientBoost (d), XGBoost (e).
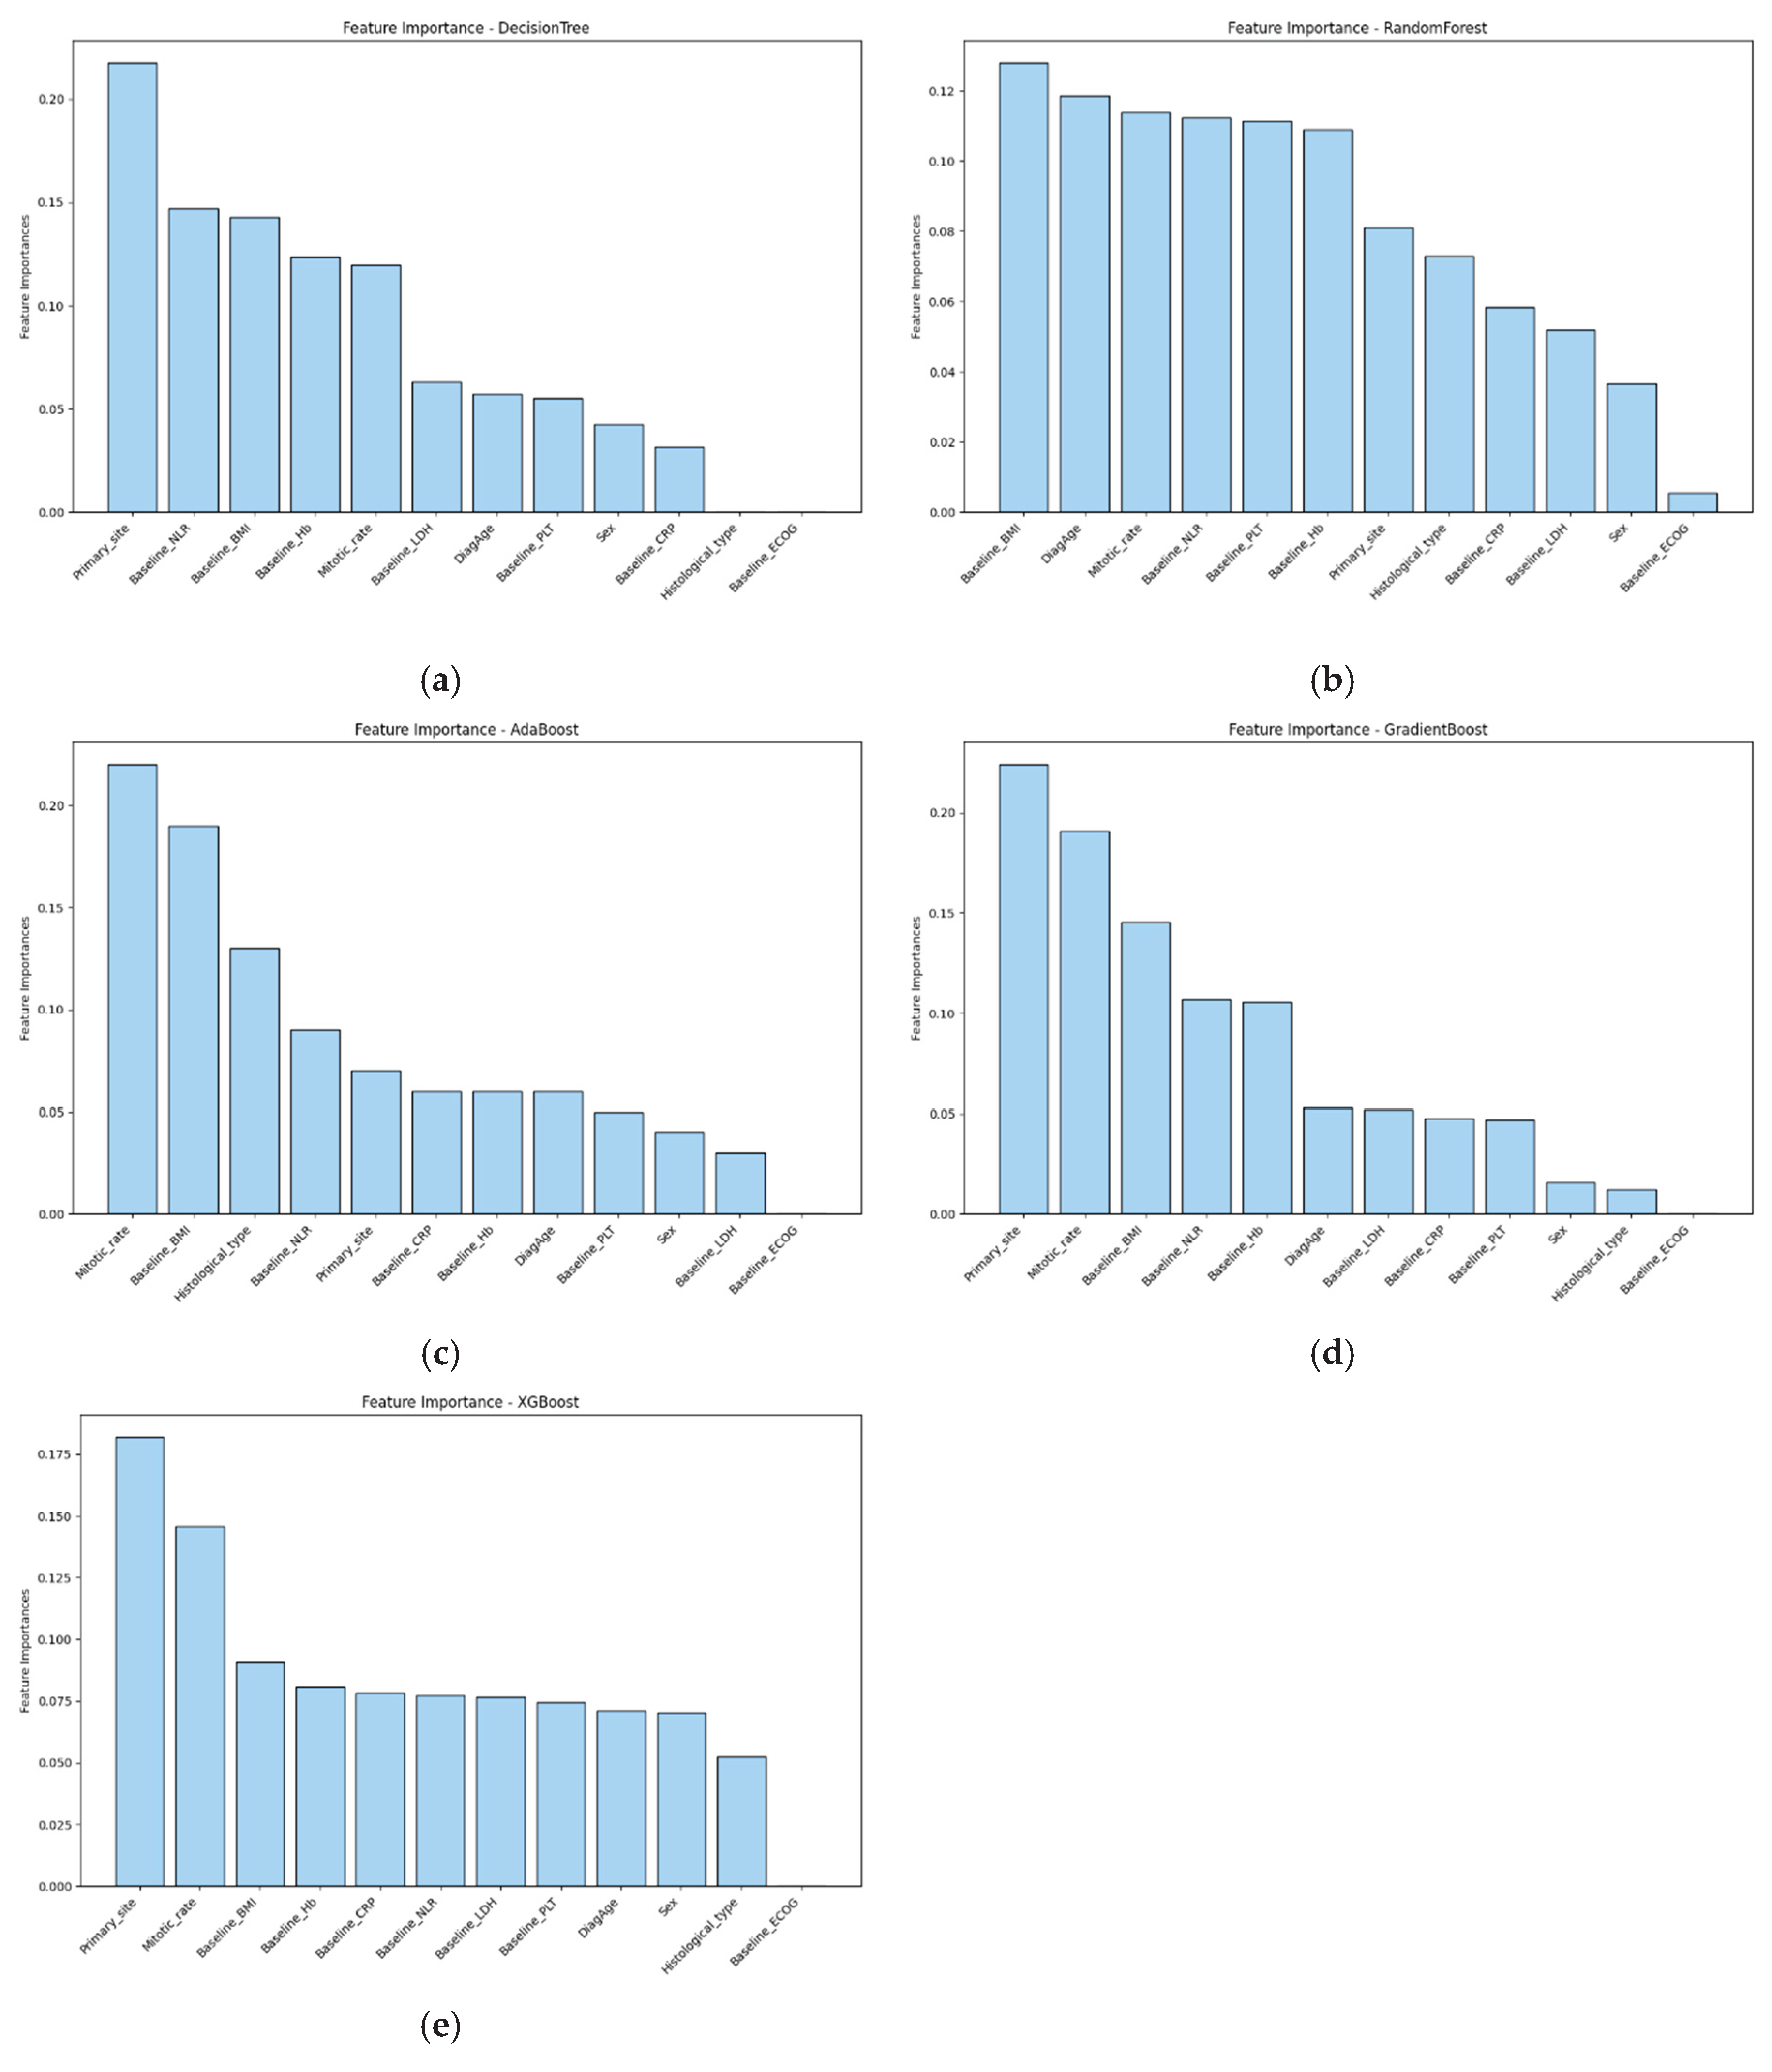
Figure 2.
Kaplan-Meier curves of patients compared by sex (a), pathological stage (b), primary site (c), histological type (d), baseline body mass index (BMI) (e).
Figure 2.
Kaplan-Meier curves of patients compared by sex (a), pathological stage (b), primary site (c), histological type (d), baseline body mass index (BMI) (e).
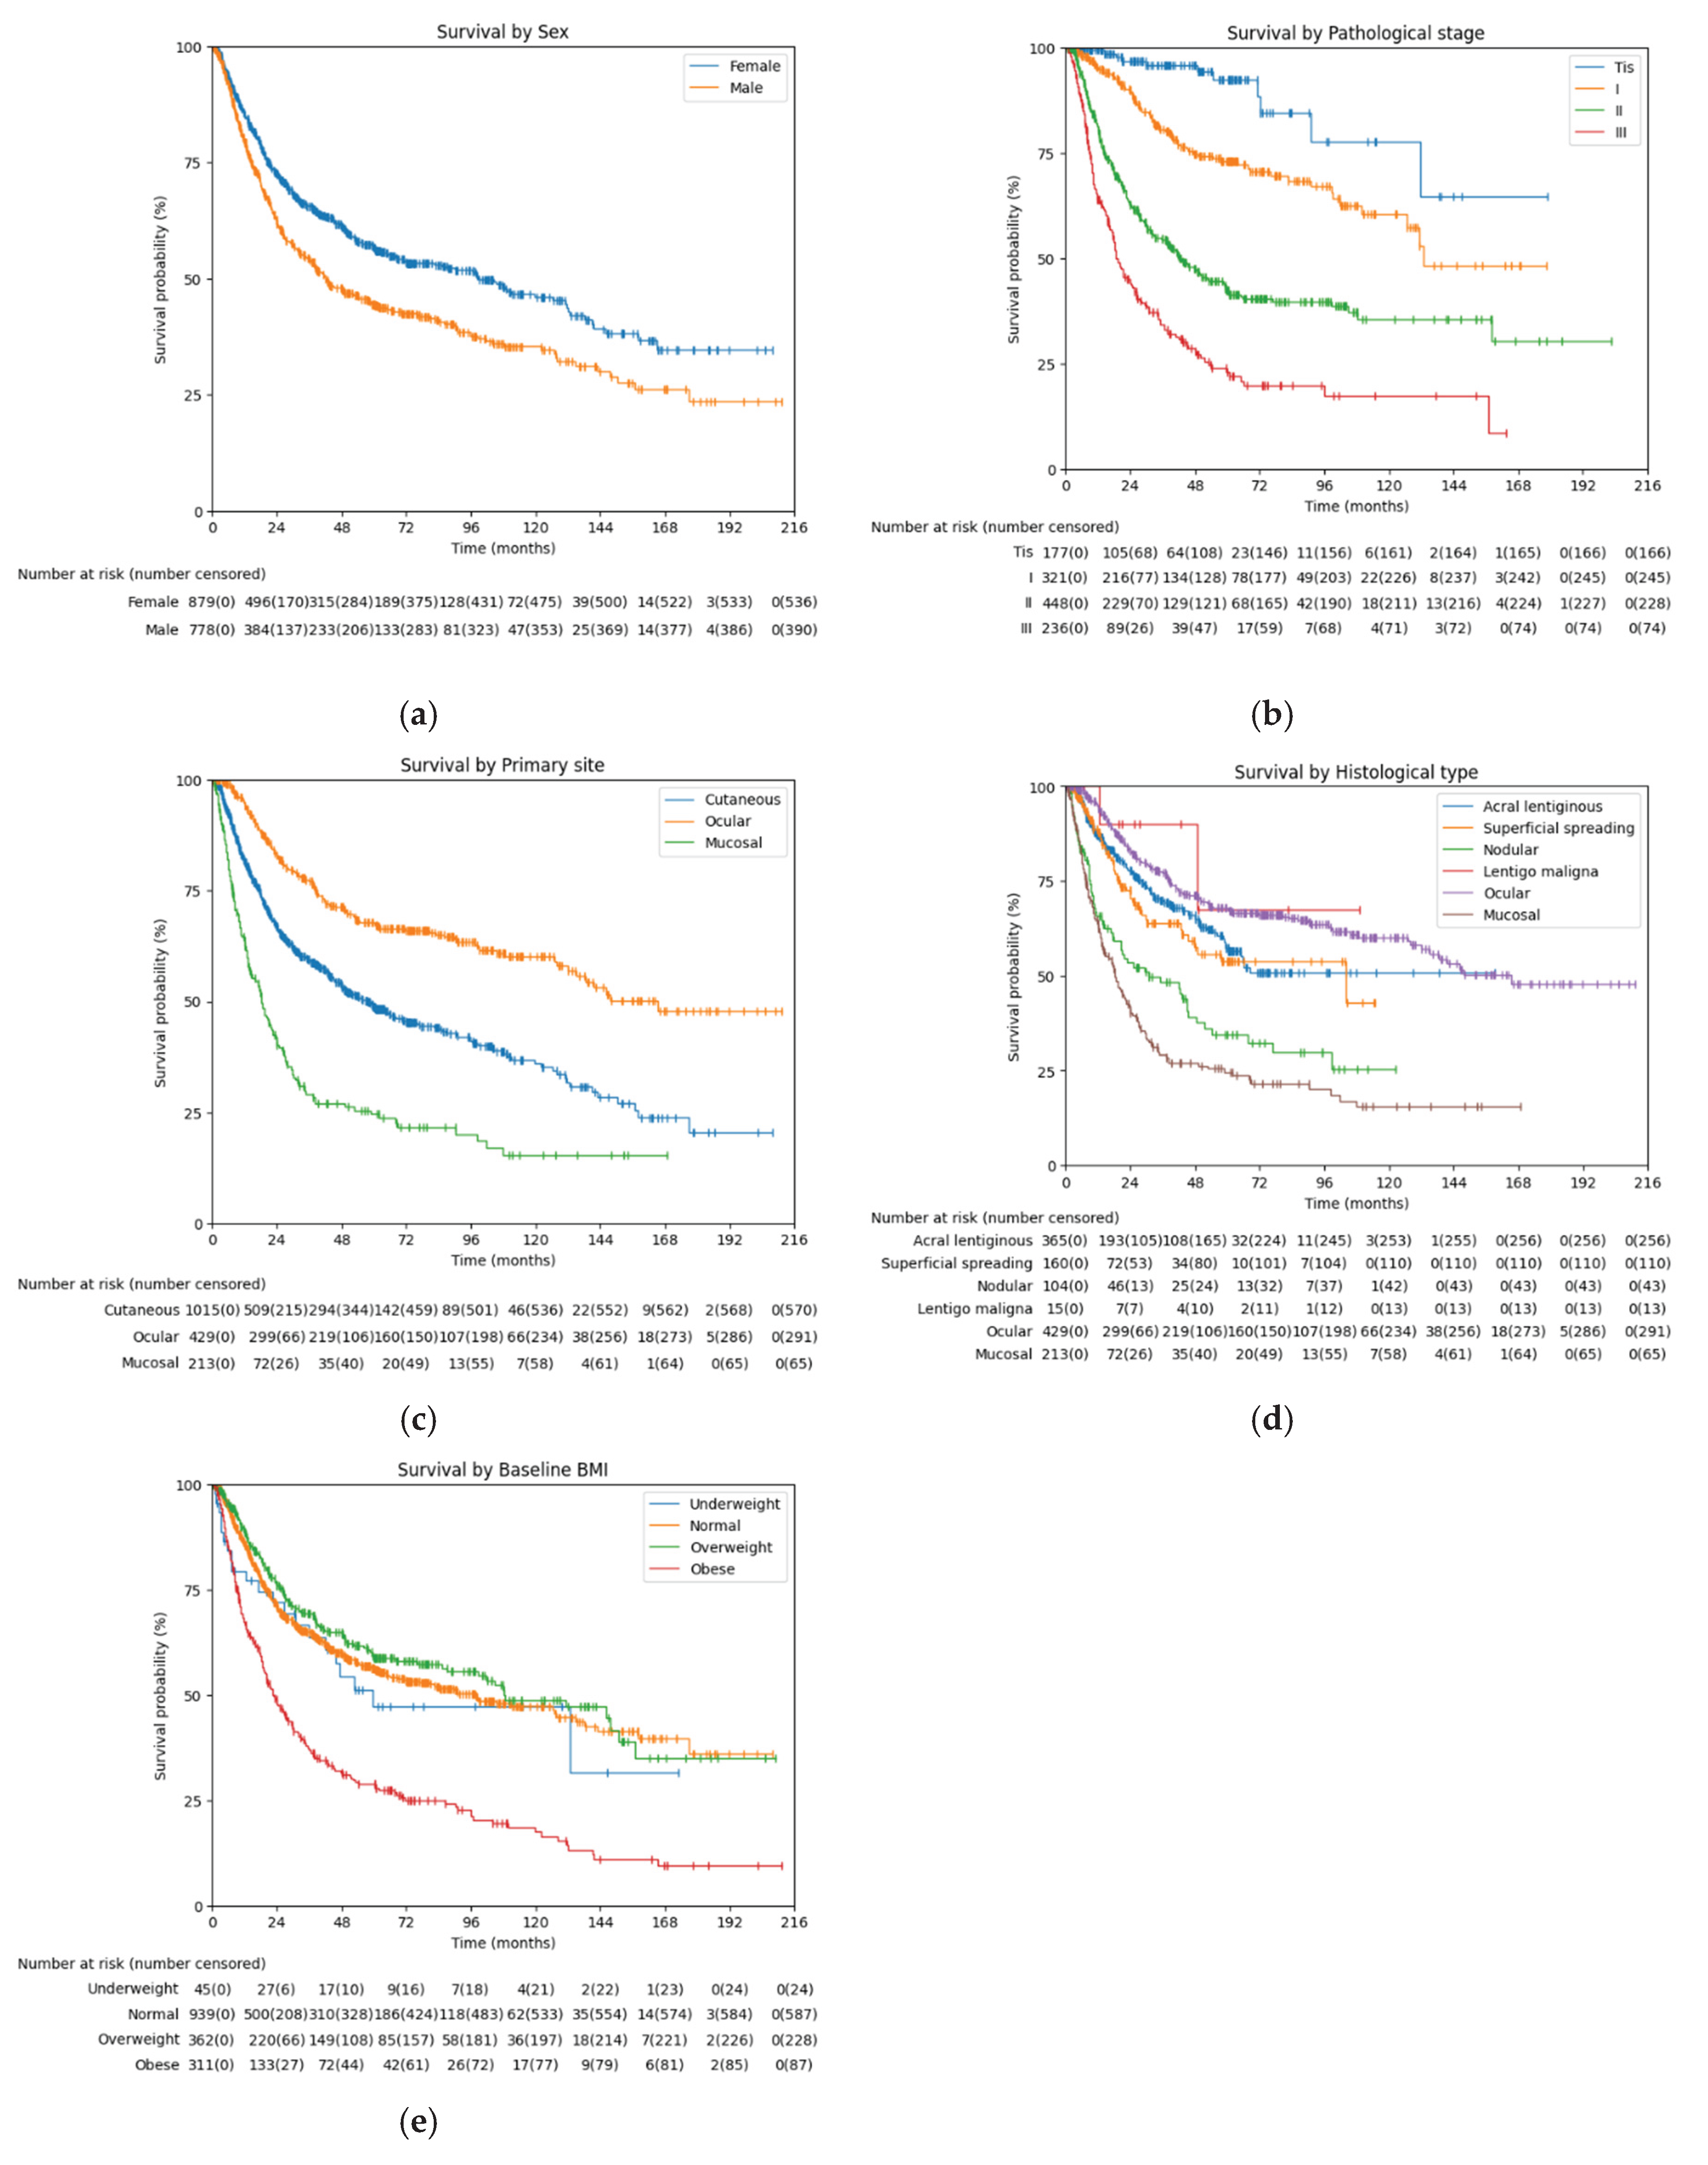
Table 1.
Baseline patient characteristics.
| Primary site | Total | Cutaneous | Ocular | Mucosal | ||||
| Histological type | Total | Acral lentiginous | Superficial spreading | Nodular | Lentigo maligna | |||
| N (%) | 1657 | 1015 (61.26) | 365 (22.03) | 160 (9.66) | 104 (6.28) | 15 (0.91) | 429 (25.89) | 213 (12.85) |
| Median age | ||||||||
| Year (range) | 59 (19-97) | 60 (19-95) | 63 (21-93) | 58 (19-87) | 58 (24-87) | 70 (42-86) | 56 (19-90) | 62 (28-97) |
| Sex | ||||||||
| Male | 778 (46.95) | 469 (46.21) | 171 (46.85) | 70 (43.75) | 52 (50.00) | 10 (66.67) | 206 (48.02) | 103 (48.36) |
| Female | 879 (53.05) | 546 (53.79) | 194 (53.15) | 90 (56.25) | 52 (50.00) | 5 (33.33) | 223 (51.98) | 110 (51.64) |
| ECOG PS* | ||||||||
| 0 | 841 (50.75) | 575 (56.65) | 254 (69.59) | 121 (75.62) | 68 (65.38) | 12 (80.00) | 173 (40.33) | 93 (43.66) |
| 1 | 90 (5.43) | 18 (1.77) | 3 (0.82) | 2 (1.25) | 1 (0.96) | 0 (0.00) | 54 (12.59) | 18 (8.45) |
| 2 | 7 (0.42) | 4 (0.39) | 1 (0.27) | 0 (0.00) | 0 (0.00) | 0 (0.00) | 1 (0.23) | 2 (0.94) |
| 3 | 2 (0.12) | 1 (0.10) | 0 (0.00) | 0 (0.00) | 0 (0.00) | 0 (0.00) | 0 (0.00) | 1 (0.47) |
| Pathological stage | ||||||||
| In situ | 177 (10.68) | 174 (17.14) | 96 (26.30) | 17 (10.62) | 0 (0.00) | 6 (40.00) | 0 (0.00) | 3 (1.41) |
| I | 321 (19.37) | 242 (23.84) | 102 (27.95) | 66 (41.25) | 13 (12.50) | 6 (40.00) | 66 (15.38) | 13 (6.10) |
| II | 448 (27.04) | 274 (27.00) | 111 (30.41) | 43 (26.88) | 47 (45.19) | 1 (6.67) | 153 (35.66) | 21 (9.86) |
| III | 236 (14.24) | 177 (17.44) | 48 (13.15) | 29 (18.12) | 40 (38.46) | 0 (0.00) | 30 (6.99) | 29 (13.62) |
| Baseline BMI** | ||||||||
| Underweight | 45 (2.72) | 25 (2.46) | 6 (1.64) | 5 (3.12) | 2 (1.92) | 0 (0.00) | 15 (3.50) | 5 (2.35) |
| Normal | 939 (56.67) | 554 (54.58) | 217 (59.45) | 109 (68.12) | 50 (48.08) | 12 (80.00) | 279 (65.03) | 106 (49.77) |
| Overweight | 362 (21.85) | 209 (20.59) | 92 (25.21) | 30 (18.75) | 26 (25.00) | 2 (13.33) | 104 (24.24) | 49 (23.00) |
| Obese | 311 (18.77) | 227 (22.36) | 50 (13.70) | 16 (10.00) | 26 (25.00) | 1 (6.67) | 31 (7.23) | 53 (24.88) |
| Relapse | ||||||||
| No | 1102 (66.51) | 658 (64.83) | 270 (73.97) | 116 (72.50) | 46 (44.23) | 13 (86.67) | 334 (77.86) | 110 (51.64) |
| Yes | 555 (33.49) | 357 (35.17) | 95 (26.03) | 44 (27.50) | 58 (55.77) | 2 (13.33) | 95 (22.14) | 103 (48.36) |
| Death | ||||||||
| No | 1098 (66.26) | 689 (67.88) | 293 (80.27) | 130 (81.25) | 66 (63.46) | 14 (93.33) | 315 (73.43) | 94 (44.13) |
| Yes | 559 (33.74) | 326 (32.12) | 72 (19.73) | 30 (18.75) | 38 (36.54) | 1 (6.67) | 114 (26.57) | 119 (55.87) |
* Eastern Cooperative Oncology Group Performance Status ** Body Mass Index.
Table 2.
Model performance comparison of machine learning models.
| ROC AUC* | Accuracy | Precision | Recall | F1 score | |
| Decision tree | 0.533 | 0.507 | 0.781 | 0.328 | 0.462 |
| Random forest | 0.664 | 0.630 | 0.750 | 0.638 | 0.689 |
| Bagging | 0.629 | 0.607 | 0.693 | 0.701 | 0.697 |
| AdaBoost | 0.616 | 0.630 | 0.740 | 0.655 | 0.695 |
| GradientBoost | 0.668 | 0.681 | 0.797 | 0.678 | 0.733 |
| XGBoost | 0.652 | 0.630 | 0.652 | 0.914 | 0.761 |
| DNN** | 0.605 | 0.641 | 0.718 | 0.730 | 0.724 |
* Receiver Operating Characteristic Area Under Curve ** Deep Neural Network.
Table 3.
Cox proportional hazards of features.
| Features | Hazards ratio (95% CI) | p-value |
| Age | 1.014 (1.008-1.019) | < 0.005 |
| Sex (reference: female) | ||
| Male | 1.419 (1.227-1.641) | < 0.005 |
| ECOG PS* | 1.104 (0.855-1.426) | 0.447 |
| Baseline Hb | 0.976 (0.921-1.034) | 0.412 |
| Baseline PLT | 1.001 (1.000-1.002) | 0.139 |
| Baseline LDH | 1.003 (1.002-1.005) | < 0.005 |
| Baseline CRP | 1.005 (1.002-1.009) | 0.005 |
| Baseline NLR | 1.173 (1.110-1.240) | < 0.005 |
| Histological type (reference: acral lentiginous) | ||
| Superficial spreading | 0.846 (0.635-1.129) | 0.256 |
| Nodular | 1.700 (1.307-2.211) | < 0.005 |
| Lentigo maligna | 0.365 (0.091-1.464) | 0.155 |
| Ocular | 0.442 (0.367-0.533) | < 0.005 |
| Mucosal | 2.564 (2.139-3.074) | < 0.005 |
| Baseline BMI (reference: normal) | ||
| Underweight | 0.993 (0.643-1.532) | 0.973 |
| Overweight | 0.694 (0.575-0.837) | < 0.005 |
| Obese | 2.323 (1.984-2.719) | < 0.005 |
*Eastern Cooperative Oncology Group Performance Status.
Disclaimer/Publisher’s Note: The statements, opinions and data contained in all publications are solely those of the individual author(s) and contributor(s) and not of MDPI and/or the editor(s). MDPI and/or the editor(s) disclaim responsibility for any injury to people or property resulting from any ideas, methods, instructions or products referred to in the content. |
© 2025 by the authors. Licensee MDPI, Basel, Switzerland. This article is an open access article distributed under the terms and conditions of the Creative Commons Attribution (CC BY) license (http://creativecommons.org/licenses/by/4.0/).
Copyright: This open access article is published under a Creative Commons CC BY 4.0 license, which permit the free download, distribution, and reuse, provided that the author and preprint are cited in any reuse.


