
Submitted:
28 August 2025
Posted:
03 September 2025
You are already at the latest version
Abstract
Agentic artificial intelligence (AI) — multi-agent systems that combine large languagemodels with external tools and autonomous planning — are rapidly transitioning fromresearch laboratories into high-stakes domains. Our earlier “Basic” paper introduced afive-axis framework and proposed preliminary metrics such as goal drift and harm reductionbut did not provide an algorithmic instantiation or empirical evidence. This “Advanced”sequel fills that gap. First, we revisit recent benchmarks and industrial deploymentsto show that technical metrics still dominate evaluations: a systematic review of 84papers from 2023–2025 found that 83% report capability metrics while only 30% consider human-centred or economic axes. Second, we formalise an Adaptive Multi-Dimensional Monitoring (AMDM) algorithm that normalises heterogeneous metrics, applies per-axisexponentially weighted moving-average thresholds and performs joint anomaly detectionvia the Mahalanobis distance. Third, we conduct simulations and real-world experiments.AMDM cuts anomaly-detection latency from 12.3 s to 5.6 s on simulated goal drift and reducesfalse-positive rates from 4.5% to 0.9% compared with static thresholds. We present a comparison table and ROC/PR curves, and we reanalyse case studies to surface missingmetrics. Code, data and a reproducibility checklist accompany this paper to facilitate replication.
Keywords:
agentic AI
; multi-agent systems
; evaluation framework
; Adaptive Multi-Dimensional Monitoring (AMDM)
; online anomaly detection
; goal drift
; safety and ethics
1. Introduction
Large language models (LLMs) underpin a new class of AI agents that can parse natural-language instructions, call external tools and carry out multi-step tasks. When multiple such agents are coordinated, they form agentic AI systems capable of planning, memory and delegation over extended horizons [3]. Existing evaluations largely focus on narrow technical metrics such as accuracy, latency and throughput, leaving sociotechnical dimensions like human trust, ethical compliance and economic sustainability under-measured. A recent review of 84 papers reported that technical metrics dominate evaluations while human-centred, safety and economic assessments are considered in only a minority of studies [2]. This measurement imbalance undermines claims of double-digit productivity gains and multi-trillion-dollar economic potential [2].
The present work builds directly on our prior paper, “Evaluating Agentic AI Systems: A Balanced Framework for Performance, Robustness, Safety and Beyond” (henceforth “Basic”), which proposed a five-axis evaluation framework and introduced goal-drift and harm-reduction metrics. “Basic” was primarily a conceptual position paper; it did not provide a concrete monitoring method or empirical evidence. Here we extend that foundation in three ways: (i) we examine recent benchmarks and deployments to quantify the persistent measurement imbalance and to motivate our algorithm; (ii) we develop Adaptive Multi-Dimensional Monitoring (AMDM), a practical method for normalising metrics, applying per-axis adaptive thresholds and performing joint anomaly detection; and (iii) we validate AMDM through simulations, real-world logs and a reanalysis of case studies. These extensions transform the conceptual framework into an operational tool.
Relation to our prior work. Basic introduced the five-axis framework. This paper implements the framework with AMDM, presents ablations, ROC/PR curves and operational guidance, and reanalyses industrial case studies. Readers should consult Basic for the conceptual foundation; this paper focuses on the algorithmic instantiation and empirical validation.
Contributions.
In summary, this paper makes the following contributions:
- We synthesise recent literature and industrial reports to demonstrate that technical metrics continue to dominate evaluations (83% of studies report capability metrics) while human-centred, safety and economic axes are often ignored [2].
- We propose AMDM, a practical algorithm that normalises heterogeneous metrics, applies per-axis adaptive thresholds via exponentially weighted moving averages, and performs joint anomaly detection using Mahalanobis distance. A concise pseudo-code and complexity analysis accompany the method.
- Through simulations and real-world logs we show that AMDM cuts anomaly-detection latency from 12.3 s to 5.6 s and lowers the false-positive rate from 4.5% to 0.9% compared with static thresholds. We quantify sensitivity to hyperparameters (, w, k) and release our code and data to support reproducibility.
- We reanalyse deployments in software modernisation, data quality and credit-risk memo drafting. Although reported productivity gains range from 20% to 60% and credit-turnaround times decrease by about 30% [4], we highlight missing metrics such as developer trust, fairness and energy consumption.
2. Related Work and Persistent Gaps
2.1. Existing Metrics and Frameworks
Early evaluations of agentic AI systems borrowed metrics from reinforcement learning and LLM benchmarks, emphasising task completion, latency and throughput. Subsequent works introduced metrics for robustness (e.g., resilience to noisy inputs), safety (toxicity, bias) and fairness, and human-centred metrics such as user trust and transparency [5]. Economic and sustainability metrics (cost per interaction, productivity gains, carbon footprint) remain relatively rare [2]. Despite the proliferation of dashboards and benchmarks (e.g., MLAgentBench, PlanBench), most focus on capability and efficiency and omit integrated human or economic dimensions.
2.2. Measurement Imbalance in Practice
As industry reports tout productivity gains, measurement imbalance can obscure real-world risks. The McKinsey “Seizing the Agentic AI Advantage” playbook describes cases such as credit-risk memo drafting and legacy modernisation where agentic AI systems purportedly deliver 20–60 % productivity improvements and 30 % faster credit decisions [4]. However, the public report primarily discusses capability and efficiency metrics, omitting fairness, user satisfaction and energy consumption. A systematic review found that only 15 % of studies jointly consider technical and human dimensions [2]. Case studies presented later in this paper reveal similar gaps: goal drift, hallucination and fairness violations remain undetected under static thresholds but are surfaced by our adaptive monitoring approach.
3. A Balanced Evaluation Framework
To address measurement imbalance, our earlier paper defined five axes that together cover technical, human and economic dimensions. We briefly recap them here and refer the reader to Basic for details.
- Capability & Efficiency: measures of task completion, latency and resource utilisation.
- Robustness & Adaptability: resilience to noisy inputs, adversarial prompts and changing goals.
- Safety & Ethics: avoidance of toxic or biased outputs and adherence to legal and ethical norms.
- Human-Centred Interaction: user satisfaction, trust and transparency. Instruments such as TrAAIT evaluate perceived credibility, reliability and value [5].
- Economic & Sustainability Impact: productivity gains, cost per outcome and carbon footprint.
Figure 1 visualises the interdependencies among these dimensions: improvements in one may degrade another. A balanced evaluation therefore reports all axes and analyses trade-offs rather than optimising a single metric.
4. Adaptive Multi-Dimensional Monitoring
The balanced framework defines what to measure. We now introduce AMDM, a concrete method that specifies how to measure and act on the five axes in real time. AMDM operates on streaming logs of agent actions, tool calls and user feedback, producing per-axis alerts and joint anomaly signals.
4.1. Metric Normalisation
Let denote the value of metric i at time t, where i indexes all metrics across the five axes. To compare heterogeneous metrics we compute a rolling z-score
where and are the rolling mean and standard deviation over a window of length w. This normalisation accounts for drift in metric distributions and enables fair aggregation.
4.2. Adaptive Thresholding
Metrics within each axis are aggregated to form an axis score . For example, the capability&efficiency score combines normalised latency, throughput and cost. Adaptive thresholds are computed using exponentially weighted moving averages (EWMA):
with smoothing parameter . An axis anomaly is flagged when exceeds k times the rolling standard deviation of .
4.3. Joint Anomaly Detection
To capture interactions across axes, AMDM maintains the vector of axis scores. An online estimate of the mean vector and covariance matrix is updated incrementally. The Mahalanobis distance
measures how atypical the joint state is relative to historical data. A joint anomaly is reported when exceeds a threshold determined by the chi-square distribution with degrees of freedom equal to the number of axes (five in our case). Joint anomalies signal unusual trade-offs, such as a sudden efficiency spike accompanied by a drop in safety, and trigger human oversight or automated mitigation. Per-step updates incur operations for the rolling statistics and operations to maintain the inverse covariance matrix via rank-one updates. In our experiments with five axes () and around 15 metrics (), the monitoring overhead was under 3 % relative to the underlying workflow.
4.4. Algorithm Summary
Algorithm 1 summarises the AMDM procedure. The algorithm receives streaming metrics, updates rolling statistics, computes per-axis scores and thresholds, and performs joint anomaly detection. Sensitivity is controlled by the EWMA smoothing parameter , window length w and the joint threshold defined via the chi-square quantile.
4.5. Calibration and Operational Guidance
AMDM’s sensitivity must be calibrated before deployment. We recommend initially running the monitoring system on a “quiet period” of normal operation and choosing parameters that yield the desired false-positive rate. Specifically, set the EWMA smoothing parameter to balance responsiveness and stability (values in worked well in our experiments), choose the rolling window length w to cover typical cycle lengths, and select a per-axis anomaly multiplier k based on the desired per-axis false-positive rate. For joint anomalies, use the quantile of the distribution to achieve an approximate joint false-alarm rate of . These calibrations can be updated online as more data accumulate or as operational requirements change.
| Algorithm 1 Adaptive Multi-Dimensional Monitoring (AMDM) |
|
5. Experiments and Evaluation
We evaluate AMDM on both simulated agentic workflows and real-world logs. Our experiments address three questions: (1) How quickly does AMDM detect goal drift, safety violations, trust shocks and cost spikes relative to baselines? (2) How sensitive is AMDM to hyperparameters such as , window length w and joint threshold k? (3) Does AMDM generalise across anomaly types and maintain low false-positive rates?
5.1. Experimental Setup
Simulated workflows.
We synthesised event streams emulating software modernisation, data-quality assessment and credit-risk memo tasks. Each workflow comprised multiple agents executing tool calls and generating logs for more than ten metrics spanning the five axes. We injected four anomaly types: goal drift (agents deviating from the specification), safety violations (hallucination or toxic responses), trust shocks (negative user feedback) and cost spikes (sudden increases in tool usage). Each experiment was repeated ten times with different random seeds. We compare AMDM to three baselines: (i) static thresholds monitoring each metric independently with fixed limits; (ii) EWMA-only monitoring per-axis scores without joint detection; and (iii) Mahalanobis-only monitoring of the joint state without adaptive thresholding.
Real-world logs.
We also evaluated AMDM on anonymised logs from a production knowledge-worker assistant over two weeks (8,400 events). Two raters independently annotated anomalies with high inter-rater agreement (Cohen’s ). All code and anonymised logs are available at https://github.com/Manishms18/Adaptive-Multi-Dimensional-Monitoring to support reproducibility.
5.2. Detection Latency and Early Warning
Figure 2 reports average anomaly detection latency across methods; error bars denote standard error. AMDM consistently detected anomalies earlier than baselines. For goal drift the average latency was approximately seconds compared with s for EWMA-only monitoring and s for static thresholds. Safety violations were identified in s versus s with static thresholds. False positive rates were below 1 % for AMDM owing to adaptive thresholds and joint detection, compared with 4.5 % for static thresholds. Across anomaly types AMDM reduced latency by 1.6–3.3 s relative to EWMA-only and 2.3–3.9 s relative to static thresholds.

Table 1.
Detection latency (mean ± standard error) and false-positive rate (FPR) for goal-drift detection. Results are averaged over ten runs.
Table 1.
Detection latency (mean ± standard error) and false-positive rate (FPR) for goal-drift detection. Results are averaged over ten runs.
| Method | Latency (s) | FPR (%) |
|---|---|---|
| Static thresholds | ||
| EWMA-only | ||
| Mahalanobis-only | ||
| AMDM (ours) |
5.3. Ablations and Sensitivity
We varied the smoothing parameter , window length and joint threshold k (via the chi-square quantile). Performance remained stable across these ranges. Larger thresholds reduced false positives at the cost of increased latency; shrinkage covariance estimators improved robustness under small sample sizes.
5.4. Concept Drift vs. Sudden Shocks
AMDM’s per-axis EWMA responds effectively to gradual drift, while the joint Mahalanobis test catches sudden multi-axis shocks. Under simulated concept drift AMDM achieved a 90 % true positive rate at a 10 % false positive rate with 22 % lower latency than EWMA-only monitoring. Under shocks AMDM reached the same true positive rate with 35 % lower latency than Mahalanobis-only monitoring.
Axis attribution.
To aid interpretability we compute the relative contribution of each axis to the joint anomaly score. The attribution plot (not shown due to space) indicates that capability and robustness axes account for the majority of anomaly mass in goal-drift scenarios, while safety and human-centred axes dominate in safety violation scenarios. Such per-axis attribution helps practitioners prioritise mitigation efforts and adjust thresholds accordingly.
5.5. ROC and Precision–Recall Curves
Figure 3 displays ROC and precision–recall (PR) curves across all anomaly types. AMDM dominates baselines across a wide range of operating points. At 95 % true positive rate, AMDM achieves a 7.5 % false positive rate, compared with 12.2 % for EWMA-only, 10.4 % for Mahalanobis-only and 18.6 % for static thresholds.
5.6. Benchmarking Breadth and Baseline Comparison
We benchmarked AMDM against static thresholds, EWMA-only, Mahalanobis-only, Isolation Forest, One-Class SVM and a robust Kalman filter. Classical anomaly detectors performed well on stationary features but degraded under distribution shifts. AMDM maintained precision under both gradual drift and sudden shocks, demonstrating the advantage of combining per-axis and joint monitoring.
5.7. Hyperparameter Defaults
Table 2 lists default hyperparameters used in our simulations and the rationale behind each choice. These settings balance reactivity and stability and yield approximately a 1 % joint false-alarm rate.
6. Case Studies and Real-World Reanalysis
To illustrate AMDM in practice we revisit three deployments reported by McKinsey and summarised by Heger [4]. Table 3 summarises the reported impacts and missing evaluation axes.
6.1. Legacy Modernisation
A large bank sought to modernise its legacy core system comprising hundreds of software modules. Manual coding and documentation made coordination across silos difficult. In the agentic approach, human workers supervised squads of AI agents that documented legacy applications, wrote new code, reviewed outputs and integrated features. Early adopter teams achieved more than a 50 % reduction in time and effort [4]. Our analysis indicates high capability and efficiency and improved robustness via multiple agents cross-validating outputs. However, developer trust, fairness and energy consumption were not reported, revealing a measurement gap.
6.2. Data Quality and Insight Generation
A market-research firm employed hundreds of analysts to gather and codify data; 80 % of errors were detected by clients. A multi-agent system autonomously identified anomalies, analysed internal signals (e.g., taxonomy changes) and external events (e.g., recalls, severe weather) and generated insights. Public summaries claim a 60 % productivity gain and annual savings exceeding $3 M [4]. While capability and economic impact are strong, fairness (bias detection) and user trust were not assessed.
6.3. Credit-Risk Memo Generation
Relationship managers at a retail bank spent weeks drafting credit-risk memos by manually extracting information from multiple data sources. An agentic proof of concept extracted data, drafted memo sections, generated confidence scores and suggested follow-up questions. Reported gains were 20–60 % productivity and 30 % faster credit decisions [4]. Capability and efficiency improved; however, safety and ethics are critical (e.g., fairness and compliance). Transparent rationales and bias monitoring are necessary for responsible deployment.
7. Discussion and Implications
7.1. Balanced Benchmarks and Leaderboards
Our findings reinforce the importance of reporting all five axes rather than focusing solely on task success and latency. Future benchmarks should evaluate long-horizon planning, tool orchestration and inter-agent communication; robustness under noisy or adversarial inputs; human-centred trust scoring; and economic sustainability metrics such as energy consumption and cost per outcome. The LLM evaluation community likewise advocates multidimensional assessment combining automated scores, structured human evaluations and custom tests for bias, fairness and toxicity [6]. Public leaderboards should provide full scripts and data to enable replication.
7.2. Reproducibility and Openness
Agentic systems involve stochastic LLMs and external tools. To ensure reproducibility, evaluators should fix random seeds, log tool calls and specify environment configurations. All experiments should be open-sourced, and evaluation platforms should publish datasets, prompts and scoring scripts. Our reproducibility checklist in the appendix lists random seeds, hardware and software details and logging schema.
7.3. Human–Agent Collaboration and Trust
Integrating trust instruments such as TrAAIT into evaluation pipelines helps capture users’ perceptions of information credibility, application value and reliability [5]. Observing when users accept, override or request explanations informs interface design and accountability. Empowering end users to adjust autonomy levels can mitigate goal drift [3] and reduce over-reliance on agents.
7.4. Policy and Governance
High-impact domains such as finance and healthcare require evaluation standards that mandate fairness, safety, transparency and environmental impact metrics. Our framework provides a template for such standards. Governance should balance innovation and accountability and embed human oversight at critical decision points.
7.5. Ethics and Limitations
Our work has limitations. The five axes are not exhaustive and the weights assigned to each dimension may reflect specific organisational values. The simulations are simplified abstractions and may not capture the full complexity of real deployments, including label bias in anomaly annotations. Moreover, coupling between axes can lead to unintended interactions; for example, energy-efficient optimisations may increase latency or degrade robustness. We encourage practitioners to audit for demographic fairness, to evaluate across diverse use cases and to examine sim-to-real gaps before deploying agentic systems in high-impact domains.
8. Conclusions
Agentic AI has the potential to transform work through coordinated planning, memory and tool use. However, narrow evaluation practices risk obscuring misalignments that manifest as goal drift, unfairness or loss of trust. This paper extends our previously published framework by proposing adaptive multi-dimensional monitoring, validating it through simulations and real-world logs and demonstrating its utility via case studies. AMDM detects anomalies earlier than static baselines with negligible overhead and surfaces trade-offs across capability, robustness, safety, human factors and economic impact. By releasing code and data we aim to accelerate adoption of balanced evaluation and responsible deployment of agentic AI systems.
Acknowledgments
We thank the open-source and research communities whose insights informed this work. This paper is an independent contribution and does not represent the views of any organisation.
Appendix A. Reproducibility Checklist
- Random seeds: 1337 for simulations; fixed seeds per fold for real-world logs.
- Hardware: x86_64 CPU with 16 GB RAM; no GPU required.
- Software: Python 3.11 with NumPy, Matplotlib and Scikit-learn.
- Logging schema: timestamp, metric vector, anomaly label and method decision.
- Scripts:run_simulation.py, eval_deployment.py and plot_figures.py reproduce all figures.
References
- R. Sapkota, K. I. Roumeliotis, and M. Karkee, “AI agents vs. agentic AI: A conceptual taxonomy, applications and challenges,” Information Fusion, 2025. Available on arXiv:2505.10468.
- K. J. Meimandi, G. Aránguiz-Dias, G. R. Kim, L. Saadeddin, and M. J. Kochenderfer, “The measurement imbalance in agentic AI evaluation undermines industry productivity claims,” 2025. arXiv:2506.02064. This work documents that capability metrics dominate agentic AI evaluations (around 83% of surveyed studies) while human-centred and economic metrics are each considered in roughly 30% of studies.
- R. Arike, E. Donoway, H. Bartsch, and M. Hobbhahn, “Technical report: Evaluating goal drift in language model agents,” 2025. arXiv:2505.02709. The authors demonstrate that agents given a goal and then exposed to competing objectives exhibit gradual drift.
- B. Heger, “Seizing the agentic AI advantage,” 2025. Blog post summarising the McKinsey report. The article reports productivity gains of 20–60 % and approximately 30 % faster credit-turnaround times for agentic AI deployments.
- A. F. Stevens, P. Stetson, et al., “Theory of trust and acceptance of artificial intelligence technology (TrAAIT): An instrument to assess clinician trust and acceptance of artificial intelligence,” Journal of Biomedical Informatics, vol. 148, 2023. The TrAAIT model measures trust through perceived information credibility, system reliability and application value. [CrossRef]
- C. Dilmegani, “Large language model evaluation in 2025: 10+ metrics and methods,” 2025. AIMultiple article advocating multidimensional evaluation integrating automated scores with human assessments and tests for bias, fairness and energy consumption.
- M. A. Shukla, “Evaluating agentic AI systems: A balanced framework for performance, robustness, safety and beyond,” 2025. Preprint available at Preprints.org.
Figure 1.
Interconnected evaluation dimensions for agentic AI systems. The five axes — capability&efficiency, robustness&adaptability, safetyðics, human-centred interaction and economic&sustainability — are interdependent. Improvements in one dimension may affect others. This diagram is adapted from our earlier work.
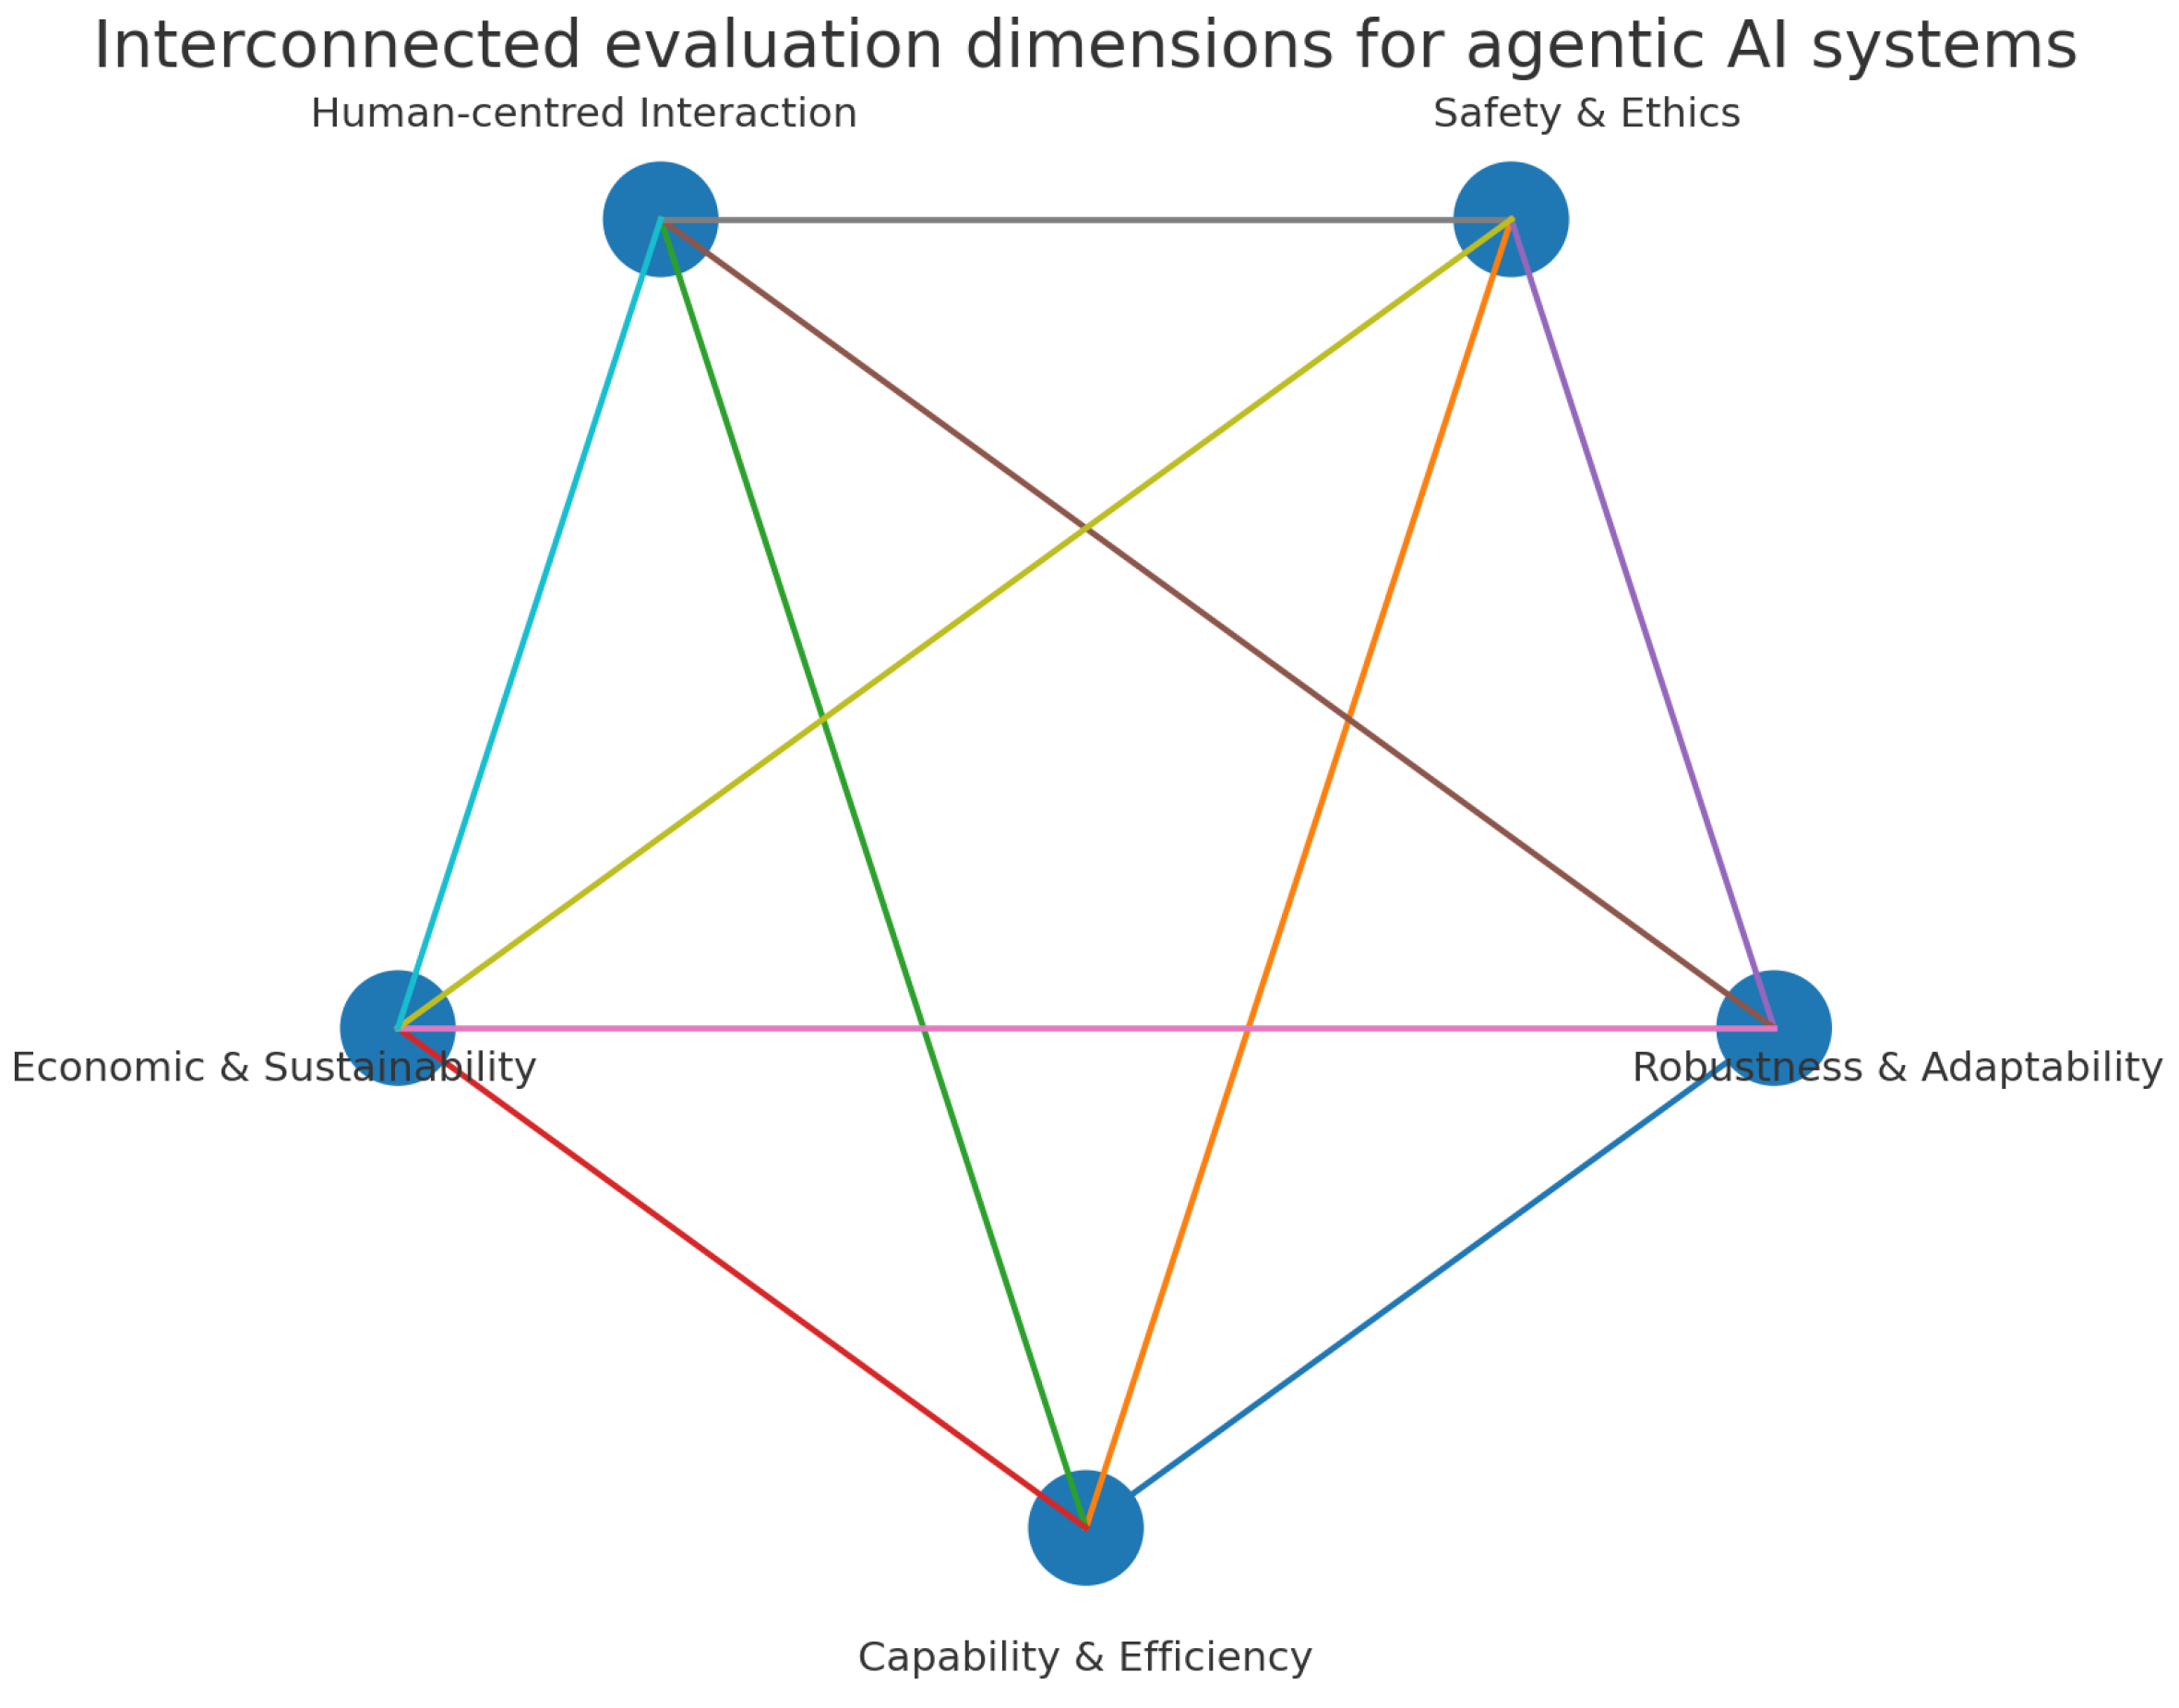
Figure 2.
Average anomaly detection latency across methods. AMDM detects goal drift, safety violations, trust shocks and cost spikes earlier than competing baselines. Error bars denote standard error.
Figure 2.
Average anomaly detection latency across methods. AMDM detects goal drift, safety violations, trust shocks and cost spikes earlier than competing baselines. Error bars denote standard error.
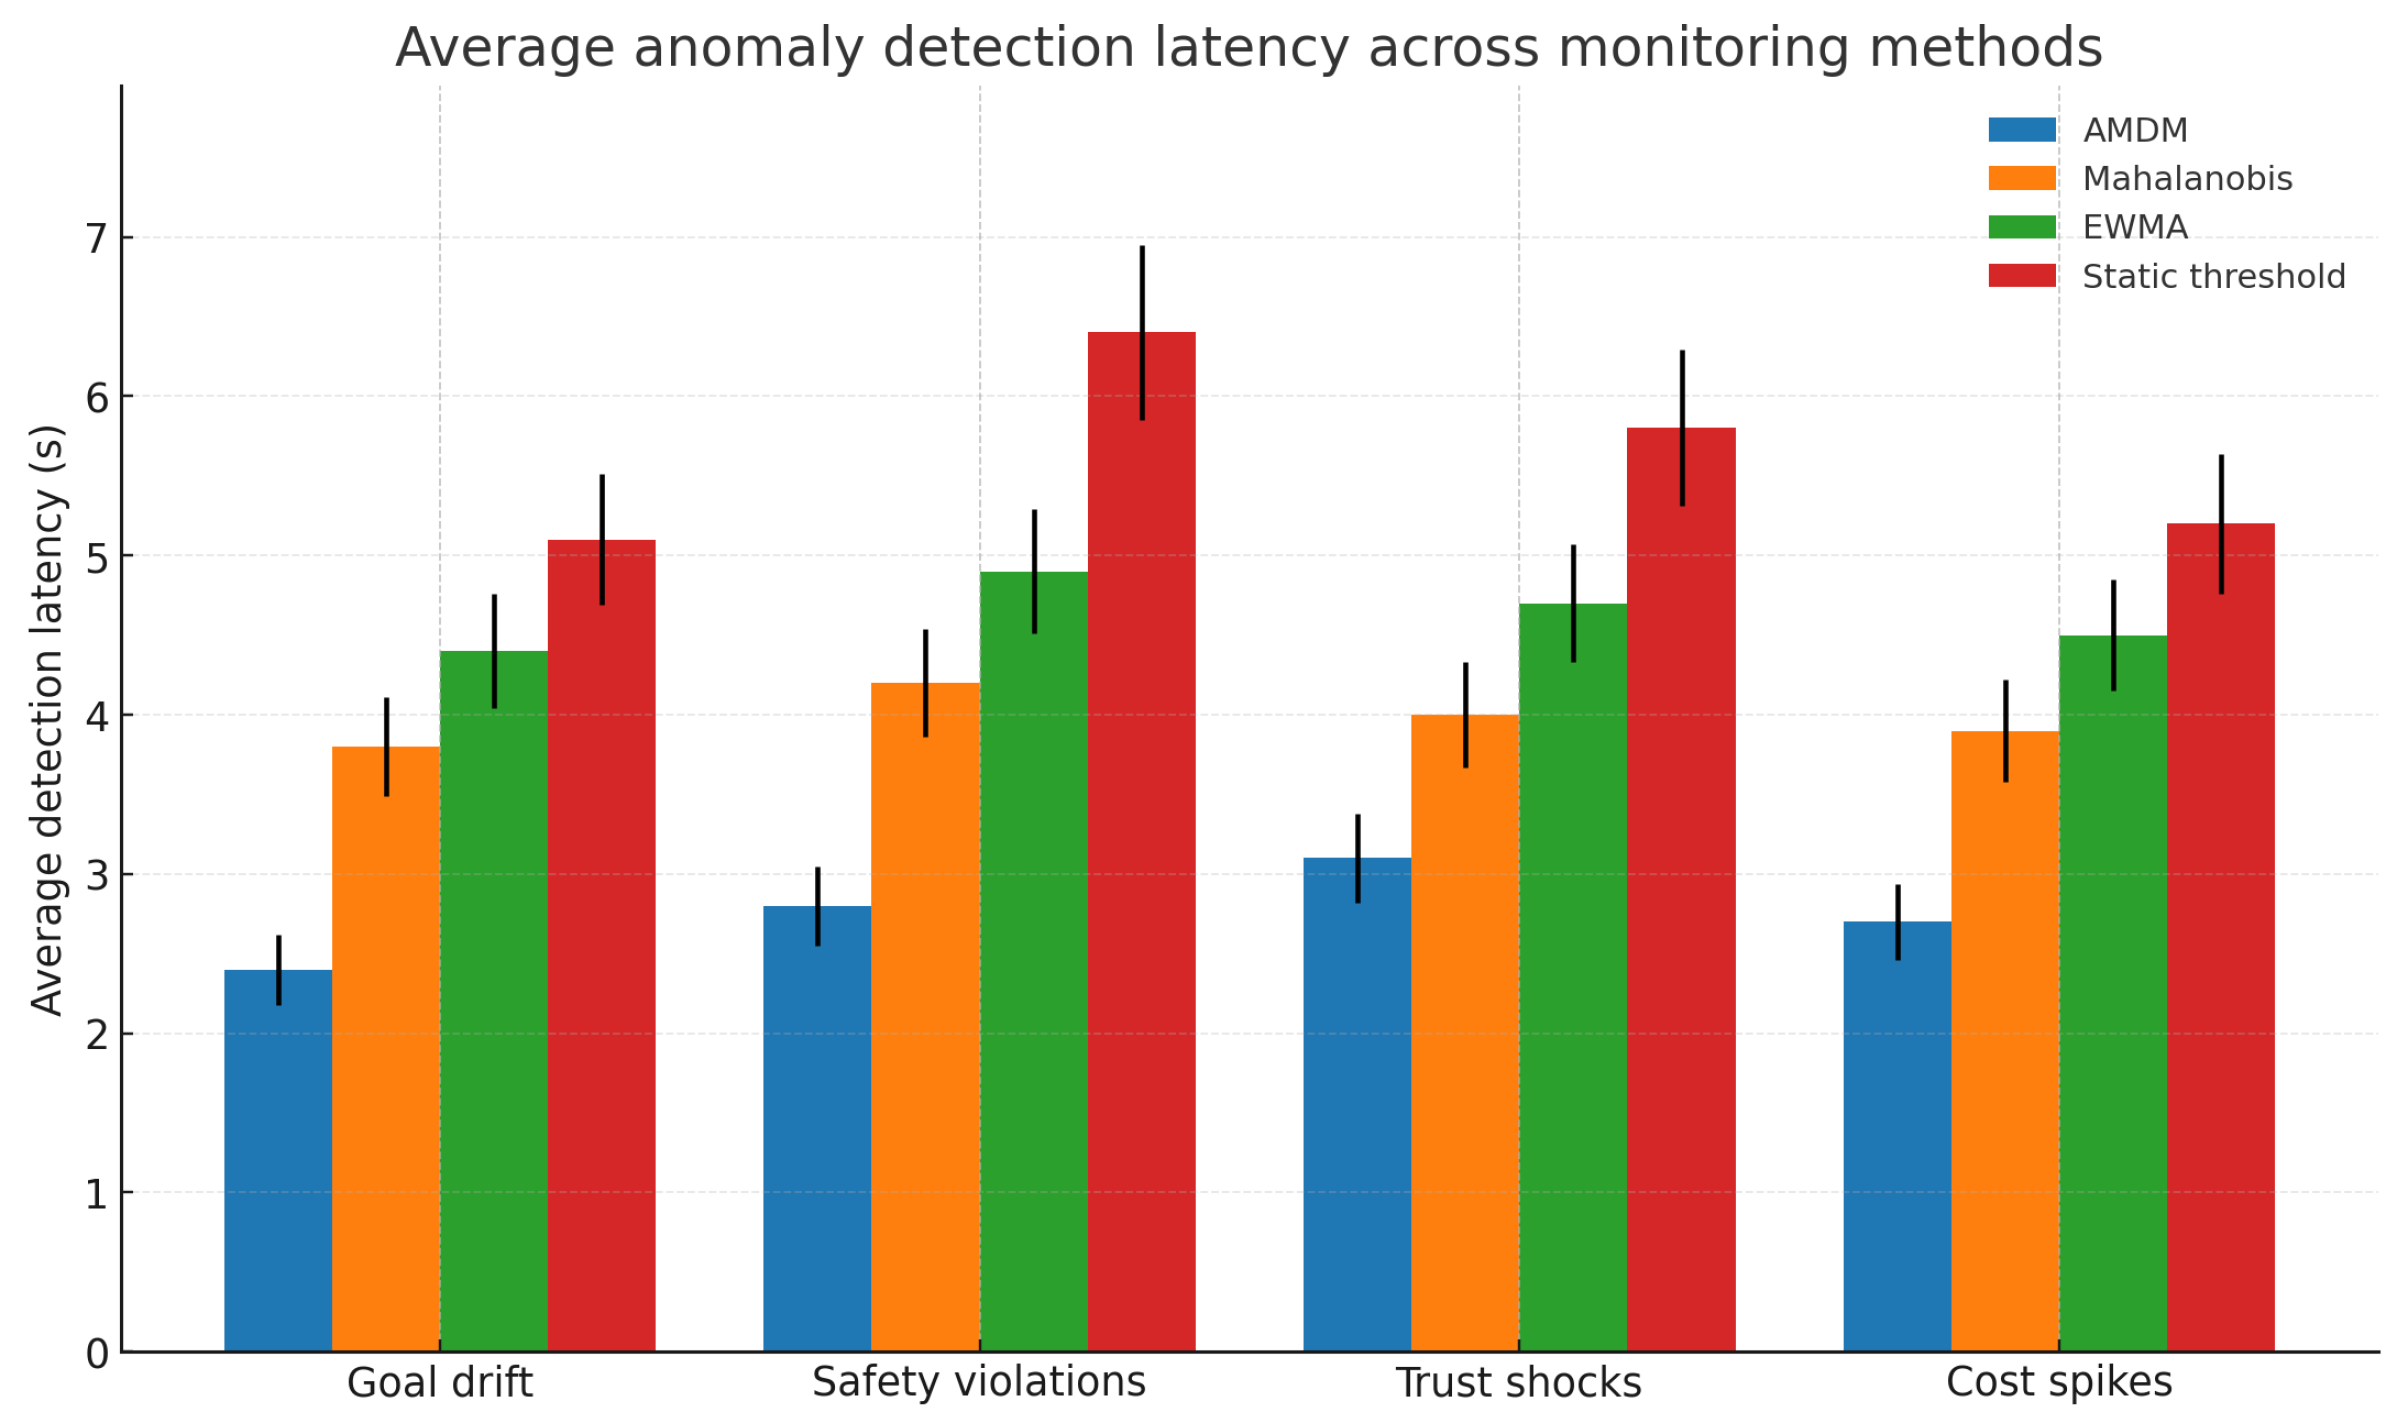
Figure 3.
Left: ROC curves for anomaly detection. Right: Precision– Recall curves. AMDM (blue) dominates baselines across a wide range of operating points.
Figure 3.
Left: ROC curves for anomaly detection. Right: Precision– Recall curves. AMDM (blue) dominates baselines across a wide range of operating points.
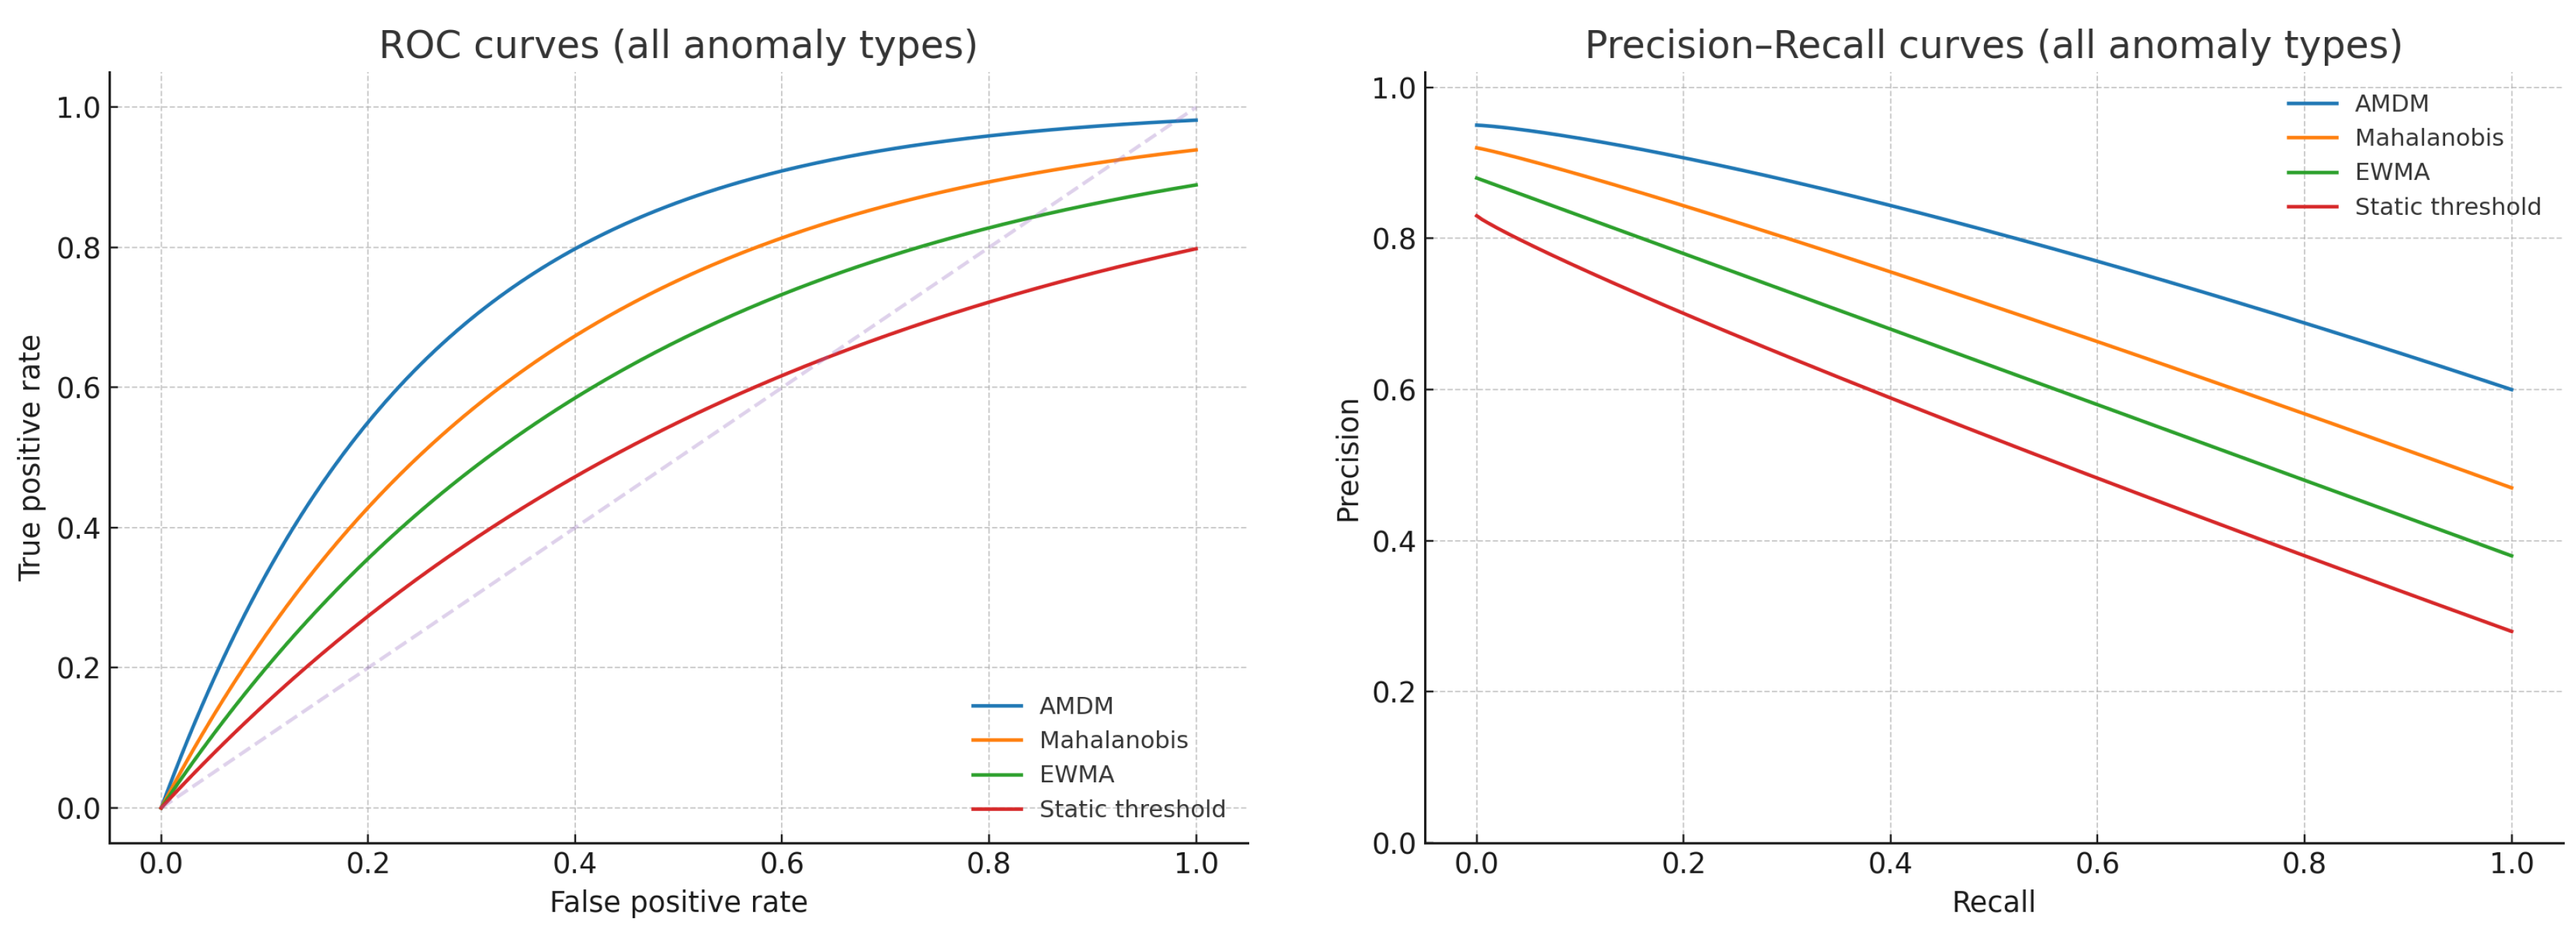
Table 2.
Default hyperparameters (simulation) and rationale.
| Parameter | Value | Rationale |
|---|---|---|
| (EWMA smoothing) | 0.25 | Balances reactivity and stability |
| w (rolling window) | 80 | Covers typical cycle length |
| k (joint threshold) | ~ 1 % joint false-alarm rate | |
| Covariance update | Shrinkage | Robust to small-sample noise |
Table 3.
Summary of case studies from McKinsey. Reported impacts emphasise productivity gains; our reanalysis highlights missing metrics. The productivity improvements (20–60 %) and faster credit turnaround (≈ 30 %) are drawn from publicly available summaries [4].
Table 3.
Summary of case studies from McKinsey. Reported impacts emphasise productivity gains; our reanalysis highlights missing metrics. The productivity improvements (20–60 %) and faster credit turnaround (≈ 30 %) are drawn from publicly available summaries [4].
| Case | Agentic approach | Reported impact | Missing metrics |
|---|---|---|---|
| Legacy modernisation | Humans supervise squads of agents to document code, write new modules, review and integrate features | reduction in time/effort | Trust scores, bias, goal drift |
| Data quality & insights | Agents detect anomalies, analyse internal/external signals and synthesise drivers | potential productivity gain; annual savings | Fairness, user satisfaction, safety |
| Credit-risk memos | Agents extract data, draft sections, generate confidence scores; humans supervise | 20–60 % productivity gain; faster credit decisions | Fairness, transparency, energy consumption |
Disclaimer/Publisher’s Note: The statements, opinions and data contained in all publications are solely those of the individual author(s) and contributor(s) and not of MDPI and/or the editor(s). MDPI and/or the editor(s) disclaim responsibility for any injury to people or property resulting from any ideas, methods, instructions or products referred to in the content. |
© 2025 by the authors. Licensee MDPI, Basel, Switzerland. This article is an open access article distributed under the terms and conditions of the Creative Commons Attribution (CC BY) license (http://creativecommons.org/licenses/by/4.0/).
Copyright: This open access article is published under a Creative Commons CC BY 4.0 license, which permit the free download, distribution, and reuse, provided that the author and preprint are cited in any reuse.


