Submitted:
27 August 2025
Posted:
29 August 2025
You are already at the latest version
Abstract
Remote sensing has emerged as an essential method for geological mapping, especially in complex environments such as the Mediterranean region. This review describes the recent progress in passive and active remote sensing utilized for geological mapping applications. It highlights sensor functionalities, the integration of data with GIS, and case studies from various geotectonic environments in Mediterranean. Furthermore, the review presents methodological trends, possible data constraints and the application of machine learning techniques. The findings illustrate the non-invasive nature of remote sensing in improving geological mapping, aiming in sustainable resource management and in mineral exploration within the diversity of the Mediterranean’s geological context.
Keywords:
remote sensing
; geological mapping
; machine learning
; InSAR
; mediterranean region
; critical raw materials
; mining exploration
1. Introduction
The Mediterranean region, located where the African plate subducts under the Eurasiatic plate, is a geological puzzle characterized by active deformation processes, a variety of lithologies, and an extensive history of tectonic and volcanic activity. To understand the regional geodynamic framework, the distribution of natural resources and the hazard assessment, mapping, and frequent monitoring of these geological features and processes are critical. Although conventional field-based geological surveys are still essential for ground-truth validation, remote sensing technologies have increasingly become a state-of-the-art tool for digital geological mapping. The capacity of satellite sensors to obtain repetitive and multiscale observations has revolutionized the detection, analysis, and interpretation of geological features of the complex Mediterranean geology. Many of the strategic minerals emphasized in the European Union’s Raw Materials (CRM) Act (http://data.europa.eu/eli/reg/2024/1252/oj) are found in environments with the complexity of the Mediterranean region. Geological mapping using Remote Sensing (RS) applications plays a primary role in supporting a secure, stable, and sustainable supply chain of strategic minerals by enabling more efficient identification and monitoring in areas enriched by these minerals.
One of the most widely used techniques in satellite-based geological mapping is pixel-based methods, which categorize land cover according to the spectral response of each single pixel. Traditional methods encompass Spectral Indices (SIs) [1,2,3]- such as the Normalized Difference Vegetation Index (NDVI), the Iron Oxide Spectral Index (IOSI), the Normalized Hydrothermal Alteration Spectral Index (NHASI) - which are usually obtained from multispectral data (e.g., Landsat, Sentinel-2, ASTER) to identify specific surface materials representatives.
In addition, the importance of subpixel methods [4,5,6,7,8] has increased significantly, particularly in heterogeneous or geologically complex regions, such as the Mediterranean, where one single pixel could contain various types of land cover or mineral compositions. Imaging spectroscopy (IS) is another Remote Sensing technique applied mainly on hyperspectral sensors like PRecursore IperSpettrale della Missione Applicativa (PRISMA), Environmental Mapping and Analysis Program (EnMAP), or the future NASA Surface Biology and Geology (SBG) mission. The IS technique applied to hyperspectral data delivers high-spectral-resolution thematic maps that facilitate the detection of minerals and alteration zones at the subpixel level. A state-of-the-art subpixel technique is Spectral Unmixing (SU), which mathematically calculates the abundance of a set of endmembers (pure spectral signatures) within a mixed pixel. SU is able to quantify the relative abundances and produce more accurate mineralogical maps in areas like the Mediterranean region, where the variability on the chemical composition of the terrains is extremely high.
The latest advancement in machine learning (ML) and satellite image analysis has enhanced the efficiency of both pixel-based and sub-pixel techniques for geological mapping. Supervised classification techniques, including support vector machines (SVM), random forests (RF), and advanced deep learning models (Deep-L), such as convolutional neural networks (CNNs) [9,10,11,12,13,14], are extensively utilized to automate lithological classification, tectonic feature analysis, and hydrothermal alteration identification [15,16,17]. These algorithms are ideal for Big Data handling, such as large amounts of satellite data across various spatial scales, utilizing both multispectral and hyperspectral information.
Complementing passive RS methods, active RS technologies such as Synthetic Aperture Radar (SAR) and Interferometric Synthetic Aperture Radar (InSAR) techniques [18,19] can provide information on the tectonic structures and the active surface information of active tectonic environments like the Mediterranean region. SAR is an all-weather system and is not affected by daylight conditions like the passive satellite sensors.
In the above-mentioned methods, the results are often verified through targeted field campaigns, which both validate the precision of RS results and enhance the reliability of classification models. In addiction, laboratory-based mineralogical analysis of field collected samples complements in-situ geological mapping. Techniques such as X-ray diffraction (XRD), electron microscopy (SEM, EPMA) and Raman spectroscopy provide important ground truth data [20] for the validation of the mineral spectral signatures collected with RS techniques.
Subsequently, the combination of RS products with current digitized geological maps, geophysical information, and field observations on Geographic Information System (GIS) platforms [21] facilitates the multi-layered spatial analysis and improves more comprehensive geological interpretations for decision makers and regional authorities. This review article a) explores the latest developments in RS applications for geological mapping in the Mediterranean region (Figure 1), b) highlights new trends in pixel-based and sub-pixel methods on passive satellite sensors and InSAR on active satellite sensors and c) reveals possible data constraints on the application of ML techniques for satellite image analysis.
2. Methods
To fully understand the state-of-the-art and future developments of Remote Sensing applications for geological mapping, a critical assessment of the main methodologies based on satellite imagery, InSAR and GIS are reported in Table 1 and discussed below. Pixel-based and sub-pixel methods on passive satellite sensors and InSAR on active satellite sensors are also presented, including the emerging application of ML techniques for satellite image analysis (Table 2).
2.1. Satellite Data Acquisition and Preprocessing
Recent advances in remote sensing have enabled the effective use of various satellite datasets for geological and mineral exploration, particularly in lithological and hydrothermal alteration mapping. A range of multispectral sensors, including Landsat-8 Operational Land Imager (OLI), ASTER (Advanced Spaceborne Thermal Emission and Reflection Radiometer), and Sentinel-2 MultiSpectral Instrument (MSI), have been widely adopted due to their diverse spectral resolutions and spatial coverages. For example, Bentahar et al. [22] compared these three data sets in the Rich area of the Central High Atlas, Morocco, highlighting the superior performance of Sentinel-2A for lithological discrimination, largely due to its higher spatial resolution (10–20 m) and broad spectral range. Similarly, Shebl et al. [23] demonstrated that integrating Sentinel-2 with airborne gamma-ray data significantly improved the accuracy of lithological classification when applying supervised machine learning techniques, such as support vector machines (SVM).
Pre-processing plays a critical role in ensuring the reliability and comparability of satellite datasets before their application in geological analysis. Common preprocessing steps include radiometric calibration, atmospheric correction (e.g., using Sen2Cor for Sentinel-2), geometric correction, and resampling to harmonize spatial resolutions across datasets. Spectral unmixing techniques were applied effectively to ASTER, Landsat-8 OLI, and Sentinel-2 MSI data in the volcanic area of Nisyros (Greece)[4]. This study emphasized the importance of careful preprocessing to reduce noise and improve the signal-to-noise ratio when mapping hydrothermal alteration minerals, particularly in heterogeneous and rugged terrains. These preprocessing steps are fundamental to generating accurate reflectance data and reliable mineral indices for remote sensing applications.
In addition to optical and thermal sensors, radar data have become increasingly important in hydrothermal alteration studies. Sentinel-1 synthetic aperture radar (SAR) data, for example, offers valuable information on surface coherence and deformation. Multi-temporal interferometric coherence analysis was applied using Sentinel-1 to detect surface changes associated with hydrothermal activity on Nisyros Island [18]. Preprocessing of SAR data — such as co-registration, noise filtering, and coherence computation, is essential for meaningful analysis. Furthermore, Tompolidi et al. [15] utilized ASTER’s thermal infrared bands to correlate surface temperature anomalies with known alteration zones, reinforcing the value of multi-sensor data usage.
Hyperspectral satellite missions such as EnMAP (Environmental Mapping and Analysis Program) and PRISMA (PRecursore IperSpettrale della Missione Applicativa) represent a significant advancement in Earth observation for geological applications, offering detailed spectral resolution across hundreds of contiguous bands. EnMAP, as described by Guanter et al. [24], provides high-reliability imaging spectroscopy data designed specifically for Earth’s surface characterization, making it suitable for mineralogical and lithological studies. PRISMA, developed by the Italian Space Agency (ASI), has been increasingly used in mineral mapping and the detection of alteration zone due to its hyperspectral capabilities and moderate spatial resolution (30 m), as outlined by[25,26]. Alicandro et al. [27] demonstrated the effectiveness of PRISMA in mapping mineral assemblages in various geological settings in Italy, with preprocessing workflows including radiometric calibration, atmospheric correction (e.g., using ATCOR or FLAASH), and spectral subsetting to optimize mineral detection. Similarly, Sorrentino et al. [28] processed PRISMA data to delineate hydrothermal alteration zones in complex ore systems in the Chilean Andes, emphasizing the value of advanced preprocessing to correct for topographic and atmospheric distortions in mountainous terrain.
Furthermore, comparisons between PRISMA and multispectral sensors like Sentinel-2 underscore the advantages of hyperspectral data for geological discrimination. A preliminary assessment between PRISMA and Sentinel-2 in archaeological applications [27] highlighted transferable insights relevant to geology, specifically, the superior capacity of PRISMA to resolve subtle spectral differences associated with mineralogical variation. These hyperspectral missions [29] require sophisticated pre-processing pipelines, often involving noise reduction, spectral smile correction, and end-member extraction to ensure accurate interpretation. As these missions mature, their high spectral fidelity will increasingly support precise mapping of alteration minerals, lithological boundaries, and compositional anomalies in diverse geological contexts.
Overall, robust pre-processing workflows tailored to each dataset are essential for maximizing the accuracy of geological interpretations in satellite-based remote sensing.
2.2. Pixel-Based Methods
Pixel-based methods are fundamental for multispectral and hyperspectral satellite image analysis for geological mapping and mineral exploration. These techniques operate at the level of individual pixels, utilizing their spectral signatures to classify surface materials based on their reflectance or emissivity properties. In multispectral imagery, pixel-based methods often involve the use of spectral indices and thresholding to improve and identify specific mineralogical or alteration features, such as iron oxides, clay minerals, and silicates [30]. In hyperspectral imagery, pixel-based analysis enables more detailed mineral discrimination by exploiting narrow and contiguous spectral bands to capture diagnostic absorption features. Techniques such as the Spectral Angle Mapper (SAM), Minimum Distance Classifier (MDC), and Spectral Feature Fitting (SFF), are commonly applied to match pixel spectra with known reference spectra from spectral libraries [31]. Despite their sensitivity to spectral variability and noise, pixel-based approaches remain widely used because of their simplicity, computational efficiency, and compatibility with both supervised and unsupervised classification methods.
2.2.1. Spectral Indices
In the Mediterranean region, satellite remote sensing has been widely applied to detect hydrothermal alteration zones and assess mineralization potential using spectral indices derived from multispectral and hyperspectral data. Spectral indices (SIs), particularly using ASTER and Landsat-8 (OLI) data, have been proved to be essential in mapping iron oxides, clay minerals, and silicification—key indicators of hydrothermal processes. For example, studies in the Tifraouine and M’sirda regions of northwestern Algeria used Landsat 8 OLI SIs such as (B4/B2), (B6/B5), and (B7/B5) to highlight iron oxide and hydroxyl-bearing minerals related to epithermal and sulfide deposits [32,33]. Similarly, Anifadi et al. [34] applied ASTER SIs including (B4/B2), (B5/B6), and (B7/B6) on Limnos Island, Greece, to effectively distinguish between argillitic, phyllitic, and propylitic alteration zones. These SIs enhance spectral features related to Fe+3 absorption and OH− and Al–OH vibrational modes, allowing for refined discrimination of alteration facies. Tompolidi et al. [4] expanded this approach by applying spectral unmixing techniques using ASTER, Landsat-8 OLI, and Sentinel-2 MSI data, demonstrating that integrated spectral analysis improves detection of subtle alterations in volcanic environments like in Nisyros.
The Iron Oxide Index (e.g., ASTER B2/B1 or Landsat B4/B2), Clay Mineral Index (e.g., ASTER B5/B7), and Ferric Iron Index have been frequently used to map hydrothermal systems and weathering processes in the Mediterranean region. A combination of iron oxide and hydroxyl-sensitive SIs with topographic derivatives (e.g., slope and elevation) has been used to map a variety of alteration zones on Lesvos Island. [35,36].
Furthermore, a novel degradation index was introduced by Chikhaoui et al. [2] by using ASTER’s shortwave infrared bands to assess land degradation in semi-arid Mediterranean catchments. In mineralized terrains of Egypt and Portugal, spectral indices such as (B4/B2), (B5/B6), were integrated with geophysical data to enhance the delineation of gold and antimony-rich alteration halos [37,38].
ASTER data have been successfully employed also in far east Mediterranean (Turkey) for mapping ophiolitic rocks in the Sivas Basin [39], evaporite minerals in central Anatolia [40], and lithological units in the Eastern Taurides [41]. Early applications of spectral analysis techniques also demonstrated the potential of satellite data to identify clay minerals [42]. Beyond lithological mapping, satellite spectral analysis has been used to evaluate tectonic activity by detecting mineral alterations along fault zones, such as the East Anatolian Fault [43], and to delineate hydrothermal alteration zones with hyperspectral EO-1 Hyperion data in Kösedağ [44]. Comparable approaches have been applied elsewhere in southeastern Europe, such as in Bulgaria where ASTER band ratios were tested for detecting hydrothermal alterations in the Panagyurishte ore region [45], in Kosovo for mineral prospecting using integrated remote sensing methods [46], and in North Macedonia where geophysical data were combined with multispectral imagery for predictive mapping of the East Vardar Ophiolite Zone [47]. Similarly, in western Europe, Sentinel-2 and ASTER data were combined to map lithological units in the Buëch area of southeastern France [48].
Moreover, the recent usage of the state-of-the-art PRISMA hyperspectral imagery - for SIs applications [28,49] — enabled precise mapping of mineralogical zones. PRISMA, because of its high spectral resolution, is able to capture narrow absorption features of specific alteration minerals that are not detectable by multispectral sensors. These examples underscore how proper selection of SIs tailored to the mineralogical and geological context is crucial for an effective geological mapping using passive remote sensing sensors throughout the Mediterranean.
2.2.2. Spectral Similarity-Based Techniques
Spectral similarity-based classification methods, such as Spectral Angle Mapper (SAM), Spectral Feature Fitting (SFF), and Minimum Distance Classifier (MDC), are widely used in remote sensing applications for geological mapping throughout the Mediterranean region. These methods compare the spectral signature of each pixel with known reference spectra (endmembers) to assess compositional similarity, enabling mineral and lithological discrimination even in complex terrains. SAM, in particular, has been proved to be robust in hydrothermal alteration and lithological mapping, as demonstrated in the Akarcay Basin (Turkey) using ASTER data [50] and in the Anti-Atlas Mountains (Morocco) using Landsat 8 OLI and ASTER imagery [51]. Meanwhile, SFF, which fits the absorption features of pixel spectra to reference spectral profiles, improves the detection of specific minerals with diagnostic absorption bands and has been successfully applied in areas such as Cyprus and North Africa [52,53]. MDC, another similarity-based method, calculates the Euclidean distance between the pixel and endmember spectra, offering computational efficiency and ease of interpretation in multispectral data analysis [54,55].
However, these methods have shown limitations, particularly under conditions of dense vegetation cover, surface weathering, or mixed pixels. For example, lithological discrimination using airborne multispectral data in Troodos Ophiolite (Cyprus) was significantly hampered by vegetation [52], while Chen [55] highlighted the challenges in applying spectral similarity techniques in heavily vegetated or soil-covered regions. Also, recent studies have successfully applied these approaches in Turkey, demonstrating their effectiveness by applying SAM in predictive mineral prospectivity mapping [56] and the exploration of ultramafic-hosted chromite deposits [57]. These methods exploit the unique spectral characteristics of target minerals, providing rapid, large-scale screening of potential ore zones while reducing the need for extensive field sampling.
To address these issues, recent studies emphasize pre-processing techniques such as vegetation masking, continuum removal, and endmember refinement to improve classification accuracy. Moreover, integrating SFF and MDC with machine learning algorithms has improved their adaptability and precision in mineral-rich environments [53,54]. Inclusion of hyperspectral sensors further improves feature detection, since detailed spectral information enables better resolution of subtle absorption features related to hydrothermal alteration minerals [58]. In general, spectral similarity-based techniques — especially when combined with advanced data fusion and classification frameworks — remain valuable tools for mineral exploration and geological mapping across the diverse and mineralized Mediterranean basin.
2.2.3. Unsupervised Classification
Unsupervised classification techniques play a pivotal role in geological mapping in the Mediterranean region, especially in data-scarce areas where traditional supervised methods are limited by the availability of the training data. Algorithms such as fuzzy c-means (FCM) and Density-Based Spatial Clustering of Applications with Noise (DBSCAN) have proven effective in identifying alteration zones by clustering pixels with similar spectral properties without prior class labels. Ghezelbash [59] demonstrated that the application of FCM and DBSCAN for unsupervised mineral prospectivity mapping effectively distinguishes hydrothermal zones from surrounding lithologies by leveraging subtle spectral differences captured in multispectral data. These methods are especially valuable in Mediterranean volcanic and geothermal environments — such as those in Greece, Morocco, and southern Spain — where alteration minerals such as kaolinite, alunite, and hematite exhibit diagnostic spectral features in the ASTER and Sentinel data. Tompolidi et al. [15] further validated the utility of thermal and spectral clustering approaches in identifying hydrothermal alteration at the Nisyros Volcano, correlating ASTER thermal performance with known alteration zones.
Beyond clustering, unsupervised classification is often integrated with advanced processing workflows to enhance hydrothermal feature detection. In particular, the delineation of hydrothermal zones is significantly improved, particularly when using high-dimensional hyperspectral data such as Hyperion, if unsupervised methods like k-means are combined with object-based classification and spectral similarity algorithms (e.g., SAM) [10,60].
In structurally complex and vegetated regions of the Mediterranean, these methods help isolate alteration signals from background noise and vegetation interference. Recent studies have also integrated unsupervised classification outputs into machine learning frameworks to refine alteration mapping — for instance, in predictive models of mineralization potential using random forests [13] or neural networks trained on pre-clustered lithological units [61]. These approaches demonstrate the growing importance of unsupervised classification not only as a standalone method but also as a foundational step in hybrid workflows for the detection of hydrothermal alteration in the tectonically and mineralogically diverse landscapes of the Mediterranean.
2.3. Sub-pixel methods
Subpixel-based methods are advanced remote sensing techniques designed to extract detailed information from mixed pixels in multispectral and hyperspectral satellite datasets, where a single pixel contains a combination of multiple surface materials. These methods aim to estimate the proportion or abundance of different materials — known as endmembers — within each pixel, thereby improving the spatial and thematic resolution of geological mapping. A common approach is spectral unmixing, which includes linear and non-linear unmixing models. The linear model assumes that the observed spectrum is a weighted sum of end-member spectra, while non-linear models account for complex interactions like multiple scattering. Techniques such as Linear Spectral Unmixing (LSU), Multiple Endmember Spectral Mixture Analysis (MESMA), and Nonlinear Mixture Models have been effectively applied in mineral exploration, hydrothermal alteration mapping, and soil composition analysis [62]. Hyperspectral data, with their high spectral resolution, are particularly well-suited for subpixel analysis, as it captures distinct absorption features that facilitate accurate endmember discrimination [63]. Subpixel-based methods offer significant advantages in heterogeneous or geologically complex terrains, where traditional pixel-based classification may fail to represent the diversity of surface materials.
2.3.1. Spectral Unmixing
Spectral unmixing, particularly through linear models, has been applied effectively to hydrothermal alteration mapping in complex volcanic terrains of the Mediterranean. In linear spectral unmixing (LSU), each pixel’s spectrum is modelled as a weighted sum of pure spectral signatures (endmembers), assuming no significant interaction between materials. This approach has proven especially useful in identifying alteration zones composed of mixed mineralogical assemblages, such as argillitic, phyllitic, and propylitic facies. Tompolidi et al. [4] applied LSU on ASTER, Sentinel-2 MSI, and Landsat-8 (OLI) data in the Nisyros volcanic system (Greece), revealing the spatial distribution of alteration minerals and highlighting the effectiveness of combining sensors with varying spectral resolutions. As demonstrated in [64], linear unmixing methods are computationally efficient and interpretable, making them a widely used starting point for geological applications. Furthermore, in far East Meditteranean Canbaz et al., [65] applied machine learning in combination with sub-pixel mixture algorithms to map bentonite deposits in Reşadiye (Tokat, Turkey), highlighting how these techniques can enhance the resolution of lithological and mineralogical maps derived from multispectral data.
However, linear models may oversimplify the spectral mixing process, especially in rugged or vegetated Mediterranean terrains, where non-linear interactions between surface materials can occur due to multiple scattering and topographic effects.
To address the limitations of linear models, non-linear spectral unmixing approaches have gained traction, particularly in hyperspectral geological mapping. Non-linear models account for complex mixing behaviours, such as internal mixtures or spectral variability induced by mineral grain size, illumination geometry, and surface roughness, which are common characteristics of hydrothermal environments. For instance, Chakraborty [66] demonstrated the superiority of non-linear methods in capturing subtle spectral differences for mineral mapping in complex terrains, while Borsoi et al. [7,12] introduced data-driven and multiscale models capable of handling spectral variability across spatial and temporal scales. These methods often incorporate machine learning and geometric modelling techniques, such as deep neural networks, to improve end-members extraction and abundance estimation [8]. In the Mediterranean region, where hydrothermal alteration zones are often spatially heterogeneous and spectrally variable, these advanced unmixing methods provide a more realistic and detailed interpretation of sub-pixel mineralogy, supporting high-precision mapping of potential mineralization zones and geothermal activity.
2.4. SAR Interferometry (InSAR) for geological mapping
The Mediterranean region, characterized by its dynamic geotectonic framework, active volcanism, and densely populated coastal zones, provides a compelling environment for the application of remote sensing technologies in geological mapping. Interferometric Synthetic Aperture Radar (InSAR), particularly through multitemporal techniques like SBAS (Small Baseline Subset), has become a cornerstone method for detecting and analyzing surface deformation across the region. Notable volcanic case studies include the Methana Volcano in Greece, where Sentinel-1 MT-InSAR data combined with GNSS and seismic observations revealed deformation patterns linked to tectonic and magmatic processes [67], and the Campi Flegrei caldera in Italy, where SAR and seismic interferometric techniques were used to track uplift and unrest phases between 2011 and 2013 [68]. Similar methodologies applied to La Palma and Santorini [69] and Ischia Island [70] underscore the effectiveness of InSAR in pre- and post-unrest monitoring, allowing the detection of subsurface magma movements and fault dynamics critical to early warning systems.
In addition to volcanic terrains, remote sensing has proven highly effective for subsidence mapping and geological assessments in sedimentary and coastal environments. For example, studies in the Po River Delta and Venice Lagoon [71] and in northeastern Italy [72] used InSAR data to delineate areas undergoing anthropogenic and natural subsidence, facilitating a better understanding of soil compressibility and land stability. Furthermore, in regions such as Aegina Island [73], Kythira Island [74], and the Vega Media of the Segura River Basin [75], SBAS and other time series InSAR techniques have captured ground deformation trends associated with tectonic activity and alluvial soil compaction, offering important inputs for zonation of geological hazards and environmental monitoring.
Remote sensing techniques have also been expanded to detect hydrothermal and surface alterations associated with volcanic systems and have not only been used for crustal deformation mapping in the Mediterranean region. In particular, the use of multitemporal Sentinel-1 coherence analysis was demonstrated to identify hydrothermal alteration zones at Nisyros Volcano, revealing the potential of coherence imagery as a complementary dataset to traditional deformation monitoring [18]. In addition, the integration of InSAR with complementary geophysical datasets — such as GNSS, seismic networks, and geological field surveys — enhances the interpretative power of remote sensing and provides a multidisciplinary framework for geological mapping. Advanced InSAR techniques, as proposed by [76], allow the classification and characterization of types of deformation, distinguishing between processes such as fault creep, landsliding, or subsidence. Furthermore, long-term deformation records such as those in Nisyros volcano [77] exemplify the role of SAR data in deformation time-series. As demonstrated throughout the Mediterranean basin, satellite-based remote sensing, especially when integrated with ground-based observations, has become indispensable for comprehensive geological analysis, offering high-resolution, wide-area, and cost-effective monitoring solutions.
2.5. Field Campaigns and Mineralogical Analysis
Field campaigns play an essential role in validating remote sensing outputs and interpreting spectral signatures in geological and mineral exploration. They not only confirm the presence of alteration minerals detected from space, but also provide critical mineralogical and geochemical details through laboratory analyses. For example, Chen et al. [78] integrated ASTER and WorldView-3 imagery with field sampling and employed X-ray diffraction (XRD) and short-wave infrared (SWIR) spectroscopy to confirm the presence of phyllitic and argillitic alteration minerals — including kaolinite, illite, and chlorite — within the Pulang porphyry copper system. Furthermore, Ferrier et al. [36] combined satellite-based compositional data with field samples analysis by X-ray fluorescence (XRF) and petrographic microscopy to characterize different types of hydrothermal alteration across multiple scales. These examples highlight how multi-sensor data acquisition must be complemented by laboratory-based mineralogical confirmation to ensure accurate spectral classification. Hewson et al. [79] further reinforce the need for multiscale geological remote sensing by advocating for ground-validated spectral libraries and laboratory-based calibration to bridge the gap between satellite-scale and hand-sample-scale observations.
In the Mediterranean region, mineralogical laboratory analyses have been crucial for understanding active and fossil hydrothermal systems. In the study of Bobos et al. [80] samples from the Furnas Volcano (Sao Miguel, Azores) were analyzed using XRD and inductively coupled plasma mass spectrometry (ICP-MS) to quantify the mineralogical and geochemical signatures of acid-sulfate alteration, including high concentrations of HFSE and REEs associated with kaolinite and alunite. Similarly, Pereira et al. [81] combined field mapping with XRD, scanning electron microscopy with energy-dispersive X-ray spectroscopy (SEM-EDS), and gas geothermometry to characterize mineral alteration in the Ribeira Grande geothermal field (Sao Miguel, Azores). Moreover, Quintela et al. [82] used XRD and differential thermal analysis (DTA) to evaluate hydrothermally altered clays for their industrial and therapeutic potential in Caldeiras da Ribeira Grande (Sao Miguel, Azores). In broader Mediterranean contexts, Chikhaoui [2] validated a remote sensing-based land degradation index in a semi-arid catchment using geochemical analysis of soil and rock samples. These integrated approaches — combining hyperspectral satellite data with laboratory-confirmed mineralogy — demonstrate the critical role of fieldwork and analytical methods such as XRD, XRF, SEM-EDS, and ICP-MS in producing geologically meaningful interpretations in Mediterranean hydrothermal systems.
2.6. Geographical Information Systems (GIS) and Multi-Layer Analysis
Based on the literature, all processed datasets (spectral indices, mineral abundance maps, unsupervised classified lithology, InSAR, and deformation layers) were integrated within a GIS environment (ArcGIS/QGIS)[4,15,83,84,85]. Overlay analysis facilitated multi-source cross-validation, such as tectonic structures (e.g: faults and fissures), from InSAR results were superimposed on digitized and orthorectified lithological maps.
This approach in most studies under investigation for the Meditteranean region facilitates a sophisticated spatial mapping, hotspot analysis of CRM-related lithologies and incorporation with a variety of geological, geophysical and geochemical layers [9,86].The GIS framework also supports dynamic querying, facilitating iterative field targeting and knowledge refinement.
3. Results
In the following, we present a synthesis of remote sensing methodologies and their applications in geological mapping across the Mediterranean region. An overview of the multispectral, hyperspectral, and SAR data applications in various Mediterranean environments, highlighting the latest state-of-the-art methods and trends is reported (Table 2). The second subsection explores the role of spectral libraries—both standard (e.g., USGS) and custom—in improving classification accuracy and mineral identification. Then we focused on the distinction between standard and custom spectral libraries cases, including sources, validation methods, and integration with mineralogical field analyses. Finally, we compare the effectiveness of pixel-based and sub-pixel methods, with emphasis respectively on their advantages and limitations in different geological contexts, such as ophiolite complexes, hydrothermal systems, and structurally complex terrains.
3.1. Overview of Remote Sensing Applications in the Mediterranean
Remote sensing applications for geological mapping across the Mediterranean region have grown substantially in the past two decades, with a strong emphasis on multispectral and hyperspectral satellite platforms. ASTER has been the most frequently utilized sensor, particularly in alteration mapping due to its effective SWIR bands, with notable case studies in Cyprus, Morocco, and southern Italy. Sentinel-2 has emerged more recently as a complementary tool for broader regional mapping, especially when high spatial resolution is needed. Specifically, Sentinel-2 has proven valuable for structural and lithological analysis when combined with spectral indices and tectonic structure mapping. More advanced hyperspectral missions such as PRISMA and EnMAP are beginning to appear in studies, particularly for mineral mapping in complex terrains such as Tunisia and central Greece.
The review shows that pixel-based classification methods, Support Vector Machines (SVM) and Maximum Likelihood, are widely applied in geologically simple areas with well-defined lithologies, such as ophiolitic complexes in Cyprus or sedimentary basins in Tunisia. These methods perform well in areas where surface exposures are clear and rock units are spectrally distinct. However, in more geologically heterogeneous zones — such as the Iberian Pyrite Belt in Portugal or faulted volcanic terrains in Morocco — spectral mixing within pixels limits the effectiveness of unsupervised classification. In these settings, sub-pixel methods such as Linear Spectral Unmixing (LSU) and Multiple Endmember Spectral Mixture Analysis (MESMA) have provided enhanced mapping precision, especially for detecting hydrothermal alteration. Several studies in Portugal, Cyprus, and Tunisia successfully integrated field-collected spectra and laboratory measurements with spectral reference libraries like the USGS Spectral Library to improve the accuracy of geological mapping.
In addition to optical data, Synthetic Aperture Radar (SAR) interferometry has been applied in the Mediterranean for geological and geomorphological mapping, particularly in volcanic regions. A key example is from Nisyros Volcano in Greece, where Tompolidi et al. [18] demonstrated the potential of multitemporal coherence derived from Sentinel-1 InSAR data to detect zones of hydrothermal alteration with different response to weathering. The findings showed that coherence loss correlated well with altered zones, optical remote sensing and available geological data [4], suggesting the strong potential of InSAR as a non-invasive tool for monitoring volcanic and geothermal systems. Complementary work by Tompolidi et al. [4,15] using ASTER, Sentinel-2 MSI, and Landsat-8 (OLI) further validated the integration of thermal, optical, and radar (SAR) datasets for detailed mapping of alteration minerals, interferometric coherence mapping and thermal anomalies across Nisyros. These studies emphasize the value of combining optical and SAR data for comprehensive geological interpretation, especially in terrains where vegetation, cloud cover, or surface inaccessibility may limit passive sensor use.
3.2. Spectral Libraries: Use and Impact in Mediterranean Geological Mapping
Spectral libraries are essential tools in geological mapping with remote sensing techniques, particularly for spectral similarity techniques (e.g., SAM, SID) and spectral unmixing techniques. In the Mediterranean region, both standard global libraries and custom-built regional libraries have been used to improve classification accuracy and mineralogical discrimination.
3.2.1. Standard and Custom Spectral Libraries
The USGS Spectral Library [31] is the most commonly referenced spectral library in Remote Sensing studies for geological mapping of the Mediterranean region. It has been used in studies applying pixel-based methods and sub-pixel methods for geological mapping in Mediterranean regions such as Greece [4,87], Cyprus [88], Italy [89], Spain [90,91], Portugal [81,92], Tunisia [93,94] and Turkey [95]. These applications focused on identifying alteration minerals (e.g., kaolinite, hematite, chlorite) associated with hydrothermal systems, mining tailings and rare-earth-elements exploration.
However, reliance on global spectral databases poses challenges, particularly in heterogeneous terrains with very specific regional lithologies. To address this point, several studies developed custom spectral libraries using field spectro-radiometry and laboratory analyses. For example, Ferrier et al. [96] used a field spectroradiometer to collect ground reference spectra of altered rocks in southern Spain, which were then used to calibrate and validate imaging spectrometry data for mapping hydrothermal alteration zones associated with gold mineralization. Similarly, Yalcin et al. [50], used both the USGS spectral library and a custom developed spectral library at the local level, derived from field and laboratory analyzes of rock samples, to improve the identification and classification of hydrothermal alteration minerals in the Akarcay Basin (Turkey) using ASTER imagery.
Custom libraries were often validated by X-ray diffraction (XRD), thin section petrography, or X-ray fluorescence (XRF), improving the reliability of the selected endmembers. About one third of the reviewed studies explicitly integrated these mineralogical analyzes combined with the development of spectral libraries[29].
3.3. Comparative Summary of Pixel-Based and Sub-Pixel Methods Effectiveness
Pixel-based methods, including algorithms like maximum likelihood and support vector machines (SVM), as well as unsupervised clustering such as ISODATA and k-means, have been extensively applied in geological mapping in the Mediterranean region. These methods are particularly effective in geologically simple or spatially homogeneous terrains, such as volcanic islands or large sedimentary basins. For example, in Cyprus [97,98], pixel-based approaches using ASTER data have been used to delineate alteration zones in Troodos ophiolite, benefiting from the clear spectral heterogeneity between ultramafic and altered rocks. However, in complex terrains like the Iberian Pyrite Belt in southern Portugal [99,100], where lithological units are intermixed and spectrally homogeneous, pixel-based methods often are not able to extract the spectral variability and this can lead to misclassification, particularly in regions with significant vegetation or urban landscapes.
Sub-pixel methods, such as Linear Spectral Unmixing (LSU), Multiple Endmember Spectral Mixture Analysis (MESMA), and more recent machine learning-based spectral decomposition techniques, enhanced performance in such complex and heterogeneous settings like the Mediterranean. In Morocco sub-pixel methods combined with hyperspectral data have successfully mapped hydrothermal alteration zones and mineralized structures at sub-pixel scales [93,94], especially when supported by reference spectra from the USGS Spectral library or custom spectral libraries for the region under investigation. Similarly, in Portugal [81,92] and Cyprus [88], sub-pixel analyses have enabled the discrimination of alteration minerals (e.g. muscovite, chlorite, and kaolinite) even within spectrally mixed pixels. These approaches are particularly valuable in mountainous or mineralized zones where surface exposures are limited or weathered. While sub-pixel methods are computationally intensive and rely heavily on accurate endmember selection, their integration with ground-truth data — such as X-ray diffraction, thin section petrography, or X-ray fluorescence — has substantially improved mapping reliability in recent studies from the Mediterranean region.
4. Discussion
4.1. Implication for Mining Exploration
An exponential growth in the demand of resources is expected as a result of the increase of global population, industrialization, digitalization and demand from developing countries. With global material demand doubled from 79 billion tonnes in 2020 to 167 billion tonnes in 2060 (OECD forecast https://www.oecd.org/en/topics/sub-issues/economic-outlook.html) the global competition for resources will become fierce in the coming decades and the dependence of critical raw materials may soon replace the current dependence on oil [101].
The EU commission on 11 December 2019 adopted the EU Green Deal Communication 1 in which access to resources was recognized as a strategic security question to fulfill its ambition towards 2050 climate neutrality and to increase our climate ambition for 2030. Critical raw materials (CRM) are highly demanded for key technologies and strategic sectors such as renewable energy, e-mobility, digital, space and defence [102]. A secure and sustainable supply of primary and secondary materials is one of the prerequisites to achieve climate neutrality. The almost complete dependence of the EU on the supply of raw materials from third countries forced the EU commission to define in the new Industrial Strategy for the EU2 an Action Plan for CRM and for industry-driven raw materials alliances where diversification of supply concerns reducing dependencies in all dimensions by increasing secondary supply of raw materials through resource efficiency and circularity, and finding alternatives to scarce raw materials [103].
One of the priorities of the EU Commission is to encourage the European production of critical raw materials and facilitate the launch of new mining and recycling activities to ensure the competitiveness of the EU industrial value chains: “The importance of metals and minerals to sustain businesses and the economy is particularly true for the EU, where about 30 million jobs are directly reliant on access to raw materials” (EU list of critical Raw Materials final report 2020 [104]).
The supply of CRM is therefore a priority for European industry and society. Europe has limited primary mining resources that are not being used well at the moment, therefore new exploitation and extraction strategies to produce CRM are strategic for Europe. In this framework, the CRM Act [103] sets ambitious 2030 benchmarks for Eu extraction (at least 10% annual), processing (at least 40%) and decreasing external sources from a single third country. Mediterranean area has a complex geotectonic configuration that produced ore deposits of different types, most of which have been exploited since ancient times. They span from Volcanogenic Massive Sulfide (VMS) to epithermal, porphyry, lateritic, skarn to carbonate-replacement (MVT, CRD) and sedimentary (phosphate deposits in Tunisia and Morocco). A potential CRM resource that still needs to be thoroughly characterized.
In this framework, most of the primary alteration minerals occurring in ore deposit formation are present together with secondary alteration processes (i.e. weathering of mineralized rocks) and can be used as key-minerals for mining exploration to produce predictive resource assessments.
4.2. Challenges and Future Directions
Despite notable advancements, remote sensing applications for geological mapping in the Mediterranean still face several challenges. Addressing these challenges is essential if remote sensing is to play a central role in supporting geologic mapping, scientific understanding, and strategic mineral exploration under the EU Critical Raw Materials (CRM) framework.
The Mediterranean landscape is highly heterogeneous, with mixtures of lithologies, weathered surfaces, vegetation, and anthropogenic cover. Pixel-based methods often misclassify such areas, while sub-pixel techniques depend heavily on accurate endmember selection. A clear research priority is the systematic testing of pixel-based versus sub-pixel approaches in varied Mediterranean settings to establish best practices for different geological environments.
Most studies rely on the USGS spectral library, which does not adequately capture the mineralogical diversity of Mediterranean lithologies. This limit the accuracy and reproducibility of the classification. The development of open-access, standardized, region-specific spectral libraries built through coordinated field campaigns and validated with XRD, XRF, Raman, and petrography would significantly enhance the reliability of RS applications. Such libraries should be continuously updated and made interoperable with global datasets.
Looking ahead, the growing demand for critical raw materials (CRMs) under the EU’s Critical Raw Materials Act presents both a strategic opportunity and a research imperative for remote sensing studies working in the Mediterranean. The next generation of Mediterranean RS research should focus on (1) building and maintaining regional spectral libraries; (2) developing standardized preprocessing and validation protocols; (3) advancing multi-sensor data fusion supported by machine learning; and (4) expanding geographical coverage beyond the current case-study hotspots.
These steps will enable RS studies to move beyond case-by-case demonstrations toward a more unified operational framework that directly supports both geoscience and sustainable mineral resource management in the Mediterranean.
5. Conclusions
This review highlights the growing role of remote sensing in geological mapping in the Mediterranean, with satellite platforms like ASTER, Sentinel-2, and PRISMA enabling effective detection of lithological units and alteration zones. Pixel-based methods remain widely used for relatively simple terrains, while sub-pixel techniques offer improved accuracy in geologically complex or spectrally mixed areas. The integration of hyperspectral data and field-based mineralogical validation, such as XRD and XRF, has significantly improved the reliability of remote sensing interpretations. Spectral libraries — particularly the USGS Spectral Library and locally calibrated datasets — play a critical role in endmember selection and classification success. Studies in regions such as Cyprus, Morocco, Portugal and Greece demonstrate the value of combining optical, thermal, and SAR datasets for comprehensive geological analysis.
Importantly, strategic interest under the Critical Raw Materials Act (CRM Act) has intensified efforts to map mineralized zones in the Mediterranean, especially in areas with known occurrences of copper, rare earth elements, and other critical raw materials. Remote sensing, especially when integrated with mineralogical data, offers a non-invasive and scalable approach to support early-stage mineral exploration aligned with EU strategic resource goals. However, challenges persist, including inconsistent methodologies, limited ground-truth data, and the need for better integration of multi-sensor datasets.
Custom spectral libraries developed locally in Mediterranean regions — such as those derived from field or laboratory measurements of region-specific lithologies — have proven essential for improving classification accuracy, particularly in areas where generalized spectral libraries do not adequately represent the local mineralogical variability. There is a growing need to expand and standardize these regional libraries to better capture the complex geological signatures unique to the Mediterranean and to enhance the reliability of sub-pixel and hyperspectral analyses in mineral exploration and mapping. Future directions should prioritize harmonized workflows, machine learning integration, and broader coverage of understudied Mediterranean sub-regions to support both scientific research and sustainable resource management.
Aligning geological mapping with EU Critical Raw Materials strategies requires moving beyond descriptive mapping toward predictive, resource-oriented applications. Remote sensing–derived alteration mineral maps can be directly linked to models of mineral system prospectivity, highlighting zones where critical raw materials such as rare earth elements, copper, and antimony are most likely to occur. Integrating alteration signatures with geophysical, geochemical, and structural datasets into geological maps within a GIS framework enables the generation of spatially explicit resource assessments that are directly relevant to exploration strategies.
Such an approach would not only strengthen the scientific basis of critical raw materials exploration in the Mediterranean but also provide decision-makers with operational tools to evaluate potential mining targets, prioritize exploration campaigns, and maximize sustainable supply chains within Europe’s territories. By explicitly connecting geological mapping with the objectives of the Critical Raw Materials Act, remote sensing studies shift from a supporting role to a central pillar of sustainable resource strategy.
Author Contributions
Conceptualization, A.T. and S.N.; methodology, A.T., S.N., A.F.; validation, A.T., S.N., A.F. and L.M.; formal analysis, A.T.; writing—original draft preparation, A.T.; writing—review and editing, A.T., S.N, A.F. and L.M.; All authors have read and agreed to the published version of the manuscript.
Funding
This research received no external funding.
Institutional Review Board Statement
Not applicable
Informed Consent Statement
Not applicable
Data Availability Statement
Not applicable
Conflicts of Interest
The authors declare no conflicts of interest.
References
- Sykioti, O.; Ganas, A.; Vasilatos, C.; Kypritidou, Z. Investigating the capability of Sentinel-2 and Worldview-3 VNIR satellite data to detect mineralized zones at an igneous intrusion in the Koutala islet (Lavreotiki, Greece) using laboratory mineralogical analysis, reflectance spectroscopy and spectral indices. Bulletin of the Geological Society of Greece 2022, 59, 175–213. [Google Scholar] [CrossRef]
- Chikhaoui, M.; Bonn, F.; Bokoye, A.I.; Merzouk, A. A spectral index for land degradation mapping using ASTER data: Application to a semi-arid Mediterranean catchment. International journal of applied earth observation and geoinformation 2005, 7, 140–153. [Google Scholar] [CrossRef]
- Blumberg, A.; Schodlok, M.C. The synergistic use of multi-scale remote sensing data for the identification of hydrothermal alteration patterns in Los Frailes, Spain. International Journal of Applied Earth Observation and Geoinformation 2022, 114, 103034. [Google Scholar] [CrossRef]
- Tompolidi, A.M.; Sykioti, O.; Koutroumbas, K.; Parcharidis, I. Spectral unmixing for mapping a hydrothermal field in a volcanic environment applied on ASTER, Landsat-8/OLI, and Sentinel-2 MSI Satellite Multispectral Data: The Nisyros (Greece) case study. Remote Sensing 2020, 12, 4180. [Google Scholar] [CrossRef]
- Fernández-Guisuraga, J.M.; González-Pérez, I.; Reguero-Vaquero, A.; Marcos, E. Estimating Grassland Biophysical Parameters in the Cantabrian Mountains Using Radiative Transfer Models in Combination with Multiple Endmember Spectral Mixture Analysis. Remote Sensing 2024, 16, 4547. [Google Scholar] [CrossRef]
- Zhang, C.; Wang, Q.; Atkinson, P.M. Unsupervised object-based spectral unmixing for subpixel mapping. Remote Sensing of Environment 2025, 318, 114514. [Google Scholar] [CrossRef]
- Borsoi, R.A.; Imbiriba, T.; Bermudez, J.C.M. A data dependent multiscale model for hyperspectral unmixing with spectral variability. IEEE Transactions on Image Processing 2020, 29, 3638–3651. [Google Scholar] [CrossRef]
- Bioucas-Dias, J.M.; Ma, W.K. Geometrical methods–illustration with hyperspectral unmixing. Source Separation in Physical-Chemical Sensing 2023, pp. 201–253.
- Anifadi, A.; Sykioti, O.; Koutroumbas, K.; Vassilakis, E.; Vasilatos, C.; Georgiou, E. Discrimination of Fe-Ni-Laterites from Bauxites Using a Novel Support Vector Machines-Based Methodology on Sentinel-2 Data. Remote Sensing 2024, 16, 2295. [Google Scholar] [CrossRef]
- Petropoulos, G.P.; Arvanitis, K.; Sigrimis, N. Hyperion hyperspectral imagery analysis combined with machine learning classifiers for land use/cover mapping. Expert systems with Applications 2012, 39, 3800–3809. [Google Scholar] [CrossRef]
- Vasilakos, C.; Kavroudakis, D.; Georganta, A. Machine learning classification ensemble of multitemporal Sentinel-2 images: The case of a mixed mediterranean ecosystem. Remote Sensing 2020, 12, 2005. [Google Scholar] [CrossRef]
- Borsoi, R.A.; Erdoğmuş, D.; Imbiriba, T. Learning interpretable deep disentangled neural networks for hyperspectral unmixing. IEEE Transactions on Computational Imaging 2023, 9, 977–991. [Google Scholar] [CrossRef]
- Rodriguez-Galiano, V.F.; Chica-Rivas, M. Evaluation of different machine learning methods for land cover mapping of a Mediterranean area using multi-seasonal Landsat images and Digital Terrain Models. International Journal of Digital Earth 2014, 7, 492–509. [Google Scholar] [CrossRef]
- De Luca, G.; MN Silva, J.; Di Fazio, S.; Modica, G. Integrated use of Sentinel-1 and Sentinel-2 data and open-source machine learning algorithms for land cover mapping in a Mediterranean region. European Journal of Remote Sensing 2022, 55, 52–70. [Google Scholar] [CrossRef]
- Tompolidi, A.M.; Koutroumbas, K.; Sykioti, O.; Parcharidis, I. Correlation of thermal performance of ASTER with the hydrothermal alteration zones: the case of Nisyros volcano, Greece. Journal of Applied Remote Sensing 2022, 16, 034506–034506. [Google Scholar] [CrossRef]
- Peleli, S.; Kouli, M.; Marchese, F.; Lacava, T.; Vallianatos, F.; Tramutoli, V. Monitoring temporal variations in the geothermal activity of Miocene Lesvos volcanic field using remote sensing techniques and MODIS–LST imagery. International Journal of Applied Earth Observation and Geoinformation 2021, 95, 102251. [Google Scholar] [CrossRef]
- Rabuffi, F.; Musacchio, M.; Silvestri, M.; Cianfarra, P.; Salvini, F.; Buongiorno, M. Integrating satellite remote sensing and proximal data to investigate the role of brittle tectonics in the distribution of geothermal surface manifestations. Insights from the Parco Naturalistico delle Biancane-Larderello geothermal field (Southern Tuscany, Italy). Geothermics 2025, 132, 103428. [Google Scholar]
- Tompolidi, A.M.; Parcharidis, I.; Sykioti, O. Investigation of Sentinel-1 capabilities to detect hydrothermal alteration based on multitemporal interferometric coherence: The case of Nisyros volcano (Greece). Procedia Computer Science 2021, 181, 1027–1033. [Google Scholar] [CrossRef]
- Lapini, A.; Pettinato, S.; Santi, E.; Paloscia, S.; Fontanelli, G.; Garzelli, A. Comparison of machine learning methods applied to SAR images for forest classification in mediterranean areas. Remote Sensing 2020, 12, 369. [Google Scholar] [CrossRef]
- Piochi, M.; Cantucci, B.; Montegrossi, G.; Currenti, G. Hydrothermal alteration at the San Vito area of the Campi Flegrei geothermal system in Italy: Mineral review and geochemical modeling. Minerals 2021, 11, 810. [Google Scholar] [CrossRef]
- Ferrier, G.; Ganas, A.; Pope, R. Prospectivity mapping for high sulfidation epithermal porphyry deposits using an integrated compositional and topographic remote sensing dataset. Ore Geology Reviews 2019, 107, 353–363. [Google Scholar] [CrossRef]
- Bentahar, I.; Raji, M. Comparison of Landsat OLI, ASTER, and Sentinel 2A data in lithological mapping: A Case study of Rich area (Central High Atlas, Morocco). Advances in Space Research 2021, 67, 945–963. [Google Scholar] [CrossRef]
- Shebl, A.; Abdellatif, M.; Hissen, M.; Abdelaziz, M.I.; Csámer, Á. Lithological mapping enhancement by integrating Sentinel 2 and gamma-ray data utilizing support vector machine: A case study from Egypt. International Journal of Applied Earth Observation and Geoinformation 2021, 105, 102619. [Google Scholar] [CrossRef]
- Guanter, L.; Kaufmann, H.; Segl, K.; Foerster, S.; Rogass, C.; Chabrillat, S.; Kuester, T.; Hollstein, A.; Rossner, G.; Chlebek, C.; et al. The EnMAP spaceborne imaging spectroscopy mission for earth observation. Remote Sensing 2015, 7, 8830–8857. [Google Scholar] [CrossRef]
- D’Amico, S.; Bodin, P.; Delpech, M.; Noteborn, R. Prisma. In Distributed space missions for earth system monitoring; Springer, 2012; pp. 599–637.
- Guarini, R.; Loizzo, R.; Facchinetti, C.; Longo, F.; Ponticelli, B.; Faraci, M.; Dami, M.; Cosi, M.; Amoruso, L.; De Pasquale, V.; et al. PRISMA hyperspectral mission products. In Proceedings of the IGARSS 2018-2018 IEEE International Geoscience and Remote Sensing Symposium. IEEE, 2018, pp. 179–182.
- Alicandro, M.; Candigliota, E.; Dominici, D.; Immordino, F.; Masin, F.; Pascucci, N.; Quaresima, R.; Zollini, S. Hyperspectral PRISMA and Sentinel-2 Preliminary Assessment Comparison in Alba Fucens and Sinuessa Archaeological Sites (Italy). Land 2022, 11, 2070. [Google Scholar] [CrossRef]
- Sorrentino, A.; Chirico, R.; Corrado, F.; Laukamp, C.; Di Martire, D.; Mondillo, N. The application of PRISMA hyperspectral satellite imagery in the delineation of distinct hydrothermal alteration zones in the Chilean Andes: The Marimaca IOCG and the Río Blanco-Los Bronces Cu-Mo porphyry districts. Ore Geology Reviews 2024, p. 105998.
- Hajaj, S.; El Harti, A.; Pour, A.B.; Jellouli, A.; Adiri, Z.; Hashim, M. A review on hyperspectral imagery application for lithological mapping and mineral prospecting: Machine learning techniques and future prospects. Remote Sensing Applications: Society and Environment 2024, p. 101218.
- Van der Meer, F.D.; Van der Werff, H.M.; Van Ruitenbeek, F.J.; Hecker, C.A.; Bakker, W.H.; Noomen, M.F.; Van Der Meijde, M.; Carranza, E.J.M.; De Smeth, J.B.; Woldai, T. Multi-and hyperspectral geologic remote sensing: A review. International journal of applied Earth observation and geoinformation 2012, 14, 112–128. [Google Scholar] [CrossRef]
- Clark, R.N.; Swayze, G.A.; Wise, R.A.; Livo, K.E.; Hoefen, T.M.; Kokaly, R.F.; Sutley, S.J. USGS digital spectral library splib06a. Technical report, US Geological Survey, 2007.
- Labdaoui, B.; Benali, H.; Boughacha, A.; Moussaoui, K. Mapping hydrothermal alterations and lineaments associated with epithermal and massive sulphides deposits of Tifraouine (northwest Algerian coast): Use of Landsat 8 OLI data and remote sensing. Revista de la Sociedad Geológica de España 2023, 36, 3–15. [Google Scholar] [CrossRef]
- Moussaoui, K.; Benali, H.; Kermani, S.; Labdaoui, B. Detection of hydrothermal alteration and structural characteristics of Miocene volcanic rocks using remote sensing in the M’sirda region (northwestern Algeria). Applied Geomatics 2023, 15, 189–207. [Google Scholar] [CrossRef]
- Anifadi, A.; Parcharidis, I.; Sykioti, O. Hydrothermal alteration zones detection in Limnos Island, through the application of remote sensing. Bulletin of the Geological Society of Greece 2016, 50, 1596–1604. [Google Scholar] [CrossRef]
- Ferrier, G.; White, K.; Griffiths, G.; Bryant, R.; Stefouli, M. The mapping of hydrothermal alteration zones on the island of Lesvos, Greece using an integrated remote sensing dataset. International journal of remote sensing 2002, 23, 341–356. [Google Scholar] [CrossRef]
- Ferrier, G.; Naden, J.; Ganas, A.; Kemp, S.; Pope, R. Identification of multi-style hydrothermal alteration using integrated compositional and topographic remote sensing datasets. Geosciences 2016, 6, 36. [Google Scholar] [CrossRef]
- Aboelkhair, H.; Ibraheem, M.; El-Magd, I.A. Integration of airborne geophysical and ASTER remotely sensed data for delineation and mapping the potential mineralization zones in Hamash area, South Eastern Desert, Egypt. Arabian Journal of Geosciences 2021, 14, 1157. [Google Scholar] [CrossRef]
- Santos, D.; Cardoso-Fernandes, J.; Lima, A.; Teodoro, A. Application of band ratios to map hydrothermal alteration zones related to Au-Sb mineralization in Freixeda, Northern Portugal. In Proceedings of the Earth Resources and Environmental Remote Sensing/GIS Applications XV. SPIE, 2024, Vol. 13197, pp. 135–143.
- Ekici, T. Lithological mapping of ophiolitic rocks from southern part of the Sivas Basin (Turkey) using ASTER imagery. Turkish Journal of Earth Sciences 2023, 32, 200–213. [Google Scholar] [CrossRef]
- Gürbüz, E. Multispectral mapping of evaporite minerals using ASTER data: A methodological comparison from central Turkey. Remote Sensing Applications: Society and Environment 2019, 15, 100240. [Google Scholar] [CrossRef]
- Hozatlioğlu, D.; Bozkaya, Ö.; Inal, S.; Kavak, K.Ş. Mapping of lithological units in the western part of the Eastern Taurides (Türkiye) using ASTER images. Turkish Journal of Earth Sciences 2024, 33, 362–383. [Google Scholar] [CrossRef]
- ALTINBAŞ, Ü.; Kurucu, Y.; Bolca, M.; El-Nahry, A. Using advanced spectral analyses techniques as possible means of identifying clay minerals. Turkish journal of agriculture and forestry 2005, 29, 19–28. [Google Scholar]
- Güzel, F.; Sarp, G. Evaluation of the tectonic activity of faults with mineral alterations: a case of the East Anatolian Fault-Palu segment, Türkiye. Bulletin of the Mineral Research and Exploration 2024, 175, 149–165. [Google Scholar] [CrossRef]
- Canbaz, O.; Gürsoy, Ö.; Karaman, M.; Çalışkan, A.B.; Gökce, A. Hydrothermal alteration mapping using EO-1 Hyperion hyperspectral data in Kösedağ, Central-Eastern Anatolia (Sivas-Turkey). Arabian Journal of Geosciences 2021, 14, 2245. [Google Scholar] [CrossRef]
- Bakardjiev, D.; Popov, K. ASTER spectral band ratios for detection of hydrothermal alterations and ore deposits in the Panagyurishte Ore Region, Central Srednogorie. In Proceedings of the Proceedings of the Bulgarian Geological Society — National conference “GEOSCIENCES 2014”. University of Mining and Geology “St. Ivan Rilski”, 2014, pp. 75–76.
- Lupa, M.; Adamek, K.; Leśniak, A.; Pršek, J. Application of satellite remote sensing methods in mineral prospecting in Kosovo, area of Selac. gospodarka surowcami mineralnymi 2020, 36, 5–22. [Google Scholar]
- Arnaut, F.; Đurić, D.; Đurić, U.; Samardžić-Petrović, M.; Peshevski, I. Application of geophysical and multispectral imagery data for predictive mapping of a complex geo-tectonic unit: a case study of the East Vardar Ophiolite Zone, North-Macedonia. Earth Science Informatics 2024, 17, 1625–1644. [Google Scholar] [CrossRef]
- Author, A. Mapping the Jurassic/Cretaceous lithological units in the Buëch area in France using Sentinel-2 and ASTER. Master’s thesis, MSc thesis (Figshare), 2020.
- Guglietta, D.; Salzano, R.; Wafik, A.; Conte, A.M.; Paciucci, M.; Punturo, R.; Salvatori, R.; Senesi, G.S.; Vaccaro, C. Hyperspectral Investigation of an Abandoned Waste Mining Site: The Case of Sidi Bou Azzouz (Morocco). Remote Sensing 2025, 17, 1838. [Google Scholar] [CrossRef]
- Yalcin, M.; Kilic Gul, F.; Yildiz, A.; Polat, N.; Basaran, C. The mapping of hydrothermal alteration related to the geothermal activities with remote sensing at Akarcay Basin (Afyonkarahisar), using Aster data. Arabian Journal of Geosciences 2020, 13, 1166. [Google Scholar] [CrossRef]
- Baid, S.; Tabit, A.; Algouti, A.; Algouti, A.; Nafouri, I.; Souddi, S.; Aboulfaraj, A.; Ezzahzi, S.; Elghouat, A. Lithological discrimination and mineralogical mapping using Landsat-8 OLI and ASTER remote sensing data: Igoudrane region, Jbel Saghro, Anti Atlas, Morocco. Heliyon 2023, 9, e17363. [Google Scholar] [CrossRef] [PubMed]
- Grebby, S.; Cunningham, D.; Tansey, K.; Naden, J. The impact of vegetation on lithological mapping using airborne multispectral data: A case study for the North Troodos region, Cyprus. Remote Sensing 2014, 6, 10860–10887. [Google Scholar] [CrossRef]
- Torres Gil, L.K.; Valdelamar Martínez, D.; Saba, M. The Widespread Use of Remote Sensing in Asbestos, Vegetation, Oil and Gas, and Geology Applications. Atmosphere 2023, 14, 172. [Google Scholar] [CrossRef]
- Sudharsan, S.; Hemalatha, R.; Radha, S. A Survey on Hyperspectral Imaging for Mineral Exploration Using Machine Learning Algorithms. In Proceedings of the Proceedings of the 2019 International Conference on Wireless Communications, Signal Processing and Networking (WiSPNET). IEEE, 2019, pp. 206–212. [CrossRef]
- Chen, Y.; Wang, Y.; Zhang, F.; Dong, Y.; Song, Z.; Liu, G. Remote Sensing for Lithology Mapping in Vegetation-Covered Regions: Methods, Challenges, and Opportunities. Minerals 2023, 13, 1153. [Google Scholar] [CrossRef]
- Mahboob, M.A.; Celik, T.; Genc, B. Predictive modelling of mineral prospectivity using satellite remote sensing and machine learning algorithms. Remote Sensing Applications: Society and Environment 2024, 36, 101316. [Google Scholar] [CrossRef]
- El-Raouf, A.A.; Doğru, F.; Bilici, Ö.; Azab, I.; Taşci, S.; Jiang, L.; Abdelrahman, K.; Fnais, M.S.; Amer, O. Combining Remote Sensing Data and Geochemical Properties of Ultramafics to Explore Chromite Ore Deposits in East Oltu Erzurum, Turkey. Minerals 2024, 14, 1116. [Google Scholar] [CrossRef]
- Schmid, T.; Koch, M.; Gumuzzio, J. Multisensor approach to determine changes of wetland characteristics in semiarid environments (Central Spain). IEEE Transactions on Geoscience and Remote Sensing 2005, 43, 2516–2525. [Google Scholar] [CrossRef]
- Ghezelbash, R.; Daviran, M.; Maghsoudi, A.; Hajihosseinlou, M. Density based spatial clustering of applications with noise and fuzzy C-means algorithms for unsupervised mineral prospectivity mapping. Earth Science Informatics 2025, 18, 217. [Google Scholar] [CrossRef]
- Petropoulos, G.P.; Vadrevu, K.P.; Kalaitzidis, C. Spectral angle mapper and object-based classification combined with hyperspectral remote sensing imagery for obtaining land use/cover mapping in a Mediterranean region. Geocarto International 2013, 28, 114–129. [Google Scholar] [CrossRef]
- Rahmani, N.; Ranjbar, H.; Nezamabadi-pour, H.; Carranza, E.J.M. Neural network classification of lithological units based on integrated radar and multispectral data. Acta Geodynamica et Geomaterialia 2024, 21. [Google Scholar] [CrossRef]
- Keshava, N.; Mustard, J.F. Spectral unmixing. IEEE signal processing magazine 2002, 19, 44–57. [Google Scholar] [CrossRef]
- Adams, J.B. Imaging spectroscopy: Interpretation based on spectral mixture analysis. Remote geochemical analysis: Elemental and mineralogical composition 1993, pp. 145–166.
- Quintano, C.; Fernández-Manso, A.; Shimabukuro, Y.E.; Pereira, G. Spectral unmixing. International Journal of Remote Sensing 2012, 33, 5307–5340. [Google Scholar] [CrossRef]
- Canbaz, O.; Karaman, M. Geochemical characteristics and mapping of Reşadiye (Tokat-Türkiye) bentonite deposits using machine learning and sub-pixel mixture algorithms. Geochemistry 2024, 84, 126123. [Google Scholar] [CrossRef]
- Chakraborty, R.; Rachdi, I.; Thiele, S.; Booysen, R.; Kirsch, M.; Lorenz, S.; Gloaguen, R.; Sebari, I. A spectral and spatial comparison of satellite-based hyperspectral data for geological mapping. Remote Sensing 2024, 16, 2089. [Google Scholar] [CrossRef]
- Gatsios, T.; Cigna, F.; Tapete, D.; Sakkas, V.; Pavlou, K.; Parcharidis, I. Copernicus sentinel-1 MT-InSAR, GNSS and seismic monitoring of deformation patterns and trends at the Methana Volcano, Greece. Applied Sciences 2020, 10, 6445. [Google Scholar] [CrossRef]
- Pepe, S.; De Siena, L.; Barone, A.; Castaldo, R.; D’Auria, L.; Manzo, M.; Casu, F.; Fedi, M.; Lanari, R.; Bianco, F.; et al. Volcanic structures investigation through SAR and seismic interferometric methods: The 2011–2013 Campi Flegrei unrest episode. Remote Sensing of Environment 2019, 234, 111440. [Google Scholar] [CrossRef]
- Castro-Melgar, I.; Gatsios, T.; Prudencio, J.; Ibanez, J.M.; Lekkas, E.; Parcharidis, I. Volcano Monitoring: Using SAR Interferometry for the Pre-Unrest of La Palma and the Post-Unrest of Santorini. In Remote Sensing for Geophysicists; CRC Press, 2025; pp. 440–459.
- Beccaro, L.; Tolomei, C.; Spinetti, C.; Bisson, M.; Colini, L.; De Ritis, R.; Gianardi, R. Ground Displacement Evaluation of the Ischia Island (Phlegraean Volcanic District, Italy) Applying Advanced Satellite SAR Interferometry Techniques. In Proceedings of the 2021 IEEE International Geoscience and Remote Sensing Symposium IGARSS. IEEE, 2021, pp. 926–929.
- Tosi, L.; Teatini, P.; Bincoletto, L.; Simonini, P.; Strozzi, T. Integrating geotechnical and interferometric SAR measurements for secondary compressibility characterization of coastal soils. Surveys in geophysics 2012, 33, 907–926. [Google Scholar] [CrossRef]
- Floris, M.; Fontana, A.; Tessari, G.; Mulè, M. Subsidence zonation through satellite interferometry in coastal plain environments of NE Italy: a possible tool for geological and geomorphological mapping in urban areas. Remote Sensing 2019, 11, 165. [Google Scholar] [CrossRef]
- Kalavrezou, I.E.; Castro-Melgar, I.; Nika, D.; Gatsios, T.; Lalechos, S.; Parcharidis, I. Application of time series INSAR (SBAS) method using sentinel-1 for monitoring ground deformation of the Aegina Island (Western Edge of Hellenic Volcanic Arc). Land 2024, 13, 485. [Google Scholar] [CrossRef]
- Alatza, S.; Papoutsis, I.; Paradissis, D.; Kontoes, C.; Papadopoulos, G.A.; Raptakis, C. InSAR time-series analysis for monitoring ground displacement trends in the western hellenic arc: The Kythira island, Greece. Geosciences 2020, 10, 293. [Google Scholar] [CrossRef]
- Conesa-garcía, C.; Tomás, R.; Herrera, G.; López-bermúdez, F.; Cano, M.; Navarro-hervás, F.; Pérez-cutillas, P. Deformational behaviours of alluvial units detected by Advanced Radar Interferometry in the Vega Media of the Segura River, southeast Spain. Geografiska Annaler: Series A, Physical Geography 2016, 98, 15–38. [Google Scholar] [CrossRef]
- Cigna, F.; Del Ventisette, C.; Liguori, V.; Casagli, N. Advanced radar-interpretation of InSAR time series for mapping and characterization of geological processes. Natural Hazards and Earth System Sciences 2011, 11, 865–881. [Google Scholar] [CrossRef]
- Lagios, E.; Sakkas, V.; Novali, F.; Ferreti, A.; Damiata, B.; Dietrich, V.J. Reviewing and updating (1996–2012) ground deformation in Nisyros Volcano (Greece) determined by GPS and SAR Interferometric Techniques (1996–2012). In Nisyros Volcano: The Kos-Yali-Nisyros Volcanic Field; Springer, 2017; pp. 285–301.
- Chen, Q.; Zhao, Z.; Zhou, J.; Zeng, M.; Xia, J.; Sun, T.; Zhao, X. New insights into the Pulang porphyry copper deposit in southwest China: Indication of alteration minerals detected using ASTER and WorldView-3 data. Remote Sensing 2021, 13, 2798. [Google Scholar] [CrossRef]
- Hewson, R.; van Ruitenbeek, F.; Hecker, C.; Soszynska, A.; van der Werff, H.; Bakker, W.; Portela, B.; van der Meer, F. Geological Remote Sensing From Continental to Exploration scales. In Reference module in earth systems and environmental sciences; Elsevier Doyma, 2024.
- Bobos, I.; Gomes, C. Mineralogy and geochemistry (HFSE and REE) of the present-day acid-sulfate types alteration from the active hydrothermal system of Furnas Volcano, São Miguel Island, The Azores Archipelago. Minerals 2021, 11, 335. [Google Scholar] [CrossRef]
- Pereira, M.; Matias, D.; Viveiros, F.; Moreno, L.; Silva, C.; Zanon, V.; Uchôa, J. The contribution of hydrothermal mineral alteration analysis and gas geothermometry for understanding high-temperature geothermal fields–the case of Ribeira Grande geothermal field, Azores. Geothermics 2022, 105, 102519. [Google Scholar] [CrossRef]
- Quintela, A.; Terroso, D.; Costa, C.; Sá, H.; Nunes, J.C.; Rocha, F. Characterization and evaluation of hydrothermally influenced clayey sediments from Caldeiras da Ribeira Grande fumarolic field (Azores Archipelago, Portugal) used for aesthetic and pelotherapy purposes. Environmental Earth Sciences 2015, 73, 2833–2842. [Google Scholar] [CrossRef]
- Petropoulos, G.P.; Griffiths, H.M.; Kalivas, D.P. Quantifying spatial and temporal vegetation recovery dynamics following a wildfire event in a Mediterranean landscape using EO data and GIS. Applied Geography 2014, 50, 120–131. [Google Scholar] [CrossRef]
- Trabucchi, M.; Puente, C.; Comin, F.A.; Olague, G.; Smith, S.V. Mapping erosion risk at the basin scale in a Mediterranean environment with opencast coal mines to target restoration actions. Regional Environmental Change 2012, 12, 675–687. [Google Scholar] [CrossRef]
- Siart, C.; Bubenzer, O.; Eitel, B. Combining digital elevation data (SRTM/ASTER), high resolution satellite imagery (Quickbird) and GIS for geomorphological mapping: A multi-component case study on Mediterranean karst in Central Crete. Geomorphology 2009, 112, 106–121. [Google Scholar] [CrossRef]
- Alexakis, D.D.; Tapoglou, E.; Vozinaki, A.E.K.; Tsanis, I.K. Integrated use of satellite remote sensing, artificial neural networks, field spectroscopy, and GIS in estimating crucial soil parameters in terms of soil erosion. Remote Sensing 2019, 11, 1106. [Google Scholar] [CrossRef]
- Kokkaliari, M.; Kanellopoulos, C.; Illiopoulos, I. Kaoline Mapping Using ASTER Satellite Imagery: The Case Study of Kefalos Peninsula, Kos Island. Materials Proceedings 2021, 5, 76. [Google Scholar] [CrossRef]
- Koerting, F.; Koellner, N.; Kuras, A.; Boesche, N.K.; Rogass, C.; Mielke, C.; Elger, K.; Altenberger, U. A solar optical hyperspectral library of rare-earth-bearing minerals, rare-earth oxide powders, copper-bearing minerals and Apliki mine surface samples. Earth System Science Data 2021, 13, 923–942. [Google Scholar] [CrossRef]
- Habashi, J.; Jamshid Moghadam, H.; Mohammady Oskouei, M.; Pour, A.B.; Hashim, M. PRISMA hyperspectral remote sensing data for mapping alteration minerals in sar-e-châh-e-shur region, birjand, Iran. Remote Sensing 2024, 16, 1277. [Google Scholar] [CrossRef]
- Rizaldy, A.; Afifi, A.J.; Ghamisi, P.; Gloaguen, R. Improving mineral classification using multimodal hyperspectral point cloud data and multi-stream neural network. Remote Sensing 2024, 16, 2336. [Google Scholar] [CrossRef]
- Riaza, A.; Buzzi, J.; García-Meléndez, E.; Carrère, V.; Müller, A. Monitoring the extent of contamination from acid mine drainage in the Iberian Pyrite Belt (SW Spain) using hyperspectral imagery. Remote Sensing 2011, 3, 2166–2186. [Google Scholar] [CrossRef]
- Pereira, J.; Pereira, A.; Gil, A.; Mantas, V.M. Lithology mapping with satellite images, fieldwork-based spectral data, and machine learning algorithms: The case study of Beiras Group (Central Portugal). Catena 2023, 220, 106653. [Google Scholar] [CrossRef]
- Mezned, N.; Abdeljaouad, S.; Boussema, M.R. Spectral modeling based on ground measurements for mine tailing mapping with Landsat ETM+ imagery. Applied Geomatics 2012, 4, 1–10. [Google Scholar] [CrossRef]
- Bouzidi, W.; Mezned, N.; Abdeljaoued, S. Potential Of Hyerion Data And Hypersectral Reflectance Spectroscopy For The Characterization Of Fe Iron Ore Deposits In The Nappe Zone In Northern Tunisia. In Proceedings of the 2020 Mediterranean and Middle-East Geoscience and Remote Sensing Symposium (M2GARSS). IEEE, 2020, pp. 152–155.
- Kavzoglu, T.; Colkesen, I.; Atesoglu, A.; Tonbul, H.; Yilmaz, E.O.; Ozlusoylu, S.; Ozturk, M.Y. Construction and implementation of a poplar spectral library based on phenological stages for land cover classification using high-resolution satellite images. International Journal of Remote Sensing 2024, 45, 2049–2072. [Google Scholar] [CrossRef]
- Ferrier, G.; Wadge, G. The application of imaging spectrometry data to mapping alteration zones associated with gold mineralization in southern Spain. International Journal of Remote Sensing 1996, 17, 331–350. [Google Scholar] [CrossRef]
- Van der Meer, F.; Vazquez-Torres, M.; Van Dijk, P. Spectral characterization of ophiolite lithologies in the Troodos Ophiolite complex of Cyprus and its potential in prospecting for massive sulphide deposits. International Journal of Remote Sensing 1997, 18, 1245–1257. [Google Scholar] [CrossRef]
- Grebby, S.; Cunningham, D.; Naden, J.; Tansey, K. Lithological mapping of the Troodos ophiolite, Cyprus, using airborne LiDAR topographic data. Remote Sensing of Environment 2010, 114, 713–724. [Google Scholar] [CrossRef]
- Quental, L.; Gonçalves, P.; de Oliveira, D.P.S.; Batista, M.J.; Matos, J.X.; Sousa, A.J.; Marsh, S.; Carreiras, J.; Dias, R.P. Multispectral and hyperspectral remote sensing as a source of knowledge in the Portuguese sector of the Iberian Pyrite Belt. Comunicações Geológicas 2020, 107, 21–39. [Google Scholar]
- Riaza, A.; Mediavilla, R.; Santisteban, J. Mapping geological stages of climate-dependent iron and clay weathering alteration on lithologically uniform sedimentary units using Thematic Mapper imagery (Tertiary Duero Basin, Spain). International Journal of Remote Sensing 2000, 21, 937–950. [Google Scholar] [CrossRef]
- Commission, E.; Directorate-General for Internal Market, Industry, E.; SMEs.; Grohol, M.; Veeh, C. Study on the critical raw materials for the EU 2023 – Final report; Publications Office of the European Union, 2023. https://doi.org/doi/10.2873/725585.
- Commission, E.; Directorate-General for Internal Market, Industry, E.; SMEs.; Bobba, S.; Carrara, S.; Huisman, J.; Mathieux, F.; Pavel, C. Critical raw materials for strategic technologies and sectors in the EU – A foresight study; Publications Office, 2020. https://doi.org/doi/10.2873/58081.
- Parliament, E.; of the European Council. Regulation (EU) 2024/1252 of the European Parliament and of the Council of 11 April 2024 establishing a framework for ensuring a secure and sustainable supply of critical raw materials and amending Regulations (EU) No 168/2013, (EU) 2018/858, (EU) 2018/1724 and (EU) 2019/1020 (Text with EEA relevance), 2024.
- Commission, E.; Directorate-General for Internal Market, Industry, E.; SMEs.; Blengini, G.A.; El Latunussa, C.; Eynard, U.; Torres De Matos, C.; Wittmer, D.; Georgitzikis, K.; Pavel, C.; et al. Study on the EU’s list of critical raw materials (2020) – Executive summary; Publications Office, 2020. https://doi.org/doi/10.2873/24089.
Figure 1.
Maps of the Mediterranean area in which the location of the geological mapping by RS is reported
Figure 1.
Maps of the Mediterranean area in which the location of the geological mapping by RS is reported
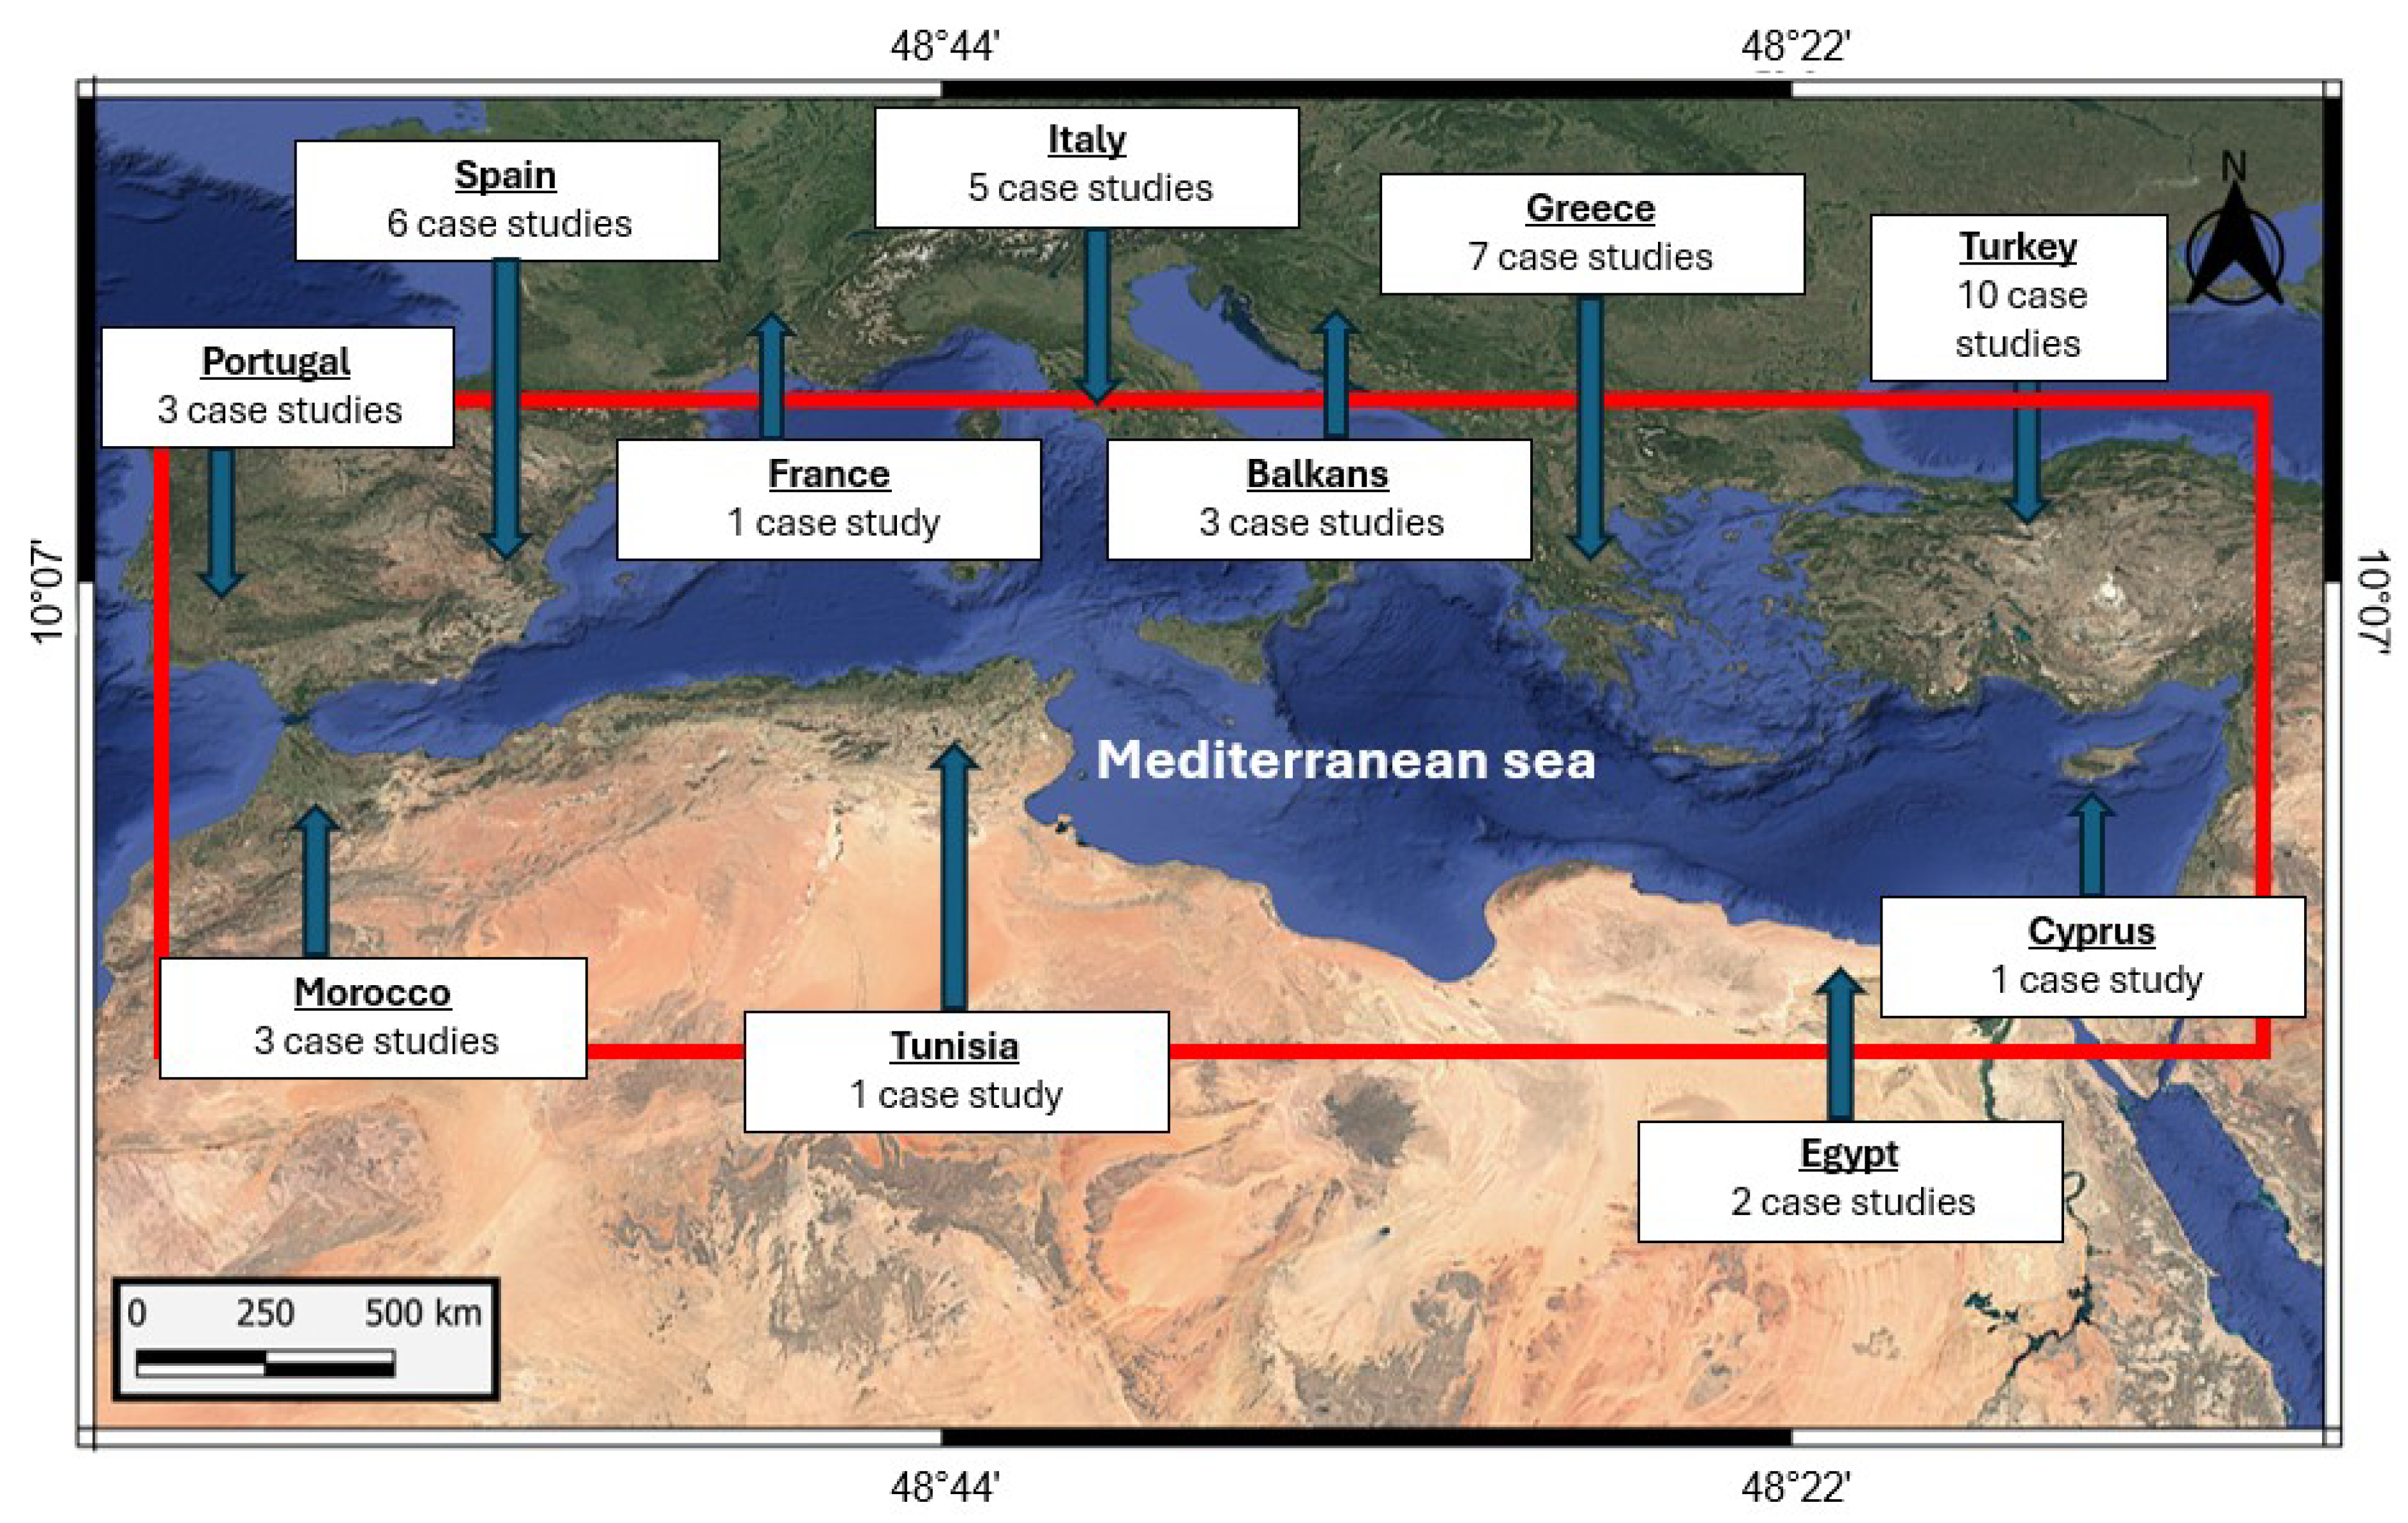

Table 1.
Satellite, Sensor, Spatial resolution, Temporal resolution, Type, Key Features, Application.
Table 1.
Satellite, Sensor, Spatial resolution, Temporal resolution, Type, Key Features, Application.
| Satellite | Sensor | Spatial resolution | Temporal resolution | Type | Key Features | Application |
|---|---|---|---|---|---|---|
| Sentinel-2 | MSI | 10–60 m | 5 days Multispectral | 13 bands, red-edge, high revisit rate | Lithological | alteration mapping, vegetation, archaeological analysis |
| Sentinel-1 | C-band sensor | 10 m | 6–12 days Radar (SAR) | Coherence-based analysis, all-weather capability | Forest classification, hydrothermal alteration detection, ground deformation monitoring | |
| Landsat 8 | OLI | 30 m | 16 days Multispectral | Long-term archive, mineral | land cover monitoring | Hydrothermal mapping, lithological discrimination |
| Terra | ASTER (VNIR, SWIR, TIR) | 15–90 m | 16 days Multispectral + Thermal | Thermal bands, mineral indices, DEM support | Hydrothermal zones, geothermal mapping | |
| Terra/Aqua | MODIS | 250 m–1 km | Daily Multispectral + Thermal | Daily coverage, LST products | Temporal geothermal studies | |
| EO-1 | Hyperion | 30 m | 16 days Hyperspectral | 220 bands, VNIR-SWIR, fine spectral resolution | Land use/cover classification, mineral mapping | |
| PRISMA | HYC + PAN | 30 m | 7 days Hyperspectral | 239 bands, atmospheric correction, surface reflectance | Hydrothermal mapping, archaeological | mineral studies |
| EnMAP | HIS | 30 m | 4 days Hyperspectral | 230 bands, global coverage, environmental focus | Geological | environmental mapping |
| Sentinel-2 + Ground Data | MSI + Gamma-ray | 10–60 m | 5 days Multispectral + gamma-ray | Integrated classification, SVM | RF algorithms | Lithological mapping |
| Landsat + DEM | OLI + DTM | 30 m | N/A Multispectral + Topographic | Integrated analysis, terrain enhancement | Alteration | mineral target detection |
| Sentinel-1 + Landsat | C-band sensor + OLI | 10–30 m | N/A Integrated | Unsupervised ML (DBSCAN, fuzzy C-means) | Prospectivity mapping | |
| ALOS, TerraSAR-X, Sentinel-1 | PALSAR (L-band), X-band, C-band sensor | 10 m | N/A Radar Interferometry | SBAS, PSInSAR, MTInSAR, advanced deformation tracking | Volcanic, tectonic, and coastal subsidence monitoring |
Table 2.
Satellite, Sensor, Processing method, Spectral Library Used.
| Satellite | Sensor | Processing Method | Spectral Library Used |
|---|---|---|---|
| Sentinel-2 | MSI | Pixel-based (spectral indices, SVM, RF) | Customized |
| Sentinel-1 | C-band sensor | SAR Interferometry (SBAS, PSInSAR) | N/A |
| Landsat 8 | OLI | Pixel-based (spectral indices, PCA) | Customized |
| Terra | ASTER (VNIR, SWIR, TIR) | Pixel-based (spectral indices, PCA) | Customized |
| Terra/Aqua | MODIS | Pixel-based (thermal time-series) | N/A |
| EO-1 | Hyperion | Sub-pixel (MESMA, spectral libraries) | USGS |
| PRISMA | HYC + PAN | Sub-pixel (spectral unmixing, indices) | USGS, Customized |
| EnMAP | HIS | Sub-pixel (unmixing, RTM models) | USGS, Customized |
| Sentinel-2 + Ground Data | MSI + Gamma-ray | Pixel-based (SVM, RF) | Customized |
| Landsat + DEM | OLI + DTM | Pixel-based (spectral indices) | Customized |
| Sentinel-1 + Landsat | C-band sensor + OLI | Mixed (SAR + DBSCAN, fuzzy C-means) | Customized |
| ALOS, TerraSAR-X, Sentinel-1 | PALSAR (L-band), X-band, C-band sensor | SAR Interferometry (SBAS, MTInSAR) | N/A |
Disclaimer/Publisher’s Note: The statements, opinions and data contained in all publications are solely those of the individual author(s) and contributor(s) and not of MDPI and/or the editor(s). MDPI and/or the editor(s) disclaim responsibility for any injury to people or property resulting from any ideas, methods, instructions or products referred to in the content. |
© 2025 by the authors. Licensee MDPI, Basel, Switzerland. This article is an open access article distributed under the terms and conditions of the Creative Commons Attribution (CC BY) license (http://creativecommons.org/licenses/by/4.0/).
Copyright: This open access article is published under a Creative Commons CC BY 4.0 license, which permit the free download, distribution, and reuse, provided that the author and preprint are cited in any reuse.


