Submitted:
28 August 2025
Posted:
29 August 2025
You are already at the latest version
Abstract
Background / Objective: In the isokinetic literature, relatively limited attention has been given to muscles of the wrist. Therefore, the objective of this study was to present an isokinetic profile of these muscles comprising the flexors (F), extensors (E), ulnar (U) and radial (R) deviators.
Method: The dominant side F, E, U and R in 40 healthy participants (20 women and 20 men) were tested concentrically and eccentrically, using a single speed of 90°/s.
Results: Men were significantly stronger than women in both the concentric and eccentric tests as indicated by both the absolute (Nm) or the bodyweight normalized (Nm/kgbw) representations. However, the bodyweight normalized women/men strength ratio (78.6±8.0%) was significantly higher than the absolute’s (64.1±6.6%). For both the concentric and eccentric effort and irrespective of the representation (absolute or normalized) the U was the strongest muscle group followed successively by F, R and E. This rank order was highly significant statistically. The eccentric/concentric strength ratios: E/CF and E/CU were significantly higher in men than in women with no remarkable inter-sex differences for E/CE and for E/CR. A correlational analysis which included all pairs of the basic isokinetic outcome parameters (e.g., the PM of Fcon) and performed with respect to ‘sex’ using Fisher’s r-to-z transformation, revealed that men had significantly higher overall correlation coefficients compared to women.
Conclusions: The uniformity of main findings with respect to both the sex of the participants and the various strength ratios strongly support the validity of the findings. Specifically, the original rank ordering of the wrist muscle can potentially serve as an additional and preliminary guideline for return to normal strength pattern in rehabilitation of the wrist.
Keywords:
Wrist
; Muscles
; Strength
; Isokinetic
1. Introduction
Compared to the characterization of the isokinetic strength of muscles operating on the shoulder and elbow joints, that which applies to the four major muscle groups of wrist: the flexors (F), extensors ( E), radial (R ) and ulnar (U) deviators has been very limited [1]. This scarcity has indeed been highlighted in a recent systematic review of wrist muscles strength which included the pronators and supinators [2]. Among other things, this relative void especially in the clinical domain, reflects some inherent factors. For example, isokinetic dynamometers are large, nonportable and expensive instruments compared to the small isometric instruments that may be employed in hand clinics. Furthermore, the complexity of the measurement exemplified by the multiplicity of parameters that need to be controlled, renders such examination less applicable. Specifically, there is no commonly accepted protocol for isokinetic testing of the wrist or grip muscles.
Indeed, isokinetic testing protocol of any muscle group consists of a number of critical parameters that must be maintained in order for the test findings to be interpretable. Specifically with respect to the muscle of the wrist the main factors include the segment position, e.g., forearm in neutral vs. pronated or supinated position, body position, e.g., in sitting or in standing, the range of segmental motion, the angular speed of joint motion, the speed ramping (low vs. high acceleration/deceleration mode) and absence or use of verbal encouragement (1). Furthermore, the age and the sex of the participants are major confounding factors. Especially the latter has two ramifications. First, strength findings derived from women cannot be compared with those of men. As strongly indicated with respect to the absolute isokinetic strength of the wrist flexors (F) and extensors (E), women were about 60% as strong as men [3,4,5,6,7]. Second, and as a direct consequence, mixing of women and men into a single study group is strictly forbidden, leading to non-interpretable results exemplified by several previous studies [8,9,10,11]. In addition to these hurdles, isokinetic studies of wrist muscles strength which were based a small number of participants [4,5,6,7,8,9,10,11], or the use of force (N) rather than moment (torque) values, likewise preclude interpretation [12].
Most isokinetic studies of wrist muscles focused on the F and E. In terms of sample size (N>20) and separation of findings according to sex, 6 studies stand out [3,5,6,7,13,14]. These studies were largely limited to concentric testing although the more recent addition of an eccentric component introduced a new dimension and understanding of wrist muscles action [7,15].
In spite of a variety of protocols, in all studies that focused on F and E, the former muscles were stronger than the latter, in both sexes alike, resulting in a maximal strength ratio: F/E of between 1.7-2.4. On the other hand, isokinetic assessment of the U and D muscles has been sparsely explored and based on a small number of participants [16,17]. Given the disparity of findings between the two papers and omission of reference to the test range of motion (RoM) in both, the derived findings from these studies should be viewed with care. Conspicuously, only two studies included isokinetic measurements of all four muscle groups. Ağırman et al. (2017) used a mixed-sex patient group with carpal tunnel syndrome (11 women, 2 men, age range 29-60) and six healthy control subjects (4 women, 2 men, with a similar age range), to test the concentric strength of all wrist muscles at 30°/s [18]. However, due to the sex-pooling, very low strength and wide age range, this study cannot serve as a valid source. In another study, Chu et al. (2018) followed up the increase in wrist muscles strength in 9 male subjects, who have undergone targeted training, with 10 controls. However, at baseline, U strength was reported as significantly lower than that of the F and on a par with that of the E while post-training, the gain in U strength was 2.5-3 times that of the other 3 muscle groups [17]. These findings render it difficult to use this study as a basis for comparison.
Beside adding to the relatively poor knowledge regarding wrist muscles strength, the importance of such an analysis is in presenting a systematic strength order paradigm that depicts the strength inter-relationships among the operating muscles. This paradigm may then help clinicians in deciding whether post-treatment strength normalization has been reached or alternatively if one or more muscles have been ‘left behind’, if such normalization is one of the treatment objectives.
Therefore, the objectives of this study were as twofold: 1. Derive the maximal isokinetic strength profile: concentric and eccentric, of the wrist F, E, U and R in healthy women and men 2. Establish a strength paradigm which depicts the inter-muscles relationships in terms of both the absolute (Nm) and bodyweight normalized (Nm/kgbw) units.
2. Materials and Methods
2.1. Participants
Forty healthy participants, 20 women and 20 men, students and staff at the Levinsky-Wingate Academic College were recruited via social media and notice board. All were right side dominant. The mean (SD) age (y), stature (cm), weight (kgf) and BMI of the women were 25.8(2.9), 163(6.0), 59.1(8.9) and 22.3(3.0), respectively, while the parallel values for men were 25.5(2.3), 176.3(7.3), 74.3(9.9) and 23.8(2.5). All participants were R-side dominant and none had a medical history relating to the forearm-hand territory and none of the women were pregnant during the time of testing. This study was approved by the IRB of the Levinsky-Wingate Academic College (Wingate Campus), N. 414, 13.07.23.
2.2. Experimental Procedure
2.2.1. Instrumentation
Participants’ stature and weight were measured using a stadiometer (Tanita Leicester Height Measure, England) and a calibrated digital scale (Lifebl312, China), respectively. The isokinetic strength measurements were carried out using a Biodex System 4 Pro isokinetic dynamometer (Shirley, NY) which was calibrated prior to the commencement of the study.
2.2.2. Test Protocol
Unilateral (R side) isokinetic concentric (Con) and eccentric (Ecc) strengths of the wrist F, E, U and R were measured in a single session. The participants were asked not to engage in any strenuous upper limb activity including training over the 48h preceding the test session. To maintain the forearm in neutral pronation-supination position in both F-E and U-R testing, the mechanical constraints of the dynamometer dictated a different body position. Thus, F and E tests were conducted in standing (Figure 1) with the elbow flexed at 60-75° so that hand motion took place in the horizontal plane namely with the dynamometer shaft in vertical position (7,19). Testing R and U was performed in sitting while the dynamometer’s axis was aligned with the capitate bone and the fingers gripped a handle whose location was adjusted individually (Figure 2). Motion took place in the vertical plane. No correction for hand weight was applied due to the negligible gravitational effect of around 0.4Nm [19]. Axes alignment for both F-E and R-U was made with respect to the radio-carpal joint while the fingers gripped a cylindrical handle which extended from dynamometer’s lever arm at an individually matched distance. As well, in both tests the RoM spanned an arch of 45°; in F-E from 5° of E to 40° of flexion while in R-U, from 5° of R to 40° of U. The angular speed was set at 90°/s for all tests.
Of note, the RoM and speed conditions were selected based on previous studies and in line with participants’ comfort and ability to exert sufficient resistive moment to initiate eccentric action. As for the relatively short RoM, a series of studies using isokinetic short range of motion (SRoM) vs. commonly employed RoMs had strongly supported the application of the former in healthy participants as well as in patients in different joints including the wrist [19,20,21]. In addition, all individual isokinetic curves were inspected during the tests to ensure that the PM in each of the muscle groups was reached within the specified RoM. Following general warm up and familiarization which consisted of 3 increasing (50, 70% and maximal) levels of effort, the criterion tests consisted of 3 reciprocal pairs of maximal Con and Ecc contractions of each of the 4 muscle groups. No verbal encouragement was given by the examiner to the participants during the tests
2.3. Statistical Analysis
Data analysis was performed using the SPSS (v. 29.0) program. The maximal individual strength value—peak moment (PM, in Nm) – out of the 3 maximal repetitions for each individual muscle, movement and contraction was used as the representative outcome score. Significance was set at p<0.05. For descriptive statistics, quantitative variables were described using the mean (SD).
The following four ratios were calculated: Within muscle eccentric to concentric ratio (E/C) namely: E/CF , E/CE , E/CU and E/CRF 2. Between antagonistic muscles but the same contraction mode, namely: F/Econ, F/Eecc, U/Rcon and U/Recc. Each PM score was examined for normality assumption via skewness (SK<[2.0]) and kurtosis (K<7.00) procedures. Skewness values ranged between – 0.15 and 1.28 and kurtosis values ranged between – (-1.03) and 3.70, justifying the assumption of normal distribution for all variables [22].
An independent t-test was conducted to compare the PM values and the ratio values between men and women. A three-way ANOVA with repeated measures was conducted on PM variables, two within factors as follows: 4 muscles X 2 con—traction modes and one between factor (sex). This analysis revealed two noteworthy results: a significant interaction between sex and the 2 main effects (muscle group, contraction mode), which indicated that women and men reacted differently in each condition. In addition, there was a significant difference between the sexes with high effect size η2=0.62. Therefore, a 2-way ANOVA with repeated measures model of the form: 4 muscles X 2 contraction modes was used for each sex separately. For the calculated ratios, a Mixed ANOVA was applied with one repeated variable (muscle) and sex as a between variable. To compare women vs. men in terms of overall correlation patterns among the PMs, a Mann-Whitney test was conducted with respect to the Fisher’s Z-transformed correlation values.
3. Results
None of the participants complained of inconvenience or pain during or following the tests. The mean±SD values of the Con and Ecc absolute and bodyweight normalized strength of the F, E, U and R and the sex-based strength ratio of women vs. men: PMW/PMM (expressed in %), are outlined in Table 1.
An independent samples t-test was conducted to examine between-sex differences in terms of absolute and normalized strength. The results indicated that men were significantly stronger than women, by both representations, across all measured muscle groups, with the exception of the normalized Con strength of F and U. To examine the difference between the ratios: PMW/PMM (absolute and normalized), a paired samples t-test revealed that the normalized ratio (78.6±8.0%) was significantly higher than the absolute’s (64.1±6.6%) with a mean difference of 14.9±1.1% (t [7] = 29.00, p < .001, Cohen’s d = 10.25).
Regarding the strength order of the 4 muscle groups, irrespective of contraction (Con or Ecc) or representation (absolute or normalized) the U was the strongest followed successively by F, R and E, graphically demonstrated by the strength polygon (Figure 3). To gain further insight into the inter-muscle relationship, the PM values of the F, E and R were expressed as percentage of the U (Figure 4). A three-way mixed ANOVA was conducted on the relative values including two within-subject factors: ‘muscle’ and ‘contraction mode’ and one between-subject factor (‘sex’). The analysis revealed statistically significant differences for all these main effects. Regardless of the first two factors, men demonstrated significantly higher values compared to women: 55.1%±9.4% vs. 47.2%±9.4%, respectively F(1,38) = 7.10, p < .01, η² = .156. Eccentric contractions yielded significantly higher values than their Con counterparts: 53.6%±1.7% vs. 48.8%±1.4%, respectively, F(1,38) = 63.38, p < .01, η² = .625. Specifically, the F produced significantly higher values than the R which in turn were associated with significantly higher values than the E: 64.8%±14.9%, 54.6%±10.9% and 34%.1±6.2%, respectively, F(2,76) = 79.84, p < .01, η² = .678.
Additionally, a significant interaction between contraction mode and muscle was observed: F (2,76) = 26.61, p < 0.01, η² = 0.412. Post-hoc analyses revealed that Ecc contractions yielded significantly higher values compared to Con contractions for R (58.6% ± 11.2% vs. 50.7% ± 10.8%, p < 0.01) in E movements (36.9% ± 6.4% vs. 31.2% ± 6.2%, p < 0.01), while no significant difference was found for F movement (65.2% ± 10.0% vs. 64.4% ± 10.5%, p = 0.319). Finally, sex-related differences varied as a function of muscle group and contraction mode. Men demonstrated significantly higher relative strength than women in both contraction modes for R and in Con contractions for E, while no significant sex differences were observed for F muscles across either contraction mode (Figure 4).
Using a two-way ANOVA with repeated measures, two types of ratios were examined: 1. Within ‘muscle’- between ‘contraction’, namely: E/CF, E/CE, E/CU and E/CR; 2. Between ‘muscle’—same ‘contraction’, namely: F/Econ, F/Eecc, U/Rcon and U/Recc. The values for the above ratios are outlined in Table 2. As for the first series of ratios, the main findings revealed that the E/CF and E/CU were significantly higher (p<0.001, p<0.001) in men than in women with no remarkable inter-sex differences for E/CE and for E/CR. Moreover, for both sexes the E/CU was the lowest ratio. With respect to the second series of ratios, the pairwise comparison revealed that the ratio values for men were significantly lower (p<0.001, p<0.01) in U/Rcon and in U/Recc, compared to the women’s, with no remarkable inter-sex differences for F/Econ and F/Eecc. The analysis also revealed that in both women and men F/Econ was significantly higher (p<0.001, p<0.001) than F/Eecc, while U/Rcon was significantly higher than Uecc/Recc (p<0.05, p<0.001). Furthermore, the results show that the order of the ratio values for men and women were generally similar with some minor differences.
Finally, a correlational analysis (Table 3) that included all pairs of the basic isokinetic outcome parameters (e.g., the PM of Fcon and Fecc) was performed with respect to ‘sex’. To compare the overall difference between the two correlation matrices (women and men) the Fisher’s r-to-z transformation for each pair was first used followed by a Mann-Whitney test. The analysis revealed that men had higher overall correlation coefficients compared to women: z = -2.95, p=.003. The findings outlined in the table also indicate that in both sexes there were significant and high correlations between the PMs of the ‘within-muscle’ Con and Ecc values (r= 0.89-0.97). Furthermore, in both sexes there were significant but moderate correlations between the PMs of the ‘between-muscle’ Con and Ecc values of F and U (0.49-0.63).
4. Discussion
This study focused on the Con and Ecc strength of the wrist muscles and their sex-related variations. The main finding is that for both contraction types and irrespective of sex, the strongest wrist muscle group is the U followed successively by the F, R and E. In addition, based on the inter-muscular correlations, women and men differ significantly in what may be termed as the inter-muscle strength pattern (IMSP).
The significance of the wrist muscles strength order lies both with the anatomical-biomechanical and the clinical domains. While the former is primarily a reflection of the force vectors of the operating muscles and their associated lever arms, the latter could provide an additional guideline in rehabilitation of wrist injury especially in the presence of muscle strength deficiency. Given the particular importance of both, a preliminary assessment of the validity of the strength polygon is self-evident. Such an assessment may be approached through three different venues. One, which is based on comparison to previous findings relating to all 4 muscle groups was ruled out since the available studies could not serve this purpose for reasons highlighted above [17,18]. Therefore, a more limited approach is to compare to F and E strengths which were explored in studies that related to both sexes, employed a substantially similar test protocol, and applied the same dynamometer. Close similarity between the former and the current findings albeit relating to only 2/4 patterns, would provide a preliminary basis for the validity of the strength polygon. However, prior to such comparison, an important qualifying factor should be considered. With one exception all past studies relating to wrist muscles strength placed the hand of the tested side in grip configuration [15]. This is in fact a direct result of the design of all wrist muscles testing attachments serving in any of the commercially available isokinetic dynamometers, namely the use of a forearm support that provides proximal stabilization and a handle which allows solid grip during the test. Thus, the recorded isokinetic strength reflects, at least with respect to wrist F, the cumulative effect of the actual wrist flexors as well as that of the muscles responsible for the grip.
A number of studies that quoted sex-based values and used the same angular speed (90°/s) can serve this purpose. Forthomme et al. (2002) reported a mean (SD) concentric PM of the F of 14.6±3.4 Nm (0.26±0.06 normalized) and 26.7±4.5 (0.35±0.04), in women and men, respectively [3]. The respective figures for E were 6.9±1.8 (0.12±0.03) and 10.5±1.8Nm (0.14±0.02). In another study relating to the age decade 20-29, the PM for F in women was 10.7±2.4 and 18.4±3.8 in men vs. E strength of 5.7(1.4) and 9.4±1.6Nm, respectively [5]. In a similar study of isokinetic strength in both sexes which was spread over a wide age range, the F strength in women (N=72) was 13.1± 2.8 whereas for men (N=90) it was 22.1±5.5Nm. The respective values for E were 6.0±1.7 and 11.4±3.1Nm [6]. Finally in a recent study which employed a slightly higher speed (120°/s) and two groups of women and men (totally different from the current study) the F strengths were 10.7±2.0Nm (0.18±0.04 Nm/kgbw) and 17.9±3.6 (0.24±0.05), in women and men, respectively. The parallel values for E strengths were 5.84±1.6 (0.10±0.02) and 9.4±2.5 (0.13±0.03 Nm/kgbw) [7]. Thus, except for one study whose mean values exceeded the current findings systematically by about 25%, the other reported values closely align with those derived from the present study. As for the F/Econ ratio, the present values of 2.05±0.76 and 2.34±0.48, in men and women respectively, should be compared with those obtained by Forthomme et al.: 2.17±0.63 (men) and 2.55±0.29 (women) and Harbo et al.: 1.94 and 2.2, respectively, indicating good to excellent agreement among the studies.
The second venue relates to the internal E/C ratios. When applying the same speed in maximal effort testing, the ECR is > 1, a physiological variant that has been reported in practically all isokinetic studies to-date [23]. In this study all ECRs were >1, ranging from 1.04 to 1.32. Of note, the higher scores were calculated for E/CE and E/CRD with almost perfect inter-sex similarity. For F and U, the values were lower in both sexes and significantly lower still in women compared to men. One possible explanation for this variation is the relatively higher Con vs. Ecc strength associated with the F and U muscle groups which could possibly result from a higher exposure to concentric powerful contractions of these muscles.
The third venue relates to the inter-sex strength ratios—PMW/PMM. In particular, the absolute (Nm) ratios ranged 0.57-0.75, with a mean value of 0.66 and 0.62 for the Con and Ecc PMs, respectively, and an overall mean of 0.64. In a recent comprehensive review that assessed principally the sex-related aspects of muscle strength and endurance, the global (all muscles) Con PMW/PMM ratio stood at around 0.6 [24]. Specifically with respect to the wrist F and E and based on the studies by Harbo and Dannes (2012), this ratio was on average 0.6 for the F and slightly smaller for the E, around 0.55 [6]. No parallel figures were quoted for either the R or the U [6]. In another study, the calculated values of the PMW/PMM ratio for Con isokinetic efforts at 30 and 90°/s and Ecc at 60°/s were 0.6, 0.55 and 0.58, respectively [3]. The slight differences between the present findings and those derived from the abovementioned studies may also be the result of the difference between the test position of the hand, in the gravitational vs. the nongravitational planes, in the former and latter, respectively. However, probably the most valid comparison is to the findings derived from a previous study carried out by our group on a different group of same age range participants in which the only difference was in the testing speed: 120 instead of 90°/s. The absolute PMW/PMM ratio was 0.6 for Fcon, Fecc and Eecc and 0.62 for Econ and thus in excellent agreement with the current findings. The increase in the normalized (Nm/kgbw) PMW/PMM ratio by around 15%, has been highlighted in a recent systematic review with particular reference to wrist muscles [2]. This aligns with parallel findings relating to other muscles in the body [25], while underlying the importance of bodyweight and sex in predictive equation of strength, see e.g., [26]. In the light of this finding, we recommend the parallel use of absolute and normalized isokinetic strength scores.
It is therefore suggested that the collective evidence supports the validity of the findings. Moreover, in spite of the serious dearth of data relating to U and R, we maintain that the strict adherence to the protocol in all possible aspects, in addition to testing of same subjects in a single session yet in random order of F-E vs. UD-RD, ensures that the strength polygon is a valid reflection of the isokinetic strength order of the wrist muscles, derived from the described test protocol. The latter, should be well borne in mind, given the sensitivity of isokinetic tests to the exact test protocols and we therefore suggest that for the sake of standardization, future isokinetic studies of these muscles are conducted along the same test conditions.
In trying to elucidate the underlying factor/s for the strength polygon, it is worth considering that ultimately, two elements take part in generating a moment around an axis: the magnitude of the force and its moment arm (MA). In biological terms, these are embodied respectively by the tension (in N) developed in the relevant muscle and its direction (in angular values) relative to a fixed coordinate system, and the distance (in mm) between that vector and the axis around which the 3D joint motion takes place. Noteworthy, the magnitude of the vector depends on the invariable muscle/s mass, physiological cross-sectional area (PCSA) and fiber length [27], as well as on the level of activation, relative to the maximum which most commonly is defined in terms of maximal isometric contraction. Thus, studies on human cadavers which typically relate to the muscle/s’s PCSA but do not include MA data are of limited importance in the present context [28,29,30]. Of note, the data presented in these studies, which were based on diverse yet very small samples, indicated significant variations although the PCSA and masses of U and F muscles were quite similar with differences of 1-11%. Quite surprisingly, the PCSA and mass of the E were the highest, but without reference to the associated MAs the strength order of the muscles could not be estimated. This was done in a study which tested the isometric strength of the 4 muscle groups using a custom-made dynamometer instrumented with a rotating load cell whose axis was aligned with the capitate bone [31]. The mean peak isometric flexion moment was 12.2±3.7 Nm, while the parallel values for E, U and R were 7.1±2.1, 9.5±2.2 and 11.0±2.0 Nm, respectively. Thus, not only were the absolute isometric strength values much lower than those obtained in the present study, the strength order of the muscles was different: F > R > U > E. Significantly, by estimation, F strength was greater than the U’s by around 30% whereas in the current study U > F by more than 50%.
Although we did not conduct isometric measurements, based on the moment-angular speed (torque-velocity) function, the value of the isometric strength normally lies between the moment values of the concentric and eccentric contractions. Therefore, by very gross interpolation and based on the current results, the isometric strength of the U, F, R and E in the male participants in this study would have been around 28, 18, 17 and 10, respectively, namely substantially higher than the previously reported values [31]. However, this disparity on its own does not provide sufficient explanation since isometric strength differs significantly from its isokinetic counterpart [23] and therefore a direct comparison should not be attempted.
On the other hand, the differences in the MAs caused by a substantially different location of the center of rotation (CoR) cannot be overlooked. Specifically aligning the CoR with the capitate for the isometric measurements [31] vs. the use of the radiocarpal joint’s CoR in the present study may seriously affect the findings. Based on radiological data extracted from Indian women and men, the distance between the middle of the capitate and the radiocarpal joint is around 20mm [32]. Furthermore 1. the CoR during isokinetic motion is constantly varying whereas in maximal isometric exertions, the CoR would be stationary once the bones are in tight position 2. The test position was different: neutral (midway between pronation-supination) vs. supinatory in the present and the Delp et al. studies, respectively, probably affecting the recorded findings [27]. Indeed, as demonstrated before in a study focusing on estimation of the wrist joint’s CoR, the method applied for this purpose may have a massive effect on the results [33]. As well, the models and the experimental set-ups have limited the analysis to the 6 ‘wrist only’ muscles while leaving the extrinsic muscles operating on the fingers outside the picture in spite of their role in the actions explored [15]. However, to actually test the effect the varying MAs may have on the present results would require on-line imaging or noninvasive marking of the bones comprising the wrist while monitoring the tendon-associated vectors and level of activity in the muscles that operate on the wrist of live subjects during the isokinetic test. Such a task would be profoundly challenging, at the slightest, from the technical point of view. Alternatively, modelling of this system could serve this objective and shed some light on the major factors taking place in producing the moments recorded in this study. Equally, further research that is based on different isokinetic dynamometers, same alignment axes and more diverse protocols, e.g., including isometric measurements and additional speeds could assist in obtaining a comprehensive strength profile of the wrist muscles.
The other major finding emerging from this study, indicated that men had significantly (p=.003) higher overall inter-muscular correlation values compared to women. The same inter-muscle strength pattern (IMSP) was observed for the first time in a recent study conducted by our group [7] which was limited to exploring the Con / Ecc strength of the F and E in both sexes. In the present study this finding was expanded to include the U and R. A comprehensive literature search failed to produce a similar finding but a recent review indicated that men participation in strength training was more intensive than women [24]. Moreover, “Men are motivated more by challenge, competition, social recognition, and a desire to increase muscle size and strength…and also have greater preference for competitive, high-intensity, and upper-body exercise whereas women are motivated more by improved attractiveness, muscle “toning,” and body mass management” (p. 494). This emphasis on upper body exercise would reflect on the strength of the wrist muscles but the IMSP is not about the strength per se, absolute or normalized, but on the strength relationships among the muscles.
In the absence of relevant previous research, we speculate that the more pronounced IMSP is probably a result of the need imposed on the muscles to increase the level of muscular co-activation in order to produce higher moments about the wrist. Significantly, none of the 4 movement patterns is a product of a single muscle, namely, movement against resistance requires co-contraction of 2 or 3 out of the 6 muscles operating on the wrist according to the direction: for U—Flexor carpi ulnaris (FCU) + Extensor carpi ulnaris (ECU), for F—FCU + Flexor carpi radialis (FCR), for R—FCR + extensor carpi radialis longus (ECRL) + extensor carpi radialis brevis (ECRB) and for E—ECU + ECRL + ECRB. In order to maximize the moment output, these muscles have to work together and the higher the demand, the higher the level of co-contraction as is well established [34,35]. Of note, any pair of muscles in the above have one directional movement in common and one that is opposite. For example, to produce forceful U, FCU and ECU are coactivated but whereas they are agonists for U, the first is also a flexor (FCU) while the second (ECU) is an extensor. The other 3 movement actions demonstrate the same principle. This simultaneous agonism-antagonism action pattern that occurs more often and at a higher intensity in men compared to women, most probably leads to the significantly higher IMSP in men. Research focusing on the within- and between-sex differences in IMSP relating to lower and upper extremity muscles that operate multiple planes of motion joints is needed to shed further light on this challenging relationship.
One methodological limitation associated with this study is the sensitivity of isokinetic assessment to the test protocol and associated external parameters. Thus, strict adherence to the same test position, axes alignment, RoM and speed as well as reference to sex and age, are prerequisites for comparison of future to present findings. In addition, the experimental design did not include isometric contractions and/or additional angular speeds that would further validate the shape of the strength polygon and the superiority of the IMSP in men compared to women.
5. Conclusions
Concentric and eccentric isokinetic profiling of the wrist muscles in women and men reveals that the ulnar deviators are the strongest muscle group followed consecutively by the flexors, radial deviators and extensors. This main finding, as well as other internal strength ratios was uniform in both sexes lending further support to the validity of the findings. In addition, the inter-muscle strength correlations were significantly higher in men compared to women, a phenomenon that may be explained by adaptive/functional factors.
Author Contributions
Conceptualization, ZD, SP, ES; methodology, ZD, ES, SP; analysis of data, MA; data curation, ES; writing—original draft preparation, ZD, SP; writing—review and editing, ZD; supervision, ZD; project administration, SP. All authors have read and agreed to the published version of the manuscript.
Funding
This research received no external funding.
Institutional Review Board Statement
This study was approved by the IRB of the Levinsky-Wingate Academic College (Wingate Campus), N. 414, 13.07.23.
Informed Consent Statement
Informed consent was obtained from all participants.
Data Availability Statement
The datasets associated with the present study are available from the corresponding author upon reasonable request.
Conflicts of Interest
None to declare by any of the authors.
Abbreviations
The following abbreviations are used in this manuscript:
| Con | concentric |
| CoR | Center of Rotation |
| E/CE | PM-based eccentric to concentric ratio of the extensors |
| E/CF | PM-based eccentric to concentric ratio of the flexors |
| E/CR | PM-based eccentric to concentric ratio of the radial deviators |
| E/CU | PM-based eccentric to concentric ratio of the ulnar deviators |
| E | extensors |
| Ecc | eccentric |
| F | flexors |
| F/Econ | concentric PM-based flexors to extensors ratio |
| F/Eecc | eccentric PM-based flexors to extensors ratio |
| MA | moment arm |
| PCSA | physiological cross-section area |
| R | radial deviators |
| RoM | Range of Motion |
| U | ulnar deviators |
| U/Rcon | concentric PM-based ulnar to radial deviators ratio |
| U/Recc | eccentric PM-based ulnar to radial deviators ratio |
References
- Dvir, Z. Isokinetics of the elbow and forearm / wrist muscles. In Isokinetics: Muscle Testing, Interpretation and Clinical Applications, 3rd ed., Dvir Z, Ed. Routledge, New York, NY, USA, 2025: 289-312.
- Napper, A.D.; Sayal, M.K.; Holmes, M.W.; Cudlip, A.C. Sex differences in wrist strength: a systematic review. PeerJ 2023, 11, e16557. [Google Scholar] [CrossRef] [PubMed]
- Forthomme, B.; Croisier, J.; Foidart-Dessalle, M.; Crielaard, J. Isokinetic assessment of the forearm and wrist muscles. Isokinet. Exerc. Sci. 2002, 10, 121–128. [Google Scholar] [CrossRef]
- Morse, J.L.; Jung, M.-C.; Bashford, G.R.; Hallbeck, M.S. Maximal dynamic grip force and wrist torque: The effects of gender, exertion direction, angular velocity, and wrist angle. Appl. Ergon. 2006, 37, 737–742. [Google Scholar] [CrossRef] [PubMed]
- Danneskiold-Samsoe B, Bartels EM Bulow PM Lund H. Stockmarr A, Holm CC, Watjen I, Appleyard M, Bliddal H. Isokinetic and Isometric Muscle Strength in a Healthy Population with Special Reference to Age and Gender. Acta Physiol (Oxf) 2009, 197 (Suppl 673), 1–68. [CrossRef]
- Harbo, T.; Brincks, J.; Andersen, H. Maximal isokinetic and isometric muscle strength of major muscle groups related to age, body mass, height, and sex in 178 healthy subjects. Eur. J. Appl. Physiol. 2011, 112, 267–275. [Google Scholar] [CrossRef]
- Shemy, E.; Okada, T.; Arnon, M.; Peleg, S. Isokinetic profile of the wrist flexors and extensors in young women and men. Isokinet. Exerc. Sci. 2025, 33, 116–122. [Google Scholar] [CrossRef]
- Lee, S.-Y.; Chieh, H.-F.; Lin, C.-J.; Jou, I.-M.; Kuo, L.-C.; Su, F.-C.; Zhao, C. The Potential Risk Factors Relevant to Lateral Epicondylitis by Wrist Coupling Posture. PLOS ONE 2016, 11, e0155379. [Google Scholar] [CrossRef]
- Lucado, A.; Fraher, L.; Patel, H.; Munck, G. Comparison of portable handheld versus fixed isokinetic dynamometers in measuring strength of the wrist and forearm. Physiother. Theory Pr. 2018, 35, 1–9. [Google Scholar] [CrossRef]
- Seven, B.; Cobanoglu, G.; Oskay, D.; Atalay-Guzel, N. Test–Retest Reliability of Isokinetic Wrist Strength and Proprioception Measurements. J. Sport Rehabilitation 2019, 28. [Google Scholar] [CrossRef]
- Prando, B.C.; Carvalho, C.; Petrella, M.; Serrão, P.R.M.d.S. Test-retest reliability of isometric and isokinetic wrist strength. J. Orthop. Sci. 2023, 28, 138–142. [Google Scholar] [CrossRef] [PubMed]
- Unyó, C.; Chaler, J.; Rojas-Martínez, M.; Pujol, E.; Müller, B.; Garreta, R.; Mañanas, M.A. A cross-sectional study comparing strength profile of dorsal and palmar flexor muscles of the wrist in epicondylitis and healthy men. . 2012, 49, 507–15. [Google Scholar]
- Marley, R.J.; Thomson, M.R. Isokinetic strength characteristics in wrist flexion and extension. Int. J. Ind. Ergon. 2000, 25, 633–643. [Google Scholar] [CrossRef]
- Poulis, S.; Rapanakis, P.; Pastra, X.; Poulis, I.; Soames, R. Force-velocity relationship of the wrist flexors and extensors: The influence of small and large handgrips. Isokinet. Exerc. Sci. 2003, 11, 101–108. [Google Scholar] [CrossRef]
- Peleg, S.; Shemy, E.; Okada, T.; Arnon, M.; Dvir, Z. Applying grip during isokinetic testing significantly impacts the concentric and eccentric strength of the wrist flexors. J. Hand Ther. 2025. [Google Scholar] [CrossRef]
- Kauranen, K.; Siira, P.; Vanharanta, H. The effect of strapping on the motor performance of the ankle and wrist joints. Scand. J. Med. Sci. Sports 1997, 7, 238–243. [Google Scholar] [CrossRef] [PubMed]
- Chu, E.; Kim, Y.-S.; Hill, G.; Kim, Y.H.; Kim, C.K.; Shim, J.K. Wrist Resistance Training Improves Motor Control and Strength. J. Strength Cond. Res. 2018, 32, 962–969. [Google Scholar] [CrossRef] [PubMed]
- Agirman, M.; Kara, A.; Durmus, O.; Saral, I.; Cakar, E. Isokinetic Evaluation of Wrist Muscle Strength in Patients of Carpal Tunnel Syndrome. Eklem Hastalik Cerrahisi 2017, 28(1):41-5.
- Reichard, B.; Katz-Leurer, M.; Rubinstein, M.; Croisier, J.-L.; Dvir, Z. Short Range of Motion Isokinetic Testing of Wrist Flexor and Extensor Strength in Normal Subjects and Patients with Carpal Tunnel Syndrome. J. Strength Cond. Res. 2010, 24, 1866–1873. [Google Scholar] [CrossRef]
- Reichard, L.B.; Croisier, J.L.; Malnati, M.; Katz-Leurer, M.; Dvir, Z. Testing knee extension and flexion strength at different ranges of motion: an isokinetic and electromyographic study. Eur. J. Appl. Physiol. 2005, 95, 371–376. [Google Scholar] [CrossRef]
- Dvir, Z.; Keating, J.L. Trunk Extension Effort in Patients With Chronic Low Back Dysfunction. Spine 2003, 28, 685–692. [Google Scholar] [CrossRef]
- Hair, J.F.; Black, W.C.; Babin, B.J.; Anderson, R.E. Multivariate Data Analysis, 7th Ed, Pearson Education Harlow, Essex, 2014.
- Dvir, Z. General issues in isokinetic testing. In Isokinetics: Muscle Testing, Interpretation and Clinical Applications. 3rd ed., Dvir Z, Ed. Routledge, New York, NY, USA, 2025: 3-38.
- Nuzzo, J.L. Narrative Review of Sex Differences in Muscle Strength, Endurance, Activation, Size, Fiber Type, and Strength Training Participation Rates, Preferences, Motivations, Injuries, and Neuromuscular Adaptations. J. Strength Cond. Res. 2022, 37, 494–536. [Google Scholar] [CrossRef] [PubMed]
- Dvir, Z.; Chaler, J. Reproducibility and interpretation of isokinetic test findings. In Isokinetics: Muscle Testing, Interpretation and Clinical Applications. 3rd ed., Dvir Z, Ed. Routledge, New York, NY, USA, 2025: 39-72.
- Zhang, Y.; Chen, K.; Liu, K.; Wang, Q.; Ma, Y.; Pang, B.; Huang, L.; Ma, Y. New prediction equations for knee isokinetic strength in young and middle-aged non-athletes. BMC Public Heal. 2023, 23, 1–8. [Google Scholar] [CrossRef]
- Loren, G.; Shoemaker, S.; Burkholder, T.; Jacobson, M.D.; Fridén, J.; Lieber, R. Human wrist motors: Biomechanical design and application to tendon transfers. J. Biomech. 1996, 29, 331–342. [Google Scholar] [CrossRef] [PubMed]
- Lieber, R.L.; Fazeli, B.M.; Botte, M.J. Architecture of selected wrist flexor and extensor muscles. J. Hand Surg. 1990, 15, 244–250. [Google Scholar] [CrossRef] [PubMed]
- Liu, A.; Liu, B.; Lu, L.; Chen, G.; Yu, D.; Zhu, L.; Guo, R.; Dang, R.; Jiang, H. Architectural properties of the neuromuscular compartments in selected forearm skeletal muscles. Am. J. Anat. 2014, 225, 12–18. [Google Scholar] [CrossRef]
- Cutts, A.; Alexander, R.M.; Ker, R.F. Ratios of cross-sectional areas of muscles and their tendons in a healthy human forearm. . 1991, 176, 133–7. [Google Scholar]
- Delp, S.L.; Grierson, A.E.; Buchanan, T.S. Maximumisometric moments generated by the wrist muscles in flexion-extension and radial-ulnar deviation. J. Biomech. 1996, 29, 1371–1375. [Google Scholar] [CrossRef] [PubMed]
- Bhat, A.K.; Pandey, A.K.; G., M.P.; Raghavendra, M.S.; M., C.K.; Singh, S.V. Normative Data of Carpal Bone Measurements in the Sample Adult Indian Population. Indian J. Plast. Surg. 2024, 57, 278–286. [Google Scholar] [CrossRef]
- Devos, P.; Hansen, C.; Ben Mansour, K.; Marin, F. Estimation of the wrist joint center of rotation. Comput. Methods Biomech. Biomed. Eng. 2017, 20, S63–S64. [Google Scholar] [CrossRef]
- Charissou, C.; Amarantini, D.; Baurès, R.; Berton, E.; Vigouroux, L. Effects of hand configuration on muscle force coordination, co-contraction and concomitant intermuscular coupling during maximal isometric flexion of the fingers. Eur. J. Appl. Physiol. 2017, 117, 2309–2320. [Google Scholar] [CrossRef]
- Snijders, C.J.; Volkers, A.C.W.; Mechelse, K.; Vleeming, A. Provocation of epicondylalgia lateralis (tennis elbow) by power grip or pinching. Med. Sci. Sports Exerc. 1987, 19, 518–523. [Google Scholar] [CrossRef]
Figure 1.
Testing wrist flexion ad extension.
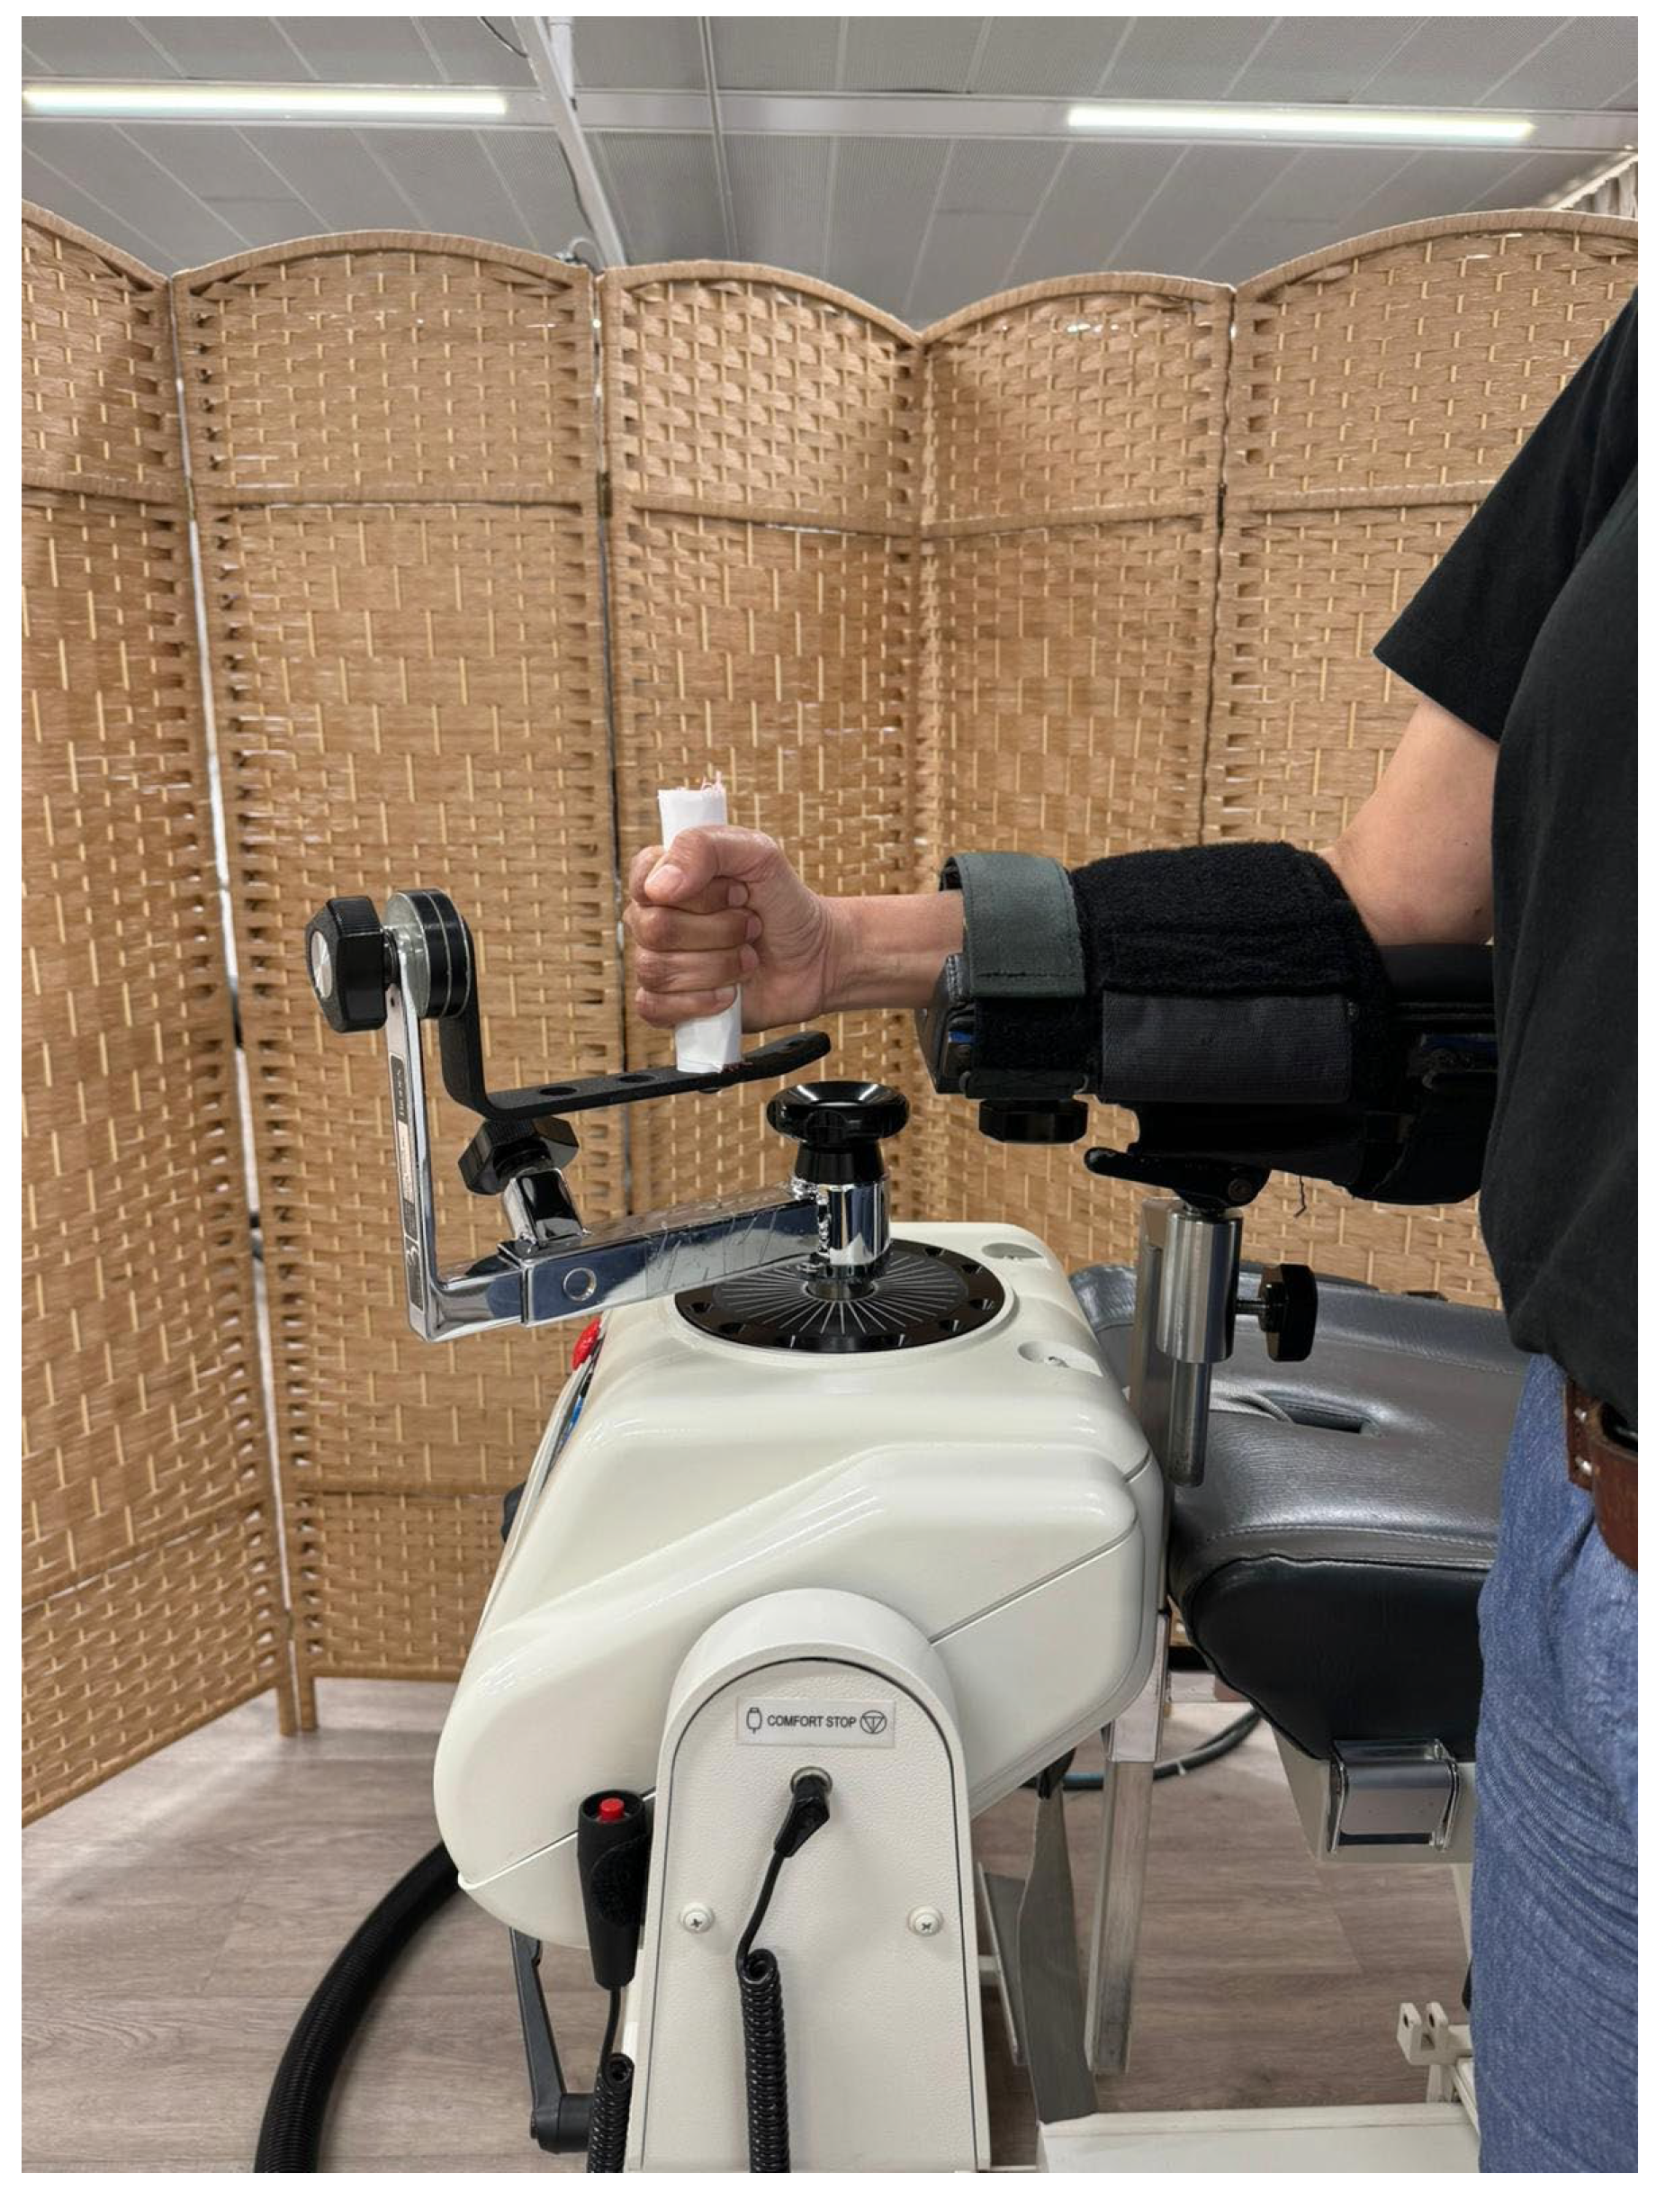
Figure 2.
Testing wrist U and R.
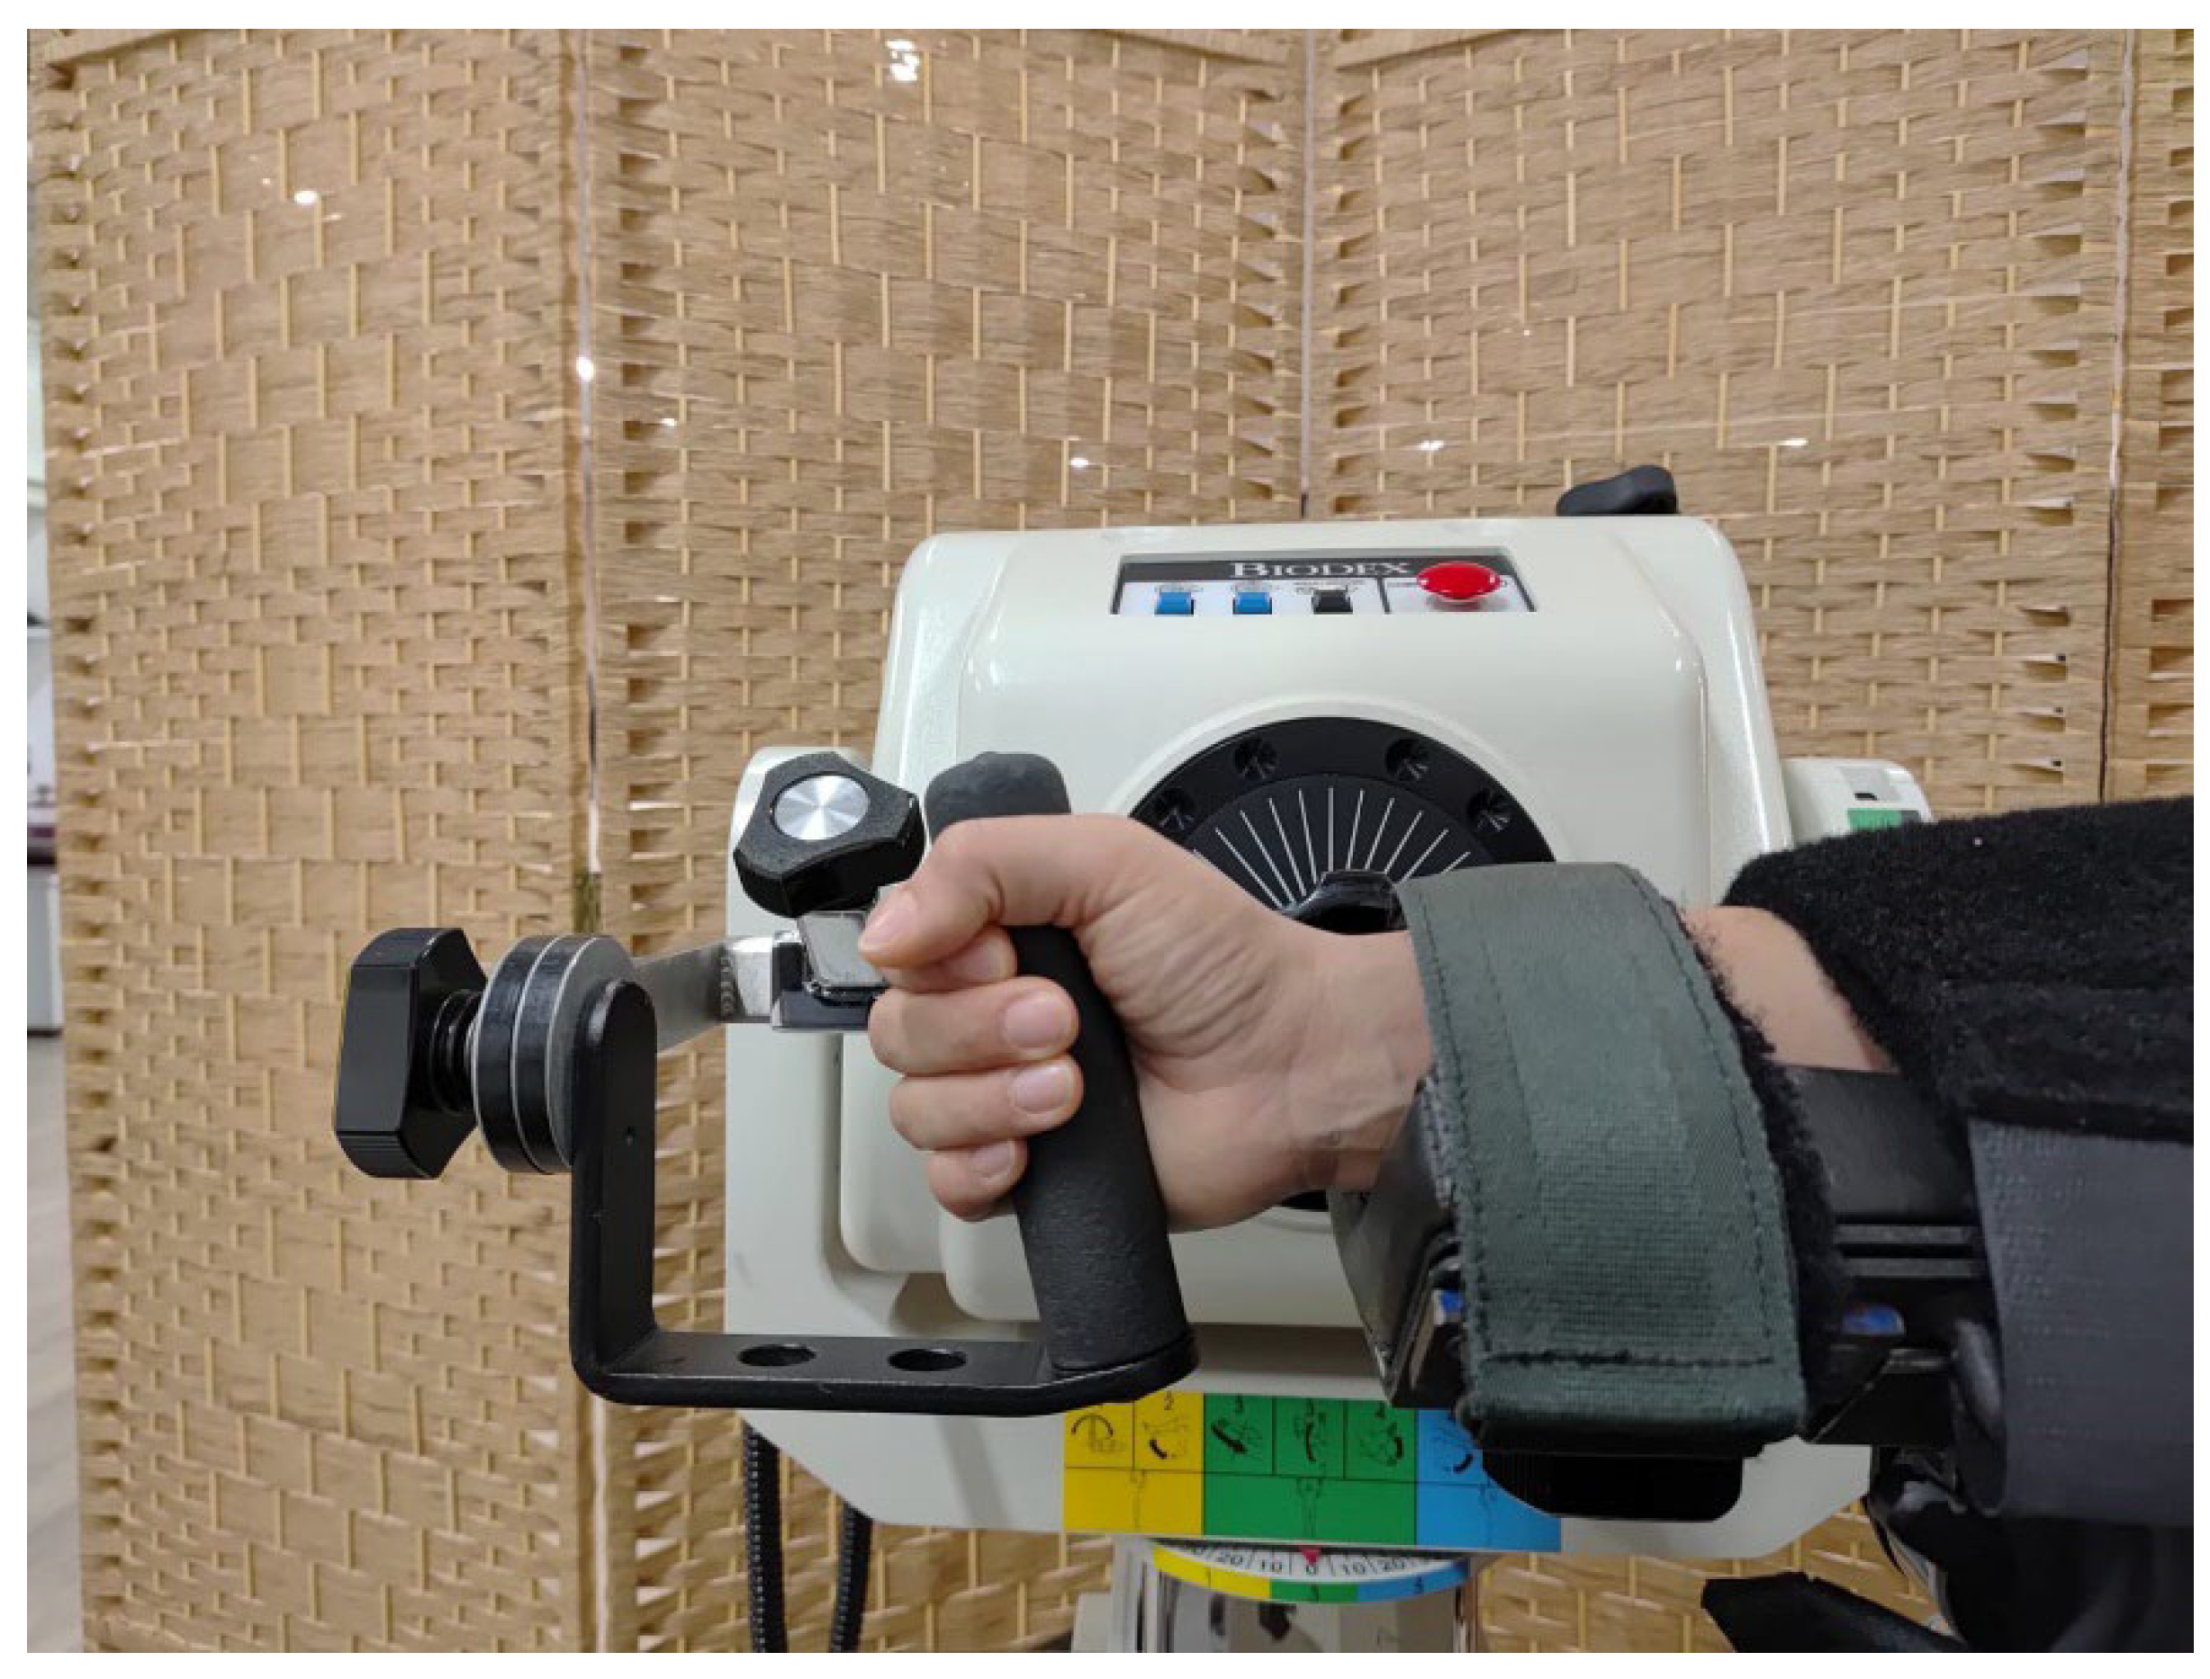
Figure 3.
The strength polygons. F—flexors, E—extensors, UD—ulnar deviators, RD—radial deviators, solid line—concentric values, dashed line—eccentric values, 2 inner polygons (solid and dashed)—women, 2 outer polygons (solid and dashed)—men. The units on the axes are in Nm.
Figure 3.
The strength polygons. F—flexors, E—extensors, UD—ulnar deviators, RD—radial deviators, solid line—concentric values, dashed line—eccentric values, 2 inner polygons (solid and dashed)—women, 2 outer polygons (solid and dashed)—men. The units on the axes are in Nm.
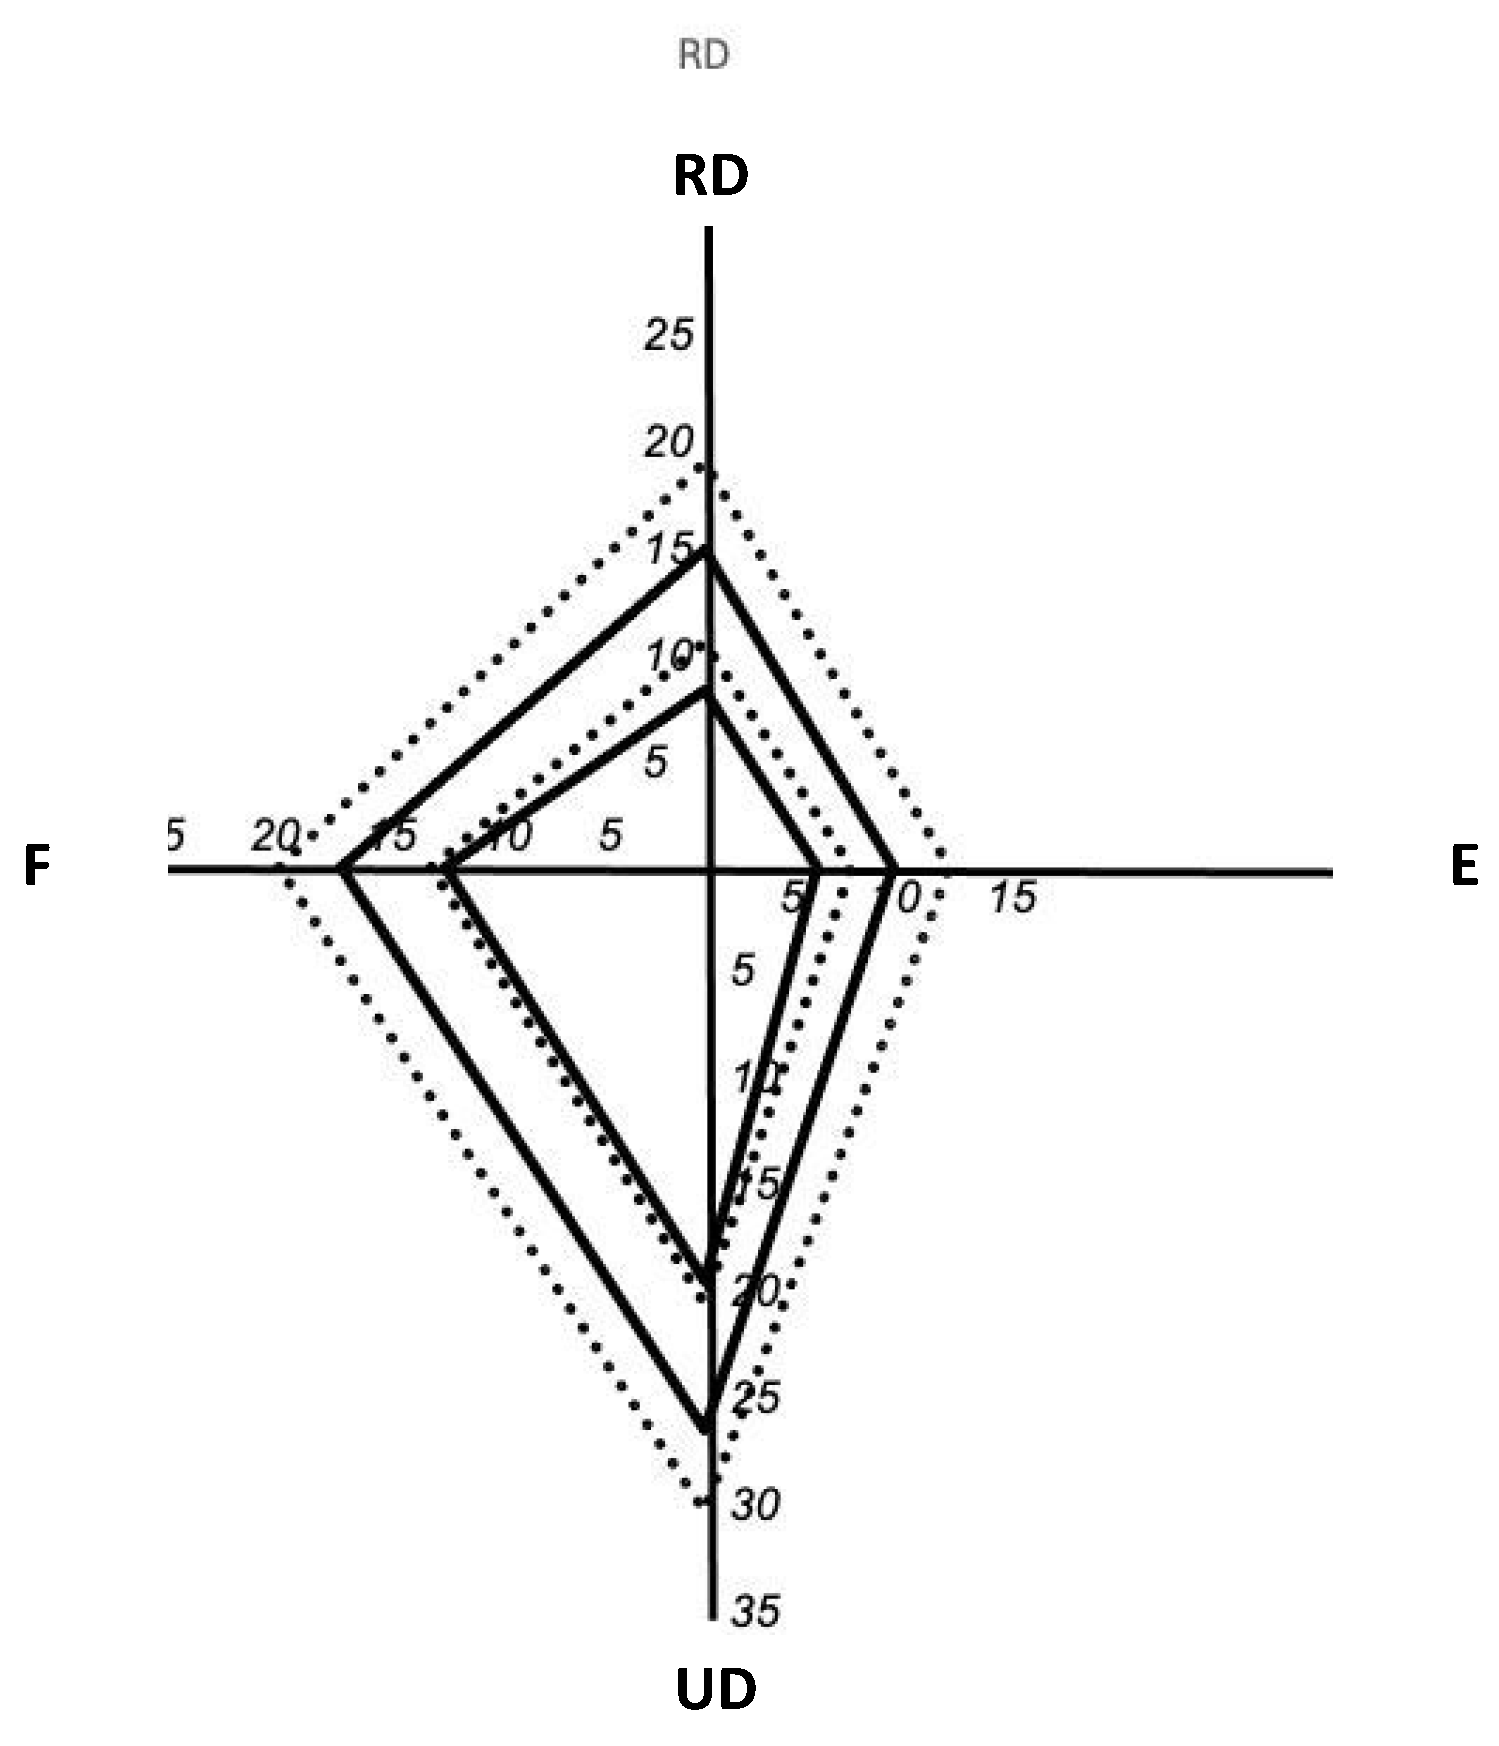
Figure 4.
The strength (PM) of the flexors, radial deviators and extensors expressed as percentage of the ulnar deviators. Con—concentric, Ecc—eccentric, E– extensors, F– flexors, PM—peak moment, RD—radial deviators.
Figure 4.
The strength (PM) of the flexors, radial deviators and extensors expressed as percentage of the ulnar deviators. Con—concentric, Ecc—eccentric, E– extensors, F– flexors, PM—peak moment, RD—radial deviators.
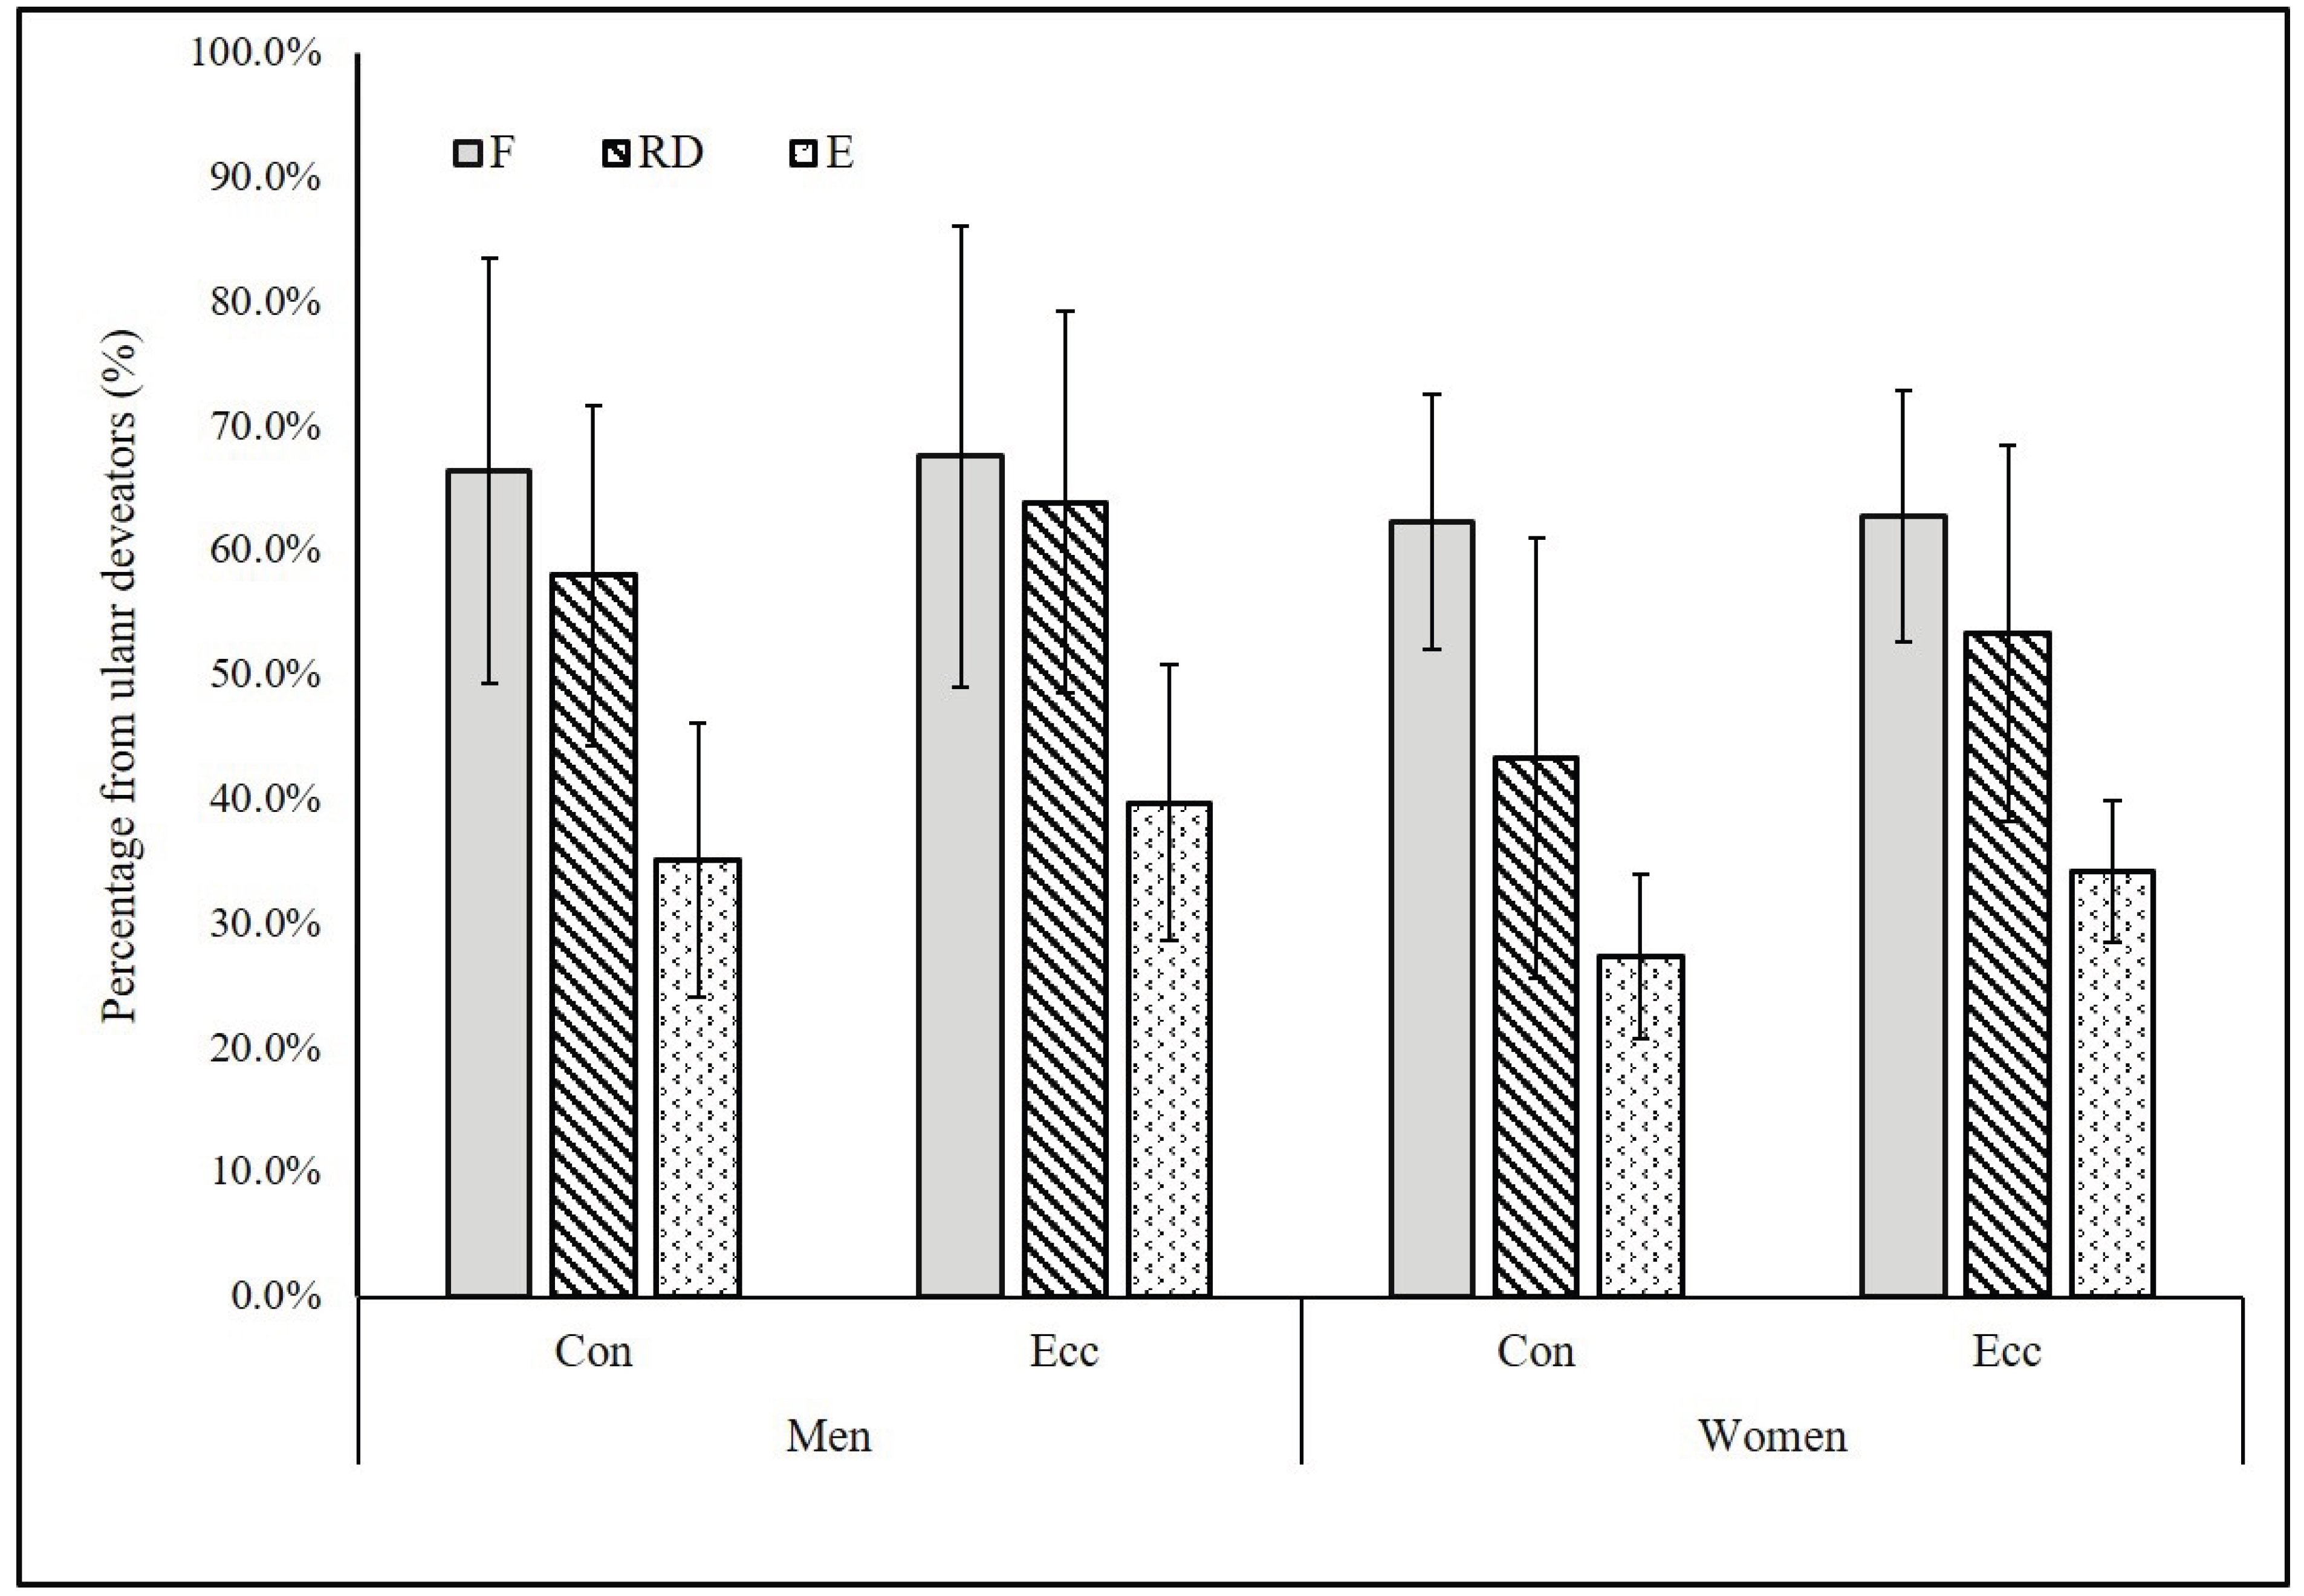

Table 1.
Absolute (Nm) and normalized (Nm/kgbw) isokinetic concentric and eccentric strength values of the wrist flexors, extensors, ulnar and radial deviators in women and men.
Table 1.
Absolute (Nm) and normalized (Nm/kgbw) isokinetic concentric and eccentric strength values of the wrist flexors, extensors, ulnar and radial deviators in women and men.
| Variable | Men | Women | PMW/PMM | |||
| Abs | Nor | Abs | Nor | Abs | Nor | |
| Fcon | 17.0±4.1 | 0.23±0.06 | 12.1±2.4**a | 0.20±0.04 | 71 | 88 |
| Fecc | 20.0±4.6 | 0.27±0.06 | 12.7±2.5** | 0.21±0.04** a | 64 | 78 |
| Econ | 8.8±1.7 | 0.12±0.03 | 5.3±1.1** | 0.09±0.02** | 61 | 75 |
| Eecc | 11.5±1.9 | 0.16±0.03 | 6.9±1.2** | 0.12±0.02** | 60 | 74 |
| Ucon | 26.5±6.6 | 0.36±0.09 | 20.0±5.3** | 0.33±0.06 | 75 | 91 |
| Uecc | 30.3±7.1 | 0.41±0.10 | 20.7±5.1** | 0.34±0.06* | 68 | 83 |
| Rcon | 14.9±3.4 | 0.20±0.05 | 8.5±3.0** | 0.14±0.05** | 57 | 70 |
| Recc | 18.9±3.9 | 0.26±0.06 | 10.7±3.2** | 0.18±0.06** | 57 | 70 |
*(in integer %), Abs—absolute, Nor—bodyweight normalized, con—concentric, ecc—eccentric, F—flexors, E—extensors, U—ulnar deviators, R—radial deviators , PM—peak moment, W—women, M—men, *p<0.01, **p<0.001.
Table 2.
PM-based isokinetic ratios for wrist muscles in women and men.
| Variable | Cohen’s d | ||||
| Men | Women | t | p | ||
| E/CF | 1.18±0.1 | 1.04±0.05 | 5.24** | 0.00 | 1.66 |
| E/CE | 1.32±0.1 | 1.31±0.14 | 0.25 | 0.80 | 0.08 |
| E/CU | 1.15±0.08 | 1.04±0.05 | 5.23** | 0.00 | 1.66 |
| E/CR | 1.28±0.09 | 1.32±0.31 | -0.58 | 0.57 | -0.18 |
| F/Econ | 2.05±0.76 | 2.34±0.48 | -1.45 | 0.15 | -0.46 |
| U/Rcon | 1.84±0.47 | 2.58±0.88 | -3.36** | 0.00 | -1.06 |
| F/Eecc | 1.80±0.55 | 1.87±0.3 | -0.48 | 0.63 | -0.15 |
| U/Recc | 1.64±0.37 | 2.05±0.60 | -2.61** | 0.01 | -0.82 |
E/CF, E, U, R—eccentric to concentric ratio of the F, E, U and R, respectively, F/Econ—concentric F to E ratio, F/Eecc—eccentric F to E ratio, U/Rcon—concentric U to R ratio, U/Recc—eccentric U to R ratio *p<0.001.
Table 3.
Peak moment correlation (Pearson’s r) matrix: women vs. men. Each cell in the matrix includes the r value in women (top) and men (bottom).
Table 3.
Peak moment correlation (Pearson’s r) matrix: women vs. men. Each cell in the matrix includes the r value in women (top) and men (bottom).
| Women Men |
||||||||
| Fcon | Fecc | Econ | Eecc | UDcon | UDecc | RDcon | RDecc | |
| Fcon | 1 | |||||||
| Fecc | 0.93*** 0.98*** |
1 | ||||||
| Econ | -0.27 0.56** |
-0.15 0.55** |
1 | |||||
| Eecc | -0.32 0.70*** |
-0.23 0.68** |
0.95*** 0.89*** |
1 | ||||
| Ucon | 0.50* 0.58** |
0.47* 0.55 |
-0.14 0.51* |
-0.05 0.53* |
1 | |||
| Uecc | 0.49* 0.65** |
0.52* 0.63** |
-0.11 0.51* |
-0.03 0.55** |
0.97*** 0.98*** |
1 | ||
| Rcon | 0.31 0.21 |
0.25 0.20 |
-0.07 0.26 |
-0.10 0.31 |
0.35 0.46* |
0.38 0.39 |
1 | |
| Recc | 0.27 0.11 |
0.21 0.07 |
-0.05 0.21 |
-0.08 0.28 |
0.38 0.36 |
0.40 0.30 |
0.96*** 0.93*** |
1 |
*p<0.05, **p<0.01, ***p<0.001.
Disclaimer/Publisher’s Note: The statements, opinions and data contained in all publications are solely those of the individual author(s) and contributor(s) and not of MDPI and/or the editor(s). MDPI and/or the editor(s) disclaim responsibility for any injury to people or property resulting from any ideas, methods, instructions or products referred to in the content. |
© 2025 by the authors. Licensee MDPI, Basel, Switzerland. This article is an open access article distributed under the terms and conditions of the Creative Commons Attribution (CC BY) license (http://creativecommons.org/licenses/by/4.0/).
Copyright: This open access article is published under a Creative Commons CC BY 4.0 license, which permit the free download, distribution, and reuse, provided that the author and preprint are cited in any reuse.


