Submitted:
27 August 2025
Posted:
28 August 2025
You are already at the latest version
Abstract
Pedestrian crashes are disproportionately concentrated in developing countries (DCs), where scarce and unreliable crash data limit the calibration of global road safety as-sessment tools. The International Road Assessment Programme (iRAP) provides a globally recognised framework for evaluating pedestrian facilities; however, its coun-termeasure effectiveness (CME) values are derived largely from data from high-income countries. This study develops and tests a variant countermeasure effectiveness model that integrates locally relevant contextual factors not considered in iRAP.
Building on a systematic review (which identified 33 contextual factors) and statistical modelling with artificial datasets (which profiled 16 absent factors), the study intro-duced two novel contributions: the Adjusted Effectiveness Formula (Eqn 1) and the Adjusted Pedestrian Star Rating Score (PSRS) Formula (Eqn 7). Eleven contextual factors were retained for integration based on a threshold criterion (Fi < 0.9 or Fi > 1.1). Four weighting methods (correlation, regression, principal component analysis, and budget allocation) were compared; the Budget Allocation Method was selected for its suitability in data-poor contexts. Interpolated risk values were generated across performance lev-els using a log-linear approach (Eqn 6).
Application of the adjusted model revealed significant shifts in star rating outcomes. At operating speeds of 40–50 km/h, factors such as overtaking tendency, traffic rule enforcement, countermeasure as an afterthought, human capacity of agencies, and employed population caused several road segments to shift from Star 2 to Star 1, classifying them as unsafe at speeds above 45 km/h. This outcome, not captured by the current iRAP model, underscores the need for localised recalibration.
The adjusted model, embedded directly into iRAP’s PSRS framework, improves realism and predictive accuracy, offering a practical tool for context-sensitive prioritisation of pedestrian safety countermeasures in DCs.
Keywords:
pedestrian safety
; countermeasure effectiveness
; international road assessment programme (iRAP)
; developing countries (DCs)
; contextual risk factors
; star rating score (SRS)
; road safety modelling
; sustainability
1. Introduction
Pedestrian crashes remain a critical global public health and development challenge, disproportionately affecting low- and middle-income countries (LMICs)/ developing countries (DCs). According to the WHO Global Status Report on Road Safety 2023, an estimated 1.19 million people die annually in road traffic crashes, with a further 50 million sustaining non-fatal injuries [1]. Vulnerable road users (pedestrians, cyclists, and motorcyclists) account for over half of these deaths. The burden falls heaviest on LMICs, which account for more than 90% of road traffic fatalities despite owning only 60% of the world’s vehicles [2]. Regionally, Africa has the highest road traffic fatality rate globally (26.6 deaths per 100,000 population), followed closely by Southeast Asia (17.0 per 100,000), with pedestrians comprising a disproportionately large share of victims [3,4]. Beyond the human cost, road crashes impose severe economic impacts, estimated at up to 5% of GDP in many LMICs [5,6], straining already fragile health systems and undermining sustainable development goals.
Pedestrian safety is shaped by a complex interplay of factors, including poor infrastructure, excessive speeds, weak enforcement, and behavioural patterns [7,8]. To address these challenges, the International Road Assessment Programme (iRAP), first introduced by the World Bank, has become a de facto global framework for road safety assessment and investment prioritisation [9,10,11]. The iRAP methodology systematically evaluates the safety of road infrastructure for different user groups and assigns Star Ratings based on infrastructure risk and predicted countermeasure effectiveness [12]. The tool has been applied in over 100 countries, and is widely endorsed by governments, development agencies, and funding institutions as a standard for benchmarking and improving road safety [13,14].
However, a growing body of evidence highlights critical limitations in applying iRAP’s globally standardised effectiveness values directly in DC contexts [15]. The countermeasure effectiveness (CME) values and crash modification factors (CMFs) used in iRAP are primarily calibrated from high-income country (HIC) datasets [16,17]. This reliance risks overestimating countermeasure benefits in settings where contextual realities such as poor infrastructure maintenance, weak enforcement, infrastructure encroachment, and socio-behavioural norms undermine safety outcomes [18,19].
A recent systematic review conducted by the authors, following PRISMA 2020 guidelines [20,21], screened 1,911 records and identified 33 contextual factors influencing the performance of pedestrian countermeasures in DCs. Among these, factors such as weak institutional capacity [13], poor enforcement [22,23], and inadequate maintenance [24] were repeatedly shown to diminish the real-world effectiveness of measures assumed to be highly effective in global models. A subsequent performance gap analysis of five before-and-after case studies revealed a mean discrepancy of 30.89% (SD = 29.89%) between iRAP-predicted and observed effectiveness, underscoring the magnitude of systematic overestimation in DC settings.
Building on this, statistical modelling with artificial datasets (2,000 random samples per variable) was conducted to approximate the influence of contextual factors on pedestrian crash frequency in data-scarce environments [25]. Using pairwise correlation, stepwise regression, and Negative Binomial (NB) modelling [26], 16 contextual factors absent from iRAP’s framework were identified as critical. These included “overtaking tendency”[26], “countermeasure as an afterthought”[22], “human capacity of agencies”[12], and “traffic rule enforcement”[27], which strongly shaped safety outcomes in DC contexts. Although coefficients from NB modelling did not reach conventional statistical significance, reflecting the limitations of artificial data rather than the irrelevance of the factors, the exercise demonstrated a replicable approach for systematically ranking and integrating locally relevant variables.
Together, these findings underscore a fundamental research gap where iRAP’s global countermeasure effectiveness values do not adequately reflect the localised realities of DC road environments, leading to inflated safety benefit predictions and suboptimal investment decisions.
The aim of this paper is therefore to present a contextualised countermeasure effectiveness model for pedestrian safety in DCs. This variant model recalibrates iRAP’s baseline effectiveness values by incorporating weighted contextual risk modifiers and introduces an adjusted Pedestrian Star Rating Score (PSRS) formula. By embedding socio-behavioural, infrastructural, and institutional realities into the assessment framework, the model enhances predictive accuracy and provides a more reliable basis for prioritising countermeasures in resource-constrained settings.
2. Materials and Methods
2.1. Data Sources and Factor Selection
The development of the contextualised countermeasure effectiveness model was based on evidence from two complementary research stages. A systematic literature review, following PRISMA 2020 guidelines [20,28,29], identified 33 contextual factors influencing pedestrian countermeasure performance in developing countries. These included socio-behavioural, infrastructural, and institutional variables such as poor maintenance, weak enforcement, pedestrian demographics, and road encroachment. A subsequent modelling exercise using artificial datasets (2,000 random samples per variable) applied pairwise correlation, stepwise regression, and Negative Binomial (NB) modelling to quantify the influence of 20 variables. From this stage, 16 factors were found to be absent from the iRAP framework.
For integration into the adjusted model, a threshold criterion for factor inclusion was applied following the Highway Safety Mannual [30]. Factors with risk values (Fi) between 0.9 and 1.1 were considered to have trivial influence and were excluded. This resulted in the retention of 11 factors. Of these:
- Some coefficients were derived from the NB modelling (expressed as Incident Rate Ratios, IRRs).
- Others were sourced from published models in external literature (expressed as Odds Ratios or IRRS).
Although combining IRRs and ORs introduces methodological consistency challenges, this was mitigated through the application of the rare-event assumption [31], which allows conversion across effect measures when events are infrequent. The approach prioritised inclusivity of influential contextual factors, recognising that empirical crash data in developing countries are limited.
The final set of 11 factors is presented in Table 1, alongside their coefficients, risk values (Fi), and data sources.
2.2. Adjusted Effectiveness Model
The first novel contribution of this study is the Adjusted Effectiveness Formula, which recalibrates iRAP’s baseline Countermeasure Effectiveness (CME) by integrating the contribution of locally relevant contextual risk factors. Unlike the iRAP framework, which applies globally standardised values, this model embeds both factor influence values (Fi) and weights (Wi):
where:
- = baseline countermeasure effectiveness from iRAP,
- = influence (risk factor value) of contextual factor i,
- = normalised weight of each contextual factor i,
- with (the average observed discrepancy between iRAP-predicted and actual effectiveness in DC settings).
This adjustment corrects for the 30.89% performance gap identified in earlier analyses, representing the aggregate influence of local contextual factors on countermeasure performance.
2.3. Weighting Methods
To allocate relative importance among the 11 contextual factors, four weighting techniques were compared. These methods were selected because they represent both statistical approaches (objective, data-driven) and participatory approaches (judgement- or impact-based), ensuring methodological balance [32,33].
2.3.1. Factor Correlation Weighting (Spearman ρ)
where: is the Spearman rank correlation between variable i and pedestrian crash frequency
This method captures monotonic relationships without assuming linearity. It is particularly relevant for DCs where crash variables interact in complex, non-linear ways [32]. Microsoft Excel software was used to compute the correlation weights.
2.3.2. Regression-Based Weights
where is the standardised regression coefficient from the NB model.
This method derives weights directly from multivariate regression contributions, reflecting the relative influence of each variable [33]. Microsoft Excel software was used to calculate the regression weights.
2.3.3. Principal Component Analysis (PCA)
where loading refers to the factor loading or eigenvalue associated with each variable on the first principal component.
2.3.4. Budget Allocation (BA)
where is the risk factor impact score. The further Fi is from 1.0, the stronger its influence (impact distortion).
This method distributes a hypothetical “budget” (e.g., 100 points) across variables based on their relative influence, reflecting performance loss theory. While it introduces subjectivity, it allows inclusion of both NB-derived and literature-derived coefficients.
Each method produced normalised weights, which were then compared against factored weights (Table 2). The factored weights account for both magnitude and variability, providing a more robust criterion for method selection. The Budget Allocation Method achieved a value of 0.991 (closest to 1.0 among the methods tested) and was therefore selected as the final weighting technique.
This multi-step approach ensured that the choice of weighting method was not arbitrary but grounded in comparative performance, addressing concerns of subjectivity in model construction.
2.4. Interpolation of Relative Risk Values
To represent how contextual risk factors behave across different performance levels, a log-linear interpolation function was applied. This technique allows dynamic risk modelling by generating interpolated relative risk values across defined performance intervals (from 0% to 100%).
where:
- Fi(P) is interpolated relative risk at performance level P,
- FiL is the lower relative risk value,
- FiH is the higher relative risk value,
- ln denotes the natural logarithm,
- exp denotes the exponential function,
- P is the performance level (expressed as a percentage), measured with reference from the level at which FiL occurs.
2.5. Integration into the Pedestrian Star Rating Score (PSRS) Framework
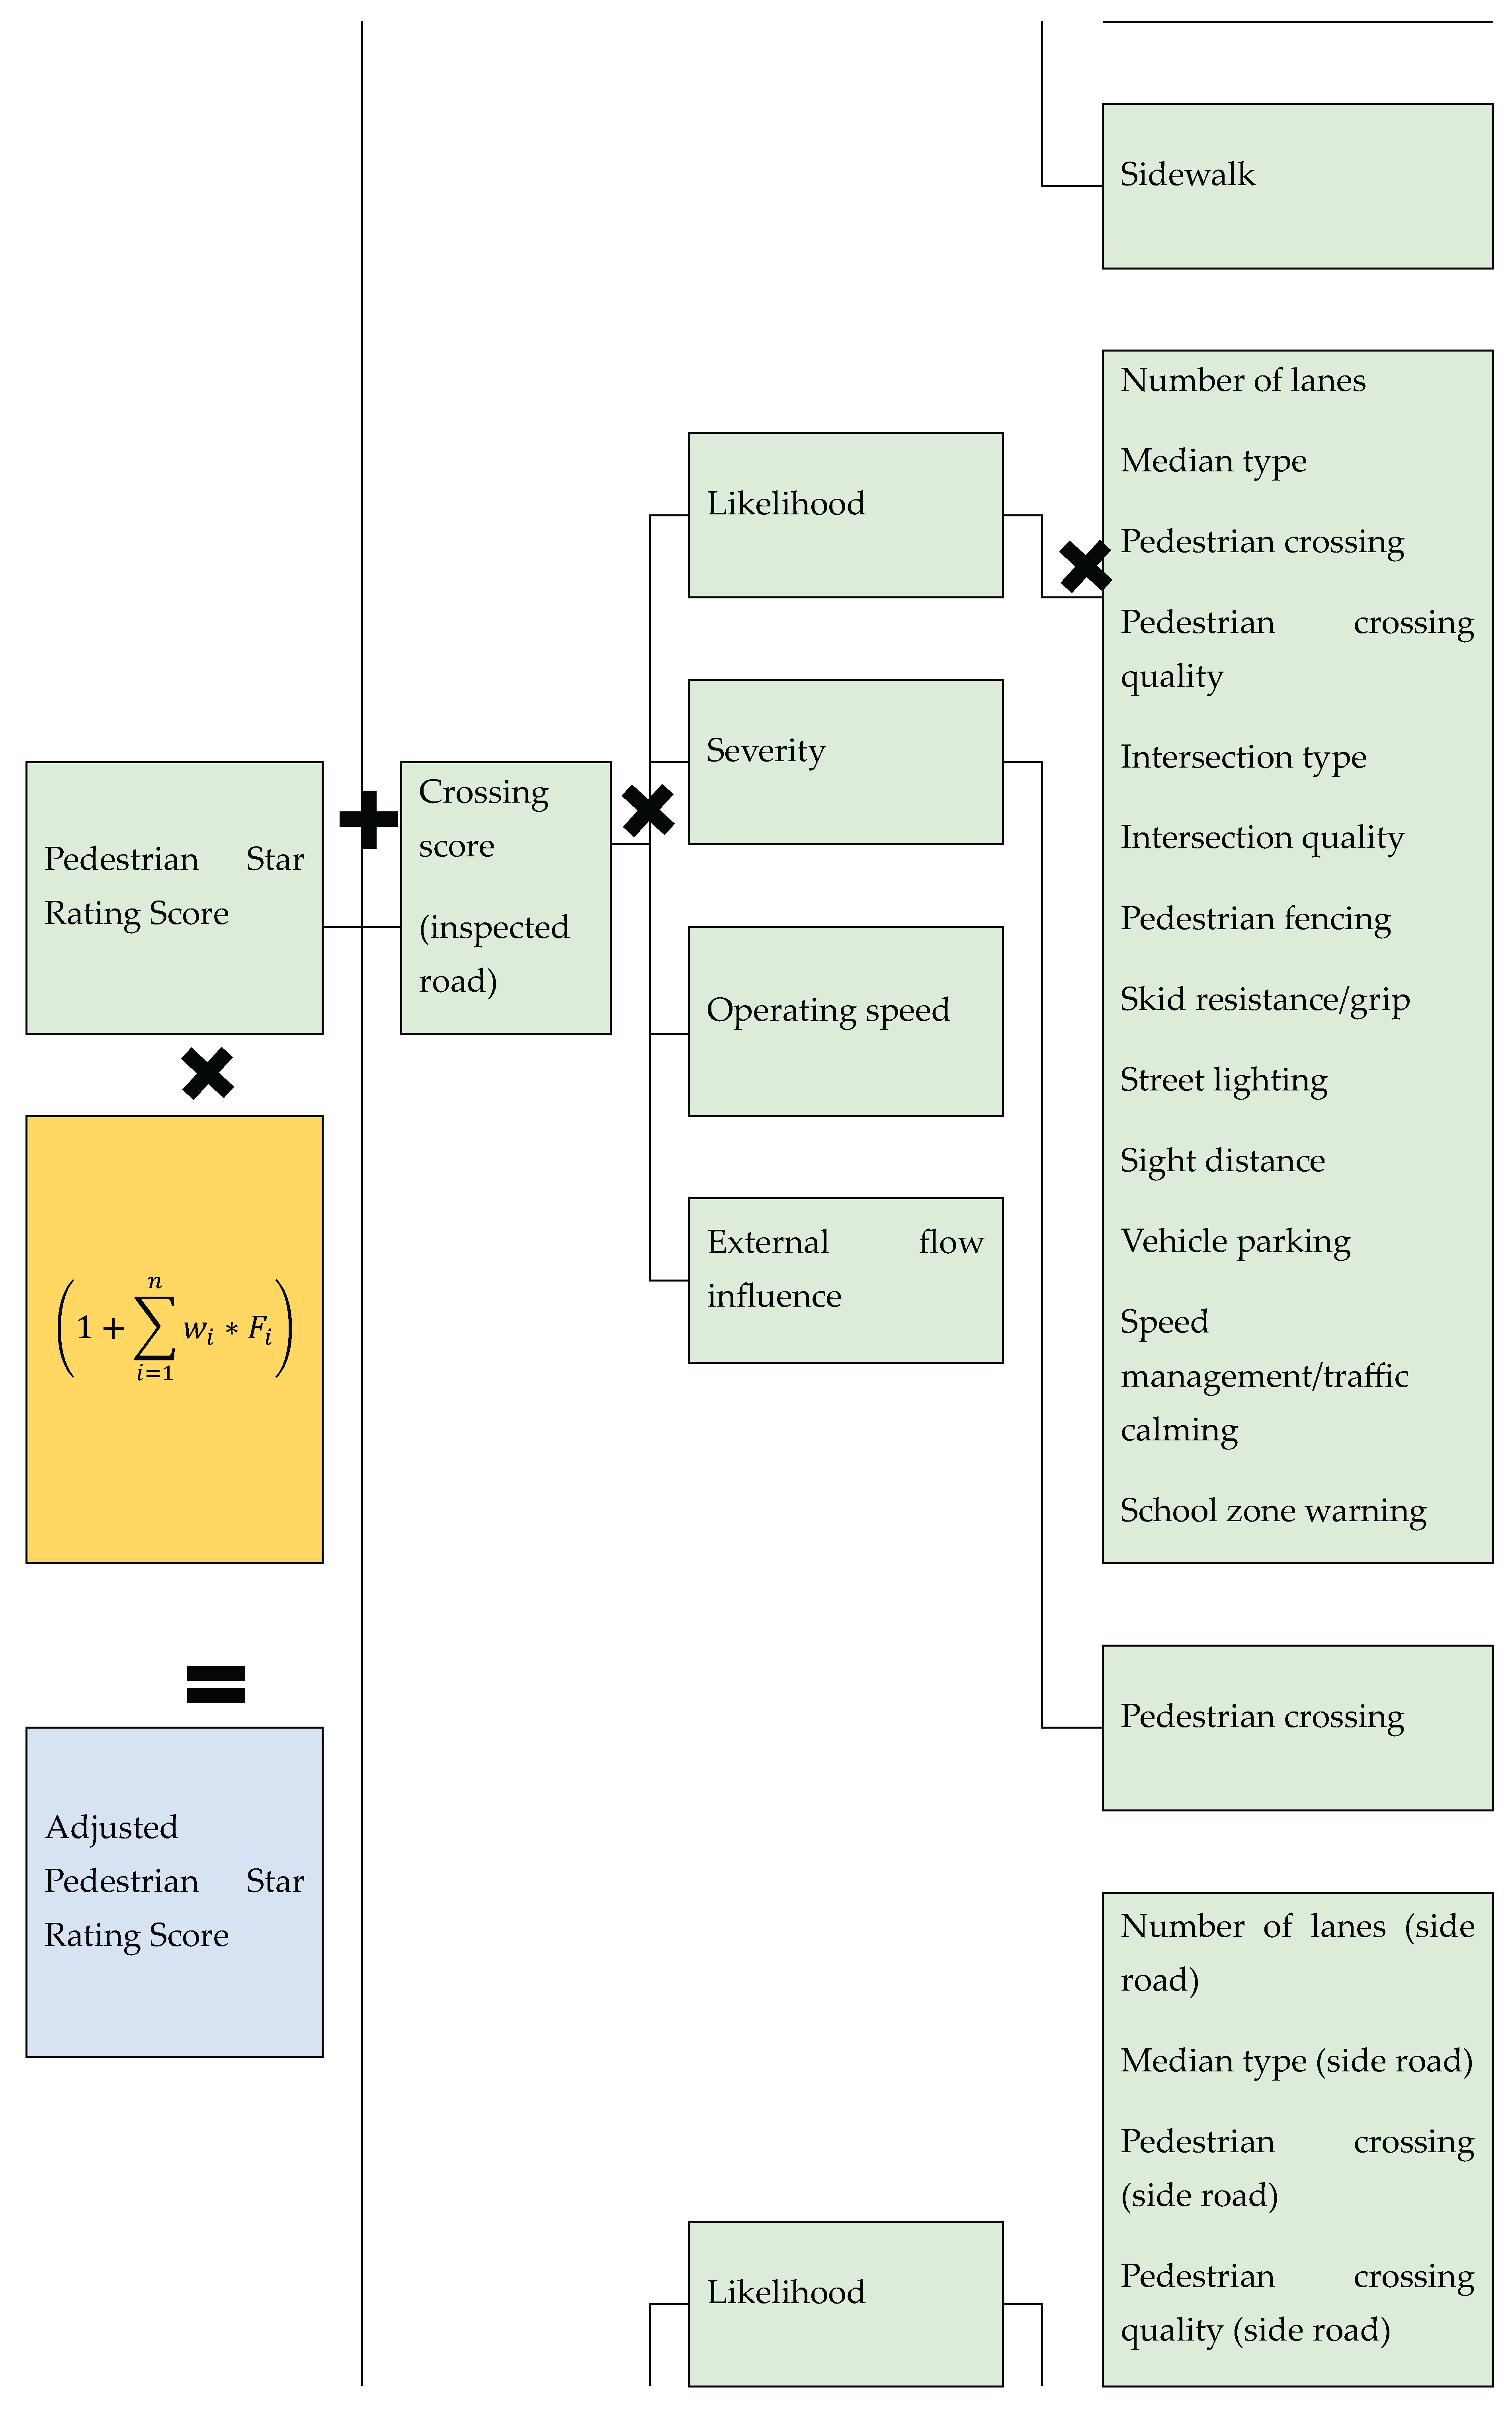
The contextualised model was embedded into iRAP’s Pedestrian Star Rating Score (PSRS) framework by introducing a novel adjusted star rating equation (Eqn 7), derived directly from Eqn 1. This replaces iRAP’s baseline star rating equation (Eqn 8), ensuring compatibility while incorporating contextual risk factors:
where:
- SRSDC refers to the adjusted star rating scores for developing countries
- SRSiRAP denotes the baseline iRAP pedestrian star score, calculated according to the iRAP Methodology Fact Sheet #6 [35].
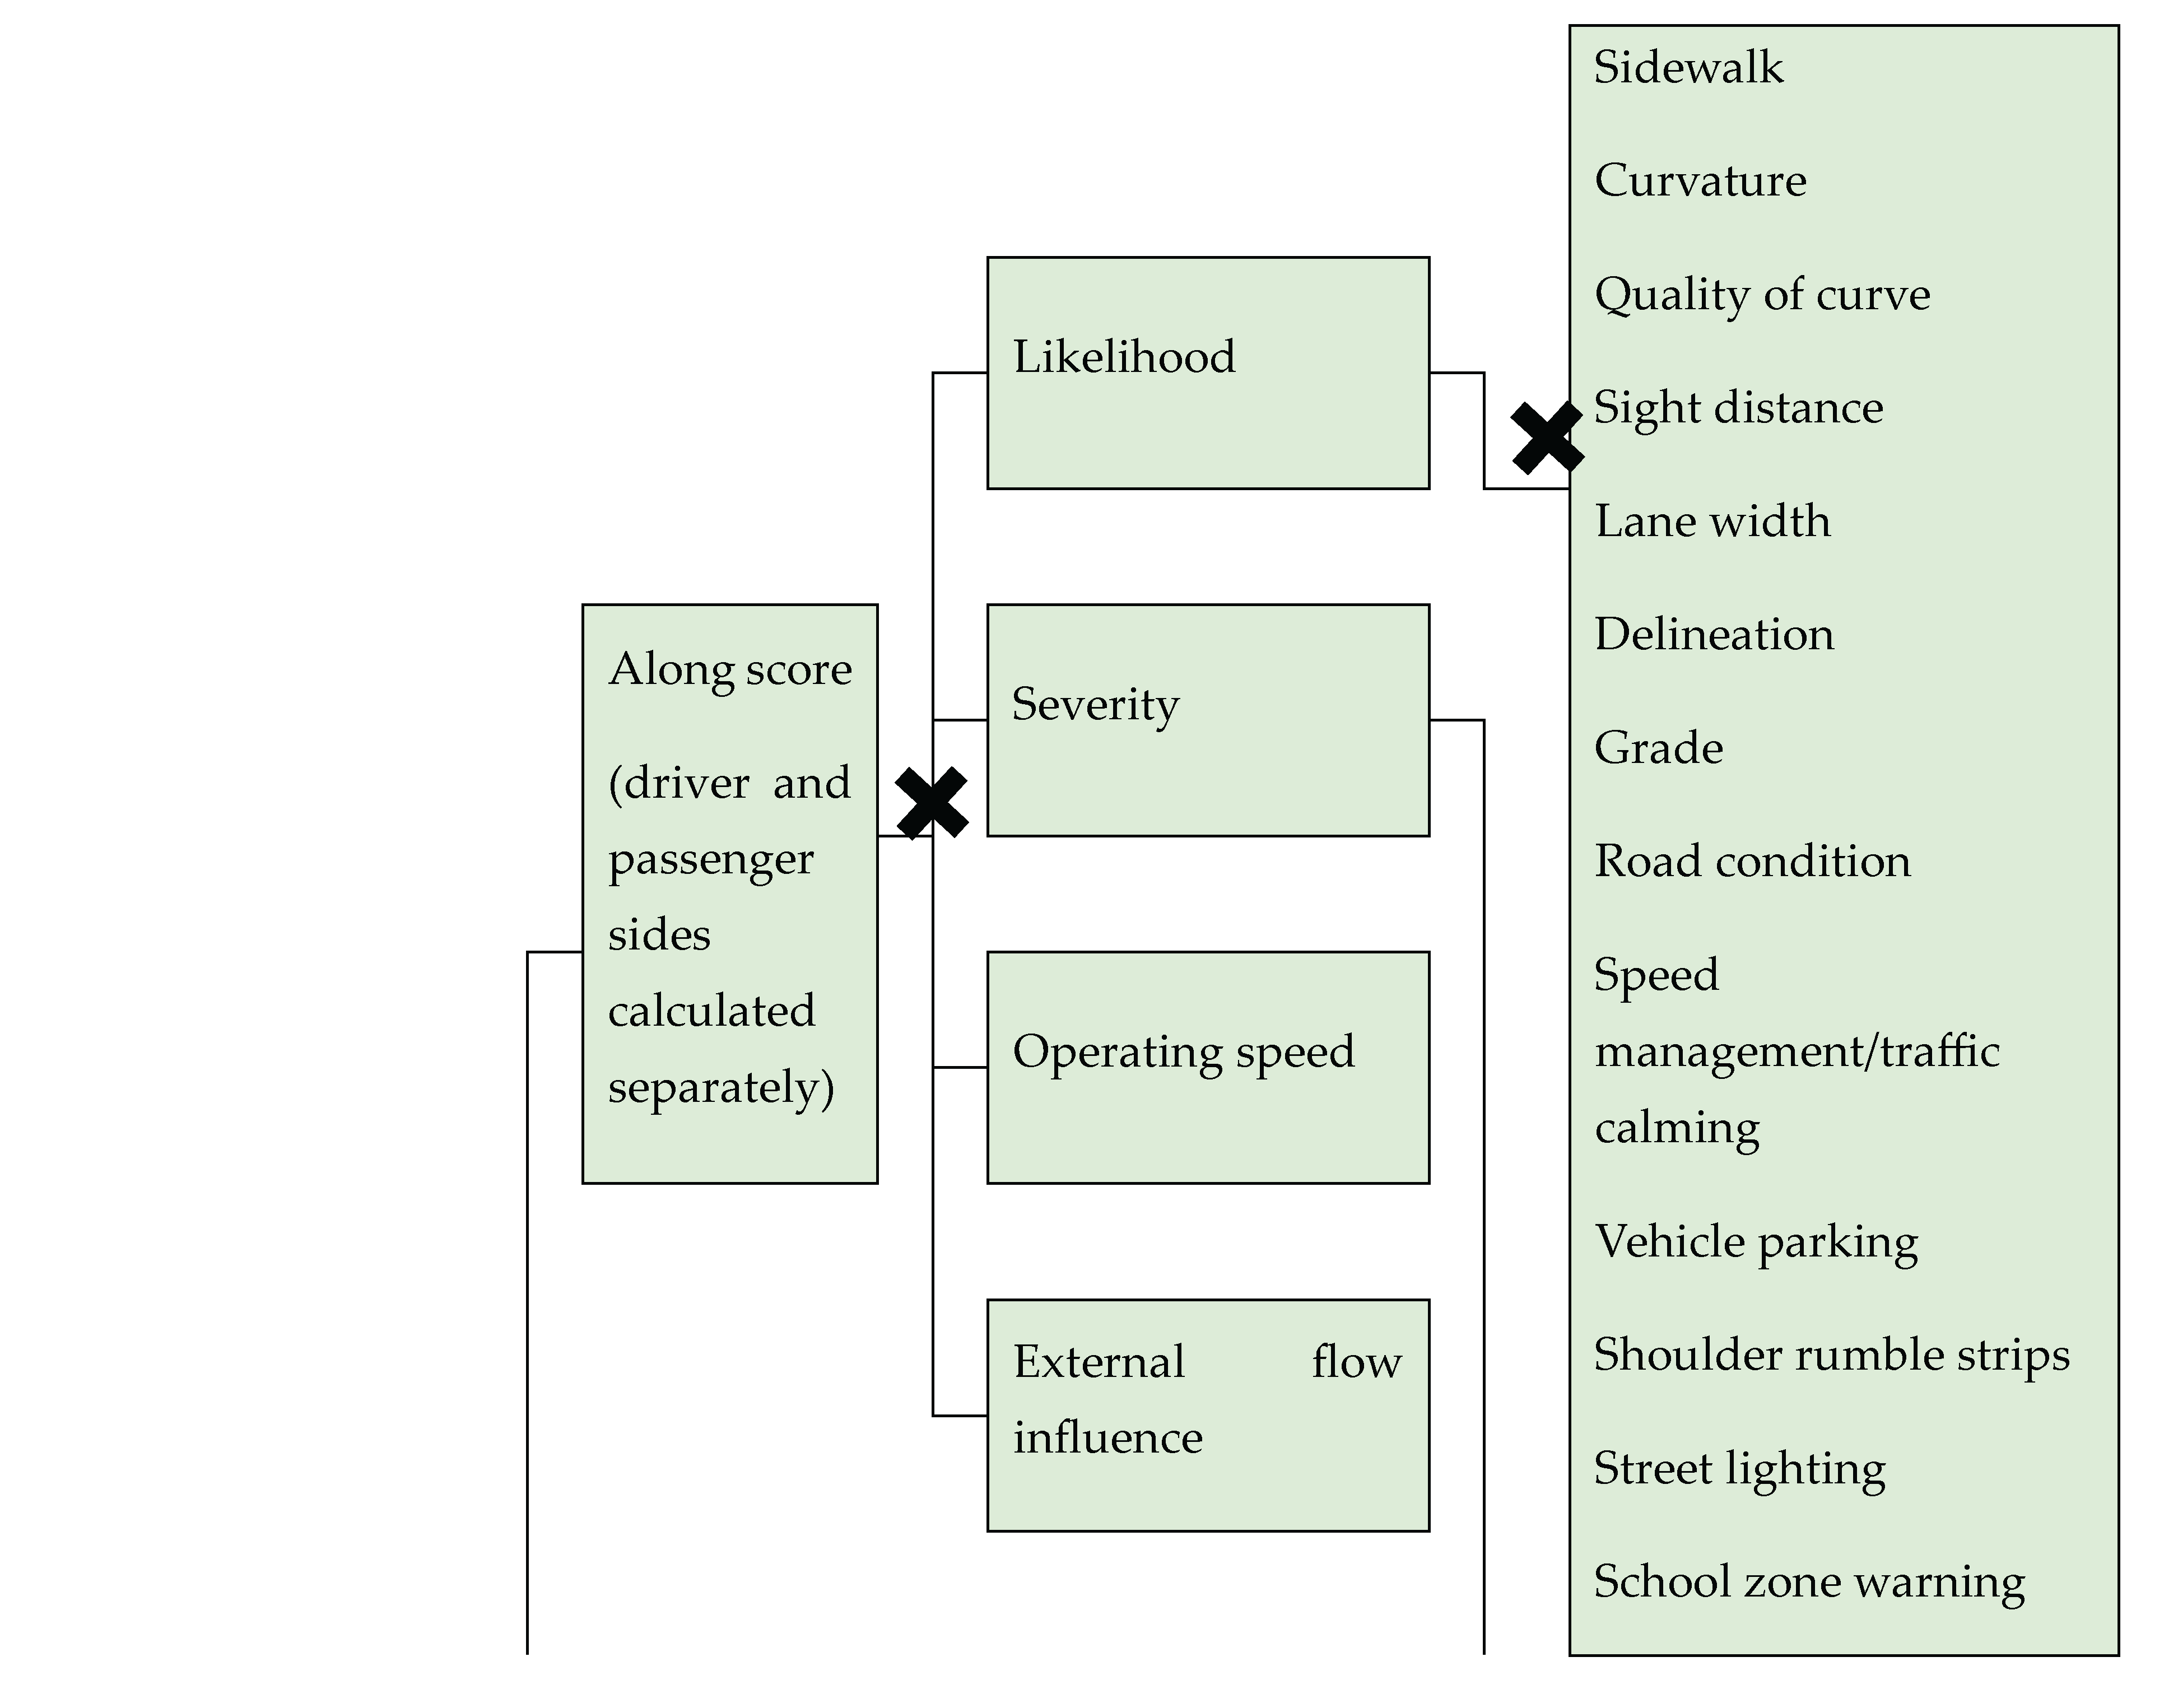
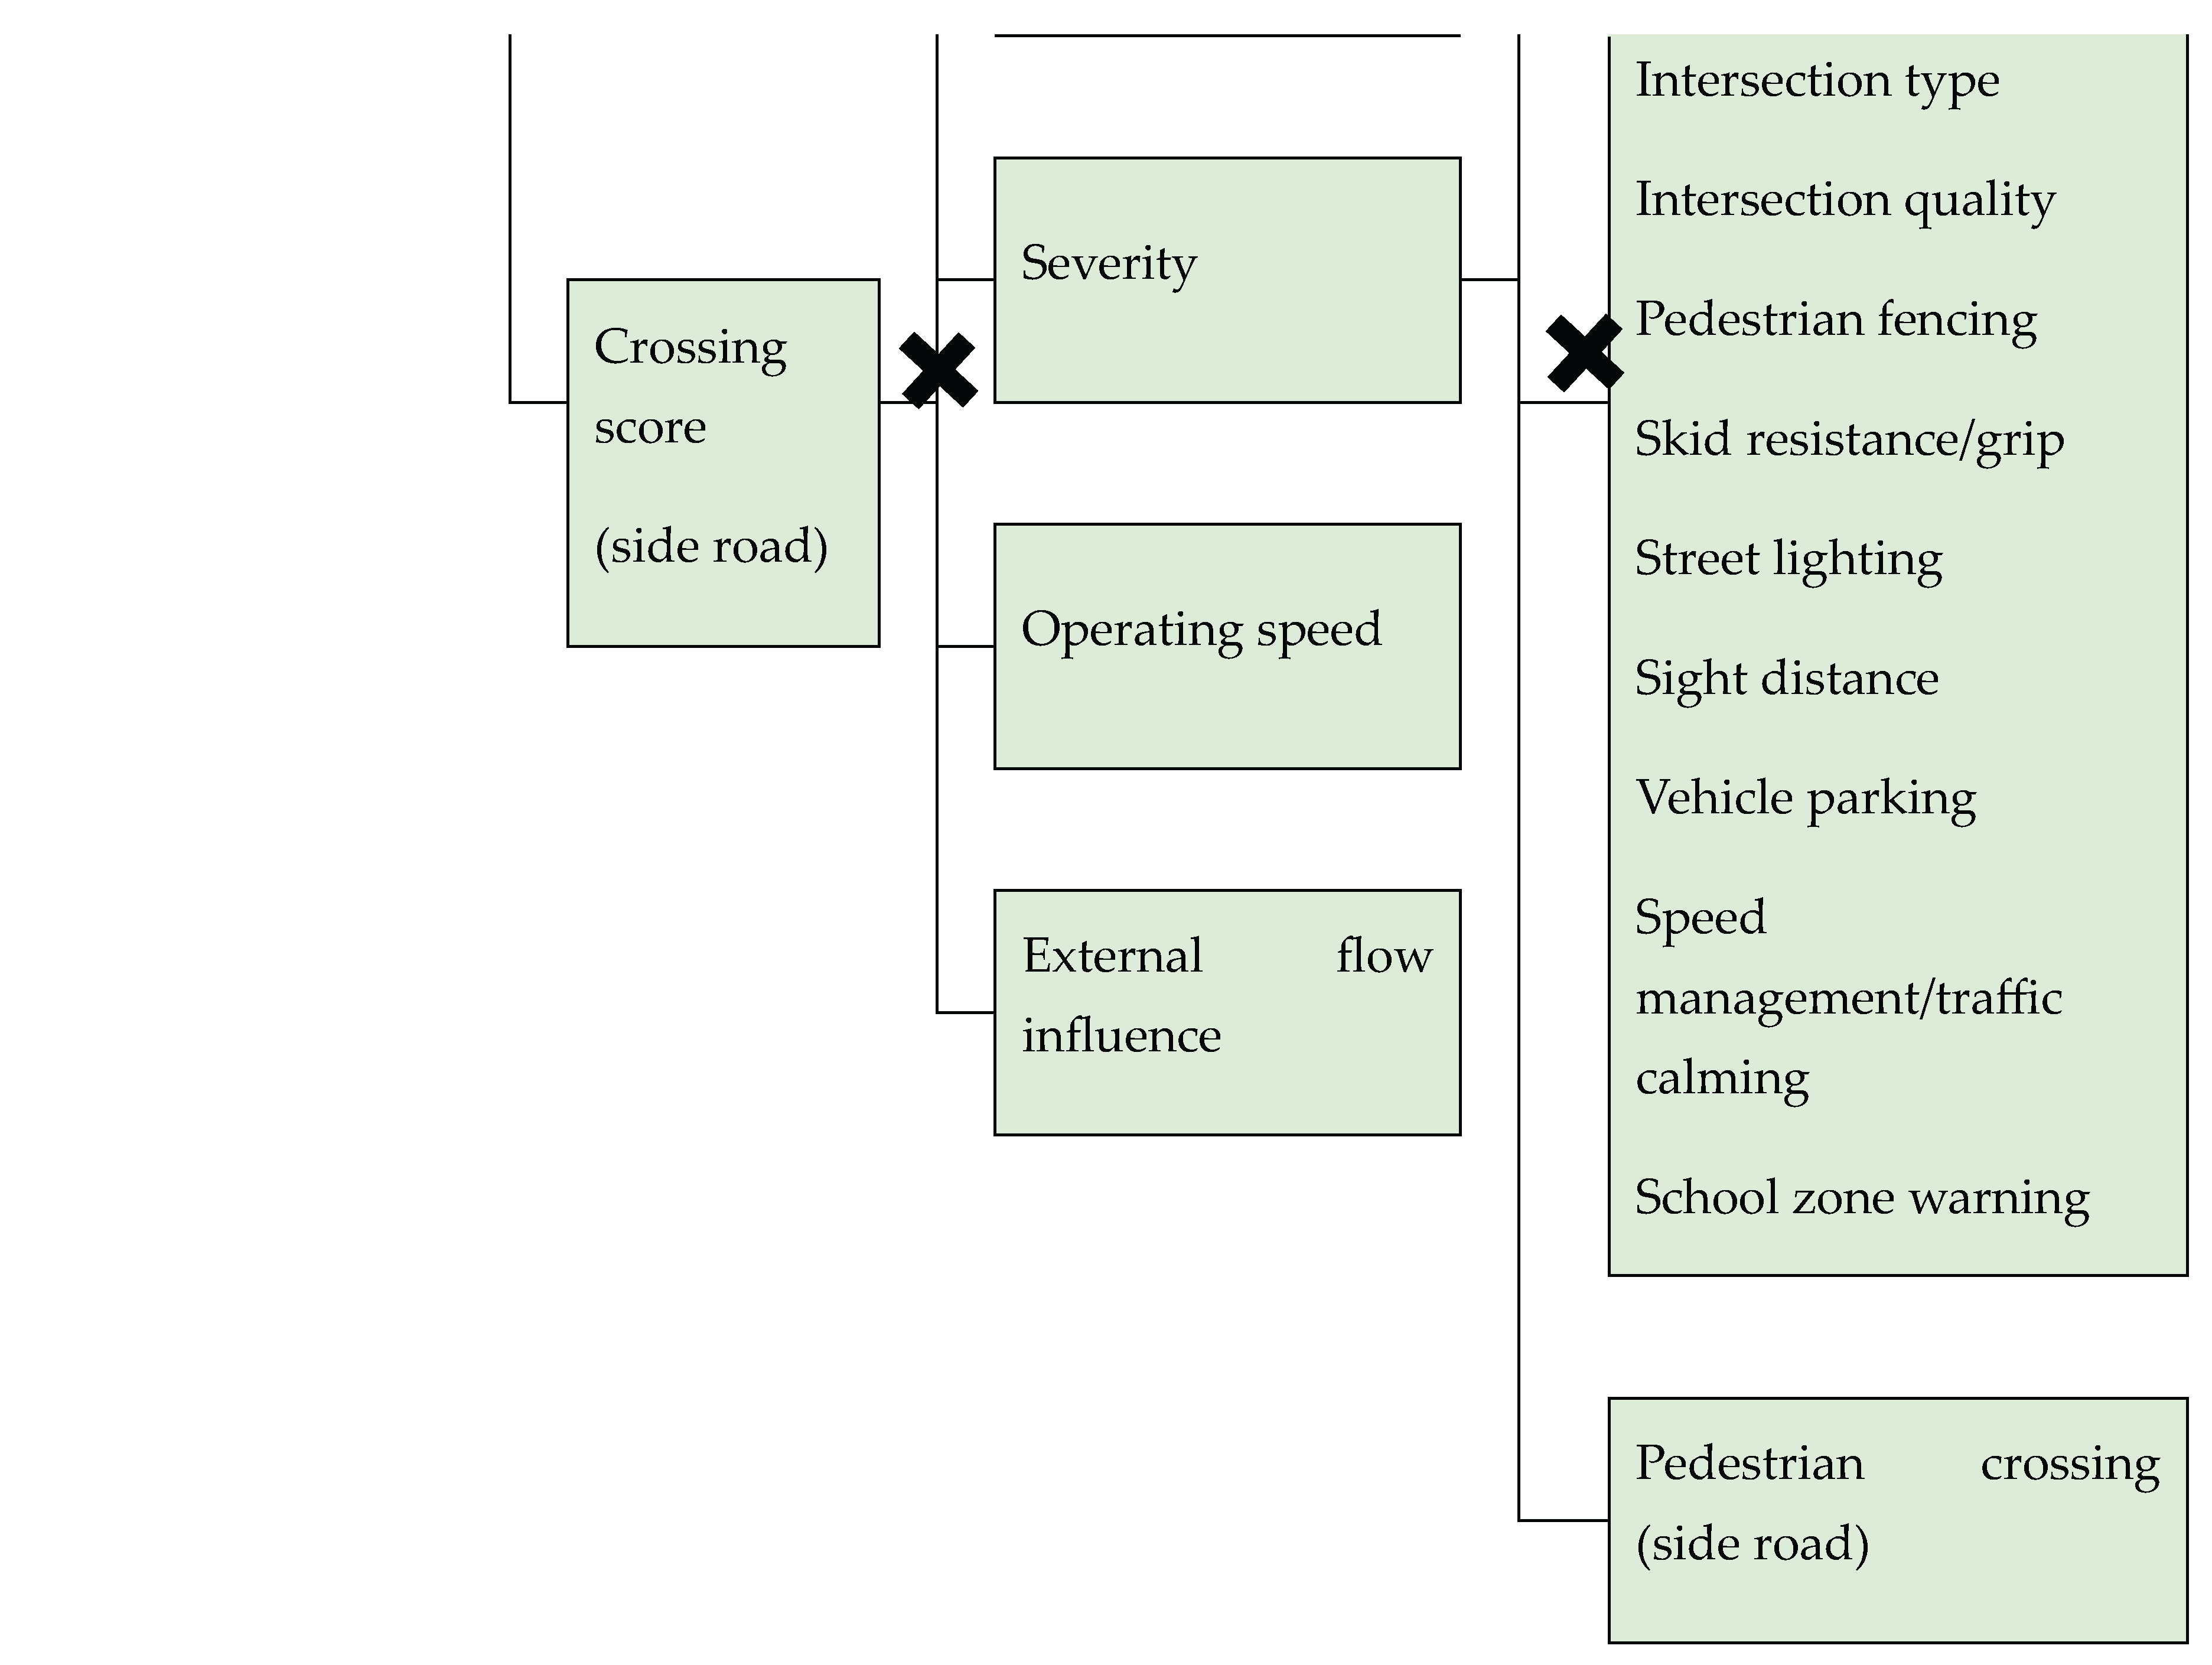
This modification enables direct comparison between contextualised and conventional star ratings, highlighting how factor integration alters countermeasure prioritisation. Figure 5 presents the adjusted PSRS framework.
2.6. Model Application Using an iRAP Worked Example
To demonstrate practical application, a worked example was conducted comparing PSRS outcomes with and without contextual factor integration. Using interpolated risk values from Table 4, and weighting adjustments (Table 5), star ratings were recalculated for different operating speeds and contrasted with baseline iRAP outcomes.
Results show that when contextual factors such as enforcement, overtaking tendency, or institutional capacity are considered, star rating scores decline significantly compared to iRAP’s baseline predictions. This confirms the model’s ability to capture the real-world constraints of developing country environments. Full calculation steps are provided in the Appendix A.
3. Results
3.1. Selection of Contextual Factors for the Adjusted Model
Table 1 presents the 16 contextual factors not currently considered in iRAP that were initially identified from the modelling and literature review process. Of these, five factors (pedestrian/vehicle volume ratio, footpath encroachment, Age 50+, street furniture vandalism, and age of countermeasure) were excluded because their risk factor values (Fi) fell within the trivial threshold of 0.9–1.1 [30]. The remaining 11 factors were retained for incorporation into the adjusted model.
3.2. Comparison of Weighting Methods
Four weighting techniques were applied (Spearman correlation, regression-based, PCA, and Budget Allocation) and the results compared.
- Table 2 shows the normalised weights computed for each contextual factor.
- These weights were subsequently adjusted into factored normalised weights (Table 2) to facilitate selection of the most appropriate method.
Comparative analysis revealed that the Budget Allocation Method (BA) produced a factored normalised weight of 0.991, closest to the ideal value of 1.0, confirming it as the most suitable weighting approach for the adjusted model.
This finding is further illustrated in Figure 3, which compares the factored weights across the four methods.
3.3. Final Weights per Factor
Table 3 summarises the final weights assigned to each factor under the selected Budget Allocation Method. These weights directly informed the adjusted effectiveness model (Eqn 1) and subsequent risk interpolations.
3.4. Interpolated Relative Risk Values
The dynamic effect of contextual factors across varying performance levels was captured using the log-linear interpolation formula (Eqn 6). The interpolated risk values for each retained factor are shown in Table 4, enabling incorporation of both baseline and extreme scenarios.
For example, public awareness demonstrates an exponential decline in risk with increasing awareness, although the marginal effect diminishes at higher levels of saturation (Figure 4).

Table 4.
Interpolated Relative risk values for each Factor.
| Performance level (%) | Vehicle age /technology | Public Safety Awareness | Driver Safety Awareness | Overtaking Tendency | Traffic Rule Enforcement | Countermeasure as Afterthought | Human Capacity of Agencies | Age 18-49 years | Female Pedestrians | Male Pedestrians | Employed Population |
|---|---|---|---|---|---|---|---|---|---|---|---|
| 0 | 1.000 | 1.120 | 1.135 | 1.000 | 1.625 | 1.000 | 1.220 | 1.000 | 1.139 | 1.000 | 1.000 |
| 5 | 1.008 | 1.114 | 1.128 | 1.025 | 1.586 | 1.016 | 1.208 | 1.007 | 1.132 | 1.006 | 1.010 |
| 10 | 1.015 | 1.107 | 1.121 | 1.051 | 1.548 | 1.032 | 1.196 | 1.014 | 1.124 | 1.011 | 1.020 |
| 15 | 1.023 | 1.101 | 1.114 | 1.078 | 1.511 | 1.048 | 1.184 | 1.021 | 1.117 | 1.017 | 1.030 |
| 20 | 1.030 | 1.095 | 1.107 | 1.106 | 1.475 | 1.065 | 1.172 | 1.028 | 1.110 | 1.022 | 1.041 |
| 25 | 1.038 | 1.089 | 1.100 | 1.134 | 1.439 | 1.082 | 1.161 | 1.036 | 1.103 | 1.028 | 1.051 |
| 30 | 1.046 | 1.083 | 1.093 | 1.163 | 1.405 | 1.099 | 1.149 | 1.043 | 1.095 | 1.033 | 1.062 |
| 35 | 1.054 | 1.076 | 1.086 | 1.192 | 1.371 | 1.116 | 1.138 | 1.050 | 1.088 | 1.039 | 1.072 |
| 40 | 1.062 | 1.070 | 1.079 | 1.222 | 1.338 | 1.134 | 1.127 | 1.057 | 1.081 | 1.045 | 1.083 |
| 45 | 1.070 | 1.064 | 1.072 | 1.253 | 1.306 | 1.152 | 1.116 | 1.065 | 1.074 | 1.051 | 1.094 |
| 50 | 1.078 | 1.058 | 1.065 | 1.285 | 1.275 | 1.170 | 1.105 | 1.072 | 1.067 | 1.056 | 1.105 |
| 55 | 1.086 | 1.052 | 1.059 | 1.318 | 1.244 | 1.189 | 1.094 | 1.080 | 1.060 | 1.062 | 1.116 |
| 60 | 1.094 | 1.046 | 1.052 | 1.351 | 1.214 | 1.207 | 1.083 | 1.087 | 1.053 | 1.068 | 1.127 |
| 65 | 1.103 | 1.040 | 1.045 | 1.386 | 1.185 | 1.226 | 1.072 | 1.095 | 1.047 | 1.074 | 1.139 |
| 70 | 1.111 | 1.035 | 1.039 | 1.421 | 1.157 | 1.246 | 1.061 | 1.103 | 1.040 | 1.080 | 1.150 |
| 75 | 1.119 | 1.029 | 1.032 | 1.457 | 1.129 | 1.266 | 1.051 | 1.111 | 1.033 | 1.086 | 1.162 |
| 80 | 1.128 | 1.023 | 1.026 | 1.494 | 1.102 | 1.286 | 1.041 | 1.118 | 1.026 | 1.092 | 1.173 |
| 85 | 1.136 | 1.017 | 1.019 | 1.532 | 1.076 | 1.306 | 1.030 | 1.126 | 1.020 | 1.098 | 1.185 |
| 90 | 1.145 | 1.011 | 1.013 | 1.571 | 1.050 | 1.327 | 1.020 | 1.134 | 1.013 | 1.104 | 1.197 |
| 95 | 1.153 | 1.006 | 1.006 | 1.611 | 1.025 | 1.348 | 1.010 | 1.142 | 1.007 | 1.110 | 1.209 |
| 100 | 1.162 | 1.000 | 1.000 | 1.652 | 1.000 | 1.369 | 1.000 | 1.150 | 1.000 | 1.116 | 1.221 |
Figure 4.
Exponential decline of relative risk as public awareness increases.
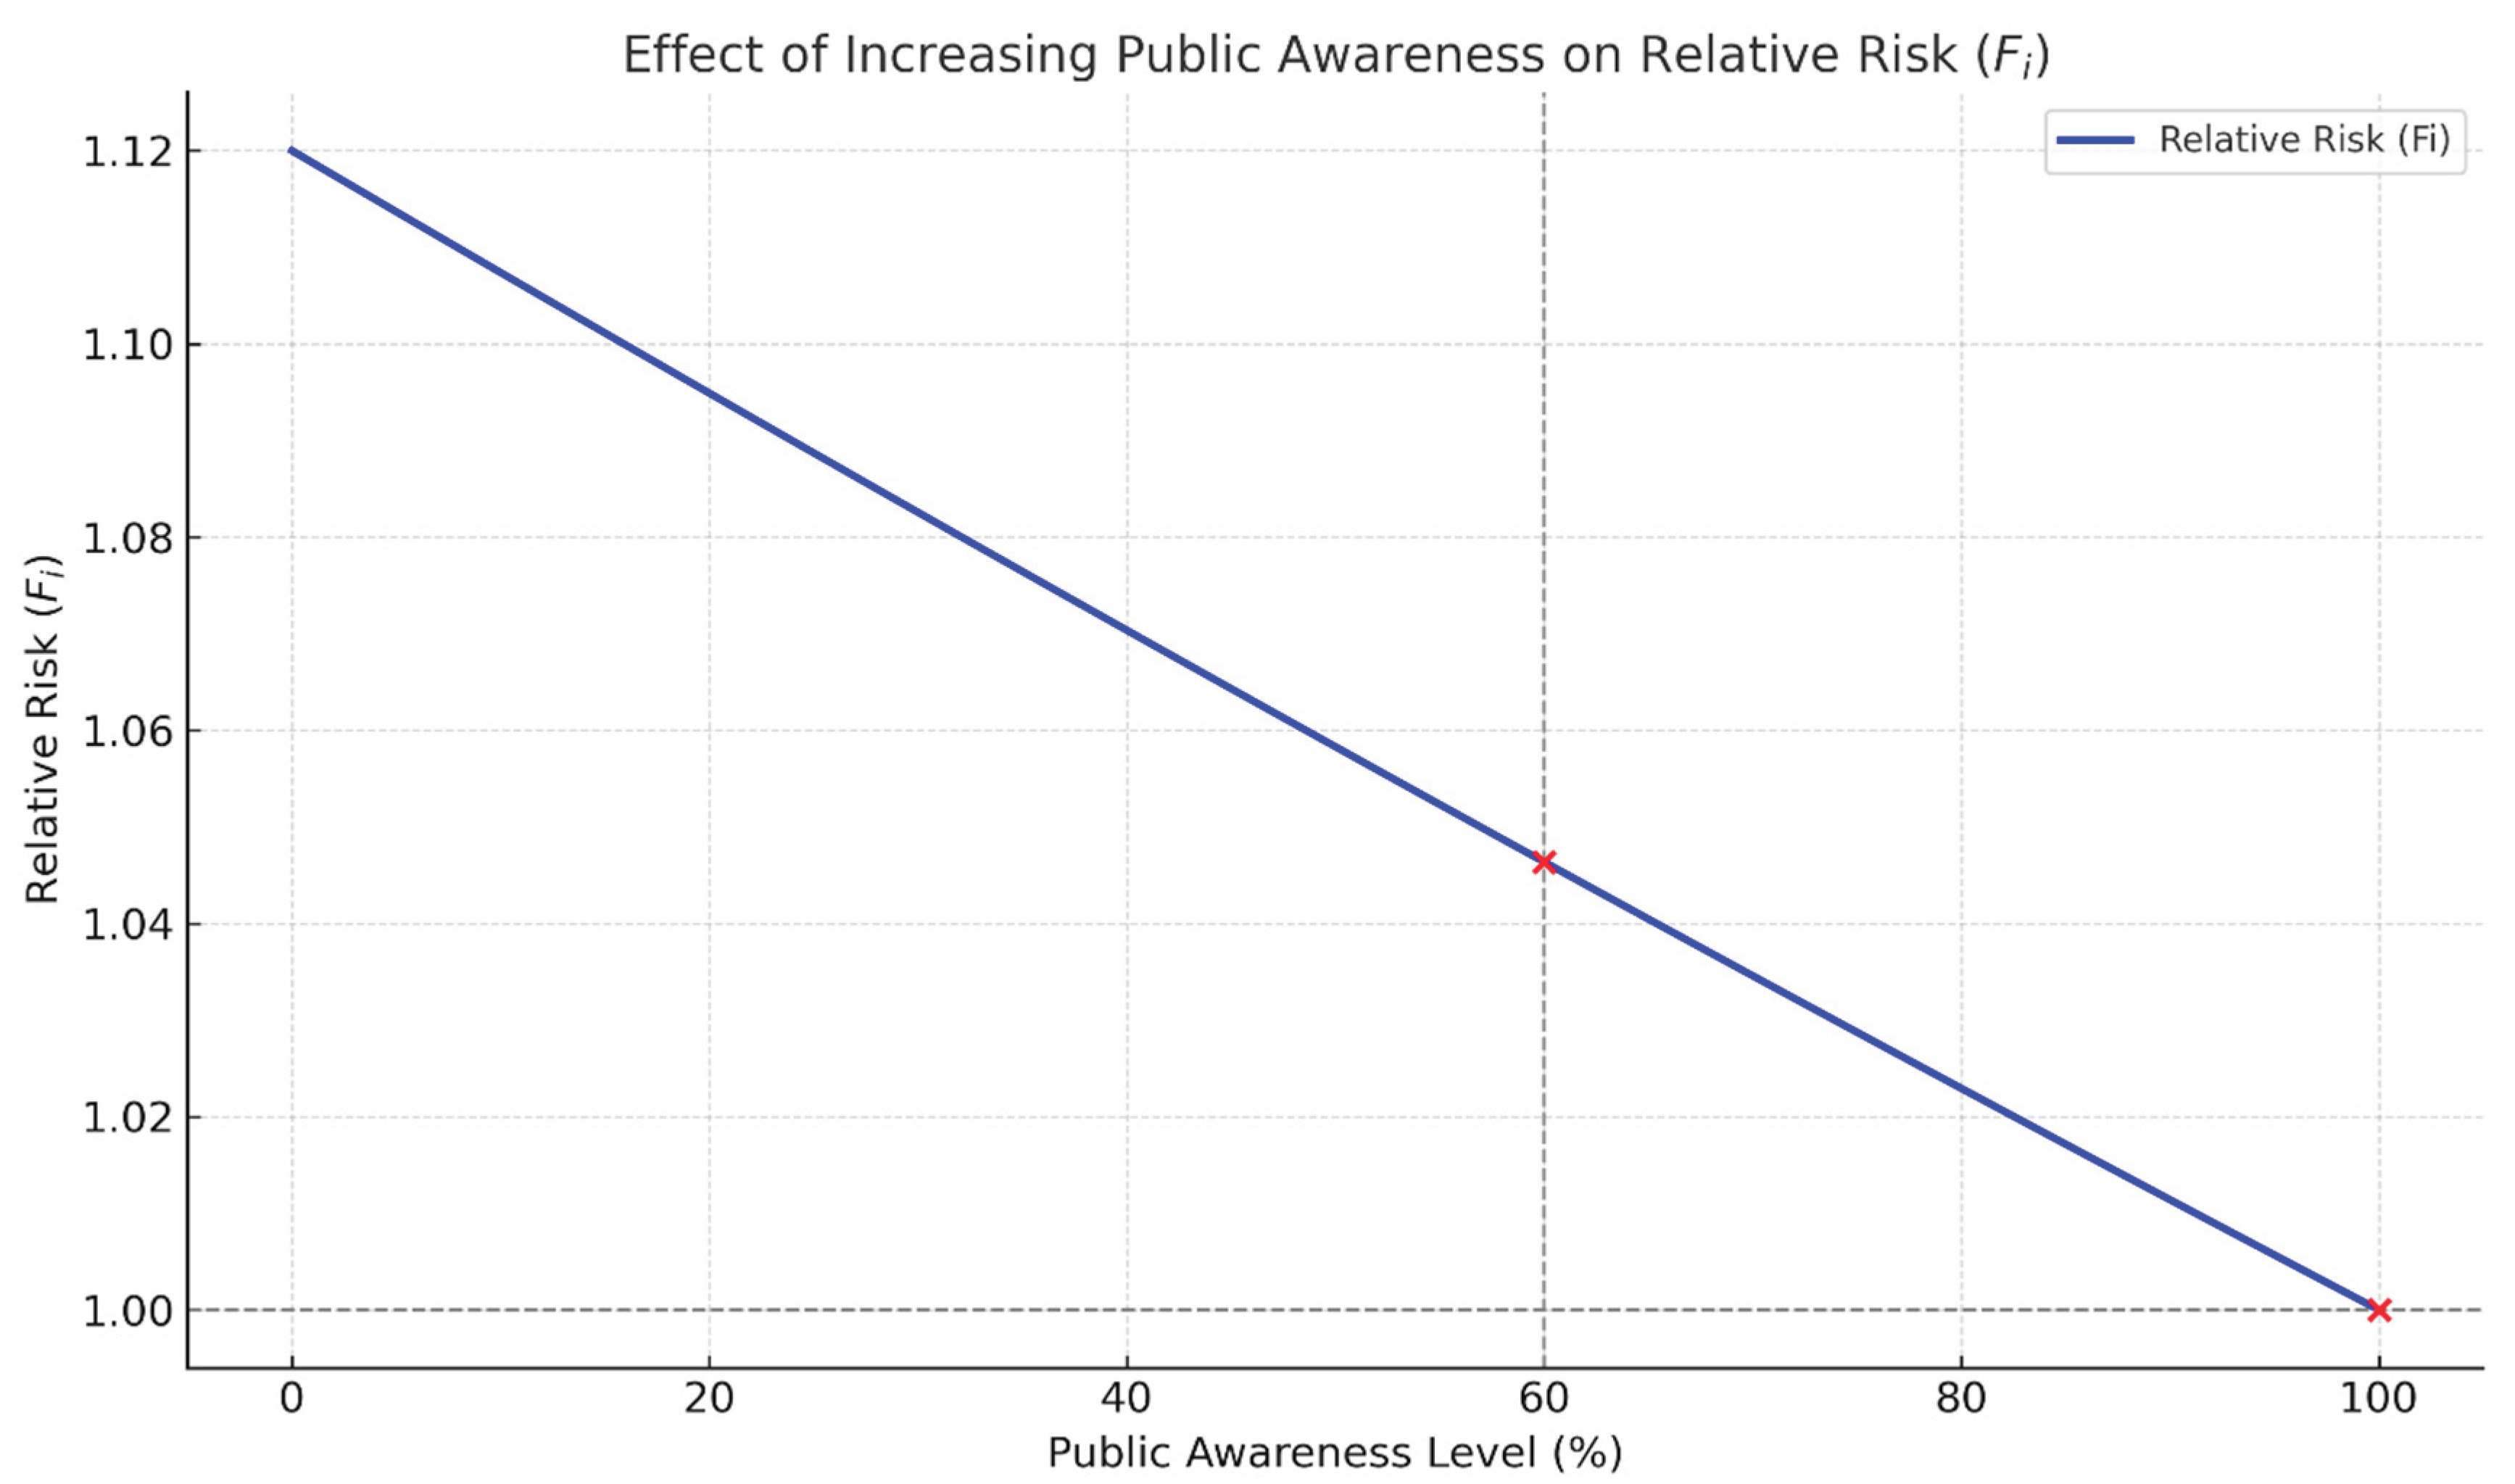
Figure 5.
Graphical representation of Adjusted Star Rating Score.
3.5. Weighted Factor Scenarios
Table 5 shows the calculated weighted factors for best- and worst-case scenarios, illustrating how countermeasure effectiveness varies when contextual conditions are favourable versus adverse. These weighted risk values were computed using Eqn 6 and serve as direct inputs into the adjusted effectiveness calculations.
Table 5.
Calculation of the weighted factors for best- and worst-case scenarios.
| Factor/Variable | Weights Wi | Relative risk value (Fi) - Best case | Relative risk value (Fi) - Worst case | Wi*Fi Best Case | Wi*Fi Worst Case |
|---|---|---|---|---|---|
| Vehicle age /technology | 0.017 | 1.000 | 1.162 | 0.017 | 0.019 |
| Public Safety Awareness | 0.012 | 1.000 | 1.120 | 0.012 | 0.014 |
| Driver Safety Awareness | 0.014 | 1.000 | 1.135 | 0.014 | 0.016 |
| Overtaking Tendency | 0.067 | 1.000 | 1.652 | 0.067 | 0.111 |
| Traffic Rule Enforcement | 0.064 | 1.000 | 1.625 | 0.064 | 0.105 |
| Countermeasure as Afterthought | 0.038 | 1.000 | 1.369 | 0.038 | 0.052 |
| Human Capacity of Agencies | 0.023 | 1.000 | 1.220 | 0.023 | 0.028 |
| Age 18-49 Years | 0.015 | 1.000 | 1.150 | 0.015 | 0.018 |
| Female Pedestrians | 0.014 | 1.000 | 1.139 | 0.014 | 0.016 |
| Male Pedestrians | 0.012 | 1.000 | 1.116 | 0.012 | 0.013 |
| Employed Population | 0.023 | 1.000 | 1.221 | 0.023 | 0.028 |
| Sum | 0.300 | 0.420 | |||
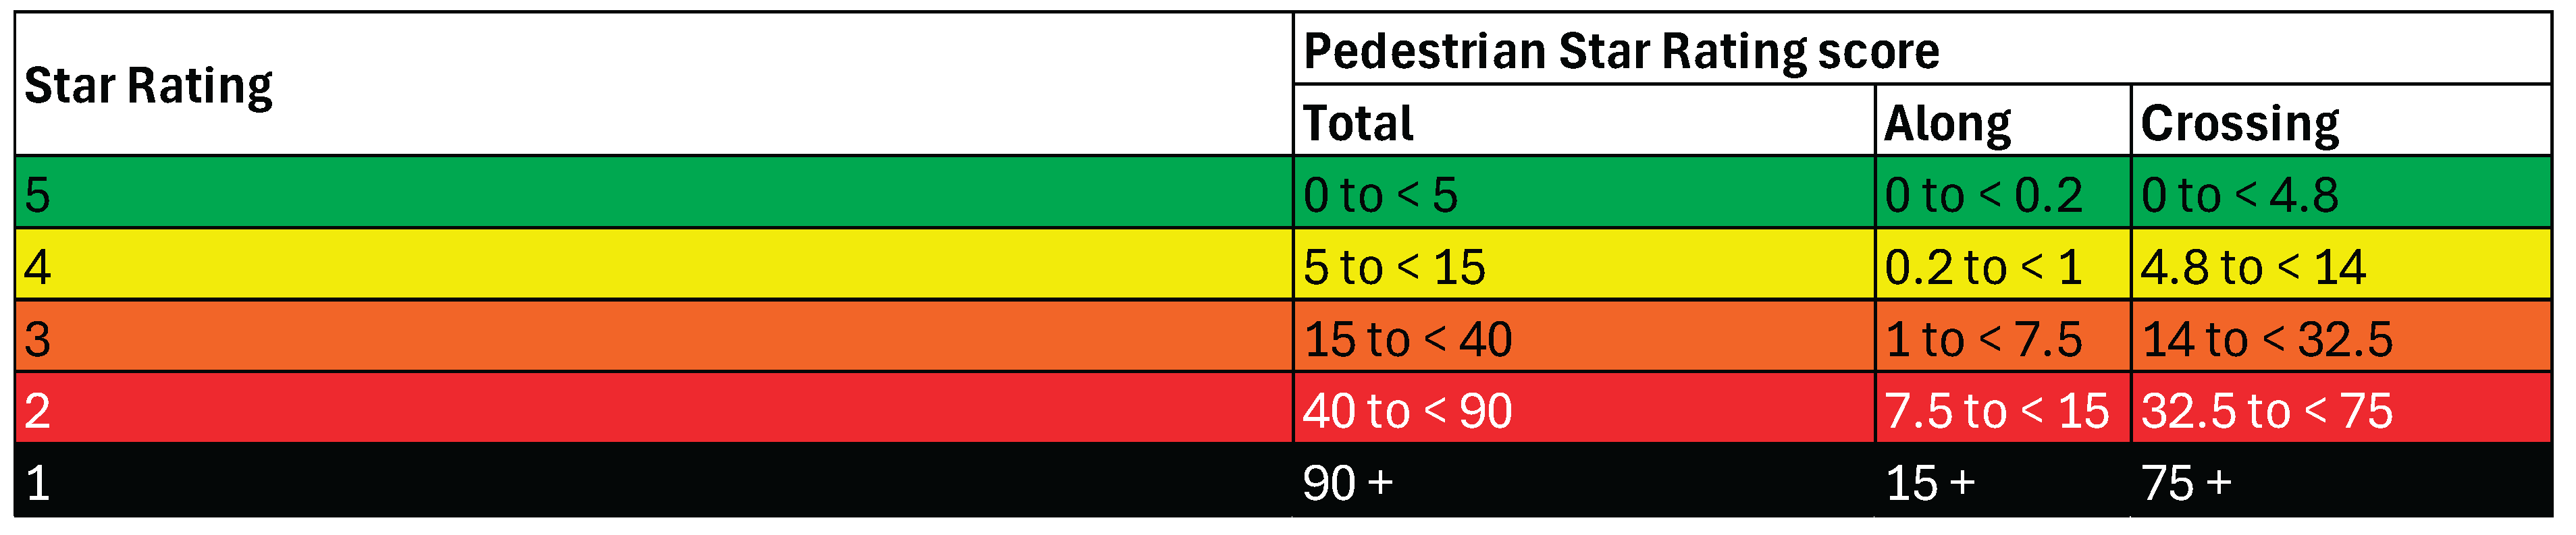
3.6. Star Rating Inputs
To ensure comparability with the iRAP methodology, two additional standard reference tables were applied. Table 7 provides relative risk values for different operating speeds, while Table 8 specifies the colour-coded classification bands for Pedestrian Star Rating Scores (PSRS), ranging from 1-star (least safe) to 5-star (safest).
Table 6.
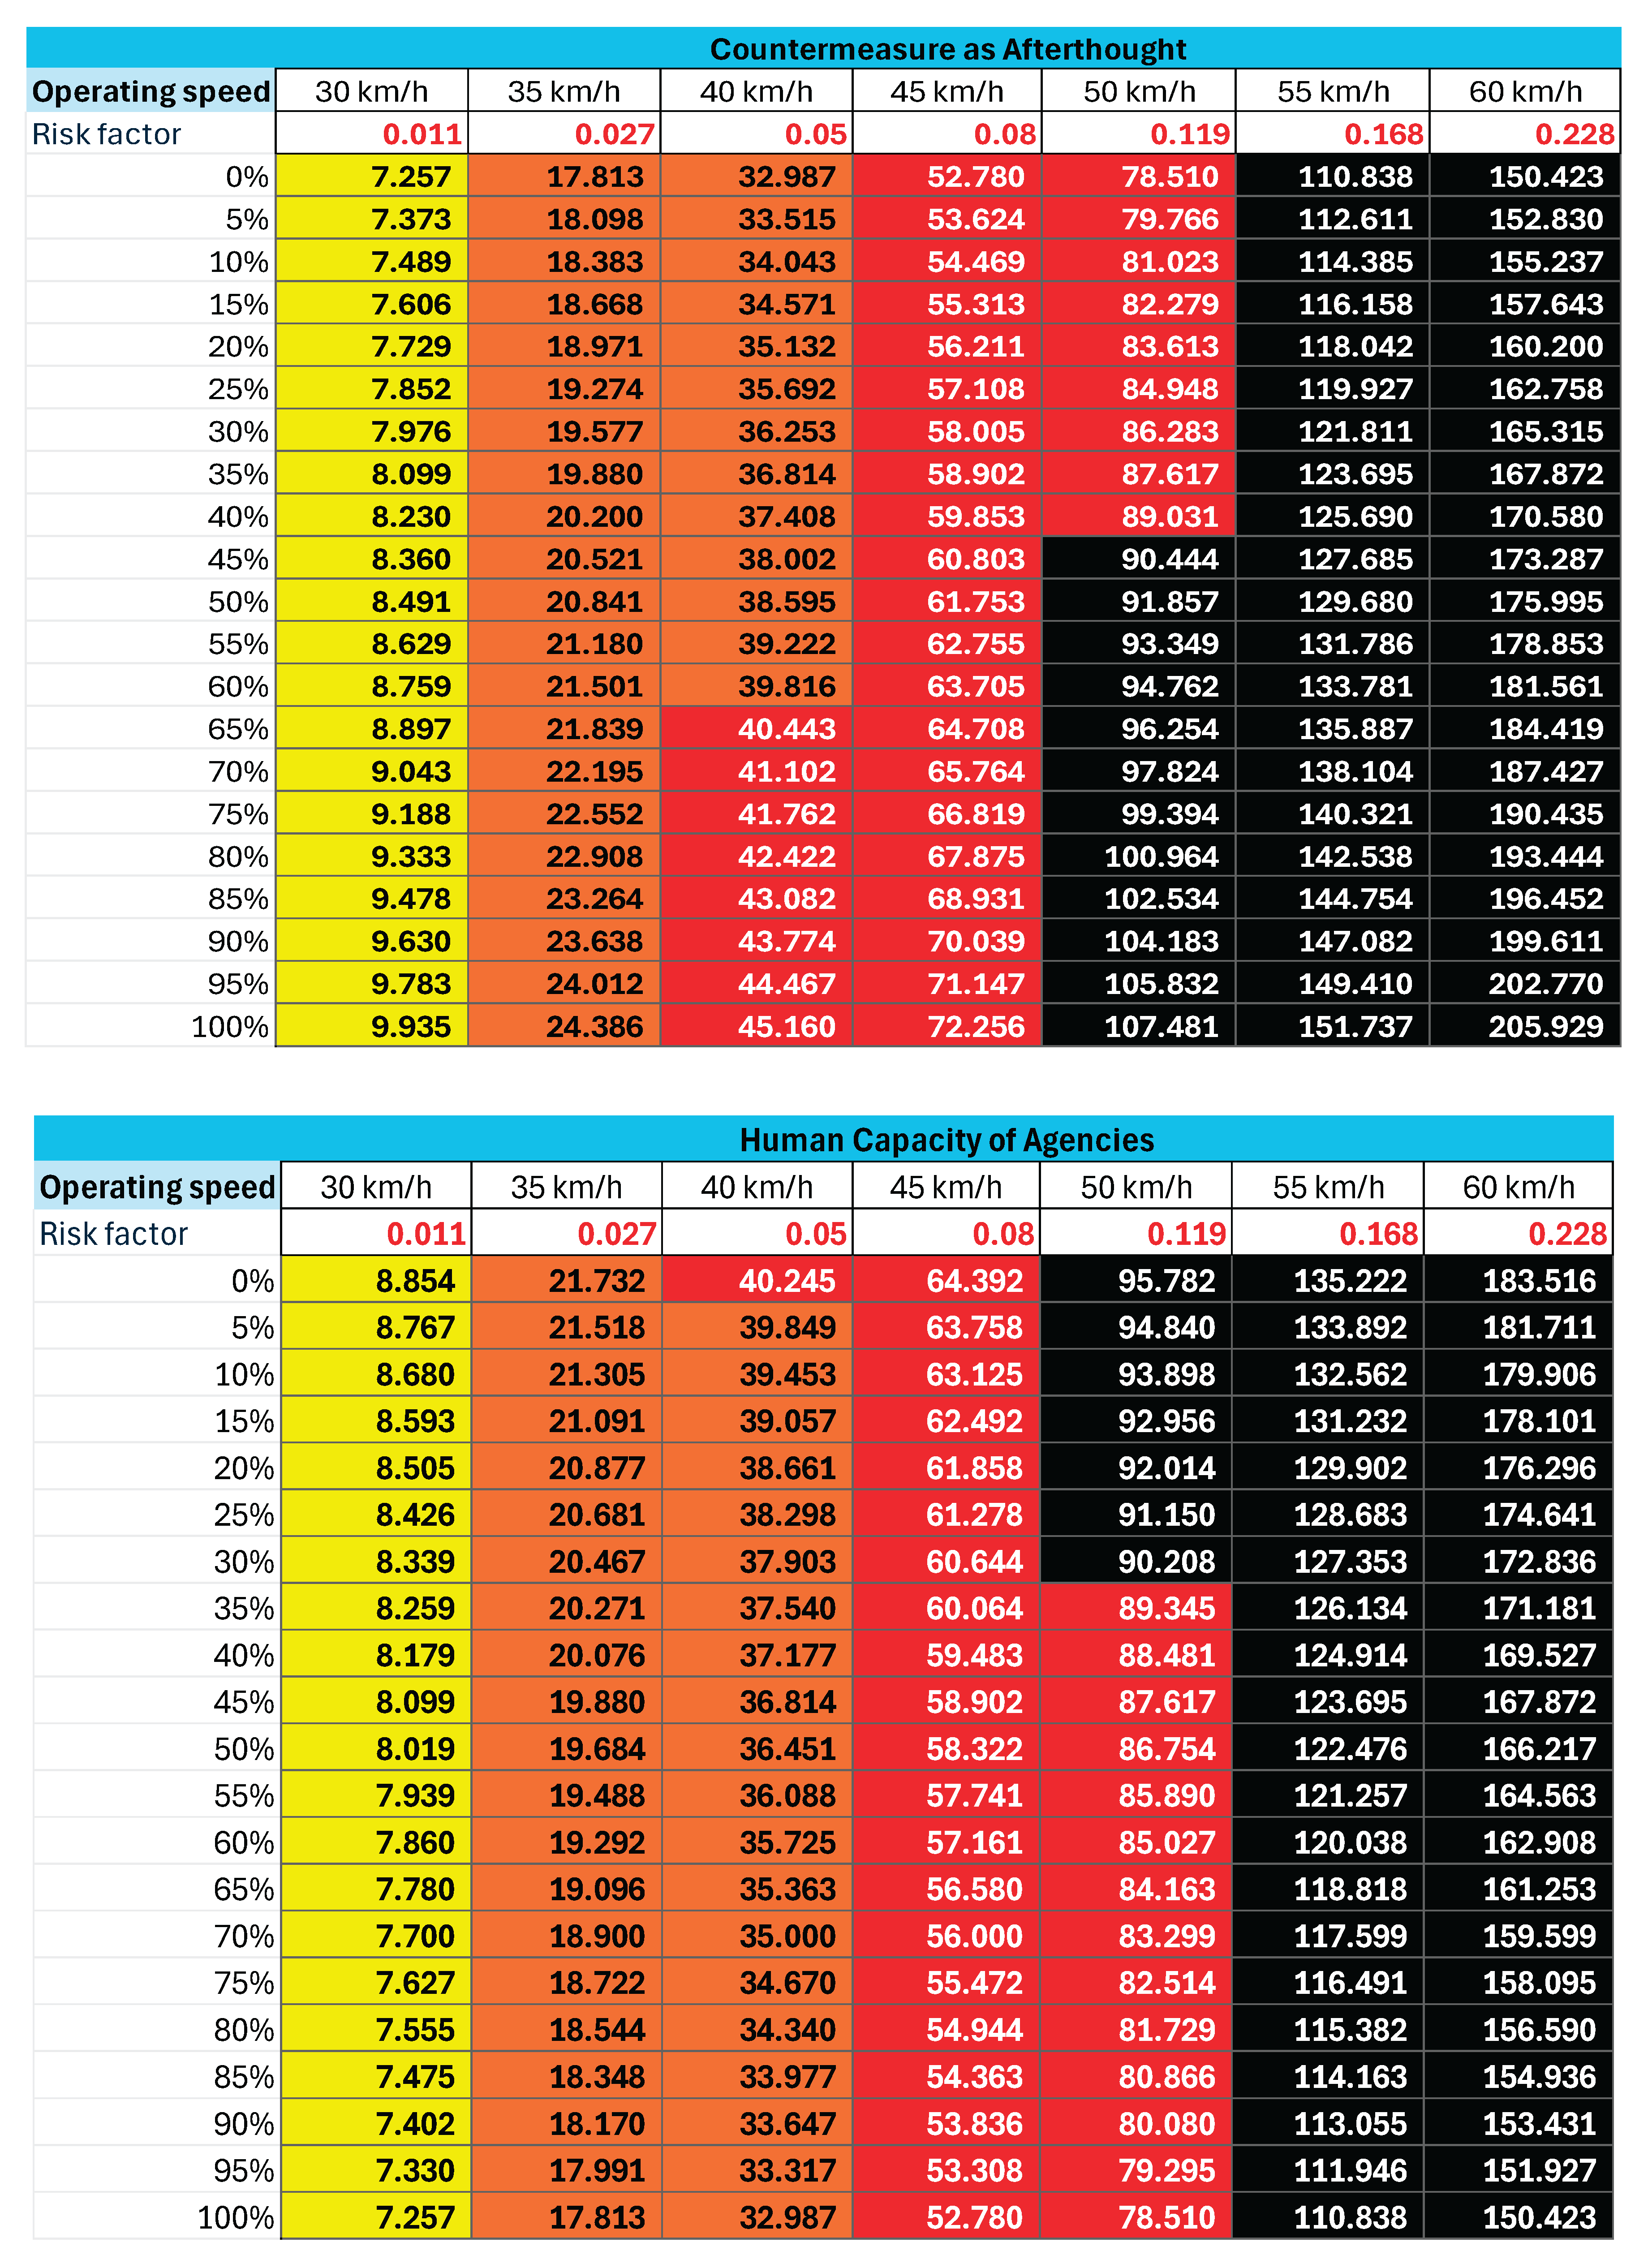
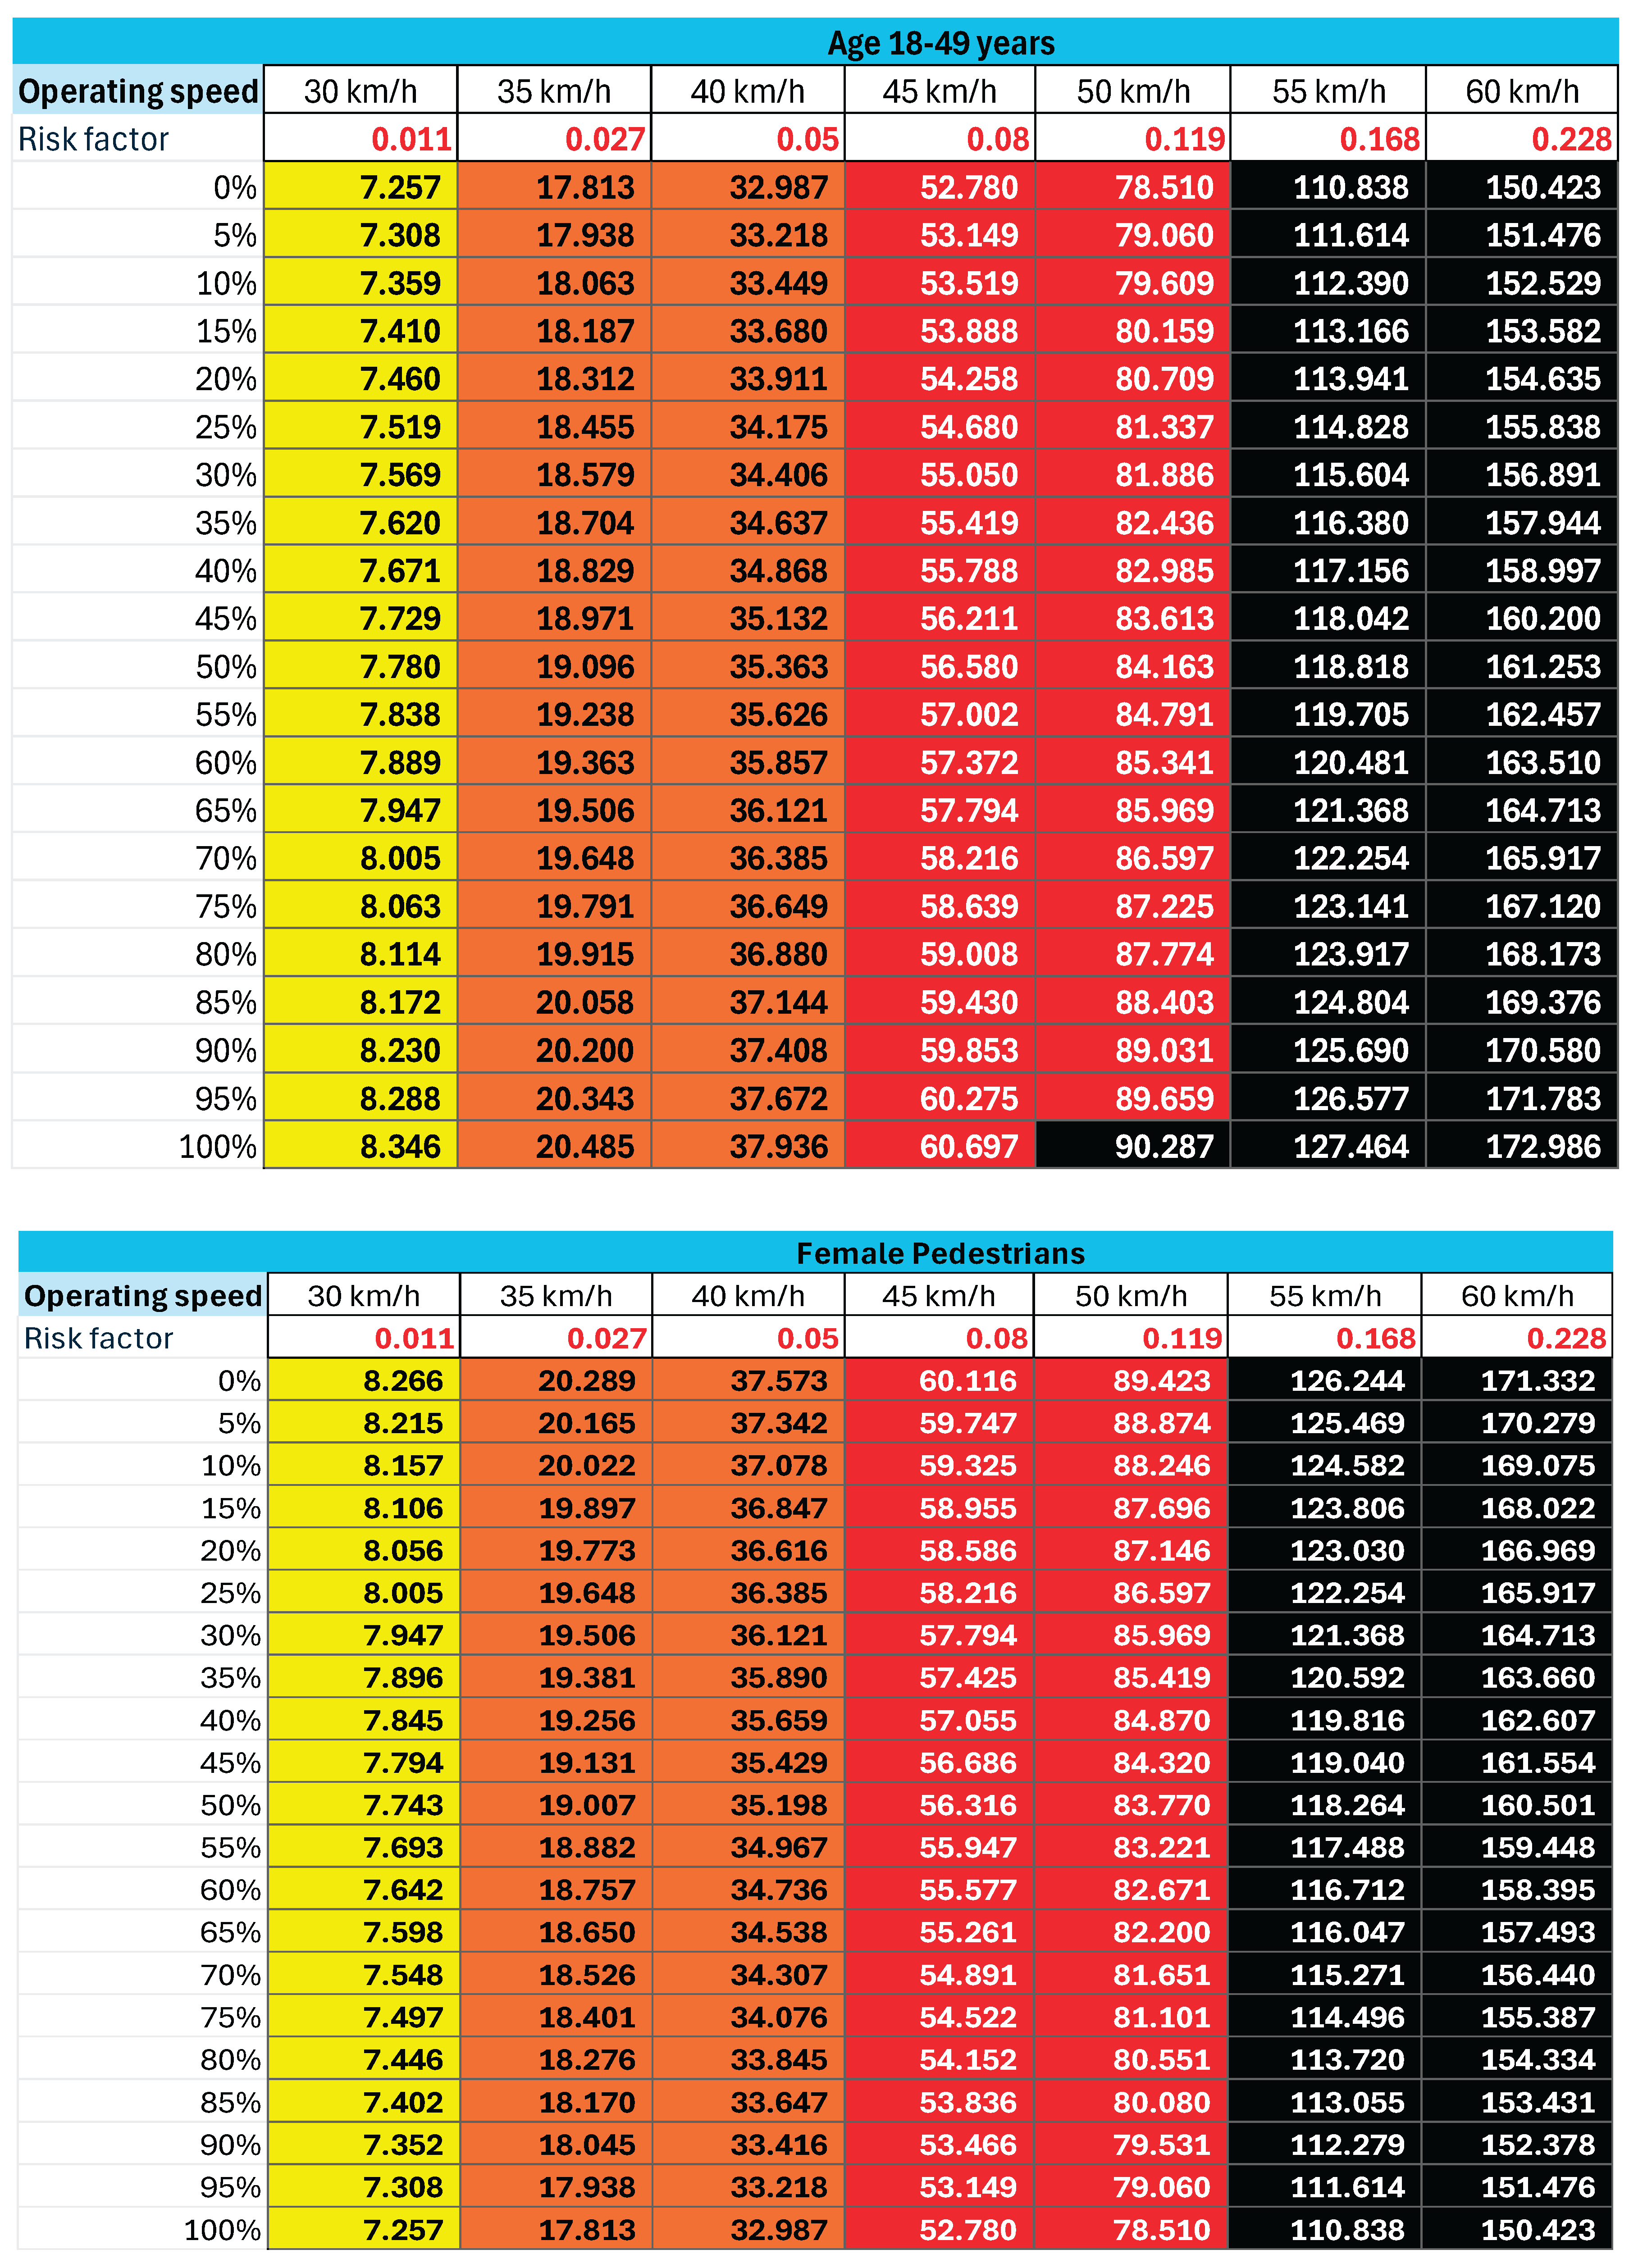
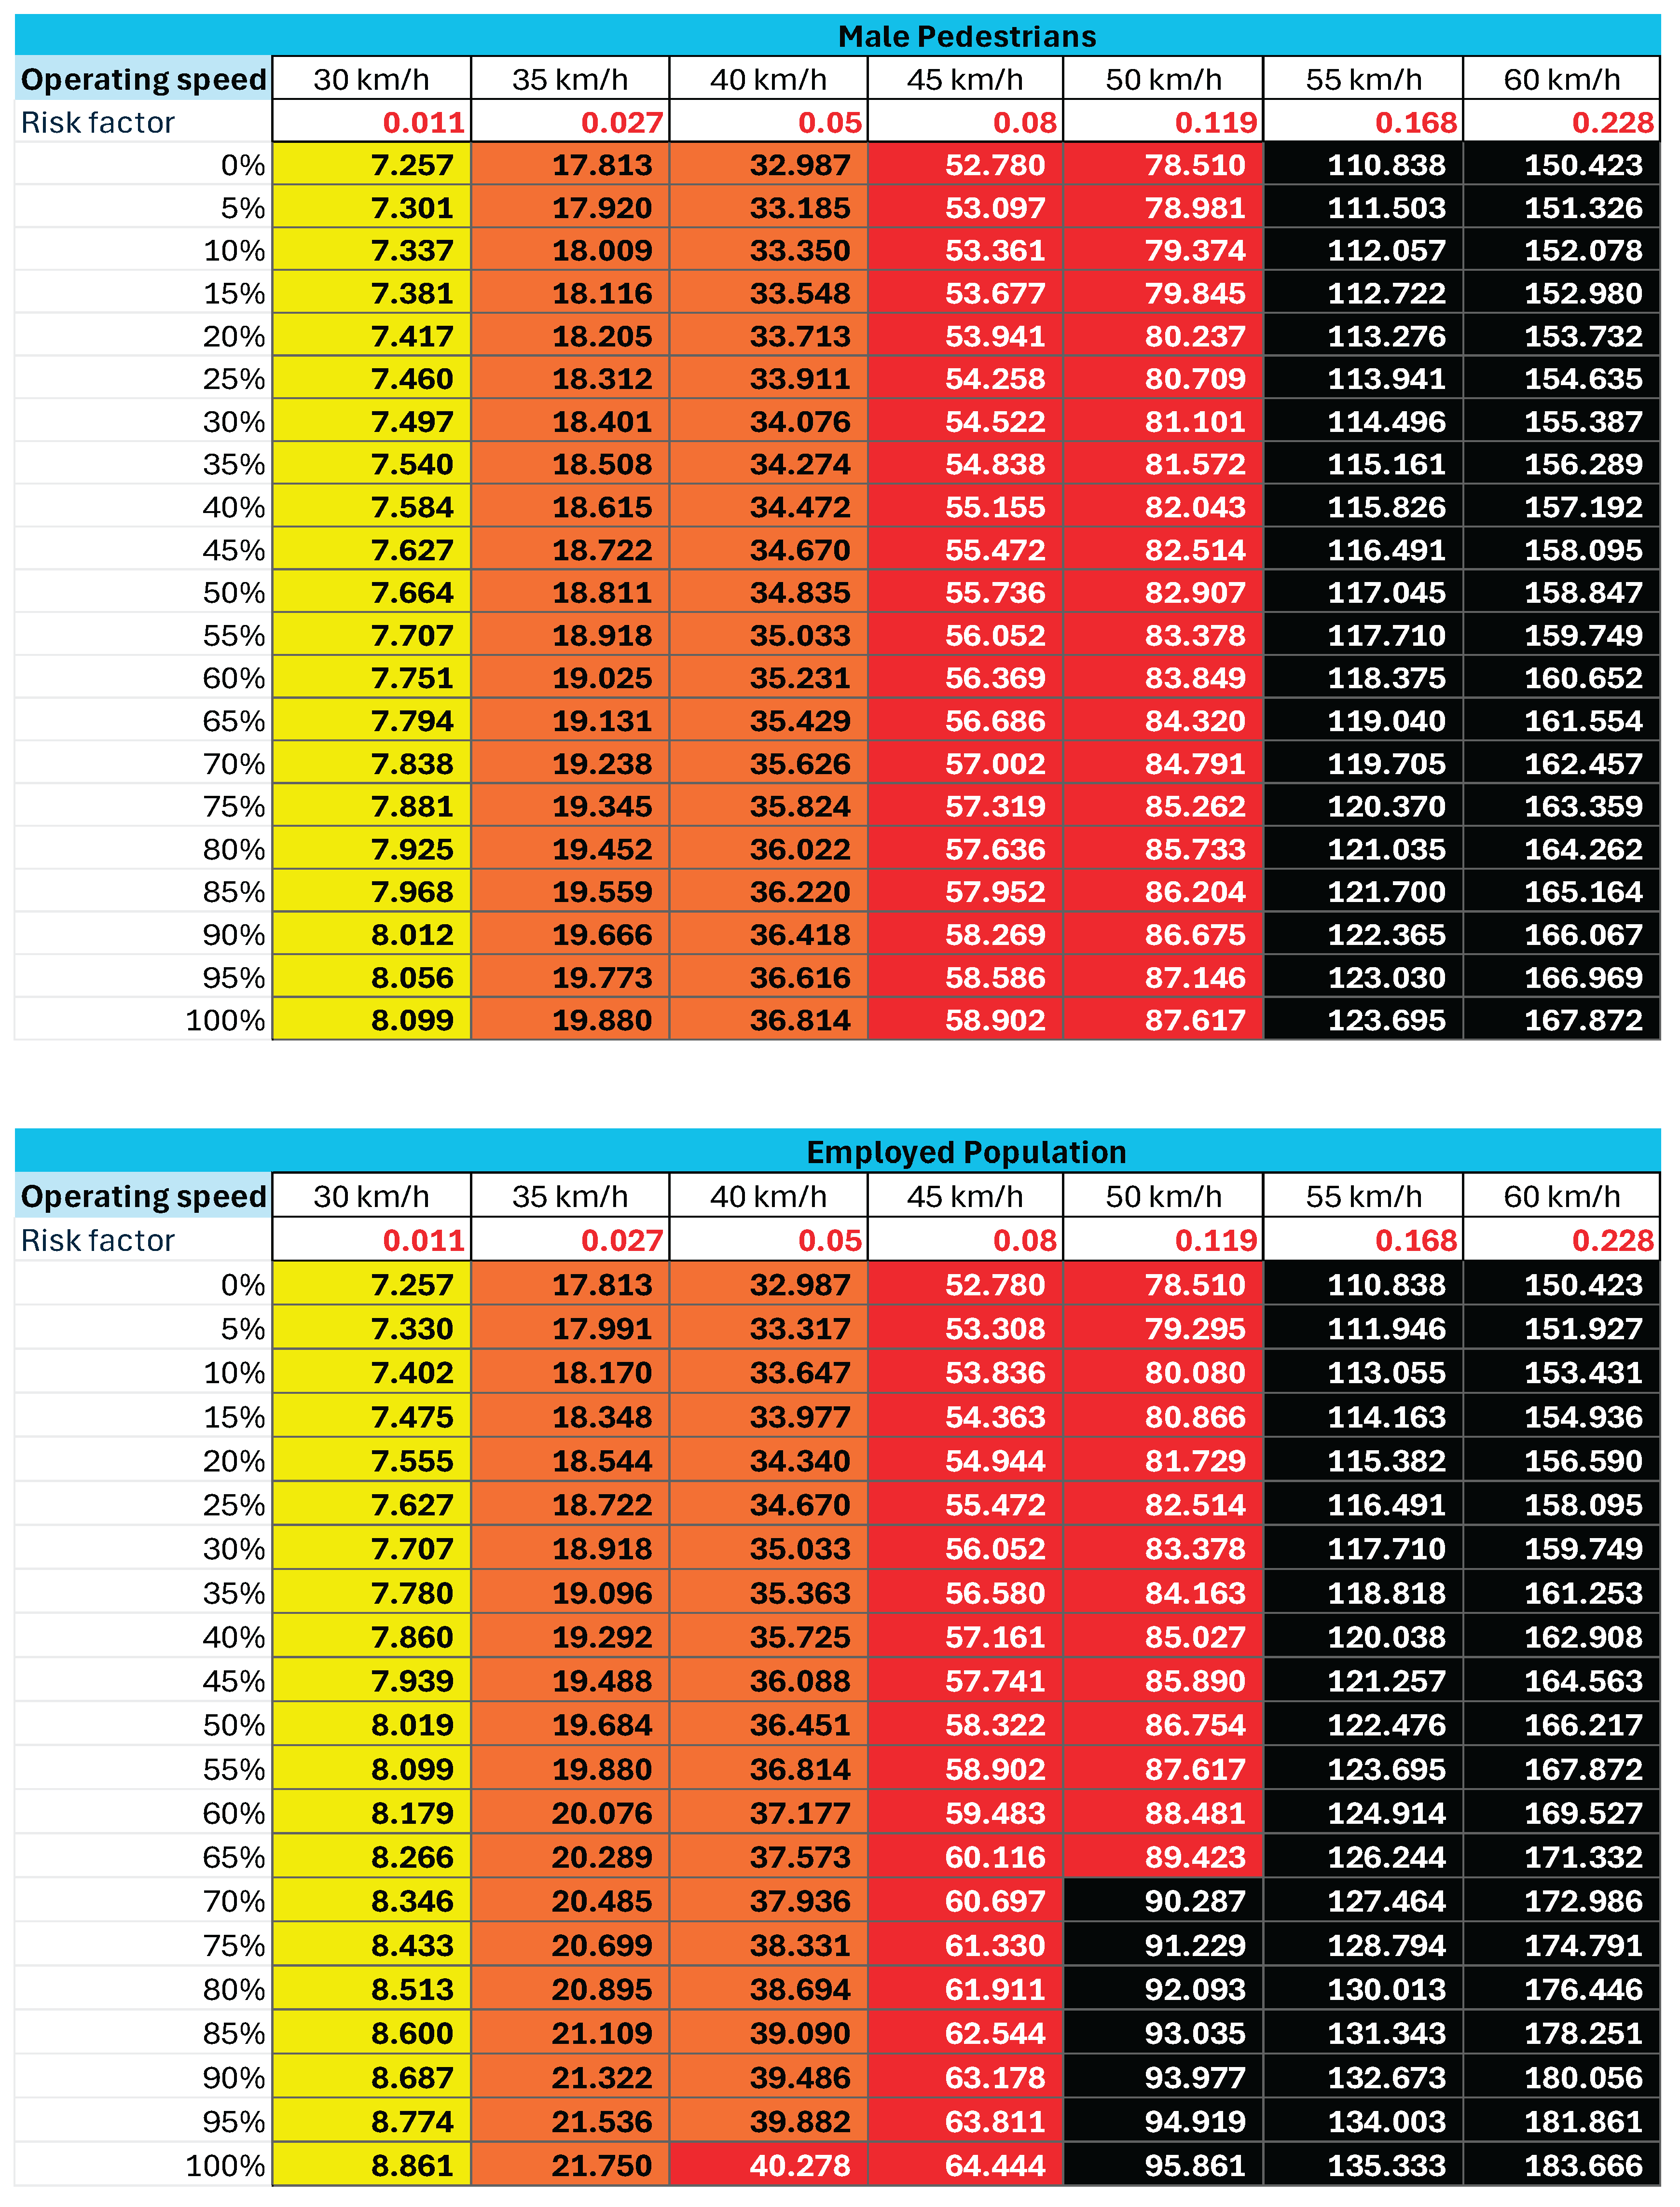
Weighted risk values for each factor at various performance levels.
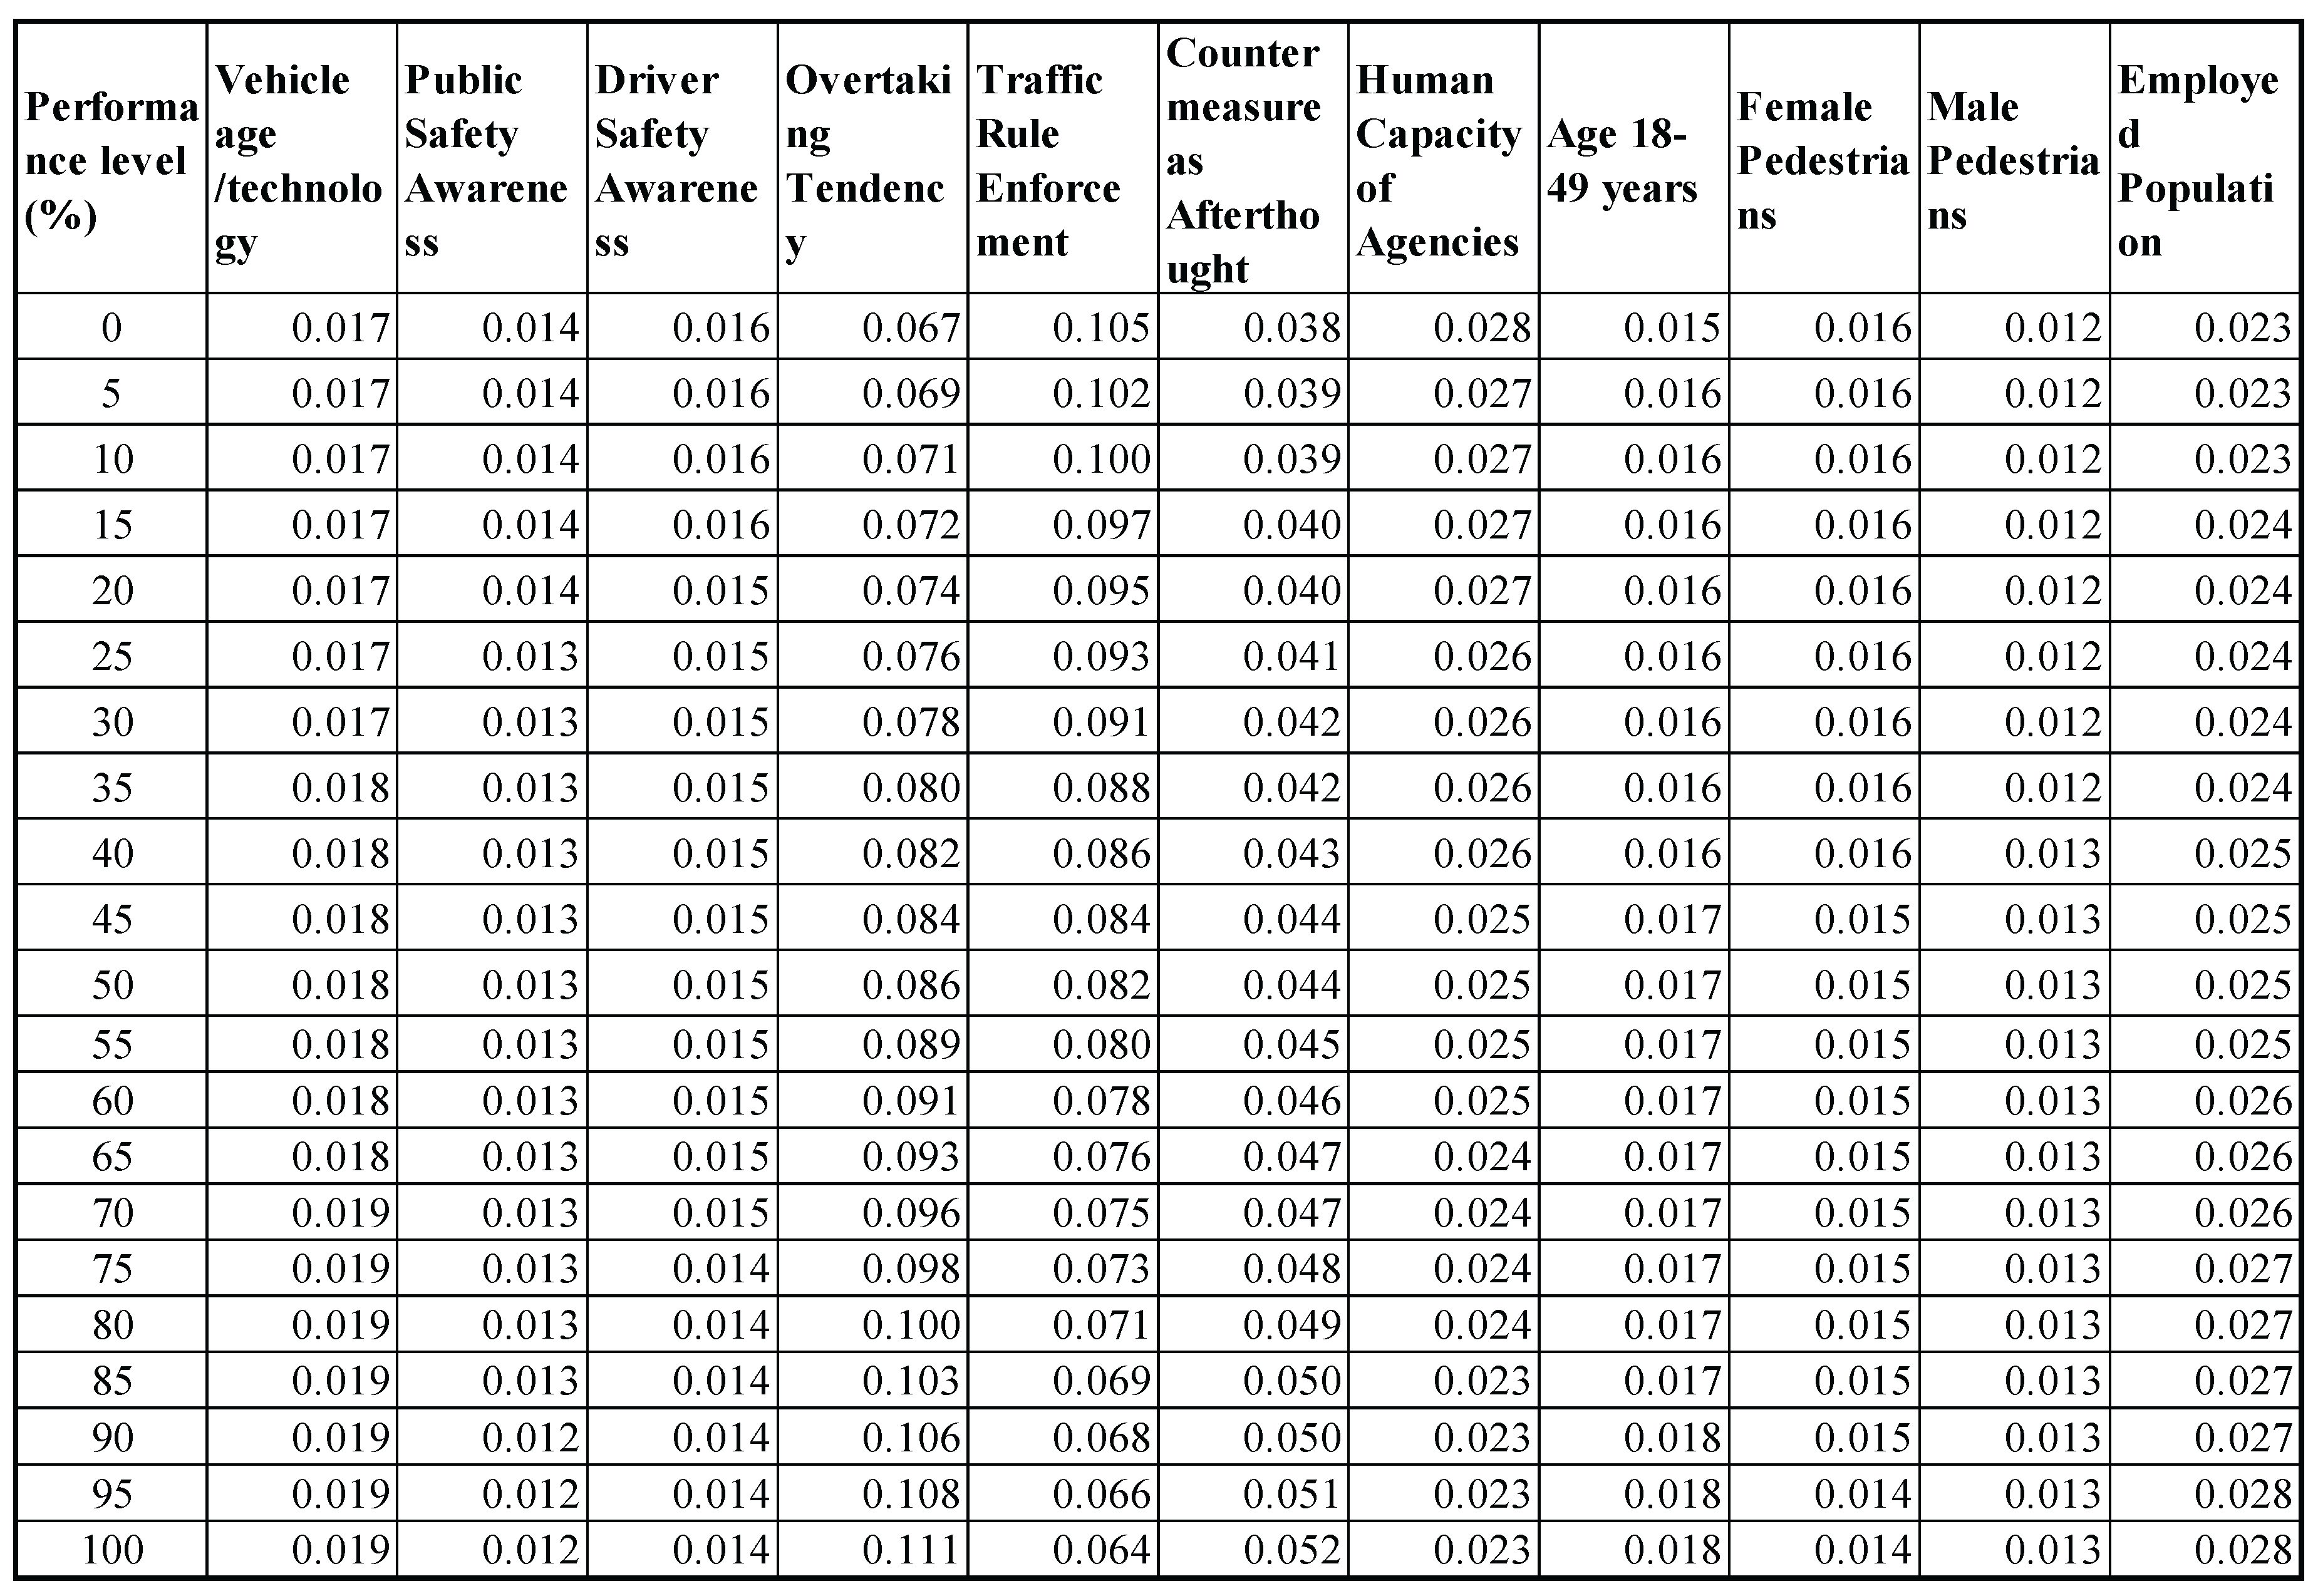
Table 7.
Relative risk values for different operating speeds by iRAP.
| Operating Speed (Km/h) | 30 | 35 | 40 | 45 | 50 | 55 | 60 |
| Relative risk | 0.011 | 0.027 | 0.050 | 0.080 | 0.119 | 0.168 | 0.228 |
Table 8.
Star Rating Score Colour Codes by iRAP.
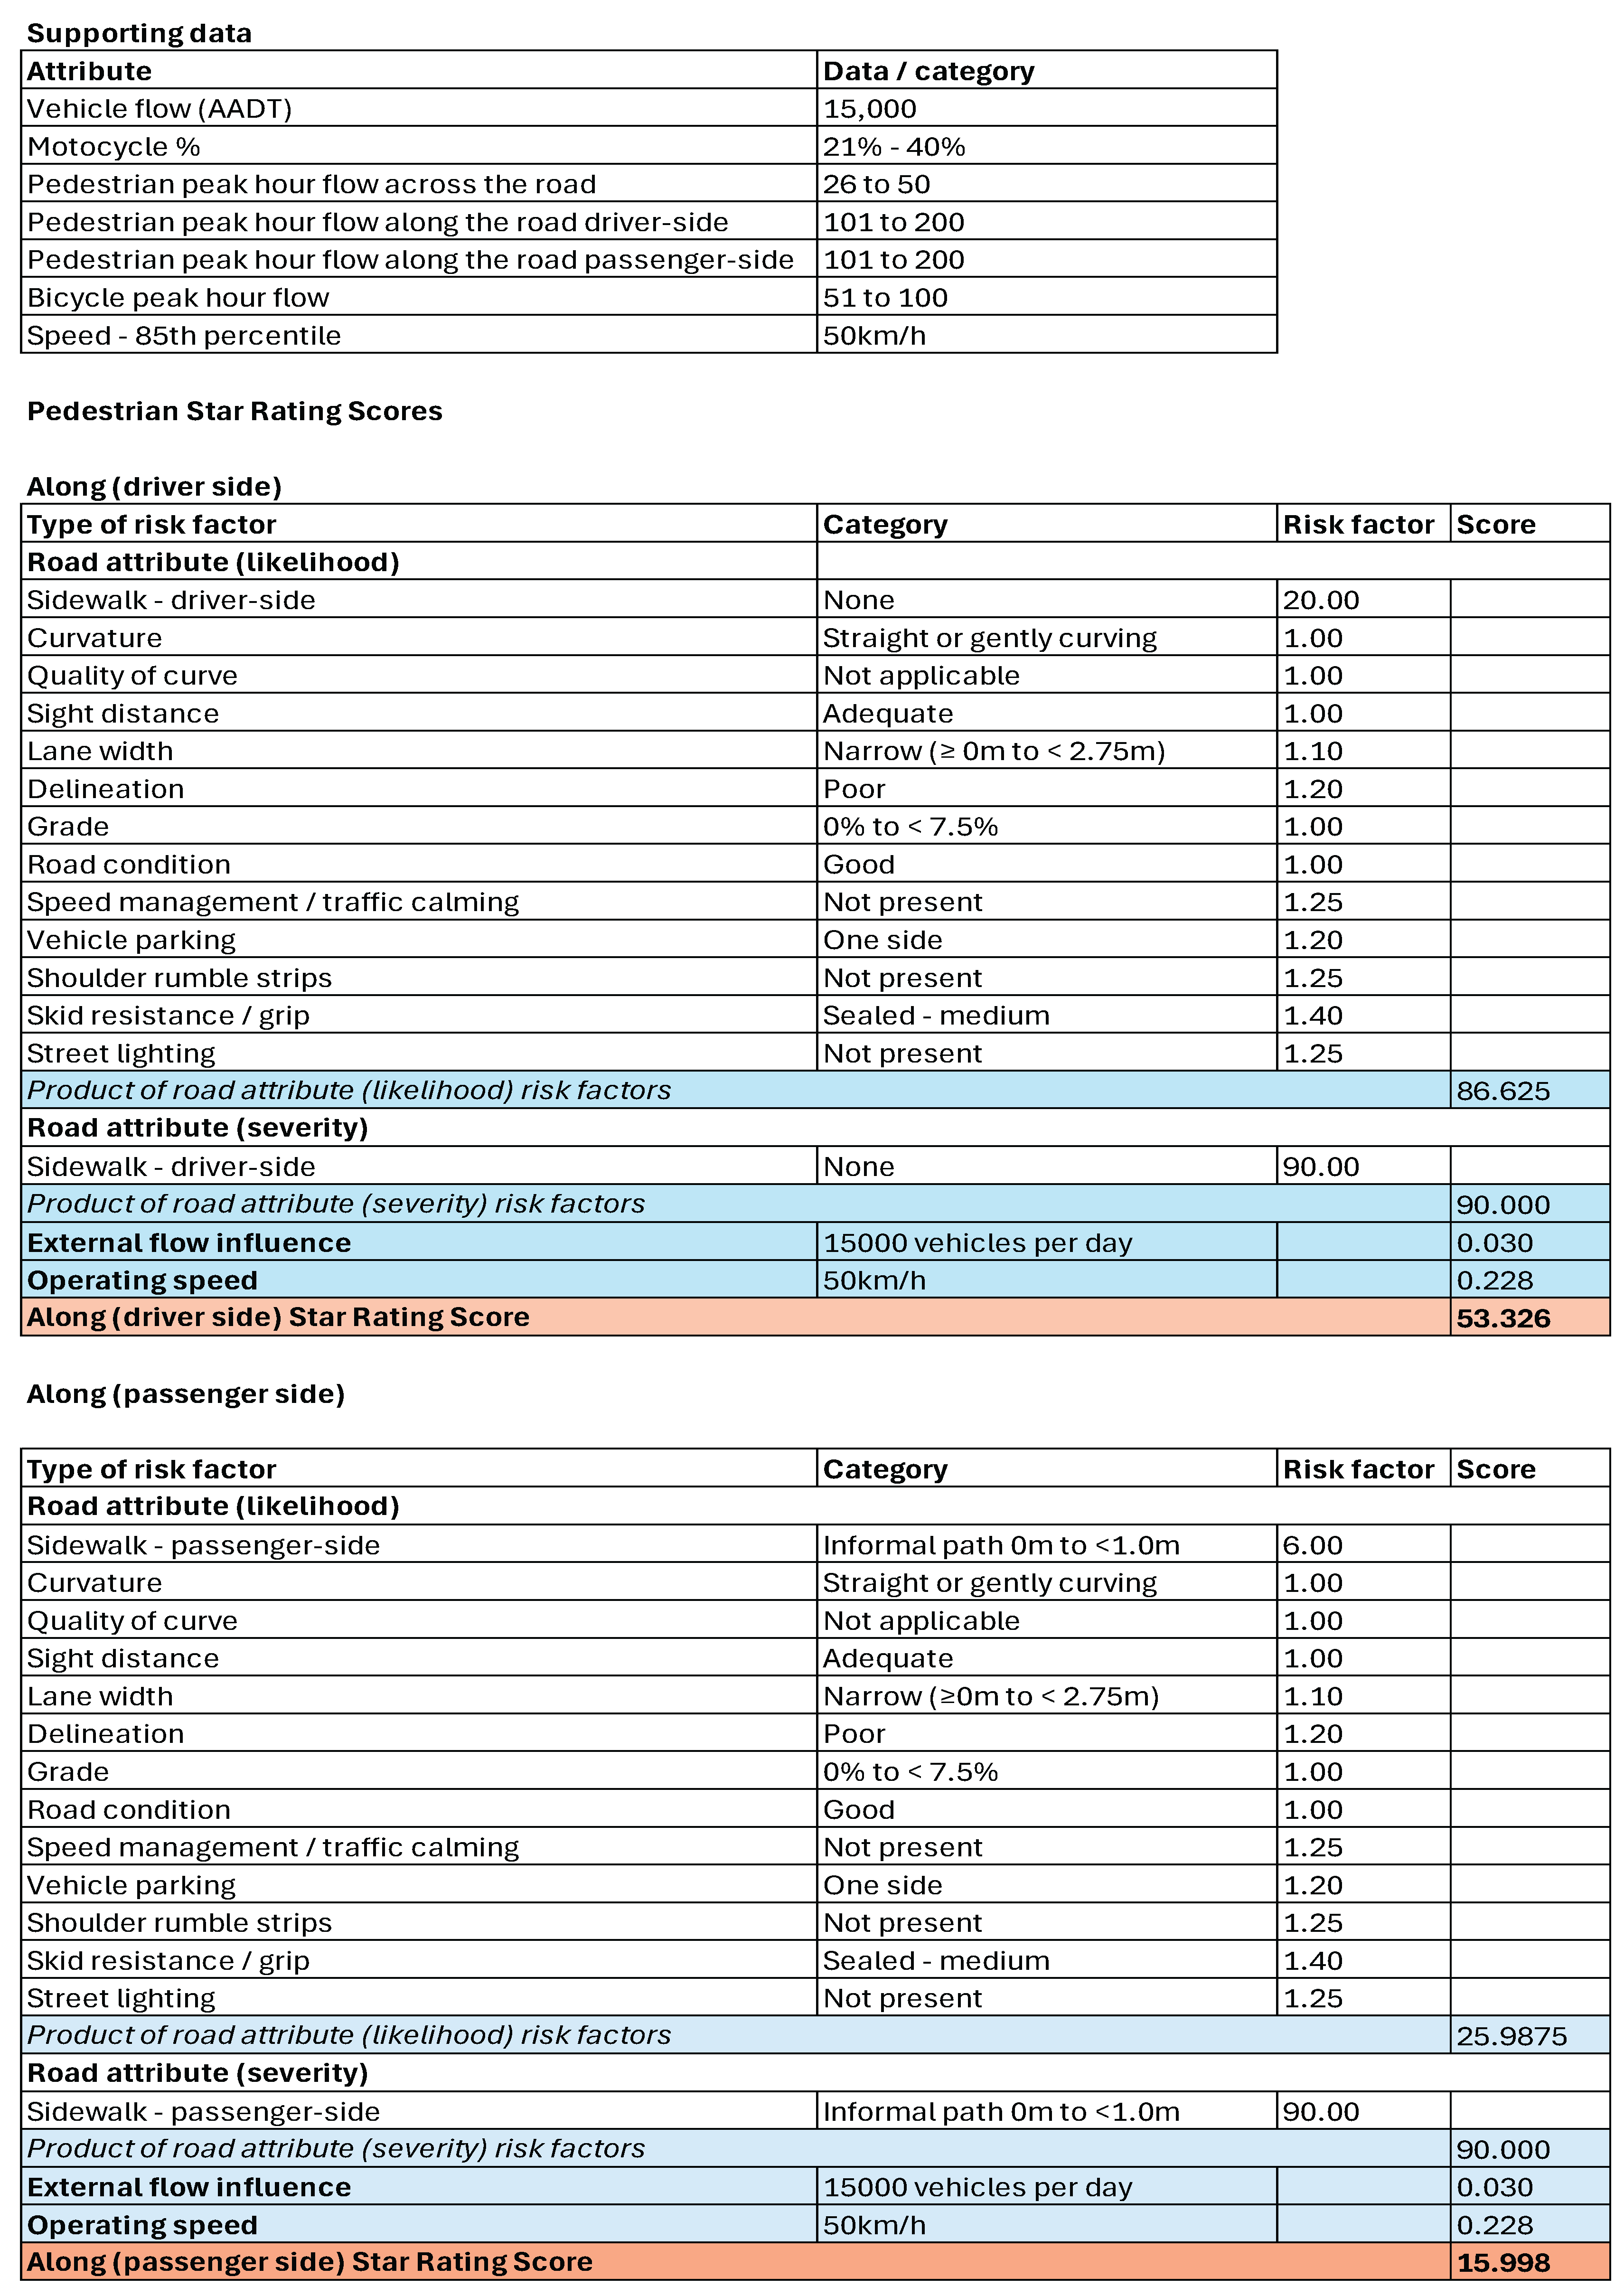
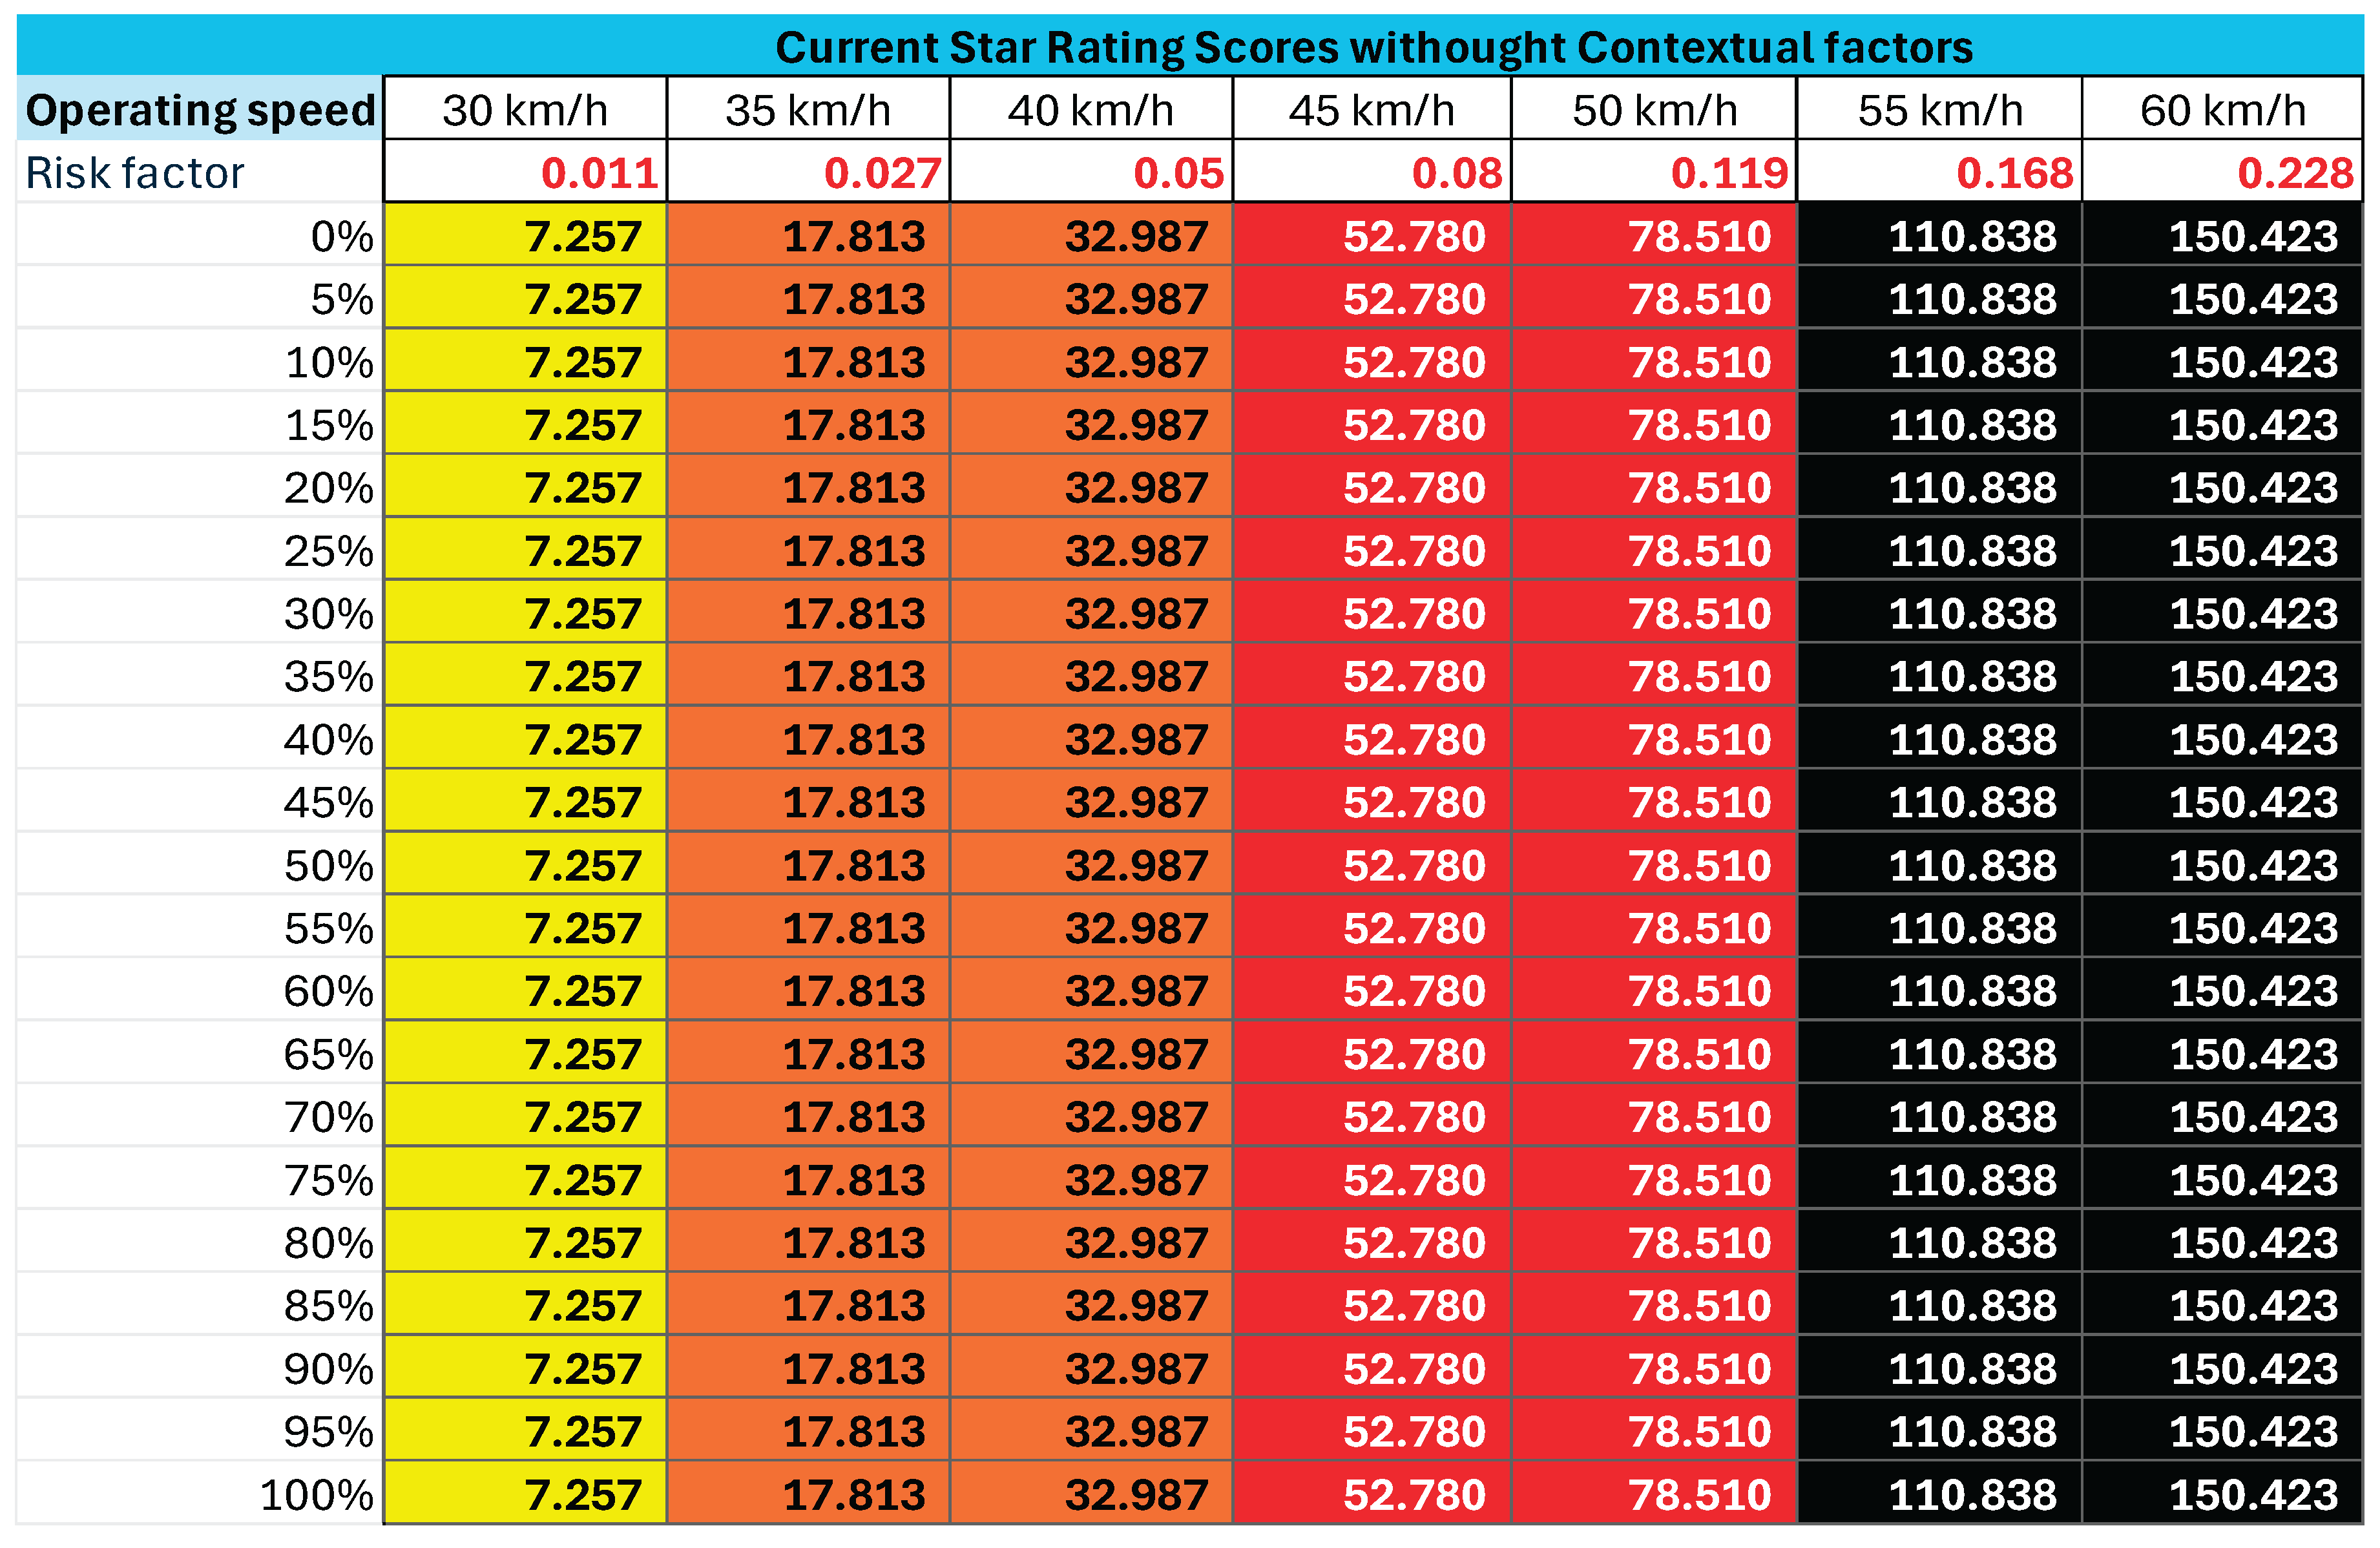
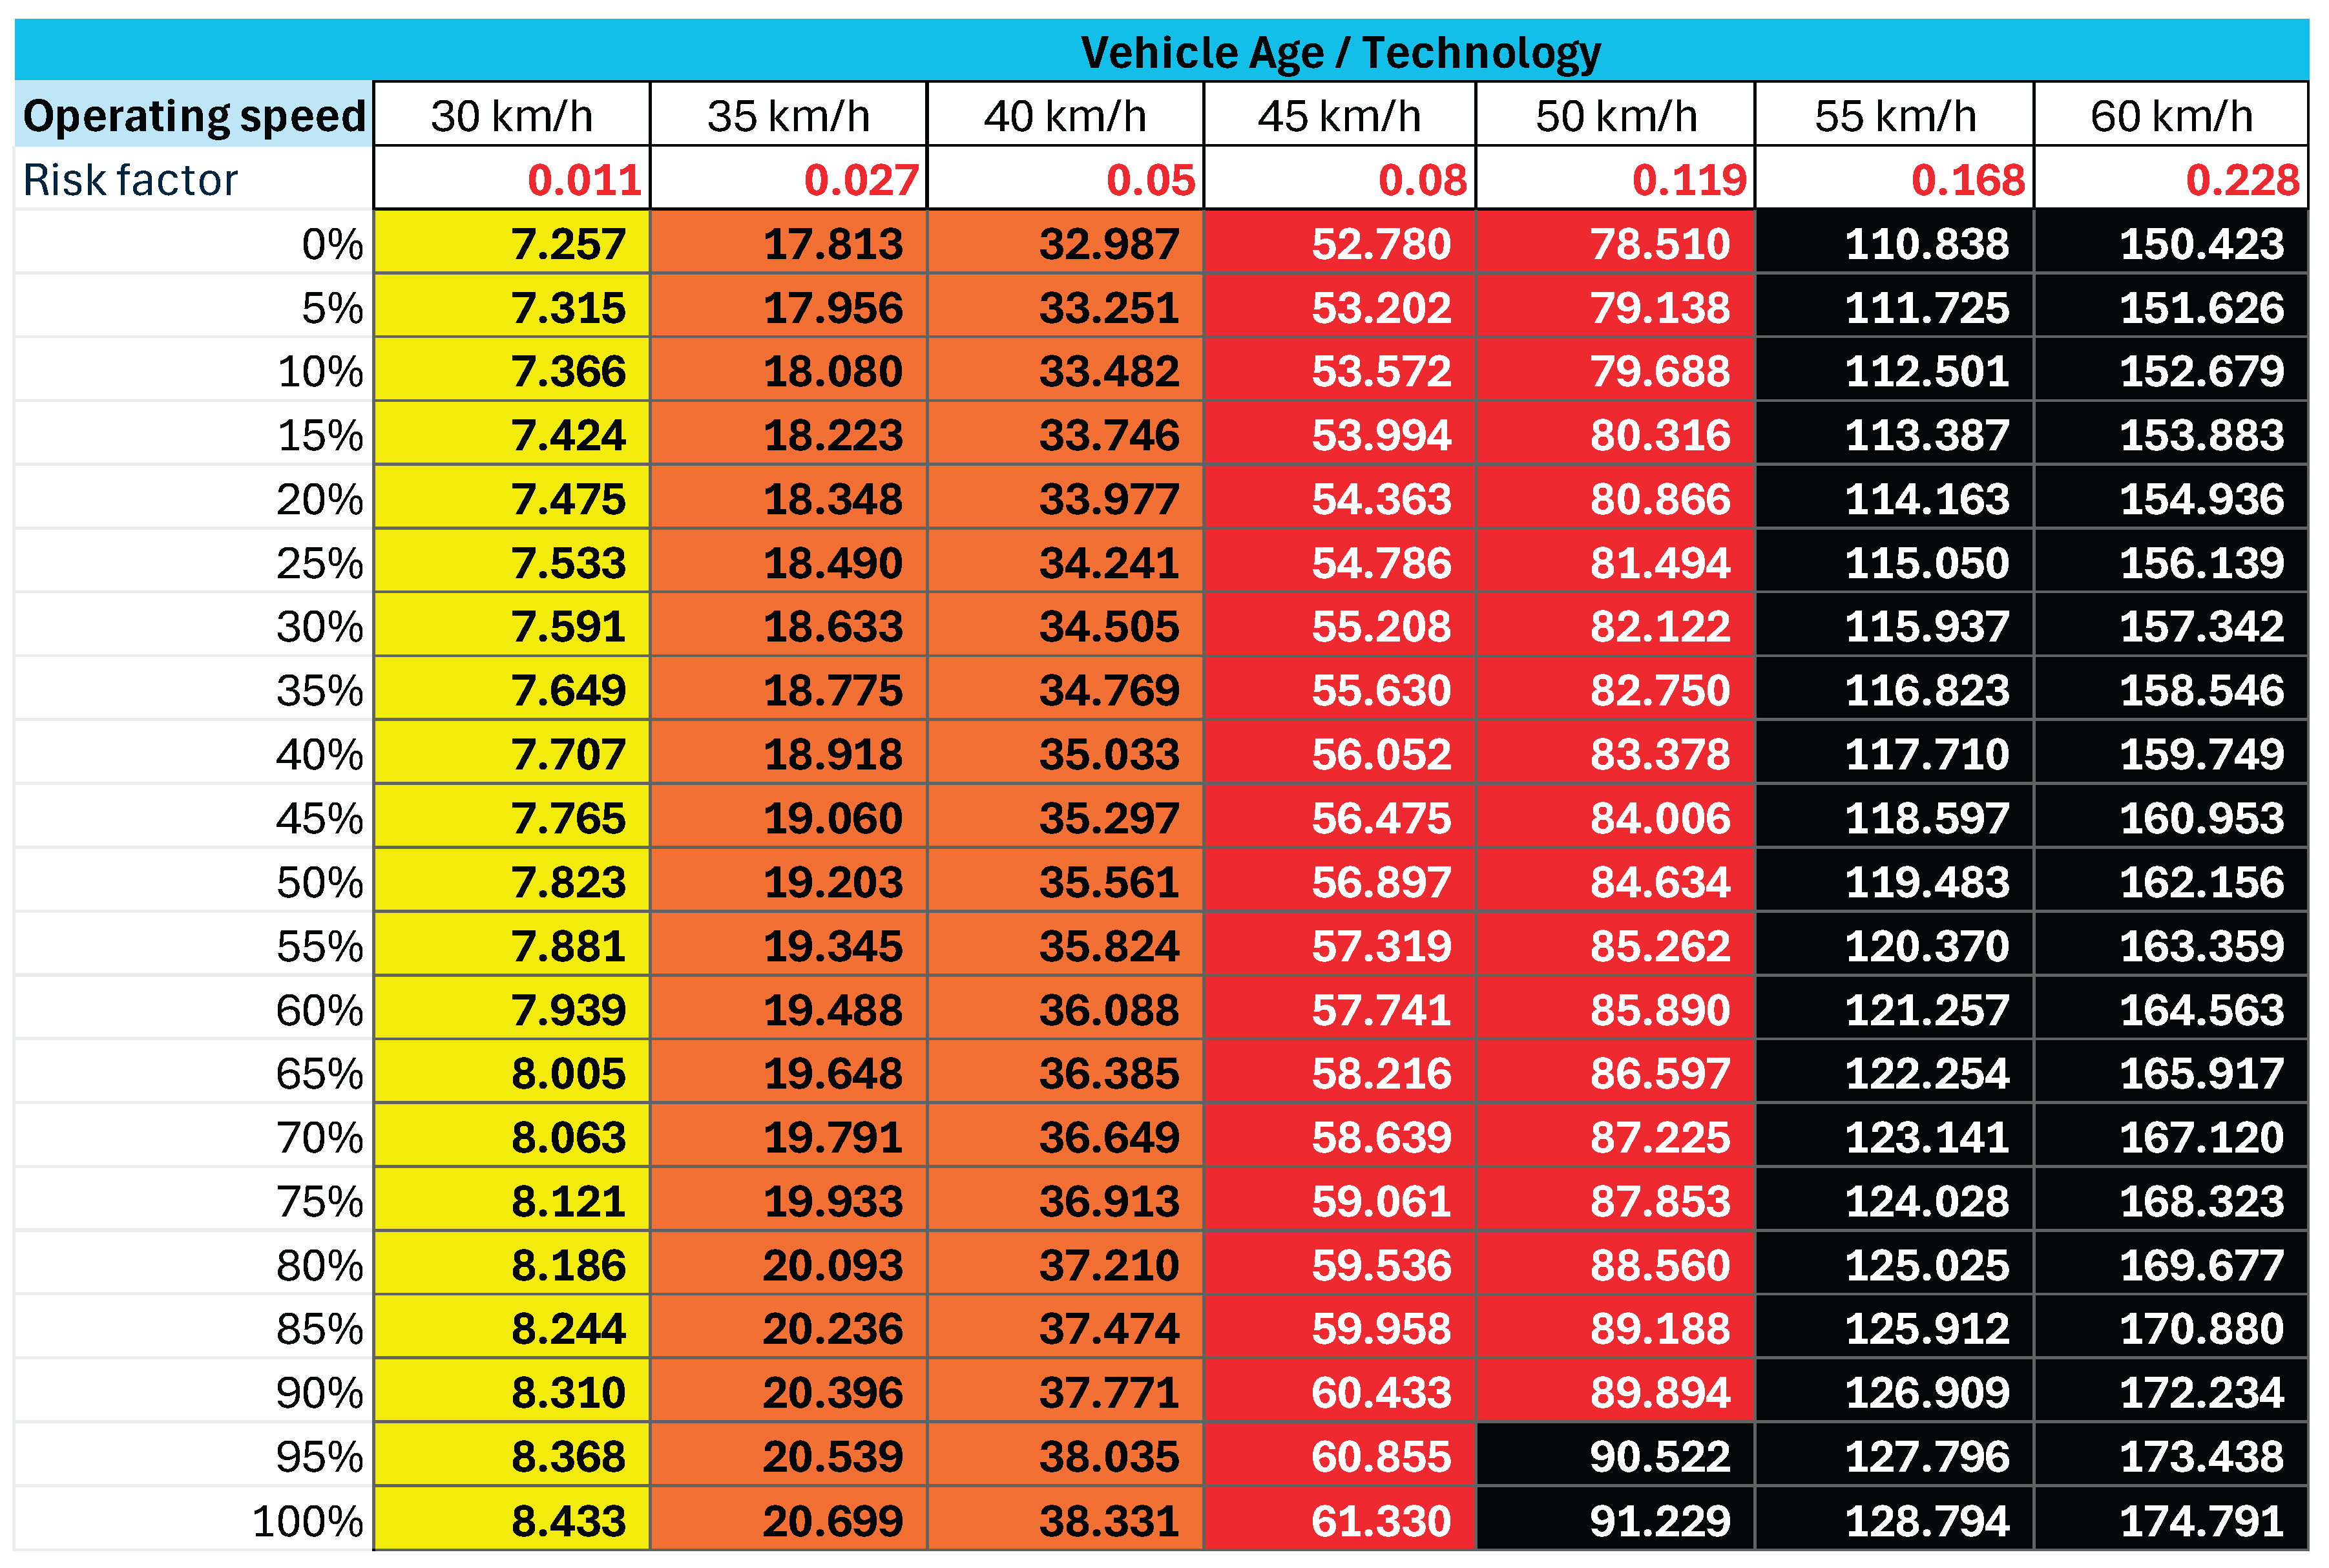
3.7. Application of the Variant Model in a Worked Example from iRAP Factsheet #9
A practical demonstration of the model was conducted using the iRAP Methodology Factsheet #9 Pedestrian Star Rating Score worked example [41] is presented in Appendix A.1.
- Step 1: Baseline PSRS values were computed using the unadjusted iRAP model (Appendix A.2.
- Step 2: Adjusted effectiveness values were calculated by substituting the weighted factors (Fi × Wi) from Table 9 into the Adjusted Effectiveness Formula (Eqn 1).
- Step 3: These adjusted effectiveness values were applied to the same formulas embedded in the Factsheet framework, ensuring full methodological consistency.
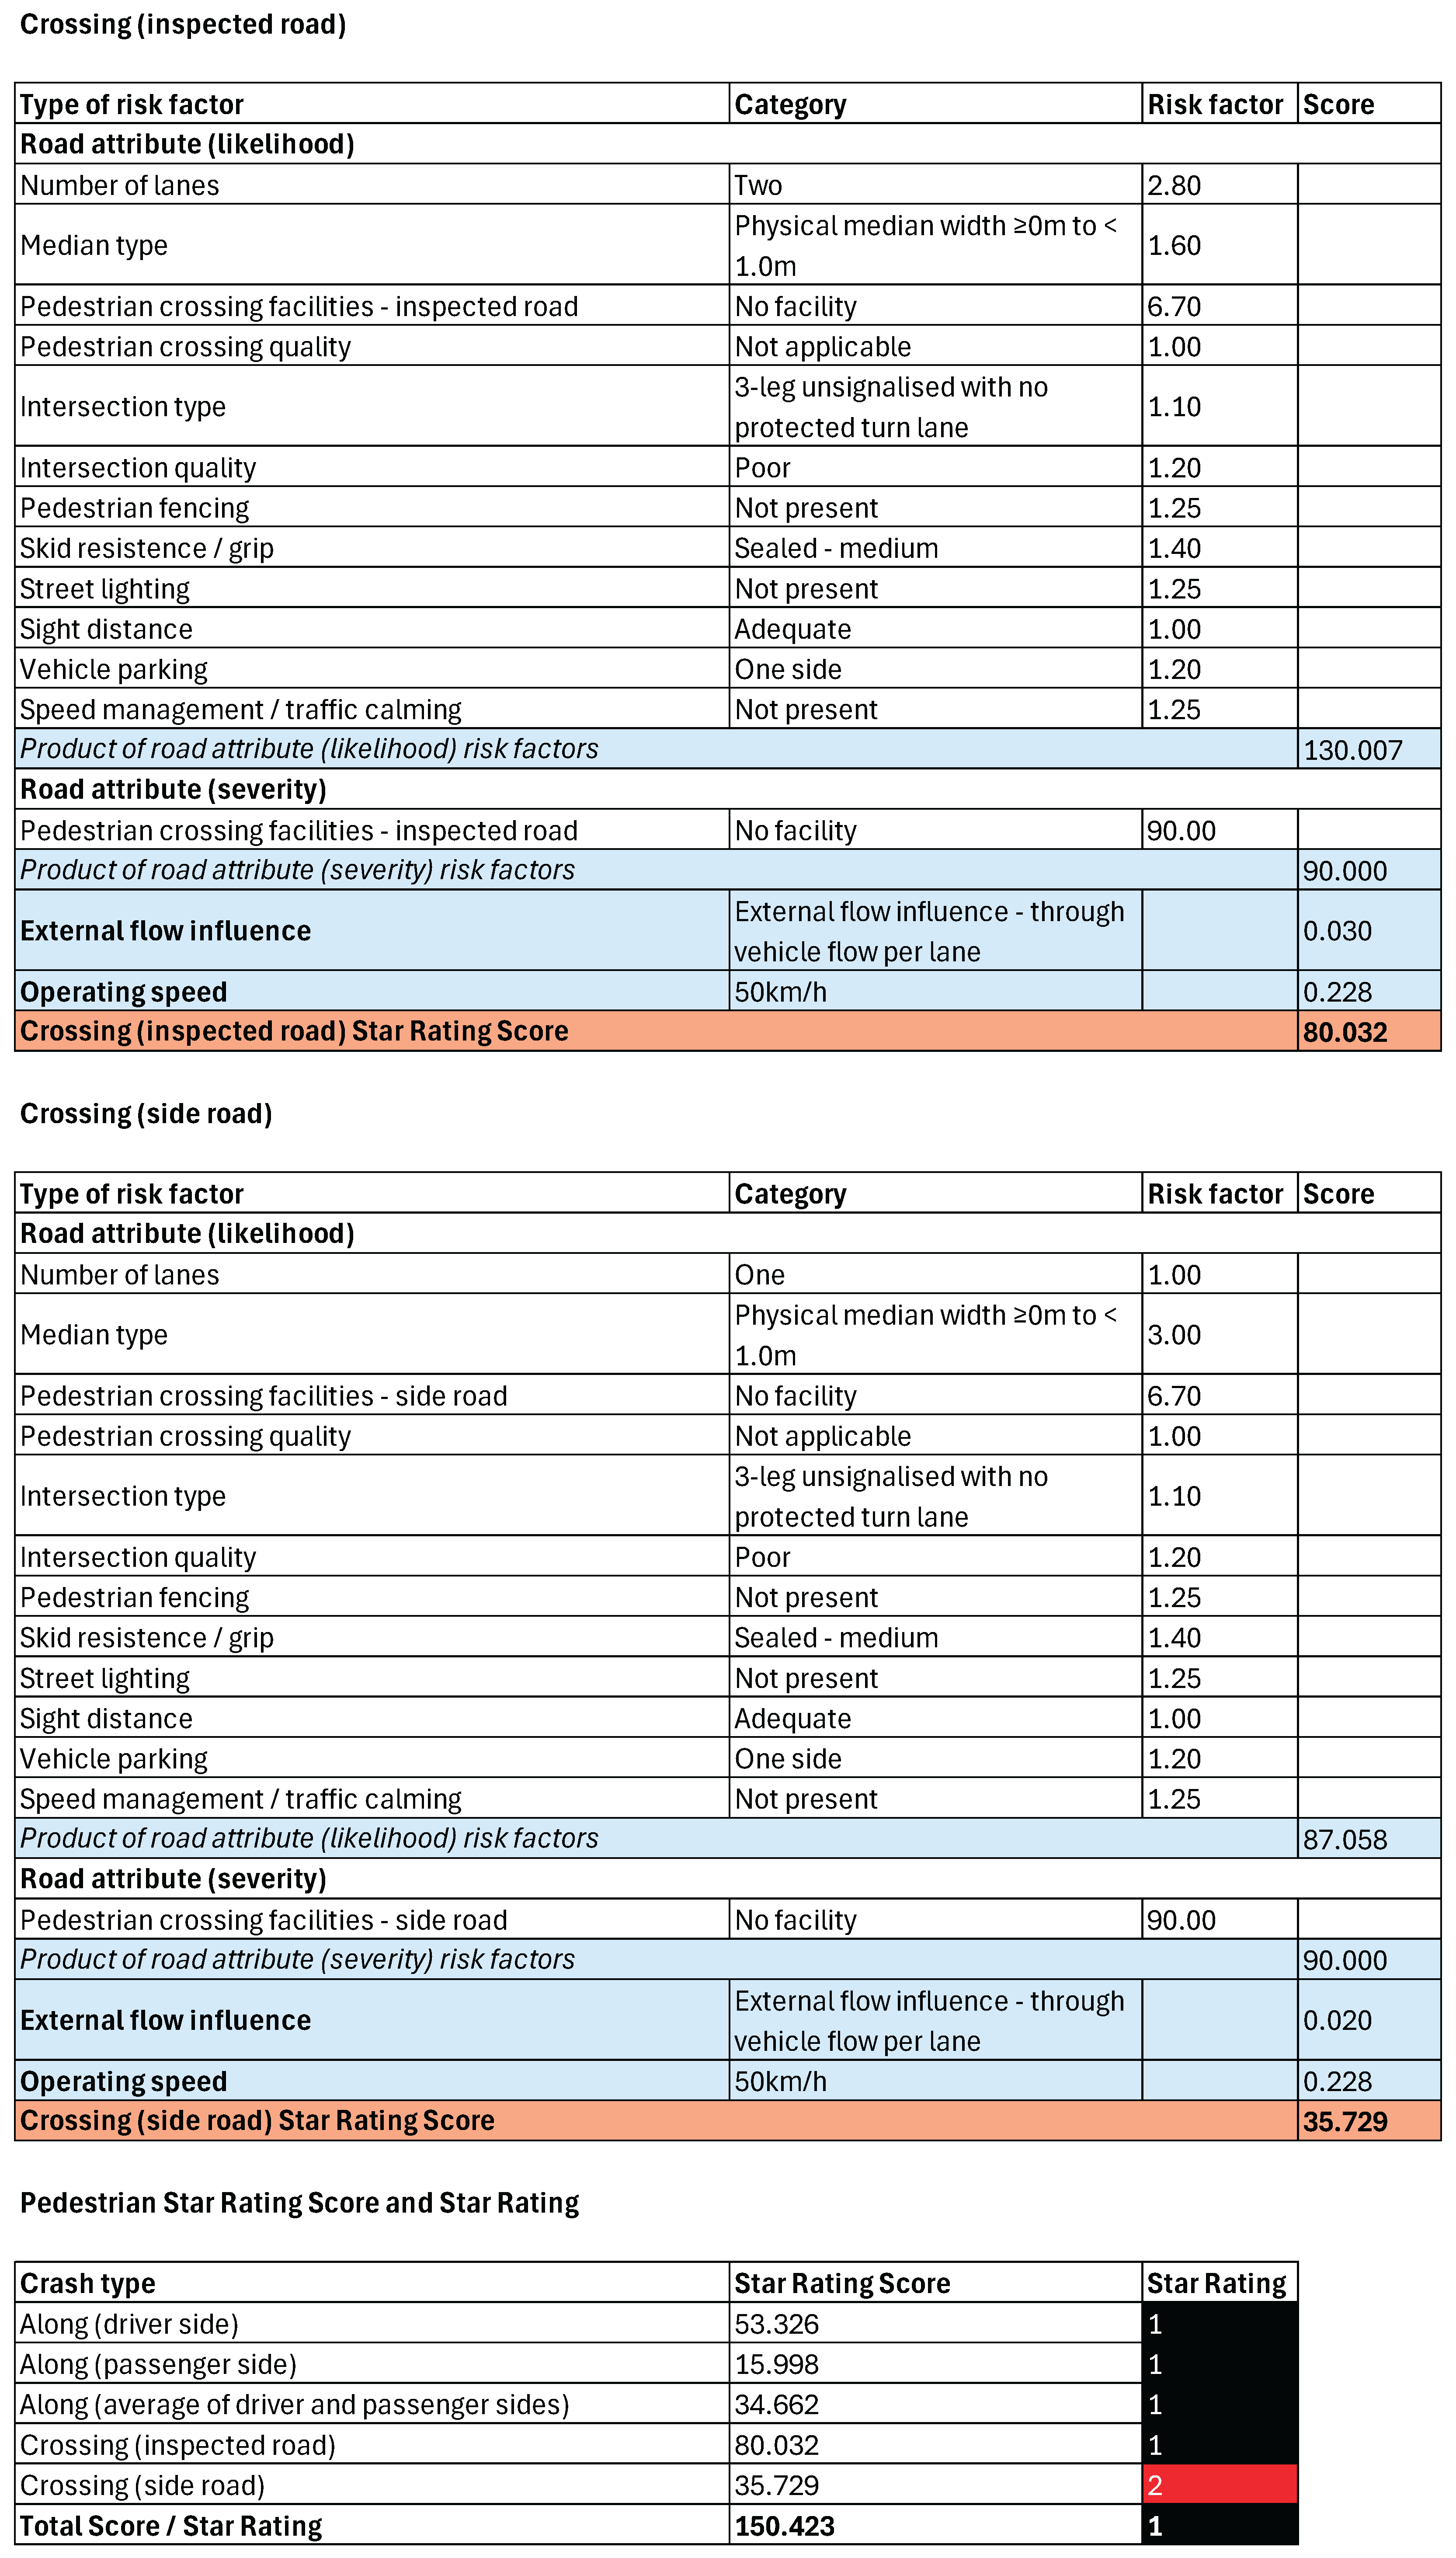
The recalculated PSRS outcomes are presented in Appendix A.3, allowing direct comparison with the baseline results in Appendix A.2.
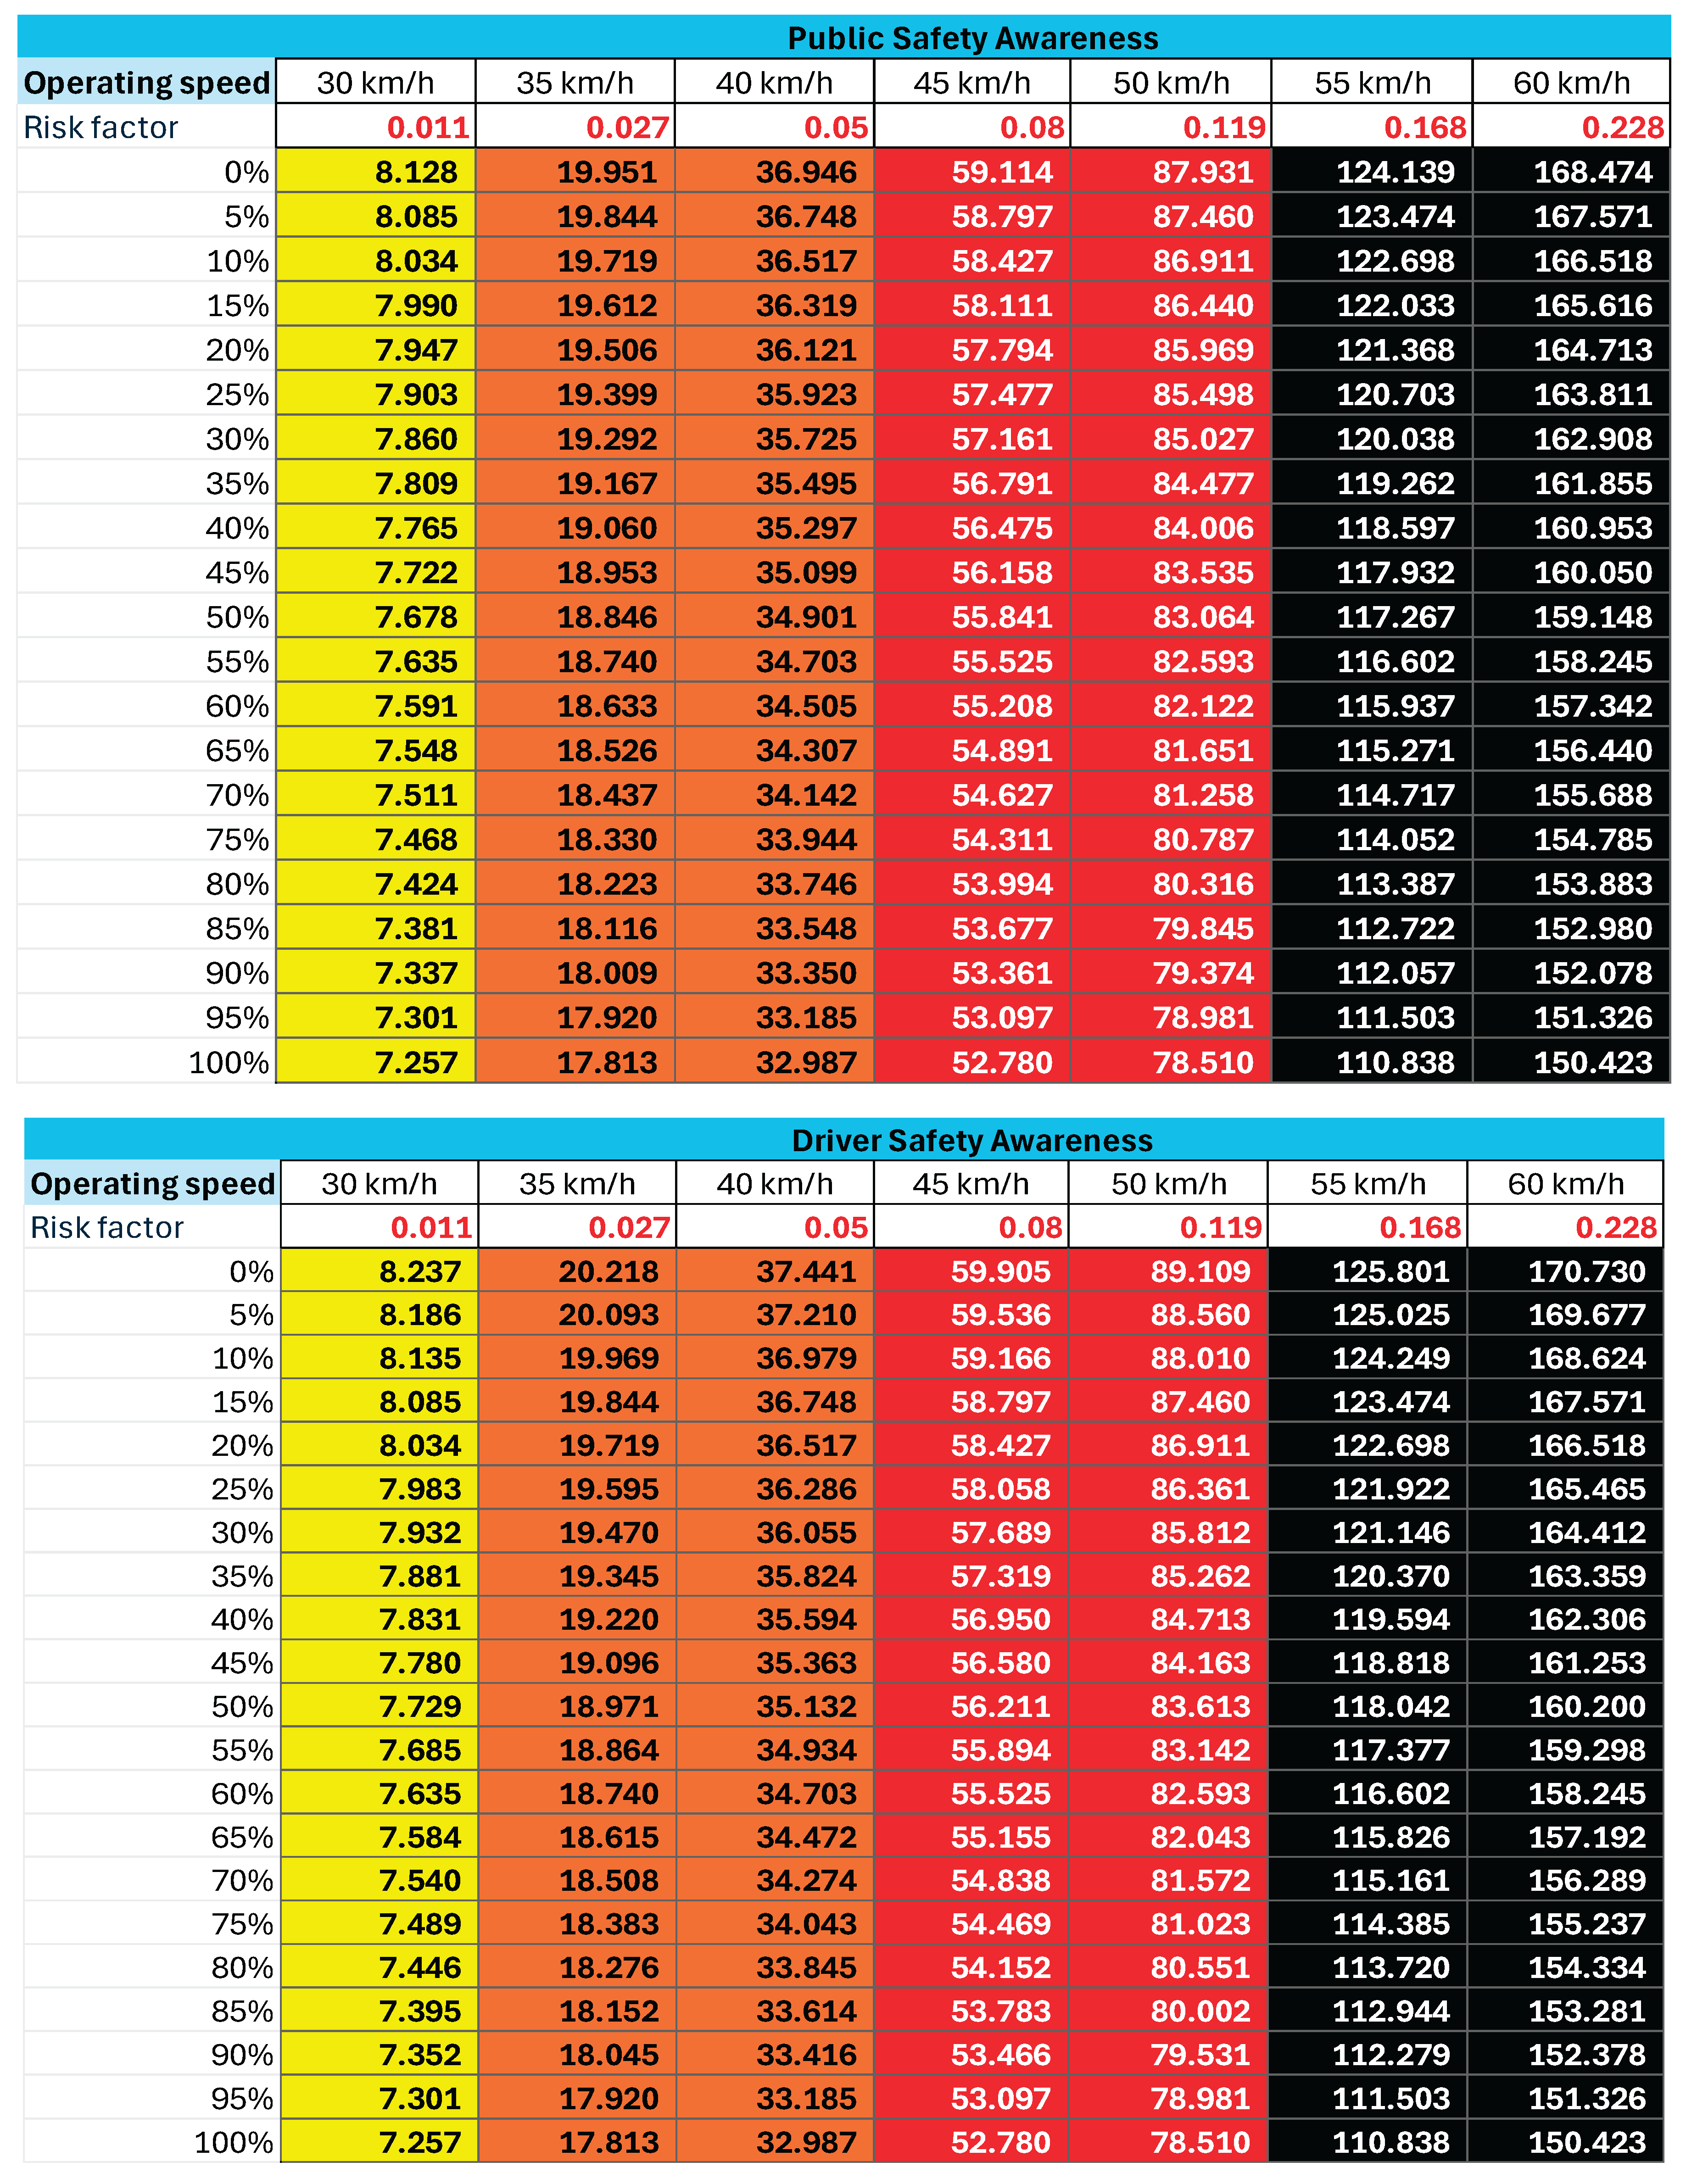
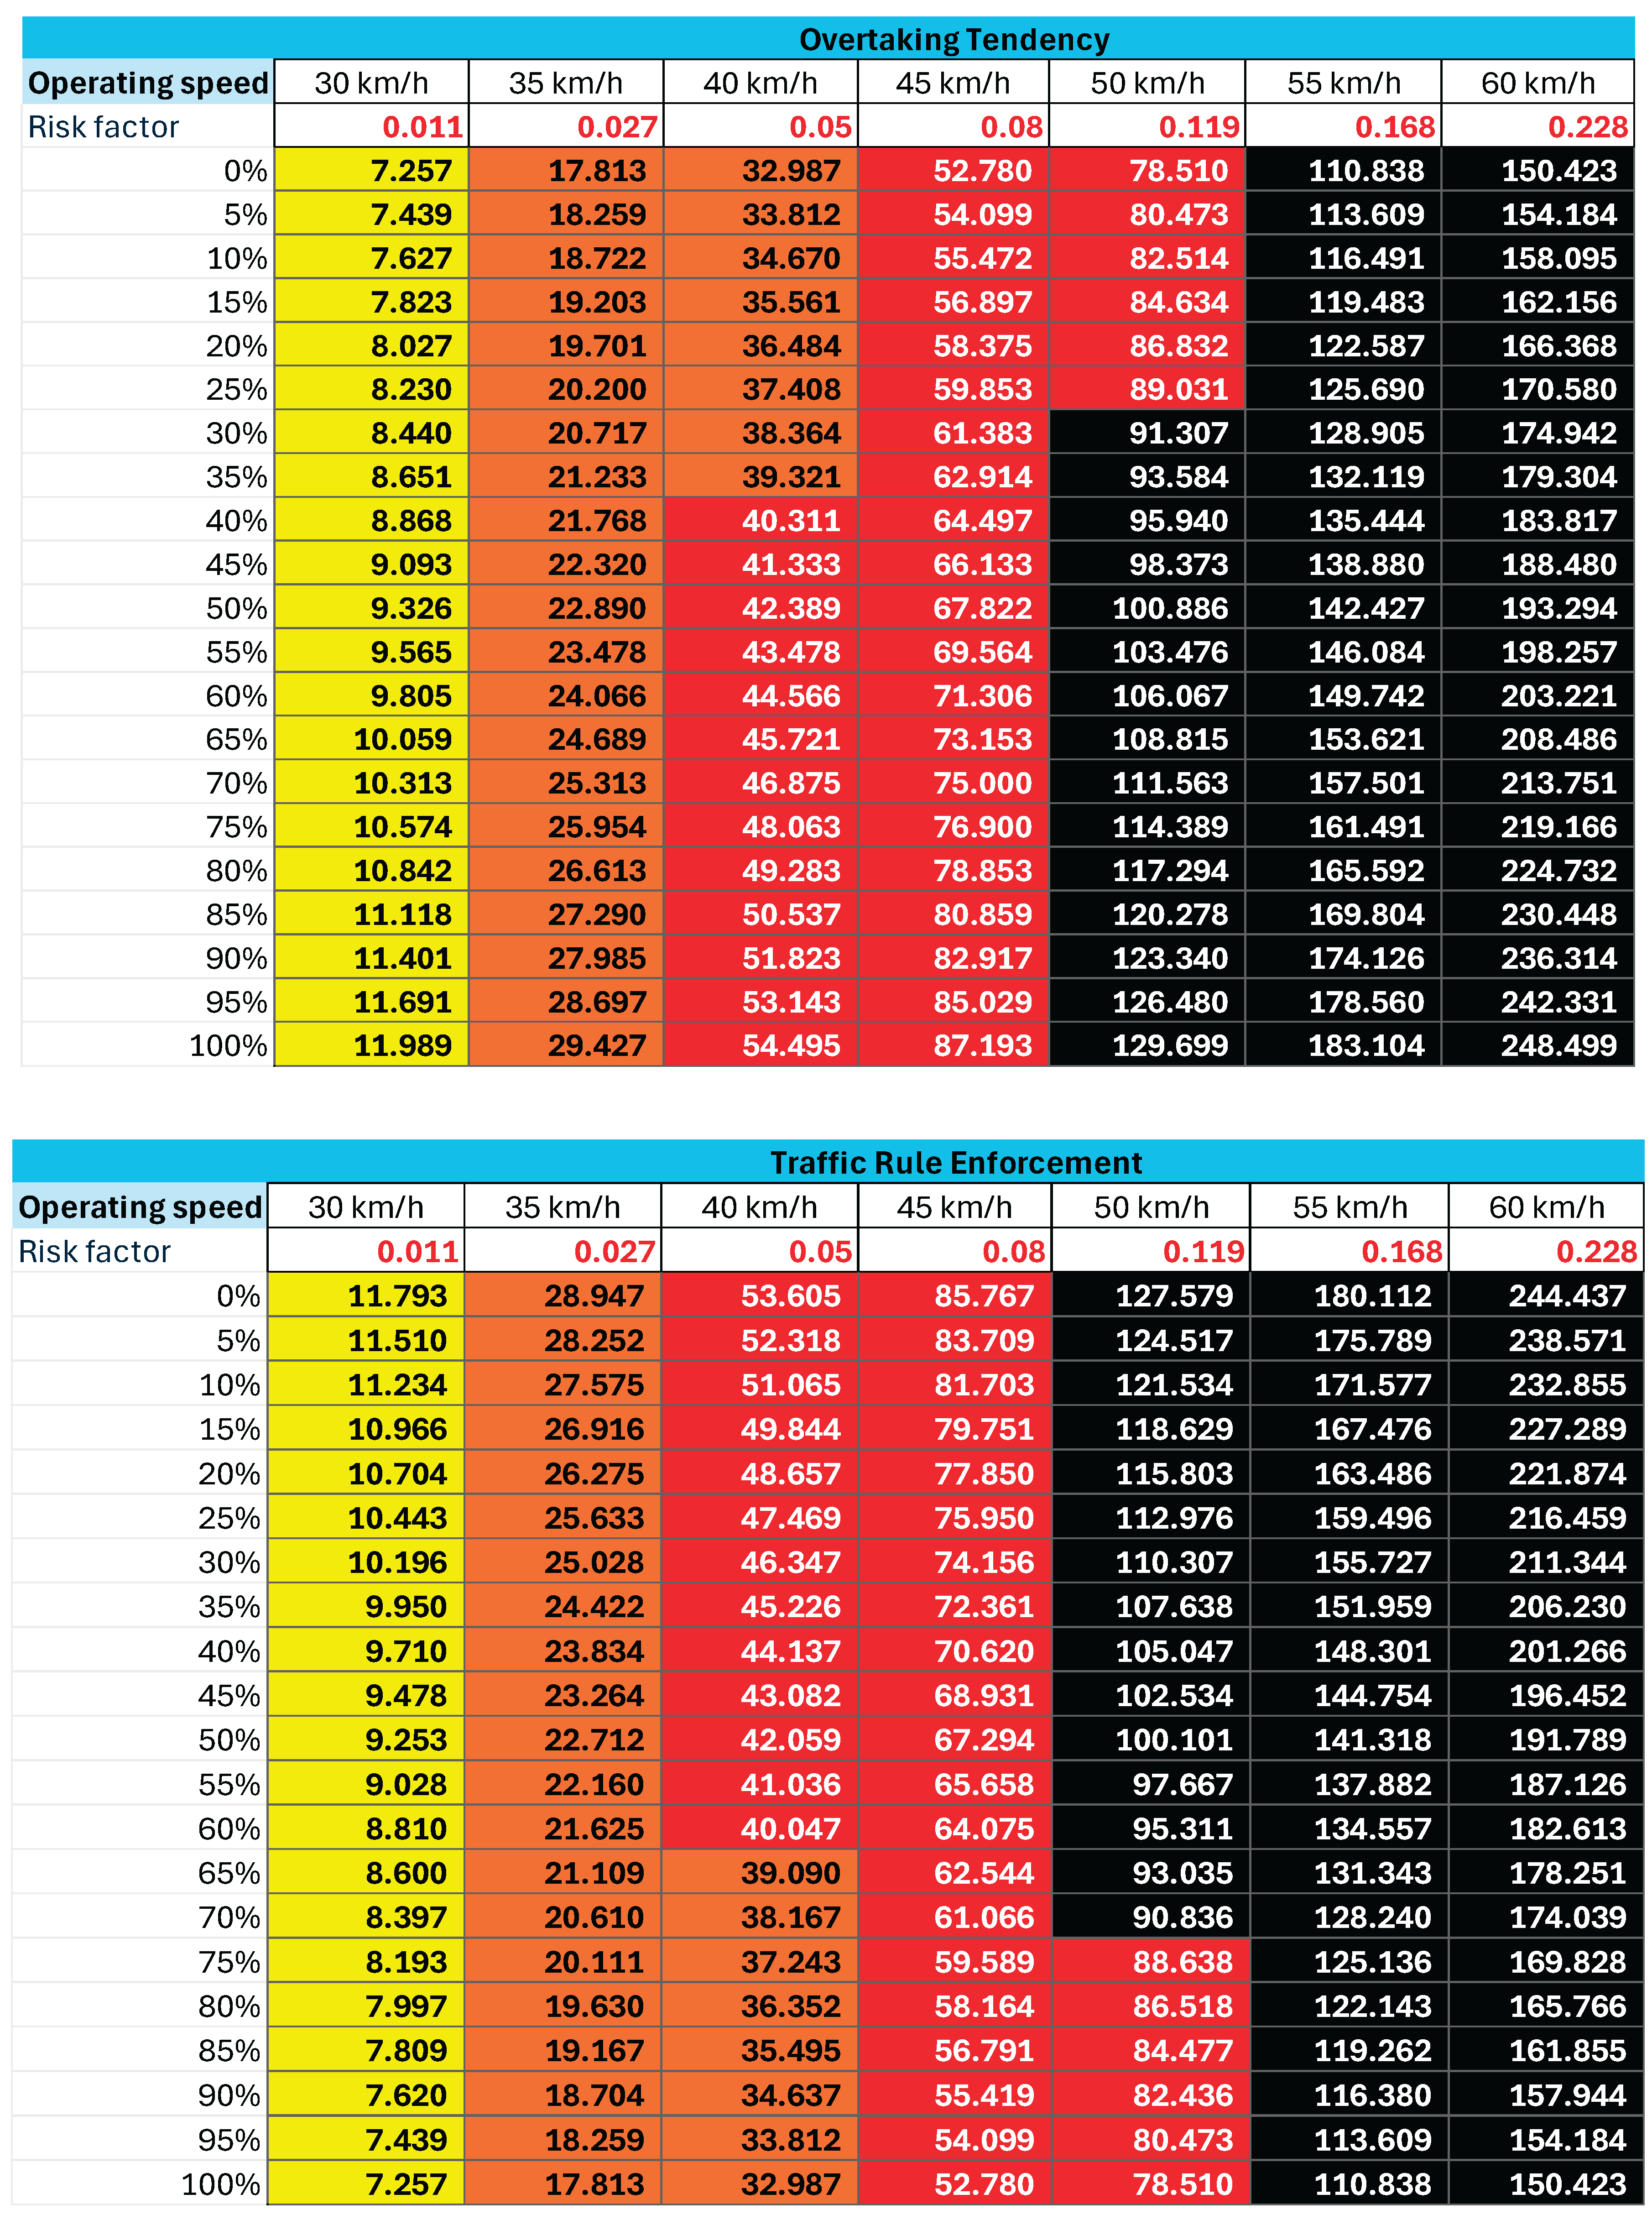
The recalculated PSRS, presented in Appendix A.3, revealed that all contextual factors incorporated into the variant effectiveness model had a measurable influence on star rating outcomes. In particular, five factors registered significant changes in star rating bands: overtaking tendency, traffic rule enforcement, countermeasure as an afterthought, human capacity of agencies, and employed population.
These changes were most pronounced at operating speeds between 40 km/h and 50 km/h, where some road segments that previously registered as Star 2 under the baseline iRAP model shifted to Star 1 after contextual adjustment. This recalibration implies that certain road environments, previously judged as meeting a minimum safety standard, are in fact very unsafe at speeds beyond 45 km/h once local realities are considered. The current iRAP model does not capture this heightened risk, underscoring its limitations when applied unadjusted in DC settings.
- By integrating the weighted contextual factors (Table 9) directly into the adjusted effectiveness equation (Eqn 1), the recalculated PSRS values provide a more conservative but realistic assessment of pedestrian safety. Importantly, the adjusted variant effectiveness model can be fully embedded within the iRAP PSRS framework, as the computed weighted values can be directly substituted into the PSRS formula (Eqn 7). This ensures methodological compatibility while improving sensitivity to localised risk exposures.
4. Discussion
4.1. Addressing the Overestimation in iRAP’s Framework
The recalculated Pedestrian Star Rating Scores (PSRS) presented in this study provide clear evidence that iRAP’s global framework systematically overestimates countermeasure effectiveness in developing country (DC) contexts. This overestimation stems from the framework’s reliance on countermeasure effectiveness (CME) values and crash modification factors (CMFs) derived predominantly from high-income country datasets. By incorporating contextual factors, the adjusted model reveals a more conservative but realistic picture of countermeasure performance, underscoring the need for locally calibrated tools.
These findings are consistent with earlier analyses. A recently concluded systematic literature review identified 33 contextual factors influencing countermeasure performance in DCs, with a subsequent gap analysis showing an average discrepancy of 30.89% (SD = 29.89%) between predicted and observed effectiveness. This study’s recalculation of star rating scores using weighted contextual factors confirms that this discrepancy materially alters countermeasure prioritisation.
4.2. Justification of the Weighting Approach
A key contribution of this study is its rigorous comparison of weighting techniques for factor prioritisation. Statistical methods (Spearman correlation, regression coefficients, PCA) provide robust mathematical bases but were limited in their ability to incorporate coefficients derived from literature (i.e., ORs and IRRS). By contrast, the Budget Allocation Method (BA) allowed both empirically modelled and literature-derived factors to be integrated into a unified framework.
The factored weight comparison (Table 2) revealed BA as the most suitable approach, with an aggregate normalised value of 0.991, closest to unity. This selection was not arbitrary; it was grounded in the need for methodological inclusivity in data-scarce environments. While BA introduces subjectivity, it also reflects the “performance loss” concept, whereby the influence of contextual factors is proportional to observed deviations from baseline effectiveness. This balance of statistical and practical considerations strengthens the model’s applicability in real-world DC settings.
4.3. Limitations in Coefficient Estimation
A methodological limitation lies in the mixing of coefficients derived from different sources, i.e., Incident Rate Ratios (IRRs) from NB models of artificial datasets, and Odds Ratios (ORs) or Incident Rate Ratios (IRRS) from external literature. While such mixing is not ideal, the rare-event assumption [31] was invoked to justify comparability. This compromise reflects the reality of DC research environments, where high-quality, disaggregated crash data are often unavailable.
Furthermore, not all contextual factors could be retained. Of the 16 factors identified, five were excluded because their risk factor values (Fi) fell within the 0.9–1.1 threshold, indicating trivial associations [30]. These exclusions, such as pedestrian/vehicle volume ratio and footpath encroachment highlight the model’s methodological discipline, ensuring that only substantively meaningful factors were included.
4.4. Capturing Non-Linear Risk Dynamics
Another advancement is the use of log-linear interpolation (Eqn 6) to model contextual factors across performance levels. This approach moves beyond static coefficient estimates by recognising that risk effects are non-linear. For example, increases in public awareness initially yield steep declines in risk but eventually taper, as illustrated in Figure 4. This feature introduces much-needed flexibility into pedestrian safety modelling and aligns with real-world dynamics observed in awareness, enforcement, and infrastructure conditions.
4.5. Practical Implications of the Worked Example
The worked example based on iRAP Factsheet #9 demonstrates the practical implications of the adjusted model. The inclusion of contextual risk factors not only recalibrated PSRS values but also shifted star rating bands for critical factors such as overtaking tendency and enforcement levels. At operating speeds between 40 km/h and 50 km/h, these contextual adjustments caused several segments to fall from Star 2 to Star 1, indicating that such environments are highly unsafe at speeds above 45 km/h.
For engineers, this is a critical insight. Road segments previously classified as marginally acceptable under the baseline model are reclassified as severely unsafe once DC-specific risks are accounted for. This has direct implications for speed management policies, prioritisation of enforcement, and the allocation of investment toward countermeasures with proven resilience in weak-institution contexts.
4.6. Contribution to the Field
The variant effectiveness model introduced here represents two novel contributions:
- Adjusted Effectiveness Formula (Eqn 1), explicitly incorporating contextual weighting (Fi × Wi) and recalibrating CME values by the empirically observed 30% performance gap.
- Adjusted PSRS Formula (Eqn 7), embedding contextualised effectiveness directly into iRAP’s star rating framework, enabling seamless integration with existing global methodologies.
Together, these innovations extend iRAP from a globally standardised framework to a flexible, context-sensitive tool better suited to the needs of low- and middle-income countries.
5. Conclusions
This study introduced and validated a Contextualised Countermeasure Effectiveness Model that recalibrates iRAP’s baseline countermeasure effectiveness estimates by incorporating weighted contextual risk factors. Two novel contributions were advanced i.e., the Adjusted Effectiveness Formula (Eqn 1) and the Adjusted PSRS Formula (Eqn 7), both of which embed contextual weighting directly into iRAP’s existing star rating framework.
The results confirm that contextual factors materially alter pedestrian star rating outcomes. Factors such as overtaking tendency, enforcement, and institutional capacity drove significant shifts in star rating bands, particularly at 40–50 km/h, where road segments moved from Star 2 to Star 1 once local risk modifiers were considered. This outcome reveals that the current iRAP model underestimates pedestrian risk in DC settings, potentially leading to misplaced confidence in the safety of certain countermeasures.
By allowing the direct substitution of weighted contextual values into the PSRS formula, the adjusted model enhances realism, local relevance, and predictive accuracy [42]. It offers policymakers and engineers in DCs a tool better suited to their realities, enabling more context-sensitive prioritisation of pedestrian safety investments.
Future work should focus on:
- calibrating the model with real crash data from DCs,
- testing sensitivity to non-linear interactions among contextual factors,
- and expanding participatory methods (e.g., expert elicitation) to strengthen the validity of weighting assignments.
In sum, this study demonstrates that global tools like iRAP can [and must] be adapted for local contexts. Incorporating socio-behavioural, institutional, and infrastructural risk modifiers into predictive frameworks represents a crucial step toward more equitable and effective pedestrian safety planning in developing countries.
Author Contributions
Conceptualization, J.M. and H.E.; methodology, analysis, and writing, J.M.; supervision, H.E. All authors have read and agreed to the published version of the manuscript.
Funding
This research received no external funding.
Institutional Review Board Statement
Not applicable.
Informed Consent Statement
Any Not applicable.
Data Availability Statement
The data supporting the reported results can be obtained from the corresponding author upon reasonable request.
Acknowledgments
The authors would like to acknowledge the support of the Commonwealth Scholarship Commission, and the University of Birmingham for providing the necessary resources.
Conflicts of Interest
The authors declare no conflict of interest.
Abbreviations
The following abbreviations are used in this manuscript:
| BA | Budget Allocation |
| CME | Countermeasure Effectiveness |
| CMF | Crash Modification Factor |
| DC | Developing Country |
| HIC | High-Income Country |
| iRAP | International Road Assessment Programme |
| LMIC | Low- and Middle-Income Countries |
| NB | Negative Binomial |
| PCA | Principal Component Analysis |
| PSRS | Pedestrian Star Rating Scores |
| SLR | Systematic Literature Review |
| SRS | Star Rating Scores |
Appendix A
Appendix A.1. Extract of the iRAP Methodology Fact Sheet #9 Pedestrian Star Rating Score Worked Example
Appendix A.2. Pedestrian Star Rating Scores of the Current iRAP Model Based on Data of Fact Sheet #9
Appendix A.3. Effect of Contextual Factors on Pedestrian Star Rating Scores in the Current iRAP Model Based on Data of Fact Sheet #9
References
- WHO, Global status report on road safety 2023. 2023, Geneva. 81.
- Tavakkoli, M., et al., Evidence From the Decade of Action for Road Safety: A Systematic Review of the Effectiveness of Interventions in Low and Middle-Income Countries. Public Health Reviews, 2022. Volume 43 - 2022. [CrossRef]
- UNECA. Road Safety. UNECA Road Safety page n.d. [cited 2025 21/08/2025]; Available from: https://www.uneca.org/road-safety.
- Zziwa, E.B., O. Kobusingye, and D. Guwatudde, Where are pedestrians injured and killed on Kampala city's road network? Frontiers in Sustainable Cities, 2022. 4. [CrossRef]
- Byaruhanga, B.C., Economic optimisation of road network safety investment programmes. 2023, University of Birmingham.
- WHO, Pedestrian safety: a road safety manual for decision-makers and practitioners. 2023: World Health Organisation.
- Stoker, P., et al., Pedestrian safety and the built environment: a review of the risk factors. Journal of Planning Literature, 2015. 30(4): p. 377-392.
- Budzynski, M., et al., Effects of Road Infrastructure on Pedestrian Safety. IOP Conference Series: Materials Science and Engineering, 2019. 603(4): p. 042052.
- iRAP. International Road Assessment Programme (iRAP). n.d. [cited 2025 22/08/2025]; Available from: https://irap.org/.
- iRAP. iRAP Specification, Manuals and Guides. 2021 31/07/2025]; Available from: https://irap.org/specifications/.
- Turner, B., S. Job, and S. Mitra, Guide for road safety interventions: Evidence of what works and what does not work. 2021, The Global Road Safety Facility (GRSF) / World Bank. p. 62.
- Bliss, T. and J.M. Breen, Road Safety Management Capacity Reviews and Safe System Projects Guidelines (Updated Edition). 2013: Washington, DC.
- Bhavsar, J., et al., Star Ratings for life-saving road improvements in India. Transport and Communications Bulletin for Asia and the Pacific, 2019. 2030(89): p. 1-24.
- Byaruhanga, C.B. and H. Evdorides, A systematic review of road safety investment appraisal models. Cogent Engineering, 2021. 8(1): p. 1993521. [CrossRef]
- Kraidi, R.A., Pedestrian safety models for urban environments with high roadside activities. 2019, University of Birmingham: Birmingham, UK. [CrossRef]
- iRAP, Road Safety Toolkit. 2021, International Road Assessment Programme (iRAP).
- Tiwari, G., Progress in pedestrian safety research. International Journal of Injury Control and Safety Promotion, 2020. 27(1): p. 35-43. [CrossRef]
- Sabi Boun, S., et al., Environmental measures to improve pedestrian safety in low- and middle-income countries: a scoping review. Glob Health Promot, 2024: p. 17579759241241513. [CrossRef]
- Godthelp, H. and A. Ksentini, Specific road safety issues in low- and middle income countries (LMICs): an overview and some illustrative examples. Traffic Safety Research, 2024. 8: p. e000068. [CrossRef]
- Page, M.J., et al., The PRISMA 2020 statement: an updated guideline for reporting systematic reviews. bmj, 2021. 372.
- Lame, G., Systematic Literature Reviews: An Introduction. Proceedings of the Design Society: International Conference on Engineering Design, 2019. 1(1): p. 1633-1642.
- Damsere-Derry, J., et al., Evaluation of the effectiveness of traffic calming measures on vehicle speeds and pedestrian injury severity in Ghana. Traffic Injury Prevention, 2019. 20(3): p. 336-342. [CrossRef]
- Hendrie, D., G. Lyle, and M. Cameron, Lives Saved in Low- and Middle-Income Countries by Road Safety Initiatives Funded by Bloomberg Philanthropies and Implemented by Their Partners between 2007–2018. International Journal of Environmental Research and Public Health, 2021. 18(21): p. 11185. [CrossRef]
- Poswayo, A., et al., School Area Road Safety Assessment and Improvements (SARSAI) programme reduces road traffic injuries among children in Tanzania. Inj Prev, 2019. 25(5): p. 414-420. [CrossRef]
- Huang, H. and M. Abdel-Aty, Multilevel data and Bayesian analysis in traffic safety. Accident Analysis & Prevention, 2010. 42(6): p. 1556-1565. [CrossRef]
- Mukherjee, D. and S. Mitra, Modelling risk factors for fatal pedestrian crashes in Kolkata, India. Int J Inj Contr Saf Promot, 2020. 27(2): p. 197-214. [CrossRef]
- Mukherjee, D. and S. Mitra, Identification of Pedestrian Risk Factors Using Negative Binomial Model. Transportation in Developing Economies, 2020. 6(1): p. 4. [CrossRef]
- Swartz, M.K., The PRISMA Statement: A Guideline for Systematic Reviews and Meta-Analyses. Journal of Pediatric Health Care, 2011. 25(1): p. 1-2. [CrossRef]
- Moher, D., et al., Preferred reporting items for systematic reviews and meta-analyses: the PRISMA statement. PLoS Med, 2009. 6(7): p. e1000097. [CrossRef]
- AASHTO, Highway Safety Mannual. 1 ed. 2010: The American Association of State Highway and Transportation Officials (AASHTO).
- Zhang, J. and K.F. Yu, What's the Relative Risk?A Method of Correcting the Odds Ratio in Cohort Studies of Common Outcomes. JAMA, 1998. 280(19): p. 1690-1691.
- Hermans, E., F. Van den Bossche, and G. Wets, Combining road safety information in a performance index. Accident Analysis & Prevention, 2008. 40(4): p. 1337-1344. [CrossRef]
- Bax, C., et al., Developing a road safety index, in EC FP7 project DaCoTA, Belgian, Scientific Report. 2012.
- OECD, Handbook on Constructing Composite Indicators: Methodology and User Guide. 2008, OECD Publishing: Paris.
- iRAP. iRAP Methodology Fact Sheet #6. Star Rating Score Equations. 2014 23/02/2014 [cited 2024 06/11/2024]; Available from: https://irap.org/methodology/.
- Mukherjee, D. and S. Mitra, Development of a Systematic Methodology to Enhance the Safety of Vulnerable Road Users in Developing Countries. Transportation in Developing Economies, 2022. 8(2): p. 28. [CrossRef]
- Chowdhury, T., S.M. Rifaat, and R. Tay, Characteristics of Pedestrians in Bangladesh Who Did Not Receive Public Education on Road Safety. Sustainability, 2022. 14(16): p. 9909. [CrossRef]
- Shaaban, K., Impact of experience and training on traffic knowledge of young drivers. The Open Transportation Journal, 2021. 15(1). [CrossRef]
- World Bank, World Development Report 1997: The State in a Changing World. 1997: Washington, DC.
- Mohan, D., et al., PROTOCOL: Effectiveness of road safety interventions: An evidence and gap map. Campbell Syst Rev, 2020. 16(1): p. e1077. [CrossRef]
- iRAP. iRAP Methodology Fact Sheet #9. Star Rating worked example. 2013 29/10/2013 [cited 2024; Available from: https://irap.org/methodology/.
Figure 1.
Flowchart illustrating the process for developing and applying the contextualised variant effectiveness model.
Figure 1.
Flowchart illustrating the process for developing and applying the contextualised variant effectiveness model.
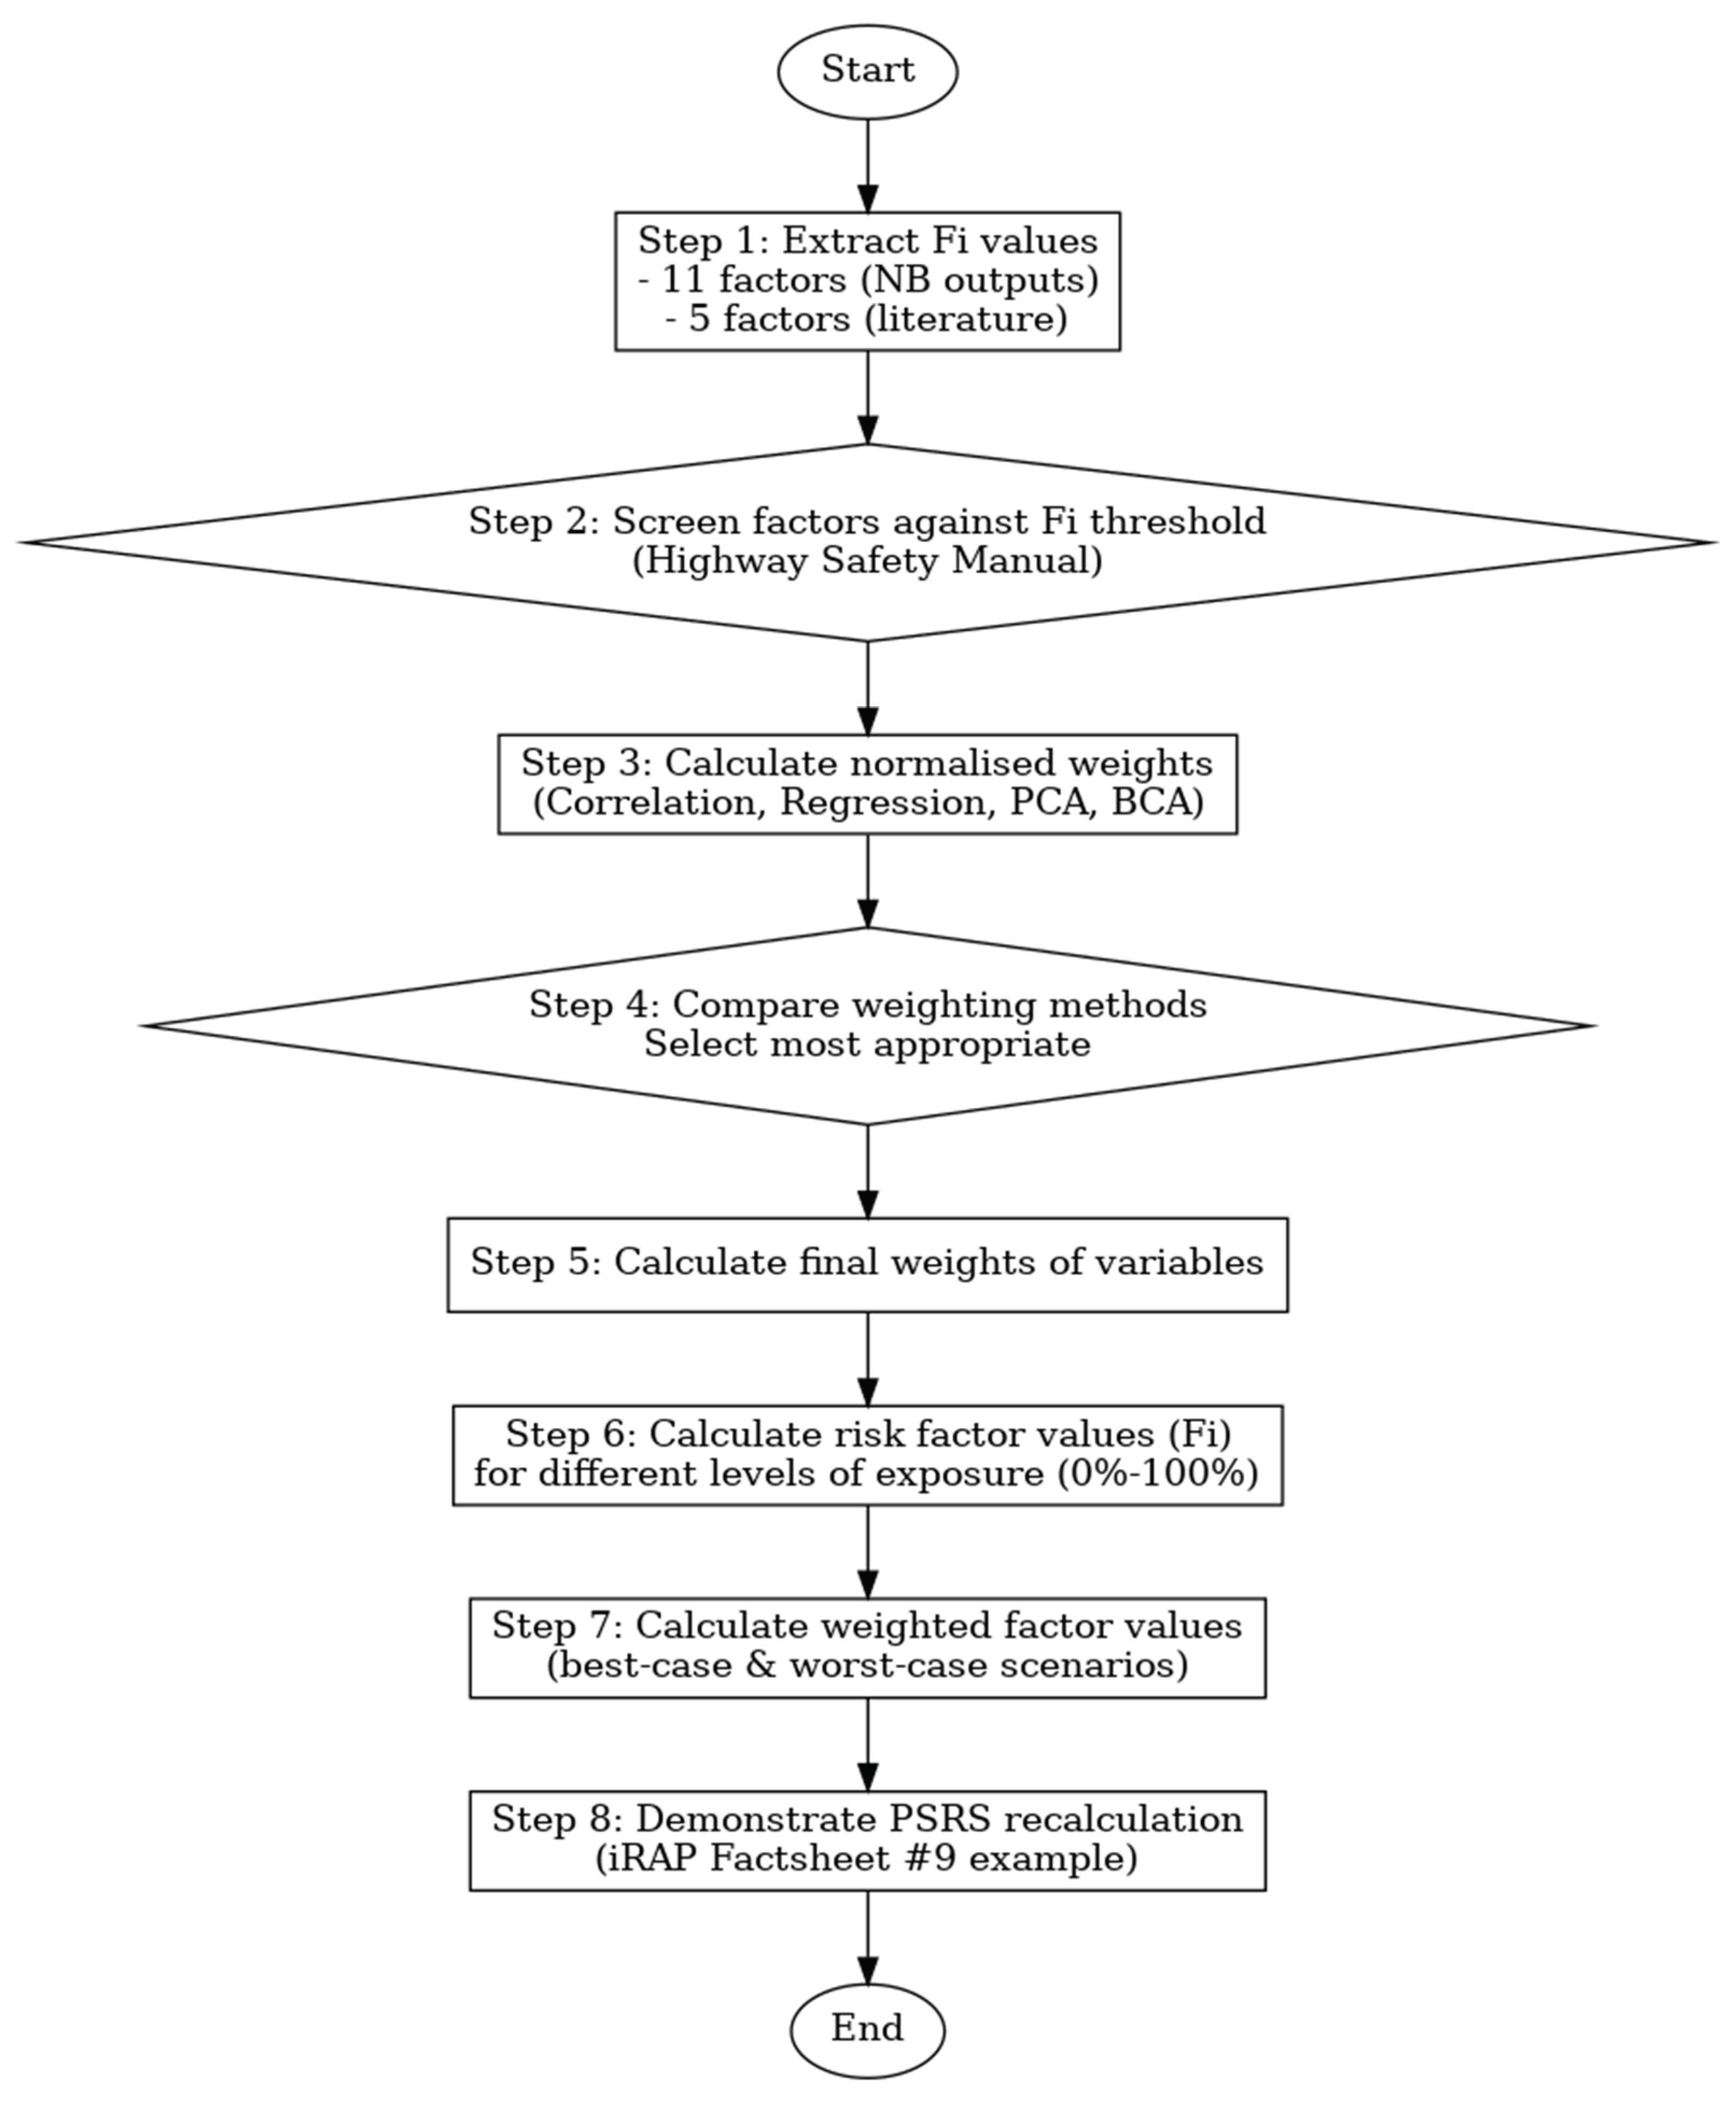
Figure 2.
Python Code for Computing Principal Component Analysis Weights.
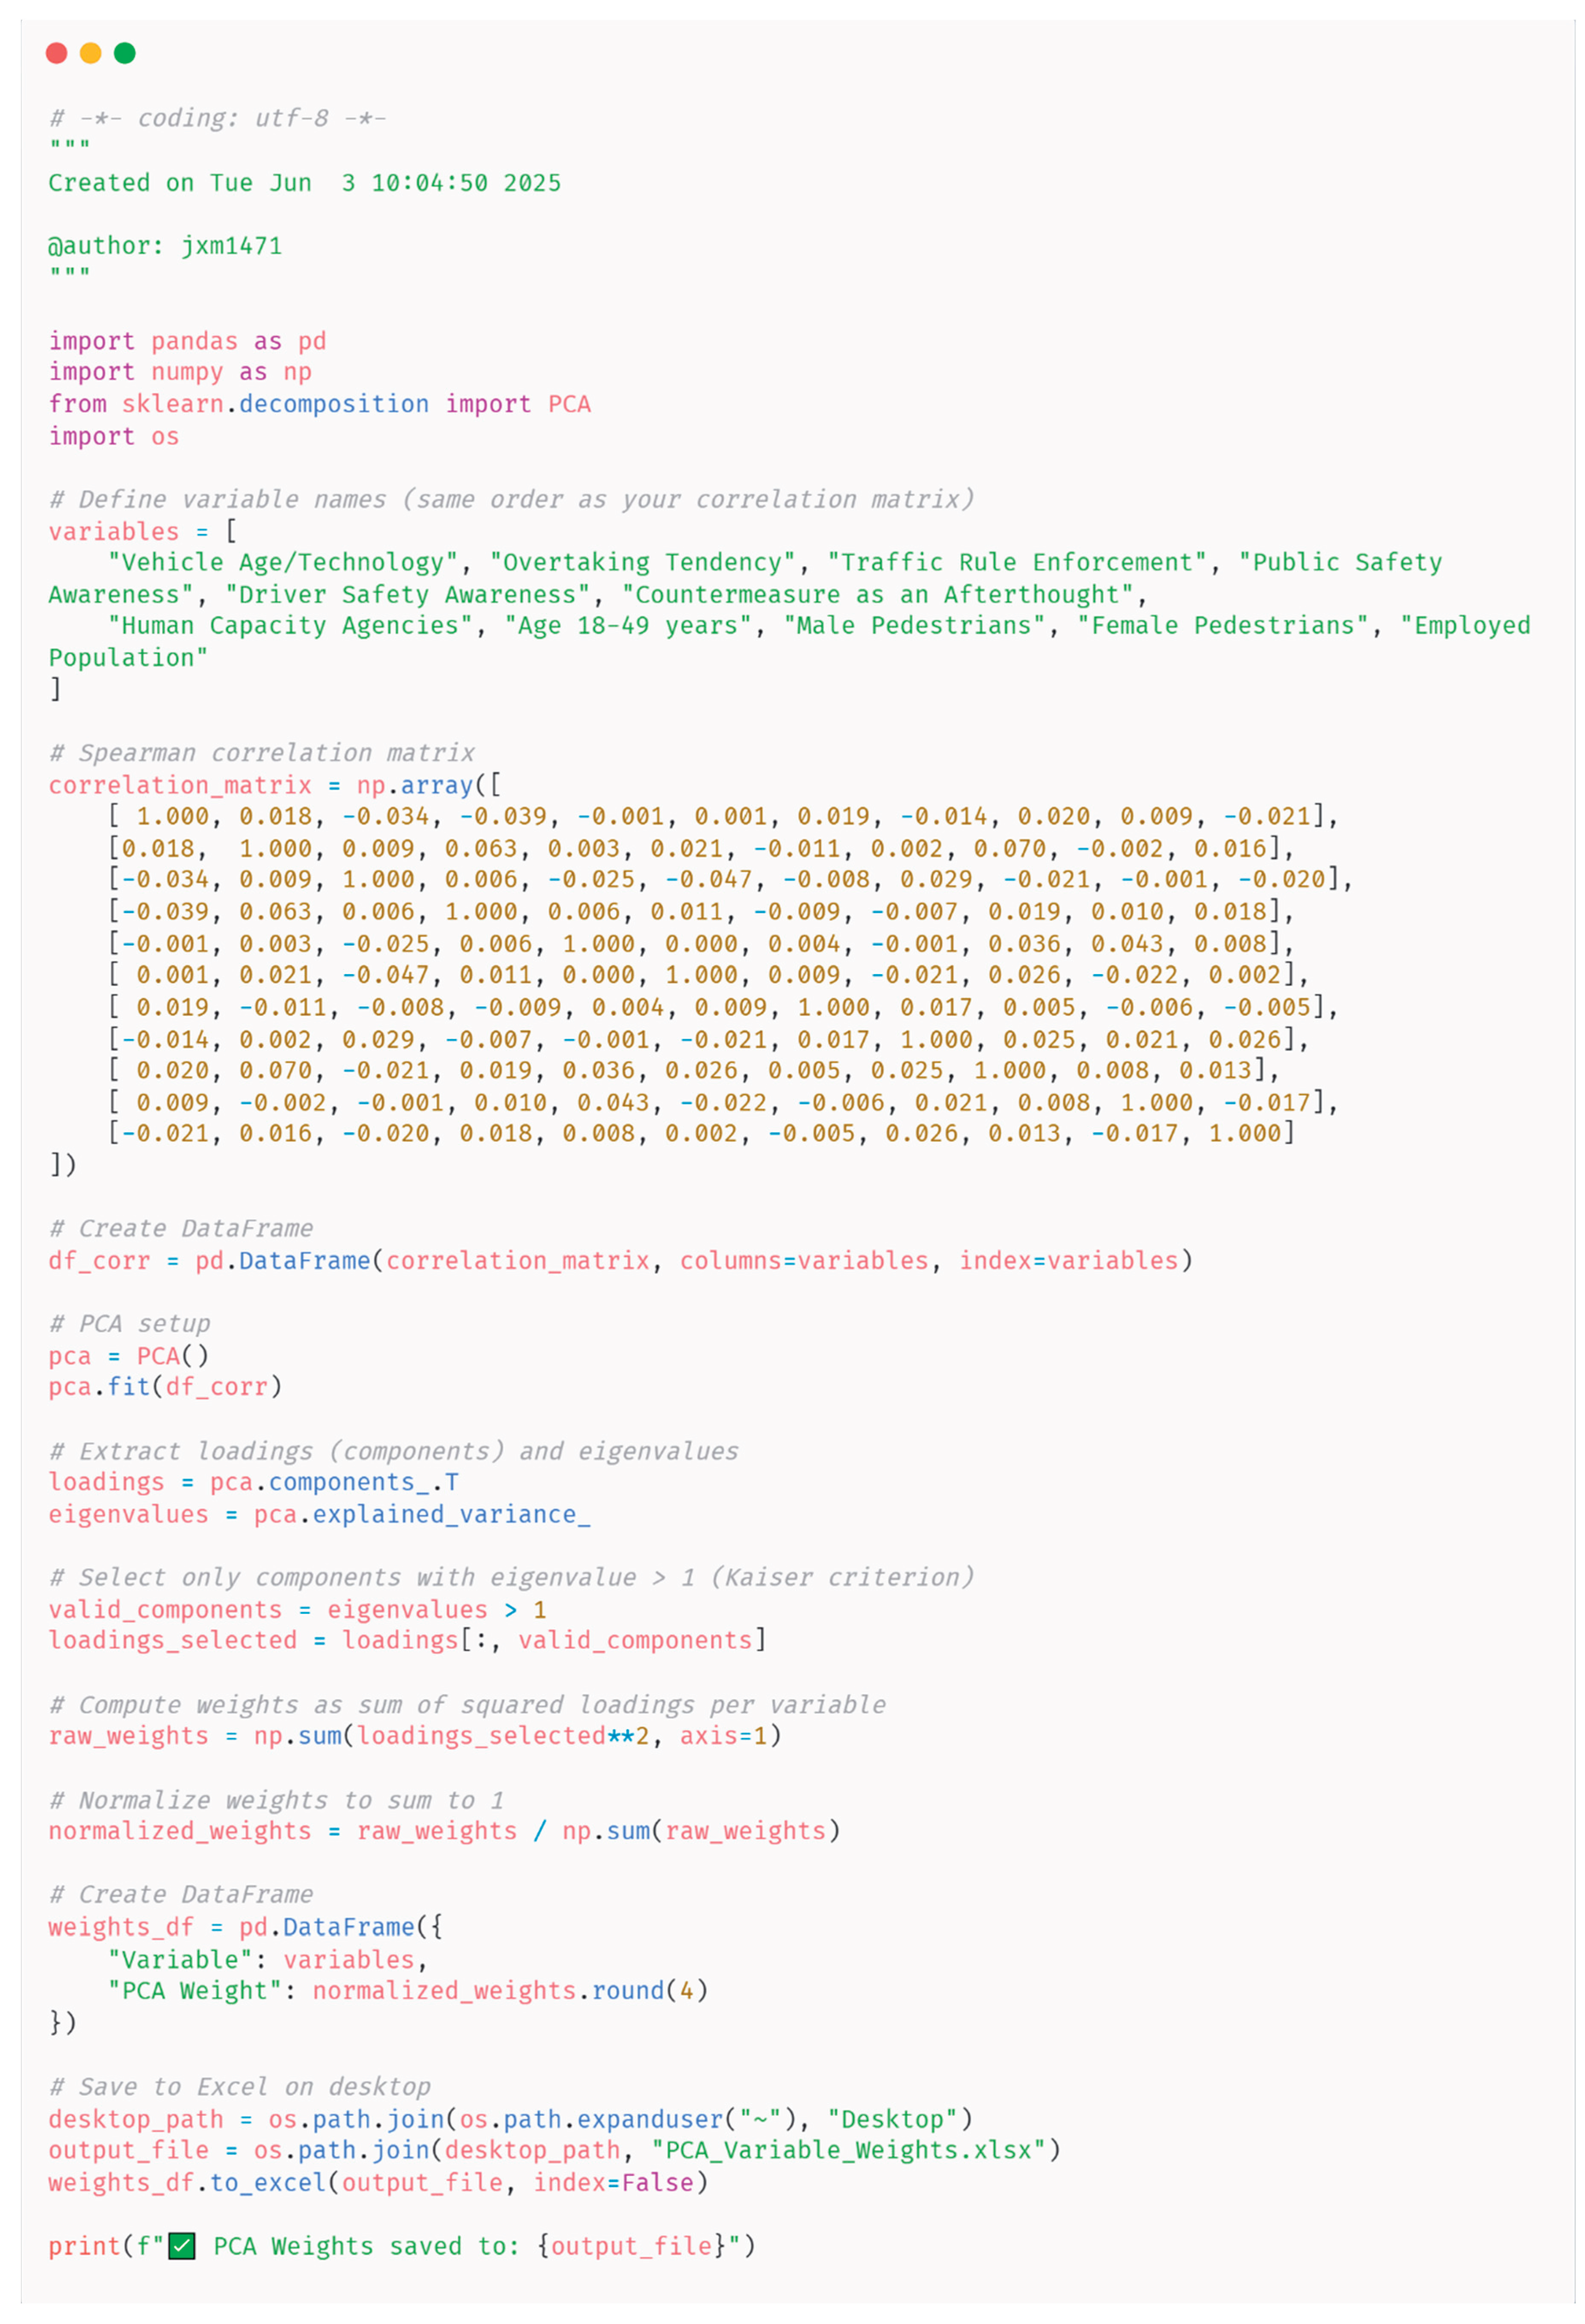
Figure 3.
Graph showing factored weight using different methods (Regression, Spearman, BA, & PCA).
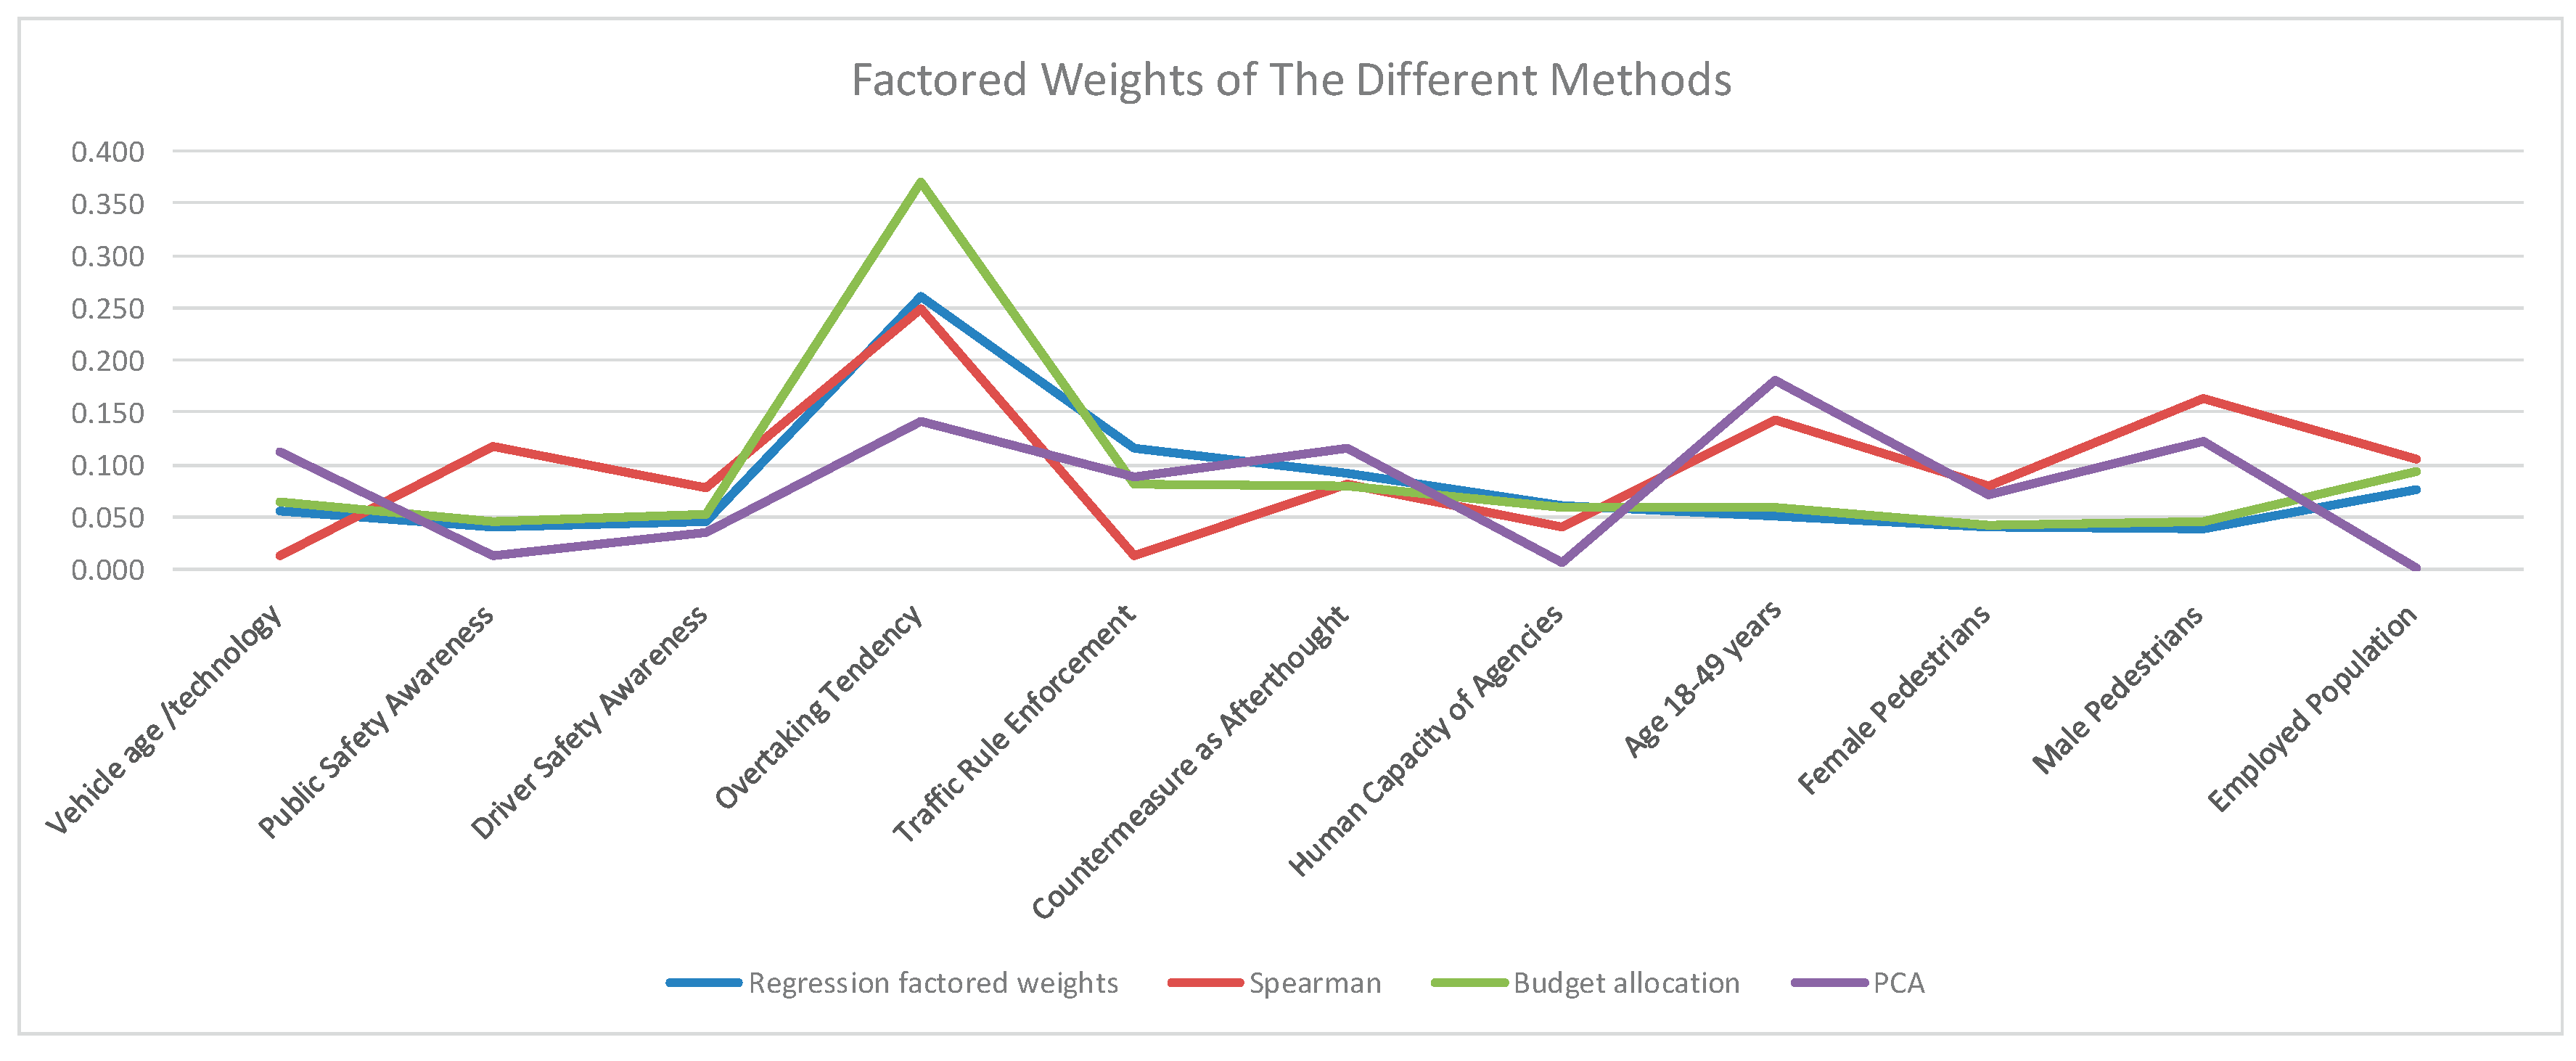
Table 1.
Factors to be considered in the variant Model.
| Variable / factor | Coefficient (β) | Risk factor (Fi) = eβ | In NB Model | iRAP Covered | Include in Model? (Fi , 0.9 or > 1.1) | Type of model and source |
|---|---|---|---|---|---|---|
| Pedestrian/Vehicle Volume Ratio | 0.004 | 1.004 | ✔️ | ✖️ | ✖️ | |
| Vehicle Age / Technology (%) | 0.150 | 1.162 | ✔️ | ✖️ | ✔️ | |
| Overtaking Tendency (1/0) | 0.502 | 1.652 | ✖️ | ✖️ | ✔️ | NB [26] |
| Traffic Rule Enforcement (1/0) | -0.980 | 0.375 | ✖️ | ✖️ | ✔️ | Logistic [36] |
| Public Safety Awareness (%) | 0.113 | 1.120 | ✖️ | ✖️ | ✔️ | Logistic [37] |
| Driver Safety Awareness (%) | 0.127 | 1.135 | ✖️ | ✖️ | ✔️ | Logistic [38] |
| Countermeasure as Afterthought (%) | -0.460 | 0.631 | ✔️ | ✖️ | ✔️ | |
| Footpath Encroachment (%) | 0.000 | 1.000 | ✔️ | ✖️ | ✖️ | |
| Human Capacity of Agencies (1/0) | -0.248 | 0.780 | ✖️ | ✖️ | ✔️ | Logistic [11,12,39,40] |
| Age 18–49 (%) | 0.140 | 1.150 | ✔️ | ✖️ | ✔️ | |
| Age 50+ (%) | -0.080 | 0.923 | ✔️ | ✖️ | ✖️ | |
| Male Pedestrians (%) | 0.110 | 1.116 | ✔️ | ✖️ | ✔️ | |
| Female Pedestrians (%) | -0.150 | 0.861 | ✔️ | ✖️ | ✔️ | |
| Employed Population (%) | 0.200 | 1.221 | ✔️ | ✖️ | ✔️ | |
| Street Furniture Vandalism (0/0.5/1) | -0.030 | 0.970 | ✔️ | ✖️ | ✖️ | |
| Age of Countermeasure (years) | -0.010 | 0.990 | ✔️ | ✖️ | ✖️ |
Table 2.
Comparison of normalised and factored weights using different methods.
| Factor/Variable | Data | Normalised Weights | Factored Weights (Fi*Wi) | ||||||||
|---|---|---|---|---|---|---|---|---|---|---|---|
| Spearman correlation coefficient (ρ) | Regression Coefficient(β) | Relative risk factor (Fi) = eβ | Spearman Correlation Weights | Regression weights | Principle Component Analysis Weights | Budget allocation weights | Spearman Correlation Weights | Regression weights | Principle Component Analysis Weights | Budget allocation weights | |
| Vehicle age /technology | 0.003 | 0.150 | 1.162 | 0.011 | 0.047 | 0.097 | 0.056 | 0.013 | 0.055 | 0.113 | 0.065 |
| Public Safety Awareness | -0.026 | 0.113 | 1.120 | 0.105 | 0.036 | 0.012 | 0.041 | 0.118 | 0.040 | 0.013 | 0.046 |
| Driver Safety Awareness | 0.017 | 0.127 | 1.135 | 0.068 | 0.040 | 0.031 | 0.047 | 0.078 | 0.045 | 0.035 | 0.053 |
| Overtaking Tendency | -0.037 | 0.502 | 1.652 | 0.151 | 0.158 | 0.086 | 0.224 | 0.249 | 0.261 | 0.141 | 0.370 |
| Traffic Rule Enforcement | 0.009 | -0.980 | 0.375 | 0.035 | 0.308 | 0.233 | 0.215 | 0.013 | 0.116 | 0.087 | 0.081 |
| Countermeasure as Afterthought | -0.032 | -0.460 | 0.631 | 0.128 | 0.145 | 0.184 | 0.127 | 0.081 | 0.091 | 0.116 | 0.080 |
| Human Capacity of Agencies | 0.013 | -0.248 | 0.780 | 0.053 | 0.078 | 0.009 | 0.075 | 0.041 | 0.061 | 0.007 | 0.059 |
| Age 18-49 | 0.031 | 0.140 | 1.150 | 0.124 | 0.044 | 0.157 | 0.052 | 0.143 | 0.051 | 0.180 | 0.059 |
| Female Pedestrians | -0.023 | -0.150 | 0.861 | 0.092 | 0.047 | 0.082 | 0.048 | 0.079 | 0.041 | 0.070 | 0.041 |
| Male Pedestrians | 0.036 | 0.110 | 1.116 | 0.146 | 0.035 | 0.110 | 0.040 | 0.163 | 0.039 | 0.123 | 0.045 |
| Employed Population | 0.021 | 0.200 | 1.221 | 0.086 | 0.063 | 0.000 | 0.076 | 0.105 | 0.077 | 0.000 | 0.093 |
| TOTAL | 1.000 | 1.000 | 1.000 | 1.000 | 1.083 | 0.875 | 0.887 | 0.991 | |||
Table 3.
Final weights of each factor, based on the BCA method.
| Variable / factor | Coefficient (β) | Factor Number (Fi) | Risk factor (Fi) = eβ | Weight Number (Wi) | Normalised Weight (Winormalised) | Final Weights (Wifinal) |
|---|---|---|---|---|---|---|
| Vehicle Age / Technology (%) | 0.150 | F1 | 1.162 | W1 | 0.056 | 0.017 |
| Public Safety Awareness (%) | 0.113 | F2 | 1.120 | W2 | 0.041 | 0.012 |
| Driver Safety Awareness (%) | 0.127 | F3 | 1.135 | W3 | 0.047 | 0.014 |
| Overtaking Tendency (1/0) | 0.502 | F4 | 1.652 | W4 | 0.224 | 0.067 |
| Traffic Rule Enforcement (1/0) | -0.980 | F5 | 0.375 | W5 | 0.215 | 0.064 |
| Countermeasure as Afterthought (%) | -0.460 | F6 | 0.631 | W6 | 0.127 | 0.038 |
| Human Capacity of Agencies (1/0) | -0.248 | F7 | 0.780 | W7 | 0.075 | 0.023 |
| Age 18–49 (%) | 0.140 | F8 | 1.150 | W8 | 0.052 | 0.015 |
| Female Pedestrians (%) | -0.150 | F9 | 0.861 | W9 | 0.048 | 0.014 |
| Male Pedestrians (%) | 0.110 | F10 | 1.116 | W10 | 0.040 | 0.012 |
| Employed Population (%) | 0.200 | F11 | 1.221 | W11 | 0.076 | 0.023 |
| Total Weight | 1.000 | 0.300 | ||||
Disclaimer/Publisher’s Note: The statements, opinions and data contained in all publications are solely those of the individual author(s) and contributor(s) and not of MDPI and/or the editor(s). MDPI and/or the editor(s) disclaim responsibility for any injury to people or property resulting from any ideas, methods, instructions or products referred to in the content. |
© 2025 by the authors. Licensee MDPI, Basel, Switzerland. This article is an open access article distributed under the terms and conditions of the Creative Commons Attribution (CC BY) license (http://creativecommons.org/licenses/by/4.0/).
Copyright: This open access article is published under a Creative Commons CC BY 4.0 license, which permit the free download, distribution, and reuse, provided that the author and preprint are cited in any reuse.


