
Submitted:
23 August 2025
Posted:
26 August 2025
You are already at the latest version
Abstract
Background: Early and accurate differentiation between melanomas and benign nevi is essential for making proper clinical decisions. This study evaluated 182 melanocytic le-sions using clinical, morphological, and histopathological parameters. Univariable anal-ysis was done in XLStat, while multivariable machine learning models were developed in Jamovi. Five supervised algorithms were compared, and glmnet (Elastic Net Regresion) was selected as best model due to superior balance of performance and calibration (AUC = 0.97). Age, horizontal diameter, and secondary histological features such as interactions with adjacent structures like epidermis (IAS-E) and changes in the extracellular matrix – like prominence of elastic fibers at the base of a lesion (CEM-BL) emerged as key predic-tors. While univariable and multivariable findings were consistent, machine learning al-lowed improved modeling of complex interactions. The results in our study demonstrate that structured demographyical, morphological and histopathological data can effectively support melanocitic lesions classification through machine learning approaches, offering a practical diagnostic support in dermatopathology.
Keywords:
Melanoma
; Nevi
; Diagnosis
; Histopathology
; Machine Learning in Medicine
1. Introduction
Melanoma is the most aggressive form of skin cancer, accounting for many skins cancer related deaths despite representing a smaller proportion of total cases [1-3]. Early and accurate differentiation between melanoma and benign melanocytic lesions, such as nevi, is critical for improving patient outcomes. Although clinical and histopathological evaluations remain the gold standard for diagnosis, overlapping morphological topography between benign and malignant lesions often lead to diagnostic uncertainty [4]. Well known risk factors such as age, gender, and lesion location significantly influence melanoma development. Morphological boundaries, the horizontal (dH) and vertical (dV) diameters of lesions, also contribute to distinguishing malignancy. Furthermore, histopathological changes including cellular atypia, immune response, and epidermal architecture, play an essential diagnostic role. However, interpretation of these characteristics may vary among pathologists and is often complicated by interrelated parameters and subjective judgment [5,6]. Advancements in information technology and artificial intelligence have enabled the application of machine learning (ML) in medical diagnostics. These algorithms can improve diagnostic accuracy by modeling complex, multidimensional relationships that are not easily captured through traditional statistical methods [7,8]. ML approaches have shown promising results in dermatopathology, particularly for lesion classification and risk stratification, due to their high performance and potential for integration into clinical workflows [9]. The aim of this retrospective study, conducted at the Clinical Hospital in Shtip, North Macedonia, was to identify key demographic, morphological, and histopathological factors that differentiate melanomas from nevi. Both univariate statistical methods and supervised ML algorithms were applied to examine predictive patterns within the data. This manuscript presents the results of this analysis and discusses the potential approaches to enhance diagnostic precision in dermatopathology.
2. Materials and Methods
Data Collection
This study considered 184 paraffin-embedded tissue samples extracted from patients with melanocytic lesions at the Clinical Hospital in Shtip, North Macedonia, during the period 2019–2023. Secondary histopathological changes were evaluated on 3-5 µm sections prepared from formalin-fixed, paraffin-embedded (FFPE) blocks. Routine hematoxylin and eosin (H&E) staining was used for general tissue architecture. Special stains Van Gieson-Elastica for elastic fibers and Alcian blue-PAS for mucin depositions, and presence of the yeast pytirosporum were applied following the manufacturer’s protocols [10,11]. All slides were reviewed using the same optical microscope, and representative characteristics were documented photographically. Demographic data: age, gender, and lesion localization were collected from patient records. Furthermore, generated diagnoses given by a pathologist were verified independently by two additional pathologists to ensure diagnostic accuracy. Secondary histopathological changes were systematically classified into five major categories, based on previously defined morphological groupings:
- Cytological Changes (CC) – including features such as clear cell cytoplasm, oncocytic transformation, granular cell transformation, and eosinophilic cytoplasmic inclusion bodies.
- Architectural Changes (A) – comprising suprabasal melanocytes, pseudogranulomatous structures, plexiform arrangements, and angioadnexocentric patterns.
- Changes in the Extracellular Matrix (CEM) – including increased elastic fiber prominence, osseous metaplasia (Osteonevus of Nanta), and mucin deposition.
- Changes Imitating Non-Melanocytic Components (CINC) – such as pseudolacunae, Pseudo Dabska-like patterns, neurotization (C-cell and pseudomeissnerian types), lipidization, and glandular/tubular-like formations.
- Interactions with Adjacent Structures (IAS) – including epidermal interactions (IAS-E), folliculitis, and cystic formations (epidermal, dermal, or trichilemmal).
Additionally and separately from all the characteristic above, the presence of the yeast Pytirosporum (Malassezia furfur) in the corneal layer was noted.
3. Results
Significant differences were observed between the melanoma and nevi groups regarding several clinical parameters (Table 1). Patients with melanoma were significantly older than those with nevi, with a median age of 66.5 years (Q1=55.75, Q3=74.75) compared to 37.0 years (Q1=30.00, Q3=48.00), p<0.0001. Age demonstrated a strong association with lesion type (η²= 0.4048). Lesion size also differed significantly between groups. The horizontal diameter (dh) was larger in melanoma cases (median = 1.55 cm) compared to nevi (median = 0.70 cm), p < 0.0001, with a moderate association (η²= 0.3554). Vertical diameter (dv) also showed a statistically significant difference (p= 0.0171), but with a much weaker association (η²= 0.0306).

Table 1.
Descriptive statistics and univariate analysis of age, lesion size (dh and dv) and lesion type.
Table 1.
Descriptive statistics and univariate analysis of age, lesion size (dh and dv) and lesion type.
| Predictor | Melanocitic lesion | N | Q1/Med/Q3 | AM± SD | MW, p value | Squared correlation ratio |
|---|---|---|---|---|---|---|
| Age | 182 | 33.00 / 42.00 / 58.00 | 45.51 ± 18.10 | |||
| M | 42 | 55.75 / 66.50 / 74.75 | 66.48 ± 12.41 | < 0.0001 | 0.4048 | |
| N | 140 | 30.00 / 37.00 / 48.00 | 39.21 ± 14.44 | |||
| dh (cm) | 182 | 0.50 / 0.80 / 1.20 | 1.00 ± 0.73 | |||
| M | 42 | 1.20 / 1.55 / 2.45 | 1.80 ± 0.85 | < 0.0001 | 0.3554 | |
| N | 140 | 0.40 / 0.70 / 1.00 | 0.76 ± 0.49 | |||
| dv (cm) | 182 | 0.20 / 0.40 / 0.58 | 0.42 ± 0.27 | |||
| M | 42 | 0.30 / 0.50 / 0.60 | 0.51 ± 0.30 | 0.0171 | 0.0306 | |
| N | 140 | 0.20 / 0.35 / 0.50 | 0.39 ± 0.26 | |||
Gender and lesion location distributions also differed significantly between the groups (Table 2). Females were significantly less likely to have melanoma (OR=0.193, 95% CI: 0.094–0.400, p<0.0001). Lesions on the trunk and head/neck were more commonly associated with melanoma, while other sites were more frequent in nevi. (Cramér’s V=0.2967) indicated a moderate association between lesion location and lesion type.
Table 2.
Cross-tabulation of melanocytic lesions by gender and anatomical location with association measures.
Table 2.
Cross-tabulation of melanocytic lesions by gender and anatomical location with association measures.
| Predictor | Melanocitic lesion | Significance by cell(Fisher's exact test) | χ2 test |
Assosiation coefficients | |||
|---|---|---|---|---|---|---|---|
| Melanoma (M) | Nevi (N) | ||||||
| Frequency (Proportion) | Frequency (Proportion) | M | N | p-value | |||
| Gender | Female | 17 (0.093) | 109 (0.599) | < | > |
< 0.0001 |
Odds ratio 0.193 [0.094;0.400] |
| Male | 25 (0.137) | 31 (0.170) | > | < | |||
| Location | 0 | 3 (0.016) | 24 (0.132) | < | 0.0030 |
Cramer's V 0.2967 |
|
| 1 | 10 (0.055) | 55 (0.302) | < | ||||
| 2 | 3 (0.016) | 5 (0.027) | |||||
| 3 | 19 (0.104) | 52 (0.286) | |||||
| 4 | 7 (0.038) | 4 (0.022) | > | < | |||
Legend: Head and neck (1), Arm (2), Trunk (3), Leg (4), Unknown (0).
Among secondary histopathological changes (Table 3), Cytological changes (CC), particularly clear cell citoplasm were more frequent in nevi (p<0.0001, OR=0.081, 95% CI: 0.032–0.203). Changes imitating non melanocytic components (CINC-L and CINC-T) were exclusively observed in nevi (p=0.0040 and p=0.0010, respectively), suggesting specificity for benign lesions. Changes in the extracellular matrix (CEM-BL, CEM-TL, CEM-S) were significantly more common in melanoma cases (p<0.0001), with odds ratios ranging from 4.84 to 7.97. The strongest association overall was observed with epidermal interactions (IAS-E), which were predominantly seen in nevi (OR=13.377, 95% CI: 4.270–41.903, p<0.0001). Presence of the Pityrosporium (PIT) was also more frequent in nevi (p=0.0021). Architectural changes (AA) and additional subcategories such as IAS-F and IAS-T were not statistically significant (p>0.05), indicating a limited role in lesion differentiation within this dataset.
Table 3.
Frequency and statistical association of secondary histopathological changes with lesion type.
Table 3.
Frequency and statistical association of secondary histopathological changes with lesion type.
| Predictor | Category | Melanocitic Lesion | Significance by Cell(Fisher's Exact Test) | χ2 test | Odds Ratio [95% CI] | ||
|---|---|---|---|---|---|---|---|
| Melanoma (M) | Nevi (N) | ||||||
| Frequency (Proportion) | Frequency (Proportion) | M | N | p-Value | |||
| CC | 0 | 24 (0.132) | 132 (0.725) | < | > | < 0.0001 | 0.081 [0.032;0.203] |
| 1 | 18 (0.099) | 8 (0.044) | > | < | |||
| AA | 0 | 27 (0.148) | 78 (0.429) |
0.3241 |
1.431 [0.707;2.898] | ||
| 1 | 15 (0.082) | 62 (0.341) | |||||
| CINC-L | 0 | 42 (0.231) | 116 (0.637) | > | < |
0.0040 |
|
| 1 | 0 (0.000) | 24 (0.132) | < | > | |||
| CINC-T | 0 | 42 (0.231) | 110 (0.604) | > | < | 0.0010 |
|
| 1 | 0 (0.000) | 30 (0.165) | < | > | |||
| CEM-BL | 0 | 17 (0.093) | 11 (0.060) | > | < |
< 0.0001 |
7.975 [3.386;18.782] |
| 1 | 25 (0.137) | 129 (0.709) | < | > | |||
| CEM-TL | 0 | 27 (0.148) | 26 (0.143) | > | < |
< 0.0001 |
7.892 [3.719;16.747] |
| 1 | 15 (0.082) | 114 (0.626) | < | > | |||
| CEM-S | 0 | 23 (0.126) | 28 (0.154) | > | < |
< 0.0001 |
4.842 [2.339;10.024] |
| 1 | 19 (0.104) | 112 (0.615) | < | > | |||
| IAS-F | 0 | 31 (0.170) | 113 (0.621) |
0.3342 |
0.673 [0.305;1.489] | ||
| 1 | 11 (0.060) | 27 (0.148) | |||||
| IAS-T | 0 | 38 (0.209) | 134 (0.736) |
0.1914 |
0.425 [0.121;1.491] | ||
| 1 | 4 (0.022) | 6 (0.033) | |||||
| IAS-E | 0 | 39 (0.214) | 69 (0.379) | > | < |
< 0.0001 |
13.377 [4.270;41.903] |
| 1 | 3 (0.016) | 71 (0.390) | < | > | |||
| PIT | 0 | 40 (0.220) | 102 (0.560) | > | < |
0.0021 |
7.451 [1.971;28.170] |
| 1 | 2 (0.011) | 38 (0.209) | < | > | |||
Machine Learning Models
To identify the most appropriate classification model, five machine learning algorithms were developed and compared: random forest (rf), partial least squares (pls), elastic net regression (glmnet), conditional inference trees (ctree), and k-nearest neighbors (knn). All models were trained on 128 samples using 14 predictor variables (excluding CINC-L and CINC-T due to the absence of category 1 in melanoma), with 54 independent samples used for validation.
As shown in (Figure 1), the rf, glmnet, pls, and ctree models achieved similar median values for classification accuracy and Cohen’s Kappa, suggesting comparable average performance. In contrast, knn showed consistently lower median values. Regarding consistency, rf, glmnet, and pls displayed tighter interquartile ranges (IQRs), while ctree and knn showed greater variability. Outliers were observed in rf, ctree, and knn, particularly for accuracy, indicating occasional performance drops. ROC curve analysis confirmed excellent discrimination by both glmnet and rf, with AUC values of 0.97 and 0.98, respectively (Figure 2). Glmnet and pls shared equivalent AUCs (0.97), but glmnet demonstrated better probability calibration. The reliability diagram (Figure 3) showed glmnet’s predictions closely aligned with observed outcomes across moderate-to-high probability ranges (0.5–1.0), while pls tended to overpredict in the mid-probability range (0.5–0.75). Given its superior calibration and strong discrimination, glmnet was selected as the final classification model. Optimal performance was achieved at α = 0.4 and λ = 0.04636 (Figure 4).
Figure 1.
Comparison of machine learning models based on accuracy and Cohen’s Kappa.
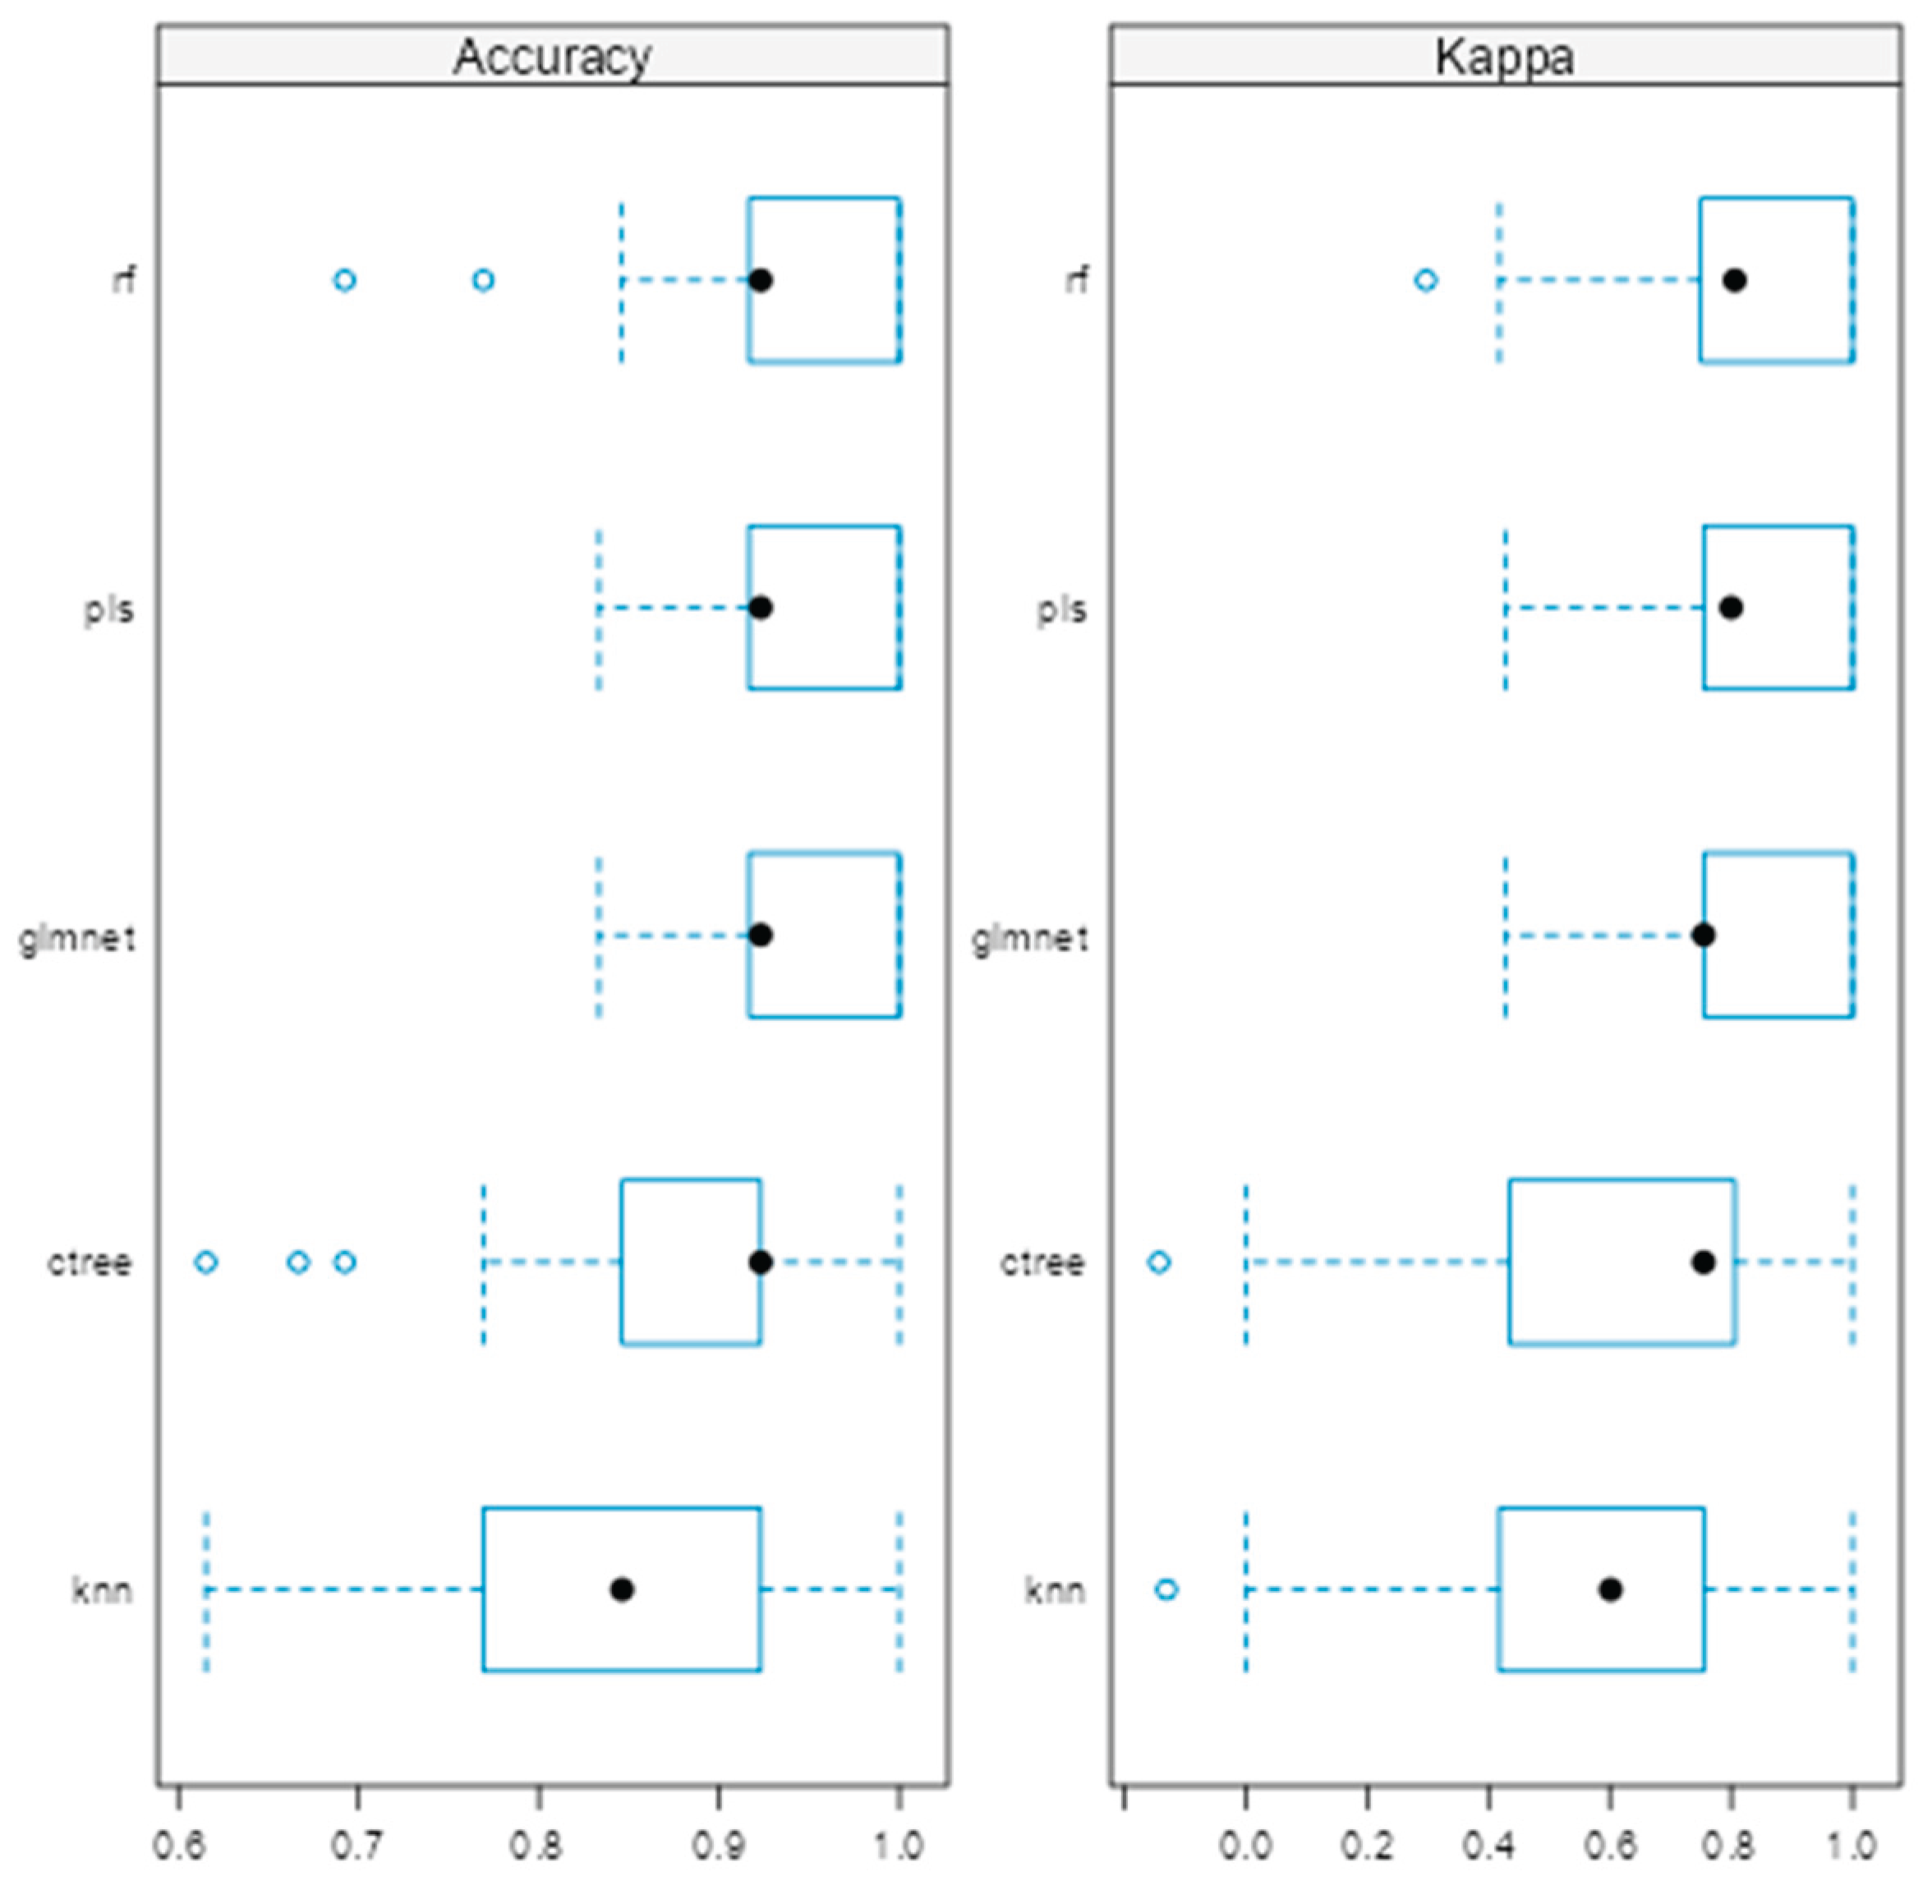
Figure 2.
ROC curves for glmnet, rf and pls machine learning models.
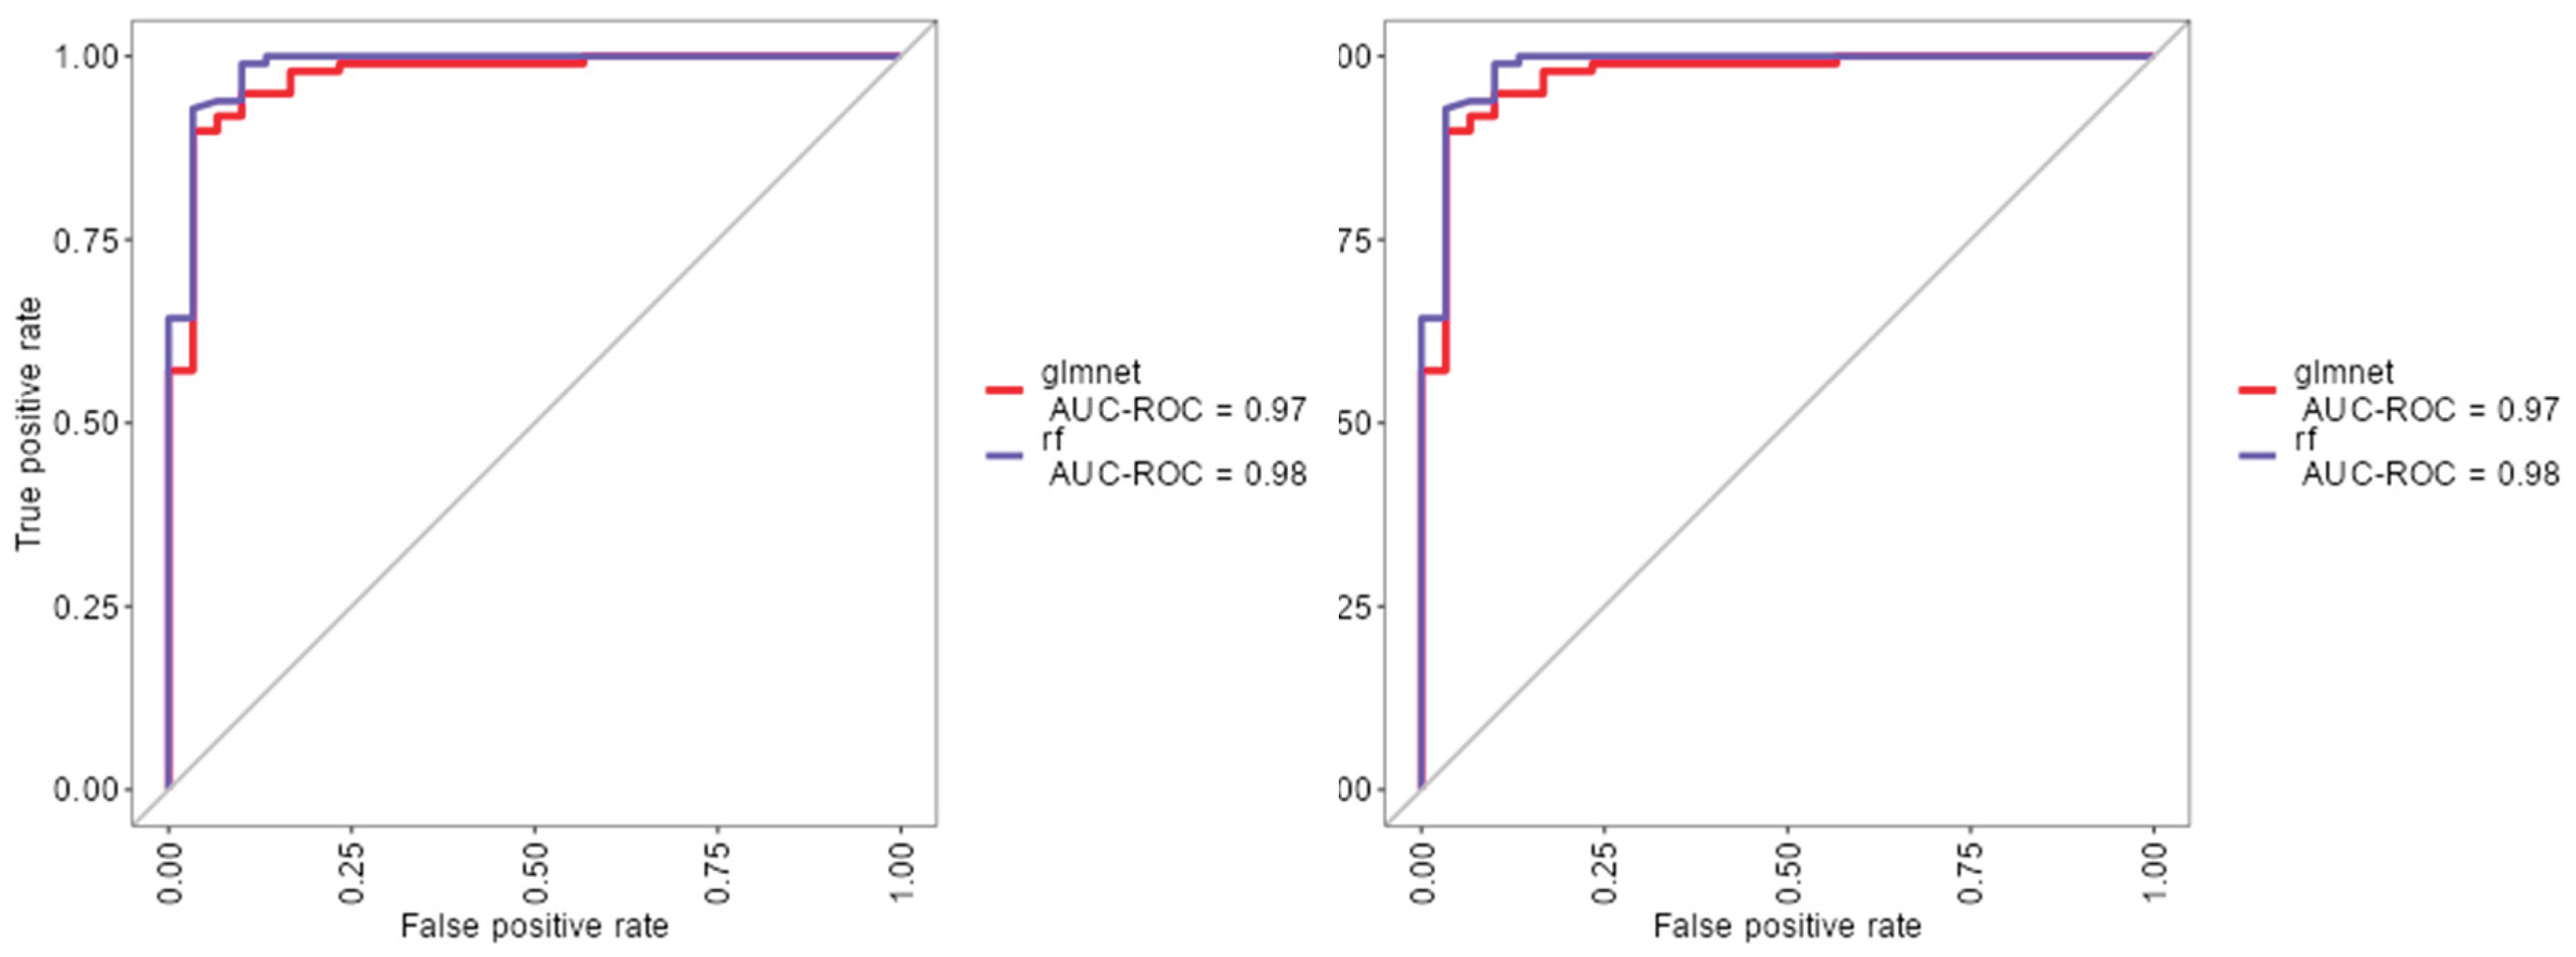
Figure 3.
Reliability diagram comparing calibration performance of glmnet and plsmodels.
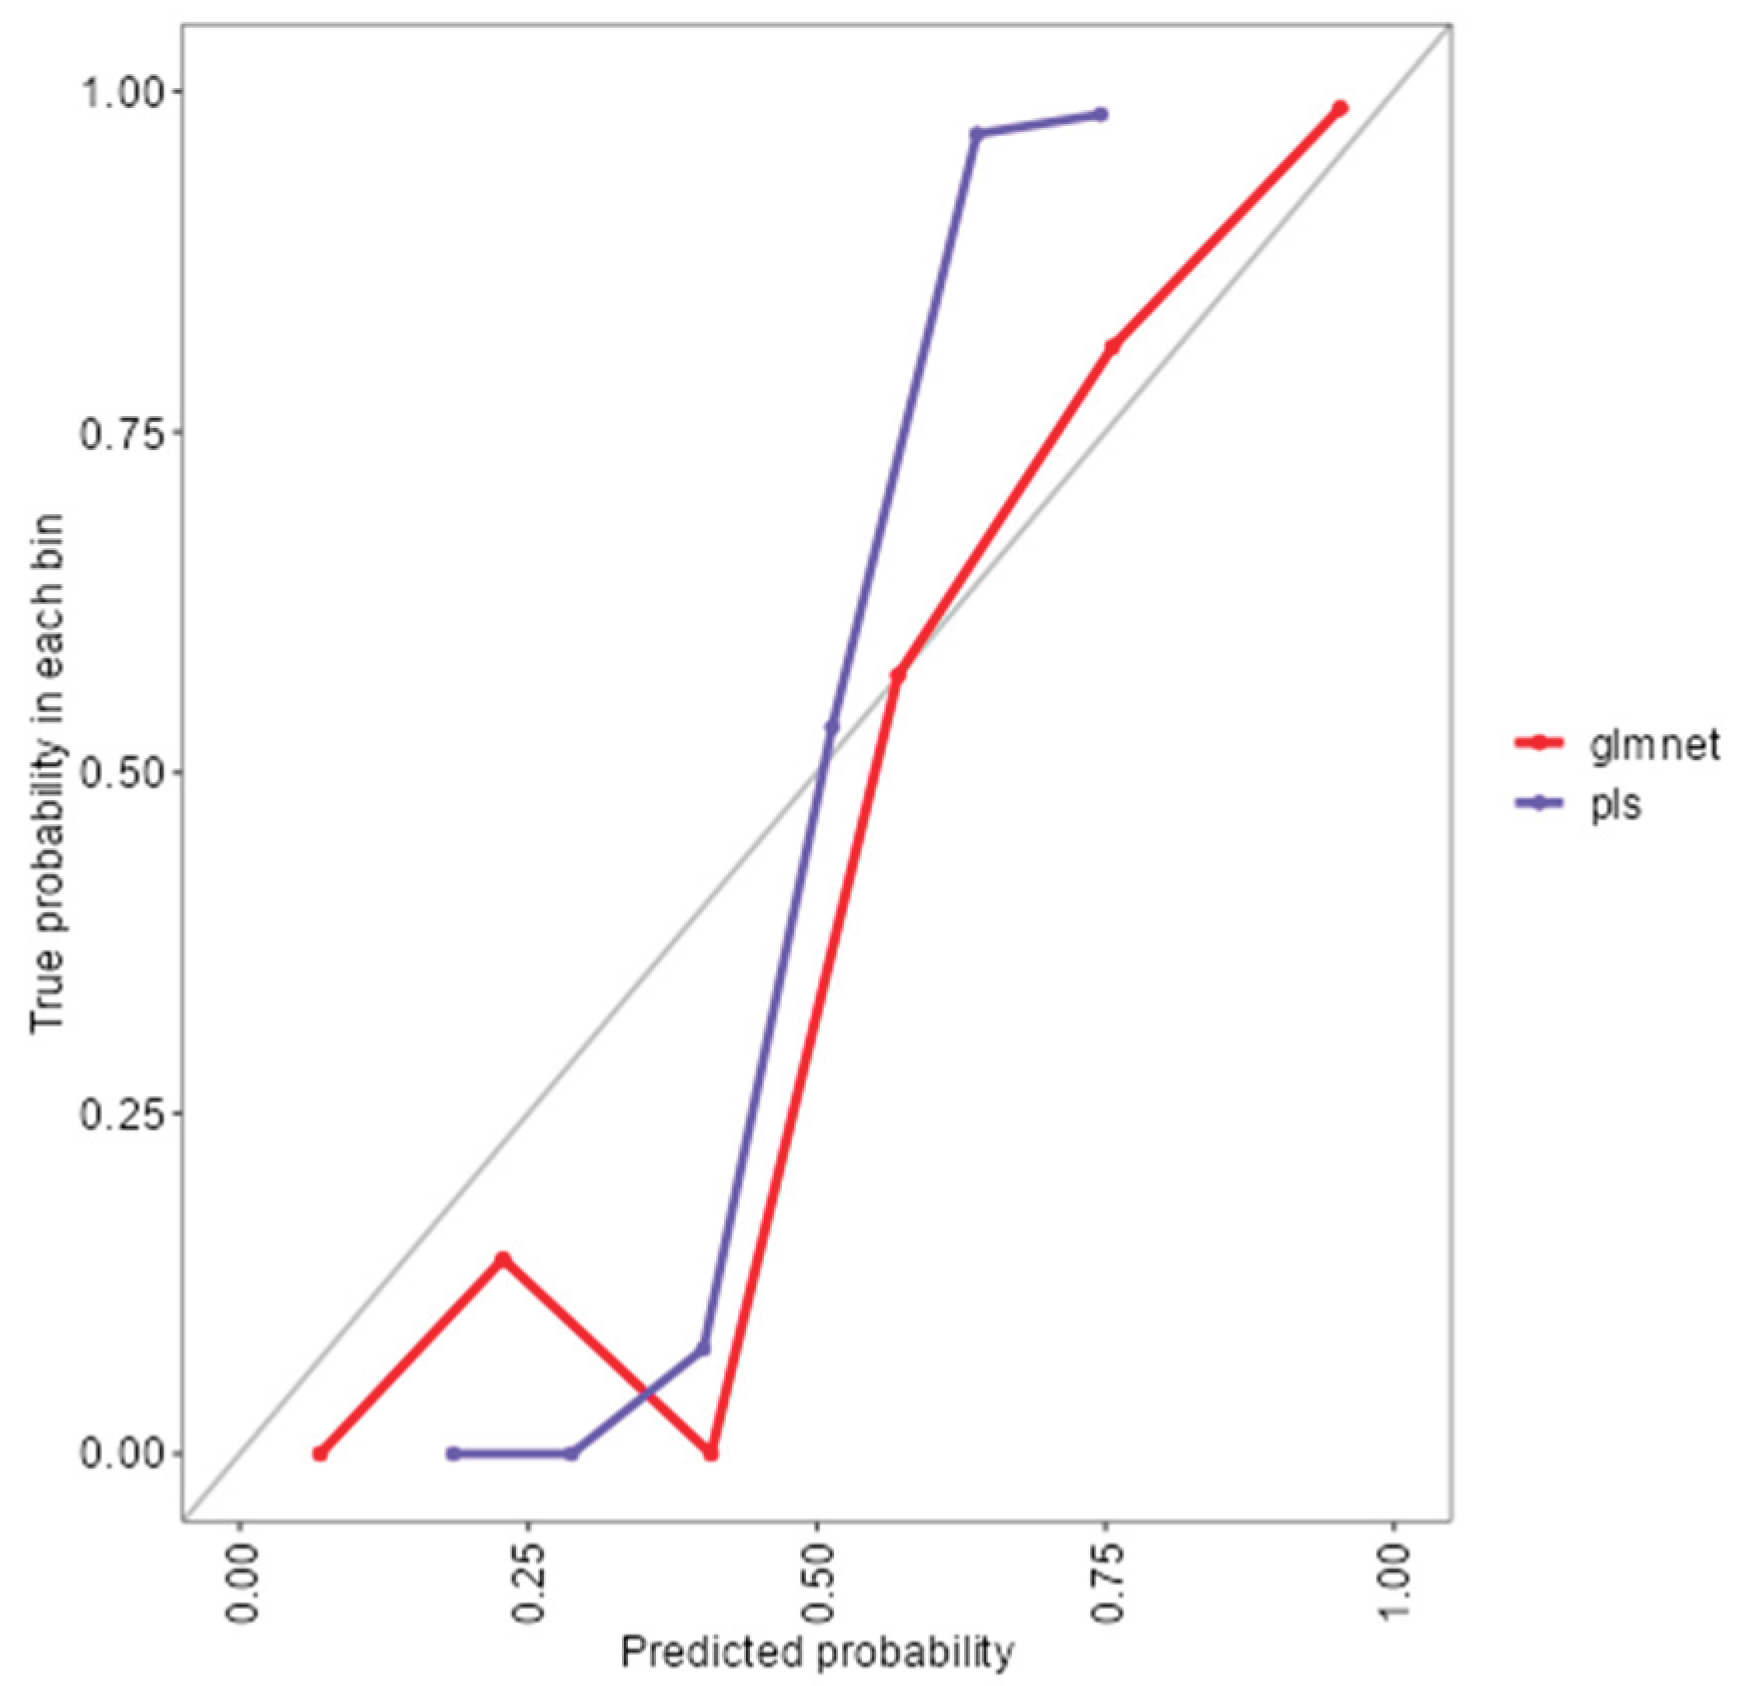
Figure 4.
Model selection and tuning parameters for glmnet.
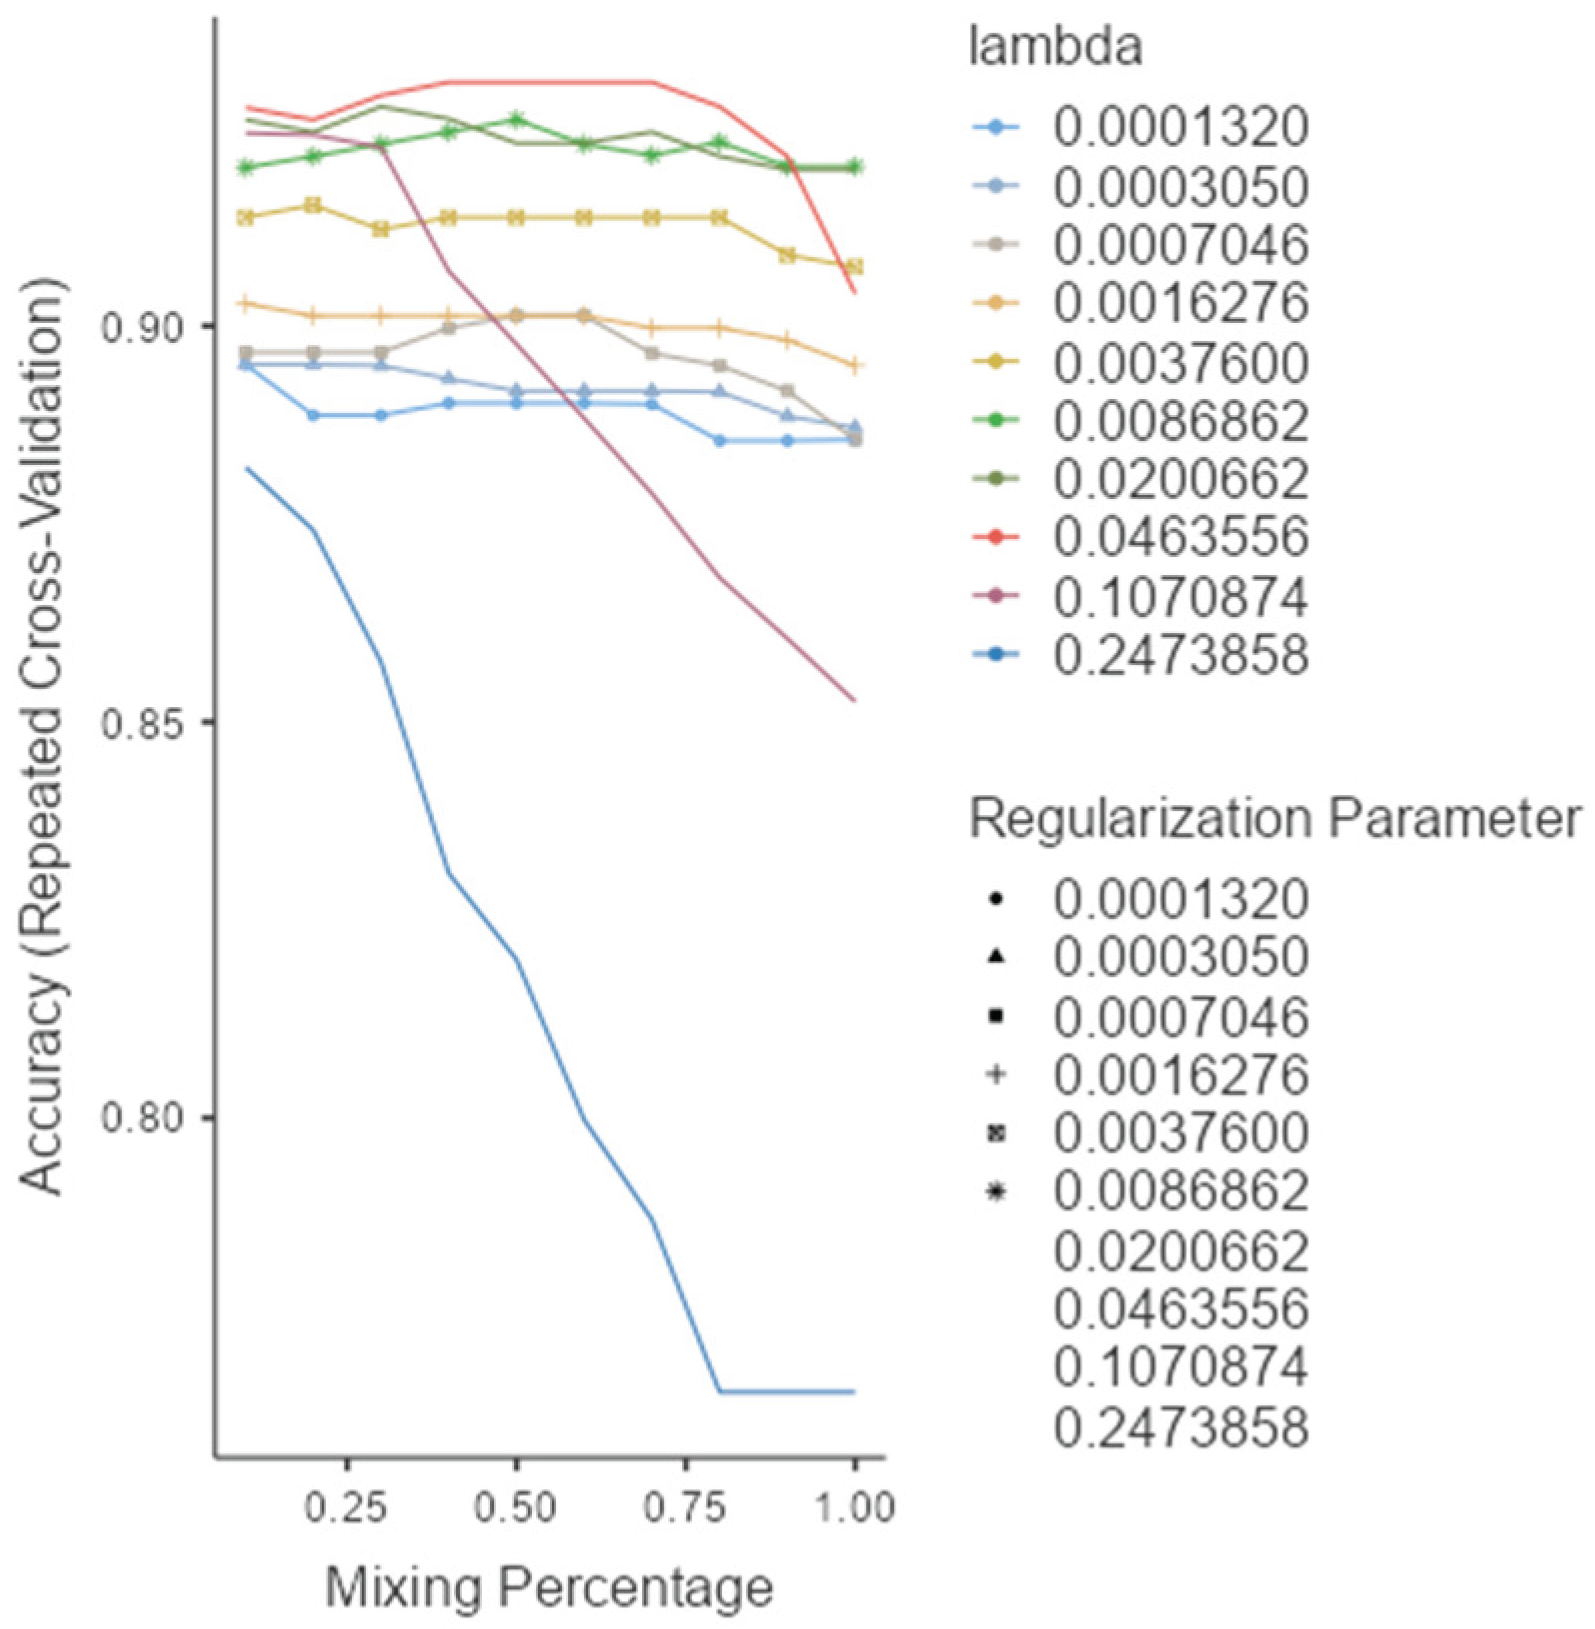
Table 4 summarizes glmnet’s performance. On the training set, it achieved 96.9% accuracy (95% CI: 92.2–99.1), sensitivity of 90.0%, specificity of 99.0%, and F1-score of 0.893. On the independent test set, accuracy was 90.7%, sensitivity 75.0%, specificity 95.2%, and F1-score 0.783, reflecting a balanced trade-off between precision and recall.
Table 4.
Performance metrics for glmnet on training and test datasets.
| Sensitivity | Specificity | Pos Pred Value | Neg Pred Value | F1 | Balanced Accuracy | |
|---|---|---|---|---|---|---|
| Training set | 0.833 | 0.990 | 0.962 | 0.951 | 0.893 | 0.912 |
| Test set | 0.750 | 0.976 | 0.900 | 0.932 | 0.893 | 0.863 |
Table 5 presents the confusion matrices, confirming that 9 of 12 melanoma cases and 41 of 44 nevi were correctly classified on the test set. This highlights glmnet’s strength in identifying benign lesions while preserving sensitivity for detecting melanomas.
Table 5.
Confusion matrices for glmnet model classification.
| Predicted | |||
|---|---|---|---|
| M | N | ||
| Training set | M | 25 | 1 |
| N | 5 | 97 | |
| Test set | M | 9 | 1 |
| N | 3 | 41 | |
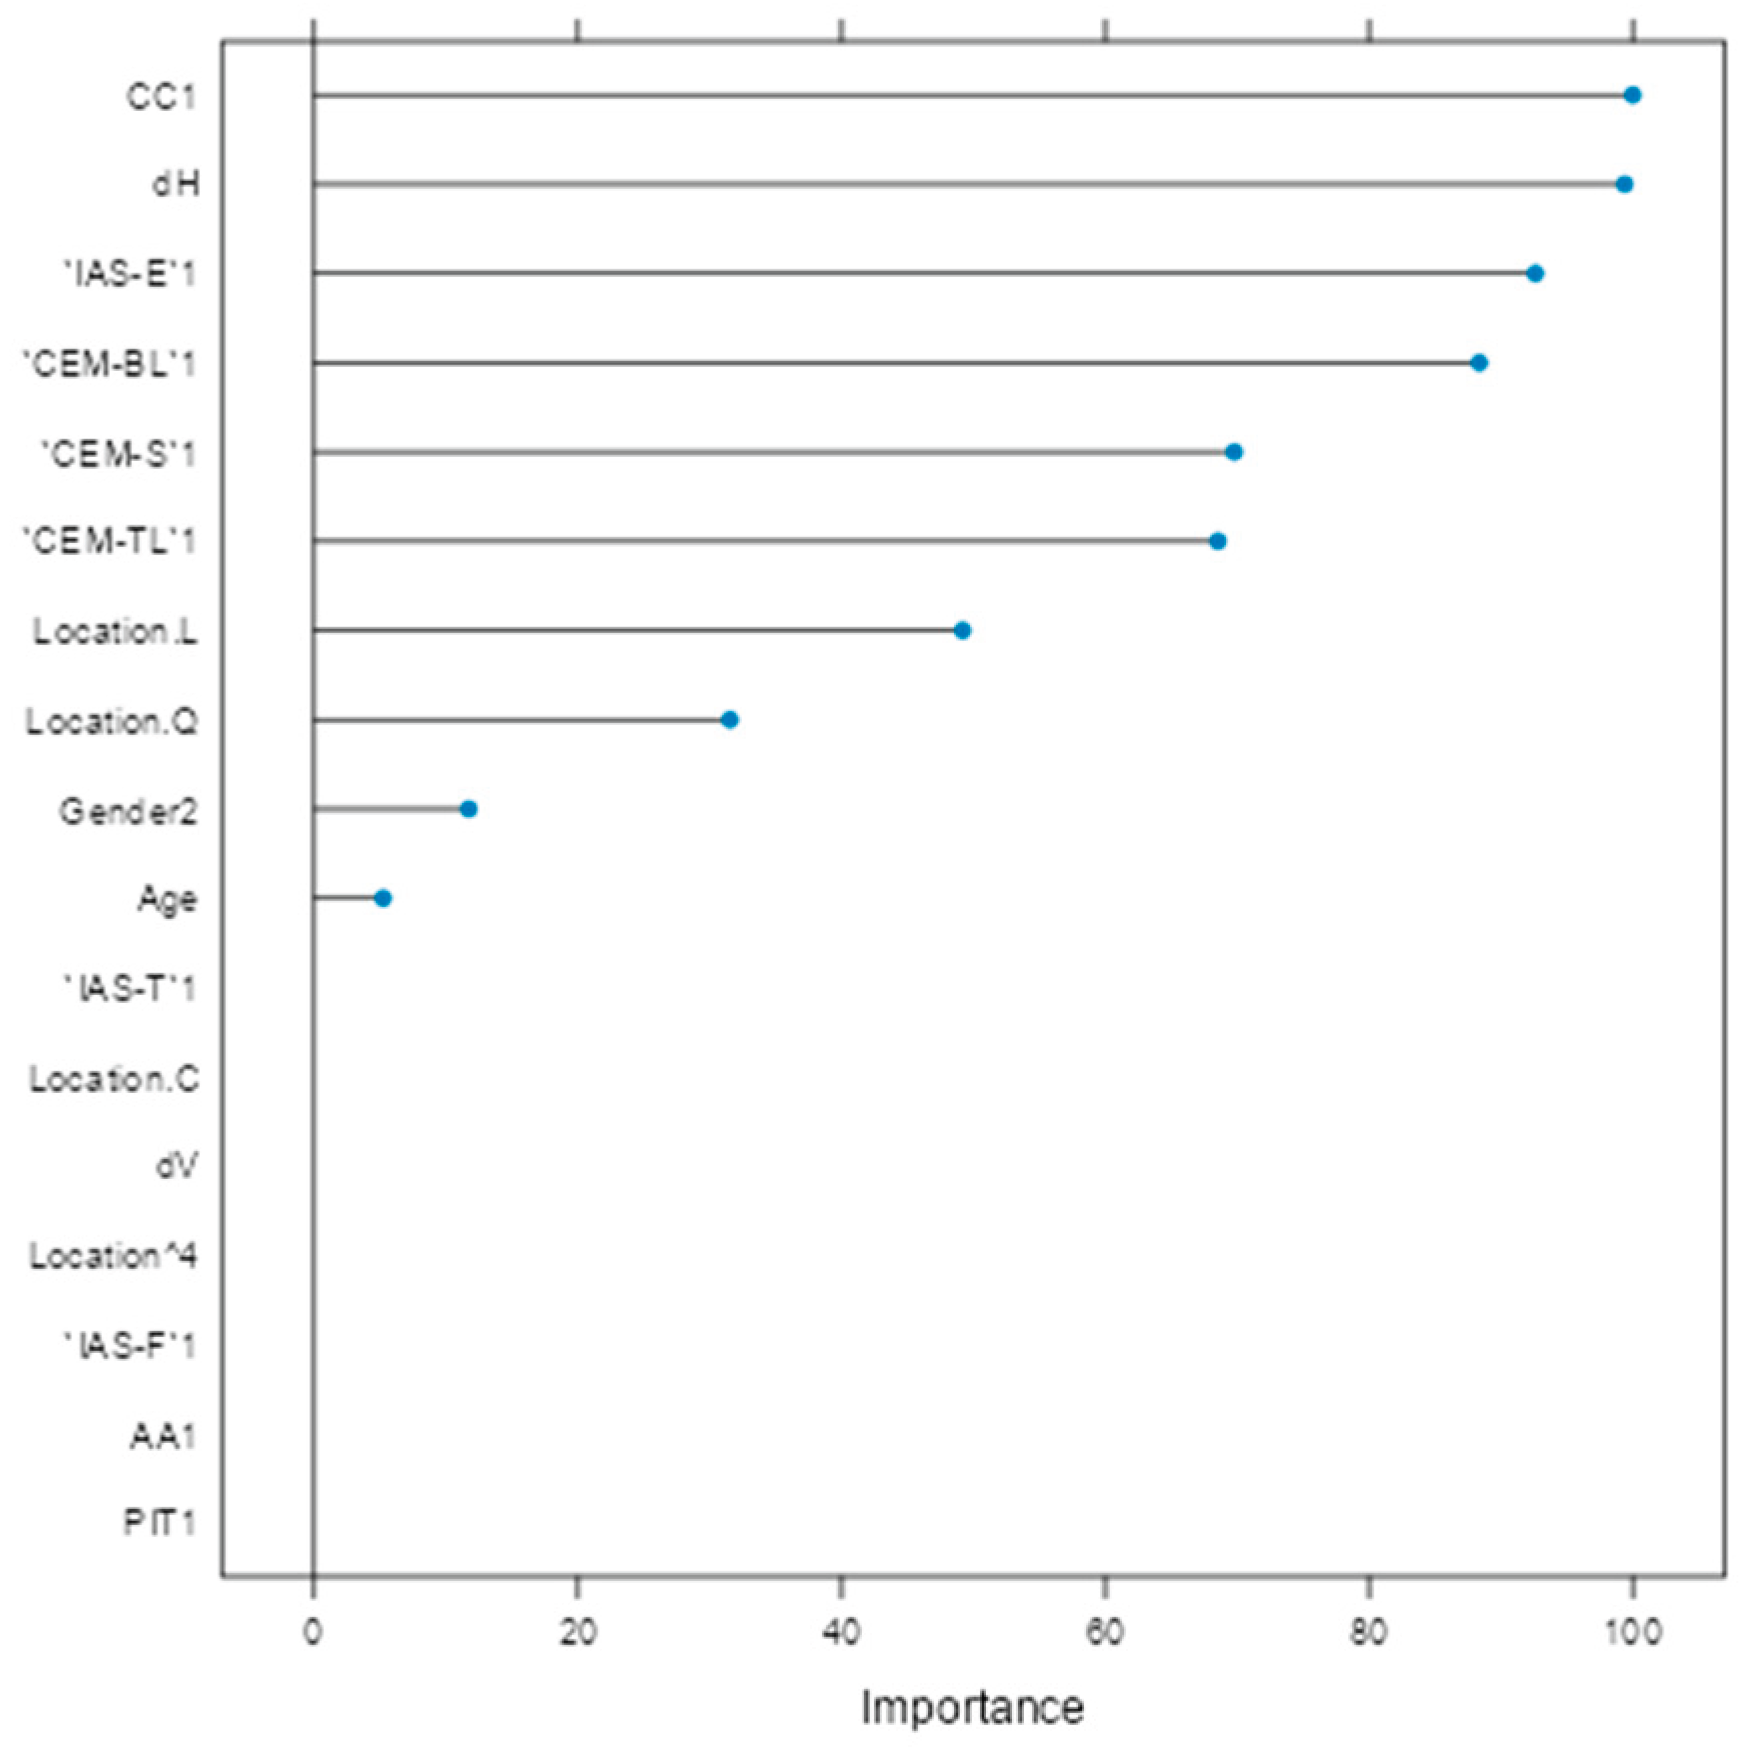
Variable importance analysis (Figure 5) identified CC1, horizontal diameter (dH), IAS-E1, CEM-BL1, CEM-S1, and CEM-TL1 as the most influential factors. Clinical parameters such as age, gender, and lesion location (trunk and head/neck) also contributed meaningfully. Variables like vertical diameter (dV), PIT1, IAS-T1, and lesion location 'C' (arm) were penalized toward zero, indicating limited predictive utility.
Figure 5.
Variable importance plot for glmnet model.
4. Discussion
This study investigated demographic, morphological, and histopathological predictors for differentiating melanomas from nevi through both univariate statistical analysis and multivariable machine learning (ML) approaches. Age emerged as the most robust univariate discriminator: melanoma patients were significantly older (median 66.5 years vs. 37.0; p<0.0001), consistent with cumulative sun exposure and age-related genetic damage observed in other studies [22]. Horizontal lesion diameter (dh) also showed a strong association with malignancy (p<0.0001), confirming previous findings that wider lesions are a sign of melanoma. In contrast, vertical diameter (dv) reached statistical significance but contributed little to predictive power (η²= 0.0306), supporting the notion that horizontal spread is a more clinically meaningful parameter. Gender and lesion location further enhanced diagnostic differentiation. Females were significantly less likely to develop melanoma (OR = 0.193, p<0.0001), aligning with established gender based risk patterns. In this study, melanomas were more frequently located on the trunk and head/neck regions (Table 2 ), supporting anatomical distribution trends. [22,23]. Secondary histopathological changes also demonstrated strong discriminatory potential. Cytological Changes (CC) were significantly more common in nevi (OR = 0.081), suggesting they may serve as negative indicators for malignancy. Changes Imitating Non-Melanocytic Components (CINC-L, CINC-T) were entirely absent in melanoma, reinforcing their specificity for benign lesions. Conversely, Changes in the Extracellular Matrix (CEM-BL, CEM-TL, and CEM-S) were significantly more frequent in melanomas (ORs from 4.84 to 7.97), consistent with studies describing stromal remodeling as a malignant signature [24]. Among the strongest markers was IAS-E (epidermal interaction), which favored nevi with an OR of 13.377, suggesting its role as a reliable benign indicator [25]. Presensce of Pityrosposrum in the corneal leyer (PIT) were also more common in nevi (OR = 7.451), supporting their potential as auxiliary benign markers. Unfortunately no studies with a similar context were found for a relevant comparison of the reported results. Features such as Architectural Alterations (AA), IAS-F, and IAS-T showed no significant differences, highlighting the limited diagnostic relevance of architectural variability in this dataset an observation also echoed in literature describing overlapping features among melanocytic lesions [25]. To extend beyond the limitations of univariate assessment, five ML models were implemented: random forest (rf), partial least squares (pls), elastic net (glmnet), conditional inference trees (ctree), and k-nearest neighbors (knn). These models were chosen to evaluate both linear and non-linear patterns, manage multicollinearity, particularly important for smaller, imbalanced clinical datasets [26,27]. Rf, glmnet, pls, and ctree achieved comparable classification accuracy and Kappa scores (Figure 1), while kNN showed inferior performance. Tighter interquartile ranges for rf, glmnet, and pls suggested more consistent behavior across validation folds. By contrast, ctree and especially kNN exhibited broader variability and frequent outliers, indicating reduced robustness. ROC curve analysis showed strong discriminative capacity across models, with glmnet and rf achieving AUCs of 0.97 and 0.98, respectively (Figure 2). While PLS also achieved an AUC of 0.97, its calibration was inferior to glmnet’s. Glmnet predicted probabilities closely aligned with observed outcomes in the moderate-to-high range, whereas pls overestimated probabilities in the midrange, potentially compromising clinical reliability (Figure 3). These results align with prior studies suggesting regularized linear models balance accuracy and interpretability well in medical classification tasks [28,29].
Based on performance metrics, glmnet was selected as the final model (Figure 4). On the training set, it achieved 96.9% accuracy and 90.0% sensitivity, while the test set confirmed strong generalizability with 90.7% accuracy and 75.0% sensitivity (Table 4). A stable F1-score of 0.783 indicated a sound balance between precision and recall crucial in clinical applications where both false positives and false negatives carry consequences. The confusion matrix (Table 5) showed successful identification of 9 out of 12 melanomas and 41 out of 44 nevi, underscoring high specificity and supporting glmnet's potential as a diagnostic aid. Variable importance analysis (Figure 5) provided insight into predictor contributions. The most influential features included CC1, horizontal diameter (dH), IAS-E1, and extracellular matrix components (CEM-BL1, CEM-S1, CEM-TL1). Age, gender, and lesion location (particularly trunk and head/neck) also demonstrated strong influence. Conversely, vertical diameter (dV), PIT1, IAS-T1, and lesion location “C” (arm) were penalized to near-zero, indicating limited multivariable value. Comparing univariate findings with glmnet's variable importance highlights key areas of overlap and divergence. Parameters like age and dH remained highly significant across both approaches, affirming their central role in diagnosis. For example, age was both a significant univariate discriminator (p<0.0001) and a key multivariable predictor confirming its integration into diagnostic models, aldough there are not any similar reports. Similarly, dH showed strong individual association and retained importance in multivariable modeling, validating earlier claims about horizontal expansion as a malignancy indication. In contrast, dV, which reached univariate significance, was heavily penalized in glmnet, likely due to redundancy with dH or weaker discriminatory value in early lesions. Factors such as IAS-E, CEM, and CC, which were univariately significant, also emerged as top ranked glmnet predictors supporting their independent relevance. Further studies need to be perfomed to confirm these findings as diagnostic indicators. Notably, some factors with strong univariate associations like CINC-L/T and PIT were excluded in the ML model. CINC variables were removed due to their absence in melanoma cases, and PIT was penalized during regularization, reflecting diminished value when adjusted for other variables. This aligns with the strength of regularized models in suppressing spurious or redundant predictors [31]. Interestingly, lesion location and gender, which were of borderline significance univariately, gained weight in the glmnet model. This suggests interaction effects not captured in univariate tests but detected in multivariable modeling consistent with findings.
5. Conclusions
Integrating clinical and histopathological features with ML algorithms like glmnet give a promising strategy for melanoma diagnosis. While univariate analysis helps highlight potential markers, multivariable modeling reveals their contextual relevance, allowing for more nuanced and clinically actionable predictions. The high accuracy, interpretability, and generalizability of the glmnet model support its use in diagnostic workflows, especially in settings where imaging data is unavailable or limited.
Abbreviations
The following abbreviations are used in this manuscript:
| ML | Machine Learning |
| GLMNET | Elastic Net Regression |
| RF | Random Forest |
| PLS | Partial Least Squares |
| KNN | k-Nearest Neighbors |
| CTREE | Conditional Inference Trees |
| AUC | Area Under the Receiver Operating Characteristic Curve |
| OR | Odds Ratio |
| CC | Cytological Changes |
| AA | Architectural Changes |
| CEM | Changes in the Extracellular Matrix |
| CINC | Changes Imitating Non-Melanocytic Components |
| IAS | Interactions with Adjacent Structures |
| PIT | Pityrosporum |
| DH | Horizontal Diameter |
| DV | Vertical Diameter |
| SD | Standard Deviation |
| Q1 / Q3 | First and Third Quartile |
| CI | Confidence Interval |
| FFPE | Formalin-Fixed Paraffin-Embedded |
| H&E | Hematoxylin and Eosin |
| AM | Arithmetic Mean |
| PPV | Positive Predictive Value |
| NPV | Negative Predictive Value |
| F1 | F1-Score |
| ROC | Receiver Operating Characteristic |
| IQR | Interquartile Range |
| XLSTAT | XLSTAT Pro statistical software |
| Jamovi | Jamovi statistical software |
| SnowCluster | SnowCluster module for Jamovi |
References
- Siegel, R. L. , Miller, K. D., Fuchs, H. E., & Jemal, A. (2023). Cancer statistics, 2023. CA: A Cancer Journal for Clinicians, 73. [CrossRef]
- Leiter, U. , Keim, U., Eigentler, T., Katalinic, A., Holleczek, B., Martus, P.,... Garbe, C. (2020). Incidence, mortality, and trends of non melanoma skin cancer in Germany. Journal of Investigative Dermatology 140(3), 579–588. [CrossRef]
- Leiter, U. , Keim, U., & Garbe, C. (2020). Epidemiology of skin cancer: Update 2020. Advances in Experimental Medicine and Biology, 1268, 123–139. [CrossRef]
- Marchetti MA, Liopyris K, Dusza SW, Codella NCF, Gutman DA, Helba B, Kalloo A, Halpern AC; International Skin Imaging Collaboration. Computer algorithms show potential for improving dermatologists' accuracy to diagnose cutaneous melanoma: Results of the International Skin Imaging Collaboration 2017. J Am Acad Dermatol. 2020 Mar;82(3):622-627. [CrossRef] [PubMed]
- Waqar S, George S, Jean-Baptiste W, Yusuf Ali A, Inyang B, Koshy FS, George K, Poudel P, Chalasani R, Goonathilake MR, Mohammed L. Recognizing Histopathological Simulators of Melanoma to Avoid Misdiagnosis. Cureus. 2022 Jun 20;14(6):e26127. [CrossRef] [PubMed]
- Ahmed Alsayyah, Differentiating between early melanomas and melanocytic nevi: A state-of-the-art review, Pathology - Research and Practice, Volume 249, 2023, 154734, ISSN 0344-0338. [CrossRef]
- Kassem, M. A. , Hosny, K. M., Damaševičius, R., & Eltoukhy, M. M. (2021). Machine Learning and Deep Learning Methods for Skin Lesion Classification and Diagnosis: A Systematic Review. Diagnostics, 11, 8, 1390. [CrossRef]
- Brinker, T. J. , Hekler, A., Enk, A. H., Berking, C., Haferkamp, S., Hauschild, A.,... von Kalle, C. (2019). Deep learning outperformed 136 of 157 dermatologists in a head-to-head dermoscopic melanoma image classification task. European Journal of Cancer, 113, 47–54. [CrossRef]
- Tschandl, P. , Rinner, C., Apalla, Z., Argenziano, G., Codella, N., Halpern, A.,... Kittler, H. (2020). Human–computer collaboration for skin cancer recognition. Nature Medicine, 26, 1229–1234. [CrossRef]
- Bancroft, J. D. , & Gamble, M. (2008). Theory and practice of histological techniques (6th ed.). Churchill Livingston.
- Suvarna, S. K. , Layton, C., & Bancroft, J. D. (2019). Bancroft’s theory and practice of histological techniques.
- Addinsoft. (2024). XLSTAT statistical and data analysis solution (Version 2024.1) [Computer software]. https://www.xlstat.com.
- The Jamovi Project. (2023). Jamovi (Version 2.4) [Computer software]. https://www.jamovi.org.
- Ratner, B. (2023). SnowCluster: Machine learning module for Jamovi [Computer software]. https://www.jamovi.org.
- Wold, S. , Sjöström, M., & Eriksson, L. (2001). PLS-regression: A basic tool of chemometrics. Chemometrics and Intelligent Laboratory Systems, 58, 2, 109–130. [CrossRef]
- Hothorn, T. , Hornik, K., & Zeileis, A. (2006). Unbiased recursive partitioning: A conditional inference framework. Journal of Computational and Graphical Statistics, 15, 3, 651–674. [CrossRef]
- Breiman, L. (2001). Random forests. Machine Learning, 45, 1, 5–32. [CrossRef]
- Zou, H. , & Hastie, T. (2005). Regularization and variable selection via the elastic net. Journal of the Royal Statistical Society: Series B (Statistical Methodology), 67, 2, 301–320. [CrossRef]
- Cover, T. , & Hart, P. (1967). Nearest neighbor pattern classification. IEEE Transactions on Information Theory 13(1), 21–27. [CrossRef]
- James, G. , Witten, D., Hastie, T., & Tibshirani, R. (2013). An introduction to statistical learning: With applications in R. Springer. [CrossRef]
- Kuhn, M. , & Johnson, K. (2013). Applied predictive modeling. Springer. [CrossRef]
- Waseh, S. , & Lee, J. B. (2023). Advances in melanoma: Epidemiology, diagnosis, and prognosis. Frontiers in Medicine, 10, Article 1268479. [CrossRef]
- Waqar S, George S, Jean-Baptiste W, Yusuf Ali A, Inyang B, Koshy FS, George K, Poudel P, Chalasani R, Goonathilake MR, Mohammed L. Recognizing Histopathological Simulators of Melanoma to Avoid Misdiagnosis. Cureus. 2022 Jun 20;14(6):e26127. [CrossRef] [PubMed]
- Yuan Z, Li Y, Zhang S, Wang X, Dou H, Yu X, Zhang Z, Yang S, Xiao M. Extracellular matrix remodeling in tumor progression and immune escape: from mechanisms to treatments. Mol Cancer. 2023 Mar 11;22(1):48. [CrossRef] [PubMed]
- Mooi, W. , & Krausz, T. (2007). Pathology of melanocytic disorders (2nd ed.). CRC Press. [CrossRef]
- Kuhn, M. , & Johnson, K. (2013). Applied predictive modeling. Springer. [CrossRef]
- James, G. , Witten, D., Hastie, T., & Tibshirani, R. (2013). An introduction to statistical learning: With applications in R. Springer. [CrossRef]
- Esteva A, Chou K, Yeung S, Naik N, Madani A, Mottaghi A, Liu Y, Topol E, Dean J, Socher R. Deep learning-enabled medical computer vision. NPJ Digit Med. 2021 Jan 8;4(1):5. [CrossRef] [PubMed]
- Bechelli S, Delhommelle J. Machine Learning and Deep Learning Algorithms for Skin Cancer Classification from Dermoscopic Images. Bioengineering (Basel). 2022 Feb 27;9(3):97. [CrossRef] [PubMed]
- Kassem, M. A. , Hosny, K. M., Damaševičius, R., & Eltoukhy, M. M. (2021). Machine Learning and Deep Learning Methods for Skin Lesion Classification and Diagnosis: A Systematic Review. Diagnostics, 11(8), 1390. [CrossRef]
- Zou, H. , & Hastie, T. (2005). Regularization and variable selection via the elastic net. Journal of the Royal Statistical Society: Series B (Statistical Methodology), 67(2), 301–320. [CrossRef]
- Addinsoft. (2024). XLSTAT statistical and data analysis solution (Version 2024.1) [Computer software]. https://www.xlstat.
Disclaimer/Publisher’s Note: The statements, opinions and data contained in all publications are solely those of the individual author(s) and contributor(s) and not of MDPI and/or the editor(s). MDPI and/or the editor(s) disclaim responsibility for any injury to people or property resulting from any ideas, methods, instructions or products referred to in the content. |
© 2025 by the authors. Licensee MDPI, Basel, Switzerland. This article is an open access article distributed under the terms and conditions of the Creative Commons Attribution (CC BY) license (http://creativecommons.org/licenses/by/4.0/).
Copyright: This open access article is published under a Creative Commons CC BY 4.0 license, which permit the free download, distribution, and reuse, provided that the author and preprint are cited in any reuse.


