
Submitted:
25 August 2025
Posted:
26 August 2025
You are already at the latest version
Abstract
Background: The definitions and approaches used to diagnose gestational diabetes (GD) are varied. The two-step approach recommended by the American College of Obstetricians and Gynecologists (ACOG) combines the sensitivity of a glucose challenge test (GCT) with the specificity of a 3-hour oral glucose tolerance test (OGTT). We investigated if minor modification of the two-step procedure can provide improved detection of GD by identifying a risk group of pregnant women with high risk of GD. Methods: We conducted a prospective cohort study of pregnant women enrolled early during pregnancy and followed till delivery. All participants underwent the ACOG-recommended two-step procedure for GD diagnosis. Based on GCT and OGTT results, the participants were divided into four risk groups (RG)s: GCT negative (RG0), GCT positive but OGTT normal (RG1), single abnormal value on OGTT or raised HbA1c (RG2) and diagnosed GD (RG3). Baseline evaluation included dietary history (24-hour recall) and physical activity. A series of multivariable logistic regression analyses were conducted to estimate the odds of maternal and fetal outcomes. Results: A total of 1,041 pregnant women were included in the study of who 16 (1.6%) were diagnosed as GD. Our two-step approach identified 48 (4.6%) women as GD while the RG2, RG1 and RG0 groups comprised 75 (7.2%), 218 (20.9%) and 700 (67.2%), respectively. Compared to RG0, the RG2 group showed a higher likelihood of antepartum complications [odds ratio and 95% confidence interval 2.38 (1.16-4.15)], any adverse outcome without [2.04 (1.17-3.55)] or with cesarean section [2.09 (1.21-3.61)], and primary cesarean section [1.68 (1.01-2.81)] after adjustment for potential confounders. The RG2 group was also significantly associated with pregnancy induced hypertension, meconium-stained amniotic fluid and premature rupture of membranes. Conclusions: In the study participants, we identified a subgroup (RG2) at high risk of GD with perinatal outcomes showing profile consistent with that of GD.
Keywords:
gestational diabetes
; epidemiology
; pregnancy outcomes
1. Introduction
Pregnancy induces a wide range of metabolic changes in the mother’s body. Late during pregnancy, there occurs a hypercatabolic state characterized by decreased insulin sensitivity that results in increased levels of maternal glucose and free fatty acid concentrations. [1] While these metabolic changes support fetal growth, there remains a risk of over-catabolism that can result in gestation diabetes (GD). The WHO defines GD as hyperglycemia first detected during pregnancy that does not meet diagnostic criteria for diabetes mellitus.[2] If not detected early and left untreated, GD can lead to adverse outcomes like fetal macrosomia, fetal hypoglycemia and hyper-insulinemia, prematurity, assisted delivery using cesarean section, and preeclampsia.[3,4] Early detection during the asymptomatic phase of GD is thus critical.
The scope and definition of gestational diabetes have suffered due to a lack of uniformity. The diagnostic criteria used to define GD have been recently reviewed by Li-Zhen et al [5] and include a total of 16 different definitions across the world. In the United States, for example, the American College of Obstetricians and Gynecologists (ACOG) recommends a two-step procedure that combines a 1-hour glucose challenge test (GCT) with 50g of glucose load at 24-28 weeks of gestation followed by a 3-hour, 100g oral glucose tolerance test (OGTT) if needed.[6] On the other hand, in India, the National Guidelines recommend a one-step procedure with a 2-hour, 75g OGTT to diagnose GD.[7] It has been shown that using the one-step procedures the prevalence estimates of GD might increase 1.5 to 3 times higher than those estimated using a two-step procedure.[8,9,10,11] This gain in specificity achieved by a two-step procedure, however, comes at the cost of additional screening visits that may not be feasible in low-resource, low-education settings.
A direct consequence of this lack of uniformity is that difficulty in comparing the prevalence of GD across studies. Li et al[12] demonstrated this in an elegant meta-analysis of 90 published studies of gestational diabetes in India. The GD prevalence estimates were consistently and significantly higher in one-step procedures than in two-step procedures. While the one-step procedures may be associated with false-positive identification of GD, the converse that the two-step procedure may be missing cases of GD is also possible. We hypothesized that if the latter is the case, then the two-step procedure recommendation can be further improved to reduce the false-negative error rate without affecting its specificity.
In this study, we investigated a pregnancy cohort in India with the ACOG-recommended two-step procedure and using potentially altered cutoffs, identified an additional GD risk group. Our primary research question was: Can the ACOG criteria be adapted to the Indian setting by including cases at a high risk of GD? To answer this research question, we investigated the prevalence of GD using modified cutoff definitions for GD and then tested the association of the GD risk groups with observed rates of adverse maternal and fetal outcomes.
2. Materials and Methods
Study participants: The Markers of Early Risk-stratification of Gestational Diabetes (MERGD) study (registered with the Clinical Trials Registry – India, CTRI/2018/05/013946) was conducted on all eligible and consenting pregnant women reporting to the Daga Memorial Women’s Hospital, Nagpur. This center is the official enrolment center for the PRIME study[13,14] and the proposed work piggybacked on the PRIME cohort. The study center is a secondary care hospital specializing in obstetric care. Eligibility criteria for inclusion in the MERGD study were: consecutive, newly registered pregnant women at the Study Center; gestational age at first contact <20 weeks, no history of type 2 diabetes, and providing a written, Informed consent. All study participants were enrolled between 21 May 2018 and 11 Aug 2018. Follow-up for all outcomes assessment ended with delivery as the endpoint. Last date of follow-up was 22 Feb 2019. This study was approved by the Ethics Research Committee of the Lata Medical Research Foundation, Nagpur, India (Protocol RPC#29, approved June 9, 2018).
Study protocol: The study protocol for the MERGD study is shown in Figure 1. Eligible pregnant women were first interviewed at the initial study visit. Interview included information on socio-demographics, and past obstetric history. After the interview, a
blood sample was drawn. This was used for lipid profiling and HbA1c measurement. This initial non-fasting sample was based on a 2ml draw of blood in EDTA tubes for HbA1c estimation and another 2ml for lipid profile studies. Further, we stored 10ml of blood in K3EDTA tubes for subsequent plasma studies and 10ml of blood in plain tubes for subsequent serum studies and genetic studies. Blood samples were collected in a single prick using Vacutainer technology. Enrolled participants were then invited for a GCT between 24-28 weeks of gestation. The GCT was conducted in a non-fasting state and was followed by a detailed dietary history using a 24-hour recall method and assessment of physical activity using an investigator-administered instrument. Patients with GCT response ≥200 mg/dl were considered as GD. Those with GCT response between 130 and 200 mg/dl were invited for a 3-hour OGTT with 100g glucose load. In the approved study protocol, diagnosis of GD was done using the National Diabetes Data Group (NDDG) criteria[15] which are as any two abnormal values from the following: fasting – >105 mg/dl, one hour – >190 mg/dl, two hour – >165 mg/dl and three hour – >145 mg/dl. All GD patients received standard-of-care GD treatment till the end of pregnancy. For the GCT and OGTT, we collected 2 ml blood samples in Flouride/Oxalate bottles for glucose measurements. These samples were transported within 6 hours of collection to the study laboratory while maintaining a temperature of 4°C with icepacks. All assays related to this study were conducted at the study laboratory (Dhruv Pathology and Molecular Diagnostic Laboratory, Laxminagar, Nagpur). All the study participants were followed till delivery to measure maternal and fetal outcomes. The outcomes included: maternal morbidity, maternal mortality, still births, prematurity, post-maturity, intrauterine growth retardation, birth weight, gestational age at birth based on USG, macrosomia and early neonatal deaths.
Diagnostic criteria for gestational diabetes: To answer our primary research question, we used the ACOG two-step process with the following diagnostic criteria: The first step included a 50g glucose load, 1-hour GCT in which a cutoff of 130 mg/dl (7.2 mmol/L) was used to decide the need for OGTT. The second step was carried out in women who showed an abnormal GCT value and included a 100g glucose load OGTT. The second step used a 100g glucose load for a 3-hour OGTT. Abnormal glucose values were investigated at the time of glucose load (fasting) and then hourly post glucose load. Out of these four blood glucose estimations presence of 2 or more abnormal values was defined as GD. To define abnormal values, we used the Carpenter-Coustan (C&C) criteria[16] as well as the NDDG criteria mentioned above. The C&C criteria used were as follows: fasting – ≥95 mg/dl (5.28 mmol/L); 1-hour – ≥180 mg/dl (10.0 mmol/L); 2-hours – ≥155 mg/dl; and 3-hours – ≥140 mg/dl (7.78 mmol/L).
Dietary assessment: The assessment of dietary intake was done at the time of Glucose Challenge Test (24-28 weeks). Dietary assessment was done with an aim to quantify the macronutrient intake at the time of initial enrolment. This was done using a 24-hour recall method at the time of first clinic visit. Dietary information was collected in accordance with the USFDA Automated Multi-Pass Method (AMPM) approach[17] with a dedicated Excel®-based routine. Dietary information was collected by trained research staff who administered the structured questionnaire to the participants. Information was collected on timing, food eaten, standardized (using commonly used weight and volume measures) portion sizes and units consumed. This information was then converted to a total daily intake of calories, proteins, fats, carbohydrates, fiber, calcium and iron. For raw foods, the estimations were derived using the information tables from the Nutritive Value of Indian Foods.[18] For cooked foods, the recipe nutritive value was derived from the Nutritionix Database (https://www.nutritionix.com/).
Assessment of physical activity: Assessment of physical activity was done at the time of Glucose Challenge Test using an investigator-administered questionnaire. This was done using the PPAQ instrument (developed by Dr Lisa Chasen-Taber, University of Massachusetts, Amherst)[19] and adapted to Indian settings.[20] Participants were asked to select the category that best approximated the amount of time spent in 32 activities including household/caregiving, occupational, sports/exercise, and inactivity during the current trimester. At the end of the PPAQ, an open-ended section allowed the respondent to add activities not already listed. Excel® based macros were written to estimate the duration and intensity of each activity. These estimates were then used to calculate the metabolic equivalents (METs per week) for each group of activities as well as the total activity.
Statistical analyses: Descriptive statistics included mean (standard deviation) for continuous variables and numbers (%) for categorical variables. The statistical significance of continuous variables across the GD risk groups was tested using the Kruskal-Wallis test while that for categorical variables was tested using Pearson’s chi-square test. Association of the GD risk groups with maternal and fetal outcomes was tested using logistic regression models adjusted for age, BMI, total cholesterol, triglycerides, HDL, LDL, VLDL, systolic and diastolic blood pressure, heart rate, total calories, fats, proteins, carbohydrates, fiber, iron, calcium and water intake and total weekly METs. To quantify the potential, unmeasured, residual confounding, we used the results from the multivariable logistic regression analyses and estimated the e-value[21] for each outcome studied. Statistical significance was tested at a type I error rate of 0.05. All statistical analyses were conducted using Stata 14 statistical package (Stata Corp, College Station, TX).
3. Results
Study participants and GD risk groups
A total of 2,121 pregnant women who reported to the study center during the study period were screened for eligibility. From this pool, we enrolled 1,041 eligible pregnant women who fulfilled the eligibility criteria mentioned earlier. The mean (SD) ultrasonographically estimated gestational age at enrollment was 12.65 (3.58) weeks. The age of the participants ranged from 19y to 40y with a mean (SD) of 25.42 (4.03) years. Of the enrolled participants 479 (46%) were nulliparous.
Based on the results of GCT, OGTT and HbA1c we created a total of four GD risk groups as shown in Figure 2. Lowest risk of GD was attributed to the GCT negative women (denoted as RG0), while the GCT positive women were further divided into the three remaining risk groups. Women who were GCT positive but had all normal values in OGTT and normal HbA1c (<6.5%) were classified as RG1; women with GCT positive result followed by a single abnormal value on OGTT or those with increased HbA1c values were classified as RG2 while those who fulfilled the ACOG to-step procedure with C&C criteria were classified as RG3. Only 16 women were positive for GD using the NGGD criteria and were a subgroup within RG3.
We found (Figure 2) that 67.2%, 20.9%, 7.2% and 4.6% of the study participants belonged to RG0, RG1, RG2 and RG3 groups, respectively. The RG2 group comprised of 50 women who had only a single abnormal value on the OGTT and 25 women who had HbA1c values ≥6.5%. Of the women who had only a single abnormal value on OGTT, 28 (56.0%) had isolated impaired fasting glucose.
Baseline characteristics by GD risk groups
Table 1 details the baseline characteristics of the study participants based on their membership of the GD risk groups. We found that the mean maternal age at enrolment was significantly higher (by ~2 years) in the RG3 group as compared to the remaining groups (P=0.0001). Also, the proportion of women with a family income <INR 100,000 per annum was higher in the RG3 group (p=0.0228). Of note, the body mass index (BMI) showed a steady increase across the GD risk groups such that the mean BMI in the RG0 group was 21.31 kg/m2 while that in the RG3 group was 23.66 kg/m2 (Kruskal-Wallis P=0.0010). Concordantly, the proportion of women with obesity (defined using Asia-specific cutoff[22] of 27.5 Kg/m2) was lowest in the RG0 group (6.4%) and highest in the RG3 group (22.9%, p = 0.0005). Also, both mean systolic and mean diastolic blood pressures were significantly higher in the RG3 group as compared to the RG0 group with intermediate values in the RG1/RG2 groups (P=4.4x10⁻⁶ and P=3.4x10⁻⁸, respectively). Finally, the blood lipid profile showed that women in the RG3 group had significantly higher serum triglycerides (TG) and serum very low density lipoprotein (VLDL) concentration (P=0.0001 for both assays). Except for these differences, the participants across GD risk groups were comparable with respect to gestational age at enrollment, obstetric history, proportion of singleton pregnancies, maternal education, caste, and religion.
Lifestyle factors by GD groups
The results of these analyses are shown in Table 2. The dietary characteristics showed that the total calories, proteins, carbohydrates, fats, calcium and water consumed per day were comparable across the GD risk groups. Interestingly, dietary iron intake and total dietary fiber intake were marginally higher in the RG3 group as compared to the remaining GD risk groups. On the other hand, the metabolic equivalents (METs) expended per week in total and in various subcategories were comparable across the GD risk groups. These observations indicated that at the time of administration of the GCT, the dietary and physical activity characteristics of the study participants did not significantly differ across the GD risk groups.
Association of GD risk groups with maternal and fetal outcomes
Supplementary Table S1 shows the distribution of the observed, unadjusted maternal and fetal outcomes across the GD risk groups. There was a significantly high proportion (>61%) of women in the RG2 and RG3 groups with antepartum maternal complications other than GDM. Also, the proportion of women in the RG2 group with intrapartum maternal outcomes was higher as compared to the rest of the GD groups. However, the postpartum maternal adverse outcomes were relatively rare (<1.5%) and comparable across GD risk groups. Indeed, the proportion of women with high risk pregnancy was 30% in RG0 group, ~39% in the RG2 group and ~48% in the RG3 group (P=0.0074). Together, these results indicated an increased risk of antepartum and intrapartum maternal adverse outcomes in RG2 and RG3 groups. With regards the fetal outcomes, prematurity was commonest in the RG3 group ~33% but relatively uncommon in RG0 and RG2 groups (~14% each). Interestingly, the proportion of fetuses with high birth weight was ~16% in RG2/RG3 groups compared to that in RG0/RG1 groups (~10%, P = 0.05). However, the proportion of post mature births was comparable across the GD risk groups. Of the most observed fetal outcomes, meconium stained amniotic fluid (MSAF, ~11%), premature rupture of membranes (PROM, 8%), and fetal distress (~11%) were higher in the RG2 as compared to all other risk groups. Detailed description of all fetal and maternal outcomes observed is given in Supplementary Table S2. It is noteworthy that the proportion of women in the RG2 and RG3 groups who had coexisting pregnancy induced hypertension (PIH) was higher than that in the RG0 and RG1 groups (20% versus 15%).
The results of adjusted logistic regression models for each outcome of interest are shown in Figure 3. We found that compared to the reference group of GCT negative women, the RG2 group was consistently and significantly associated with a higher risk of antepartum complications (p = 0.002), a composite outcome indicating presence of any adverse outcome (p = 0.012), any adverse outcome including Cesarean section (P = 0.008) and primary Cesarean section (p = 0.46). Further, the RG2 group showed marginally significant association with a high risk of intra-partum complications, high birth weight and Cesarean section (p = 0.067, 0.106 and 0.095, respectively). Interestingly, the RG3 group showed a significant association with only two outcomes: antepartum complications (p = 0.029) and premature births (p = 0.012). In total, these observations demonstrated a significantly increased risk of adverse outcomes associated with the RG2 group. Using these results, we estimated the e-values for the outcomes with which a significant association of GD risk groups was observed (antepartum complications, any adverse outcome, any adverse outcome with cesarean section and primary cesarean section). The e-values for these outcomes were: 2.52, 2.29, 2.22, and 1.88, respectively.
4. Discussion
In this study, based on a single abnormal value in OGTT or raised HbA1c concentration we identified a subgroup of pregnant women who were not diagnosed as GD but were at a high risk of GD (the RG2 group). Since these women were not diagnosed as GD they received routine antenatal care and consequently were associated with a higher risk of maternal and fetal adverse outcomes. If the diagnostic criteria in the 3-hour OGTT were based on a single (as against two abnormal values as recommended in the C&C criteria), then our study could have identified a higher number of potential GD cases. Of the 75 women in the RG2 group, 33 (42%) had a high HbA1c at 24-28 weeks of gestation without a clear history of type 2 diabetes diagnosis or treatment previously. Since HbA1c reflects overall glycemia levels over previous three months, it is possible, in part, that the raised HbA1c levels were related to dysglycemia during the current pregnancy. Together, we identified a subset of pregnant women at an increased risk of GD by more accommodative and relaxed criteria.
The two-step diagnostic protocol for GD attempts to combine the high sensitivity of GCT (using a low threshold of 130 mg/dl) with the high specificity of OGTT. However, the need for at least two abnormal values on OGTT implicitly eliminates the importance of isolated impaired fasting glucose in the pathogenesis of GD. Ryan et al[23] and Kaul et al[24] have demonstrated through large-scale population studies that impaired fasting glucose is a stronger predictor of large-for-gestational-age infants and hypertension during pregnancy as compared to women with impaired glucose tolerance only. These observations corroborate the findings from an elegant, large meta-analysis[25] that demonstrated the importance of a single abnormal value on OGTT as a significant predictor of poor pregnancy outcomes. Our results agree with this contention and demonstrate that the yield of GCT is likely to be enriched if the OGTT uses a relaxed criterion of a single abnormal value as diagnostic of GD.
The pattern of association observed in our study indicated that compared to the GCT negative (RG0) group, women in the RG2 group were at a higher risk of antepartum complications, primary caesarean section, any adverse outcome and any adverse outcome with caesarean section. Also, from among the fetal outcomes, we observed that MSAF and PROM were most common in the RG2 group as compared to other GD groups. These observations are in line with the known risks associated with untreated gestational diabetes. [26,27,28,29,30] Further, the proportion of women with PIH in the RG2 group was higher than that in the RG0 and Rg1 groups. Together, these results indicate that the pattern of perinatal outcomes observed in the RG2 group mimicked that known to be associated with untreated gestational diabetes. Of note, the RG3 group was significantly associated with an increased risk of antepartum complications and premature births. While the association of RG3 with antepartum complications is in line with expectations, the association with premature births can be explained by the corroborating observations that GD cases tend to be treated with early induction especially if there are coexisting complications like PIH.[31,32,33,34] Consistently, within the RG3 group, those patients who were diagnosed as GD using the NDDG criteria had higher rates of adverse events, primary caesarean section, antepartum complications and premature births as compared to the rest of the RG3 group (Supplementary Figure S1). Contrasting the pattern of association of the RG3 and RG2 groups with the perinatal outcomes in this study supports the hyposthesis that the RG2 group comprised of women in whom early identification of GD could have been possible.
Our study has some limitations. First, observational data – like the one studied here – cannot be used to infer causality. All the observations made here should therefore be considered evidence of association and not causality. A causal association between the RG2 group and adverse perinatal outcomes needs to be evaluated in well-designed and controlled settings. Second, the intricate interplay of coexisting conditions and their treatments on the perinatal outcomes can confound the interpretations of associations. We conducted logistic regression analyses that adjusted for the potential confounders, however the potential for unmeasured residual confounding cannot be refuted. The estimated e-values indicated that the unmeasured confounder will need to have an association strength of approximately two or more to be able to influence and confound the observed association. The covariates listed in Table 1 however indicate that the possibility of missing out on such a strongly associated confounder is low. Third, we used the ACOG recommended two-step procedure with a 3-hour OGTT based on 100g glucose load. The national practice in India is to use a 2-hour OGTT with 75g glucose load.[7] Therefore, a direct comparison of the incidence of GD in our study sample by the two-step and one-step procedures is not possible.
5. Conclusions
Notwithstanding these limitations, our results point to a potential for early diagnosis of gestational diabetes using the ACOG recommended procedure and the C&C diagnostic criteria. In the ongoing debate[11,35,36,37,38,39,40] about the generally accepted cost-effectiveness superiority of the two-step versus one-step procedure for GD diagnosis, it needs to be brought out that the two-step process can yield more meaningful results by simple modification of the diagnostic criteria. To that end, this study demonstrates the potential to improve early diagnosis of GD by including a single abnormal value and HbA1c concentration at the time of OGTT. Larger, controlled studies are needed to definitively address the comparative effectiveness of various GD diagnostic approaches.
Supplementary Materials
The following supporting information can be downloaded at the website of this paper posted on Preprints.org, Figure S1: Comparison of the incidence of outcomes within the RG3 group based on NDDG criteria; Table S1: Distribution of maternal and fetal outcomes based on gestational diabetes status, MERGD 2018; and Table S2: Maternal and fetal outcomes observed in the MERGD study.
Author Contributions
MM, HK – Concept, study design, data collection, statistical analysis, writing original draft; KK, ABP – study design, data collection, manuscript review; AP, MJ, KP, SB, SP, VK – data collection, manuscript review; PKD – study design, manuscript review; SM – laboratory studies, manuscript review. The authors have reviewed and edited the output and take full responsibility for the content of this publication.
Funding
This research was intramurally funded by the Lata Medical Research Foundation, Nagpur, India.
Institutional Review Board Statement
The study was conducted in accordance with the Declaration of Helsinki, and approved by the Ethics Research Committee of the Lata Medical Research Foundation, Nagpur, India (Protocol RPC#29, approved June 9, 2018).
Informed Consent Statement
Written informed consent was obtained from all subjects involved in the study.
Data Availability Statement
The data that support the findings of this study are not publicly available since restrictions apply to the availability of these data as outlined in the recommendations of the Ethics Research Committee of the Lata Medical research Foundation, Nagpur, India. Data are, however, available from the authors upon reasonable request and with permission from the Ethics Research Committee of the Lata Medical Research Foundation, Nagpur, India.
Acknowledgments
The authors are indebted to the data collection team which included Dr. Abhishek Dagamwar, Mayuri Parate, Chaitali Gedam, Nargis Kausar, Jyotsna Bansod and Monali Chachere from the Lata Medical Research Foundation, Nagpur, India. The authors also gratefully appreciate the administrative support from Smita Puppalwar, Shilpa Pawar (Lata Medical Research Foundation, Nagpur, India); from Dr. Madhuri Thorat and Dr. Sulbha Mool (Daga Memorial Women’s Hospital, Nagpur); and from Dr. Madhavi Deshmukh (Dhruv Pathology and Molecular Diagnostic Laboratory, Nagpur, India).
Conflicts of Interest
The authors declare no conflicts of interest.
Abbreviations
The following abbreviations are used in this manuscript:
| ACOG | American College of Obstetrics and Gynecology |
| AMPM | Automated Multi-Pass Method |
| BMI | Body mass index |
| C&C | Carpenter-Coustan |
| GCT | Glucose Challenge Test |
| GD | Gestational Diabetes |
| HDL | High density lipoprotein |
| LDL | Low density lipoprotein |
| MERGD | Markers of Early Risk-stratification of Gestational Diabetes |
| MET | Metabolic equivalents |
| NDDG | National Diabetes Data Group |
| OGTT | Oral Glucose Tolerance Test |
| PPAQ | Pregnancy Physical Activity Questionnaire |
| TG | Triglycerides |
| VLDL | Very low density lipoprotein |
| WHO | World Health Organization |
References
- Lain, K.Y.; Catalano, P.M. Metabolic changes in pregnancy. Clinical obstetrics and gynecology. 2007, 50, 938–948. [Google Scholar] [CrossRef] [PubMed]
- WHO Diagnostic criteria and classification of hyperglycaemia first detected in pregnancy; World Health Organization: Geneva, 2013.
- Group, H.S.C.R. Hyperglycemia and Adverse Pregnancy Outcome (HAPO) Study: associations with neonatal anthropometrics. Diabetes. 2009, 58, 453–459. [Google Scholar] [CrossRef] [PubMed] [PubMed Central]
- Group, H.S.C.R.; Metzger, B.E.; Lowe, L.P.; Dyer, A.R.; Trimble, E.R.; Chaovarindr, U.; Coustan, D.R.; Hadden, D.R.; McCance, D.R.; Hod, M.; McIntyre, H.D.; Oats, J.J.; Persson, B.; Rogers, M.S.; Sacks, D.A. Hyperglycemia and adverse pregnancy outcomes. The New England journal of medicine. 2008, 358, 1991–2002. [Google Scholar] [CrossRef] [PubMed]
- Li-Zhen, L.; Yun, X.; Xiao-Dong, Z.; Shu-Bin, H.; Zi-Lian, W.; Adrian Sandra, D.; Bin, L. Evaluation of guidelines on the screening and diagnosis of gestational diabetes mellitus: systematic review. BMJ open. 2019, 9, e023014. [Google Scholar] [CrossRef] [PubMed] [PubMed Central]
- ACOG Practice Bulletin No. 190: Gestational Diabetes Mellitus. Obstetrics and gynecology. 2018, 131, e49–e64. [CrossRef] [PubMed]
- Mohan, V.; Usha, S.; Uma, R. Screening for gestational diabetes in India: Where do we stand? Journal of postgraduate medicine. 2015, 61, 151–154. [Google Scholar] [CrossRef] [PubMed] [PubMed Central]
- Coustan, D.R.; Lowe, L.P.; Metzger, B.E.; Dyer, A.R.; International Association of, D.; Pregnancy Study, G. The Hyperglycemia and Adverse Pregnancy Outcome (HAPO) study: paving the way for new diagnostic criteria for gestational diabetes mellitus. American journal of obstetrics and gynecology. 2010, 202, 654–e1. [Google Scholar] [CrossRef] [PubMed] [PubMed Central]
- Langer, O.; Umans, J.G.; Miodovnik, M. Perspectives on the proposed gestational diabetes mellitus diagnostic criteria. Obstetrics and gynecology. 2013, 121, 177–182. [Google Scholar] [CrossRef] [PubMed]
- Bodmer-Roy, S.; Morin, L.; Cousineau, J.; Rey, E. Pregnancy outcomes in women with and without gestational diabetes mellitus according to the International Association of the Diabetes and Pregnancy Study Groups criteria. Obstetrics and gynecology. 2012, 120, 746–752. [Google Scholar] [CrossRef] [PubMed]
- Fuller, K.P.; Borgida, A.F. Gestational diabetes mellitus screening using the one-step versus two-step method in a high-risk practice. Clinical diabetes : a publication of the American Diabetes Association. 2014, 32, 148–150. [Google Scholar] [CrossRef] [PubMed] [PubMed Central]
- Li, K.T.; Naik, S.; Alexander, M.; Mathad, J.S. Screening and diagnosis of gestational diabetes in India: a systematic review and meta-analysis. Acta diabetologica. 2018, 55, 613–625. [Google Scholar] [CrossRef] [PubMed] [PubMed Central]
- Dawood FS, Hunt D, Patel A, Kittikraisak W, Tinoco Y, Kurhe K, Soto G, Hombroek D, Garg S, Chotpitayasunondh T, Gonzales O, Bhargav S, Thompson MG, Chotpitayasunondh B, Florian R, Prakash A, Arriola S, Macareo L, Das P, Cabrera S, La Rosa S, Azziz-Baumgartner E, Pregnancy, Influenza Multinational Epidemiologic Study Working G. The Pregnancy and Influenza Multinational Epidemiologic (PRIME) study: a prospective cohort study of the impact of influenza during pregnancy among women in middle-income countries. Reproductive health. 2018, 15, 159. [CrossRef] [PubMed] [PubMed Central]
- Dawood, F.S.; Kittikraisak, W.; Patel, A.; Rentz Hunt, D.; Suntarattiwong, P.; Wesley, M.G.; Thompson, M.G.; Soto, G.; Mundhada, S.; Arriola, C.S.; Azziz-Baumgartner, E.; Brummer, T.; Cabrera, S.; Chang, H.H.; Deshmukh, M.; Ellison, D.; Florian, R.; Gonzales, O.; Kurhe, K.; Kaoiean, S.; Rawangban, B.; Lindstrom, S.; Llajaruna, E.; Mott, J.A.; Saha, S.; Prakash, A.; Mohanty, S.; Sinthuwattanawibool, C.; Tinoco, Y. Incidence of influenza during pregnancy and association with pregnancy and perinatal outcomes in three middle-income countries: a multisite prospective longitudinal cohort study. The Lancet Infectious diseases. 2021, 21, 97–106. [Google Scholar] [CrossRef] [PubMed]
- American Diabetes, A. 2. Classification and Diagnosis of Diabetes: Standards of Medical Care in Diabetes-2018. Diabetes care 2018, 41, S13–S27. [Google Scholar] [CrossRef] [PubMed]
- Carpenter, M.W.; Coustan, D.R. Criteria for screening tests for gestational diabetes. American journal of obstetrics and gynecology. 1982, 144, 768–773. [Google Scholar] [CrossRef] [PubMed]
- Raper, N.R.; Perloff, B.; Ingwersen, L.; Steinfeldt, L.; Anand, J. An overview of USDA's dietary intake data system. J Foof Compos Anal. 2004, 17, 545–555. [Google Scholar] [CrossRef]
- Gopalan, C.; Rama Sastri, B.V.; Balasubramanian, S.C. Nutritive value of Indian Foods; National Institute of Nutrition: Hyderabad, India, 2012. [Google Scholar]
- Chasan-Taber, L.; Schmidt, M.D.; Roberts, D.E.; Hosmer, D.; Markenson, G.; Freedson, P.S. Development and validation of a Pregnancy Physical Activity Questionnaire. Medicine and science in sports and exercise. 2004, 36, 1750–1760. [Google Scholar] [CrossRef] [PubMed]
- Chowdhury Salian, S.; Singh, J. Reliability and validity of the Indian version of the Pregnancy Physical Activity Questionnaire (PPAQ). Int J Curr Res Modern Ed. 2017, 2, 89–92. [Google Scholar]
- VanderWeele, T.J.; Ding, P. Sensitivity Analysis in Observational Research: Introducing the E-Value. Annals of internal medicine. 2017, 167, 268–274. [Google Scholar] [CrossRef] [PubMed]
- Consultation, W.H.O.E. Appropriate body-mass index for Asian populations and its implications for policy and intervention strategies. Lancet. 2004, 363, 157–163. [Google Scholar] [CrossRef] [PubMed]
- Ryan, E.A.; Savu, A.; Yeung, R.O.; Moore, L.E.; Bowker, S.L.; Kaul, P. Elevated fasting vs post-load glucose levels and pregnancy outcomes in gestational diabetes: a population-based study. Diabetic medicine : a journal of the British Diabetic Association. 2020, 37, 114–122. [Google Scholar] [CrossRef] [PubMed]
- Kaul, P.; Savu, A.; Yeung, R.O.; Ryan, E.A. Association between maternal glucose and large for gestational outcomes: Real-world evidence to support Hyperglycaemia and Adverse Pregnancy Outcomes (HAPO) study findings. Diabetic medicine : a journal of the British Diabetic Association. 2022, 39, e14786. [Google Scholar] [CrossRef] [PubMed]
- Roeckner, J.T.; Sanchez-Ramos, L.; Jijon-Knupp, R.; Kaunitz, A.M. Single abnormal value on 3-hour oral glucose tolerance test during pregnancy is associated with adverse maternal and neonatal outcomes: a systematic review and metaanalysis. American journal of obstetrics and gynecology. 2016, 215, 287–297. [Google Scholar] [CrossRef] [PubMed]
- Levin, G.; Tsur, A.; Shai, D.; Cahan, T.; Shapira, M.; Meyer, R. Prediction of adverse neonatal outcome among newborns born through meconium-stained amniotic fluid. International journal of gynaecology and obstetrics: the official organ of the International Federation of Gynaecology and Obstetrics. 2021, 154, 515–520. [Google Scholar] [CrossRef] [PubMed]
- Oral, S.; Celik, S.; Akpak, Y.K.; Golbasi, H.; Bayraktar, B.; Unver, G.; Sahin, S.; Yurtcu, N.; Soyer Caliskan, C. Prediction of gestational diabetes mellitus and perinatal outcomes by plasma zonulin levels. Archives of gynecology and obstetrics 2022. [Google Scholar] [CrossRef] [PubMed]
- Modzelewski, R.; Stefanowicz-Rutkowska, M.M.; Matuszewski, W.; Bandurska-Stankiewicz, E.M. Gestational Diabetes Mellitus-Recent Literature Review. Journal of clinical medicine 2022, 11. [Google Scholar] [CrossRef] [PubMed] [PubMed Central]
- Ye, W.; Luo, C.; Huang, J.; Li, C.; Liu, Z.; Liu, F. Gestational diabetes mellitus and adverse pregnancy outcomes: systematic review and meta-analysis. . 2022;377:e067946. Epub 2022/05/26. Bmj 2022, 377, e067946, at www.icmje.org/disclosure-of-interest/ and declare: support from the National Natural Science Foundation of China and the Natural Science Foundation for Young Scientist of Hunan Province, China for the submitted work; no financial relationships with any organisations that might have an interest in the submitted work in the previous three years; no other relationships or activities that could appear to have influenced the submitted work. [Google Scholar] [CrossRef] [PubMed]
- Liu, H.; Liu, J. Improved support vector machine algorithm based on the influence of Gestational Diabetes Mellitus on the outcome of perinatal outcome by ultrasound imaging. Pakistan journal of medical sciences. 2021, 37, 1625–1629. [Google Scholar] [CrossRef] [PubMed] [PubMed Central]
- Xu, H.; Arkema, E.V.; Cnattingius, S.; Stephansson, O.; Johansson, K. Gestational weight gain and delivery outcomes: A population-based cohort study. Paediatric and perinatal epidemiology. 2021, 35, 47–56. [Google Scholar] [CrossRef] [PubMed]
- Glazer, K.B.; Danilack, V.A.; Field, A.E.; Werner, E.F.; Savitz, D.A. Term Labor Induction and Cesarean Delivery Risk among Obese Women with and without Comorbidities. American journal of perinatology. 2022, 39, 154–164. [Google Scholar] [CrossRef] [PubMed]
- Pouliot, A.; Elmahboubi, R.; Adam, C. Incidence and Outcomes of Gestational Diabetes Mellitus Using the New International Association of Diabetes in Pregnancy Study Group Criteria in Hopital Maisonneuve-Rosemont. Canadian journal of diabetes. 2019, 43, 594–599. [Google Scholar] [CrossRef] [PubMed]
- Lennestal, R.; Otterblad Olausson, P.; Kallen, B. Maternal use of antihypertensive drugs in early pregnancy and delivery outcome, notably the presence of congenital heart defects in the infants. European journal of clinical pharmacology. 2009, 65, 615–625. [Google Scholar] [CrossRef] [PubMed]
- Ramezani Tehrani, F.; Rahmati, M.; Farzadfar, F.; Abedini, M.; Farahmand, M.; Hosseinpanah, F.; Hadaegh, F.; Torkestani, F.; Valizadeh, M.; Azizi, F.; Behboudi-Gandevani, S. One-step versus two-step screening for diagnosis of gestational diabetes mellitus in Iranian population: A randomized community trial. Frontiers in endocrinology 2022, 13, 1039643. [Google Scholar] [CrossRef] [PubMed] [PubMed Central]
- Zera, C.A.; Seely, E.W. Controversies in Gestational Diabetes. TouchREVIEWS in endocrinology. 2021, 17, 102–107. [Google Scholar] [CrossRef] [PubMed] [PubMed Central]
- Saccone, G.; Khalifeh, A.; Al-Kouatly, H.B.; Sendek, K.; Berghella, V. Screening for gestational diabetes mellitus: one step versus two step approach. A meta-analysis of randomized trials. The journal of maternal-fetal & neonatal medicine : the official journal of the European Association of Perinatal Medicine, the Federation of Asia and Oceania Perinatal Societies, the International Society of Perinatal Obstet. 2020, 33, 1616–1624. [Google Scholar] [CrossRef] [PubMed]
- Khalifeh, A.; Eckler, R.; Felder, L.; Saccone, G.; Caissutti, C.; Berghella, V. One-step versus two-step diagnostic testing for gestational diabetes: a randomized controlled trial. The journal of maternal-fetal & neonatal medicine : the official journal of the European Association of Perinatal Medicine, the Federation of Asia and Oceania Perinatal Societies, the International Society of Perinatal Obstet. 2020, 33, 612–617. [Google Scholar] [CrossRef] [PubMed]
- Brown, F.M.; Wyckoff, J. Application of One-Step IADPSG Versus Two-Step Diagnostic Criteria for Gestational Diabetes in the Real World: Impact on Health Services, Clinical Care, and Outcomes. Current diabetes reports. 2017, 17, 85. [Google Scholar] [CrossRef] [PubMed] [PubMed Central]
- Sevket, O.; Ates, S.; Uysal, O.; Molla, T.; Dansuk, R.; Kelekci, S. To evaluate the prevalence and clinical outcomes using a one-step method versus a two-step method to screen gestational diabetes mellitus. The journal of maternal-fetal & neonatal medicine : the official journal of the European Association of Perinatal Medicine, the Federation of Asia and Oceania Perinatal Societies, the International Society of Perinatal Obstet. 2014, 27, 36–41. [Google Scholar] [CrossRef] [PubMed]
Figure 1.
Diagnostic protocol used in the study for identification of gestational diabetes. GA (USG), ultrasonographic estimate of gestational age; BG, blood glucose; GD, gestational diabetes; NDDG, National Diabetes Data Group.
Figure 1.
Diagnostic protocol used in the study for identification of gestational diabetes. GA (USG), ultrasonographic estimate of gestational age; BG, blood glucose; GD, gestational diabetes; NDDG, National Diabetes Data Group.
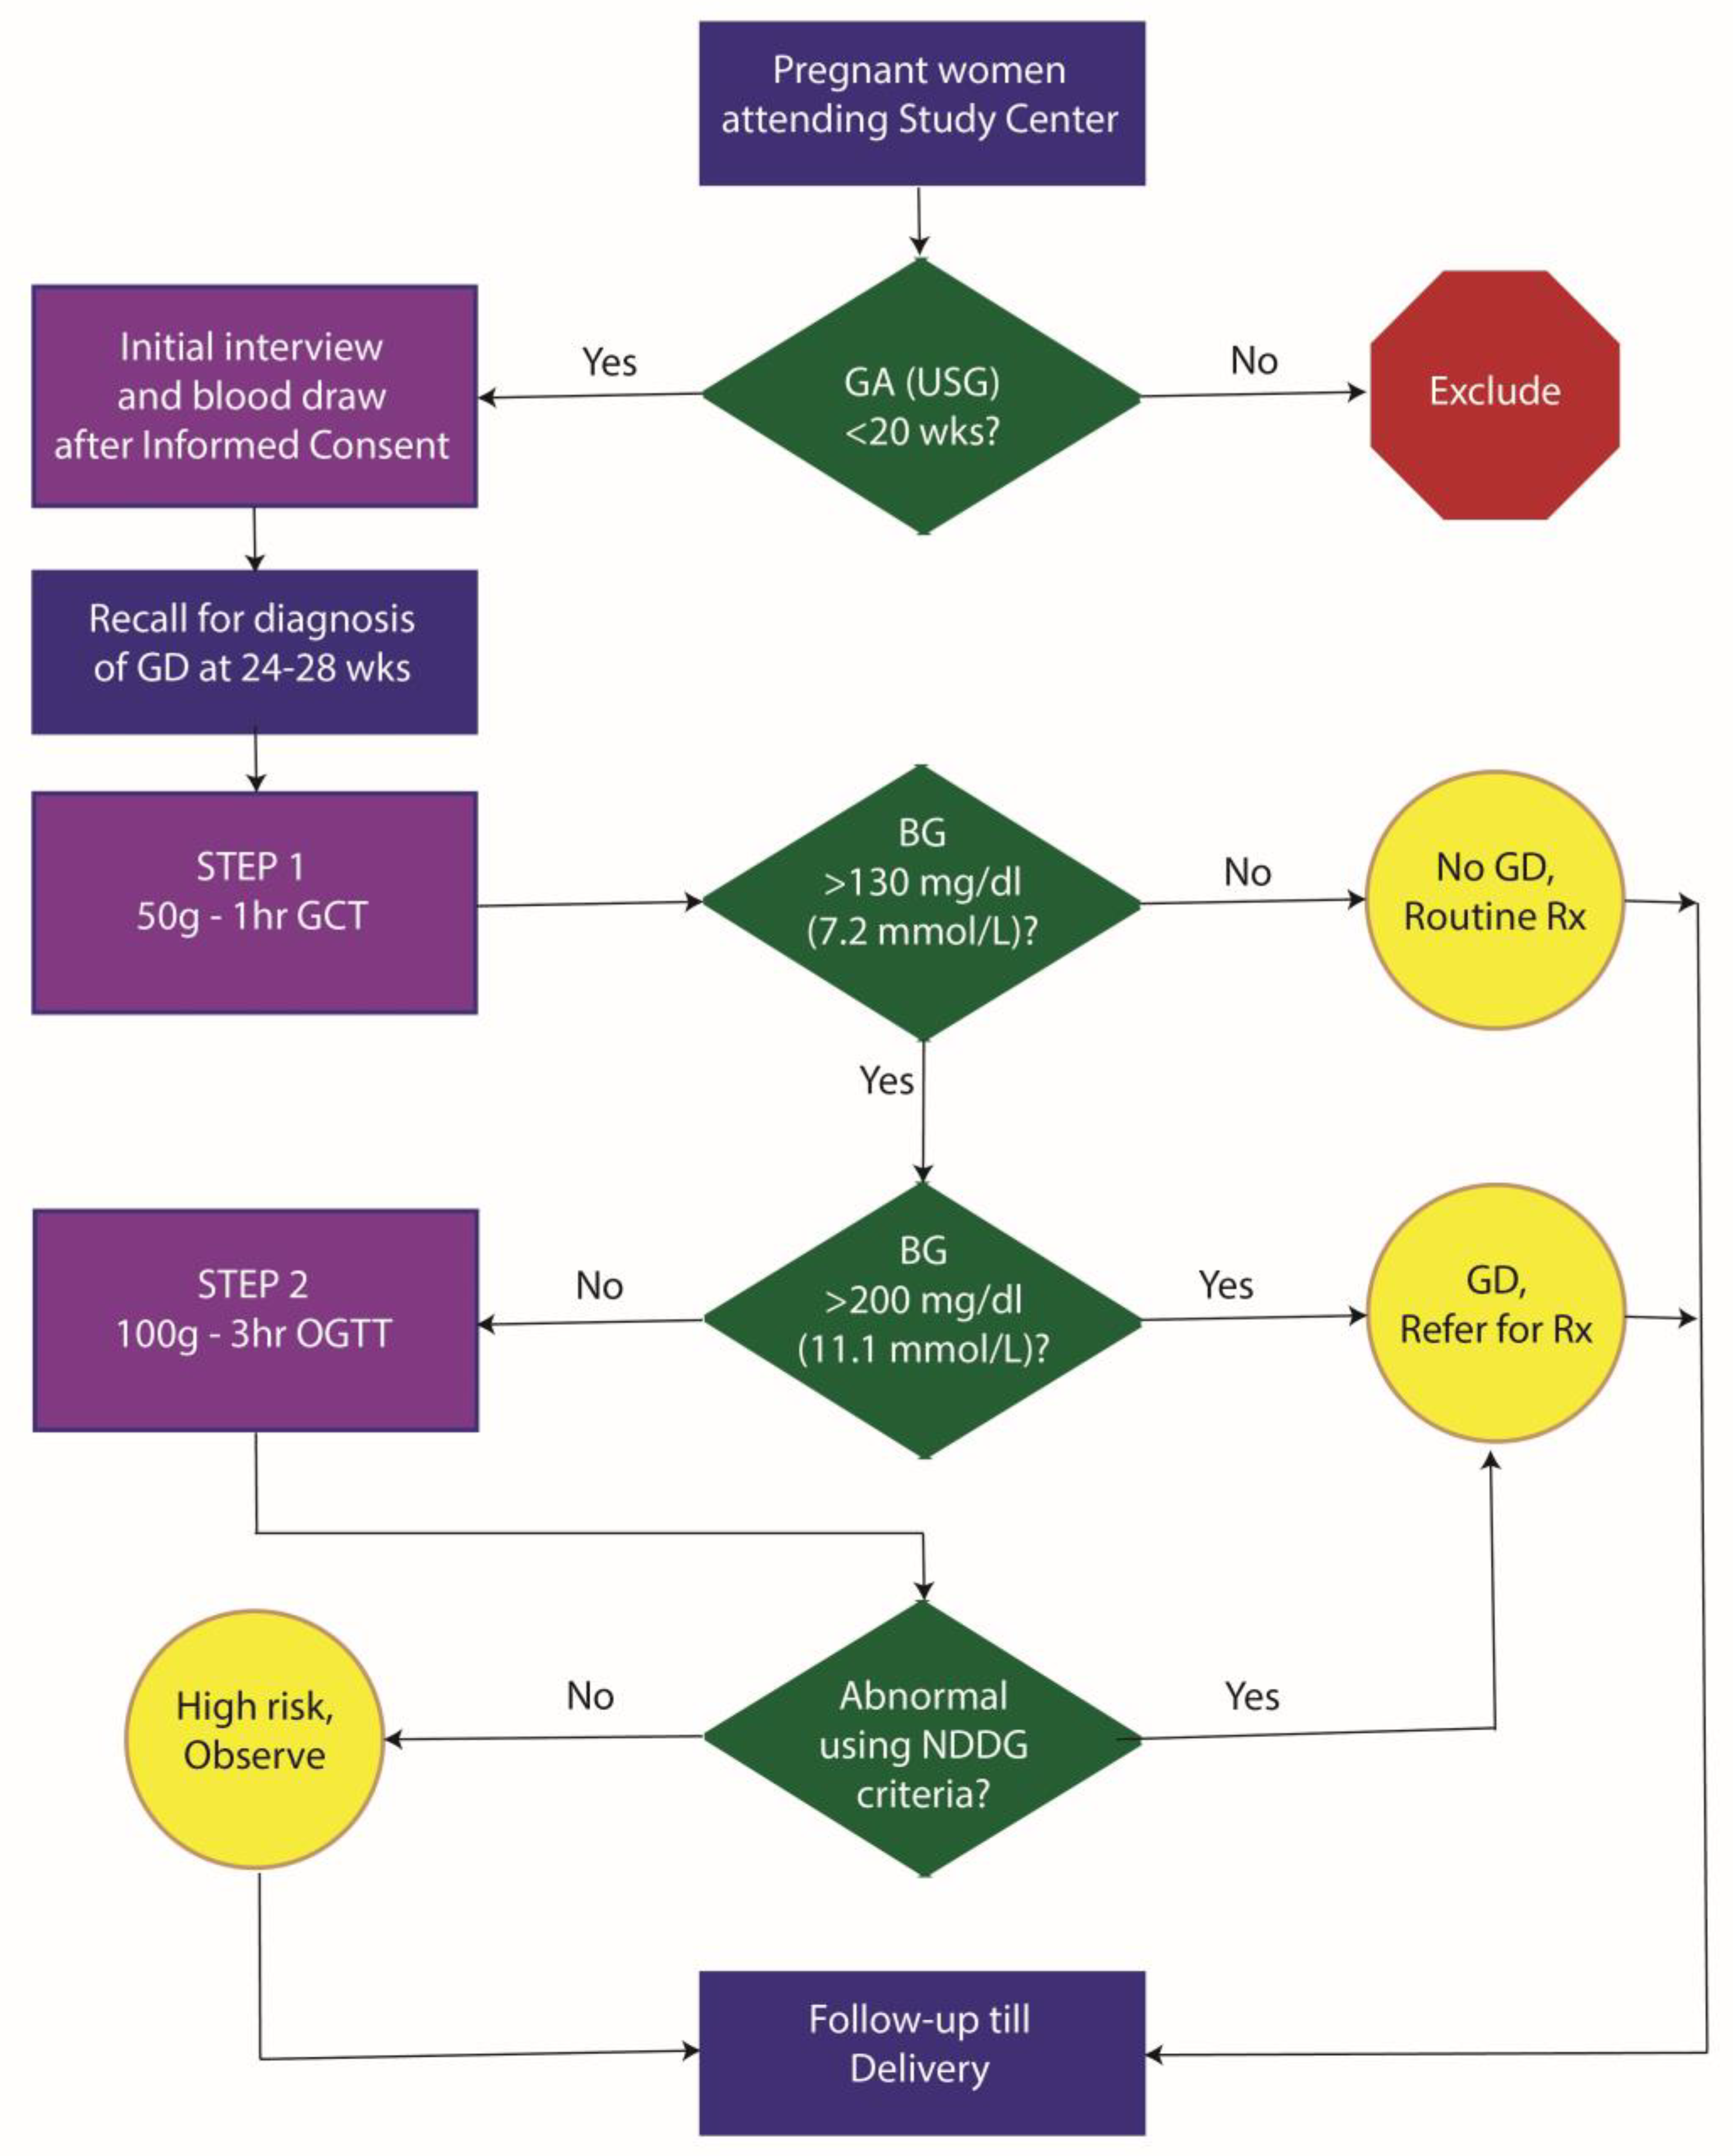
Figure 2.
Gestational diabetes risk groups: composition and numbers. Of the 1,041 pregnant women enrolled into the study, 700 were negative by the glucose challenge test (GCT) – this comprised the RG0 group (green bar). Of the 341 GCT-positive women, 218 had normal OGTT and HbA1c values and comprised the RG1 group (blue bar). Of the remaining 123 women, 75 had either a single abnormal value (by Carpenter-Coustan criteria) during OGTT or an HbA1c >6.5% and formed the RG2 group (orange bar). The RG3 group (red bar) comprised of 48 women of whom 16 were diagnosed as GD using the NDDG criteria (brown bar).
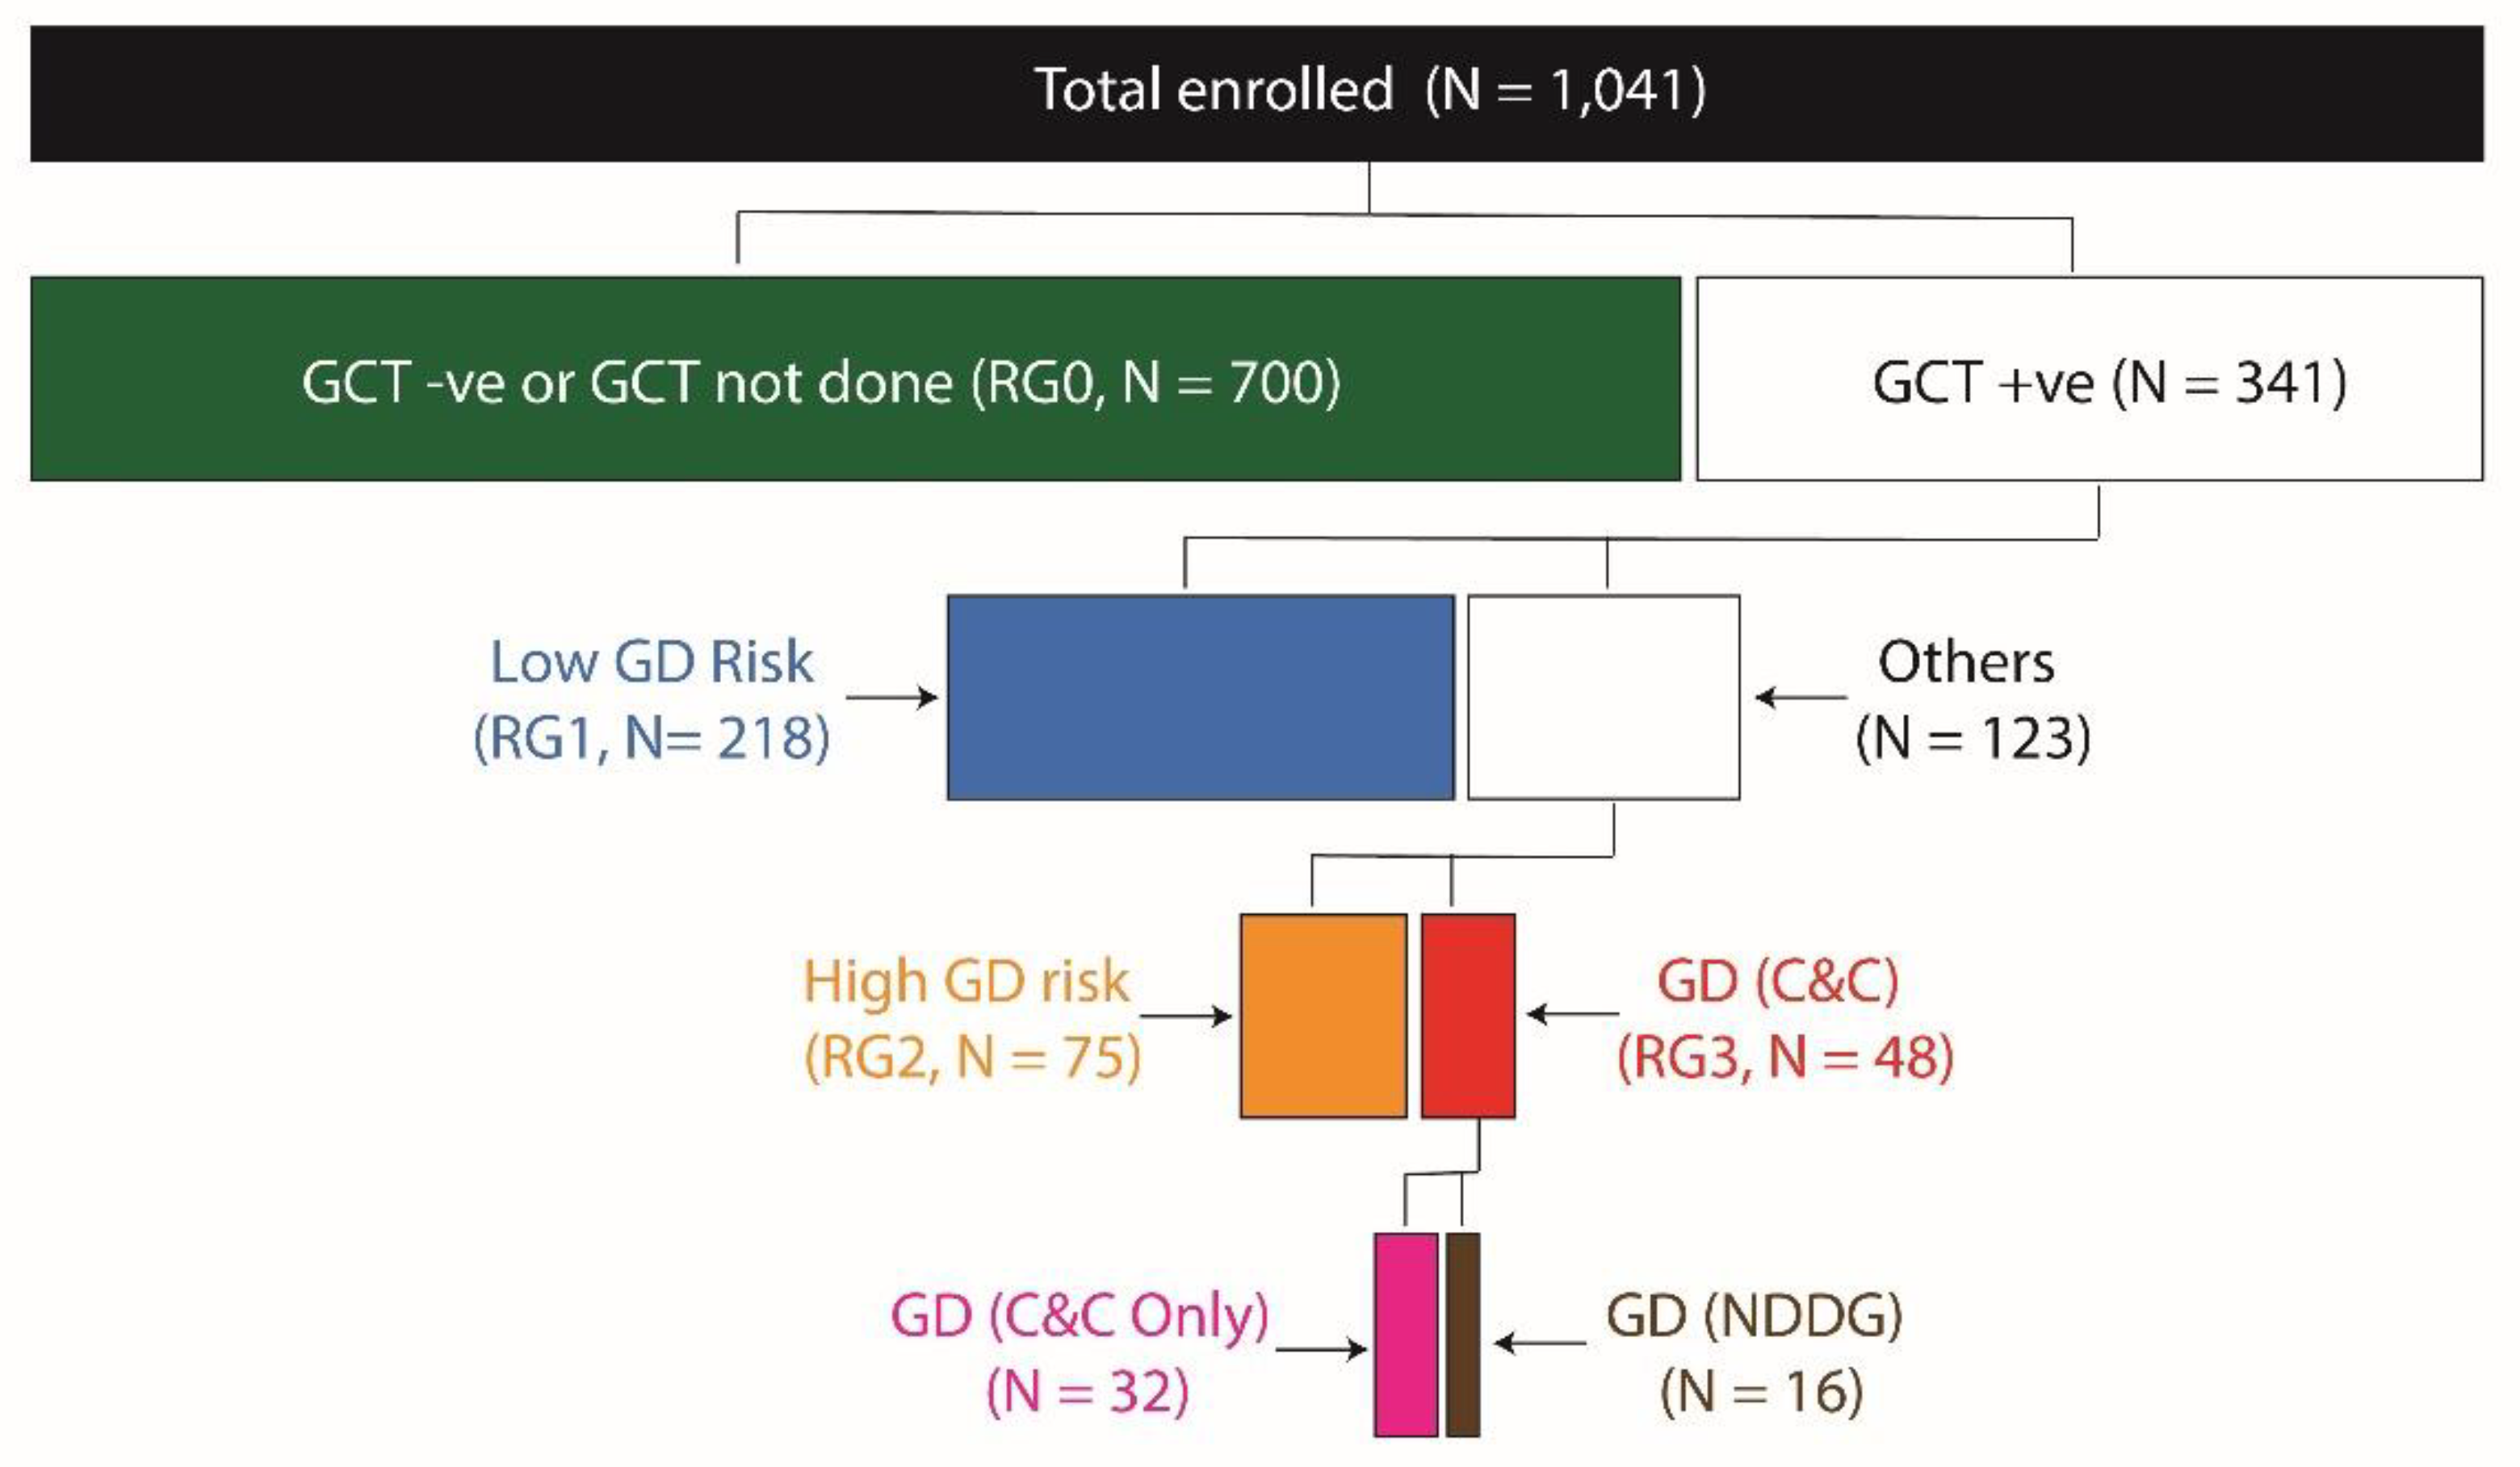
Figure 3.
Adjusted odds ratio for study outcomes associated with the GD risk groups. All logistic models are adjusted for age, BMI, total cholesterol, triglycerides, HDL, LDL, VLDL, systolic and diastolic blood pressure, total calories, fats, proteins, carbohydrates, fiber, iron, calcium and water intake and total weekly METs. Diamonds show point estimates and the error bars show 95% confidence intervals.


Table 1.
Baseline characteristics of the study participants based on membership of the GD risk group, MERGD 2018.
Table 1.
Baseline characteristics of the study participants based on membership of the GD risk group, MERGD 2018.
| Characteristic | GD Risk group | P | |||
| 0 | 1 | 2 | 3 | ||
| (n = 700) | (n = 218) | (n = 75) | (n = 48) | ||
| Enrollment characteristics | |||||
| Maternal age at enrollment | 25.08 (0.15) | 25.85 (0.27) | 25.91 (0.56) | 27.56 (0.58) | 0.0001 |
| Gestational age at enrollment | 16.25 (0.11) | 16.17 (0.19) | 15.47 (0.38) | 15.76 (0.46) | 0.2204 |
| Singleton pregnancy | 688 (98.29) | 212 (97.25) | 75 (100.00) | 47 (97.92) | 0.4742 |
| Demographics | |||||
| Maternal education | 0.1490 | ||||
| Never schooled / kindergarten only | 5 (0.72) | 2 (0.92) | 2 (2.67) | 2 (4.17) | |
| Class 1-8 | 109 (15.62) | 39 (17.89) | 16 (21.33) | 4 (8.33) | |
| Class 9-10 | 235 (33.67) | 78 (35.78) | 24 (32.00) | 13 (27.08) | |
| Class 11-12 | 194 (27.79) | 54 (24.77) | 20 (26.67) | 17 (35.42) | |
| College 1-3 years | 106 (15.19) | 35 (16.06) | 11 (14.67) | 6 (12.50) | |
| College >3 years | 35 (5.01) | 8 (3.67) | 2 (2.67) | 6 (12.50) | |
| Degree / Masters | 14 (2.01) | 2 (0.92) | 0 (0.00) | 0 (0.00) | |
| Family income | 0.0228 | ||||
| INR <100,000 per annum | 287 (41.41) | 84 (39.25) | 31 (41.47) | 23 (48.94) | |
| INR 100,000-<200,000 per annum | 312 (45.02) | 102 (47.66) | 29 (39.73) | 12 (25.33) | |
| INR 200,000-<300,000 per annum | 68 (9.81) | 26 (12.15) | 8 (10.96) | 8 (17.02) | |
| INR 300,000-<400,000 per annum | 20 (2.89) | 1 (0.47) | 3 (4.11) | 2 (4.26) | |
| INR 400,000-<600,000 per annum | 4 (0.58) | 0 (0.00) | 2 (2.74) | 1 (2.13) | |
| INR 600,000-<1,000,000 per annum | 1 (0.14) | 1 (0.47) | 0 (0.00) | 0 (0.00) | |
| INR >=1,000,000 per annum | 1 (0.14) | 0 (0.00) | 0 (0.00) | 1 (2.13) | |
| Caste | 0.0752 | ||||
| Open | 205 (29.33) | 70 (32.11) | 33 (44.00) | 22 (45.83) | |
| Other backward classes | 244 (34.91) | 78 (35.78) | 24 (32.00) | 14 (29.17) | |
| Scheduled caste | 166 (23.75) | 42 (19.27) | 13 (17.33) | 4 (8.33) | |
| Scheduled tribe | 33 (4.72) | 15 (6.88) | 2 (2.67) | 4 (8.33) | |
| Nomadic tribe / Vimukta Jaati | 29 (4.15) | 8 (3.67) | 2 (2.67) | 4 (8.33) | |
| Other | 22 (3.15) | 5 (2.29) | 1 (1.33) | 0 (0.00) | |
| Religion | 0.1956 | ||||
| Hindu | 427 (61.17) | 136 (62.67) | 41 (54.67) | 26 (54.17) | |
| Buddhist | 123 (17.62) | 34 (15.67) | 12 (16.00) | 4 (8.33) | |
| Muslim | 145 (20.77) | 44 (20.28) | 22 (29.33) | 18 (37.50) | |
| Sikh | 3 (0.43) | 1 (0.46) | 0 (0.00) | 0 (0.00) | |
| Christian | 0 (0.00) | 1 (0.46) | 0 (0.00) | 0 (0.00) | |
| Other | 0 (0.00) | 1 (0.46) | 0 (0.00) | 0 (0.00) | |
| Obstetric history | |||||
| Previous pregnancies | 0.2560 | ||||
| 0 | 316 (45.21) | 98 (44.95) | 43 (57.33) | 22 (45.83) | |
| 1 | 251 (35.91) | 67 (30.73) | 18 (24.00) | 15 (31.25) | |
| 2 | 105 (15.02) | 39 (17.89) | 8 (10.67) | 10 (20.83) | |
| 3 | 20 (2.86) | 12 (5.50) | 4 (5.33) | 1 (2.08) | |
| 4 | 5 (0.72) | 1 (0.46) | 1 (1.33) | 0 (0.00) | |
| 5 | 2 (0.29) | 0 (0.00) | 1 (1.33) | 0 (0.00) | |
| 6 | 0 (0.00) | 1 (0.46) | 0 (0.00) | 0 (0.00) | |
| Previous livebirths | 0.6558 | ||||
| 0 | 68 (17.75) | 20 (16.67) | 7 (21.88) | 6 (23.08) | |
| 1 | 265 (69.19) | 84 (70.00) | 19 (59.38) | 14 (53.85) | |
| 2 | 44 (11.19) | 15 (12.50) | 6 (18.75) | 6 (23.08) | |
| 3 | 6 (1.57) | 1 (0.83) | 0 (0.00) | 0 (0.00) | |
| Previous cesarean section | 102 (14.57) | 35 (16.06) | 12 (16.00) | 7 (14.58) | 0.9490 |
| Body mass index (Kg/m2) | 21.31 (0.14) | 21.51 (0.30) | 22.18 (0.45) | 23.66 (0.70) | 0.0010 |
| Obesity (BMI≥27.5 Kg/m2) | 45 (6.43) | 19 (8.72) | 8 (10.67) | 11 (22.92) | 0.0005 |
| Blood pressure | |||||
| Systolic (mmHg) | 100.63 (0.31) | 103.30 (0.55) | 102.74 (0.99) | 105.70 (1.50) | 4.40x10⁻⁶ |
| Diastolic (mmHg) | 63.24 (0.23) | 65.61 (0.44) | 65.58 (0.80) | 66.99 (1.07) | 3.38x10⁻⁸ |
| Pulse pressure (mmHg) | 37.43 (0.22) | 37.69 (0.40) | 37.75 (0.72) | 37.77 (0.93) | 0.8629 |
| Mean arterial pressure (mmHg) | 75.68 (0.24) | 78.17 (0.44) | 77.57 (0.75) | 80.52 (1.19) | 1.48x10⁻⁸ |
| Hypertension | 7 (1.01) | 7 (3.21) | 1 (1.35) | 3 (6.25) | 0.0133 |
| Blood lipid profile | |||||
| Total serum cholesterol (mg/dl) | 157.07 (1.21) | 162.39 (2.17) | 159.72 (3.73) | 163.19 (4.27) | 0.1133 |
| Serum triglycerides (mg/dl) | 104.83 (1.80) | 112.13 (2.67) | 114.15 (5.84) | 125.88 (5.91) | 0.0001 |
| Serum high density lipoprotein (mg/dl) | 50.90 (0.34) | 50.25 (0.59) | 48.35 (0.92) | 50.77 (1.30) | 0.1423 |
| Serum low density lipoprotein (mg/dl) | 85.21 (1.06) | 89.71 (1.94) | 88.54 (3.21) | 87.24 (3.78) | 0.2076 |
| Serum very low density lipoprotein (mg/dl) | 20.97 (0.36) | 22.43 (0.53) | 22.83 (1.17) | 25.18 (1.18) | 0.0001 |
Table 2.
Dietary and physical activity characteristics based on gestational diabetes status, MERGD 2018.
Table 2.
Dietary and physical activity characteristics based on gestational diabetes status, MERGD 2018.
| Characteristic | GD Risk group | P | |||
| 0 | 1 | 2 | 3 | ||
| (n = 700) | (n = 218) | (n = 75) | (n = 48) | ||
| Dietary characteristics | |||||
| Total calories (Kcal/d) | 1510.26 (28.75) | 1489.70 (42.63) | 1419.60 (69.90) | 1560.37 (83.98) | 0.4785 |
| Total proteins (g/d) | 50.47 (1.29) | 53.04 (2.51) | 50.00 (4.54) | 56.49 (5.29) | 0.5188 |
| Total carbohydrates (g/d) | 220.91 (3.48) | 214.90 (5.39) | 203.73 (8.58) | 222.68 (11.91) | 0.5581 |
| Total fats (g/d) | 46.19 (1.50) | 45.33 (2.11) | 44.02 (3.30) | 47.70 (3.28) | 0.1557 |
| Total dietary fiber (g/d) | 7.14 (0.20) | 6.63 (0.29) | 6.53 (0.46) | 7.81 (0.61) | 0.1258 |
| Dietary iron (mg/d) | 15.41 (0.31) | 13.89 (0.48) | 14.25 (0.81) | 16.92 (1.07) | 0.0136 |
| Dietary calcium (mg/d) | 482.24 (10.29) | 473.98 (16.71) | 485.82 (28.45) | 548.71 (50.73) | 0.5046 |
| Water intake (L/d) | 1.13 (0.02) | 1.16 (0.04) | 1.11 (0.06) | 1.09 (0.06) | 0.9137 |
| Physical activity (per week) | |||||
| Total METs | 59.22 (0.88) | 57.42 (1.41) | 56.71 (1.84) | 56.31 (2.83) | 0.5037 |
| Sedentary METs | 1.18 (0.07) | 1.02 (0.12) | 0.84 (0.13) | 1.26 (0.24) | 0.3199 |
| Light intensity activity METs | 49.73 (0.62) | 48.44 (1.03) | 49.53 (1.52) | 48.64 (2.21) | 0.7153 |
| Moderate intensity activity METs | 8.29 (0.37) | 7.95 (0.58) | 6.35 (0.52) | 6.41 (0.99) | 0.5379 |
| Vigourous intensity activity METs | 0.02 (0.01) | 0.01 (0.01) | 0.00 (0.00) | 0.00 (0.00) | 0.6339 |
| Household/ caregiving activity METs | 55.65 (0.84) | 54.06 (1.38) | 53.65 (1.78) | 52.67 (2.67) | 0.5665 |
| Occupational activity METs | 0.04 (0.02) | 0.10 (0.05) | 0.00 (0.00) | 0.00 (0.00) | 0.2556 |
| Sports activity METs | 1.14 (0.04) | 1.11 (0.06) | 1.07 (0.10) | 1.20 (0.13) | 0.9246 |
Disclaimer/Publisher’s Note: The statements, opinions and data contained in all publications are solely those of the individual author(s) and contributor(s) and not of MDPI and/or the editor(s). MDPI and/or the editor(s) disclaim responsibility for any injury to people or property resulting from any ideas, methods, instructions or products referred to in the content. |
© 2025 by the authors. Licensee MDPI, Basel, Switzerland. This article is an open access article distributed under the terms and conditions of the Creative Commons Attribution (CC BY) license (http://creativecommons.org/licenses/by/4.0/).
Copyright: This open access article is published under a Creative Commons CC BY 4.0 license, which permit the free download, distribution, and reuse, provided that the author and preprint are cited in any reuse.


