Submitted:
23 August 2025
Posted:
25 August 2025
You are already at the latest version
Abstract
Bisphenol A (BPA) is an important industrial chemical used in the manufacture of polycarbonate plastic and epoxy resin-based products. This endocrine disruptor molecule is metabolized and eliminated primarily as a monoglucuronide. The purpose of this study was to identify those of murine tissues and UDP-glucuronosyltransferase (UGT) enzymes involved in BPA-glucuronide (-G) formation. A series of in vitro glucuronidation assays were performed using homogenates or microsomal fractions from murine tissues or HEK293 cells expressing each of the 7 murine Ugt2b isoforms. From the 29 tissues tested, the most reactive were the liver, gallbladder, caecum and colon. A low BPA-G formation was also detected in the ileum, oviduct and testis. KM values ranged from 19.6±7.5 (gallbladder) to 85.8±16.0µM (caecum), while with 190.3µL/min/mg proteins the gallbladder exhibited the highest intrinsic clearance value. From the 7 murine Ugt2bs, the highest BPA-G formation rates were obtained with the Ugt2b1 and Ugt2b34 isoforms. These 2 enzymes displayed important differences in terms of kinetic parameters: Ugt2b1 exhibited lower KM and Vmaxapp. values (2.5±0.2µM and 389.4±79.0pmol/min/mg proteins, respectively) than Ug2b34 (KM=98.4±3.3µM and Vmaxapp.=9,681.3±1,507.3pmol/min/mg proteins). However, CLINT. values revealed that both enzymes exhibit similar BPA glucuronidation efficiencies. Quantitative RT-PCR experiments further revealed that the profile of the Ugt2b34 mRNA expression correlates with BPA-G formation in tissues of the gastro-intestinal tract.
In conclusion, the present study identifies tissues of the hepato-biliary-intestinal tract as well as the Ugt2b1 and Ugt2b34 isoforms as major contributors for bisphenol A glucuronidation in mice Surprisingly, gallbladder was very reactive with this substrate.
Keywords:
Bisphenol A
; glucuronidation
; mice
; liver
; gallbaldder
; UDP-glucuronosyltransferase
; Ugt2b34
Introduction
Bisphenol A (2,2-bis(4-hydroxyphenyl)propane; BPA) is an important chemical composed of two phenols and an acetone, and used as a monomer for polycarbonate plastics and epoxy resins production [1]. Shatter-proof polycarbonate plastic is present in many types of consumer products, including beverage containers and medical devices. BPA-based epoxy resins are common liners for metal cans containing food and beverage [1], and are used for some dental materials, including dental sealants [1,2]. BPA can leach from polycarbonate plastics and from epoxy resins in contact with food and drink, and as a result, ingestion is considered the major and routine route for BPA [2].
A NHANES (National Health and Nutrition Examination Survey) study (2003-2004) which was designed to be representative of the United State population, showed that more than 90% of urine samples contained measurable levels of BPA metabolites [2,3]. Recent international estimates of mean dietary exposures to BPA were 0.01-0.4µg/kg body weight/day for adults and 0.1-0.5µg/kg body weight/day for young children and teenagers (reviewed in [2,4]. Human exposure to BPA has been correlated with a variety of diseases, including diabetes [5], cardiovascular diseases [6], recurrent miscarriages and increased numbers of premature deliveries in women [7,8], altered postnatal growth rate, induction of precocious puberty and influence on immune system [9].
Bisphenol A-monoglucuronide (BPA-G) has been identified to be the predominant in vivo metabolite in mice, rats, monkeys and humans [10,11,12,13,14]. Two studies performed in humans to evaluate the metabolic fate of low deuterated-BPA doses failed to find detectable levels of unconjugated BPA in plasma and urine [13,15]. By contrast, the kinetic profile of BPA-G showed a rapid plasma peak followed by urinary elimination [13,15]. These results were interpreted as indicating more rapid and complete metabolic clearance of BPA in humans relative to rats, in which circulating parent compound can be detected and the clearance of BPA-G is slower (reviewed in [15]). This difference was attributed to different elimination pathways in rats versus humans: i.e a biliary/fecal BPA-G elimination in the rat, but via urine in humans [13,15]. The urinary elimination of BPA-G would preclude enterohepatic recirculation in humans, in contrast to rats in which intestinal -glucuronidases could break down excreted BPA-G and liberate BPA for intestinal reabsorption (reviewed in [15]). These cross-species pharmacokinetic differences have been used to question the relevance of rodents as experimental models to evaluate BPA effects at low doses (reviewed in [15]).
The UDP-glucuronosyltransferase (UGT) enzymes catalyze the glucuronidation reaction, which corresponds to the transfer of glucuronic acid from UDP-glucuronic acid (UDPGA) to hydrophobic aglycons. UGTs are classified into 4 families: UGT1, UGT2, UGT3 and UGT8. The most important drug and pollutant conjugating UGTs belong to the UGT1 and UGT2 families [16]. While the UGT1 family is composed of only 1 subfamily, i.e. UGT1A, members of the UGT2 are further divided into UGT2A and UGT2B subfamilies [16,17,18]. The UGT2B15 and UGT2B1 enzymes were previously identified as responsible for BPA glucuronide conjugation in humans and rats, respectively [19,20,21]. By contrast, the Ugt(s) catalyzing BPA-G formation in mice received only limited attention until now. Although mice are widely used to investigate BPA toxicokinetic properties, only little is known about the tissue distribution of bisphenol A glucuronidation in this species. As in humans, murine Ugts are divided into 4 sub-families: Ugt1a, Ugt2a, Ugt2b and Ugt3a [22]. Murine Ugt2bs (namely, Ugt2b1, 2b5, 2b34, 2b35, 2b36, 2b37 and 2b38) are encoded by genes clustered on chromosome 5E1 [22]. The primary objectives of the present study were to identify the tissues and Ugt isoforms that contribute to BPA-G production in mice.
Materials and Methods
Materials
BPA was purchased from Sigma-Aldrich (St. Louis, MO, USA) and deuterated [2H6]-BPA(-d6) from Toronto Research Chemicals (B519497; Toronto, ON, Canada). The internal standard BPA-G-d6 was obtained through in vitro enzymatic assays with BPA-d6 and human liver microsomes following a previously reported procedure [23]. HPLC-grade reagents were from VWR Canada (Mississauga, ON, Canada) and Laboratoire MAT (Québec, QC, Canada). All chemicals and reagents were of the highest grade commercially available. UDP-glucuronic acid (UDPGA) and all aglycones were obtained from Sigma-Aldrich and ICN Pharmaceuticals, Inc. (Québec, QC, Canada).
Human embryonic kidney 293 (HEK293) cells were obtained from the American Type Culture Collection (Rockville, MD, USA) and were grown as reported [24]. HEK293 cells expressing the human UGT2B15 enzymes were as previously described [25]. Protein assay reagents were obtained from Bio-Rad Laboratories Inc. (Marnes-la-Coquette, France). Antibiotics and cell culture reagents were from Invitrogen (Burlington, ON, Canada).
Animal Tissue Collection
Animal studies were performed in compliance with Guidelines for Care and Use of Experimental Animals from the Canadian Council for Laboratory Animal Care. All experiments were approved by the Animal Care Council of the CHU de Québec research centre (approbation number #2012-077-1). Most experiments were performed with tissues from 6 mice (3 males and 3 females) aged 53 days at sacrifice; however due to the small size of the tissue, gallbladders from 10 animals (9 females and 1 male; age: 84-112days), were pooled. Animals were sacrificed through isoflurane (Baxter Corporation, Mississauga, ON, Canada) anaesthesia followed by cardiac blood withdrawal. Tissues were collected and freed from fat connective tissues immediately after death and frozen on dry ice. Tissues were kept at -80°C for subsequent analyses.
Enzymatic Preparations
Homogenates were prepared from murine tissues and Ugt2b-HEK293 cells using a potter-glass-col (Terre-Haute, IN, USA) type homogenizer with a Teflon pestle in a phosphate-buffered saline solution with dithiothreitol (0.5mM). Homogenates were used at concentrations ranging from 3 to 5µg/µL. Microsome pellets were extracted by differential centrifugation as previously described [24] and resuspended at a 5µg/µL concentration. Human liver microsomes were as previously described [26,27].
Glucuronidation Assays
Enzymatic assays were performed in the presence of 30-50µg homogenates or 5-10µg microsomes using the previously reported glucuronidation assay buffer [28], in the presence of BPA concentrations varying from 1 to 500µM. After incubation at 37°C for the indicated duration, assays were ended by adding 100µL of methanol containing 0.02% butylated hydroxytoluene [24], and centrifuged at 13,000g for 10min. Supernatants were diluted in an internal standard of methanol and water (50:50) with approximately 10ng of BPA-G-d6.
Liquid Chromatography Coupled to Tandem Mass Spectrometry (LC-MS/MS)
BPA-G formation was quantified through liquid chromatography (HPLC) coupled to a triple-quadrupole mass spectrometer (LC-MS/MS) (API3000 Applied Biosystems, Concord, Canada) operating with a turbo ion spray source using multiple ions monitoring mode. The HPLC system consisted of the Prominence HPLC apparatus (Shimadzu, Columbia, DC, USA) equipped with an ACE3 C18-HL100×4.6mm (Canadian Life Science Inc., Peterborough, ON, Canada). The mobile phase was composed of the binary solutions: water with 5mM ammonium formate (solvent A) and methanol with 5mM ammonium formate (solvent B). Analytes were eluted at a flow rate of 0.9mL/min using the following program: 0–2.3min: isocratic 45% A and 55% B; 2.3–3.4min, isocratic 95% B; 3.4–6.0min, isocratic 55% B. Electrospray was set to negative-ion mode with ionization voltage, declustering potential and collision energy of 4600V, 10V and 26V, respectively. The ion source temperature was set at 500°C. The following mass ion transitions (m/z) were used for detection: 403.3→113.0 for BPA-G, 409.3→113.0 for BPA-d6-G. Retention time for BPA-G was of 2.2min (Figure 1). The limit of quantification was 1.0ng/mL.
Total RNA Isolation and Quantitative RT-PCR Analyses
Total RNA was isolated from tissues (10mg) according to the TriReagent acid:phenol protocol as recommended by the supplier (Molecular Research Center Inc., Cincinnati, OH, USA). Total RNA (1μg) was reverse-transcribed using random hexamer primers (150ng) and 200units of Superscript II reverse-transcriptase (Invitrogen, Burlington, ON, Canada). The reaction was performed in a final volume of 10μL composed of 5µL Fast Sybr Green PCR Master Mix (Life Technologies, Carlsbad, ON, CA), 1µL of each primer (400nM final) as reported (Table 1) and 3µL of a RT product diluted at 1/50. Real-time PCR quantifications were performed on an ABI ViiA 7 Real-Time PCR system from Applied Biosystems (Life Technologies, Carlsbad, ON, Canada). Copy numbers were obtained through linear regression with a standard curve constructed with five log concentrations of each Ugt2b cDNA. The integrity of the reverse transcription reaction was assessed by analyzing mRNA levels of the housekeeping gene peptidylprolyl isomerase A (cyclophilin A, PPIA).
Results
Tissue Distribution of Bisphenol A-Glucuronide Formation in Mice
To determine the tissue distribution of BPA-G formation in mice, homogenates from 29 murine tissues obtained from 2 adult male and 2 adult female animals were assayed through in vitro glucuronidation assays in the presence of 500µM BPA. As summarized in Table 2, the most reactive organs in both male and female animals were the liver (5,787.3±735.2pmol/min/mg proteins) and gallbladder (2,451.4±803.9pmol/min/mg proteins). Within the intestine, the caecum (1,050.7±994.1pmol/min/mg proteins) and colon (970.6±371.7pmol/min/mg proteins) were also efficient in converting BPA into BPA-G (Table 2). Other tissues only exhibited: i) barely detectable (<10pmol/min/mg proteins: heart, brain, muscle, spleen, adrenals, skin, prostate, bulbospongious tissue and seminal vesicle); ii) very low (10 to 100pmol/min/mg proteins: mammary gland, lung, adipose tissue, pancreas, epididymis, uterus, ovary and vagina) or iii) low (100 to 400pmol/min/mg proteins: ileum, oviduct and testis) glucuronidation activities (Table 2). Interestingly, no major sex-related differences were observed in these experiments.
Kinetic Parameters of Hepatic BPA Glucuronidation in Mice and Humans
The kinetic parameters for hepatic BPA-G formation were determined using microsomal preparations from 3 male and 3 female animals with BPA concentrations ranging from 1 to 250μM (Figure 2 and Table 3). In male livers, KM values ranged from 64.6±9.2 to 157.9±26.0μM. Similar inter-individual variations were also observed with microsomes from female mice in which the KM values were comprised between 39.9±4.9 and 75.3±7.1μM (Table 3). Overall the mean KM value obtained from these 6 murine livers was of 77.8±41.6µM. Interestingly, the apparent maximal velocity values (alias Vmaxapp.) also exhibited large inter-individual variability, particularly in males (Figure 2A). Vmaxapp. values also tended to be reduced in enzymatic preparations from female livers when compared to males (Figure 2B). Indeed, mean Vmaxapp. values were 8,241.2±2,457.1pmol/min/mg proteins in males and 5,384.2±1,171.3pmol/min/mg proteins in females (Table 3). By contrast, both male and female enzymatic preparations exhibited similar BPA glucuronidation capacities as demonstrated by the close intrinsic clearance (CLINT.) values of 88.0±21.3µL/min/mg proteins for males and 98.5±12.9µL/min/mg proteins for females (Table 3).
Kinetic Parameters of Intestinal and Biliary BPA-G Formation in Mice
To evaluate whether BPA glucuronidation in reactive extrahepatic tissues (namely the caecum, colon and gallbladder) involves similar enzymatic characteristics, kinetic parameters were determined using microsomal proteins purified from the caecum and colon of male 1 and female 1, and from a pool of gallbladders undertaken from 10 animals (1 male and 9 females) (Table 4). While KM values tended to be higher in the male sample than in the female one, the 2 intestinal tissues presented similar affinities for BPA glucuronidation (85.8±16.0 and 67.2±21.4µM for caecum and colon, respectively). Interestingly, microsomal proteins from the gallbladder pool exhibited a low 19.6±7.5µM KM value (Table 4), which makes this tissue with the highest affinity for BPA among those herein investigated. Maximal velocities in caecum and colon also displayed a sort of sexual dimorphism, since the Vmaxapp of female caecum was twice higher than the male one. Interestingly, the opposite was observed with the colon since male proteins had an almost 4-fold higher velocity value (Table 4). As a consequence, the intrinsic clearance also varied between male and female tissues: CLINT. was higher in female caecum and male colon. Interestingly, this parameter, which translates the glucuronidation reaction efficiency, was notably high with microsomes from gallbladder (190.3µL/min/mg proteins), when compared not only to caecum (78.5±49.5µL/min/mg proteins) and colon (50.4±29.1µL/min/mg proteins), but also to mice (93.3±16.8µL/min/mg proteins) and human (69.2±16.8µL/min/mg proteins) livers (Tables 3&4).
Identification of BPA-Conjugating Ugt2b enzymes in Mice
To further elucidate the enzymatic mechanisms governing BPA glucuronidation in mice, the 7 murine Ugt2b isoforms previously cloned and stably expressed in human HEK293 cells [30] were screened their ability to convert BPA into BPA-G in vitro assays (Figure 3). The presence of each enzyme in the corresponding Ugt2b-HEK293 cell line was previously quantified through Western-blotting [30]. While all enzymes exhibited reactivity with BPA, the highest BPA-G formation rates were detected in the presence of Ugt2b1 (307.7±64.9pmol/min/mg proteins) and Ugt2b34 (6,201.6±554.9pmol/min/mg proteins) enzymes; the latter being the most reactive isoform with this substrate (Figure 3).
When assayed for kinetic parameters, these 2 enzymes displayed significant differences (Table 5): Ugt2b1 exhibited lower KM and Vmaxapp. values (2.5±0.2µM and 389.4±79.0pmol/min/mg proteins, respectively) than Ugt2b34 (KM=98.4±3.3µM and Vmaxapp.=9,681.3±1,507.3pmol/min/mg proteins). However, CLINT. values revealed that both enzymes exhibit similar BPA glucuronidation efficiencies (Table 5). To determine how BPA-G formation by murine Ugt2bs compares with parameters of the previously identified human isoform [19], we conducted similar analyses using microsomes from UGT2B15-HEK293 cells. As summarized in Table 5, KM and Vmaxapp. values of the human enzymes were both higher than those of Ugt2b1, and lower than those of Ugt2b34. Nevertheless, with a CLINT. value of 26.8±3.4µl/min/mg proteins, UGT2B15 appeared less efficient than the 2 murine enzymes in converting BPA into its glucuronide derivative (Table 5).
The Profile of Ugt2b34 mRNA Expression Correlates with BPA-G Formation
To further discriminate the role of the Ugt2b34 and Ugt2b1 in BPA-G formation in vivo, we thought to compare their respective tissue distribution of mRNA expression with the level of BPA glucuronidation activity as determined in the same tissues (Table 2). For this purpose, total mRNA was extracted from tissues and analyzed for contents in Ugt2b1 and Ugt2b34 transcripts through real-time RT-PCR analyses (Figure 4). Accordingly to previous reports [31], Ugt2b1 mRNA was found only in the liver and gallbladder (Figure 4A), while Ugt2b34 transcripts were detected in all tissues tested, namely the liver, kidney, duodenum, jejunum, caecum, colon, stomach, bladder and gallbladder (Figure 4B). The comparison of these mRNA levels with BPA-G formation reveals that in the hepatobiliary system both Ugt2b1 and Ugt2b34 may play a role in BPA glucuronidation, while in intestinal tissues this catabolic reaction may entirely reflect the Ugt2b34 contribution.
Discussion
This study provides a comprehensive analysis of the tissues and Ugt2b enzymes contributing to the glucuronide conjugation of BPA in mice. These investigations illustrate the predominant role played by tissues of the gastrointestinal and hepatobiliary tracts, and demonstrate the major contribution of Ugt2b1 and Ugt2b34 in this process.
Among the 29 different tissues analyzed, BPA glucuronide formation was detected at high levels in the liver, gallbladder, caecum and colon. Identification of the liver as the most reactive organ is consistent with: i) the role of this tissue as the primary organ for glucuronidation of foreign compounds in mammals [19,32], and ii) the previous observation that murine Ugt2b isoforms are particularly abundant in this tissue [31]. Similarly, the present demonstration that tissues of the large intestine, such as the duodenum, caecum and colon, also exhibit elevated BPA to BPA-G conversion rates is consistent with previous investigations in rats [33]. In this species, elevated intestinal glucuronidation has been proposed as a protecting mechanism against exposure to ingested BPA and against the important enterohepatic cycle of glucuronidation/deglucuronidation sustained by the compounds in rodents [34]. Our data suggest that a similar phenomenon may also occur in mice.
The most intriguing observation issuing from the present investigations relates to the high level of BPA-G formation detected with microsomes from gallbladder. When compared to the liver, the gallbladder presented only a 2-time lower BPA-G formation level, which ranks this tissue as the second most reactive organ for BPA glucuronidation in mice. Moreover, not only the gallbladder presents a higher affinity (i.e lower KM) than the liver, but it also exhibits a 2-time higher intrinsic clearance, thus identifying this organ has a major glucuronidation site for BPA. The gallbladder is usually viewed only as a storage organ for the bile, where glucuronide conjugates formed in the liver are stored before excretion in the intestine. Our observations suggest that, at least for BPA, murine gallbladder is not only a storage organ, but actively participates to the conversion of the molecule into a glucuronide conjugate. To the best of our knowledge, the possibility that such a tissue can convert endogenous and/or exogenous substrates into glucuronide derivatives has never been reported. This suggests that the role of this organ in detoxification processes involving glucuronidation, not only for BPA, but also for the vast variety of hydrophobic compounds excreted as glucuronide conjugates, has potentially been underestimated until now. To further validate such an hypothesis, additional investigations are required to: i) determine whether the gallbladder also exhibits such elevated conjugation activity toward BPA in primates (monkeys and humans); and ii) evaluate in vivo the significance of such activity for the toxicokinetic properties of endocrine disruptors in rodents and higher mammals.
Another interesting observation of the present study corresponds to the demonstration that the murine kidney exhibits only low reactivity for BPA glucuronidation in mice. Indeed, beyond the intestine and liver, another key organ for endo- and xenobiotics glucuronidation is the kidney [35]. The low activity levels detected in mice kidney are, however, in agreement with previous investigations performed in rats [21], and further reinforce the idea that BPA glucuronidation mainly occurs in hepatobiliary and intestinal tissues in rodents. Such a tissue-selective metabolic phenomenon may contribute to a major difference in BPA’s toxicokinetic properties previously observed between rodents and primates [15,36]: even if glucuronidation is the primary mode of phase II metabolism for this compound in both species, in adult primates, BPA is cleared from the blood by the kidney into the urine, whereas in rodents the primary excretory pathway for BPA is via the bile into the feces [36,37]. Such species-related differences were initially discussed as reflecting the fact that the molecular cutoff for urinary excretion is larger in humans (550Da) compared with that in rats (350Da), thus allowing BPA-G (404Da) elimination in humans but not in rats [15]. Even if urinary glucuronides can originate from different organs, it is likely that the low levels of BPA detected in rodents’ urine also reflect the minor contribution of kidneys in BPA glucuronidation. In the opposite, the strong biliary and intestinal glucuronidation detected in mice may favor the fecal excretion of the molecule. While direct experimental evidences are currently lacking, the idea that a tissue-selective glucuronidation determines the preferred elimination route for BPA is supported by the previous demonstration that the human intestine only shows little BPA glucuronidation when compared with those from rats [32].
In addition to the difference in the tissue distribution of BPA glucuronidation discussed above, our results also indicate that human liver microsomes exhibit lower KM and CLINT. values for BPA glucuronidation than microsomes from mice livers. Similar inter-species differences were previously evidenced concerning the in vitro glucuronidation capacity of the mice, rats and human hepatocytes [12]. Overall, these observations may have deep toxicological impacts in regards of the current controversies about the relevance of animal models used to estimate the consequences of exposure to BPA on humans [15]. Indeed, the site of its glucuronidation is a crucial determinant for BPA’s bioavailability and its subsequent endocrine disruption properties. Our results suggest that even if the metabolic clearance of BPA is more rapid in humans than in rodents [15], the elevated hepatobiliary and intestinal conjugation activity may result in limited exposure of peripheral and endocrine sensitive tissues to unconjugated BPA in mice. Accordingly, it can be concluded from the limited conjugation activity level detected in the present study that, even, at low concentration, BPA cannot be locally inactivated in steroid target tissues from mice.
While the UGT enzymes responsible for BPA glucuronide conjugation were deeply investigated in humans and rats [19,20,21], those catalyzing BPA-G formation in mice received only limited attention until now. Our results demonstrate that among the 7 murine Ugt2b enzymes, only Ugt2b1 and Ugt2b34 exhibit high reactivity with BPA. Interestingly, the 2 enzymes displayed large differences in terms of affinity (~40-fold), velocity (~25-fold) and intrinsic clearance (1.6-fold) for BPA glucuronidation. These differences suggest that the 2 enzymes actually exert distinct roles for the glucuronide conjugation of bisphenol A. Such a complementary role is further supported by the selective distribution of their respective expression. Indeed, the most reactive tissues, namely the liver and gallbladder, correspond to tissues where both Ugt2b1 and Ugt2b34 enzymes are expressed. By contrast, tissues where only Ugt2b34 is detected, such as the kidney, intestine, stomach and bladder, exhibit only low or moderate BPA-glucuronidating activities. These observations therefore suggest that in the hepato-biliary system BPA is conjugated by the 2 enzymes, while in other reactive tissues the formation of BPA-G only reflects the activity of Ugt2b34. Interestingly, similar collaborative implications in BPA glucuronidation were previously reported in rats [21]. Indeed, while the rat UGT2B1 enzyme was identified as an important BPA-conjugating enzyme, additional investigations using immune-inhibition revealed that this isoform actually contributes for only 65% of the rat liver microsomal activities towards bisphenol A [21]. One can therefore understand that the remaining 35% reflect other Ugt(s) activity.
In conclusion, the present study identifies tissues of the hepato-biliary-intestinal tract, as well as the Ugt2b1 and Ugt2b34 isoforms as major contributors for bisphenol A glucuronidation in mice. Furthermore, results of the present study also indicate that the gallbladder possesses the enzymatic machinery for BPA glucuronidation in mice.
Acknowledgment
The authors thank Dr. Virginie Bocher for critical reading of the manuscript. This study was supported by grants from the Canadian Institute of Health Research (CIHR), the Canadian Foundation for Innovation (CFI) and the Natural Sciences and Engineering Research Council of Canada (NSERC). S. Caron is supported by a scholarship from the “Fondation du CHU de Québec” (Québec).
Abbreviations
BPA: Bisphenol A; CLINT.: Intrinsic clearance; G: Glucuronide; HEK293: Human Embryonic Kidney 293 cells; KM: Michaelis constant; LC-MS/MS: Liquid chromatography coupled to tandem mass spectrometry; Vmaxapp.: apparent maximal velocity; UDPGA: UDP-glucuronic acid; UGT: UDP-glucuronosyltransferase.
References
- Doerge, D.R.; Twaddle, N.C.; Vanlandingham, M.; Fisher, J.W. Pharmacokinetics of bisphenol A in neonatal and adult CD-1 mice: inter-species comparisons with Sprague-Dawley rats and rhesus monkeys. Toxicology letters 2011, 207, 298–305. [Google Scholar] [CrossRef]
- Rubin, B.S. Bisphenol A: an endocrine disruptor with widespread exposure and multiple effects. The Journal of steroid biochemistry and molecular biology 2011, 127, 27–34. [Google Scholar] [CrossRef]
- Calafat, A.M.; Ye, X.; Wong, L.Y.; Reidy, J.A.; Needham, L.L. Exposure of the U.S. population to bisphenol A and 4-tertiary-octylphenol: 2003-2004. Environmental health perspectives 2008, 116, 39–44. [Google Scholar] [CrossRef]
- Doerge, D.R.; Twaddle, N.C.; Vanlandingham, M.; Brown, R.P.; Fisher, J.W. Distribution of bisphenol A into tissues of adult, neonatal, and fetal Sprague-Dawley rats. Toxicology and applied pharmacology 2011, 255, 261–270. [Google Scholar] [CrossRef]
- Lang, I.A.; Galloway, T.S.; Scarlett, A.; Henley, W.E.; Depledge, M.; Wallace, R.B.; Melzer, D. Association of urinary bisphenol A concentration with medical disorders and laboratory abnormalities in adults. Jama 2008, 300, 1303–1310. [Google Scholar] [CrossRef]
- Melzer, D.; Rice, N.E.; Lewis, C.; Henley, W.E.; Galloway, T.S. Association of urinary bisphenol a concentration with heart disease: evidence from NHANES 2003/06. PloS one 2010, 5, e8673. [Google Scholar] [CrossRef]
- Sugiura-Ogasawara, M.; Ozaki, Y.; Sonta, S.; Makino, T.; Suzumori, K. Exposure to bisphenol A is associated with recurrent miscarriage. Human reproduction 2005, 20, 2325–2329. [Google Scholar] [CrossRef] [PubMed]
- Cantonwine, D.; Meeker, J.D.; Hu, H.; Sanchez, B.N.; Lamadrid-Figueroa, H.; Mercado-Garcia, A.; Fortenberry, G.Z.; Calafat, A.M.; Tellez-Rojo, M.M. Bisphenol a exposure in Mexico City and risk of prematurity: a pilot nested case control study. Environmental health : a global access science source 2010, 9, 62. [Google Scholar] [CrossRef] [PubMed]
- Yang, Y.J.; Hong, Y.C.; Oh, S.Y.; Park, M.S.; Kim, H.; Leem, J.H.; Ha, E.H. Bisphenol A exposure is associated with oxidative stress and inflammation in postmenopausal women. Environmental research 2009, 109, 797–801. [Google Scholar] [CrossRef] [PubMed]
- Pottenger, L.H.; Domoradzki, J.Y.; Markham, D.A.; Hansen, S.C.; Cagen, S.Z.; Waechter, J.M., Jr. The relative bioavailability and metabolism of bisphenol A in rats is dependent upon the route of administration. Toxicological sciences : an official journal of the Society of Toxicology 2000, 54, 3–18. [Google Scholar] [CrossRef]
- Kurebayashi, H.; Harada, R.; Stewart, R.K.; Numata, H.; Ohno, Y. Disposition of a low dose of bisphenol a in male and female cynomolgus monkeys. Toxicological sciences : an official journal of the Society of Toxicology 2002, 68, 32–42. [Google Scholar] [CrossRef]
- Pritchett, J.J.; Kuester, R.K.; Sipes, I.G. Metabolism of bisphenol a in primary cultured hepatocytes from mice, rats, and humans. Drug metabolism and disposition: the biological fate of chemicals 2002, 30, 1180–1185. [Google Scholar] [CrossRef]
- Volkel, W.; Colnot, T.; Csanady, G.A.; Filser, J.G.; Dekant, W. Metabolism and kinetics of bisphenol a in humans at low doses following oral administration. Chemical research in toxicology 2002, 15, 1281–1287. [Google Scholar] [CrossRef]
- Kuester, R.K.; Sipes, I.G. Prediction of metabolic clearance of bisphenol A (4,4 '-dihydroxy-2,2-diphenylpropane) using cryopreserved human hepatocytes. Drug metabolism and disposition: the biological fate of chemicals 2007, 35, 1910–1915. [Google Scholar] [CrossRef]
- Ginsberg, G.; Rice, D.C. Does rapid metabolism ensure negligible risk from bisphenol A? Environmental health perspectives 2009, 117, 1639–1643. [Google Scholar] [CrossRef] [PubMed]
- Mackenzie, P.I.; Walter Bock, K.; Burchell, B.; Guillemette, C.; Ikushiro, S.; Iyanagi, T.; Miners, J.O.; Owens, I.S.; Nebert, D.W. Nomenclature update for the mammalian UDP glycosyltransferase (UGT) gene superfamily. Pharmacogenet Genomics 2005, 15, 677–685. [Google Scholar] [CrossRef] [PubMed]
- Guillemette, C.; Levesque, E.; Harvey, M.; Bellemare, J.; Menard, V. UGT genomic diversity: beyond gene duplication. Drug Metab Rev 2010, 42, 24–44. [Google Scholar] [CrossRef] [PubMed]
- Knights, K.M.; Miners, J.O. Renal UDP-glucuronosyltransferases and the glucuronidation of xenobiotics and endogenous mediators. Drug metabolism reviews 2010, 42, 63–73. [Google Scholar] [CrossRef]
- Hanioka, N.; Naito, T.; Narimatsu, S. Human UDP-glucuronosyltransferase isoforms involved in bisphenol A glucuronidation. Chemosphere 2008, 74, 33–36. [Google Scholar] [CrossRef]
- Hanioka, N.; Oka, H.; Nagaoka, K.; Ikushiro, S.; Narimatsu, S. Effect of UDP-glucuronosyltransferase 2B15 polymorphism on bisphenol A glucuronidation. Archives of toxicology 2011, 85, 1373–1381. [Google Scholar] [CrossRef]
- Yokota, H.; Iwano, H.; Endo, M.; Kobayashi, T.; Inoue, H.; Ikushiro, S.; Yuasa, A. Glucuronidation of the environmental oestrogen bisphenol A by an isoform of UDP-glucuronosyltransferase, UGT2B1, in the rat liver. Biochem J 1999, 340 ( Pt 2) Pt 2, 405–409. [Google Scholar] [CrossRef]
- Mackenzie, P.I.; Bock, K.W.; Burchell, B.; Guillemette, C.; Ikushiro, S.; Iyanagi, T.; Miners, J.O.; Owens, I.S.; Nebert, D.W. Nomenclature update for the mammalian UDP glycosyltransferase (UGT) gene superfamily. Pharmacogenet Genomics 2005, 15, 677–685. [Google Scholar] [CrossRef]
- Caron, P.; Trottier, J.; Verreault, M.; Bélanger, J.; Kaeding, J.; Barbier, O. Enzymatic Production of Bile Acid Glucuronides Used as Analytical Standards for Liquid Chromatography−Mass Spectrometry Analyses. Mol Pharm 2006, 3, 293–302. [Google Scholar] [CrossRef] [PubMed]
- Trottier, J.; Verreault, M.; Grepper, S.; Monté, D.; Bélanger, J.; Kaeding, J.; Caron, P.; Inaba, T.T.; Barbier, O. Human UDP-glucuronosyltransferase (UGT)1A3 enzyme conjugates chenodeoxycholic acid in the liver. Hepatology 2006, 44, 1158–1170. [Google Scholar] [CrossRef] [PubMed]
- Barbier, O.; Girard, C.; Breton, R.; Belanger, A.; Hum, D.W. N-glycosylation and residue 96 are involved in the functional properties of UDP-glucuronosyltransferase enzymes. Biochemistry 2000, 39, 11540–11552. [Google Scholar] [CrossRef] [PubMed]
- Sumida, A.; Kinoshita, K.; Fukuda, T.; Matsuda, H.; Yamamoto, I.; Inaba, T.; Azuma, J. Relationship between mRNA levels quantified by reverse transcription-competitive PCR and metabolic activity of CYP3A4 and CYP2E1 in human liver. Biochem Biophys Res Commun 1999, 262, 499–503. [Google Scholar] [CrossRef]
- Trottier, J.; El Husseini, D.; Perreault, M.; Paquet, S.; Caron, P.; Bourassa, S.; Verreault, M.; Inaba, T.T.; Poirier, G.G.; Belanger, A.; et al. The human UGT1A3 enzyme conjugates norursodeoxycholic acid into a C23-ester glucuronide in the liver. J Biol Chem 2010, 285, 1113–1121. [Google Scholar] [CrossRef]
- Grosse, L.; Campeau, A.-S.; Caron, S.; Morin, F.-A.; Meunier, K.; Trottier, J.; Caron, P.; Verreault, M.; Barbier, O. Enantiomer Selective Glucuronidation of the Non-Steroidal Pure Anti-Androgen Bicalutamide by Human Liver and Kidney: Role of the Human UDP-Glucuronosyltransferase (UGT)1A9 Enzyme. Basic Clin Pharmacol Toxicol 2013, 113, 92–102. [Google Scholar] [CrossRef]
- Hanioka, N.; Isobe, T.; Tanaka-Kagawa, T.; Jinno, H.; Ohkawara, S. In vitro glucuronidation of bisphenol A in liver and intestinal microsomes: interspecies differences in humans and laboratory animals. Drug Chem Toxicol 2022, 45, 1565–1569. [Google Scholar] [CrossRef]
- Grosse, L.; Chouinard, S.; Paquet, S.; Verreault, M.; Trottier, J.; Belanger, A.; Barbier, O. Androgen Glucuronidation in Mice: When, Where, and How. Biology (Basel) 2022, 11. [Google Scholar] [CrossRef]
- Buckley, D.B.; Klaassen, C.D. Tissue- and gender-specific mRNA expression of UDP-glucuronosyltransferases (UGTs) in mice. Drug metabolism and disposition: the biological fate of chemicals 2007, 35, 121–127. [Google Scholar] [CrossRef]
- Mazur, C.S.; Kenneke, J.F.; Hess-Wilson, J.K.; Lipscomb, J.C. Differences between human and rat intestinal and hepatic bisphenol A glucuronidation and the influence of alamethicin on in vitro kinetic measurements. Drug metabolism and disposition: the biological fate of chemicals 2010, 38, 2232–2238. [Google Scholar] [CrossRef]
- Inoue, H.; Yuki, G.; Yokota, H.; Kato, S. Bisphenol A glucuronidation and absorption in rat intestine. Drug metabolism and disposition: the biological fate of chemicals 2003, 31, 140–144. [Google Scholar] [CrossRef]
- Teeguarden, J.G.; Waechter, J.M., Jr.; Clewell, H.J., 3rd; Covington, T.R.; Barton, H.A. Evaluation of oral and intravenous route pharmacokinetics, plasma protein binding, and uterine tissue dose metrics of bisphenol A: a physiologically based pharmacokinetic approach. Toxicological sciences : an official journal of the Society of Toxicology 2005, 85, 823–838. [Google Scholar] [CrossRef]
- Mackenzie, P.I.; Hu, D.G.; Gardner-Stephen, D.A. The regulation of UDP-glucuronosyltransferase genes by tissue-specific and ligand-activated transcription factors. Drug Metab Rev 2010, 42, 99–109. [Google Scholar] [CrossRef]
- Taylor, J.A.; Vom Saal, F.S.; Welshons, W.V.; Drury, B.; Rottinghaus, G.; Hunt, P.A.; Toutain, P.L.; Laffont, C.M.; VandeVoort, C.A. Similarity of bisphenol A pharmacokinetics in rhesus monkeys and mice: relevance for human exposure. Environmental health perspectives 2011, 119, 422–430. [Google Scholar] [CrossRef]
- Inoue, H.; Tsuruta, A.; Kudo, S.; Ishii, T.; Fukushima, Y.; Iwano, H.; Yokota, H.; Kato, S. Bisphenol a glucuronidation and excretion in liver of pregnant and nonpregnant female rats. Drug metabolism and disposition: the biological fate of chemicals 2005, 33, 55–59. [Google Scholar] [CrossRef] [PubMed]
Figure 1.
Representative chromatogram of bisphenol A-glucuronide. Representative chromatogram of bisphenol A-glucuronide (BPA-G) as obtained from incubated samples. Retention times were 2.2min for BPA-G and the deuterated internal standard BPA-G-d6. min : minutes; cps : count per second.
Figure 1.
Representative chromatogram of bisphenol A-glucuronide. Representative chromatogram of bisphenol A-glucuronide (BPA-G) as obtained from incubated samples. Retention times were 2.2min for BPA-G and the deuterated internal standard BPA-G-d6. min : minutes; cps : count per second.
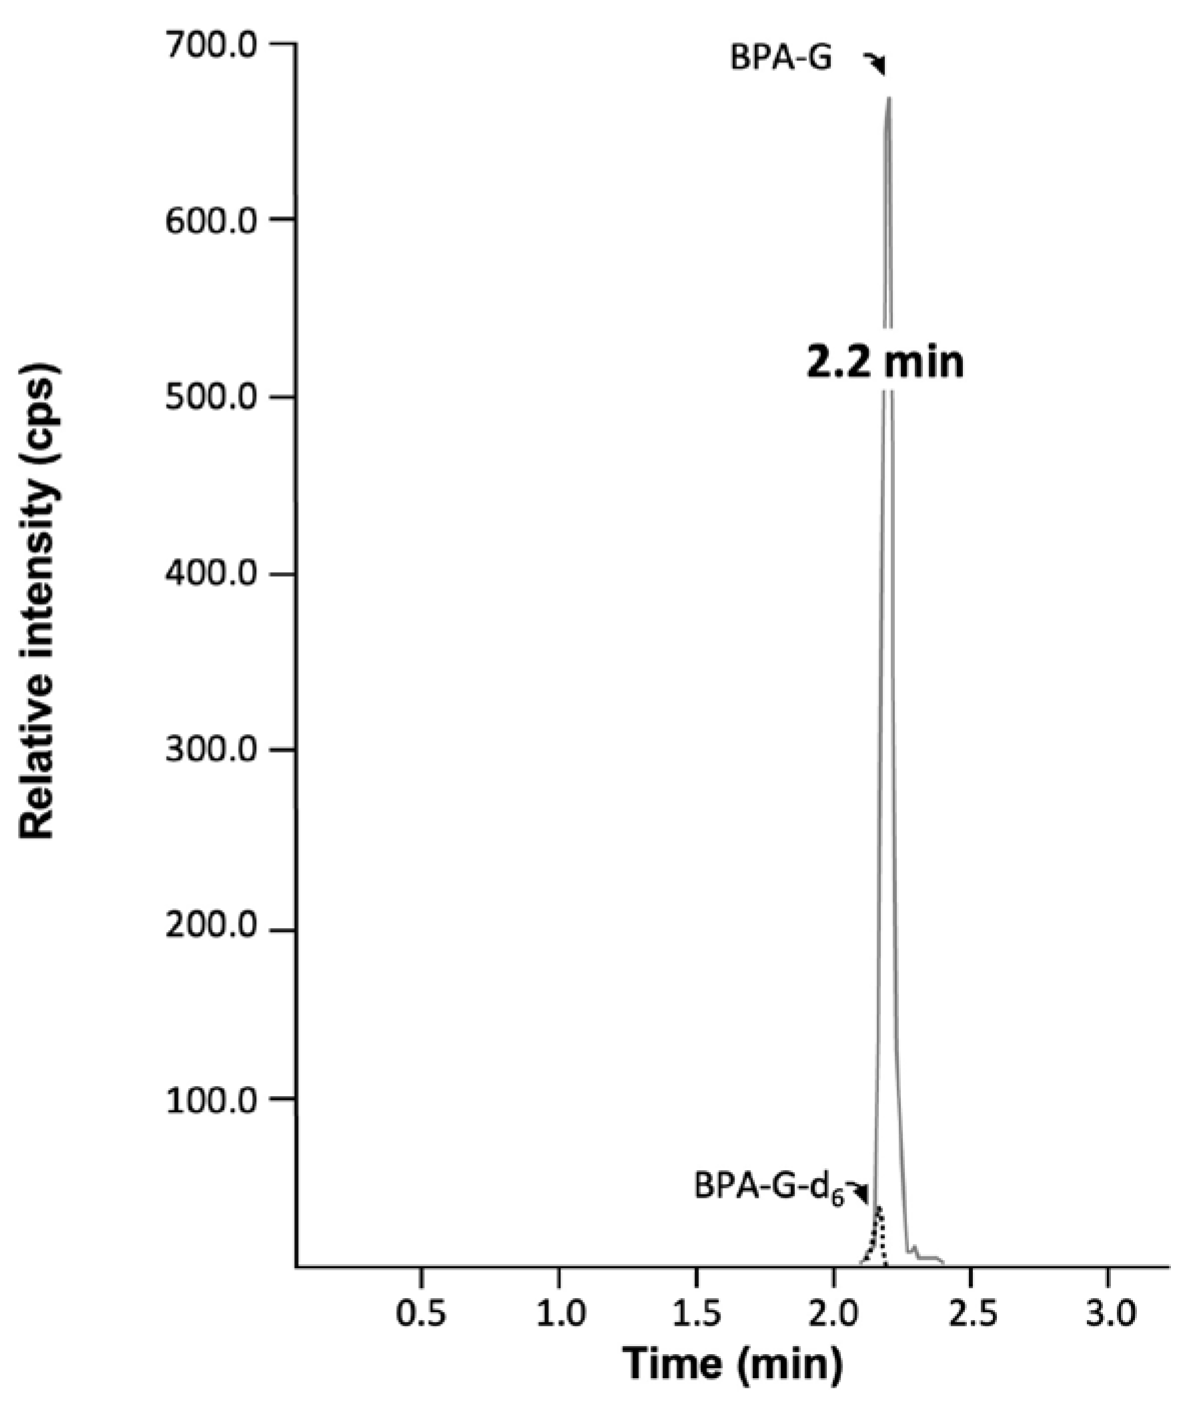
Figure 2.
Dose-response and kinetic analyses of bisphenol A conversion into its glucuronide conjugates by microsomes from human or murine liver. Mice (A-C) and human (C) liver microsomes (10 µg) were incubated in the presence of UDPGA (1mM) and increasing bisphenol A (BPA) concentrations (1-250μM) for 1H at 37°C. The formation of BPA-glucuronide (G) was analyzed by LC-MS/MS. While panel A presents results (mean±SD of triplicate experiments) from 3 male (♂) and 3 female (♀) animals, mean values (±SD) of each group (male versus female) are shown on panel B, and the mean (±SD) determined with results from the 6 animals is compared with results obtained in the presence of human liver microsomes (mean±SD of triplicate experiments) on panel C.
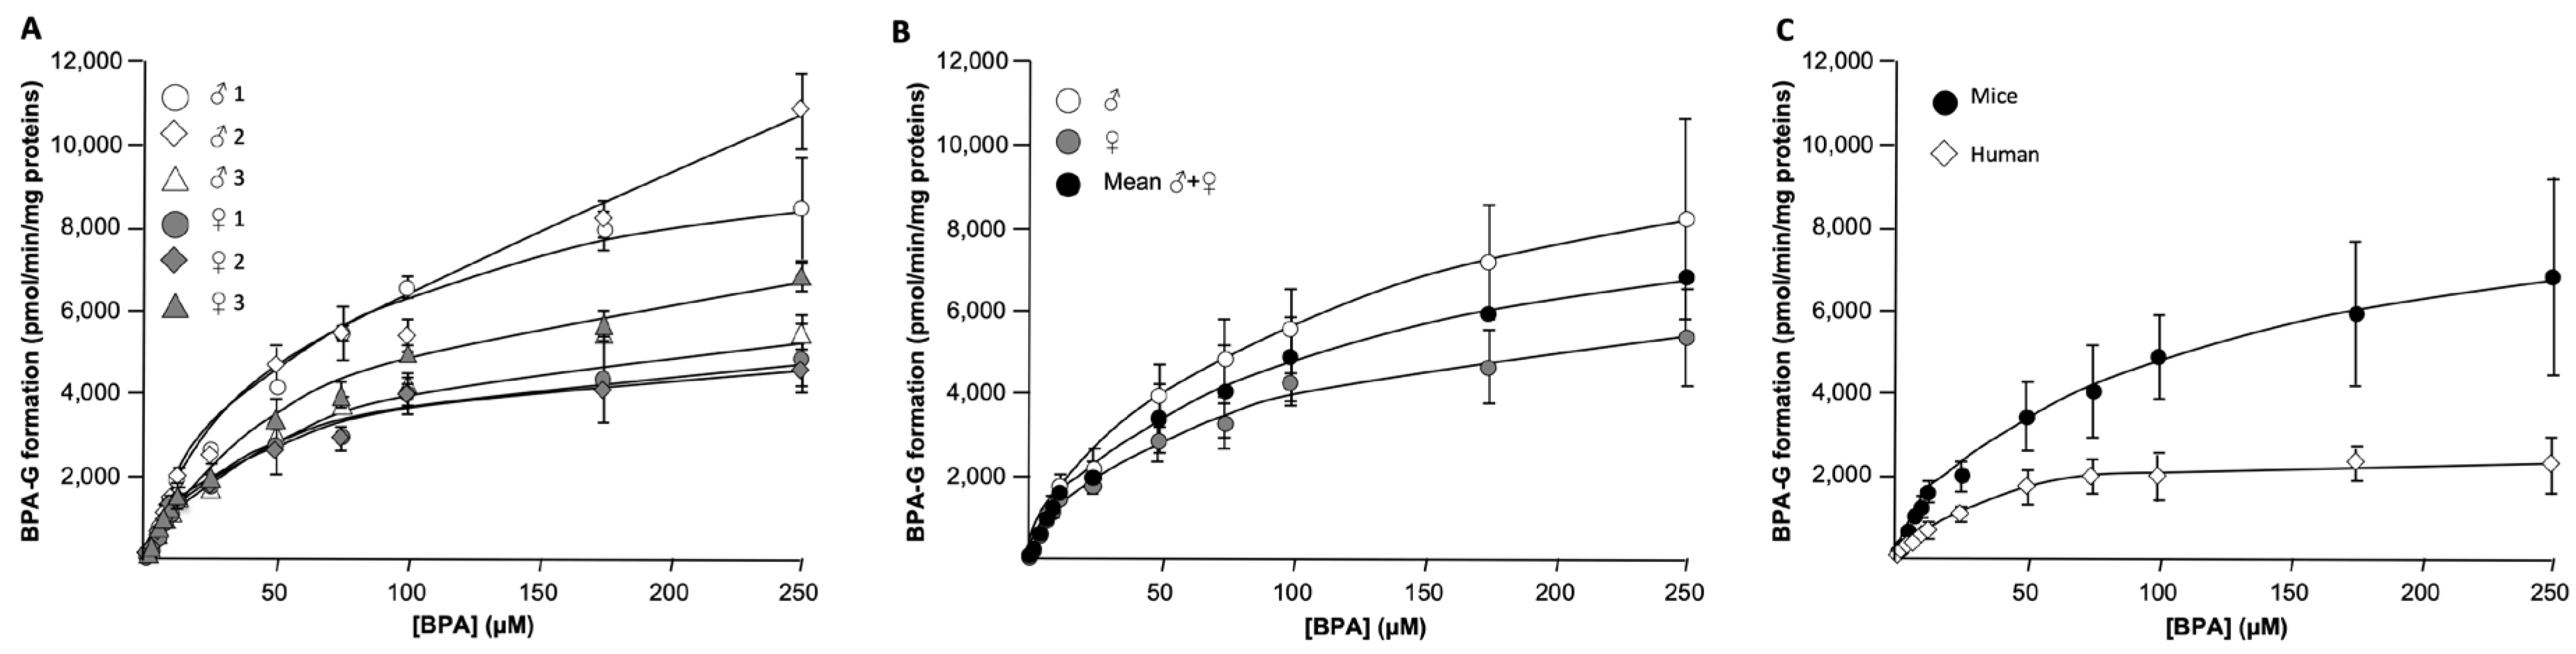
Figure 3.
Glucuronide conjugation of bisphenol A by recombinant murine Ugt2b enzymes. Homogenates (50µg) from Ugt2b-HEK293 cells were incubated in the presence of 500μM bisphenol A (BPA) and 1mM UDPGA for 30min at 37°C. The formation of BPA-glucuronide (-G) was resolved by LC-MS/MS. Data represent the mean±S.D. of experiments performed in triplicate.
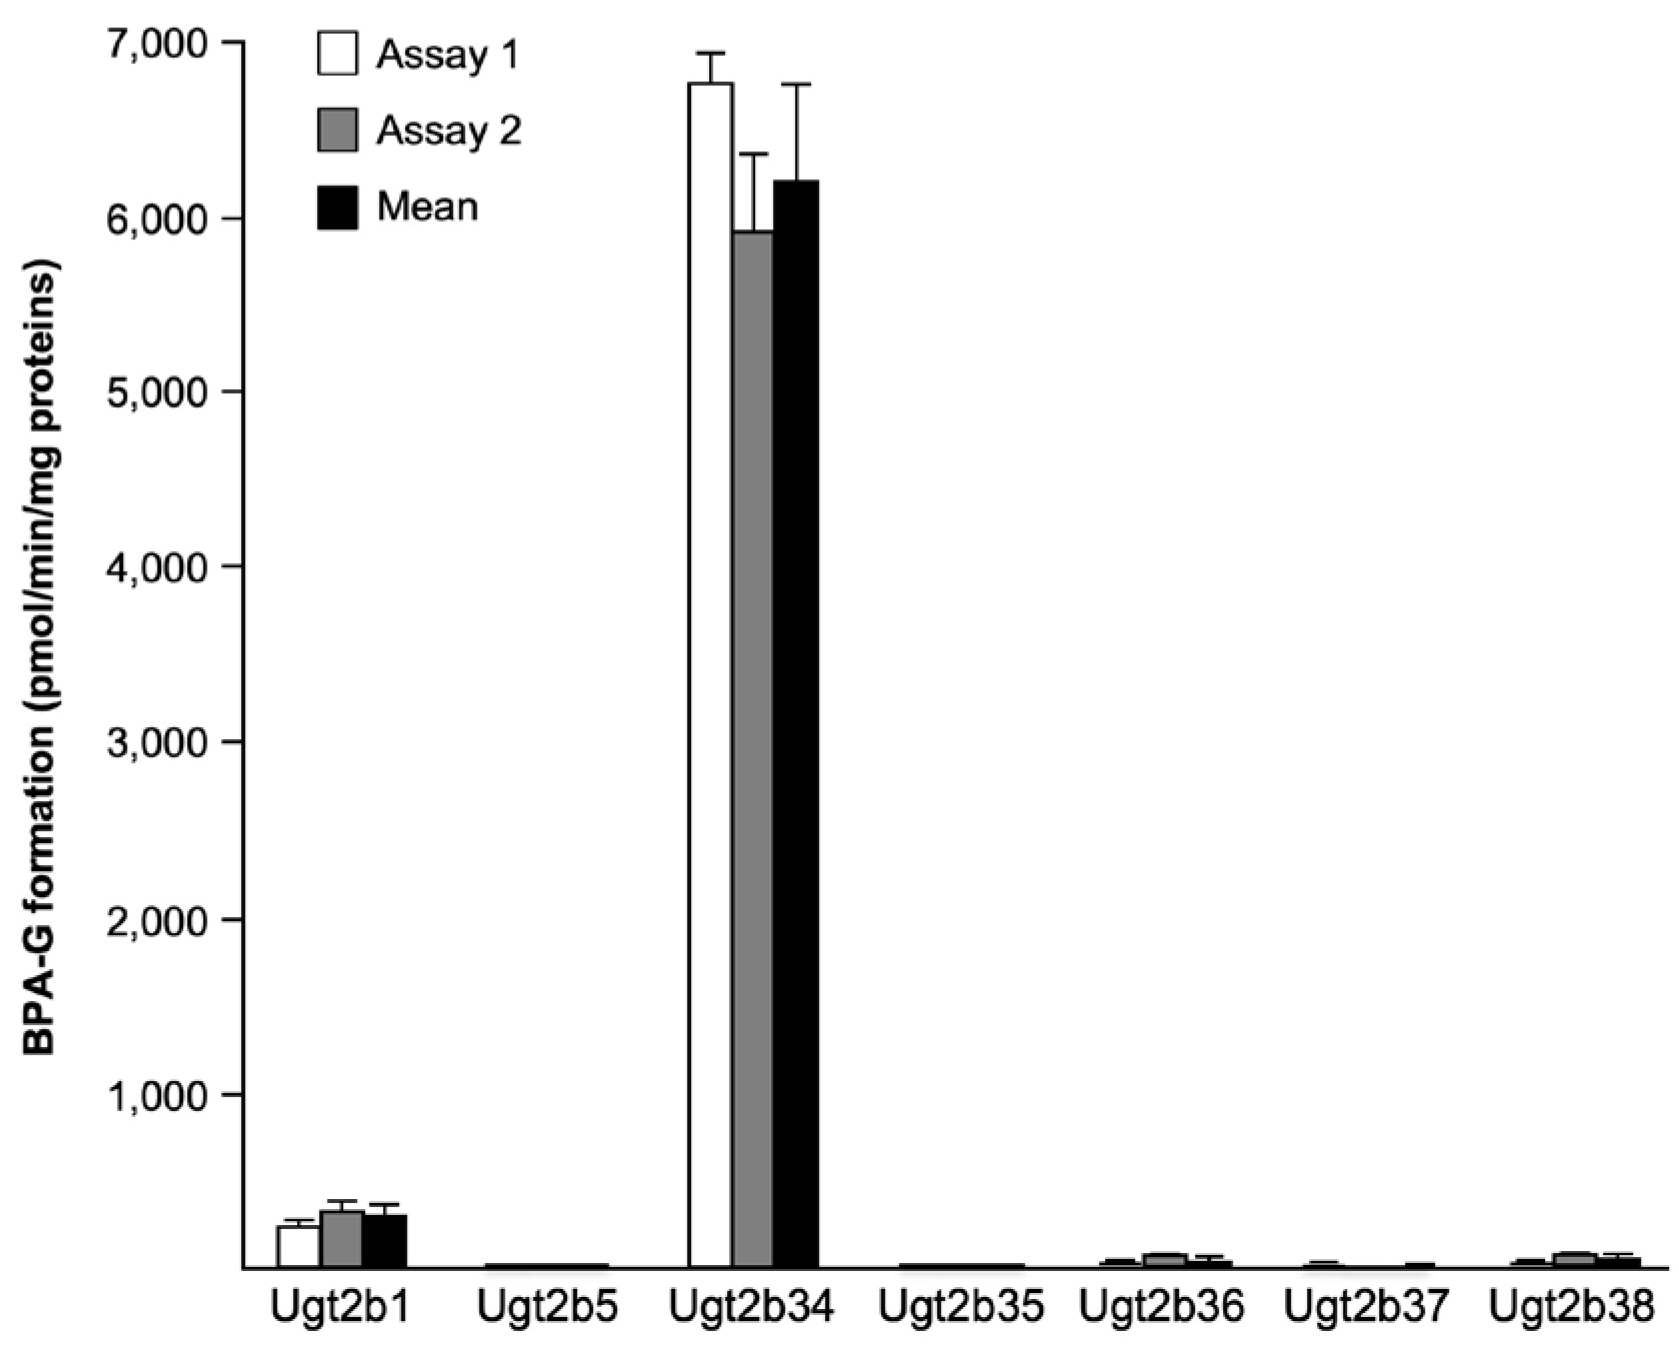
Figure 4.
Comparative analysis of bisphenol A-glucuronide formation, Ugt2b1 and Ugt2b34 transcript levels within BPA-reactive tissues. Bisphenol A glucuronidation activity was performed as in Figure 1. Total RNA was extracted from the same tissues of male (♂) and female (♀) mice. Messenger RNA levels of Ugt2b1 (A) and Ugt2b34 (B) enzymes were determined using quantitative RT-PCR, as described in the materials and method section. Data represent the mean ± S.D. of triplicates.
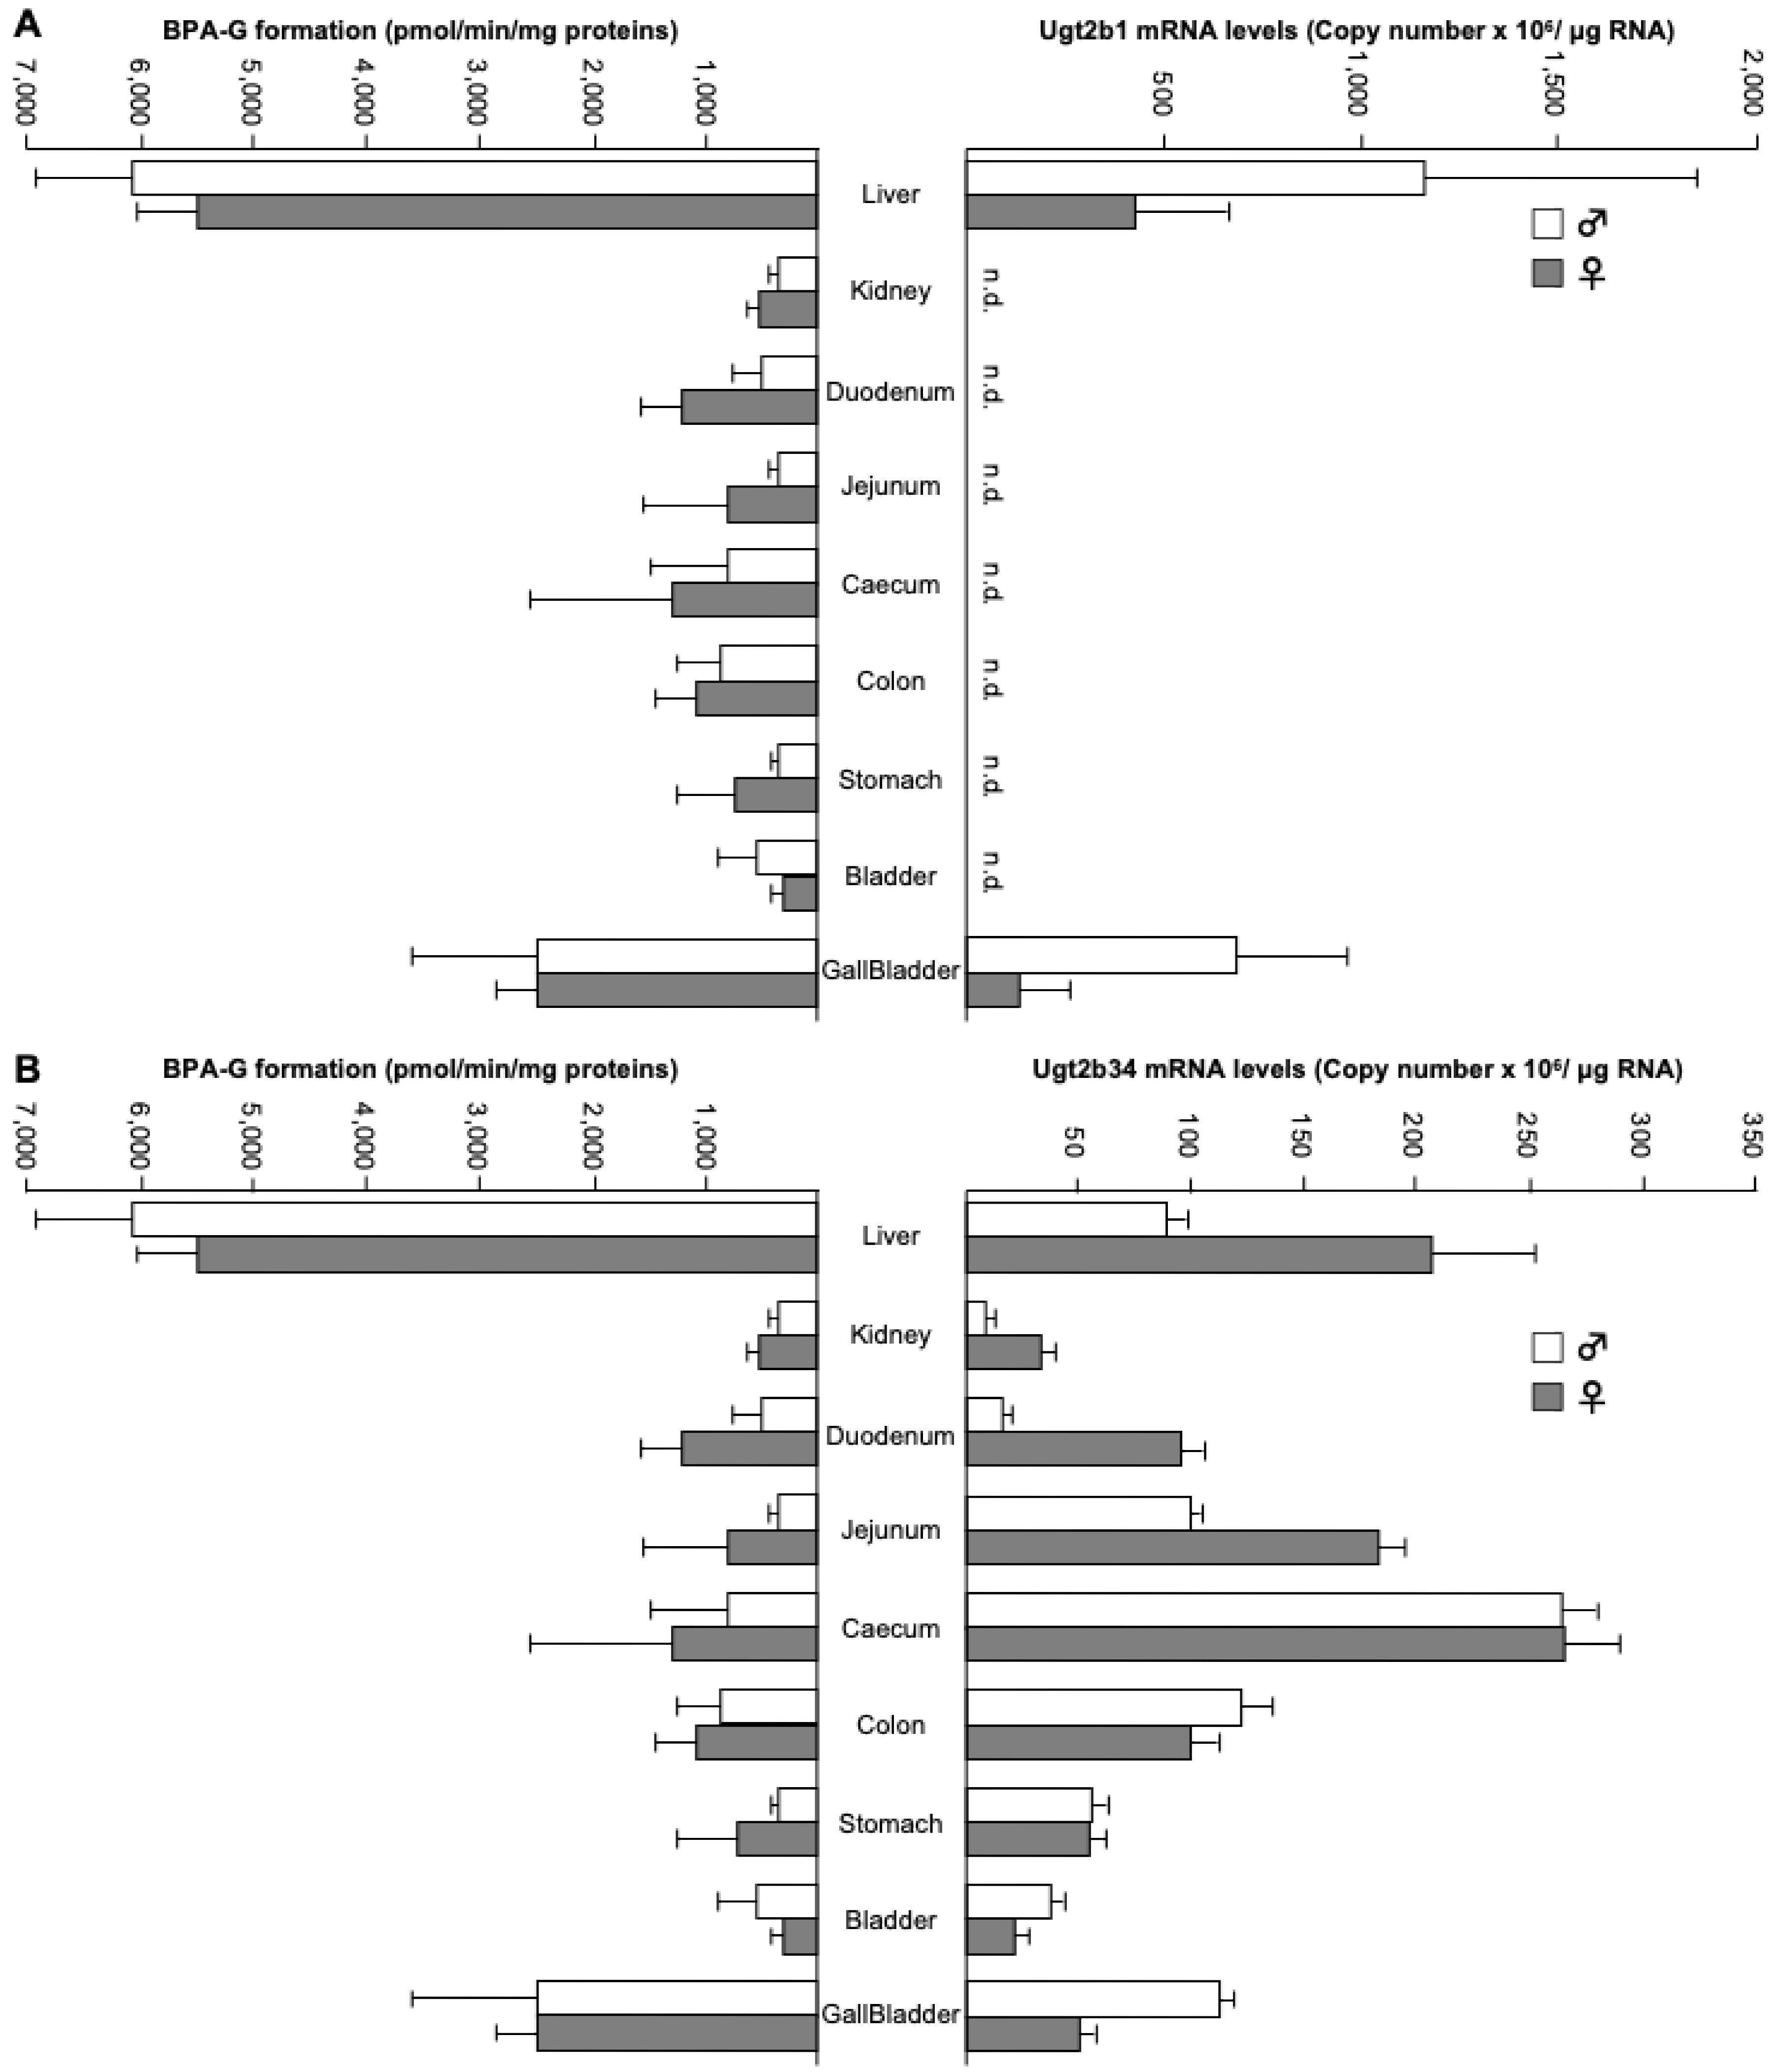

Table 1.
Primer sequences and annealing temperatures for real time PCR analyses of Ugt2b1 and Ugt2b34.
Table 1.
Primer sequences and annealing temperatures for real time PCR analyses of Ugt2b1 and Ugt2b34.
| Primer forward | Primer reverse | Temp | |
| PPIA | 5’-TCCTGGCATCTTGTCCATG-3’ | 5’-CATCCAGCCATTCAGTCTTG-3’ | 56°C |
| Ugt2b1 | 5’-TATGTTGCAGGTGTTGCT-3’ | 5’-GTCCCAGAAGGTTCGAAC-3’ | 62°C |
| Ugt2b34 | 5’-ATGTCAGAATTGAGTGACAGG-3’ | 5’-TGTCGTGGGTCTTCCTAAT-3’ | 63°C |
Table 2.
Conversion of bisphenol A (BPA) into BPA-glucuronide by murine tissues.
| ♂ 1 | ♂ 2 | Mean ♂1+2 | ♀ 1 | ♀ 2 | Mean ♀1+2 | Mean ♂+♀ | |
|---|---|---|---|---|---|---|---|
| Liver | 5,484.0±293.1 | 6,663.9±783.0 | 6,074.0±835.1 | 5,594.1±312.2 | 5,407.0±662.6 | 5,500.6±503.4 | 5,787.3±735.2 |
| Kidney | 423.0±5.0 | 275.6±3.3 | 349.3±80.8 | 609.5±39.5 | 436.2±48.8 | 522.8±102.9 | 436.1±126.5 |
| Duodenum | 715.6±89.0 | 303.6±5.9 | 509.6±232.6 | 901.5±86.6 | 1,526.4±114.6 | 1,214.0±354.1 | 861.8±465.7 |
| Jejunum | 393.3±5.8 | 324.0±98.0 | 358.6±72.8 | 1,469.7±113.2 | 129.8±13.4 | 799.8±737.4 | 579.2±550.2 |
| Ileum | 127.6±5.2 | 315.2±14.7 | 221.4±103.2 | 100.3±8.4 | 14.3±3.7 | 57.3±47.5 | 139.3±114.9 |
| Caecum | 1,416.4±56.5 | 207.4±10.5 | 811.9±663.2 | 136.6±11.5 | 2,442.2±82.5 | 1,289.4±1,263.9 | 1,050.7±994.1 |
| Colon | 1,192.5±63.4 | 524.2±209.8 | 858.4±391.4 | 1,397.1±65.5 | 768.4±25.0 | 1,082.8±347.2 | 970.6±371.7 |
| Mammary gland | 7.1±1.9 | 7.9±0.4 | 7.5±1.3 | 13.4±0.7 | 19.1±2.8 | 16.3±3.6 | 11.9±5.3 |
| Gallbladder | 1,643.9±175.5 | 3,256.6±1,097.6 | 2,450.3±1,129.0 | 2,556.2±328.8 | 2,348.7±477.2 | 2,452.5±383.7 | 2,451.4±803.9 |
| Heart | B.L.Q | 1.1±0.4 | 1.1±0.4 | 4.4±0.6 | 1.1±0.1 | 2.7±1.8 | 1.8±1.6 |
| Brain | B.L.Q | 1.1±0.1 | 1.1±0.1 | 0.8±0.2 | B.L.Q | 0.8±0.2 | 0.9±0.2 |
| Stomach | 295.4±48.7 | 401.0±20.3 | 348.2±66.8 | 235.8±77.7 | 1,184.8±107.6 | 710.3±526.6 | 529.2±404.7 |
| Lung | 22.2±1.0 | 27.3±1.0 | 24.8±3.0 | 34.4±4.1 | 27.6±0.7 | 31.0±4.5 | 27.9±4.9 |
| Muscle | 0.9±0.1 | 0.3±0.0 | 0.6±0.4 | B.L.Q | B.L.Q | B.L.Q | 0.6±0.4 |
| Adipose tissue | 17.3±1.4 | 41.1±3.1 | 29.2±13.2 | 43.7±5.2 | 33.9±3.4 | 38.8±6.6 | 34.0±11.1 |
| Bladder | 249.2±8.7 | 847.1±76.7 | 548.1±331.1 | 257.4±24.4 | 391.1±63.7 | 324.3±85.0 | 436.2±258.4 |
| Pancreas | 16.6±2.0 | 22.9±3.2 | 19.8±4.2 | 35.3±10.1 | 26.0±15.8 | 30.7±12.9 | 25.2±10.8 |
| ♂ 1 | ♂ 2 | Mean ♂1+2 | ♀ 1 | ♀ 2 | Mean ♀1+2 | Mean♂+♀ | |
| Spleen | 3.7±0.2 | 6.4±0.9 | 5.0±1.6 | 7.0±0.3 | 20.0±0.2 | 13.5±7.1 | 9.3±6.6 |
| Adrenals | 3.4±0.1 | 7.8±0.3 | 5.6±2.4 | 4.9±0.1 | 5.9±0.5 | 5.4±0.7 | 5.5±1.7 |
| Skin | 1.3±0.1 | 9.1±0.4 | 5.2±4.3 | 2.0±0.1 | 2.1±0.1 | 2.1±0.1 | 3.6±3.3 |
| Prostate | 4.3±0.5 | 4.5±0.2 | 4.4±0.4 | N.A | N.A | N.A | 4.4±0.4 |
| Epididymis | 9.8±1.3 | 25.4±2.6 | 17.6±8.7 | N.A | N.A | N.A | 17.6±8.7 |
| Testis | 113.5±2.9 | 133.4±12.2 | 123.4±13.5 | N.A | N.A | N.A | 123.4±13.5 |
| Bulbospongious | B.L.Q | 2.0±0.1 | 2.0±0.1 | N.A | N.A | N.A | 2.0±0.1 |
| Seminal vesicle | 3.4±0.2 | B.L.Q | 3.4±0.2 | N.A | N.A | N.A | 3.4±0.2 |
| Uterus | N.A | N.A | N.A | 36.7±1.6 | 32.2±6.5 | 34.5±4.9 | 34.5±4.9 |
| Oviduct | N.A | N.A | N.A | 155.3±5.3 | 124.3±7.0 | 139.8±17.9 | 139.8±17.9 |
| Ovary | N.A | N.A | N.A | 11.7±3.1 | 14.9±1.4 | 13.3±2.8 | 13.3±2.8 |
| Vagina | N.A | N.A | N.A | 44.9±3.8 | 81.4±2.6 | 63.1±20.2 | 63.1±20.2 |
BPA-G formation (mean±SD) is expressed as pmol/min/mg proteins. B.L.Q: Below the Limit of Quantification; N.A: Not Applicable.
Table 3.
Kinetic parameters of bisphenol A-glucuronide (BPA-G) formation by microsomal proteins from mice and human livers.
Table 3.
Kinetic parameters of bisphenol A-glucuronide (BPA-G) formation by microsomal proteins from mice and human livers.
| KM | Vmaxapp. | CLINT. (Vmaxapp./KM) | ||
| µM | pmol/min/mg proteins | μL/min/mg proteins | ||
| Mice | ♂ 1 | 76.2±6.8 | 8,447.5±1,244.5 | 110.9 |
| ♂ 2 | 157.9±26.0 | 10,814.6±923.9 | 68.7 | |
| ♂ 3 | 64.6±9.2 | 5,461.5±114.9 | 84.5 | |
| Mean ♂ 1-3 | 99.6±50.8 | 8,241.2±2,457.1 | 88.0±21.3 | |
| ♀ 1 | 52.6±7.7 | 4,834.2±827.6 | 91.9 | |
| ♀ 2 | 39.9±4.9 | 4,519.6±333.1 | 113.4 | |
| ♀ 3 | 75.3±7.1 | 6,798.9±338.5 | 90.3 | |
| Mean ♀ 1-3 | 55.9±18.0 | 5,384.2±1,171.3 | 98.5±12.9 | |
| Mean♂+♀ | 77.8±41.6 | 6,812.7±2,376.4 | 93.3±16.8 | |
| Human | Assay 1 | 33.3±6.8 | 2,079.9±341.9 | 62.4 |
| Assay 2 | 37.5±3.6 | 2,854.6±92.7 | 76.1 | |
| Mean | 35.4±3.0 | 2,467.3±547.9 | 69.2±9.7 |
Results are expressed as mean±SD of experiments performed in triplicate. Vmaxapp.: Apparent maximal velocity value. CLINT.: Intrinsic clearance.
Table 4.
Kinetic parameters of bisphenol A-glucuronide (BPA-G) formation by microsomal proteins from the murine caecum, colon and gallbladder.
Table 4.
Kinetic parameters of bisphenol A-glucuronide (BPA-G) formation by microsomal proteins from the murine caecum, colon and gallbladder.
| KM | Vmaxapp. | CLINT. (Vmaxapp./KM) | ||
| µM | pmol/min/mg proteins | μL/min/mg proteins | ||
| Caecum | ♂ | 97.1±13.3 | 4,223.1±410.9 | 43.5 |
| ♀ | 74.4±9.4 | 8,443.5±298.4 | 113.4 | |
| ♂+♀ | 85.8±16.0 | 6,333.3±2,984.3 | 78.5±49.5 | |
| Colon | ♂ | 82.3±13.7 | 5,844.3±85.9 | 71.0 |
| ♀ | 52.1±5.4 | 1,556.7±188.3 | 29.9 | |
| ♂+♀ | 67.2±21.4 | 3,700.5±3,031.8 | 50.4±29.1 | |
| Gallbladder | Pool* | 19.6±7.5 | 3,729.4±92.9 | 190.3 |
Results are expressed as mean±SD of experiments performed in triplicate. Vmaxapp.: Apparent maximal velocity value. CLINT.:: Intrinsic clearance. *pool: gallbladders from 10 animals (9 females and 1 male; age: 84-112days) were pooled.
Table 5.
Kinetic parameters of bisphenol A-glucuronide (BPA-G) formation by recombinant murine Ugt2b1 and Ugt2b34, and human UGT2B15 enzymes.
Table 5.
Kinetic parameters of bisphenol A-glucuronide (BPA-G) formation by recombinant murine Ugt2b1 and Ugt2b34, and human UGT2B15 enzymes.
| KM | Vmaxapp. | CLINT. (Vmaxapp./KM) | ||
| µM | pmol/min/mg proteins | μL/min/mg proteins | ||
| Ugt2b1 | Assay 1 | 2.6±0.5 | 333.5±17.8 | 126.3 |
| Assay 2 | 2.3±0.6 | 445.2±48.3 | 191.9 | |
| Mean | 2.5±0.2 | 389.4±79.0 | 159.1±46.4 | |
| Ugt2b34 | Assay 1 | 100.7±17.4 | 8,615.5±1,003.9 | 85.5 |
| Assay 2 | 96.0±9.5 | 10,747.2±670.6 | 111.9 | |
| Mean | 98.4±3.3 | 9,681.3±1,507.3 | 98.7±18.7 | |
| UGT2B15 | Assay 1 | 36.7±4.4 | 897.1±166.8 | 24.4 |
| Assay 2 | 37.8±4.8 | 1,103.1±54.9 | 29.2 | |
| Mean | 37.2±0.8 | 1,000.1±145.7 | 26.8±3.4 |
Results are expressed as mean±SD of experiments performed in triplicate. Vmaxapp.: Apparent maximal velocity value. CLINT.:: Intrinsic clearance.
Disclaimer/Publisher’s Note: The statements, opinions and data contained in all publications are solely those of the individual author(s) and contributor(s) and not of MDPI and/or the editor(s). MDPI and/or the editor(s) disclaim responsibility for any injury to people or property resulting from any ideas, methods, instructions or products referred to in the content. |
© 2025 by the authors. Licensee MDPI, Basel, Switzerland. This article is an open access article distributed under the terms and conditions of the Creative Commons Attribution (CC BY) license (http://creativecommons.org/licenses/by/4.0/).
Copyright: This open access article is published under a Creative Commons CC BY 4.0 license, which permit the free download, distribution, and reuse, provided that the author and preprint are cited in any reuse.


