
Submitted:
24 August 2025
Posted:
25 August 2025
You are already at the latest version
Abstract
Machine learning is a powerful approach for analysing RNA sequences, particularly for understanding the function and regulation of non-coding RNAs. A critical step in this process is feature extraction, which transforms biological sequences into numerical representations that allow computational models to capture and interpret complex biological patterns. Despite its central role, the field of RNA feature extraction remains broad and fragmented, with limited standardization and accessibility hindering consistent application. In this comprehensive review, we address the fragmentation of the field by systematically organizing over 25 feature extraction strategies into sequence- and structure-based approaches. We further conduct a comparative analysis highlighting how the choice of feature sets impacts model performance, reinforcing the importance of integrated feature engineering. To facilitate practical adoption, it also provides a curated list of publicly available tools and software packages. By consolidating methodologies and resources, this work seeks to improve reproducibility, scalability, and interpretability in machine learning-driven RNA research.
Keywords:
RNA bioinformatics
; non-coding RNA (ncRNA)
; feature extraction
; machine learning
; sequence
; representation
1. Introduction
RNA sequencing (RNA-seq) has revolutionized transcriptomics by enabling the comprehensive analysis of RNA expression across various cell types, tissues, and biological conditions [1,2]. Beyond quantifying gene expression, RNA-seq data support diverse applications such as the discovery of novel transcripts, annotation of non-coding RNAs (ncRNAs), and exploration of transcriptomic diversity [1]. RNA molecules, including messenger RNAs (mRNAs) and various classes of non-coding RNAs such as microRNAs (miRNAs), long non-coding RNAs (lncRNAs), small RNAs (sRNAs), and circular RNAs (circRNAs), play essential roles in gene regulation, RNA processing, epigenetic control, and molecular interactions in both prokaryotic and eukaryotic organisms [3,4,5,6]. Determining the sequence and structural properties of these RNAs is therefore critical for understanding cellular behaviour, genetic regulatory regions, and identifying biomarkers or therapeutic targets [2].
With an increasing number of RNA-seq datasets, one of the key challenges is the transformation of raw sequence data into meaningful, quantifiable features suitable for computational modelling [7,8]. Machine learning (ML) algorithms cannot interpret nucleotide sequences in their original form and therefore require the data to be converted into informative numerical representations. This transformation is achieved through feature extraction, a vital preprocessing step that encodes sequence and structural properties into numerical formats that retain relevant biological patterns while minimizing noise and redundancy [9,10,11]. These extracted features facilitate the development of predictive models based on machine learning, which can be applied to various domain-specific applications in molecular biology and biomedical research. These applications include but are not limited to: RNA classification (e.g., non-coding vs. coding RNAs), RNA-protein and RNA-RNA interaction prediction, transcript stability analysis, prediction of subcellular localization, functional annotation, and the design of therapeutic RNAs, including small interfering RNAs (siRNAs), RNA aptamers, and CRISPR guide RNAs. The quality and consistency of the extracted features are critical to the effectiveness of these applications, as they influence model accuracy, generalizability, and interpretability [7,8]
In parallel with traditional feature extraction methods, deep learning-based representation learning approaches have emerged as a promising direction in computational biology [12]. Representation learning aims to automatically extract meaningful features directly from raw sequence data, thereby eliminating the need for manual feature design [13]. However, despite its potential, representation learning faces challenges such as its reliance on large datasets, susceptibility to overfitting when applied to small datasets, significant computational requirements, and function as black-box models, limiting transparency in decision-making [14,15,16,17]. For small to medium-sized datasets, traditional machine learning methods such as support vector machines, random forests, and gradient boosting remain effective alternatives. Although they require structured feature engineering, which involves additional preprocessing, this process enables a more interpretable and systematically controlled modelling approach [18].
Despite increasing interest in ML for RNA analysis, there is no consolidated overview of feature extraction techniques tailored to RNA sequences and structures. Existing approaches are scattered across domains, vary in implementation, and lack standardized documentation, hindering reproducibility and accessibility, particularly for researchers with limited programming expertise.
To address this gap, this review provides a structured, accessible overview of established feature extraction strategies for RNA, categorized into sequence-based and structure-based methods. Figure 1 outlines the complete workflow, from raw RNA sequences through feature extraction and integration into predictive modelling frameworks. In addition to methodological categorization, we compile publicly available tools and software packages to support practical implementation. By organizing and contextualizing existing methods, this work aims to advance reproducibility, accessibility, and interpretability in ML-driven RNA biology.
2. Foundations of RNA Feature Extraction
2.1. Sequence-Based Features
Feature extraction from RNA sequences is a critical step in machine learning based RNA analysis, transforming raw nucleotide strings into structured quantitative representations suitable for predictive modelling. A wide range of feature extraction techniques have been developed to encode RNA sequences, spanning from simple frequency-based representations to advanced network-theoretic approaches [19], many of which are implemented in open-source toolkits [20]. Broadly, sequence-derived features can be categorised into the following groups: nucleotide composition-based features, numerical mapping and signal transformation methods, Fourier and Chaos-based features, entropy and information-theoretic measures, autocorrelation-based descriptors, pseudo nucleotide compositions, and similarity or instance-based features [19]. This categorization reflects an increasing level of computational and biological sophistication, progressing from the capture of local nucleotide patterns to the modelling of long-range dependencies, physicochemical properties, and structural complexities embedded within RNA sequences.
2.1.1. Nucleic Acid Composition
These methods capture short range or local sequence order by counting the occurrence frequencies of adjacent or non-contiguous residues include:
One-hot encoding: One hot encoding is a widely adopted feature extraction technique that represents each nucleotide in the RNA sequence as a unique binary vector. An RNA sequence composed of the four bases A, U, C, and G can be represented by a 4-dimensional vector for each base. For example, A is represented as [1,0,0,0], U as [0,1,0,0], C as [0,0,1,0], and G as [0,0,0,1]. Therefore, an RNA sequence of length L can be expressed as a 4 × L dimensional binary matrix in which each column corresponds to a sequence position and each row represents a specific nucleotide [21].
K-mer composition: The k-mer feature counts the frequency of distinct nucleotide subsequences of length k within the RNA sequence. This is achieved by sliding a window of length k along the sequence and counting how often each possible k-mer appears. The process considers all contiguous subsequences of size k from position 1 to position (L − k + 1). The frequency () is calculated as:
Eq. 1
where is the count of a specific k-mer, is sequence length, is the maximum value, and denotes the four nucleotide types [22]. K-mer features have been widely applied in the analysis of RNA sequence properties, including classification of coding and non-coding RNAs, identification of structural motifs, and functional annotation tasks [23,24,25].
Enhanced Nucleic Acid Composition (ENAC): Local nucleic acid composition can be calculated using the Enhanced Nucleic Acid Composition encoding, which applies a fixed length sliding window that moves sequentially from the 5′ to the 3′ end of the nucleotide sequence. This method is generally applied to nucleotide sequences of equal length. The sliding window size and sequence length determine the ENAC encoding dimension, calculated as . The ENAC encoding is defined as follows [26]:
Eq. 2
Eq. 3
where represents the frequency of nucleotide within a given window () of the sequence and is the count of nucleotide within that window.
Reverse complement k-mer: The reverse complement k-mer (k-RevcKmer) is a variation of the standard k-mer feature used in RNA sequence analysis. In this approach, both the original k-mers in the sequence and their reverse complements are considered during feature extraction. First, all possible k-mers are generated from the RNA sequence. Any k-mer that is identical to its reverse complement is removed to avoid redundancy. The remaining k-mers are then used to construct a feature vector, with each feature representing the frequency of a specific k-mer in the sequence. This method reduces the dimensionality of the k-mer space while retaining information from complementary strand orientations [27].
Mismatch Profile: The mismatch profile approach is an extension of traditional k-mer counting that allows up to m mismatches within each k-mer, where m < k. For example, if m = 1 and k = 3, the notation (3, 1) refers to a 3-length subsequence with at most one mismatch. Considering a 3-mer “AAC” with one allowed mismatch, the count would include not only “AAC” itself, but also variants such as “AAG,” “AAA,” “AAU,” “GAC,” “CAC,” and “UAC” that appear in the sequence. The mismatch profile of a sequence x can be expressed as:
Eq. 4
Here, indicates the frequency of the -th k-mer variant in sequence with mismatches, where ranges from 1 to and from 0 to . By incorporating both exact matches and near matches, the mismatch profile captures a broader spectrum of sequence patterns, potentially revealing biologically significant variations that standard k-mer counts may miss [28,29].
xxKGAP Encoding: The xxKGAP composition is a key approach employed in PyFeat package [7], considering kgaps in RNA sub-sequences. A sliding window is utilized to count the occurrences of discontinuous bases with g gaps (), and the frequency () is calculated as:
Eq. 5
where represents the maximum value of [22]. For example, the sequence can be encoded into X_X frequencies for mMKGap features with a kgap of 1, producing 16-dimensional features (). If kgap = 2, the sequence can be characterised by 32 features (). For dMKGap, the total number of features is calculated as [20]. This representation allows the capture of dependencies between nonadjacent nucleotides, which can reflect structural or functional patterns in RNA sequences.
GC content: GC content indicates the proportion of guanine and cytosine nucleotides within an RNA sequence. This metric is often employed to differentiate protein-coding regions from non-coding sequences. Generally, non-coding elements such as 5′ untranslated regions (UTRs) and introns have a lower percentage of GC bases compared to protein-coding sequences. The GC content is calculated as follows [30]:
Eq. 6
where and refer to the numbers of G and C nucleotides respectively, and is the overall transcript length.
Accumulated nucleotide frequency: The accumulated nucleotide frequency (ANF) encoding system represents the density and distribution of each nucleotide within a sequence [26]. To capture the nucleotide frequency and the distribution of each nucleotide in the RNA sequence, the density () of any nucleotide () at position in the RNA sequence is defined using the following formula [31],
Eq. 7
Eq. 8
Here, represents the length of the sequence, denotes the length of the -th prefix string within the sequence, and . For the example sequence “UCGUUCAUGG”, the density of each nucleotide is as follows: For ‘U’, the density is 1 (1/1) at position 1, 0.5 (2/4) at position 4, 0.6 (3/5) at position 5, and 0.5 (4/8) at position 8. For ‘C’, the density is 0.5 (1/2) and 0.33 (2/6) at positions 2 and 6, respectively. The density of ‘A’ is 0.14 (1/7) at position 7. Finally, the density of ‘G’ is 0.33 (1/3) at position 3, 0.22 (2/9) at position 9, and 0.3 (3/10) at position 10 [31].
AUGC Ratio: The AU/GC ratio is a simple compositional feature that generates a single scalar value for each RNA sequence. It measures the relative abundance of adenine and uracil bases compared to guanine and cytosine bases. The ratio is calculated as [32].
Eq. 9
GC Skew: GC skew, calculated as , measures strand-specific nucleotide asymmetry and is commonly used to determine replication origin and terminus in bacterial genomes [33,34]. Although originally developed as a genome level measure, GC skew can also be applied to RNA sequences to provide additional compositional information that may be relevant for distinguishing functional classes or structural properties [32,35].
2.1.2. Autocorrelation Descriptors
These approaches look for correlations between two di- or trinucleotides based on their physicochemical properties for RNA sequence analysis. Unlike simple compositional features, which only quantify nucleotide frequencies, autocorrelation descriptors preserve sequence-order information and can reveal periodic or long-range dependencies, making them useful for complex sequence analysis tasks. Two widely used approaches are autocovariance, which measures correlations of the same physicochemical property across nucleotide groups at a defined distance, and cross-covariance, which assesses correlations between different physicochemical indices [36]. According to the approaches applied in several studies for RNA, the autocorrelation module is divided into several categories based on different properties and correlation types. These include dinucleotide-based autocorrelation (DAC), dinucleotide-based Moran autocorrelation (DMAC), dinucleotide-based Geary autocorrelation (DGAC), and normalised Moreau-Broto autocorrelation (NMBAC). Similarly, for cross-correlation and auto-cross-correlation modules, two methods exist for RNA: dinucleotide-based cross-correlation (DCC) and dinucleotide-based auto-cross-correlation (DACC) [37,38].
2.1.3. Pseudo Nucleotide Composition
The third category of sequence-derived features includes pseudo k-tuple nucleotide composition (PseKNC) methods, which are designed to capture both global and long-range sequence-order information, as well as physicochemical properties of nucleotides. Due to their strong performance across various predictive tasks, several versatile web servers and software tools have been developed to generate pseudo nucleotide composition features [39,40,41]. A comprehensive overview of pseudo nucleotide composition approaches can be found in a recent review [42]. Within this category, pseudo dinucleotide composition (PseDNC) encoding is one of the most widely used methods in RNA sequence analysis. PseDNC takes into account not only the sequential arrangement of nucleotides but also the physicochemical properties of dinucleotide pairs within the RNA molecule, resulting in a numerical feature set for each analysed sequence. The total number of PseDNC features is given by 16+λ. The initial 16 features are derived from pairs of adjacent dinucleotides. The remaining λ features are calculated based on dinucleotide pairs that are separated by different distances along the sequence. λ denotes the greatest possible separation between any two dinucleotides considered in the analysis [43]. Several publicly available packages have been developed to extract PseDNC features such as Pse-in-One 2.0 [44], repRNA [45], and UltraPse [46].
2.1.4. Numerical Mapping Features
Real, integer, and complex number mappings: In sequence analysis, numerical mapping methods such as integer, complex, and real number representations are widely used to convert symbolic nucleotide sequences into numerical form suitable for computational analysis [19]. Integer mapping assigns simple whole numbers to nucleotides, for example A = 0, C = 1, G = 2, and T/U = 3 [47]. Complex number mapping places nucleotides as points in the complex plane, such as A = 1 + i, T/U = 1 − i, C = −1 − i, and G = −1 + i [48]. Real number mapping, on the other hand, uses continuous real values such as A = −1.5, T/U = 1.5, C = 0.5, and G = −0.5. This representation has the useful property that complementary sequences can be derived by reversing the sequence order and changing the sign of each value [49].
EIIP: EIIP encoding transforms RNA sequences into numerical feature vectors by assigning each nucleotide a specific electron-ion interaction Pseudopotentials (EIIP) value: A = 0.1260, C = 0.1340, G = 0.0806, and U = 0.1335 [50]. To represent trinucleotide composition, this method constructs a 64-dimensional feature vector in which each element corresponds to a specific trinucleotide. For a trinucleotide sequence , the EIIP value is calculated as:
Eq. 10
where m, n, o ∈ {A, C, G, U} and is the frequency of that trinucleotide in the sequence. The resulting vector is:
Eq. 11
Z-Curve: The Z-curve theory, originally developed for DNA sequence analysis, is a three-dimensional representation of a sequence’s base distribution [51]. This method can be effectively adapted for RNA sequence analysis due to its distinct geometrical properties and the similarity between RNA and DNA nucleotide structures, with the primary difference being the substitution of uracil (U) for thymine (T) [11,52,53]. The Z curve is formed by a series of nodes, P0, P1,...PN, where N is the sequence length and each node has coordinates , , defined as:
Eq. 12
Eq. 13
Eq. 14
where , , , denote the cumulative counts of each nucleotide from the first position up to position n in the sequence.
Nucleotides are classified into six categories based on their properties: purine (R = A, G) versus pyrimidine (Y = C, U), amino (M = A, C) versus keto (K = G, U), and hydrogen bond strength, strong (S = G, C) versus weak (W = A, U). The x-component of the Z-curve represents the distribution of purines and pyrimidines, the y-component corresponds to amino and keto distribution, and the z-component reflects the distribution of strong and weak hydrogen bonds in the nucleotide sequence [54]. As a result, three numerical features can be generated from the Z-curve representation for downstream analysis.
2.1.5. Codon Usage and Coding Potential Features
Fickett Score: The Fickett score is a feature extraction method designed to differentiate coding from non-coding RNAs by integrating nucleotide composition with codon usage bias. It evaluates four position values and four content values for each sequence followed by a weighted summation. The position values capture the preference of each nucleotide (A, C, G, U) for specific positions within codons, offering insights into positional biases within the transcript. For each nucleotide, its position value within the RNA transcript is determined using the following formula:
Eq. 15
Eq. 16
Eq. 17
Eq. 18
Here, represents the total count of nucleotides under the specified condition. The values for , , are derived in the same way as . The overall content-based metrics for each nucleotide in the transcript are then computed as follows:
Eq. 19
The calculation methods for , , and are identical. Ultimately, a lookup table is employed to transform the four positional attributes and four compositional attributes into probabilities indicative of coding potential. The Fickett score is then derived by multiplying these eight probability values (p) by their respective weighting factors (w). These weights reflect the effectiveness of each positional or compositional feature in distinguishing between coding and non-coding sequences [30,55].
Eq. 20
Relative Codon Bias (RCB): Relative codon bias serves as a metric to quantify the non-uniform usage of codon triplets within the open reading frames (ORFs) of an RNA transcript. It measures how much the observed codon usage deviates from what would be expected based on the independent nucleotide composition at each codon position. To derive the RCB value for an ORF, the product of the individual usage biases for all its codon triplets is computed. The codon usage bias for a specific triplet is determined as follows:
Eq. 21
Eq. 22
Eq. 23
Here, is the count of the codon triplet found in the ORF, and is the ORF length in codons. The calculations for and at the second and third positions are analogous to the calculation of at the first nucleotide position. Subsequently, the complete RCB value for the RNA transcript’s ORF is computed as shown below [30,56]:
Eq. 24
ORF Related Features (Max ORF length, Max ORF coverage, Average ORF length, Average ORF coverage): An open reading frame (ORF) is a segment within an RNA transcript that has the potential to encode a protein. Analyses of ORF characteristics are commonly used to distinguish protein-coding transcripts from long non-coding RNAs (lncRNAs), although these features are generally less effective for differentiating among various lncRNA subtypes [57]. To capture protein-coding information more comprehensively, analyses may extend beyond the conventional definition of an ORF as the region between a start codon and a stop codon. Alternative definitions include ORFs that begin with a start codon and extend to the transcript’s end, or segments that span from any non-stop codon to a stop codon. An integrated approach can also select the longer sequence between these start-codon-focused and stop-codon-focused variants. For each ORF type, the maximum length across all three reading frames can be determined and extracted as the max ORF.
In addition to their absolute length, the max ORF coverage can be computed by dividing the max ORF length by the total transcript length. Furthermore, for conventionally defined ORFs (bounded by start and stop codons), both the average ORF length and the average ORF coverage are determined. These features provide informative measures of coding potential and have been widely applied in computational transcript classification [30].
2.1.6. Signal Transformation Features (Fourier-Based)
This category encompasses feature extraction techniques that convert RNA sequences into numerical signals and then apply methods from genomic signal processing (GSP) to derive informative features. Among these, the Fourier Transform (FT) is one of the most widely used approaches in biological sequence analysis [10,58,59]. A detailed mathematical formulation of the Fourier-based approach for nucleotide sequences is provided in [10].
2.1.7. Chaos Game-Based Features
Chaos Game Representation (CGR) is a method that visually encodes RNA sequences as two-dimensional fractal patterns derived from nucleotide composition. For machine learning applications, CGR can be quantified using Frequency Chaos Game Representation (FCGR), in which the fractal image is divided into a grid and the frequencies of subsequences falling into each grid cell are counted. This process generates a numerical matrix that can be flattened into a fixed-length vector, providing an alignment-free feature representation for RNA sequence analysis. The detailed methodology and applications of CGR and FCGR are described in [60].
2.1.8. Entropy and Information-Theoretic Features
Several studies have applied concepts from information theory to extract meaningful features from biological sequences, with Shannon entropy (SE) being one of the most widely used measures [61,62]. SE quantifies the uncertainty or diversity in the distribution of nucleotides or k-mers within a sequence, providing insights into its complexity. In addition to SE, Tsallis entropy (TE) [63,64] has been successfully employed as an alternative or complementary descriptor in sequence analysis. TE generalizes the concept of entropy by introducing a parameter that can adjust the sensitivity of the measure to rare or frequent events. Both SE and TE capture important statistical properties of RNA sequences and can be applied at different k-mer levels to highlight sequence variability and compositional bias [30].
2.2. Structural Feature Extraction
Understanding the structural configuration of an RNA molecule is an essential first stage in uncovering its functional mechanisms [65]. Among structural characteristics, the secondary structure is particularly critical in diverse biological processes and is often more conserved than the primary sequence [66]. The set of base pairs formed through hydrogen bonding between nucleotides defines the RNA secondary structure. The main challenge in secondary structure prediction lies in determining which nucleotides are paired with each other in a given sequence [67]. Thermodynamic principles can be used to predict the secondary structure of an RNA sequence [68]. These thermodynamics-based methods employ nearest-neighbour parameters to estimate structural stability, which is quantified by the change in folding free energy [69,70,71]. Structure prediction is commonly achieved by determining the conformation with the lowest free energy [65]. Minimum free energy (MFE) acts as a fundamental structural indicator, reflecting the stability of the RNA structure [66]. The assumption is that a lower free energy implies greater stability of the RNA secondary structure [30]. Alternative prediction strategies include sampling from the Boltzmann ensemble to identify a representative centroid structure [72] or selecting the structure with the highest sum of base-pairing probabilities, known as the maximum expected accuracy (MEA) structure [73].
A widely used tool for RNA secondary structure prediction is RNAfold, part of the ViennaRNA Package, which applies MFE calculations to identify the most probable configurations [74]. RNAfold decomposes RNA secondary structures into elements such as interior loops, hairpin loops, multiloops, bulge loops, and stacking pairs, with each contributing to the total free energy. The total free energy of RNA’s secondary structure is determined by summing the free energy values of its constituent substructures. The most stable predicted structure is generated for each RNA transcript and used for downstream feature extraction [74]. A comprehensive list of available RNA secondary structure prediction tools is available at [75].
In a study conducted by Kang et al. [22], RNA secondary structures were predicted using the RNAfold package, which represents structural features using a system of brackets ( “(“ or “)” = paired nucleotide) and dots ( “.” = unpaired). These approaches can extract both continuous and discontinuous structural patterns. However, unlike sequence-based analyses that consider the four nucleotide types, structural analysis is constrained to two symbol types (brackets and dots), necessitating adjustments in calculation parameters. Accordingly, several structural features can be derived from the dot-bracket notations produced by these tools, as described in the following paragraphs.
2.2.1. Paired Ratio
This is a metric based on the secondary structure of an RNA transcript, representing the proportion of nucleotides involved in Watson-Crick base pairing compared to those that remain unpaired. This ratio is used to assess structural stability; RNA molecules with a higher percentage of paired nucleotides have more stable secondary structures [30]. The formula is as follows:
Eq. 25
2.2.2. Triplet
This method integrates both sequence and structure information and has shown superior performance in tasks such as microRNA identification [45,76]. Using dot/bracket notation, there are 8 (23) possible structural configurations for a set of three adjacent nucleotides: ‘(((‘, ‘((.’, ‘(..’, ‘(.(‘, ‘.((‘, ‘.(.’, ‘..(‘, and ‘...’. By focusing on the middle nucleotide within each group of three, 32 possible structure-sequence combinations (4 × 8) can be obtained, denoted as fA (‘(((‘), fG (‘(((‘), etc. These combinations define the triplet structure-sequence elements, which integrate both nucleotide sequence and corresponding structural information, allowing for comprehensive analysis [21,45].
2.2.3. Pseudo-Structure Status Composition (PseSSC) & Pseudo-Distance Structure Status Pair Composition (PseDPC)
Liu et al. proposed PseSSC and PseDPC methods for capturing the compositional and sequential information of RNA sequences by efficiently representing RNA secondary structures like stem loops. These approaches approximate the sequential information of RNA sequences employing a correlation function based on secondary structure status, considering both the distance between structural status pairs and the minimum free energy [77]. Details can be found in the referenced sources [78,79].
2.2.4. Number of Distinct Loop Structures
2.2.5. Coverage of Different Loop Structures
For each loop type, coverage is computed as the number of loops divided by the transcript length [30].
Eq. 26
Eq. 27 Eq. 28
Eq. 29
2.2.6. GC Content of Paired Nucleotides
This attribute is calculated as the proportion of guanine-cytosine (G-C) base pairs in the secondary structure of an RNA transcript. G-C bonds are stronger and more stable than adenine-thymine/uracil (A-T/U) bonds, so a higher GC content in paired nucleotides typically reflects a more stable secondary structure for the RNA transcript [30].
Eq. 30
3. Comparative Impact of Feature Set Choice on Model Performance
The predictive performance of machine learning models in RNA analysis is strongly influenced by the composition of the input feature set [9,79]. While the choice of algorithm plays a role, the diversity and informativeness of the features are equally critical in determining model accuracy. Evidence from four independent studies [81,82,83,84], each employing different combinations of RNA-derived features for various RNA classification tasks, highlights this effect (Figure 3). Across these examples, a consistent pattern is observed: models trained on integrated feature sets, combining multiple descriptor types, often outperform those relying on a single feature category. This reinforces the view that strategic feature engineering is not a preliminary or optional step but a core element in building reliable predictive models in RNA biology. Consequently, the careful composition of complementary feature types can yield substantial performance gains, often independent of the specific model architecture employed.
4. Feature Extraction Tools
Over the years, a variety of computational tools have been developed to facilitate the extraction of RNA sequence and structure features. These tools implement a broad spectrum of methodologies, enabling the derivation of descriptors such as k-mer frequencies, physicochemical properties, structural stability metrics, entropy-based measures, and other specialized attributes discussed in previous sections. Table 1 presents a summary of widely used tools in the literature, outlining their primary functionalities and feature categories. The availability of these resources has significantly streamlined the process of generating high-dimensional, informative feature sets for downstream machine learning applications in RNA biology.
5. Discussion and Conclusions
The rapid expansion of publicly available RNA sequence data has created new opportunities for computational approaches to uncover their biological roles. Despite this availability, many RNA sequences remain poorly characterized with respect to their functional and structural properties. Machine learning has emerged as a powerful framework for addressing this gap, but its success depends heavily on how effectively raw sequences are transformed into informative numerical representations. This review has provided a detailed overview of descriptor categories and feature extraction strategies for encoding RNA sequences and structures into numerical form. We have also discussed available tools and platforms that implement these methods and highlighted how the choice and diversity of feature sets can influence the predictive performance and interpretability of machine learning models in RNA-related applications.
Most prediction tasks in biological sequence analysis are framed as binary or multi-class classification problems. Numerous efficient computational approaches have been developed using machine learning algorithms to predict or analyse sequence-related characteristics solely from sequence information [87]. However, most existing machine-learning techniques, such as SVM (support vector machine) and KNN (k-nearest neighbour), are designed to handle numerical vectors rather than raw sequences [45]. Consequently, feature extraction plays a pivotal role in converting sequences into mathematical representations that preserve their intrinsic relationship with the target variable, thereby directly influencing model performance [89]. To facilitate this process, a range of web-based servers and stand-alone software tools have been developed, enabling the extraction of diverse sequence, structural, and physicochemical features [37,44,45,86]. Nevertheless, significant challenges remain. Many existing tools focus on a narrow subset of features, limiting their ability to integrate both sequence- and structure-based information in a unified framework. This limitation reduces their effectiveness for complex RNA analyses that require comprehensive feature representations.
Traditional feature extraction approaches, such as nucleic acid composition, pseudo-nucleotide composition, and autocorrelation have been widely used because of their effectiveness and simplicity in capturing sequence features. Tools like MathFeature expand on these foundations by incorporating innovative mathematical descriptors, such as chaos game theory, genomic signal processing, and entropy, which enable high accuracy across a variety of classification tasks [19]. On the other hand, some feature extraction pipelines, such as iLearnPlus [38] and the recently introduced R-based package ftrCOOL [88], have expanded the range of features by integrating physicochemical and structural descriptors alongside the aforementioned traditional approaches. ftrCOOL remarkably outperforms iLearnPlus in processing speed, making it a preferred choice for analysing large RNA datasets [88]
Although the field has made substantial progress, further efforts are required to address persistent challenges. Future feature extraction platforms should prioritise user-friendliness and computational efficiency, enabling both expert bioinformaticians and researchers with limited programming experience to perform advanced analyses. In addition, expanding the range of available feature descriptors and integrating broader analytical capabilities will be essential for improving model performance and reproducibility in RNA-focused machine learning studies.
Author Contribution: F.S.: Investigation, Formal analysis, Methodology, Data curation, Writing—Original Draft. F.V.: Conceptualization, Supervision, Investigation, Funding acquisition, Writing—Review & Editing. J.J.T.: Supervision, Funding acquisition, Writing—Review & Editing.
Acknowledgments
The authors acknowledge funding from the Australian Research Council Discovery Project (DP220101938) and the Australian Government Research Training Program (RTP) Scholarship.
References
- Kukurba KR, Montgomery SB. RNA Sequencing and Analysis. Cold Spring Harb Protoc. 2015 Apr 13;2015(11):951–69.
- Deshpande, D.; Chhugani, K.; Chang, Y.; Karlsberg, A.; Loeffler, C.; Zhang, J.; Muszyńska, A.; Munteanu, V.; Yang, H.; Rotman, J.; et al. RNA-seq data science: From raw data to effective interpretation. Front. Genet. 2023, 14, 997383. [Google Scholar] [CrossRef] [PubMed]
- Mitić, T.; Caporali, A. Emerging roles of non-coding RNAs in endothelial cell function. Curr. Opin. Physiol. 2023, 34. [Google Scholar] [CrossRef]
- Chauvier, A.; Walter, N.G. Regulation of bacterial gene expression by non-coding RNA: It is all about time! Cell Chem. Biol. 2024, 31, 71–85. [Google Scholar] [CrossRef]
- Rinn JL, Chang HY. Genome regulation by long noncoding RNAs. Annu Rev Biochem. 2012;81:145–66.
- Schmitt AM, Chang HY. Long noncoding RNAs in cancer pathways. Cancer cell. 2016 Apr 11;29(4):452-63.
- van der Sluis F, van den Broek EL. Model interpretability enhances domain generalization in the case of textual complexity modeling. Patterns (N Y). 2025 Feb 6;6(2):101177.
- Murdoch, W.J.; Singh, C.; Kumbier, K.; Abbasi-Asl, R.; Yu, B. Definitions, methods, and applications in interpretable machine learning. Proc. Natl. Acad. Sci. USA 2019, 116, 22071–22080. [Google Scholar] [CrossRef]
- Greener, J.G.; Kandathil, S.M.; Moffat, L.; Jones, D.T. A guide to machine learning for biologists. Nat. Rev. Mol. Cell Biol. 2021, 23, 40–55. [Google Scholar] [CrossRef]
- Bonidia, R.P.; Sampaio, L.D.H.; Domingues, D.S.; Paschoal, A.R.; Lopes, F.M.; de Carvalho, A.C.P.L.F.; Sanches, D.S. Feature extraction approaches for biological sequences: a comparative study of mathematical features. Briefings Bioinform. 2021, 22. [Google Scholar] [CrossRef] [PubMed]
- Gross, B.; Dauvin, A.; Cabeli, V.; Kmetzsch, V.; El Khoury, J.; Dissez, G.; Ouardini, K.; Grouard, S.; Davi, A.; Loeb, R.; et al. Robust evaluation of deep learning-based representation methods for survival and gene essentiality prediction on bulk RNA-seq data. Sci. Rep. 2024, 14, 1–15. [Google Scholar] [CrossRef]
- Hwang, H.; Jeon, H.; Yeo, N.; Baek, D. Big data and deep learning for RNA biology. Exp. Mol. Med. 2024, 56, 1293–1321. [Google Scholar] [CrossRef] [PubMed]
- Dias, A.L.; Bustillo, L.; Rodrigues, T. Limitations of representation learning in small molecule property prediction. Nat. Commun. 2023, 14, 1–2. [Google Scholar] [CrossRef]
- Ericsson, L.; Gouk, H.; Loy, C.C.; Hospedales, T.M. Self-Supervised Representation Learning: Introduction, advances, and challenges. IEEE Signal Process. Mag. 2022, 39, 42–62. [Google Scholar] [CrossRef]
- Pan, X.; Yang, Y.; Xia, C.; Mirza, A.H.; Shen, H. Recent methodology progress of deep learning for RNA–protein interaction prediction. Wiley Interdiscip. Rev. RNA 2019, 10, e1544. [Google Scholar] [CrossRef] [PubMed]
- Pérez-Núñez JR, Rodríguez C, Vásquez-Serpa LJ, Navarro C. The Challenge of Deep Learning for the Prevention and Automatic Diagnosis of Breast Cancer: A Systematic Review. Diagnostics (Basel). 2024 Dec 23;14(24):2896.
- Ding, Z.; Wang, Z.; Zhang, Y.; Cao, Y.; Liu, Y.; Shen, X.; Tian, Y.; Dai, J. Trade-offs between machine learning and deep learning for mental illness detection on social media. Sci. Rep. 2025, 15, 1–14. [Google Scholar] [CrossRef]
- Bonidia, R.P.; Domingues, D.S.; Sanches, D.S.; de Carvalho, A.C.P.L.F. MathFeature: feature extraction package for DNA, RNA and protein sequences based on mathematical descriptors. Briefings Bioinform. 2021, 23. [Google Scholar] [CrossRef]
- Dou, L.; Li, X.; Ding, H.; Xu, L.; Xiang, H. Prediction of m5C Modifications in RNA Sequences by Combining Multiple Sequence Features. Mol. Ther. - Nucleic Acids 2020, 21, 332–342. [Google Scholar] [CrossRef]
- Guan, Z.-X.; Li, S.-H.; Zhang, Z.-M.; Zhang, D.; Yang, H.; Ding, H. A Brief Survey for MicroRNA Precursor Identification Using Machine Learning Methods. Curr. Genom. 2020, 21, 11–25. [Google Scholar] [CrossRef]
- Kang, Q.; Meng, J.; Luan, Y. RNAI-FRID: novel feature representation method with information enhancement and dimension reduction for RNA–RNA interaction. Briefings Bioinform. 2022, 23. [Google Scholar] [CrossRef] [PubMed]
- Arceda VM. An Analysis of k-Mer Frequency Features with Machine Learning Models for Viral Subtyping of Polyomavirus and HIV-1 Genomes. InProceedings of the Future Technologies Conference 2020 Oct 31 (pp. 279-290). Cham: Springer International Publishing.
- Kirk, J.M.; Kim, S.O.; Inoue, K.; Smola, M.J.; Lee, D.M.; Schertzer, M.D.; Wooten, J.S.; Baker, A.R.; Sprague, D.; Collins, D.W.; et al. Functional classification of long non-coding RNAs by k-mer content. Nat. Genet. 2018, 50, 1474–1482. [Google Scholar] [CrossRef] [PubMed]
- Lorenzi, C.; Barriere, S.; Villemin, J.-P.; Bretones, L.D.; Mancheron, A.; Ritchie, W. iMOKA: k-mer based software to analyze large collections of sequencing data. Genome Biol. 2020, 21, 1–19. [Google Scholar] [CrossRef]
- Xu, H.; Jia, P.; Zhao, Z. Deep4mC: systematic assessment and computational prediction for DNA N4-methylcytosine sites by deep learning. Briefings Bioinform. 2020, 22. [Google Scholar] [CrossRef]
- Zhang, W.; Shi, J.; Tang, G.; Wu, W.; Yue, X.; Li, D. Predicting small RNAs in bacteria via sequence learning ensemble method. 2017 IEEE International Conference on Bioinformatics and Biomedicine (BIBM). LOCATION OF CONFERENCE, United StatesDATE OF CONFERENCE; pp. 643–647.
- Luo, L.; Li, D.; Zhang, W.; Tu, S.; Zhu, X.; Tian, G.; Liu, B. Accurate Prediction of Transposon-Derived piRNAs by Integrating Various Sequential and Physicochemical Features. PLOS ONE 2016, 11, e0153268–e0153268. [Google Scholar] [CrossRef]
- Leslie, C.S.; Eskin, E.; Cohen, A.; Weston, J.; Noble, W.S. Mismatch string kernels for discriminative protein classification. Bioinformatics 2004, 20, 467–476. [Google Scholar] [CrossRef]
- Li, M.; Liang, C. LncDC: a machine learning-based tool for long non-coding RNA detection from RNA-Seq data. Sci. Rep. 2022, 12, 1–18. [Google Scholar] [CrossRef]
- Chen, W.; Tran, H.; Liang, Z.; Lin, H.; Zhang, L. Identification and analysis of the N6-methyladenosine in the Saccharomyces cerevisiae transcriptome. Sci. Rep. 2015, 5, srep13859. [Google Scholar] [CrossRef]
- Muhammod, R.; Ahmed, S.; Farid, D.M.; Shatabda, S.; Sharma, A.; Dehzangi, A.; Hancock, J. PyFeat: a Python-based effective feature generation tool for DNA, RNA and protein sequences. Bioinformatics 2019, 35, 3831–3833. [Google Scholar] [CrossRef] [PubMed]
- Hubert, B. SkewDB, a comprehensive database of GC and 10 other skews for over 30,000 chromosomes and plasmids. Sci. Data 2022, 9, 1–9. [Google Scholar] [CrossRef] [PubMed]
- Lu, J.; Salzberg, S.L.; Rzhetsky, A. SkewIT: The Skew Index Test for large-scale GC Skew analysis of bacterial genomes. PLOS Comput. Biol. 2020, 16, e1008439. [Google Scholar] [CrossRef] [PubMed]
- Yuan, G.-H.; Wang, Y.; Wang, G.-Z.; Yang, L. RNAlight: a machine learning model to identify nucleotide features determining RNA subcellular localization. Briefings Bioinform. 2022, 24. [Google Scholar] [CrossRef]
- Liu, B. BioSeq-Analysis: a platform for DNA, RNA and protein sequence analysis based on machine learning approaches. Briefings Bioinform. 2017, 20, 1280–1294. [Google Scholar] [CrossRef]
- Mathur M, Patiyal S, Dhall A, Jain S, Tomer R, Arora A, Raghava GP. Nfeature: A platform for computing features of nucleotide sequences. BioRxiv. 2021 Dec 16:2021-12.
- Chen, Zhen, Pei Zhao, Chen Li, Fuyi Li, Dongxu Xiang, Yong-Zi Chen, Tatsuya Akutsu et al. iLearnPlus: a comprehensive and automated machine-learning platform for nucleic acid and protein sequence analysis, prediction and visualization. Nucleic acids research 49, no. 10 (2021): e60-e60.
- Chen, W.; Lei, T.-Y.; Jin, D.-C.; Lin, H.; Chou, K.-C. PseKNC: A flexible web server for generating pseudo K-tuple nucleotide composition. Anal. Biochem. 2014, 456, 53–60. [Google Scholar] [CrossRef]
- Chen, W.; Zhang, X.; Brooker, J.; Lin, H.; Zhang, L.; Chou, K.-C. PseKNC-General: a cross-platform package for generating various modes of pseudo nucleotide compositions. Bioinformatics 2014, 31, 119–120. [Google Scholar] [CrossRef]
- Liu, B.; Liu, F.; Wang, X.; Chen, J.; Fang, L.; Chou, K.-C. Pse-in-One: a web server for generating various modes of pseudo components of DNA, RNA, and protein sequences. Nucleic Acids Res. 2015, 43, W65–W71. [Google Scholar] [CrossRef]
- Chen, W.; Lin, H.; Chou, K.-C. Pseudo nucleotide composition or PseKNC: an effective formulation for analyzing genomic sequences. Mol. Biosyst. 2015, 11, 2620–2634. [Google Scholar] [CrossRef] [PubMed]
- Liu, B.; Wu, H.; Chou, K.-C. Pse-in-One 2.0: An Improved Package of Web Servers for Generating Various Modes of Pseudo Components of DNA, RNA, and Protein Sequences. Nat. Sci. 2017, 09, 67–91. [Google Scholar] [CrossRef]
- Liu, B.; Liu, F.; Fang, L.; Wang, X.; Chou, K.-C. repRNA: a web server for generating various feature vectors of RNA sequences. Mol. Genet. Genom. 2015, 291, 473–481. [Google Scholar] [CrossRef] [PubMed]
- Du, P.-F.; Zhao, W.; Miao, Y.-Y.; Wei, L.-Y.; Wang, L. UltraPse: A Universal and Extensible Software Platform for Representing Biological Sequences. Int. J. Mol. Sci. 2017, 18, 2400. [Google Scholar] [CrossRef]
- Tsonis, A.A.; Elsner, J.B.; Tsonis, P.A. Periodicity in DNA coding sequences: Implications in gene evolution. J. Theor. Biol. 1991, 151, 323–331. [Google Scholar] [CrossRef]
- Anastassiou, D. Genomic signal processing. IEEE Signal Process. Mag. 2001, 18, 8–20. [Google Scholar] [CrossRef]
- Chakravarthy, N.; Spanias, A.; Iasemidis, L.D.; Tsakalis, K. Autoregressive Modeling and Feature Analysis of DNA Sequences. EURASIP J. Adv. Signal Process. 2004, 2004, 952689–28. [Google Scholar] [CrossRef]
- Roshid, H.O.; Pham, N.T.; Manavalan, B.; Kurata, H.; Akbar, S. Meta-2OM: A multi-classifier meta-model for the accurate prediction of RNA 2′-O-methylation sites in human RNA. PLOS ONE 2024, 19, e0305406. [Google Scholar] [CrossRef]
- Zhang, R.; Zhang, C.-T. Z Curves, An Intutive Tool for Visualizing and Analyzing the DNA Sequences. J. Biomol. Struct. Dyn. 1994, 11, 767–782. [Google Scholar] [CrossRef]
- Yang, Y.-L. Study on the Specific ncRNAs Based on Z-curve Method. 2008 International Conference on MultiMedia and Information Technology (MMIT). LOCATION OF CONFERENCE, ChinaDATE OF CONFERENCE; pp. 790–793.
- Yang Y ling, Wang J, Yu JF, Liu G zhong. An Analysis of Non-Coding RNA Using Z-Curve Method. In 2008. p. 129–32.
- Zhang, R.; Zhang, C.-T. A Brief Review: The Z-curve Theory and its Application in Genome Analysis. Curr. Genom. 2014, 15, 78–94. [Google Scholar] [CrossRef]
- Wang, L.; Park, H.J.; Dasari, S.; Wang, S.; Kocher, J.-P.; Li, W. CPAT: Coding-Potential Assessment Tool using an alignment-free logistic regression model. Nucleic Acids Res. 2013, 41, e74–e74. [Google Scholar] [CrossRef]
- Roymondal, U.; Das, S.; Sahoo, S. Predicting Gene Expression Level from Relative Codon Usage Bias: An Application to Escherichia coli Genome. DNA Res. 2009, 16, 13–30. [Google Scholar] [CrossRef] [PubMed]
- Bonidia, R.P.; Sampaio, L.D.H.; Domingues, D.S.; Paschoal, A.R.; Lopes, F.M.; de Carvalho, A.C.P.L.F.; Sanches, D.S. Feature extraction approaches for biological sequences: a comparative study of mathematical features. Briefings Bioinform. 2021, 22. [Google Scholar] [CrossRef] [PubMed]
- Hoang, T.; Yin, C.; Yau, S.S.-T. Numerical encoding of DNA sequences by chaos game representation with application in similarity comparison. Genomics 2016, 108, 134–142. [Google Scholar] [CrossRef] [PubMed]
- Yin, C.; Chen, Y.; Yau, S.S.-T. A measure of DNA sequence similarity by Fourier Transform with applications on hierarchical clustering. J. Theor. Biol. 2014, 359, 18–28. [Google Scholar] [CrossRef]
- Löchel, H.F.; Heider, D. Chaos game representation and its applications in bioinformatics. Comput. Struct. Biotechnol. J. 2021, 19, 6263–6271. [Google Scholar] [CrossRef]
- Akhter, S.; Bailey, B.A.; Salamon, P.; Aziz, R.K.; Edwards, R.A. Applying Shannon's information theory to bacterial and phage genomes and metagenomes. Sci. Rep. 2013, 3, 1033. [Google Scholar] [CrossRef]
- Tenreiro Machado JA, Costa AC, Quelhas MD. Shannon, Rényie and Tsallis entropy analysis of DNA using phase plane. Nonlinear Analysis: Real World Applications. 2011 Dec 1;12(6):3135–44.
- Tsallis, C.; Mendes, R.; Plastino, A. The role of constraints within generalized nonextensive statistics. Phys. A: Stat. Mech. its Appl. 1998, 261, 534–554. [Google Scholar] [CrossRef]
- Yamano, T. Information theory based on nonadditive information content. Phys. Rev. E 2001, 63, 046105. [Google Scholar] [CrossRef]
- Reuter JS, Mathews DH. RNAstructure: software for RNA secondary structure prediction and analysis. BMC Bioinformatics. 2010 Mar 15;11(1):129.
- Han, S.; Liang, Y.; Ma, Q.; Xu, Y.; Zhang, Y.; Du, W.; Wang, C.; Li, Y. LncFinder: an integrated platform for long non-coding RNA identification utilizing sequence intrinsic composition, structural information and physicochemical property. Briefings Bioinform. 2018, 20, 2009–2027. [Google Scholar] [CrossRef]
- Sato, K.; Hamada, M. Recent trends in RNA informatics: a review of machine learning and deep learning for RNA secondary structure prediction and RNA drug discovery. Briefings Bioinform. 2023, 24. [Google Scholar] [CrossRef] [PubMed]
- Mathews, D.H.; Turner, D.H. Prediction of RNA secondary structure by free energy minimization. Curr. Opin. Struct. Biol. 2006, 16, 270–278. [Google Scholar] [CrossRef]
- Mathews, D.H.; Sabina, J.; Zuker, M.; Turner, D.H. Expanded sequence dependence of thermodynamic parameters improves prediction of RNA secondary structure. J. Mol. Biol. 1999, 288, 911–940. [Google Scholar] [CrossRef]
- Xia, T.; SantaLucia, J., Jr.; Burkard, M.E.; Kierzek, R.; Schroeder, S.J.; Jiao, X.; Cox, C.; Turner, D.H. Thermodynamic Parameters for an Expanded Nearest-Neighbor Model for Formation of RNA Duplexes with Watson−Crick Base Pairs. Biochemistry 1998, 37, 14719–14735. [Google Scholar] [CrossRef]
- Mathews, D.H.; Disney, M.D.; Childs, J.L.; Schroeder, S.J.; Zuker, M.; Turner, D.H. Incorporating chemical modification constraints into a dynamic programming algorithm for prediction of RNA secondary structure. Proc. Natl. Acad. Sci. 2004, 101, 7287–7292. [Google Scholar] [CrossRef] [PubMed]
- Ding, Y.; Chan, C.Y.; Lawrence, C.E. RNA secondary structure prediction by centroids in a Boltzmann weighted ensemble. RNA 2005, 11, 1157–1166. [Google Scholar] [CrossRef] [PubMed]
- Lu, Z.J.; Gloor, J.W.; Mathews, D.H. Improved RNA secondary structure prediction by maximizing expected pair accuracy. RNA 2009, 15, 1805–1813. [Google Scholar] [CrossRef]
- Lorenz, R.; Bernhart, S.H.; Honer Zu Siederdissen, C.; Tafer, H.; Flamm, C.; Stadler, P.F.; Hofacker, I.L. ViennaRNA Package 2.0. Algorithms Mol. Biol. 2011, 6, 26. [Google Scholar] [CrossRef]
- List of RNA structure prediction software. In: Wikipedia [Internet]. 2025 [cited 2025 Aug 11]. t: Available from, 1305.
- Xue, C.; Li, F.; He, T.; Liu, G.-P.; Li, Y.; Zhang, X. Classification of real and pseudo microRNA precursors using local structure-sequence features and support vector machine. BMC Bioinform. 2005, 6, 310–310. [Google Scholar] [CrossRef]
- Wang, M.; Ali, H.; Xu, Y.; Xie, J.; Xu, S. BiPSTP: Sequence feature encoding method for identifying different RNA modifications with bidirectional position-specific trinucleotides propensities. J. Biol. Chem. 2024, 300, 107140. [Google Scholar] [CrossRef]
- Liu, B.; Fang, L.; Liu, F.; Wang, X.; Chen, J.; Chou, K.-C.; Budak, H. Identification of Real MicroRNA Precursors with a Pseudo Structure Status Composition Approach. PLOS ONE 2015, 10, e0121501. [Google Scholar] [CrossRef] [PubMed]
- Liu B, Fang L, Liu F, Wang X, Chou KC. iMiRNA-PseDPC: microRNA precursor identification with a pseudo distance-pair composition approach. Journal of Biomolecular Structure and Dynamics. 2016 Jan 2;34(1):223–35.
- Lopes, I.d.O.; Schliep, A.; Carvalho, A.C.d.L.d. The discriminant power of RNA features for pre-miRNA recognition. BMC Bioinform. 2014, 15, 124–124. [Google Scholar] [CrossRef]
- Jha, T.; Mendel, J.; Cho, H.; Choudhary, M. Prediction of Bacterial sRNAs Using Sequence-Derived Features and Machine Learning. Bioinform. Biol. Insights 2022, 16. [Google Scholar] [CrossRef] [PubMed]
- Khalid, R.; Naveed, H.; Khalid, Z. Computational prediction of disease related lncRNAs using machine learning. Sci. Rep. 2023, 13, 1–7. [Google Scholar] [CrossRef]
- Li, J.; Ju, Y.; Zou, Q.; Ni, F. lncRNA localization and feature interpretability analysis. Mol. Ther. - Nucleic Acids 2024, 36, 102425. [Google Scholar] [CrossRef]
- Tang, G.; Shi, J.; Wu, W.; Yue, X.; Zhang, W. Sequence-based bacterial small RNAs prediction using ensemble learning strategies. BMC Bioinform. 2018, 19, 13–23. [Google Scholar] [CrossRef] [PubMed]
- Dong, J.; Yao, Z.-J.; Wen, M.; Zhu, M.-F.; Wang, N.-N.; Miao, H.-Y.; Lu, A.-P.; Zeng, W.-B.; Cao, D.-S. BioTriangle: a web-accessible platform for generating various molecular representations for chemicals, proteins, DNAs/RNAs and their interactions. J. Chemin- 2016, 8, 1–13. [Google Scholar] [CrossRef]
- Liu, B.; Gao, X.; Zhang, H. BioSeq-Analysis2.0: an updated platform for analyzing DNA, RNA and protein sequences at sequence level and residue level based on machine learning approaches. Nucleic Acids Res. 2019, 47, e127–e127. [Google Scholar] [CrossRef]
- Chen, Z.; Zhao, P.; Li, F.; Marquez-Lago, T.T.; Leier, A.; Revote, J.; Zhu, Y.; Powell, D.R.; Akutsu, T.; I Webb, G.; et al. iLearn: an integrated platform and meta-learner for feature engineering, machine-learning analysis and modeling of DNA, RNA and protein sequence data. Briefings Bioinform. 2019, 21, 1047–1057. [Google Scholar] [CrossRef]
- Amerifar, S.; Norouzi, M.; Ghandi, M. A tool for feature extraction from biological sequences. Briefings Bioinform. 2022, 23. [Google Scholar] [CrossRef] [PubMed]
- Chou, K.-C. Some remarks on protein attribute prediction and pseudo amino acid composition. J. Theor. Biol. 2011, 273, 236–247. [Google Scholar] [CrossRef] [PubMed]
Figure 1.
Overview of RNA feature extraction and machine learning workflow. RNA sequences are processed using software tools, web servers, or programming packages to extract informative numerical features. These features are categorized as sequence-based or structure-based, assembled into a feature matrix, and used to train machine learning models for various RNA-related predictive tasks.
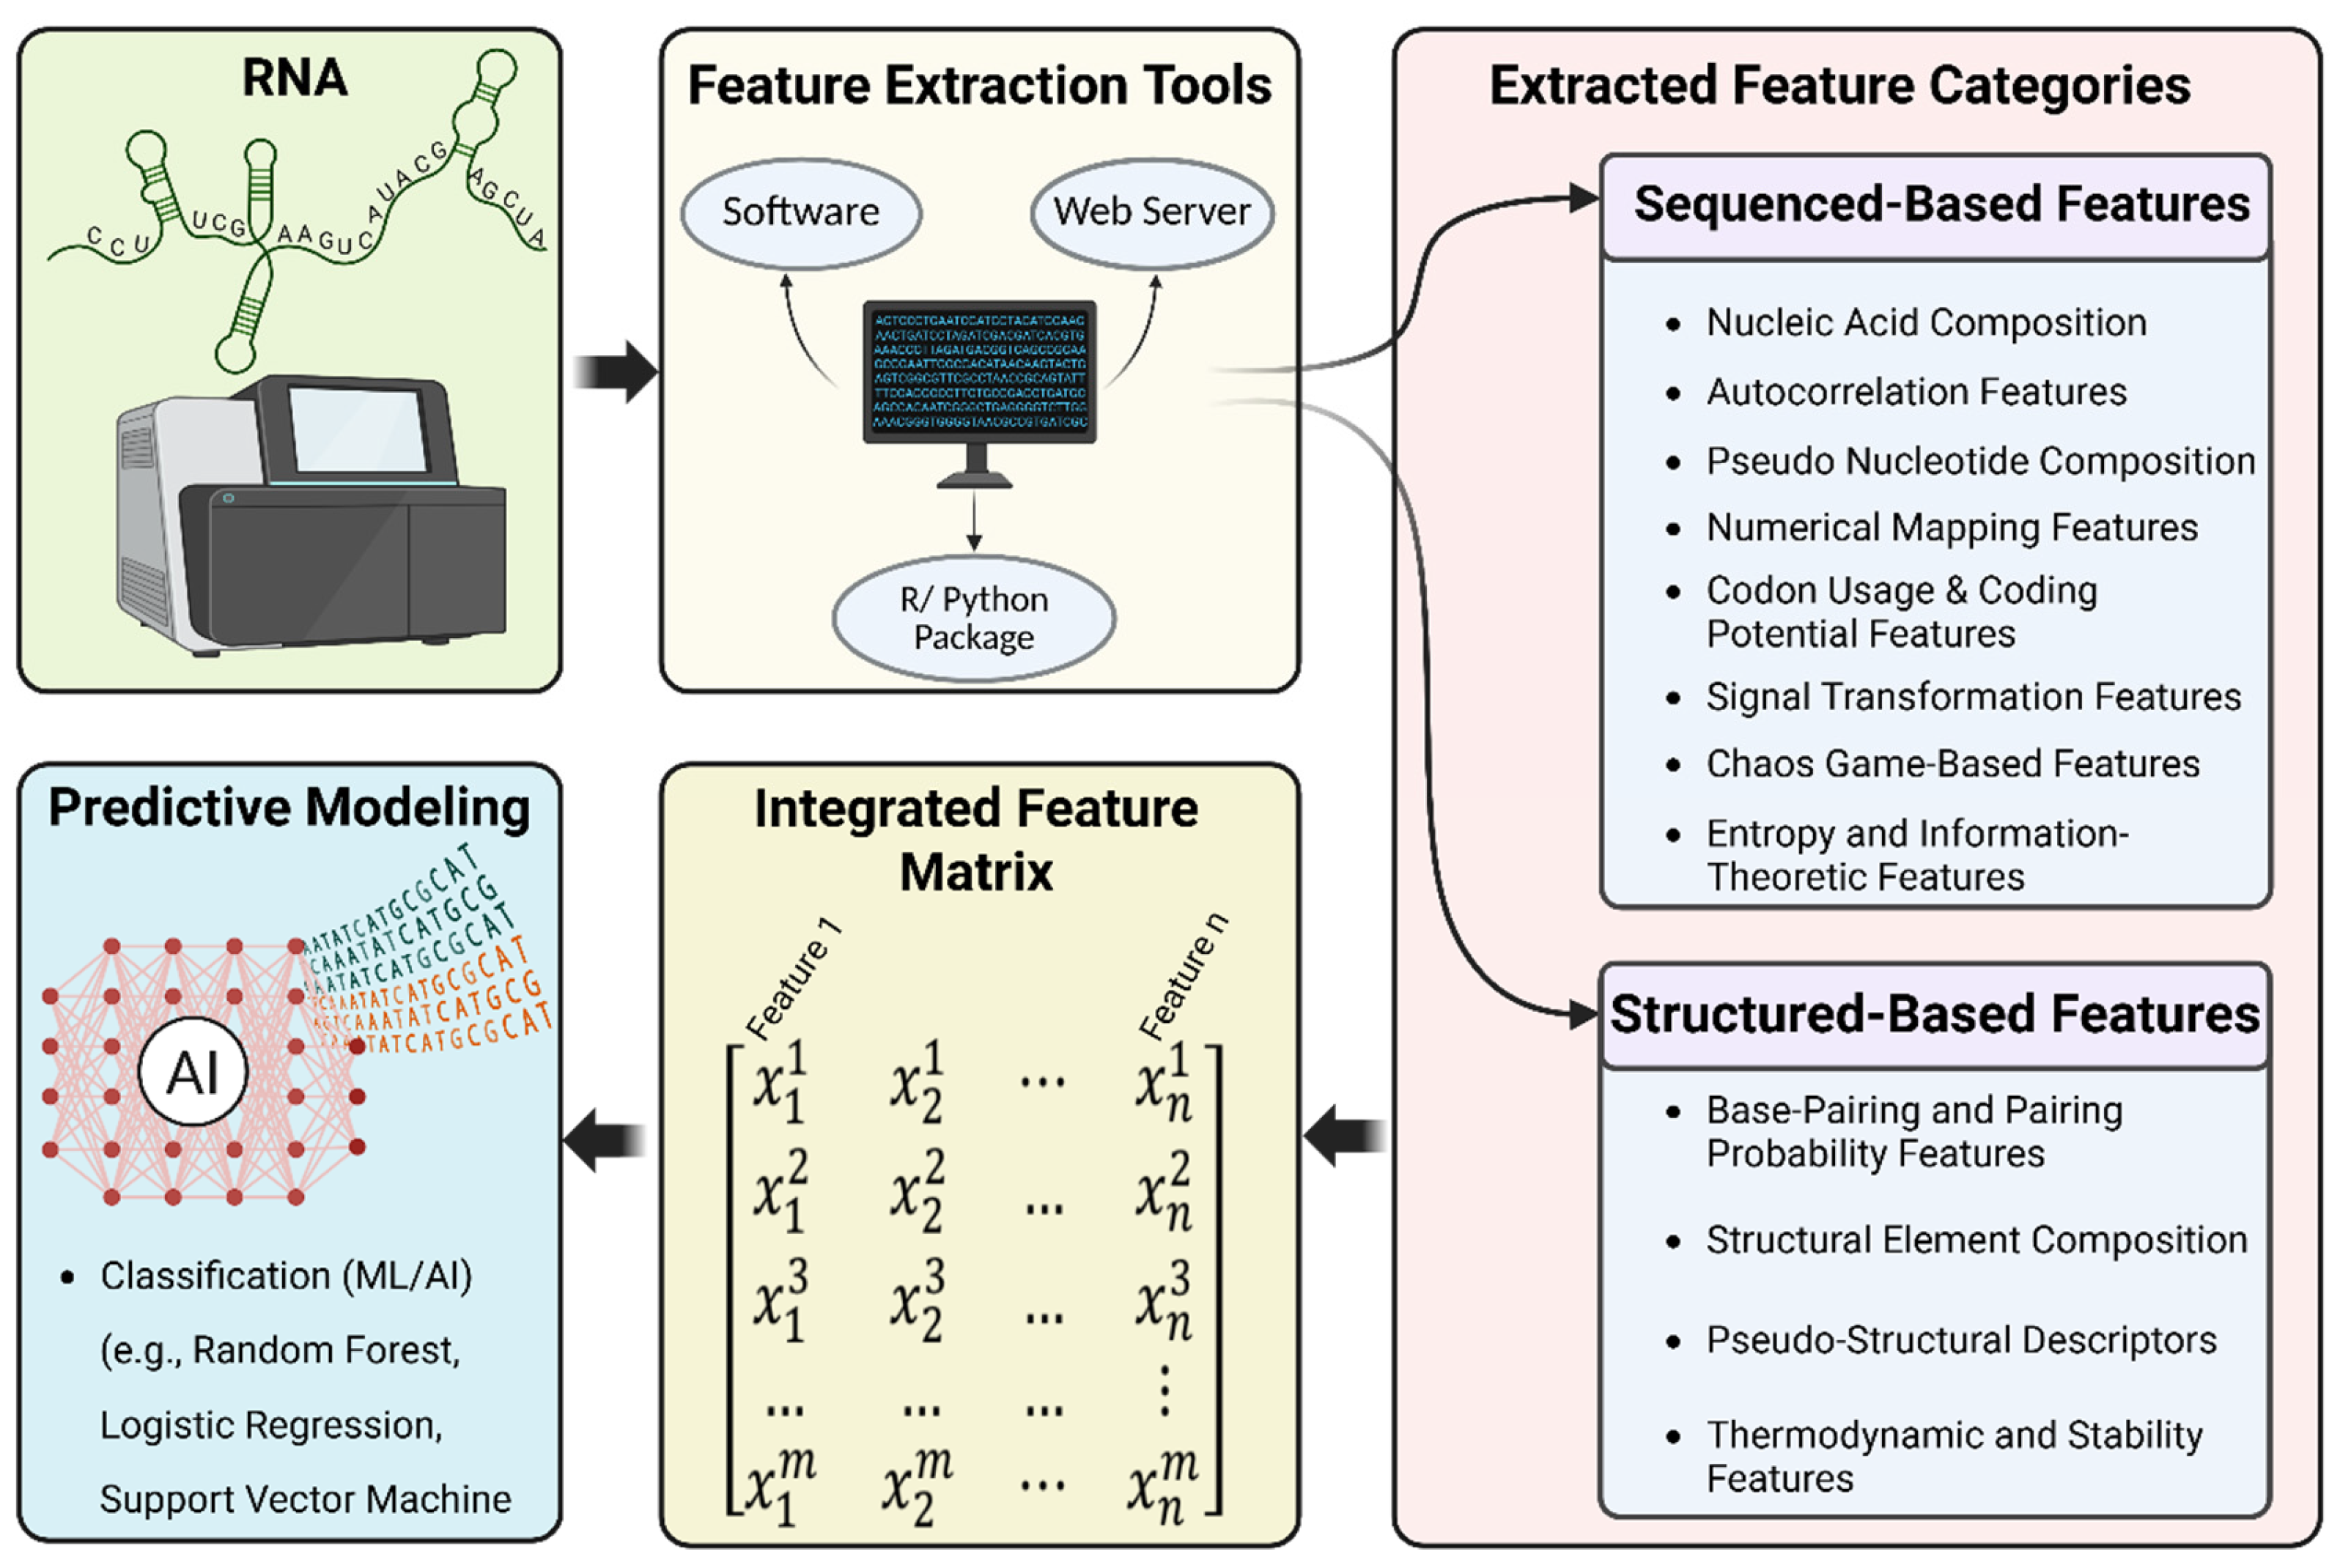
Figure 2.
Example of an RNA secondary structure illustrating various types of structural elements. (Created in BioRender.com).
Figure 2.
Example of an RNA secondary structure illustrating various types of structural elements. (Created in BioRender.com).
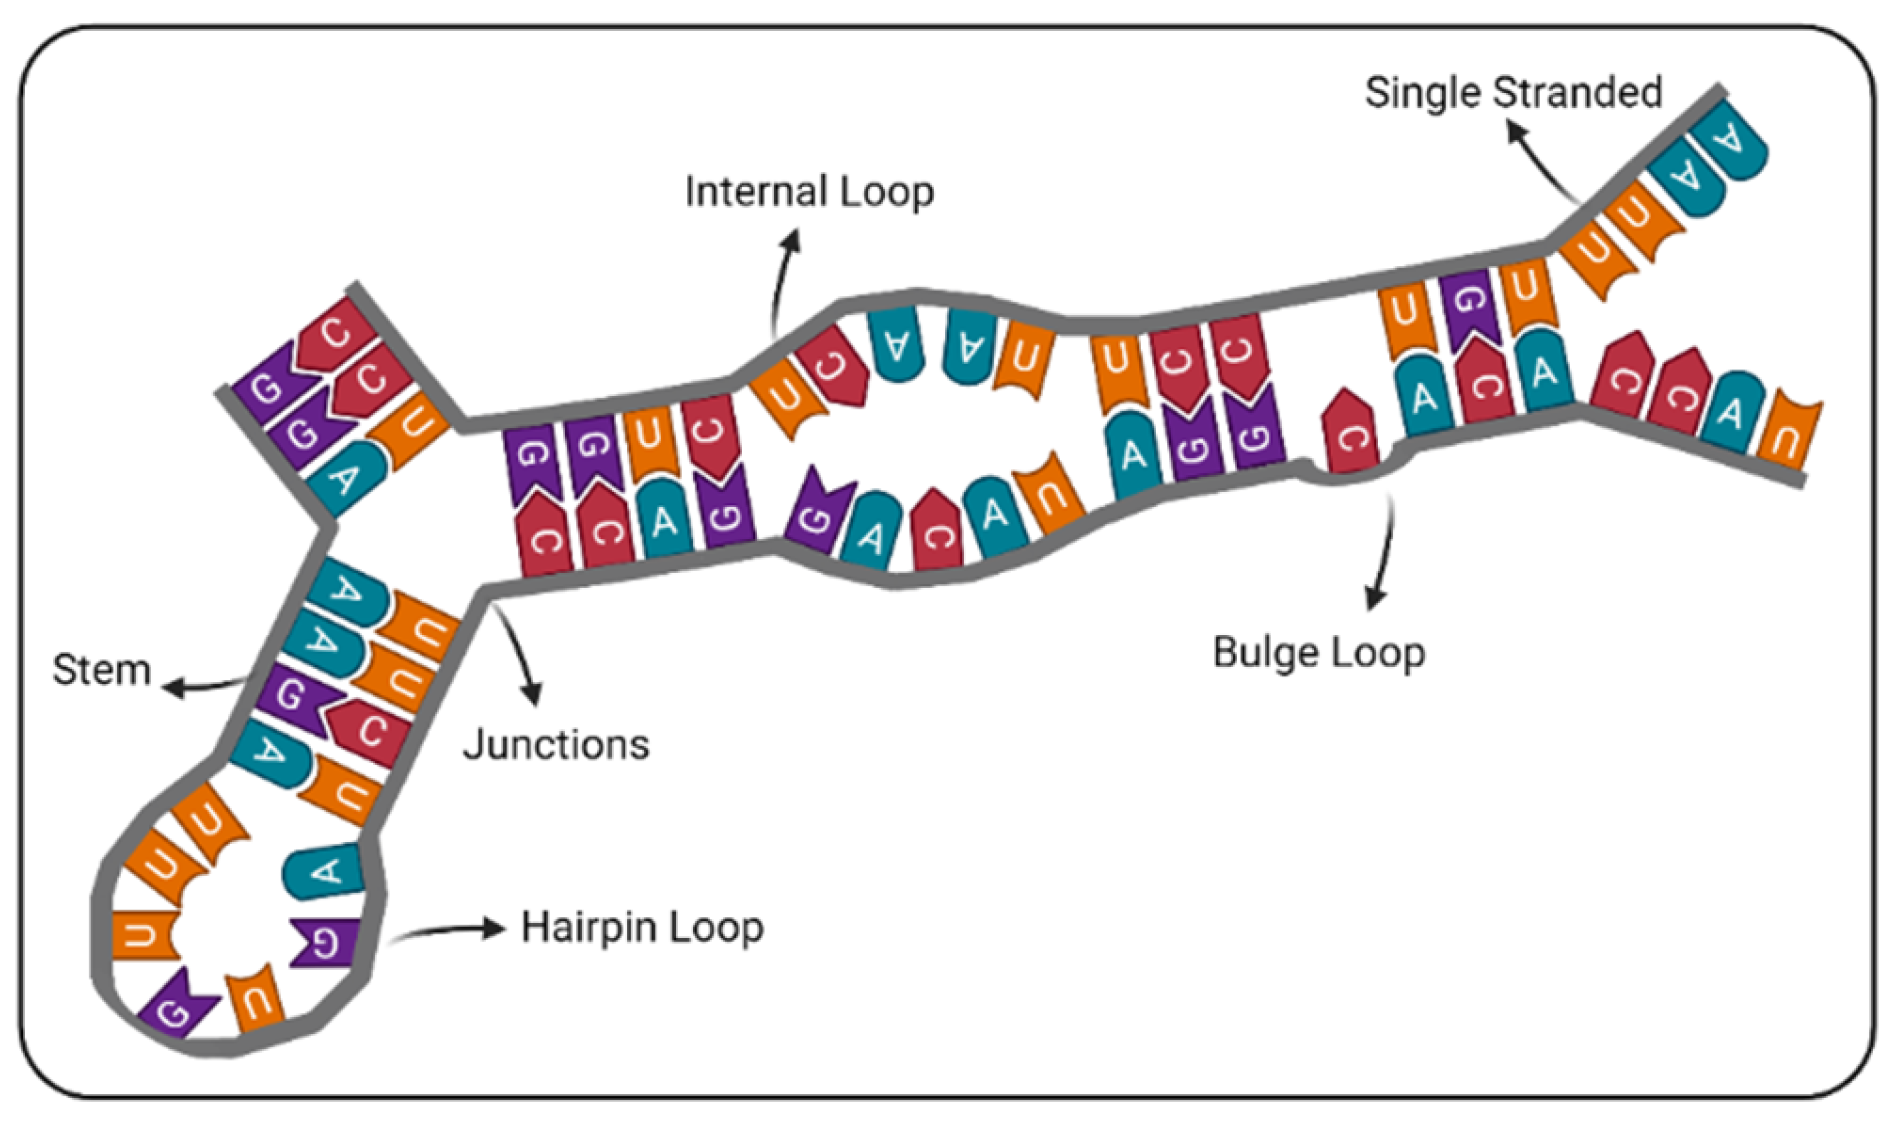
Figure 3.
Performance comparison across different feature sets and machine learning models in four independent RNA-related studies. A) Area Under the Receiver Operating Characteristic (AUROC) curve for an AdaBoost model predicting bacterial small RNAs. Performance is evaluated for 15 individual feature groups (G1–G15)* and their combinations, demonstrating that combined feature sets generally yield higher predictive power [81]. B) Accuracy of a Support Vector Machine (SVM) model predicting disease-related lncRNAs, where the integration of multiple feature groups improves performance [82]. C) AUROC values from a Random Forest model predicting lncRNA localization, comparing the effectiveness of four descriptor categories [83]. D) AUROC values for a Random Forest model predicting bacterial small RNAs, illustrating differences in predictive ability across five distinct sequence encoding strategies [84].*The 15 individual feature groups (G1–G15) in panel A are, respectively: Biological features; 1-mer to 5-mer frequencies; 1-mer to 5-mer reverse complement k-mer (RCkmer) frequencies; PCPseDNC, parallel correlation pseudo-dinucleotide composition; PCPseTNC, parallel correlation pseudo-trinucleotide composition; SCPseDNC, series correlation pseudo-dinucleotide composition; SCPseTNC, series correlation pseudo-trinucleotide composition.
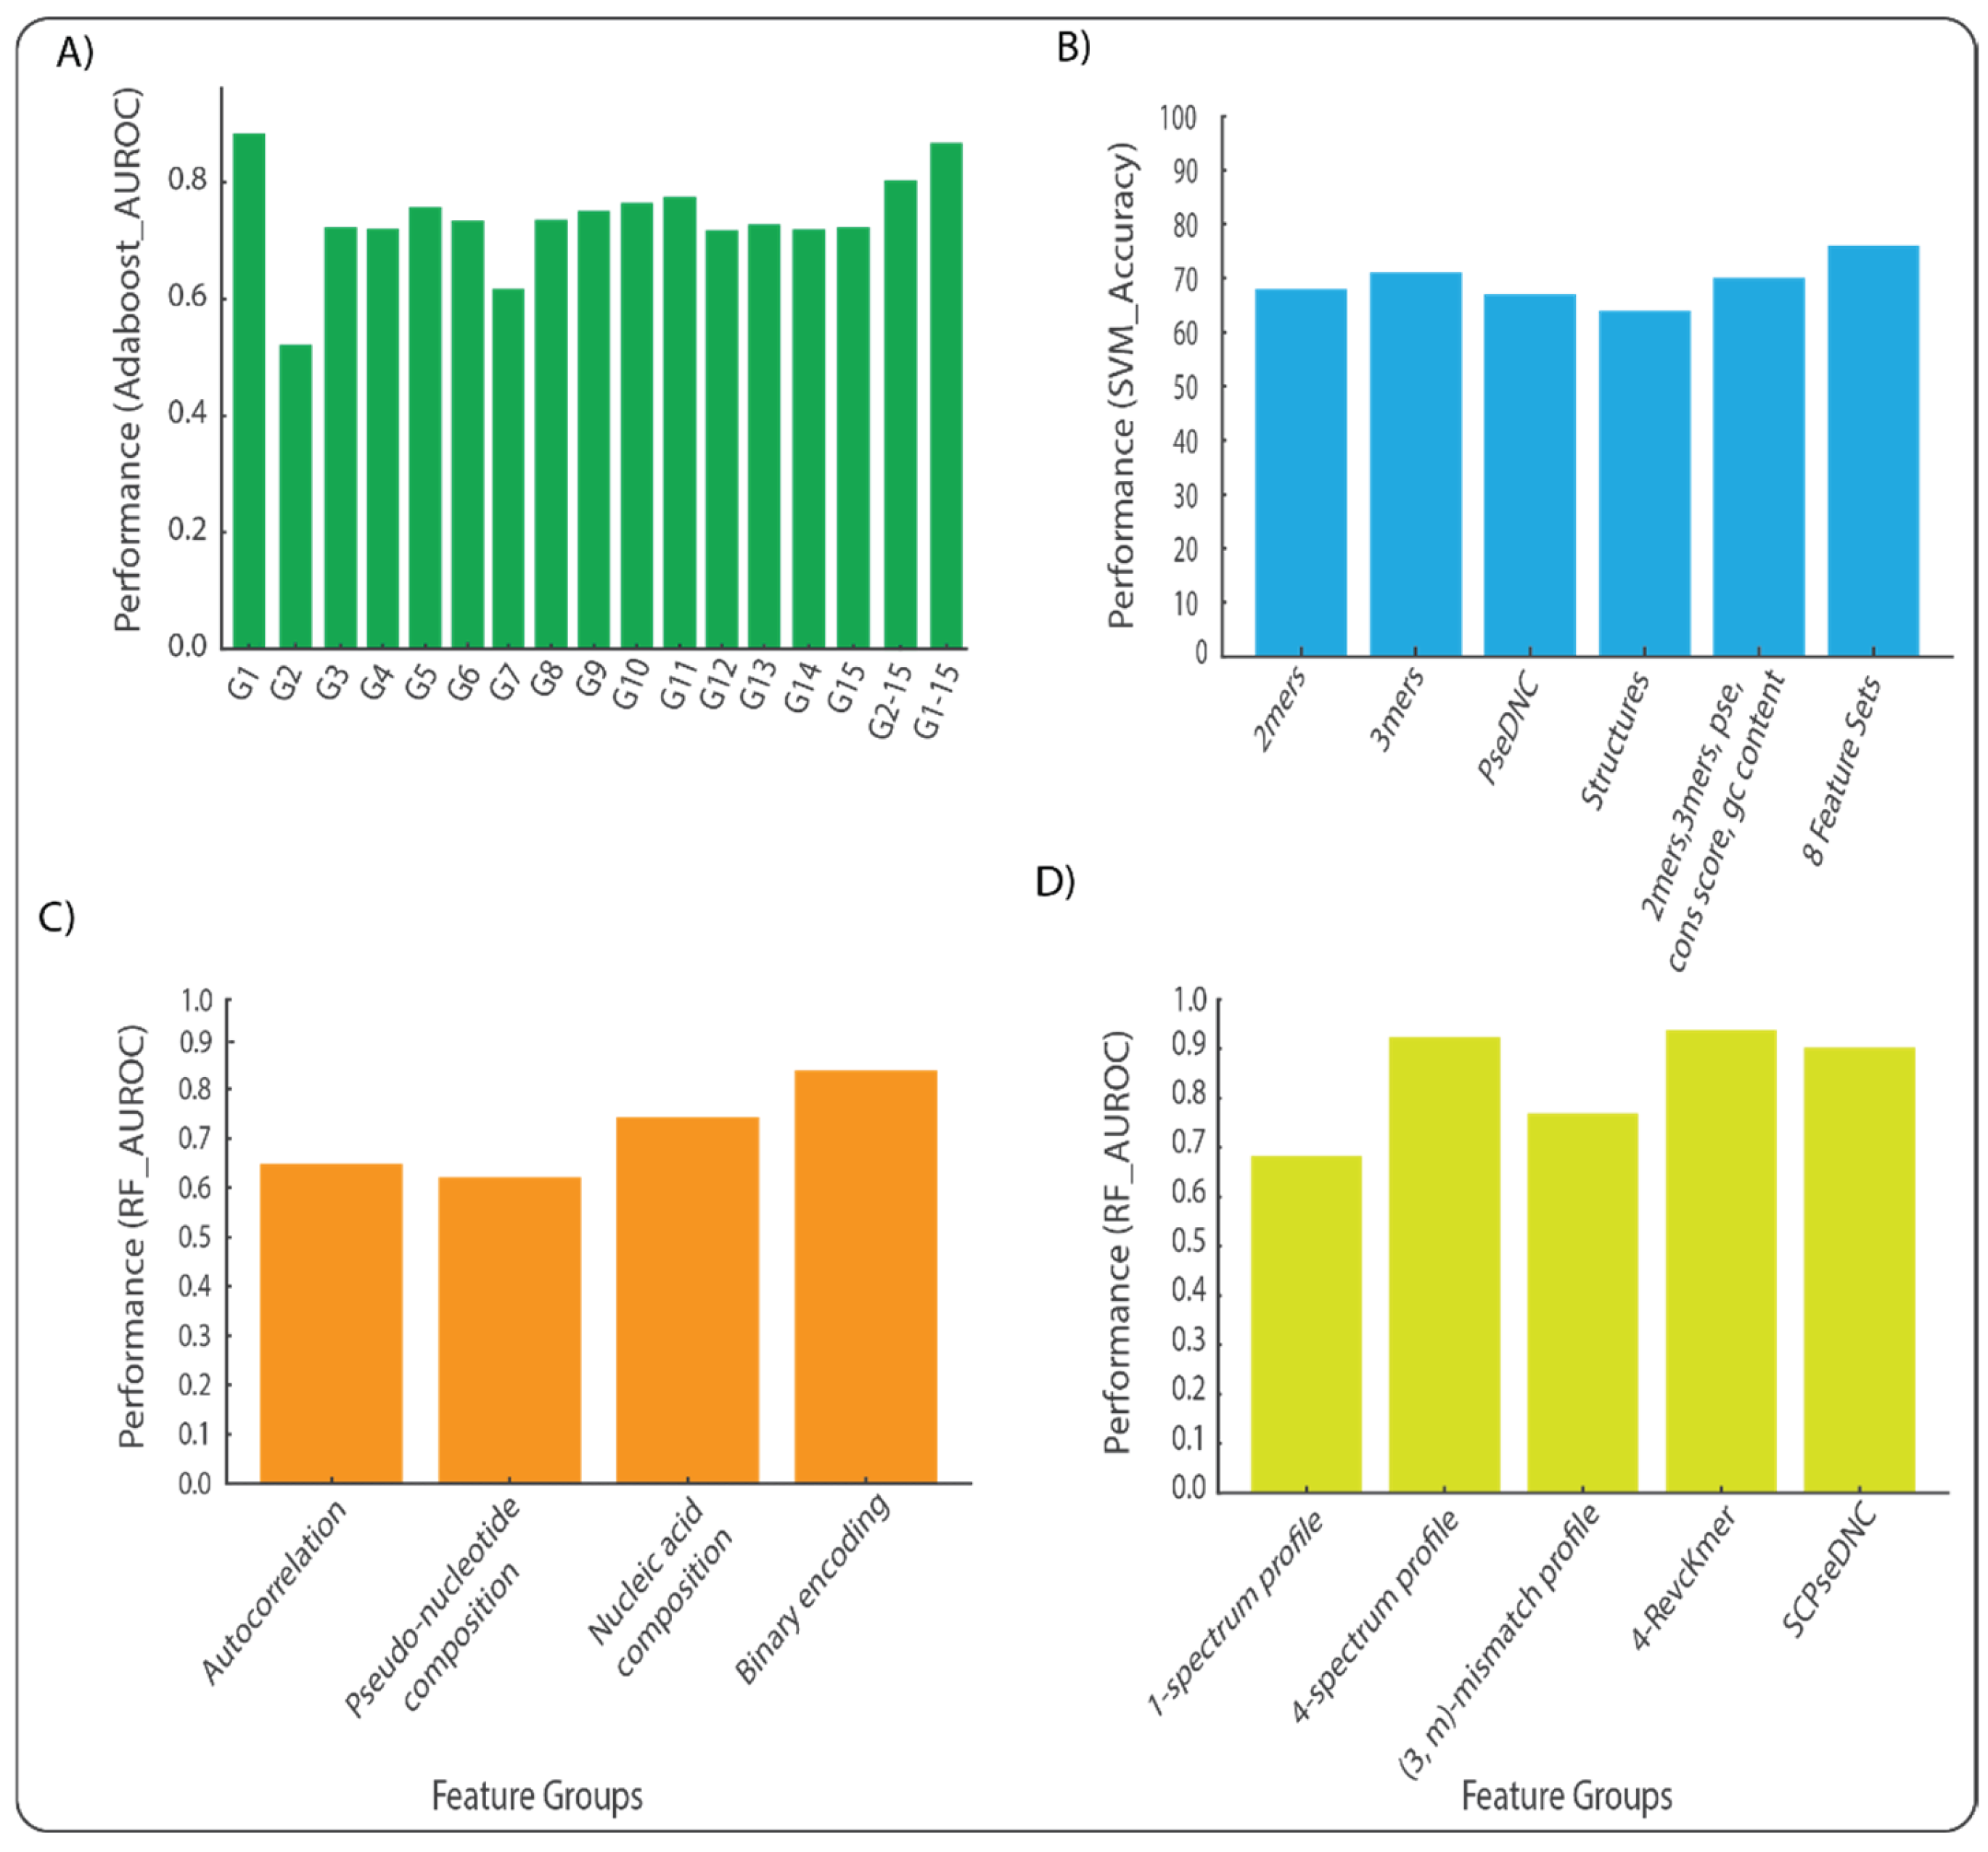

Table 1.
Publicly available tools for extracting sequence-based and structure-based features from RNA sequences.
Table 1.
Publicly available tools for extracting sequence-based and structure-based features from RNA sequences.
| Tool/Package Name | Access Type | Type of Feature Categories | Published Year | Ref |
| RepRNA | Web server | Oligonucleotide composition; pseudo-nucleotide composition; structure composition | 2016 | [45] |
| PseKNC | Web server | Pseudo-dinucleotide composition (PseDNC); pseudo-trinucleotide composition (PseTNC) | 2014 | [39] |
| PseKNC-General | Web server | K-tuple nucleotide composition; autocorrelation descriptors; pseudo-nucleotide composition | 2015 | [40] |
| BioTriangle | Web server | Nucleic acid composition; autocorrelation descriptors; pseudo-nucleotide composition | 2016 | [85] |
| BioSeq-Analysis2.0 | Web server | Residue-level composition; sequence-level physicochemical and structural descriptors | 2019 | [86] |
| BioSeq-Analysis | Standalone program & web server | Nucleic acid composition; autocorrelation descriptors; pseudo-nucleotide composition; predicted structure composition | 2019 | [36] |
| Nfeature | R/Python package & web server | Nucleic acid composition; distance distribution of nucleotides; nucleotide repeat index; pseudo-composition; entropy | 2021 | [37] |
| iLearn | Python toolkit | Nucleic acid composition; binary encoding; position-specific trinucleotide tendencies; autocorrelation; pseudo-composition | 2019 | [87] |
| iLearnPlus | R/Python package & web server | Nucleic acid composition; residue composition; position-specific trinucleotide tendencies; autocorrelation; physicochemical; mutual information; similarity-based; pseudo-composition | 2021 | [38] |
| ftrCOOL | R/Python package | Nucleic acid composition; substitution matrices; k-nearest-neighbor RNA; local position-specific k-frequency; maxORF-based | 2022 | [88] |
| PyFeat | Python toolkit | Z-curve; GC content; AT/GC ratio; cumulative skew; Chou’s pseudo-composition; k-gap statistics | 2019 | [32] |
| MathFeature | R/Python package & web server | Numerical mapping; chaos game descriptors; Fourier transform; entropy and graph descriptors; pseudo-composition | 2022 | [19] |
| Pse-In-One | Web server | Nucleic acid composition; autocorrelation descriptors; pseudo-nucleotide composition | 2015 | [41] |
| Pse-in-One 2.0 | Web server | Nucleic acid composition; autocorrelation; triplet sequence-structure elements; pseudo-structure status composition; PseDPC | 2017 | [44] |
| UltraPse | Software platform | Nucleic acid composition; autocorrelation descriptors; pseudo-nucleotide composition | 2017 | [46] |
Disclaimer/Publisher’s Note: The statements, opinions and data contained in all publications are solely those of the individual author(s) and contributor(s) and not of MDPI and/or the editor(s). MDPI and/or the editor(s) disclaim responsibility for any injury to people or property resulting from any ideas, methods, instructions or products referred to in the content. |
© 2025 by the authors. Licensee MDPI, Basel, Switzerland. This article is an open access article distributed under the terms and conditions of the Creative Commons Attribution (CC BY) license (https://creativecommons.org/licenses/by/4.0/).
Copyright: This open access article is published under a Creative Commons CC BY 4.0 license, which permit the free download, distribution, and reuse, provided that the author and preprint are cited in any reuse.


