
Submitted:
23 August 2025
Posted:
26 August 2025
You are already at the latest version
Abstract
Under the dual pressures of global population aging and fiscal austerity, the sustainability of traditional social security systems is facing severe challenges. Existing policies often fail to achieve sustainable inclusive growth due to the fragmentation of economic incentives, social equity, and governance accountability. To address this challenge, this paper constructs an integrated institutional framework that endogenously integrates marginal pricing, rule-based redistribution, and on-chain accountability mechanisms, aiming to achieve sustainable development across the social, economic, and fiscal dimensions. The study employs a heterogeneous agency life cycle model and conducts numerical simulations to compare three scenarios: baseline, inclusive, and compatible (which incorporates "tax-wealth—targeted transfers"). The results indicate that the framework achieves an inclusive effect of "supporting the bottom without harming the top" while ensuring fiscal sustainability: In the inclusive scenario, the variance in wealth shares of the poorest 10% of the adult population converges by nearly 16%; In the compatibility scenario, their disposable income increased by over 100% compared to the baseline scenario, while the standardized Gini coefficient decreased from approximately 0.36 to 0.25, a reduction of over 30%. Both scenarios ensured the sustainability of fiscal resources through positive net growth.
Keywords:
social sustainability
; institutional sustainability
; inclusive growth
; left-tail sustainability
; fiscal sustainability
; rule-based redistribution
; sustainable safety net mechanism
1. Introduction
Against the backdrop of accelerating global population aging, deepening technological penetration, and persistently tightening fiscal constraints, traditional welfare and social security systems are facing unprecedented risks of unsustainability. Intergenerational shifts in population structure are exacerbating health risks and care burdens, significantly increasing structural expenditure pressures on social security systems[1]. Evidence from multiple countries also shows that under ongoing aging trends, rising expenditures on pensions and health care will squeeze fiscal policy space and impact debt sustainability assessments[2]. At the same time, widening income gaps and increasing group heterogeneity have sharpened the tension between fairness and efficiency in redistribution targeting[3,4]. Even with the introduction of new data and algorithms, technical challenges such as bias management and transparency remain[5]. In this context, if existing mechanisms continue to evolve in a fragmented manner, there is a high risk of falling into a "collapse-style" unsustainable dilemma: on the one hand, unable to stabilize the welfare of vulnerable groups, and on the other hand, accumulating long-term fiscal and debt risks. Therefore, the essence of this issue is a "sustainability" problem. The core challenge of sustainability lies in how to ensure the basic well-being of the left-tail population while maintaining long-term growth momentum and debt stability under the constraint of tight fiscal resources. Existing research and policy practices indicate that without effective safety nets for vulnerable groups, social risks will continue to accumulate and may in turn weaken institutional and fiscal stability, ultimately rendering growth unsustainable[6,7]. This is precisely why "inclusiveness" is widely regarded as a prerequisite for achieving sustainable development[8]. In the context of this paper, "inclusive distribution" does not refer to mere welfare expansion, but rather to institutional arrangements that can effectively cover left-tail risks while maintaining incentive compatibility and growth friendliness. Inclusive distribution is not only a demand for fairness, but also a necessary condition for institutional and fiscal sustainability.
Existing literature has made significant progress in related fields. In terms of fiscal incentives, some studies have focused on the efficiency of resource allocation at the primary distribution stage, exploring incentive-compatible pathways through two-stage pricing and other game-theoretic mechanisms [9], as well as using Shapley values for cost sharing and welfare distribution to maintain cooperative stability [10]. In terms of distribution rules, some researchers have focused on the fairness and targeting ability of secondary distribution, adopting strategies such as conditional transfer payments, poverty identification, and age weighting to improve the efficiency of resource allocation, including Meta-analysis of Conditional Cash Transfer (CCT) programs[11]; age priority and weighting [12]; and targeting based on non-traditional data [13]. In terms of technical governance, some studies have attempted to embed digital governance tools such as blockchain and smart contracts into redistribution and public fund flow supervision to enhance institutional transparency and auditability, such as applications and use cases in the accounting-audit field [14,15]. However, these explorations mostly remain at the level of local optimization. Fiscal incentive-based research emphasizes improving efficiency in the primary distribution phase but often overlooks long-term fiscal constraints and intertemporal rebalancing. Traditional deficit measurement standards fail to reflect the impact of fiscal policy on intergenerational equity[16]. Furthermore, if fiscal rules overly emphasize short-term incentives while neglecting long-term fiscal sustainability, this may lead to unsustainable debt dynamics[17] Improvements to distribution rules have enhanced short-term targeting capabilities but have failed to effectively prevent resource depletion and policy volatility under fiscal pressure. Related studies have pointed out that targeted cash transfers can improve welfare in the short term but may fail to provide long-term financial resilience under sustained fiscal pressure[18]. Technical governance measures have strengthened accountability mechanisms but need to be effectively combined with macro-fiscal sustainability indicators to support the long-term stability of the system; for example, budget transparency should be linked to fiscal sustainability [19]. In summary, existing research generally optimizes fairness, efficiency, or governance transparency as independent dimensions without addressing the core question of "how to form a fiscal closed loop and maintain intertemporal sustainability under dynamic shocks." To address this gap, this paper proposes a computable institutional prototype with fiscal closure, integrating efficiency, equity, and on-chain accountability. Simulations show it enhances left-tail welfare while ensuring fiscal sustainability. We also introduce novel left-tail resilience and inequality metrics, offering operational tools to assess system stability under shocks.The specific objectives are threefold: (1)Proposes a sustainable inclusive framework integrating marginal pricing, Shapley cost-sharing, targeted transfers, mutual insurance, and on-chain accountability to achieve fiscal closure and intertemporal balance while ensuring efficiency and inclusiveness. (2)Reveals the intrinsic link between inclusiveness and sustainability by modeling heterogeneous groups and incorporating the elderly’s contributions, showing that inclusiveness is essential for fiscal and institutional viability. (3)Develops novel indicators—debt-adjusted inequality and left-tail resilience—validated through simulations, capturing dynamic poverty risks and demonstrating policy feasibility and long-term sustainability.
2. Materials and Methods
2.1. Assumptions and Setting
This paper constructs a life cycle heterogeneous individual economic model to characterize the dynamic mechanisms of income distribution and the social security system under population aging conditions. The economic entities are composed of individuals , and the population size changes with time .Based on age structure, the population is divided into minors (0–15 years old), workers (16–59 years old), and the elderly ( years old) to reflect the impact of life cycle differences on income and expenditure. The model operates under a discrete time setting, with each period representing a cycle of resource allocation and institutional operations. Two scenarios are designed: the baseline scenario (Baseline) and the inclusive scenario (Inclusive). In the Baseline scenario, income distribution is entirely market-driven, with risks primarily internalized through private channels and lacking institutional safeguards. In the Inclusive scenario, an integrated fund-insurance-governance mechanism is introduced, encompassing public funds and insurance pools, blockchain-based on-chain governance, and targeted compensation for low-income groups. This approach enhances transparency and accountability while achieving a balance between safety net protection and incentives. Further assuming heterogeneity among individuals in terms of labor capacity, health status, and medical expenses, this leads to differences in income and risk distribution. This assumption provides a theoretical foundation for comparing the distributional outcomes and sustainability of different institutional arrangements.
2.2. Production Sector
2.2.1. Production Function and Productive Factors
Under equilibrium conditions, total output is determined by capital, labor, technology, and management/organizational capital, with the production function defined as:
where represents the physical capital stock, denotes the efficient labor input, represents the exogenous or semi-exogenous level of technology, and is the aggregate quantity of management and organizational capital (see 2.2.3). The allocation weights of output among factors are determined by income shares, with the following elasticities:
2.2.2. Capital and Technology Dynamics
Capital and technology exhibit dynamic evolutionary characteristics over time. The capital stock changes under the influence of investment and depreciation, specifically:
where is the capital depreciation rate, and represents the proportion of output allocated to investment. Meanwhile, technological progress follows an exogenous growth pattern:
2.2.3. Management, Organizational Capital, and Aging Externalities
Management capital () consists of two components:
where represents the management contribution formed when the highest-skilled workers are selected to management positions through a certain proportion of , with their management weight normalized to . This component reflects the role workers play in organizational governance and resource allocation. In contrast, reflects the social governance and mutual aid network externalities associated with the proportion of the elderly population under an inclusive institutional framework. In numerical terms, the different institutional arrangements for management capital are manifested as follows:
Among these, represents the governance effectiveness formed when management positions exist, while measures the positive externalities of the elderly population structure on organizational capital.
2.2.4. Individual Effective Labor and Effort
The effective labor input of an individual during their working-age period is jointly determined by their skill level and effort rate. Assuming that an individual’s skill level, , follows a normal initial distribution, the effective labor input of an individual within the age range of is
where represents the individual’s effort rate. The effort rate is jointly influenced by governance quality and moral hazard constraints, formally expressed as
where denotes the maximum effort level, and reflects the moral hazard level of individuals under different institutional arrangements. In contrast, inclusive institutions reduce individuals’ motivation to shirk labor through governance mechanisms and mutual aid networks, thereby making .
2.3. Income Distribution and Individual Market Income
In the overall output distribution, income shares follow the principle of marginal contribution of production factors, allocated to capital, labor, and management factors: is allocated to capital; is allocated to labor; is allocated to management.Thus, the pre-tax market income of an individual i in period t can be expressed as:
where the capital share is normalized by ownership weights; the labor weight reflects the individual’s relative share in total effective labor; and the management weight represents the individual’s normalized weight in management positions.
2.4. Population and Health Expenditure Shocks
During population evolution, the increase in individual age can be represented as . The mortality rate is set as a piecewise linear or convex function, with a significant increase after age 60, reflecting the asymmetric impact of aging on population sustainability. Meanwhile, the fertility mechanism is set such that individuals in the working-age group (ages) reproduce new individuals according to the intensity parameter , ensuring the endogenous nature of population reproduction. Foreign labor enters the system through migration mechanisms, with migration intensity denoted as . The age of migrants follows a uniform distribution in the 18–30 age range, and skill levels are set to a log-normal distribution . An exogenous shock is represented by the migration indicator variable . This setup ensures that population evolution reflects both natural population processes and the structural impacts of external mobility.
Regarding health shocks, an individual’s medical expenditure follows a Gamma distribution across age stages:
where the expected value of medical expenditure increases significantly with age, as shown by . This reflects the differing health risks across life stages: lower expenditures during childhood, gradual increases during the working years, and a significant rise in old age.
2.5. Fund-Insurance-Blockchain Governance and Redistribution
Funds, insurance, and governance mechanisms collectively form an institutional channel for transforming "pre-tax market income" into "disposable income".This mechanism not only fulfills fiscal and social security redistribution functions but also enhances the inclusiveness and sustainability of the system through governance constraints, resource allocation, and risk-sharing. The sensitivity of governance costs as an accounting deduction is discussed in Appendix C: Robustness Analysis. The main model excludes this term to maintain structural closure and clarity in the solution.
2.5.1. Fund Resources, Governance Costs, and Blockchain Transparency
Within the framework of an inclusive institutional design, the core function of the fund is to provide a stable resource pool for risk sharing and redistribution. The fund’s available resources can be formally expressed as:
where represents the tax rate, denotes individual market income, signifies additional benefits from technological spillover effects, and governance costs , are composed of blockchain batch processing and transaction costs, including fixed costs and marginal costs that increase with the number of transactions, i.e., . Thus, the fund’s governance efficiency depends not only on macroeconomic output and the fiscal collection capacity of but is also constrained by the technical processing costs under the blockchain operating mechanism. To maintain the closed-form and reproducibility of the main model, this paper sets the governance cost term to 0 in the baseline; sensitivity analysis of accounting items is only conducted in Appendix C. For the decomposition and scale effects of governance costs, see Appendix A.1.
Compared with traditional fund operation models, blockchain-based transparent governance plays a key role. First, the immutability of on-chain records provides verifiable evidence for resource mobilization and allocation, effectively alleviating information asymmetry and moral hazards. Second, the automatic execution attribute of blockchain smart contracts reduces the cost of human intervention in administrative processes, making the allocation of fund resources across different purposes more transparent and predictable. Finally, through the distributed consensus mechanism among nodes, governance costs are transformed from centralized supervision to algorithmic rule constraints, further enhancing the credibility and inclusiveness of the system.
2.5.2. Insurance Pools, Claims Settlement, and Inclusive Allocation
Under the conditions of a given basic reimbursement ratio and a management fee rate calculated based on the amount paid out, the fund is allocated at the beginning of the period according to the rules to three categories of uses: general subsidies for the elderly, targeted compensation for the poorest groups, and resources entering the insurance premium pool. The corresponding budget allocations are as follows:
where is allocated for equal allowances for all elderly individuals, is allocated for targeted compensation for the poorest groups, and is allocated for resources entering the insurance premium pool. The on-chain smart contract locks the allocation caps and accounting criteria for the three categories and generates verifiable records on the blockchain ledger (see Appendices Appendix A.2 and Appendix A.3 for details).
Insurance claims are settled according to the unified principle of “full payment when resources are sufficient, proportional payment when resources are insufficient.” Let the previous period’s reserve fund be , the current period’s individual medical expenses be , and the management expense ratio be . Let the system-defined basic reimbursement ratio be . Then, the proportional payment factor and the individual claim amount are:
Based on this, the update of the end-of-period reserve is:
and the net surplus for the insurance period is recorded as:
The above is automatically calculated and executed by the on-chain contract in the settlement block; when , the full amount is paid out; when , it enters the proportional payment interval, ensuring that the budget is closed in real-time within the rules. The triggering and intensity of proportional payments are determined by the coverage ratio, whose formal definition and thresholds are detailed in Section 4.5. In an inclusive scenario, the universal elderly allowance and targeted compensation form an institutional safety net for the left tail of the distribution. If the current elderly population size is , the equal allowance received by the elderly is:
where is the individual’s age, and is an indicator function. Targeted compensation is implemented using a two-step method: benchmark criteria—weighted allocation. First, all individuals are ranked based on poverty identification criteria, and the poorest q proportion is selected to form the set . Then, allocation is weighted based on vulnerability:
When , the weight increases with age, while ensures that the weight for the youngest cohort is non-zero. The implementation of both types of transfers and insurance payments is automatically completed by on-chain smart contracts within the disbursement cycle, and verifiable certificates are generated through selective disclosure to reduce information asymmetry and administrative friction, while suppressing moral hazard and rent-seeking opportunities.
2.5.3. Targeted Taxation and Transfer Payments for High-Income Groups: A Compatibility Scenario
While inclusive policies such as universal subsidies and partial price controls can enhance the welfare of low-income groups without distorting the initial distribution pattern, such policies, due to their broad coverage, struggle to effectively constrain the right tail of income distribution (i.e., the high-income end), thereby yielding limited effects on metrics measuring overall inequality, such as the Gini coefficient. To simultaneously achieve the dual objectives of growth and inclusiveness and build a more optimal redistribution system, this study designs and introduces a targeted taxation-transfer payment mechanism. This mechanism aims to achieve incentive compatibility, i.e., without altering the original solution framework and constraint system of the model, it significantly enhances the progressivity and precision of secondary distribution by imposing a targeted surtax on income derived from capital (including dividends, interest, and capital gains) among high-income groups. The incremental fiscal revenue generated will be fully targeted for transfer payments to low-income groups. To ensure the simplicity and verifiability of the model, the mechanism is defined only at the parameter and calculation levels, avoiding the introduction of new nominal items or structural equations, thereby maintaining the structural stability of the original model. Specifically, the new tax base explicitly excludes labor income, i.e., the labor income tax rate is set to zero().
Taxation mainly targets the overall income and capital returns of high-income groups. We set the scenario tax rates and . In the model, the original comprehensive tax rate parameter can be regarded as a function of these two tax rates, i.e.,.The newly added taxes are fully included in the targeted subsidy share (such that ),while other fiscal projects are automatically adjusted according to existing budget constraints. Qualitative analysis results indicate that this non-labor tax base—targeted transfer combination design constitutes an incentive-compatible policy scenario. This mechanism can systematically strengthen the regulation of the upper income distribution and accurately transfer resources to the lower income groups without suppressing labor supply incentives and long-term economic growth momentum. Compared with the baseline scenario that relies solely on general inclusive policies, this mechanism can lead to a larger and statistically verifiable decline in the Gini coefficient. Specifically, the disposable income of the lower income groups shows sustained growth, and its volatility significantly converges. Within the parameter feasible domain of the model, the mechanism has minimal impact on macroeconomic output. Additionally, even under short-term fiscal pressures, the intertemporal budget balance condition embedded in the model ensures the steady-state operation of the policy framework, thereby guaranteeing the long-term sustainability of the policy experiment as designed in the model.
2.6. Two Scenarios for Individual Disposable Income
For consistency, the combined item of “after tax - allowances - claims” for individuals i during the period t is recorded as
where represents pre-tax market income, denotes the proportional tax rate, and refers to universal or standardized subsidies. Medical expenditures are recorded as , insurance payments as , and targeted transfers to the poorest groups as . Let denote the non-negative part of the value x, i.e., the larger of x and zero. Throughout the paper, is allowed to take negative values to reflect the debt-induced poverty that may be triggered by medical shocks.
2.6.1. Baseline Scenario
In the baseline scenario, which lacks inclusive institutional arrangements, individual disposable income is composed of market income minus out-of-pocket medical expenditures:
Negative values under this definition directly correspond to the current debt flow, fully preserving the left-tail distribution risk without non-negative truncation.
2.6.2. Inclusive Scenario
After introducing an integrated arrangement of funds, insurance, and targeted transfers, the original value of out-of-pocket expenses is first defined:
Individual disposable income is then expressed as
This structure implies that claims are prioritized to offset medical expenditures within the coverage scope, with any excess forming the non-negative portion of out-of-pocket expenditures; are distributed exclusively to the identified poorest groups according to rules, and may be weighted by age and vulnerability. Although this mechanism mitigates health shocks and adverse life cycle factors through insurance coverage and targeted compensation, if the intensity of protection and compensation is insufficient, may still be negative, with its meaning and measurement criteria consistent with the baseline scenario.
3. Deriving Algebraic Solutions for the Model
This chapter provides closed-form (or quasi-closed-form) algebraic expressions for the three major modules—production sector, factor prices, and fund-insurance-transfer—under the structural and mechanism settings established in Chapter 2. It also presents explicit formulas for individual disposable income and feasibility criteria under the Baseline and Inclusive scenarios.
3.1. Algebraic Solution for Production and Primary Distribution
Under constant returns to factors and perfect competition assumptions, production is determined by technology, capital, effective labor, and management/organizational capital, with the output function given by
where . Under perfect competition and marginal product pricing, the first-order conditions yield the factor prices per unit of output (i.e., the factor income shares equal the output elasticities):
Management/organizational capital () is the sum of position-specific management contributions and externalities from aging governance:
where is the proportion of highly skilled workers entering management positions, is the corresponding skill aggregation (weighted and normalized), is the proportion of the elderly population, and is the externality function associated with the elderly mutual aid/governance network. By applying the chain rule, we obtain the logarithmic elasticity of the elderly structure on output through the management channel:
The derivation of the elasticity formula is presented in Proposition D1 of Appendix D. In the life cycle dimension, the total effective labor supply is defined as
where is individual skill, is effort rate, and is moral hazard intensity (in an inclusive scenario, is lower, so is higher). This section only unifies notation and aggregation criteria; behavioral propositions are not elaborated. Based on this, the pre-tax market income of an individual i can be expressed as a "share-type" closed-form expression:
here is the capital ownership weight (normalized), is the labor weight, and is the management position weight, normalized over the selected set and summed to 1.
3.2. Algebraic solution and scenario-based disposable income
3.2.1. Fund Available Resources and Three-Way Budget Allocation
Let the available resources of the fund in period t be
here is the proportional tax rate, is the pre-tax market income of individuals, represents the resources allocated to the fund from the technology share (or spillover) according to the established rules, and is the governance/operational expenses, which are not listed separately, such that . Sensitivity analysis is conducted in Appendix C. At the beginning of the period, the fund is divided into three budgets according to fixed shares:
where and . is allocated for general elderly allowances, is allocated for targeted compensation for the poorest groups, and is allocated to the insurance premium pool; the remaining share is retained or allocated to other public purposes but does not affect the budget closure in this document.
3.2.2. Insurance Pool: Proportional Allocation Factor and Reserve Fund Dynamics
Following the unified rule of "full payment when resources are sufficient and proportional payment when resources are insufficient," the basic reimbursement for all individuals is scaled proportionally using the same ratio (), ensuring the budget closes within the rules in real time. The accounting equation for the current period is
Within the settlement block, calculate (when resources are sufficient, ; otherwise, ), and update the end-of-period reserve fund accordingly. The on-chain smart contract automatically performs calculations and accounting, while generating verifiable transactions and receipts for audit review and external verification. For regulatory verification, this document adopts the coverage ratio as a standardized Key Performance Indicator(KPI); its definition and threshold criteria are detailed in Section 4.5 and are not repeated here.
3.2.3. General Allowances for the Elderly and Targeted Compensation
To distinguish between universal support for the elderly population and targeted assistance for vulnerable groups, this study divides public transfers into two components: general allowances and targeted compensation. General allowances are distributed equally per capita to eligible elderly individuals: Let the current general budget allocated for the elderly be , and the size of the eligible elderly population be . Then, each elderly individual receives an amount equal to it during the period:
To enhance the targeting of resources toward impoverished elderly individuals, we rank individuals based on their baseline disposable income from lowest to highest and allocate those in the bottom proportion to the set as the target group for targeted compensation. To avoid certain age groups (such as the youngest elderly group) having zero weights and to reflect the policy orientation of increasing support with age, we define a weight function that monotonically increases with age:
where is the individual’s age, is the shift term to prevent zero weights, and controls the steepness of the increase with age. Let the total targeted compensation for the current period be . Then, for individuals in , their targeted compensation is
For individuals with , . The above settings ensure that targeted resources are allocated within the target population according to age-weighted distribution, thereby providing stronger protection for the elderly in poverty.
3.2.4. Individual Disposable Income in Two Scenarios
To uniformly express the combined effects of taxes, subsidies, and insurance claims, the “after tax - allowances - claims” income of an individual in period t is denoted as
where is market income, is the proportional tax rate, and is the current medical insurance claim. Total medical expenditure is denoted as . The excess portion that individuals must pay out-of-pocket is defined as
Under this framework, consider the disposable income under two institutional scenarios. First, Baseline (no inclusive system): No taxes, insurance, or subsidies are introduced. Individuals directly bear all medical expenses, and disposable income is
Negative values are allowed when medical burdens are heavy, thereby recording them as current debt flows. Second, Inclusive (Fund + Insurance + Targeted Compensation): Insurance (linked to relevant funds) first compensates for medical expenses, with the remaining portion borne by individuals; general subsidies and targeted compensation are also accounted for. In this scenario,
this structure implies that the system first mitigates medical expenditures, but when insurance coverage is insufficient, may still be negative.
3.2.5. Vector-Matrix Representation
Let the normalized weight vectors for capital/labor and management be and , respectively, and let denote the effective labor force of an individual. Let the selection matrices be (the elderly group) and (the poorest group), and define the diagonal matrix of welfare weights
Based on this, the general allowance and targeted compensation can be expressed in vector form:
here is the per capita general allowance level for the elderly, and is the current total budget for targeted compensation, which is allocated proportionally within the poorest set according to . The insurance payment vector is defined element-wise as
where is the current proportional factor, and is the expected insurance payout at the individual level. Applying the operator element-wise yields the closed-form expressions for the disposable income vector under the baseline and inclusive schemes.
3.3. Feasibility, Equilibrium, and Comparative Static Analysis
3.3.1. Capital and Output: Normalized Steady State and Scale Closure
Under the exogenous investment rates and depreciation rate , we introduce the technology scaling factor to normalize capital as . The system dynamics are written as
Based on this, the unique steady state of normalized capital is obtained
In the steady state, output and capital scale have a closed-loop (or quasi-closed-loop) expression:
Under marginal product pricing, the first distribution satisfies "share = elasticity." Additionally, the governance-organization channel generates externalities on output through capital management; the impact of the aging structure on growth can be expressed as logarithmic elasticity, used to characterize comparative statics under different governance scenarios. Relevant derivations and proofs are provided in Appendix D: Proposition D1.
3.3.2. Budget-Insurance Closure and Proportional Payout
Under a given settlement rule, the insurance module has a unique proportional payment factor for each period. The value of this factor is consistent with the reserve fund status and, together with the current period’s claims-accounting identity, ensures the immediate closure of the budget; that is, after settlement, the identity relationship among the reserve fund, claims, and resources allocated to the insurance pool in the current period is satisfied, with no deficits or carryovers. The triggering and intensity of proportional payments are determined by the coverage ratio. The formal definition and threshold of the coverage ratio are detailed in Section 4.5. When the coverage ratio is greater than or equal to the threshold, full payment is executed for the current period (); when the coverage ratio is below the threshold, a uniform proportional payment is triggered (), and all individual claims are scaled by the same proportion, thereby ensuring budget closure for the current period and maintaining horizontal consistency.
The above closed-loop mechanism is automatically executed at the settlement layer by the settlement block: the system calculates the based on the rules, generates the final payouts for each entity, and synchronously updates the reserve status. The corresponding vouchers are recorded in a verifiable manner for audit review and cross-period comparison. This mechanism is equivalent to a simple and robust feedback control: when actual payouts increase, payouts are automatically reduced to prevent the reserve from becoming negative; when risks decline or resources are sufficient, full payouts are resumed. General elderly allowances and targeted compensation are executed independently according to the established budget scope, without altering the closed-loop nature of the insurance module. The two types of transfers are advanced in parallel with insurance settlement within the accounting period and are recorded consistently in terms of “who, how much, and what” through on-chain vouchers, thereby ensuring the overall traceability and auditability of the system. In summary, the proportion factor—coverage ratio—reserve update form a consistent budget closure chain: the coverage ratio provides the trigger criteria, the proportion factor specifies the uniform execution coefficient, and the reserve update completes the state feedback. This chain demonstrates the stability of “spending based on revenue” during the pilot period.
3.3.3. Redistribution and Pricing: Age-Weighted Universal -Targeted and Distortion-Free Margins
When threshold conditions are met, equal universal allowances are provided to the elderly population in the current period; targeted compensation is provided to the poorest q proportion of individuals based on an age-weighted function. The two types of transfers are automatically settled under the three-way budget and proportional allocation rules, and are linked to the closed-loop or segmented expression of individual disposable income, facilitating numerical reproduction and model calibration. Fixed costs are allocated according to the Shapley scheme for cooperative games, and marginal quantities are priced using a two-part pricing mechanism to ensure that marginal prices equal marginal costs. This mechanism satisfies both feasibility and individual rationality constraints, avoids shifting fixed costs to high-efficiency or high-usage entities, maintains distortion-free margins, and is compatible with the “share = elasticity” pricing principle. A formal proof is provided in Appendix D, Proposition D2.
4. Numerical Simulation Results
4.1. Population and Macroeconomic Evolution: Structure-Output Linkage
This chapter analyzes the evolutionary effects of inclusive institutions through numerical simulation. Two scenarios are compared: the baseline scenario without an inclusive mechanism, and the inclusive scenario with insurance payments, targeted compensation, and standardized budget arrangements. Both scenarios maintain consistency in population structure classification, production function settings, fiscal constraint forms, and parameter selection to ensure comparability.
Figure 1 illustrates the demographic dynamics across age groups. In the 60th period, the total population increased from 910.67 to 1,202.53 under the inclusive scenario, with the working-age population rising from 526.44 to 683.31, the child population increasing from 166.35 to 231.11, and the elderly population growing from 217.88 to 288.11. The proportion of the labor force slightly decreased (57.81% to 56.82%), while the proportions of children and the elderly slightly increased (19.22% and 23.96%, respectively). Despite the overall dependency ratio rising from 0.73 to 0.76, the expansion of the labor force and improvements in human capital enhanced the carrying capacity. The expansion primarily stemmed from two mechanisms: first, insurance and targeted compensation alleviated catastrophic expenditures, enhanced health investment and life cycle budget flexibility among low-income households, and improved child survival rates and elderly life expectancy; second, enhanced institutional credibility and accessibility of public services attracted net migration, sustaining population growth. Figure 2 indicates that despite the inclusion of transfer mechanisms, institutional design has not weakened long-term growth potential. With the externalities of organizational capital and technological inputs, per capita output in the Inclusive scenario remains higher than in the Baseline scenario, and the growth path is stable, without amplifying fluctuations or output declines. This aligns with the comparison of the static model, which suggests that the aging population’s impact on output is amplified by organizational capital.
4.2. Distribution and Inequality: Supporting the Bottom Without Harming the Top
To accurately identify debt-induced poverty, this chapter uses a statistical approach that allows negative values to enter the calculation to analyze wealth distribution and inequality evolution. Figure 3 uses L1 normalization and a debt-inclusive denominator to process wealth shares, with the Top 10% calculated based on the total population and the Bottom 10% limited to adults (≥ 16 years old). This framework adheres to three principles: (1) robustness to negative wealth and leverage; (2) the Top 10% reflects concentration; and (3) the Bottom 10% focuses on the target group for policy support. Simulation results show that the inclusive scenario exerts minimal pressure on the right tail: The wealth share of the Top 10% slightly increases (0.008021 → 0.008442), volatility slightly decreases (variance: ), and stability improves. Improvements in the left tail are more significant: The wealth share of the Bottom 10% converges from -0.266314 to -0.265429, variance decreased from 0.003660 to 0.003082, with the path remaining above or close to the baseline scenario throughout, indicating significant convergence in volatility. Under this statistical setting, the mean difference is not significant, but the "+" trend over time provides stronger evidence, confirming the system’s characteristic of "supporting the bottom without harming the top".
Figure 4 measures overall inequality using a standardized Gini coefficient, which addresses negative net income and debt issues. The mean values of the Baseline and Inclusive scenarios are close (0.466498 vs. 0.468307), but the latter has a smaller variance (0.001897 vs. 0.002110), indicating that the inclusive mechanism does not alter the overall mean but effectively suppresses sequence volatility, enhancing institutional stability. This trend aligns with the convergence of fluctuations in the Bottom 10%.
4.3. Compatibility Mechanism Analysis of Tax-Transfer Linkage
Include Compatibility Scenario as the third scenario alongside Baseline and Inclusive in the simulation. This scenario builds upon the inclusive mechanism by introducing a "tax-wealth—targeted transfer" module: imposing additional taxes on high incomes and capital returns, and implementing targeted bottom-up transfers through standardized budget arrangements. All parameter settings follow the specifications outlined in Section 2.5.4, with the exception of scenario-specific differences. All other parameters, including exogenous settings, measurement criteria, budget constraints, and solution procedures, remain consistent with Section 4.1 and Section 4.2. Overall inequality is still measured using the "debt-inclusive standardized Gini coefficient." The income dynamics of the bottom group are characterized by the disposable income time path of the Bottom 10% of adults (aged 16 and above), ensuring the completeness and targeting of the identification path.
Figure 5 shows that, while maintaining the integrity of primary distribution incentives (i.e., without distorting the labor tax base), the standardized Gini coefficient under the compatibility scenario remains significantly lower than that under the baseline and inclusive scenarios, with a faster decline trend. This indicates that the "tax-wealth—targeted transfer" mechanism has a sustained and effective role in reducing overall inequality, and its effects remain stable and identifiable after the transition period. Figure 6 further illustrates the evolution of the disposable income of the bottom 10% of adults under the three scenarios. It can be seen that the path in the compatibility scenario has a higher central point, a more stable growth trend, and a converging fluctuation band, demonstrating stronger bottom-up support capacity than the inclusive and benchmark scenarios. This improvement does not come at the expense of institutional stability, as all fiscal operations are closed under the same budget rules, without introducing additional exogenous capital injections or compressing efficiency through proportional compensation.
Overall, the compatibility design achieves a better distribution outcome by imposing progressive tax constraints on the right tail group while providing rule-based transfers to the left tail, without interfering with the incentives for primary distribution and output momentum. This secondary distribution mechanism demonstrates good coupling effects, fiscal endogenous closure, and long-term sustainability, showcasing clear advantages in structural and policy design.
4.4. Baseline Fiscal Sustainability of the Inclusive Mechanism
Figure 7 illustrates the evolution trend of the fund’s net resources under the inclusive scenario. The series increased from 11.45 to 20.52 during the sample period, showing a steady overall upward trend with moderate fluctuations and no significant decline in the middle segment. Budget allocation was distributed among elderly allowances, targeted compensation, and insurance, mitigating procyclical fluctuations and supporting the "left-tail improvement-volatility convergence" observed in Figure 3 and Figure 4.
To test the fiscal sustainability of the inclusive system under benchmark parameters, Figure 8 plots the insurance pool coverage ratio:
where represents the previous period’s reserve fund, denotes the budget allocation for insurance premiums in the current period, is the management fee rate calculated based on claims payments, and represents the expected claims payments for the current period. The criteria are clear: when , no proportional payments are required, and the budget is balanced on a periodic basis; if ,proportional payments are triggered, and , ensuring that the budget constraint is immediately established. Figure 8 shows that the coverage ratio remains stable above the threshold line throughout the process and rises gradually over time, proving that the inclusive system has strong fiscal sustainability under standardized budget and management fee settings, while also possessing the automatic stabilizing attribute of spending based on revenue. This mechanism also has policy operability, with the coverage ratio serving as a governance KPI for real-time auditing and system evaluation, ensuring that each period operates within clear, supervisable rules to achieve budget balance.
4.5. Endpoint Sensitivity Analysis
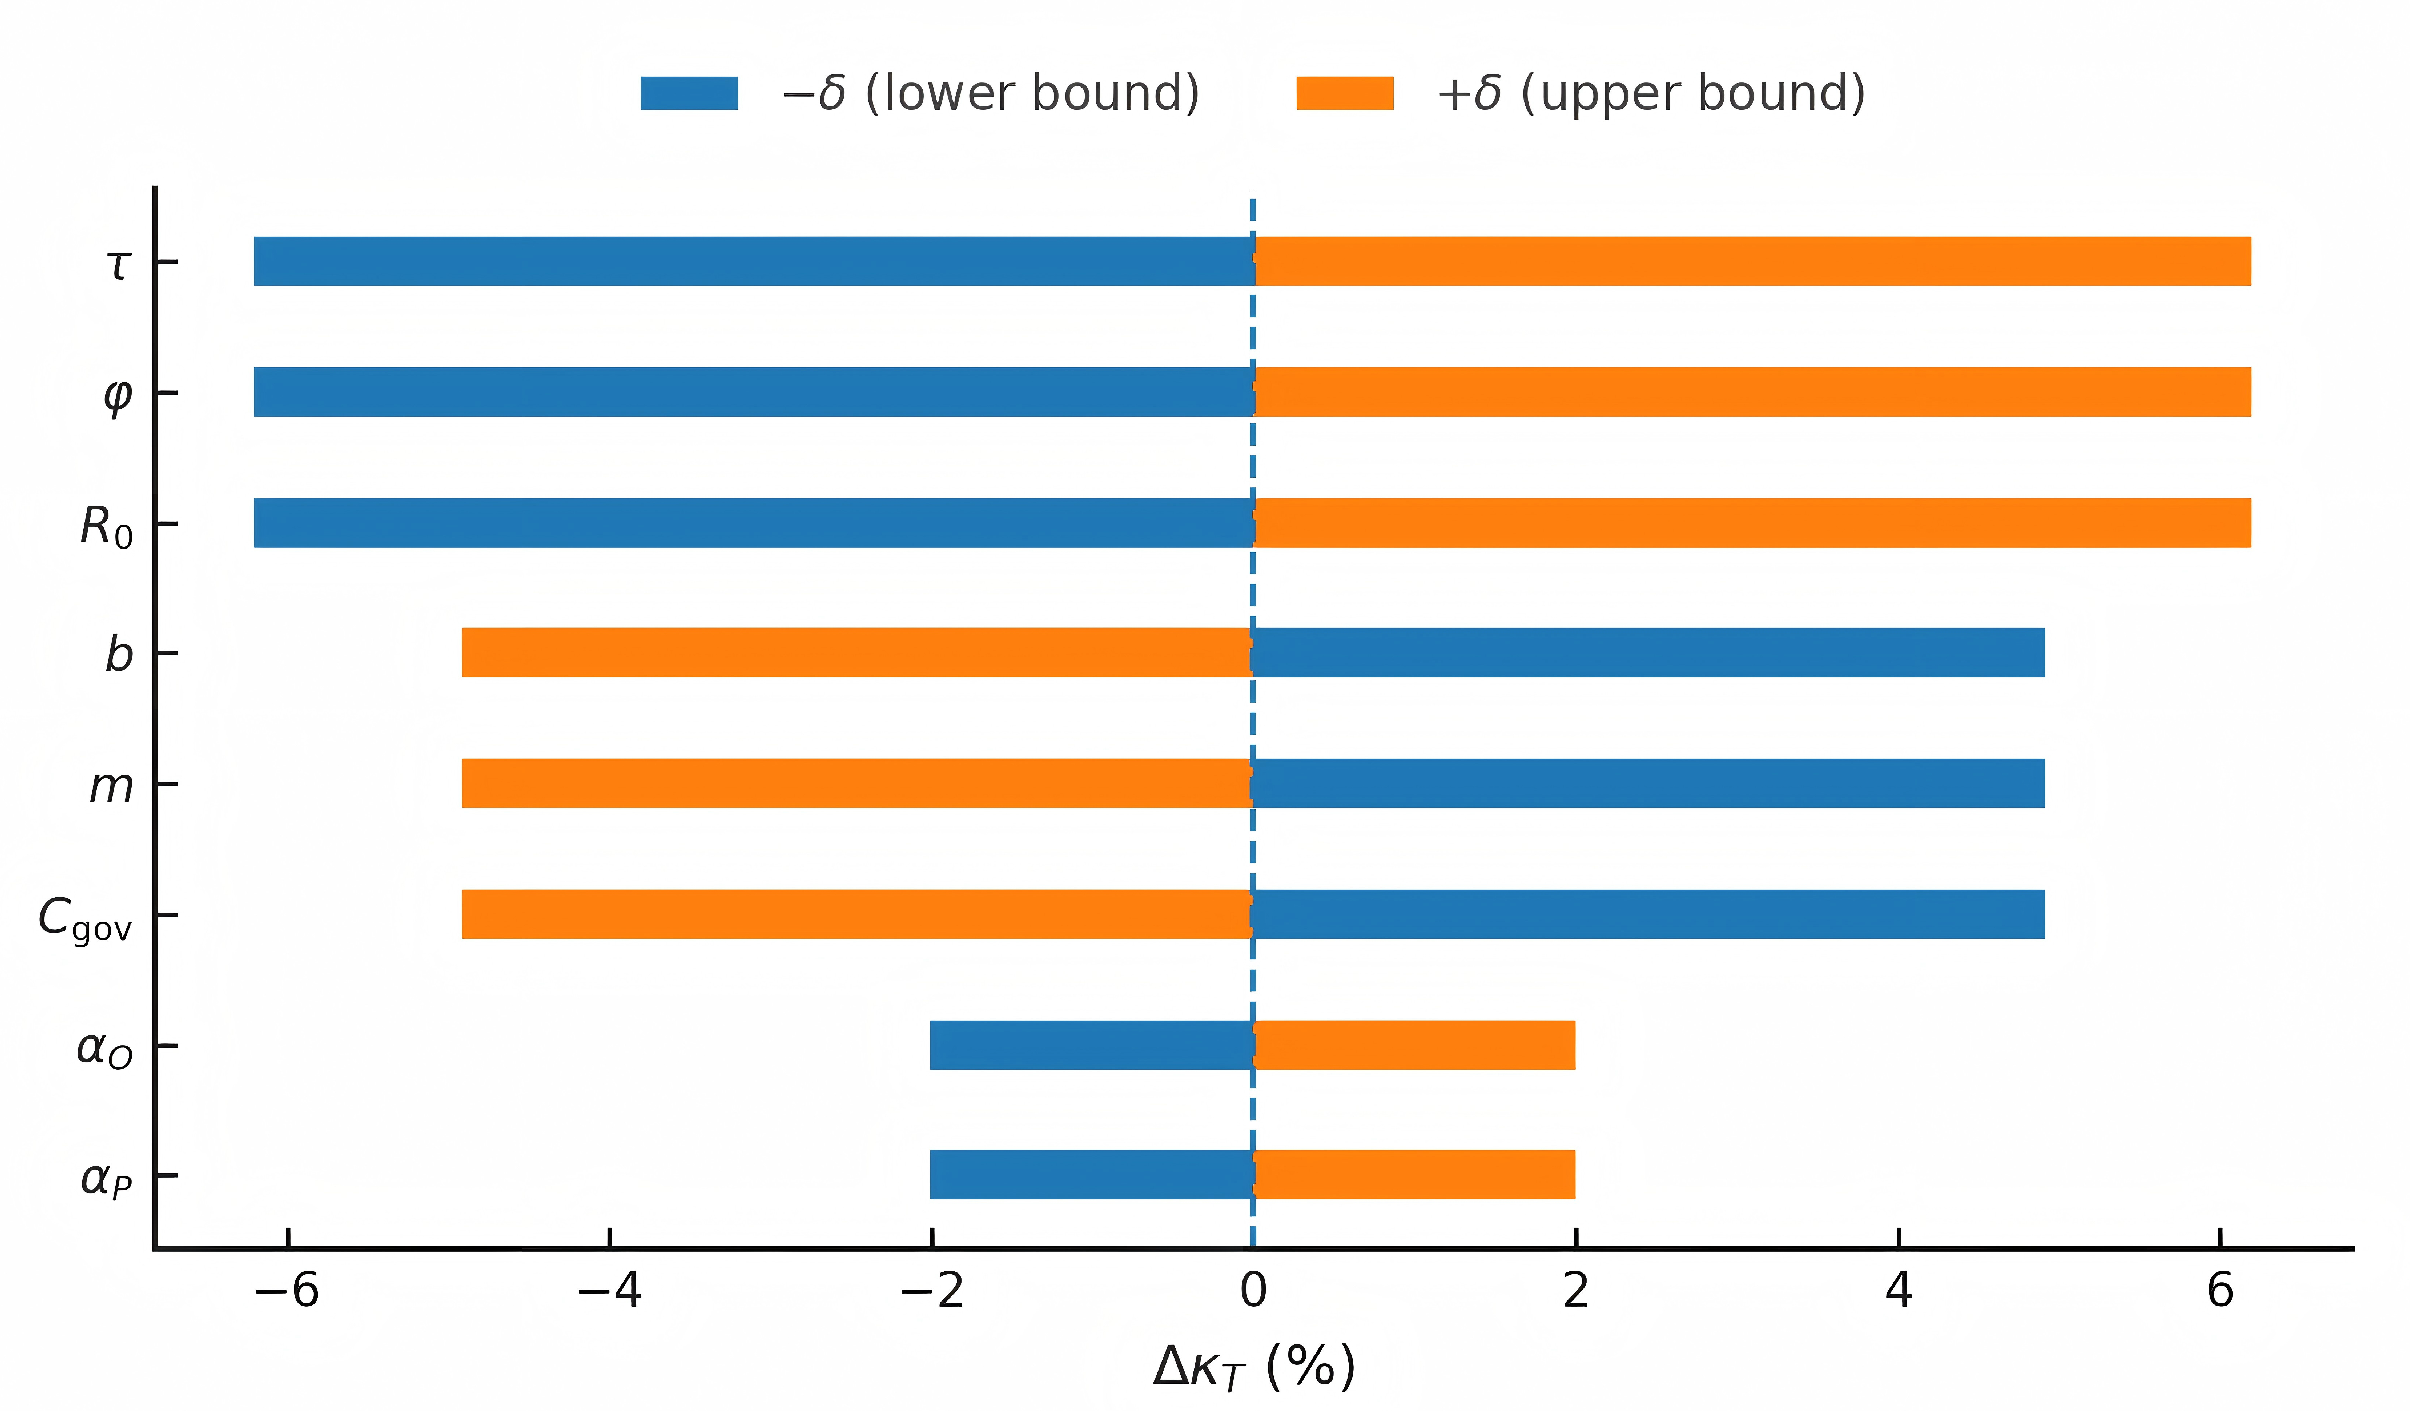
To verify the directional robustness of key conclusions under minor perturbations of core parameters, this study conducted a single-factor endpoint sensitivity analysis under the baseline settings established in Section 4. The following parameters were selected: tax rate , elderly allowance share , targeted compensation share , basic reimbursement ratio b, management fee rate m, technology injection ratio , and initial reserve . Each parameter was subjected to a to the baseline, applied disturbances to the governance cost , and kept the remaining parameters unchanged. With the end-period coverage ratio as the target variable, the following indicators were defined:
The endpoint sensitivity map obtained after sorting is shown in Figure 9. The results indicate that: an increase in the input variable tax rate , technology injection ratio , and initial reserve raises the coverage ratio by approximately 6.2%, while a decrease lowers it by approximately 6.2%; while increasing the baseline reimbursement ratio b, management fee rate m, and governance cost reduces the coverage ratio by approximately 4.9%, and decreasing them increases the coverage ratio by approximately 4.9%. The two redistribution share parameters and have a relatively small impact, with fluctuations within ±2.0%. Overall, strengthening the inflow or reducing costs improves fund sustainability, while strengthening the outflow or increasing costs weakens sustainability. Combining the baseline path results from Section 4, it can be seen that the core conclusions of this paper remain consistent in direction under moderate parameter perturbations, demonstrating strong robustness. Additionally, the results for governance costs are consistent with the robustness tests in the appendix.
5. Conclusions
To address the dual challenges of global aging and fiscal austerity, and to resolve the long-standing dilemma that traditional policies—due to the fragmentation of economic incentives, social security, and governance accountability—have been unable to effectively balance social equity, fiscal soundness, and economic efficiency, this paper constructs an integrated institutional framework that endogenously integrates marginal pricing, rule-based redistribution, and on-chain accountability mechanisms. Its core design objective is to achieve sustainable inclusive growth that encompasses social, economic, and fiscal dimensions. Through rigorous institutional closed-loop design, the framework ensures that the social security system fulfills its fairness function while maintaining its long-term fiscal sustainability and incentive compatibility with economic growth.
Numerical simulation results strongly validate the framework’s effectiveness on the path toward sustainable development. In an inclusive scenario, the mechanism demonstrates fiscal and social sustainability: the net resources of the fund, which serves as the lifeline of the system, steadily increased from 11.45 units at the beginning of the period to 20.52 units, while the key performance indicator “coverage rate” of the insurance pool remained significantly above the 1.0 revenue-expenditure balance threshold throughout the simulation period, avoiding the risk of long-term deficits. At the social level, this mechanism enhances the resilience of vulnerable groups by providing targeted support without undermining the incentives of high-income groups (the wealth share of the top 10% remains stable, with volatility decreasing from 0.001612 to 0.001537), significantly enhancing the risk-resilience of the bottom 10% of the population. The wealth share variance of the poorest 10% of adults converged by nearly 16% (from 0.003660 to 0.003082). Furthermore, in a scenario compatible with the introduction of “tax-wealth—targeted transfers”, the model’s sustainability is further strengthened: the disposable income of the poorest 10% of adults increases by more than double compared to the baseline scenario, while the standardized Gini coefficient—a measure of overall inequality—plummets from approximately 0.36 to 0.25, a decrease of over 30%. This demonstrates the potential to achieve higher levels of social equity without compromising long-term economic sustainability.
The core contribution of this study lies in providing a computable institutional prototype that endogenously integrates economic incentives, social equity, and fiscal discipline, offering a verifiable pathway toward achieving sustainable inclusive growth. Its innovation lies in linking Shapley fixed cost allocation, age-weighted targeting, proportional insurance payments, and on-chain accountability mechanisms for joint solution, while introducing inequality indicators that incorporate net income and debt with negative values, providing new analytical tools for precisely identifying and addressing vulnerabilities. Future research can be expanded in terms of deepening heterogeneity, calibrating key behaviors, and expanding dimensions to enhance the model’s real-world explanatory power.
Author Contributions
Conceptualization, H.S. and X.X.; methodology, H.S. and X.X.; software, H.S.; validation, H.S. and X.X.; formal analysis, H.S. and X.X.; investigation, H.S.; resources, Q.Y.; data curation, H.S.; writing—original draft preparation, H.S.; writing—review and editing, H.S., Q.Y. and X.X.; visualization, H.S.; supervision, X.X.; project administration, X.X. All authors have read and agreed to the published version of the manuscript.
Funding
This research received no external funding.
Institutional Review Board Statement
Not applicable.
Informed Consent Statement
Not applicable.
Data Availability Statement
Data will be made available on request.
Acknowledgments
The completion of this thesis is not only the culmination of my personal efforts but also the result of the support and encouragement of countless individuals. I would like to express my heartfelt gratitude to all of you. First and foremost, I would like to thank my advisor, Professor Xi Xi. Under his meticulous guidance, I have come to appreciate the rigor and beauty of academic research. Whether in terms of research methods or conceptual frameworks, he has provided me with profound insights and selfless assistance, guiding my research in the right direction.I would also like to express my heartfelt gratitude to my family and friends. During times of confusion and hardship, your unwavering support was my greatest source of strength, and your valuable advice served as a guiding light on my path forward. Finally, I would like to thank life itself. The unforgettable moments and the brilliant sunshine have not only given me strength but also kept me filled with passion and courage as I continue on my journey toward the halls of academia.
Conflicts of Interest
The authors declare no conflicts of interest. The funders had no role in the design of the study; in the collection, analyses, or interpretation of data; in the writing of the manuscript; or in the decision to publish the results.
Abbreviations
The following abbreviations are used in this manuscript:
| CCT | Conditional Cash Transfer |
| Cgov | Governance Cost |
| KPI | Key Performance Indicator |
Appendix A. Blockchain Governance: Cost, Contracts, and Institutional Coupling
Appendix A.1. Blockchain Governance Cost Breakdown and Scale Effects
In the operation of the fund–insurance system, governance costs have a fundamental impact on the efficiency of resource allocation. Unlike centralized fiscal supervision, on-chain governance forms a dual structure of fixed inputs plus transaction-related consumption through distributed ledger technology and consensus: the former primarily manifests as fixed expenditures such as node deployment, contract platforms, and security infrastructure, which remain constant over time and do not vary with transaction scale; the latter varies with the number of transactions and data volume during the on-chain, verification, and consensus processes, and is a function of computational and storage intensity.
Empirical simulations show that when transaction scale is small, the proportion of fixed inputs is higher; as scale expands, the proportion of marginal costs in total governance costs increases, but their growth rate is slower compared to traditional administrative oversight costs, thereby ensuring scalability and cost advantages in the long term. In the main model, governance expenses are treated solely as accounting items to ensure the identifiability of structural equations and first-order conditions. This appendix provides corresponding sensitivity analyses to validate the robustness of the main conclusions regarding the scope of governance costs.
Appendix A.2. Smart Contracts and Fund Allocation Mechanisms
Smart contracts provide the minimum executable path for disbursement and audit: when the recipient meets the threshold-based eligibility and targeting conditions, the contract automatically triggers during the disbursement cycle, calculates the amount to be disbursed, and records the transfer, generating a verifiable transaction chain on the blockchain. Since the rules are publicly available on the blockchain and fixed through consensus, external parties can independently verify “who, when, how much, and based on what evidence,” thereby mitigating information asymmetry and reducing implementation friction without altering the structural model.
To ensure the endogenous closure of fiscal constraints, the contract links to the coverage ratio—reserve status during execution: when the coverage ratio is no less than 1, regular payments are made; when the coverage ratio temporarily falls below the threshold, the system automatically switches to proportional payments. The relevant status is written back to the fund ledger and audit module, forming a closed-loop accountability mechanism under triple-entry accounting and selective disclosure.
Appendix A.3. Institutional Coupling Between Blockchain and Inclusive Growth
Treat blockchain as a technical foundation for governance and accountability rather than as a simulation entity, transforming institutional trust from centralized supervision into a combination of technical consensus and verifiable credentials, thereby reducing agency problems and post-execution verification costs during implementation. For vulnerable groups, on-chain verifiable identity and income/health impact data streams (under selective disclosure) improve targeting accuracy, reduce misallocation and under-allocation, and provide a low-friction implementation channel for linking targeted compensation, mutual insurance, and proportional payments.
At the intertemporal level, on-chain records of coverage ratios and reserve fund status shift fiscal sustainability regulation from offline reports to real-time auditable data. This “institutional–technological” embedding approach is compatible with the main mechanism of this paper, does not alter the incentives or structural equations of the primary distribution, but significantly enhances transparency and replicability at the implementation level.
Appendix B. Parameter and Variable Table

Table A1.
Parameters (with aliases consistent with the main text).
| Symbol | Definition | Value/Range |
|---|---|---|
| Output elasticities (factor income shares) of capital, labor, technology, and management | , | |
| Capital depreciation rate | ||
| Share of output allocated to investment | ||
| Exogenous (or semi-exogenous) technology growth rate | ||
| Proportional income tax rate | ||
| Share of technology income routed to fund | ||
| Management fee rate on insurance payouts | ||
| Baseline medical reimbursement ratio | ||
| Budget shares for universal, targeted, and insurance modules | , sum | |
| q | Bottom proportion for targeted set | |
| Age-weight parameters in | , | |
| Share of top-skilled workers entering management | ||
| Scale factor in management/organizational capital | ||
| Externality map from elderly share to | – | |
| Elderly share (population ratio) | ||
| Output scaling/injection factor in fund identity | ||
| Scale factor in production/normalization | ||
| Governance cost (accounting item) |
Table A2.
Key state and flow variables.
| Symbol | Definition | Symbol | Definition |
|---|---|---|---|
| Aggregate output | Capital, technology, management/organizational capital | ||
| Aggregate effective labor | Individual effective labor | ||
| Individual skill | Effort rate | ||
| Moral hazard intensity | Population size at time t | ||
| Pre-tax market income of i | Normalized ownership/position weights | ||
| Individual medical expenditure | Insurance payout | ||
| Total medical expenditure (alt. symbol) | Out-of-pocket non-negative part | ||
| Fund available resources | Budgets for universal, targeted, insurance | ||
| Resources entering insurance premium pool | End-of-period reserve balance | ||
| Proportional payout factor (insurance) | Coverage ratio | ||
| Per-capita universal allowance for elderly | Eligible elderly count in period t | ||
| Targeted set (poorest q proportion) | Targeted transfer for | ||
| Age weight | After-tax-and-transfers income | ||
| Disposable income |
Appendix C. Robustness Tests
The main model in this paper does not include government expenditures or governance costs. To test the fiscal consistency of the proposed system under real-world implementation conditions, we add an exogenous governance cost term to the fund accounting identity without altering any core equations (including the production function, allocation rules, and individual budget constraints), and conduct sensitivity analysis. Specifically, fund resources are recorded as
corresponding to the scenario without governance costs; in the scenario with governance costs, it is deducted in accounting terms
This term does not enter the utility or constraints of any entity, nor does it affect prices or factor allocation—it only alters the net amount of fund resources available for transfer and insurance. Parameters and definitions follow the calibrated inclusive scenario baseline parameters (consistent with the main text): , technical spillover injection ratio , and governance costs are set at a fixed plus a marginal . All other parameters remain consistent with the main text.
Figure A1.
Fund Trajectory: With vs. Without Governance Costs
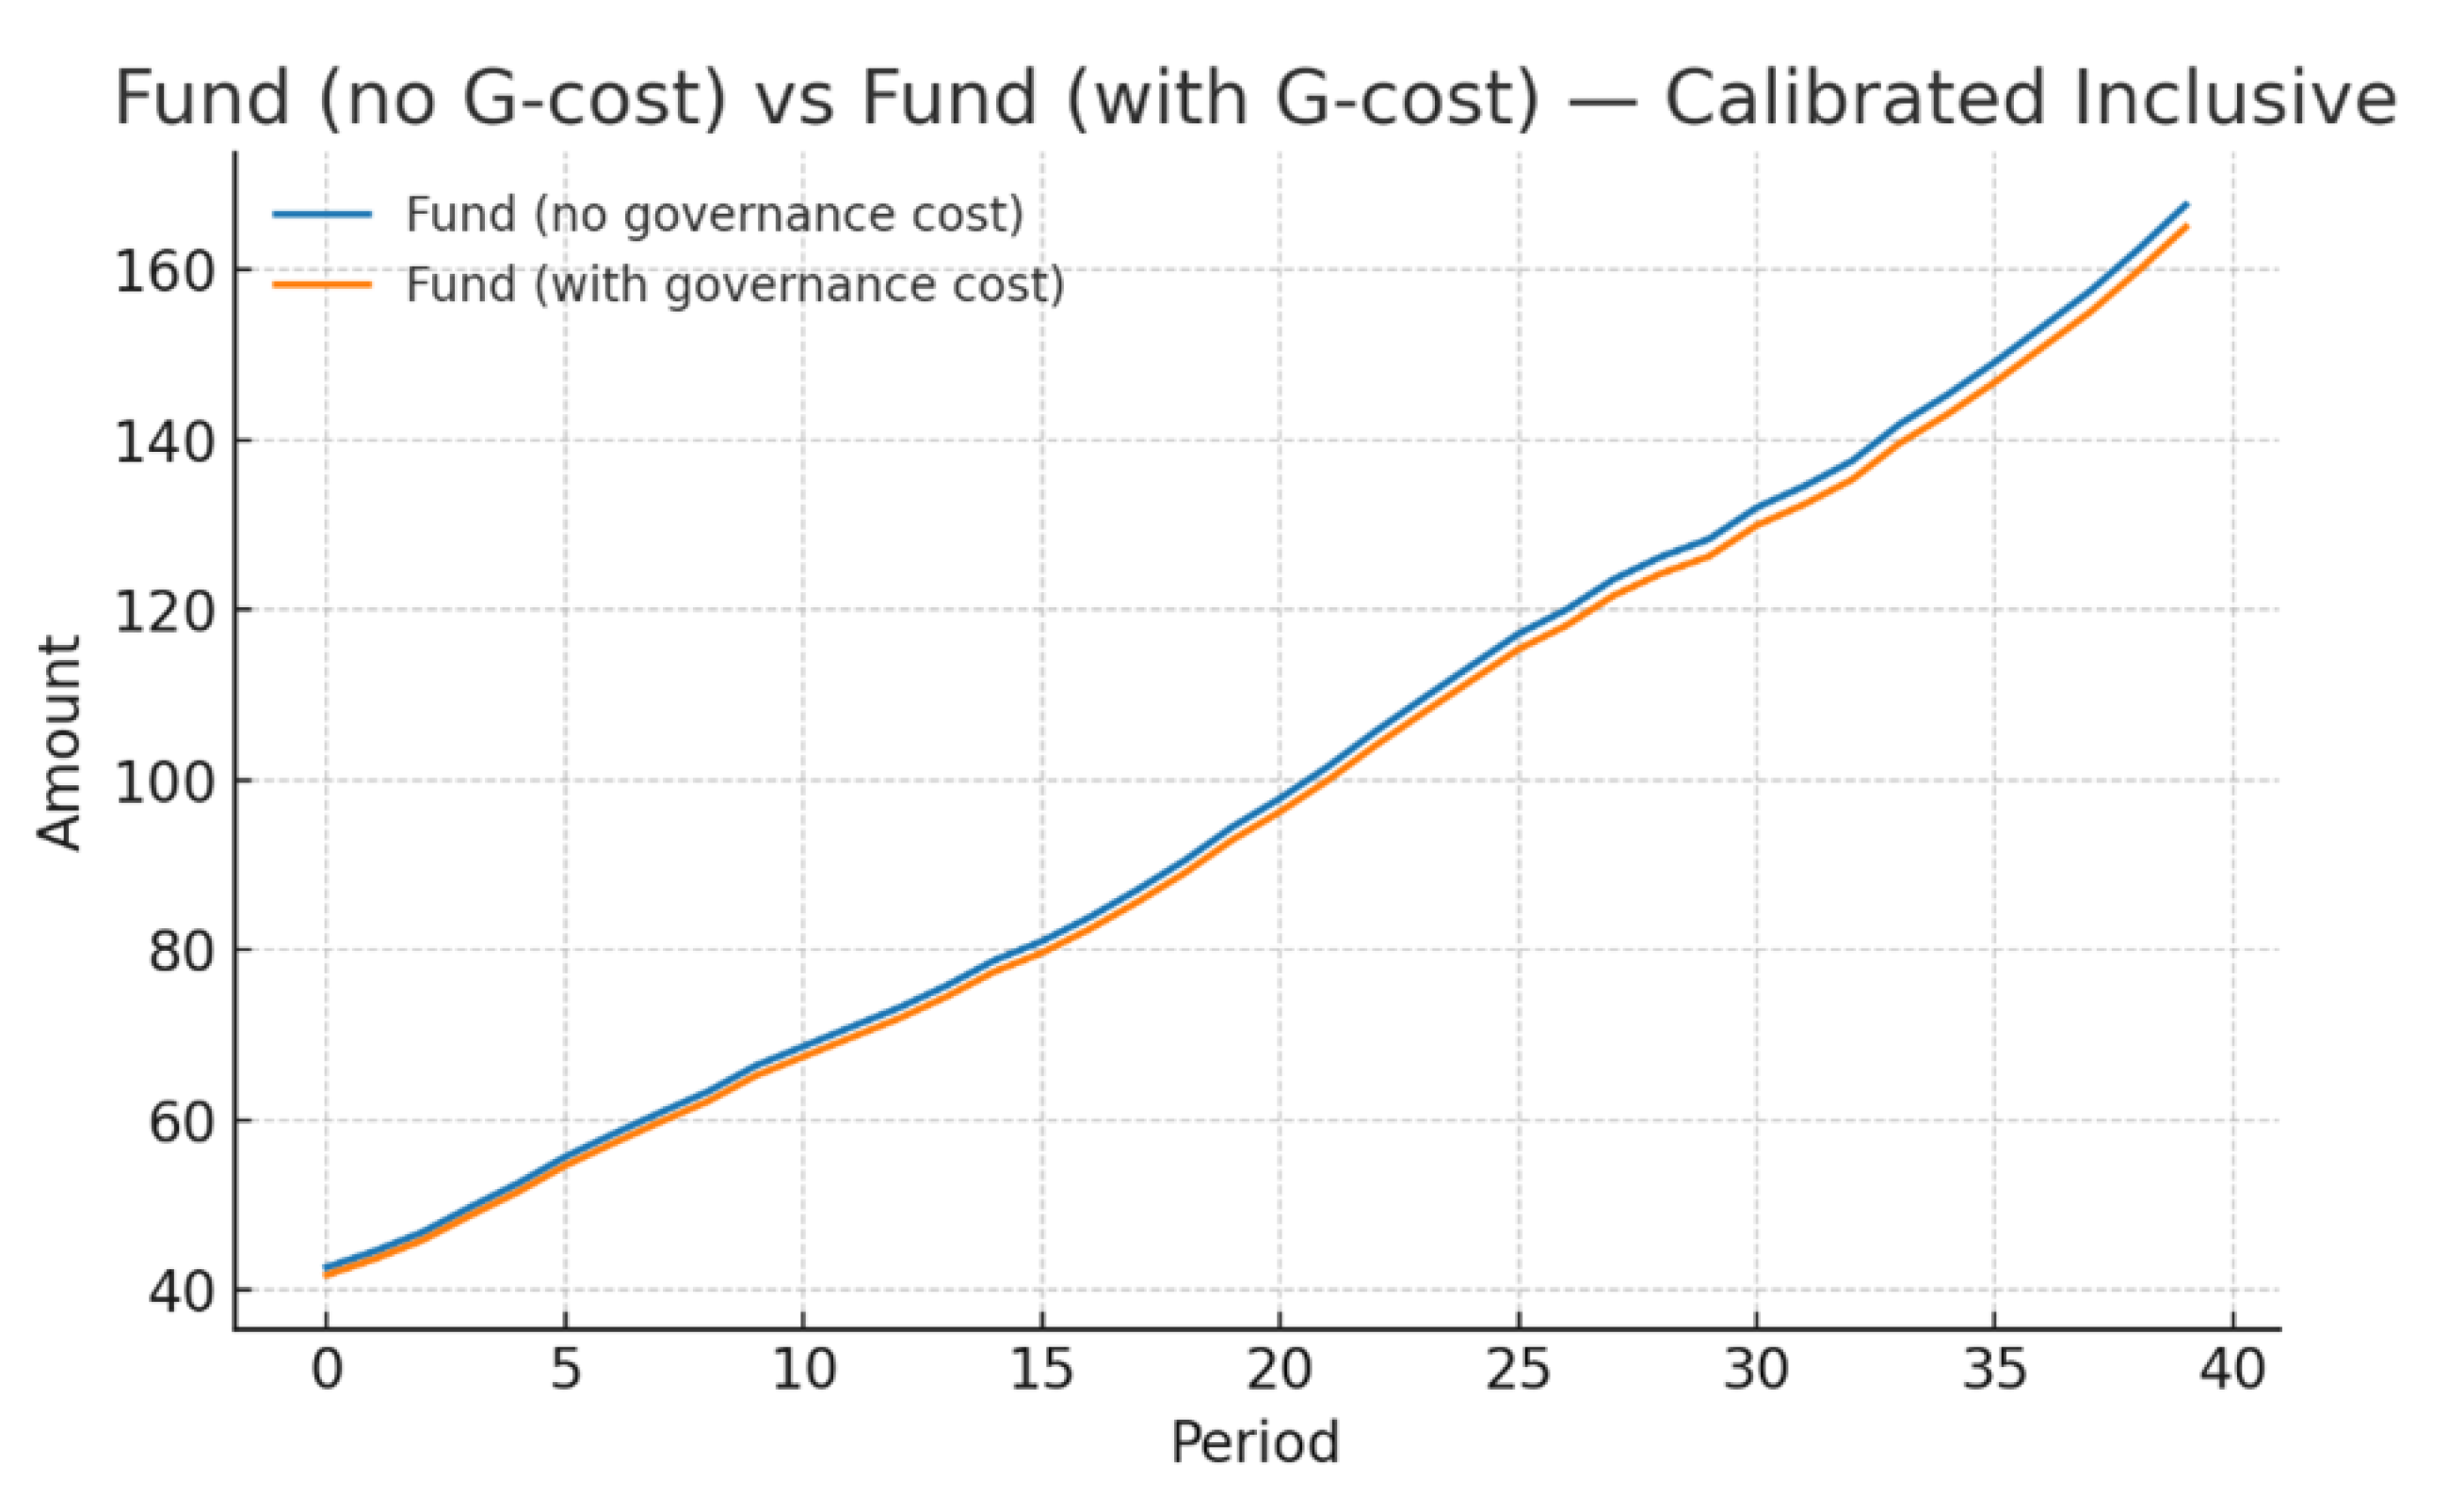
The result (Figure A1) show that, while the net resources of the fund under the governance cost scenario are slightly lower overall than in the “no governance cost” scenario, the two trends are consistent and rise almost in parallel. Moreover, the former remains significantly above zero throughout the entire period and far exceeds the governance cost itself (average annual net resources of approximately , with an average governance cost of ), indicating that the mechanism possesses robust fiscal redundancy and expenditure coverage capabilities. When the governance cost term is set to zero (regression to the main model), the fund resource curve shifts upward overall, but the core qualitative conclusions regarding overall inequality, bottom decile income buffer, and risk convergence for vulnerable elderly groups remain robust. Only the space for “safety net” operations is slightly tightened, without altering the direction of policy effects.
Based on this, two conclusions can be drawn: (i) under the scenario of introducing governance/audit costs, the institutional arrangements maintain long-term fiscal self-sustainability to cover governance expenditures without further compressing the social safety net function; (ii) the main outcomes of the mechanism exhibit robustness under governance cost shocks, demonstrating practical feasibility and moderate flexibility.
Appendix D. Selected Propositions and Proofs
Appendix D.1. Aging Externalities and Output Elasticity
Proposition A1
(Aging Externalities and Output Elasticity). With
the elasticity of output with respect to is
Proof.
Only depends on in . Taking yields . □
Appendix D.2. Shapley’s Distortion-Free Allocation
Proposition A2
(Shapley’s Distortion-Free Allocation). For any agent i, let the marginal cost payment be
and let the fixed cost be independent of usage . Then
which satisfies the marginal cost pricing principle; hence the allocation is distortion-free.
Proof.
Under the given cost specification does not depend on , so and . Therefore the derivative equals . □
References
- Cho, D.; Lee, K.w. Population aging and fiscal sustainability: Nonlinear evidence from Europe. Journal of International Money and Finance 2022, 126, 102665. [Google Scholar] [CrossRef]
- Park, K. An aging population and sustainable government debt: The case of Korea. Journal of Asian Economics 2024, 95, 101831. [Google Scholar] [CrossRef]
- Gavoille, N.; Zasova, A. What we pay in the shadows: Labor tax evasion, minimum wage hike and employment. Journal of Public Economics 2023, 228, 105027. [Google Scholar] [CrossRef]
- Arellano, M.; Blundell, R.; Bonhomme, S.; Light, J. Heterogeneity of consumption responses to income shocks in the presence of nonlinear persistence. Journal of Econometrics 2024, 240, 105449. [Google Scholar] [CrossRef]
- Aiken, E.; Bellue, S.; Karlan, D.; Udry, C.; Blumenstock, J.E. Machine learning and phone data can improve targeting of humanitarian aid. Nature 2022, 603, 864–870. [Google Scholar] [CrossRef] [PubMed]
- Kentikelenis, A.; Stubbs, T. Social protection and the International Monetary Fund: promise versus performance. Globalization and Health 2024, 20, 41. [Google Scholar] [CrossRef] [PubMed]
- Wade, R.H. The world development report 2022: Finance for an equitable recovery in the context of the international debt crisis. Development and Change 2023, 54, 1354–1373. [Google Scholar] [CrossRef]
- Gupta, J.; Pouw, N. Towards a trans-disciplinary conceptualization of inclusive development. Current opinion in environmental sustainability 2017, 24, 96–103. [Google Scholar] [CrossRef]
- Shuai, J.; Xia, M.; Zeng, C. Upstream market structure and downstream partial ownership. Journal of Economics & Management Strategy 2023, 32, 22–47. [Google Scholar]
- Buga, A.; Harper, D.G.; Sapper, T.N.; Hyde, P.N.; Fell, B.; Dickerson, R.; Stoner, J.T.; Kackley, M.L.; Crabtree, C.D.; Decker, D.D.; et al. Feasibility and metabolic outcomes of a well-formulated ketogenic diet as an adjuvant therapeutic intervention for women with stage IV metastatic breast cancer: The Keto-CARE trial. PLoS One 2024, 19, e0296523. [Google Scholar] [CrossRef] [PubMed]
- Manley, J.; Alderman, H.; Gentilini, U. More evidence on cash transfers and child nutritional outcomes: a systematic review and meta-analysis. BMJ global health 2022, 7. [Google Scholar] [CrossRef] [PubMed]
- Flynn, J. Do sugar-sweetened beverage taxes improve public health for high school aged adolescents? Health Economics 2023, 32, 47–64. [Google Scholar] [CrossRef] [PubMed]
- Aiken, E.L.; Bedoya, G.; Blumenstock, J.E.; Coville, A. Program targeting with machine learning and mobile phone data: Evidence from an anti-poverty intervention in Afghanistan. Journal of Development Economics 2023, 161, 103016. [Google Scholar] [CrossRef]
- Han, H.; Shiwakoti, R.K.; Jarvis, R.; Mordi, C.; Botchie, D. Accounting and auditing with blockchain technology and artificial Intelligence: A literature review. International Journal of Accounting Information Systems 2023, 48, 100598. [Google Scholar] [CrossRef]
- Liu, M.; Robin, A.; Wu, K.; Xu, J. Blockchain’s impact on accounting and auditing: a use case on supply chain traceability. Journal of Emerging Technologies in Accounting 2022, 19, 105–119. [Google Scholar] [CrossRef]
- Auerbach, A.J.; Gokhale, J.; Kotlikoff, L.J. Generational accounts: A meaningful alternative to deficit accounting. Tax policy and the economy 1991, 5, 55–110. [Google Scholar] [CrossRef]
- Caselli, F.; Lagerborg, A.; Medas, M.P.A. Green fiscal rules? Challenges and policy alternatives; International Monetary Fund, 2024.
- Comelli, F. Navigating Fiscal Challenges in Sub-Saharan Africa. Departmental Papers 2023, 2023, 1. [Google Scholar] [CrossRef]
- Cuadrado-Ballesteros, B.; Bisogno, M. Budget transparency and financial sustainability. Journal of Public Budgeting, Accounting & Financial Management 2022, 34, 210–234. [Google Scholar] [CrossRef]
Figure 1.
(a) Population by Age Group (Baseline); (b) Population by age group (Inclusive).
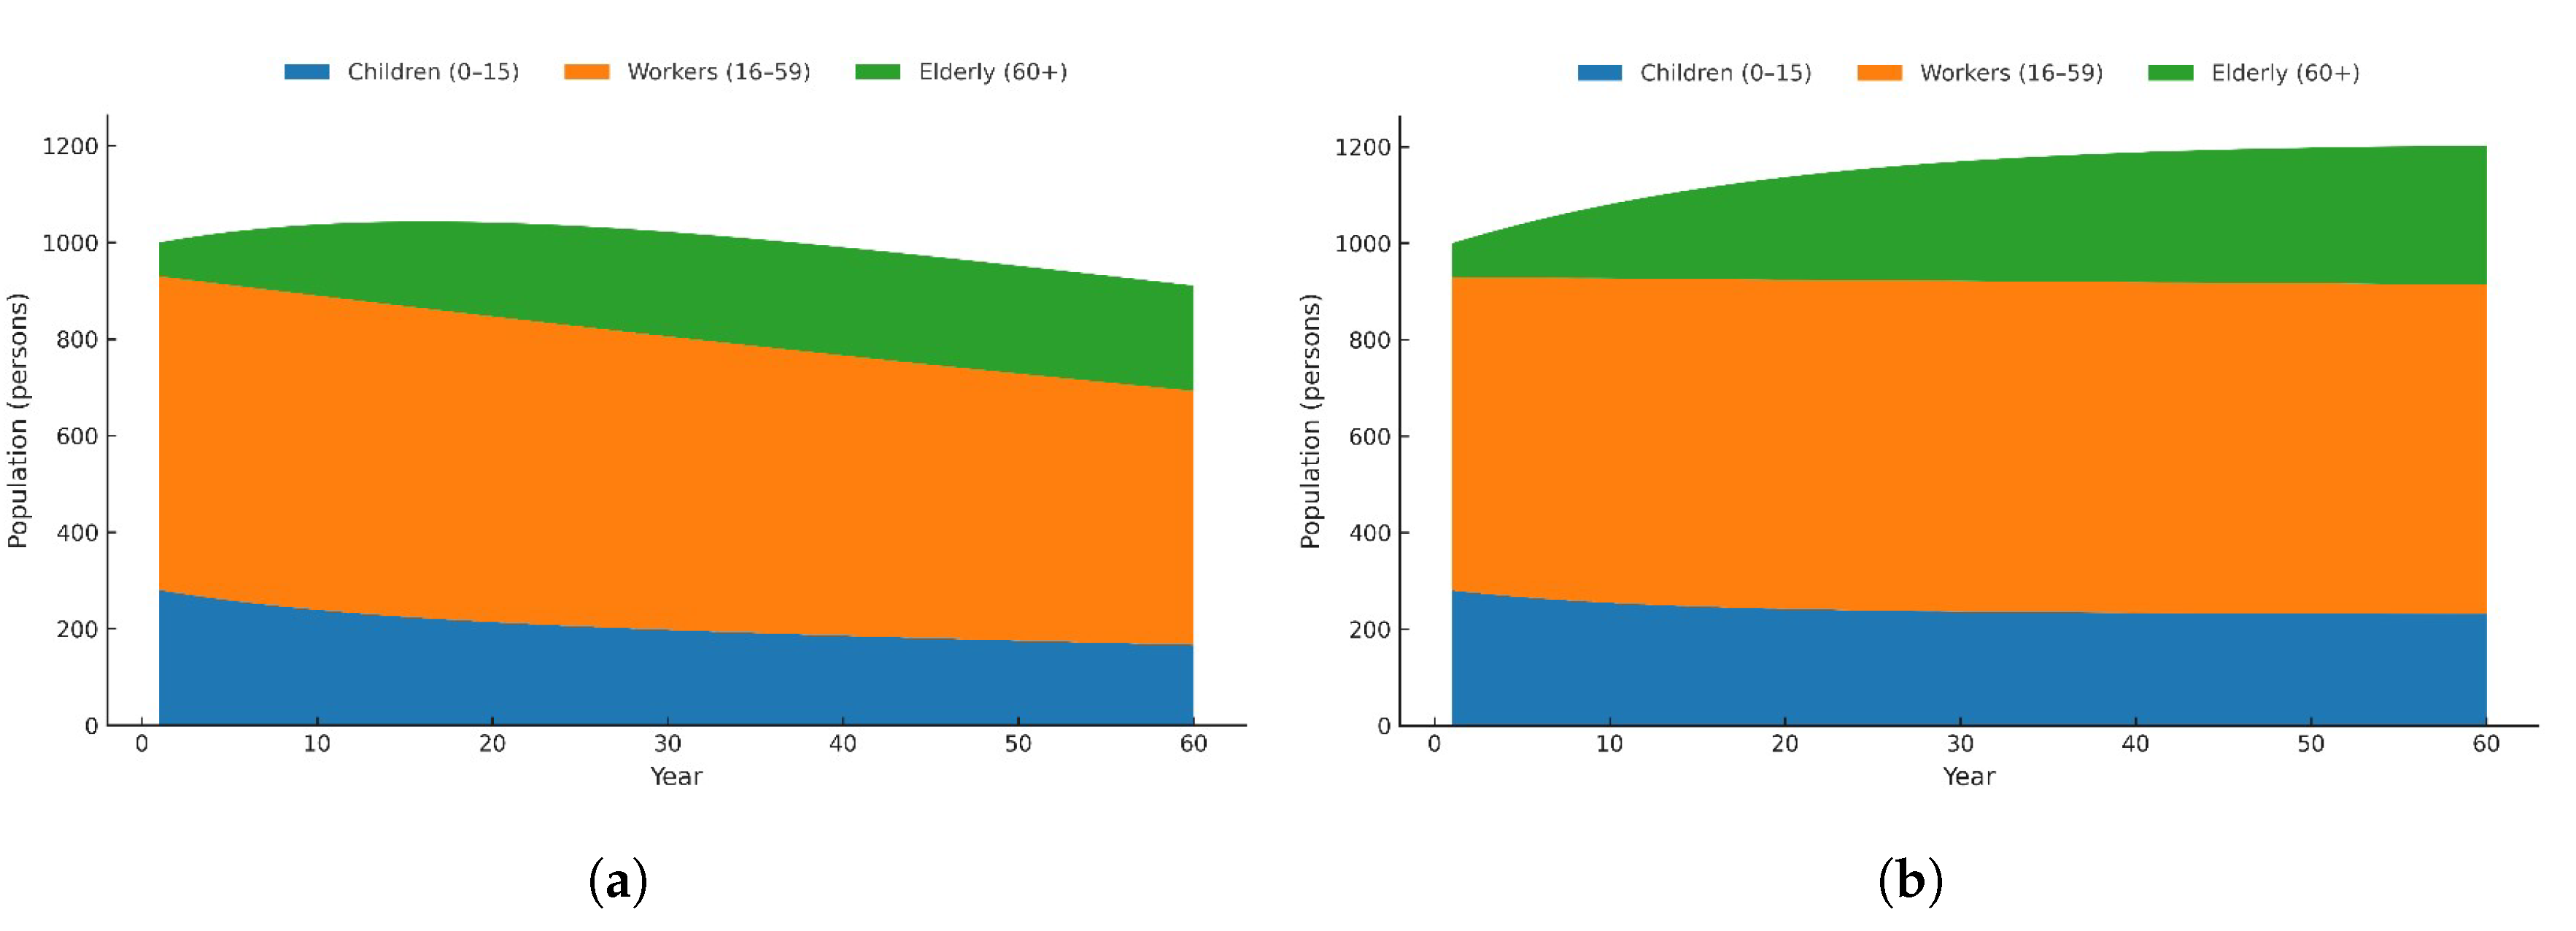
Figure 2.
Output per Capita.
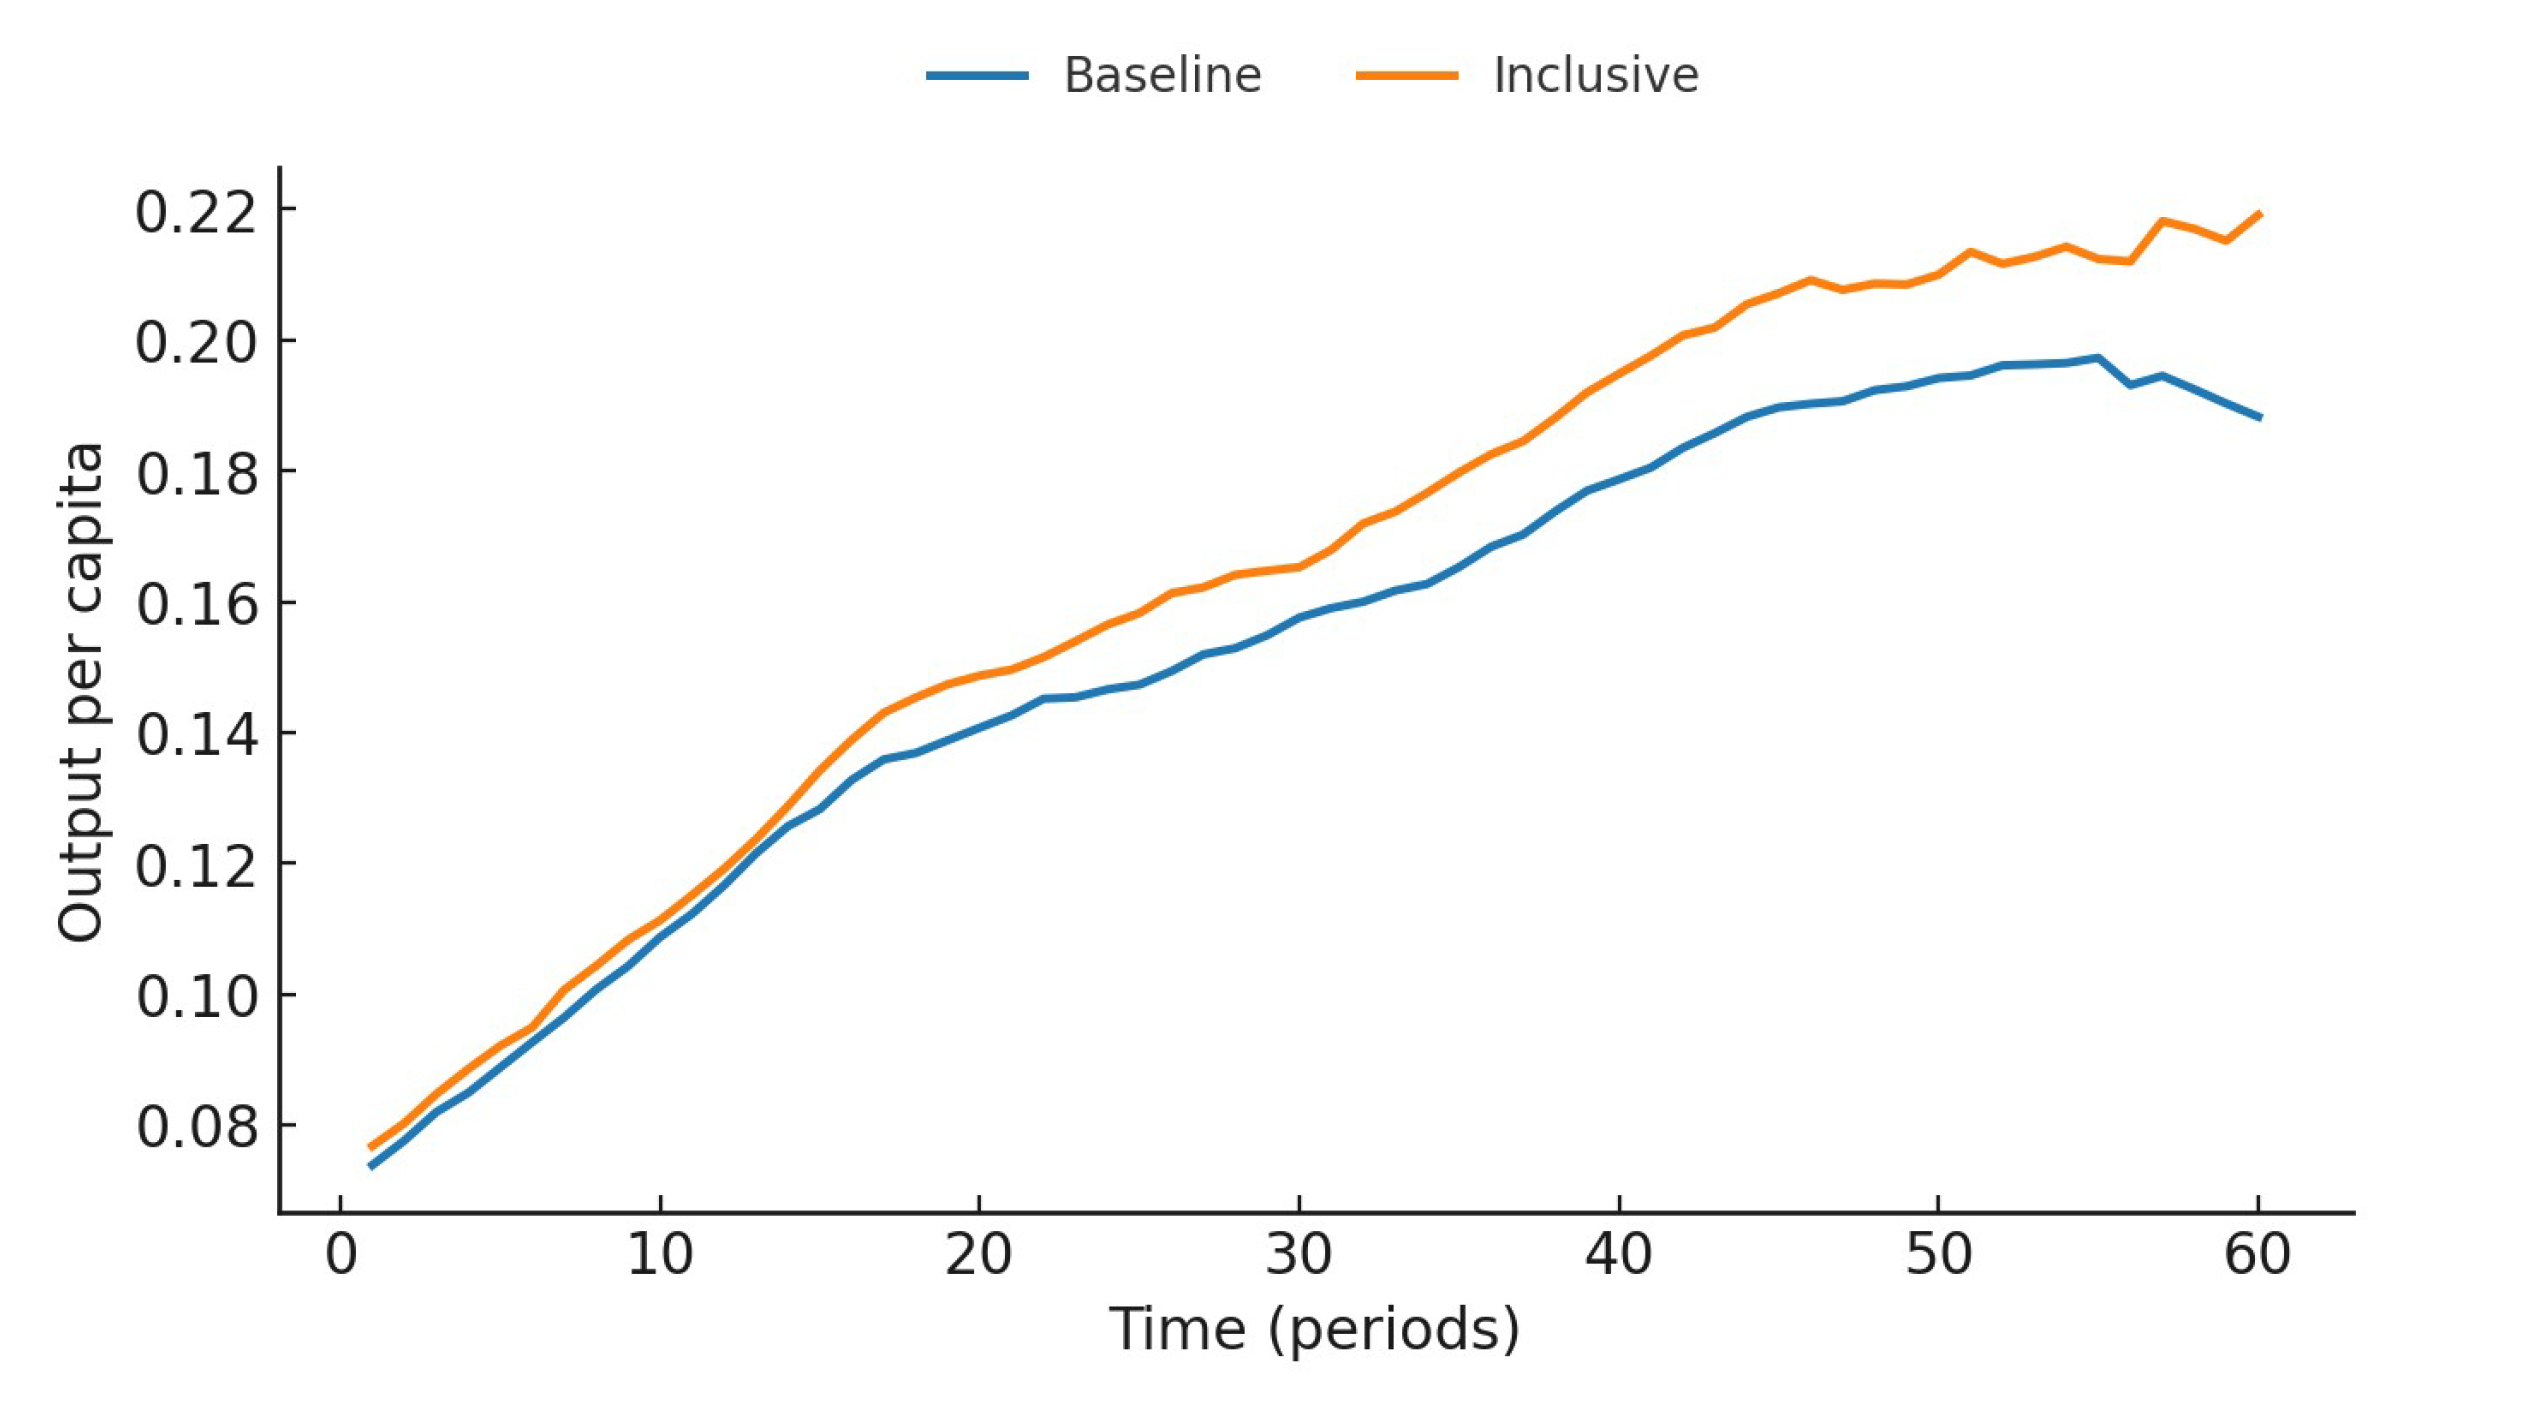
Figure 3.
Wealth Shares (Debt-Inclusive, L1-Normalized): Top 10% vs Bottom 10% (Adults).
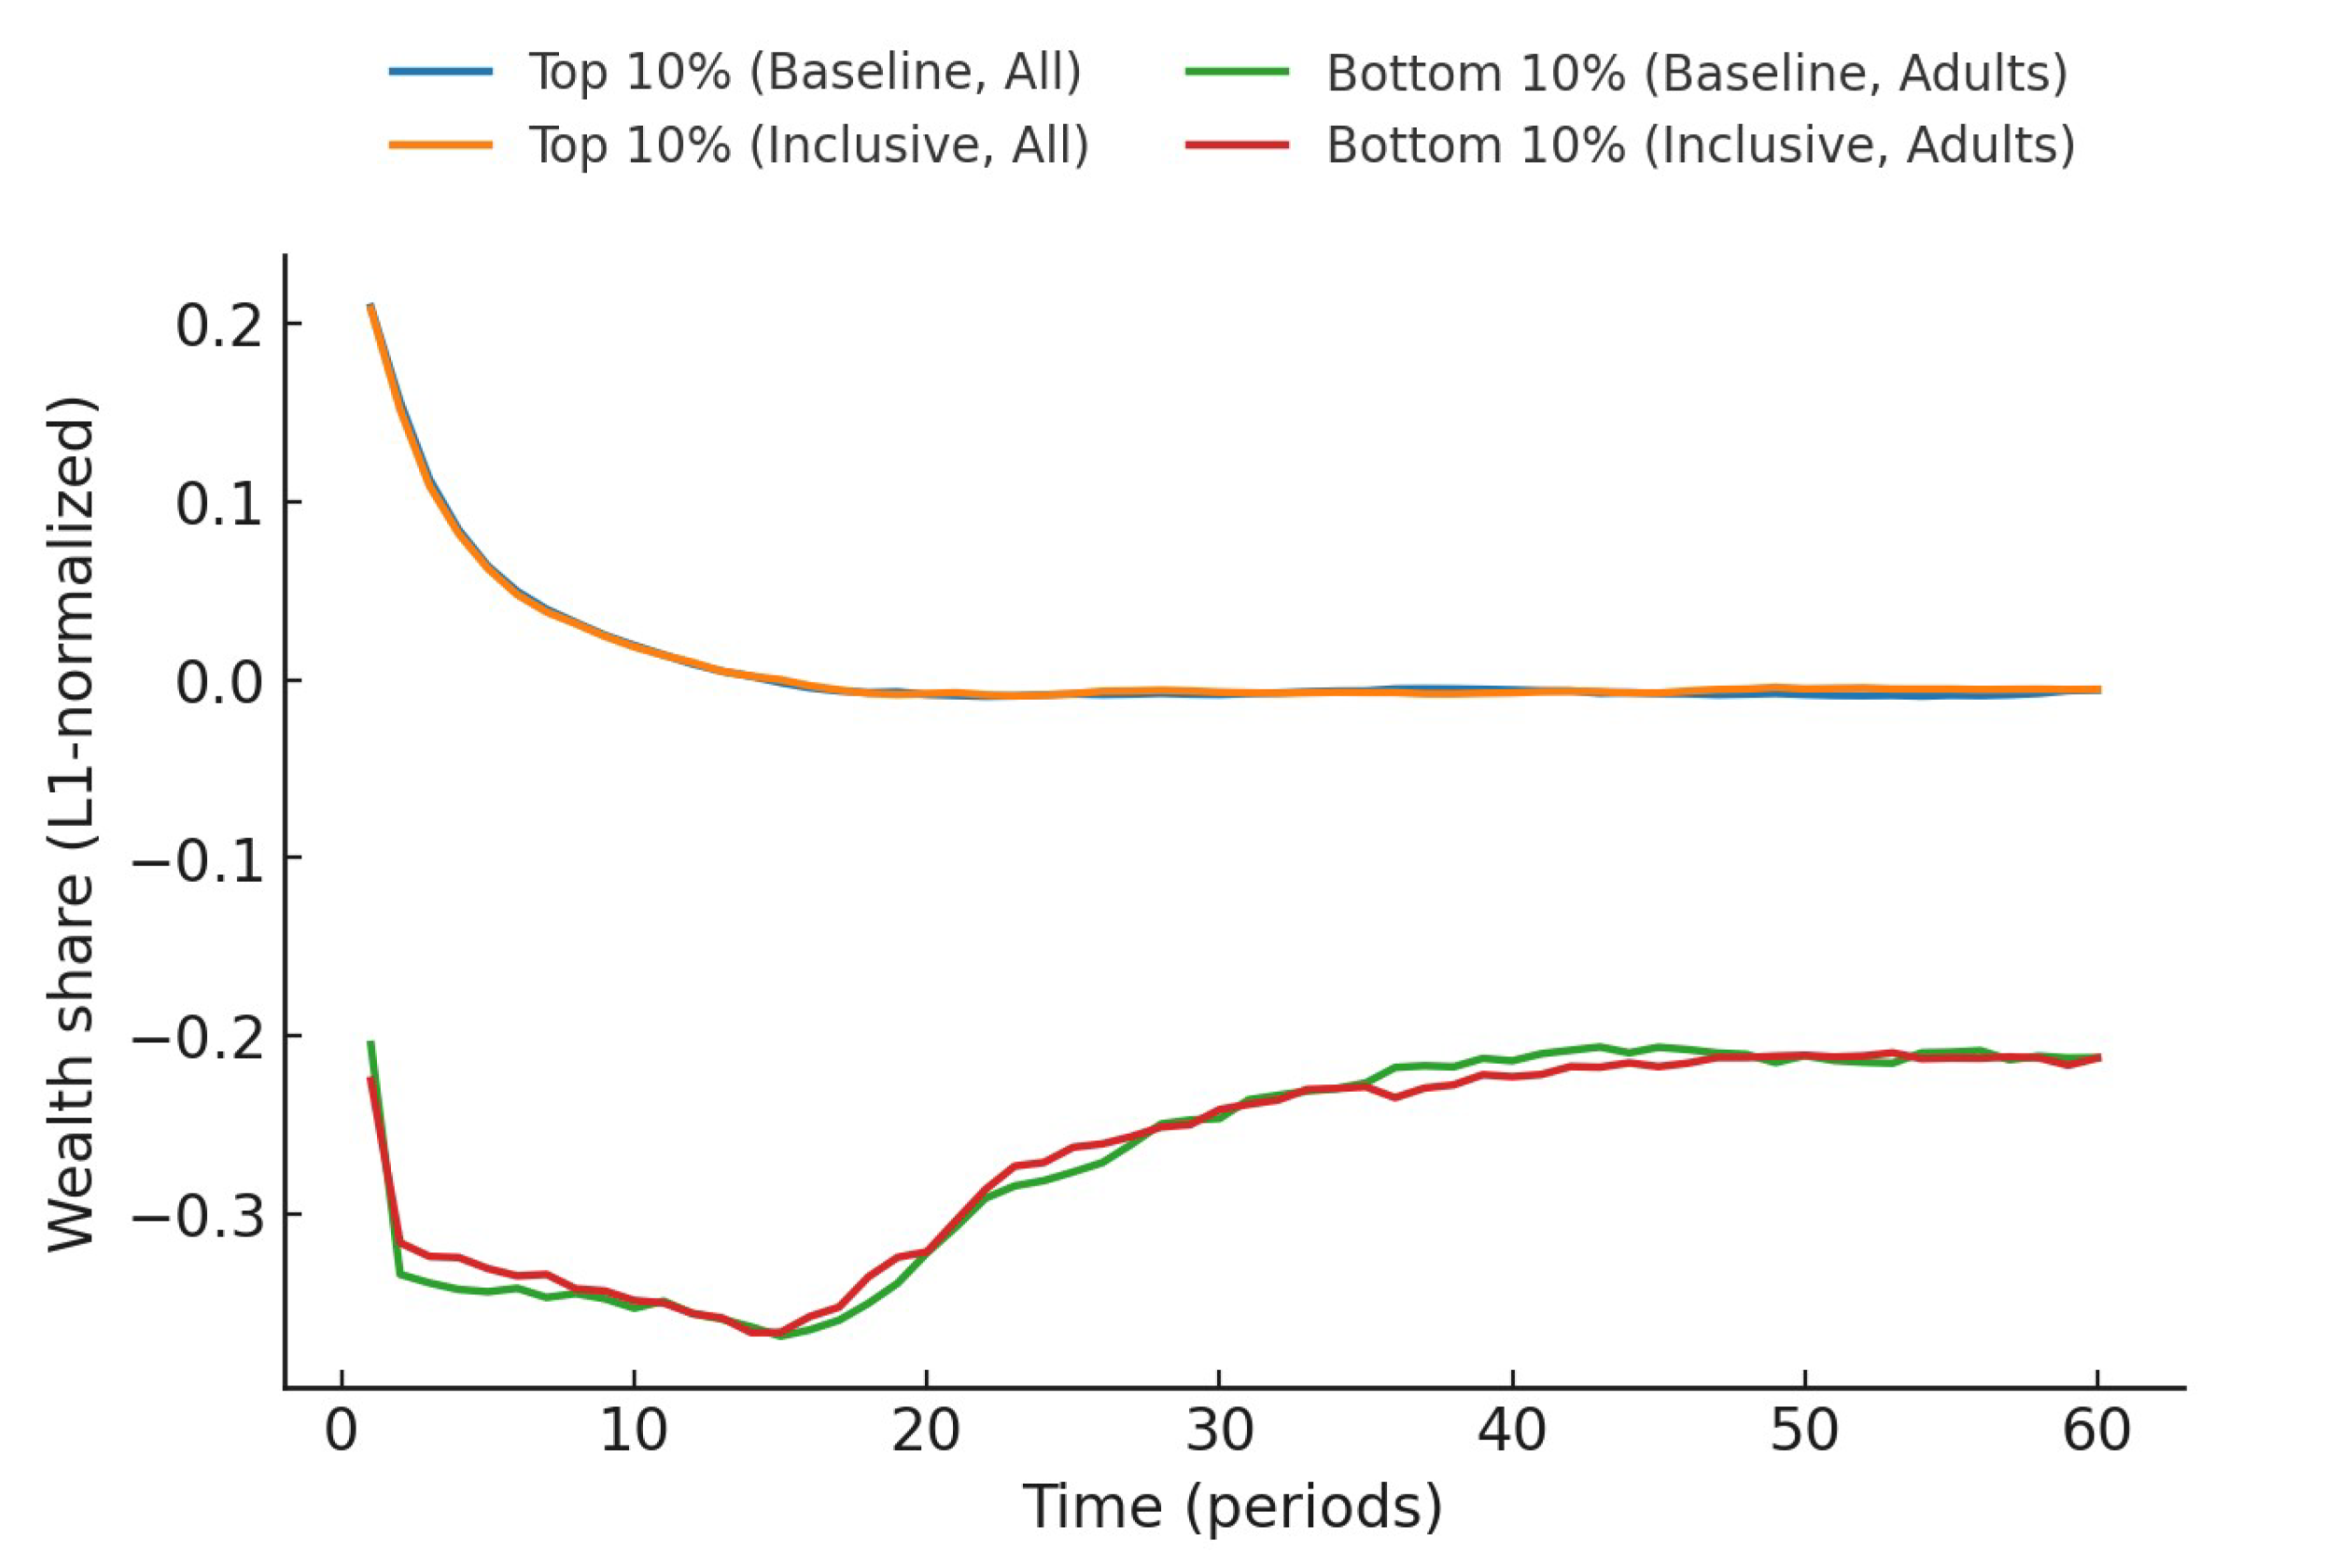
Figure 4.
Inequality over Time (Normalized Gini).
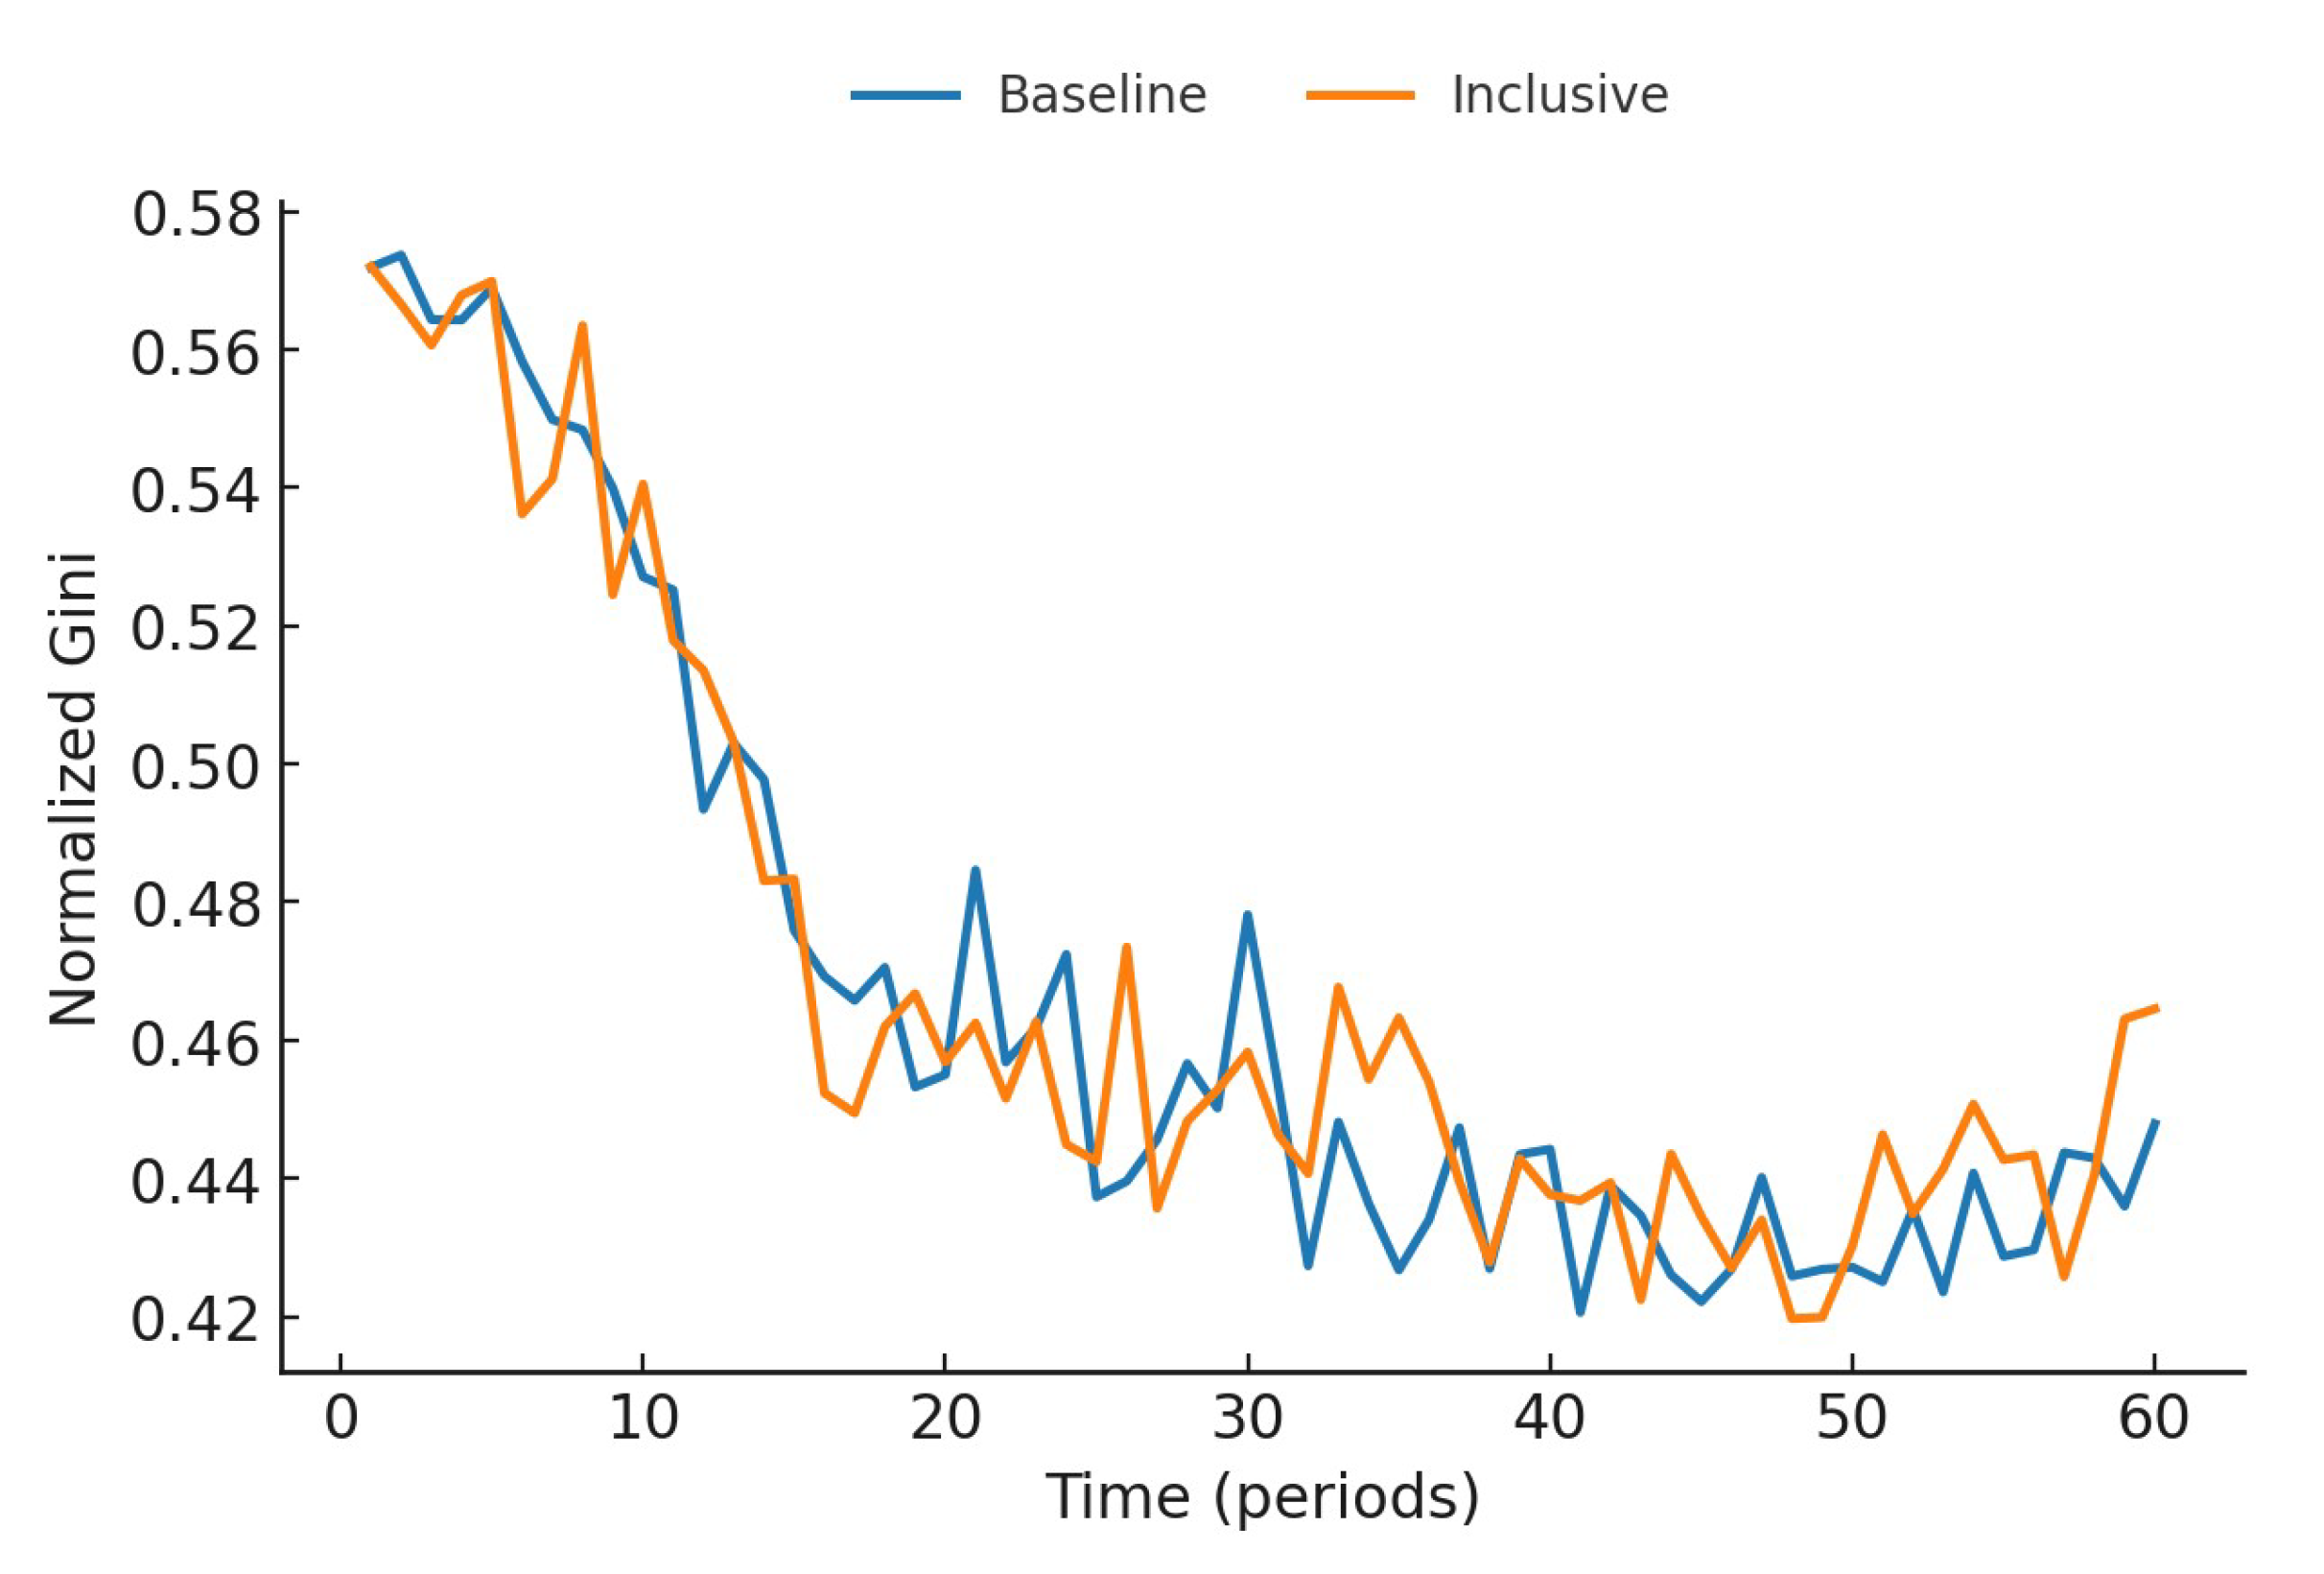
Figure 5.
Gini: Baseline vs Inclusive vs Compatibility (Rich-Transfer).
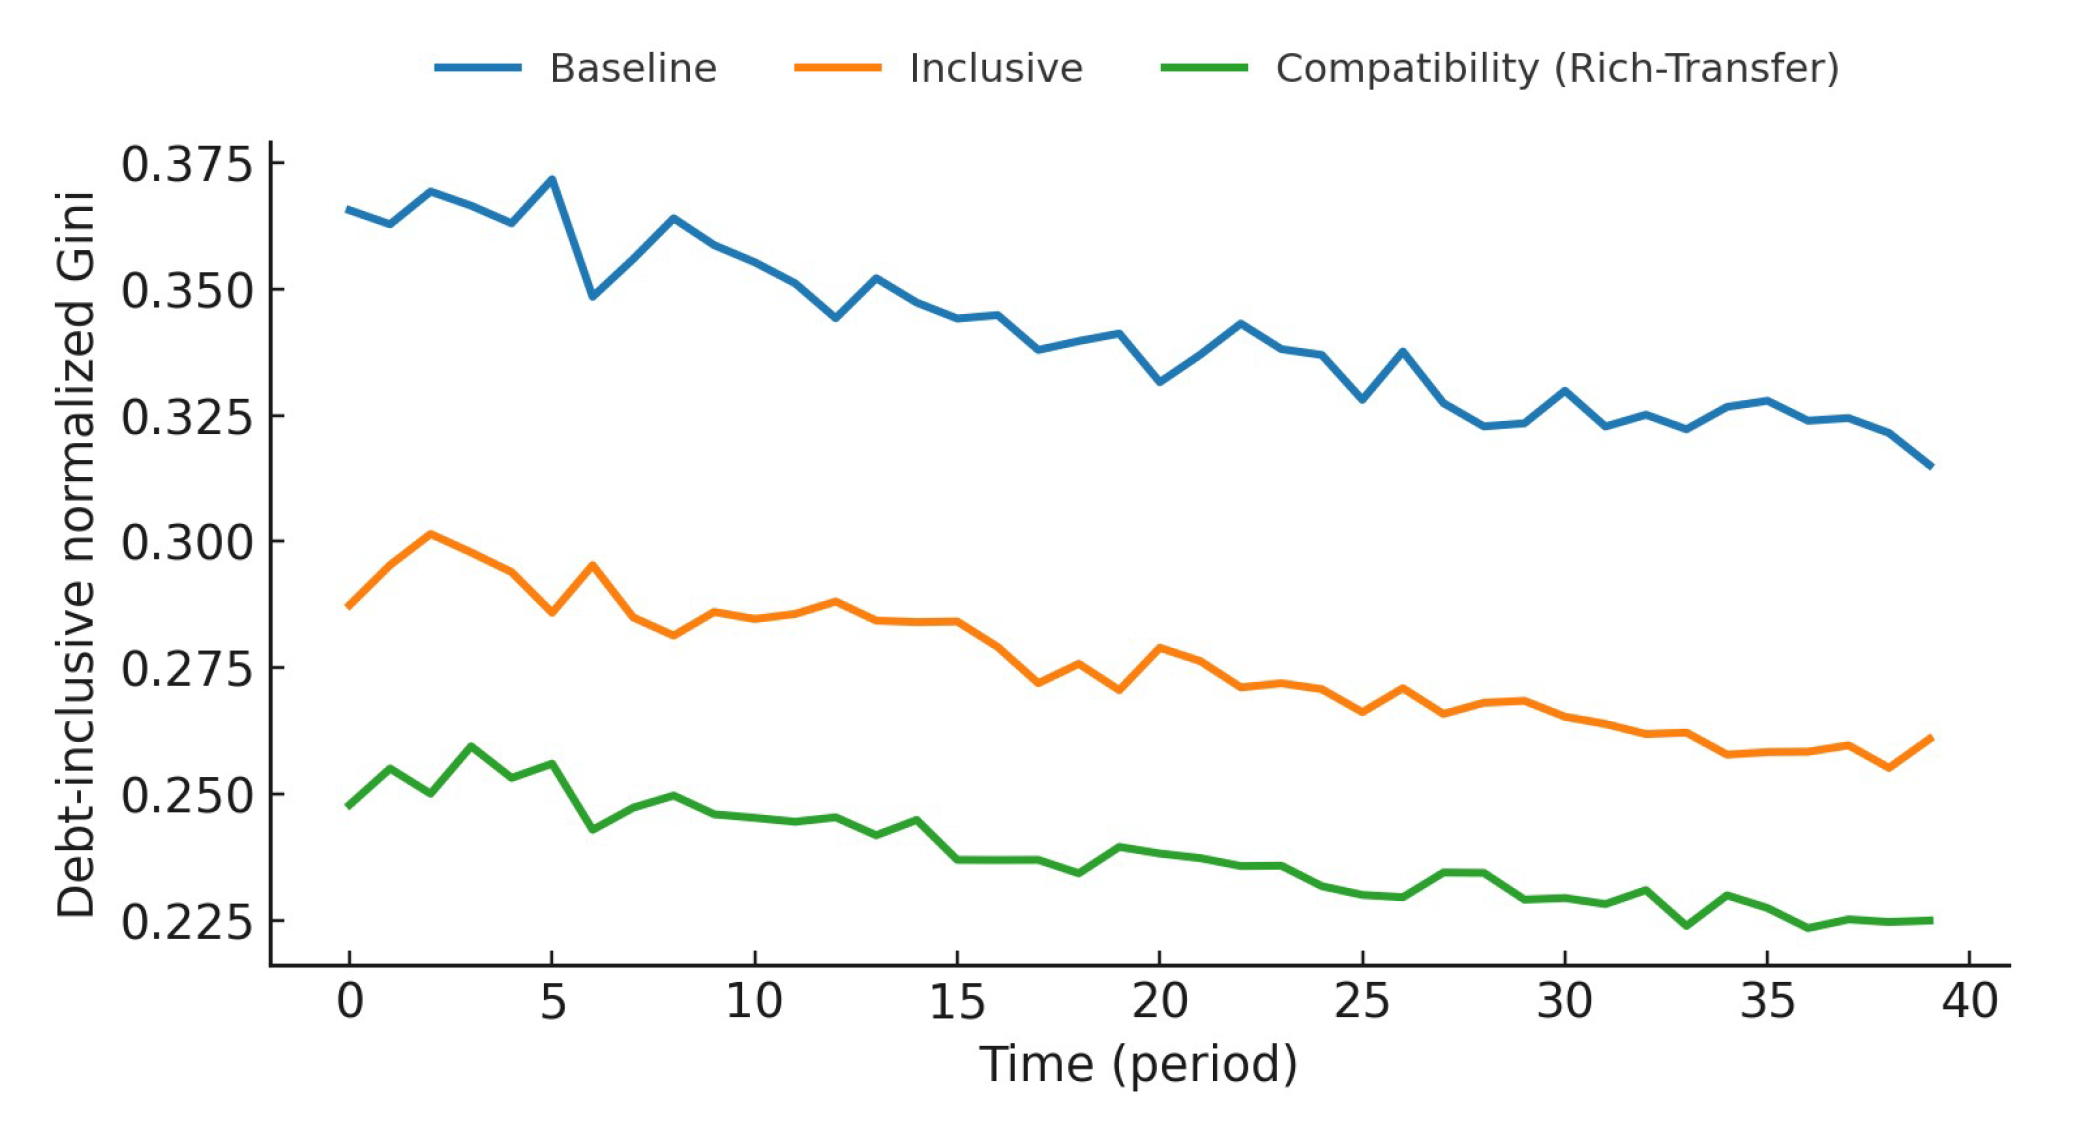
Figure 6.
Bottom Decile (Adults) Disposable Income: Baseline vs Inclusive vs Compatibility (Rich-Transfer).
Figure 6.
Bottom Decile (Adults) Disposable Income: Baseline vs Inclusive vs Compatibility (Rich-Transfer).
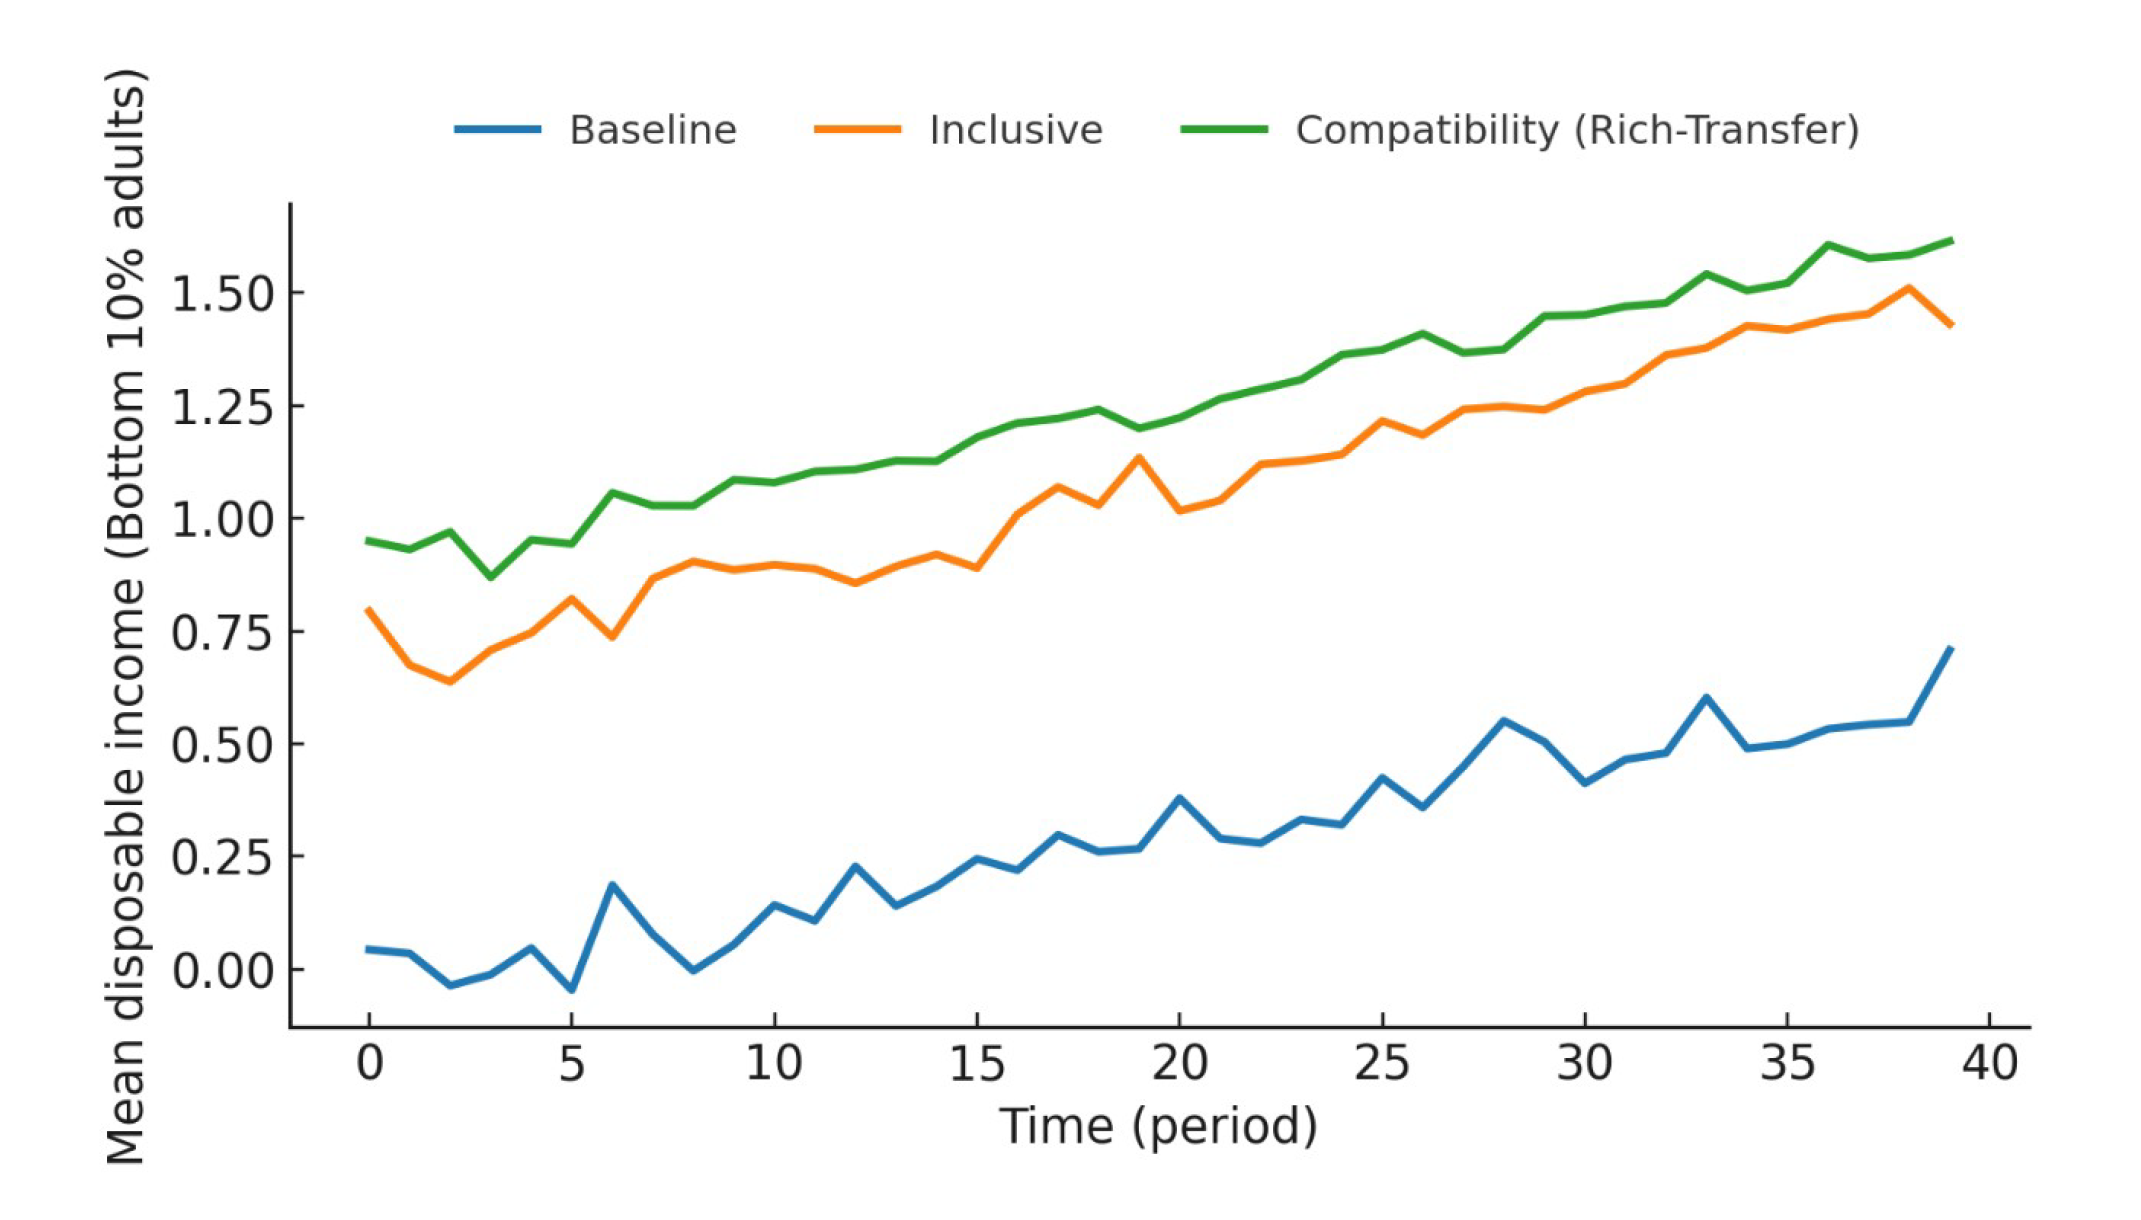
Figure 7.
Fund Evolution (inclusive, Net).
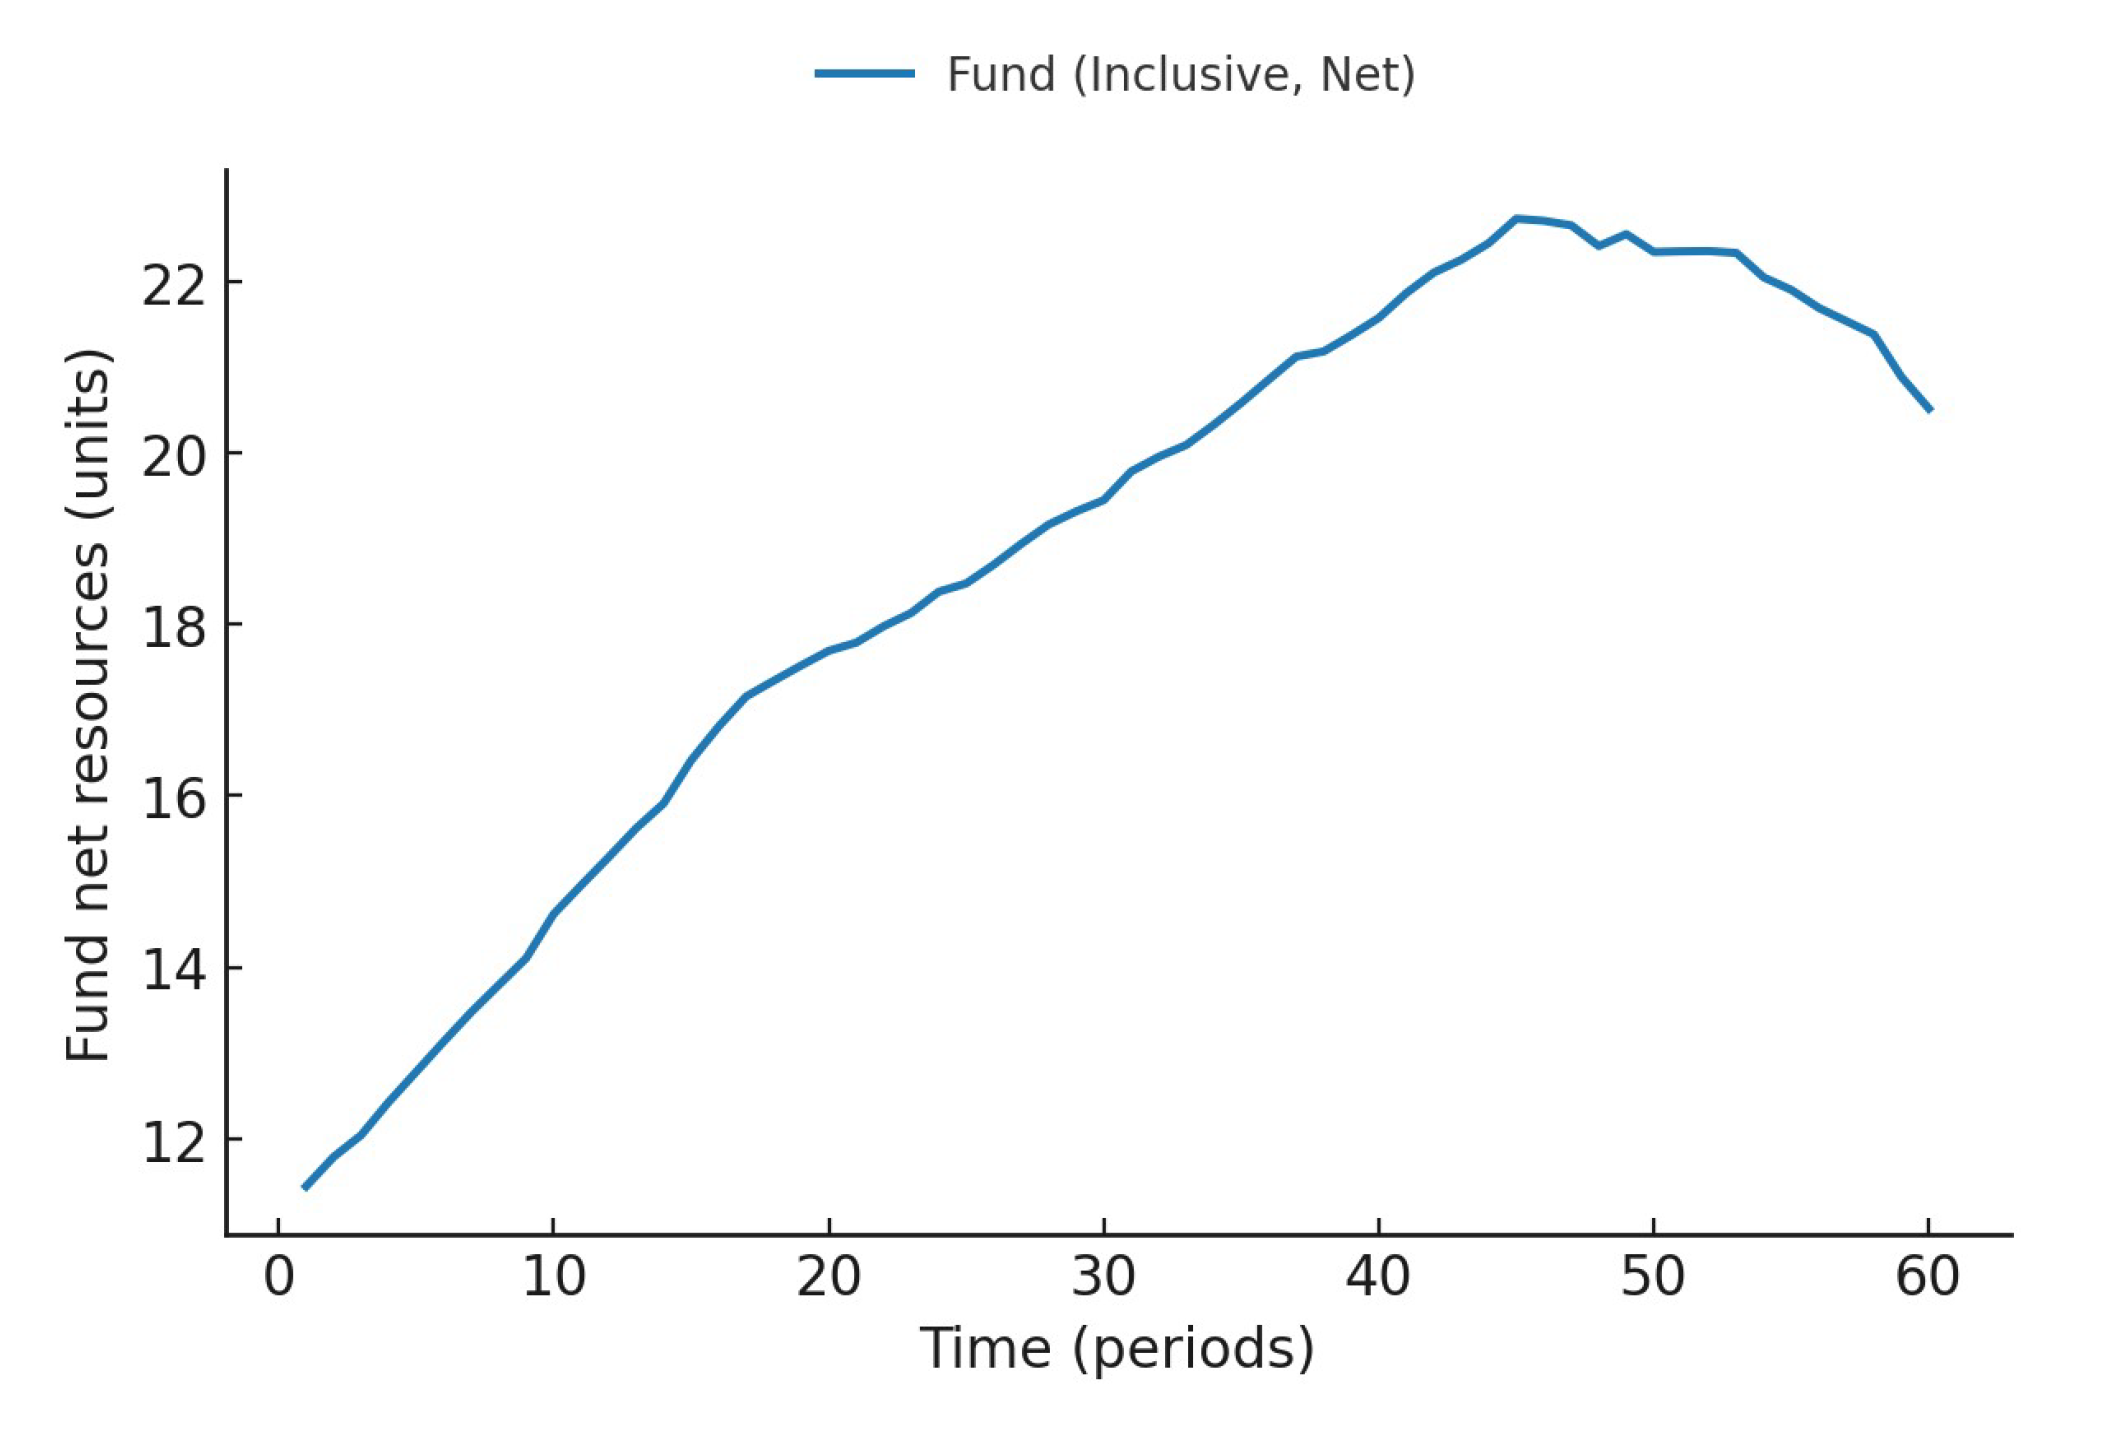
Figure 8.
Coverage Ratio of Insurance Pool (Inclusive).
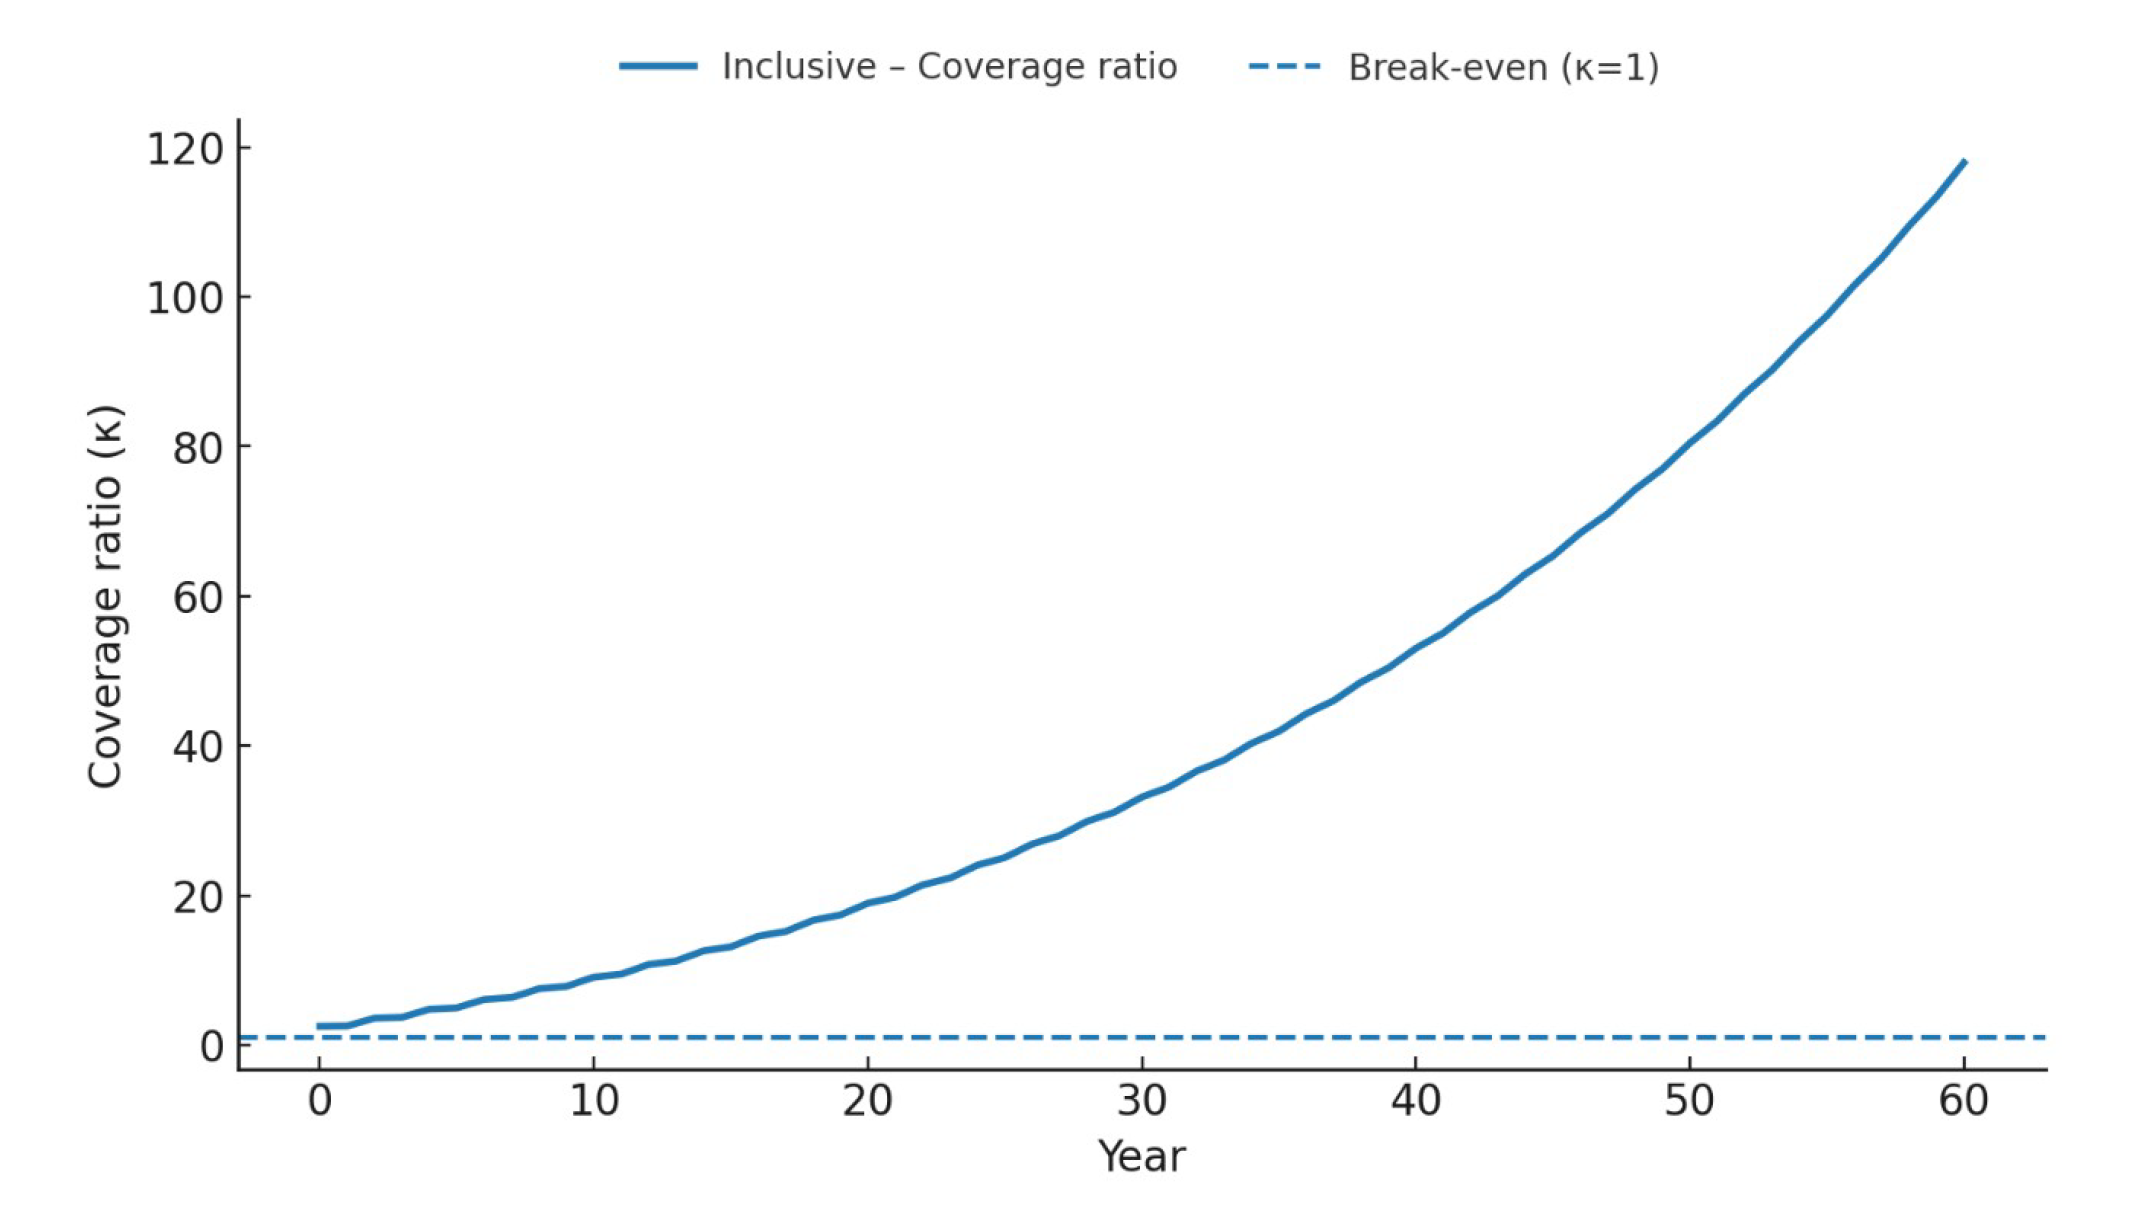
Figure 9.
Endpoint Sensitivity Analysis (Tornado).
Disclaimer/Publisher’s Note: The statements, opinions and data contained in all publications are solely those of the individual author(s) and contributor(s) and not of MDPI and/or the editor(s). MDPI and/or the editor(s) disclaim responsibility for any injury to people or property resulting from any ideas, methods, instructions or products referred to in the content. |
© 2025 by the authors. Licensee MDPI, Basel, Switzerland. This article is an open access article distributed under the terms and conditions of the Creative Commons Attribution (CC BY) license (http://creativecommons.org/licenses/by/4.0/).
Copyright: This open access article is published under a Creative Commons CC BY 4.0 license, which permit the free download, distribution, and reuse, provided that the author and preprint are cited in any reuse.


