Submitted:
11 August 2025
Posted:
22 August 2025
You are already at the latest version
Abstract
Internet of Things (IoT) sensors are increasingly applied to real-time water quality monitoring, with implications for environmental supervision and public health. This systematic review synthesised findings from 52 studies identified through Google Scholar, Web of Science, and Scopus (7,606 records; 1,054 screened after duplicates). Publications grew steadily from 2014, peaking in 2018–2019. Ion-selective sensors and multi-parameter systems each accounted for 18.2%, followed by optical, electrochemical, and biosensors at 9.1% each, with other types at 4.5%. Target parameters included nutrients/eutrophication indicators (30%), heavy metals/trace elements (29%), microbiological contaminants (6%), emerging pollutants (4%), industrial pollutants (3%), salinity/marine conditions (8%), general indicators (8%), physical–chemical parameters (8%), infrastructure monitoring (2%), recreational water risks (2%), and mixed parameters (8%). Sensitivity (27.3%) and combined detection limits/sensitivity (18.2%) dominated performance metrics. Low-cost devices (USD 50–500) comprised 46% of systems; medium-cost 14%; very low-cost and high-cost 8% each; research-stage 14%; mixed cost 8%. Industrial protocols led interfaces (32%), followed by analog/digital mixed IoT-enabled (14%), analog-only (8%), digital-only (4%), and mixed architectures (8%). Arduino platforms were most common (29%), followed by Raspberry Pi (20%). Field deployment dominated (44%), with field–remote IoT-enabled at 19%, lab–field hybrids at 9%, and others less frequent. Calibration was regular/periodic in 34%, implied periodic in 20%, general in 23%, detailed in 14%, specialist in 6%, and not required in 4%. Key challenges were biofouling (32%), sensor drift (22%), signal interference (14%), power limitations (10%), and environmental or data issues (8% each). IoT-based water quality monitoring is dominated by low-cost, field-ready solutions, but standardised calibration, improved fouling resistance, and integration of advanced analytics are needed for scalable, reliable deployment.
Keywords:
Internet of Things (IoT)
; water quality monitoring
; trace elements
; IoT sensors
; electrochemical sensors
; optical sensors
; spectroscopic sensors
; real-time monitoring
; sensor calibration
; data management
; machine learning
; environmental sustainability
; public health
; sensor accuracy
; predictive analysis
1. Introduction
Internet of Things (IoT) technologies have transformed water quality monitoring by enabling continuous, real-time data collection over extended periods, thereby enhancing water resource management practices (Miller et al., 2023). Traditional methods, which rely on manual sampling and laboratory analysis, are often slow and provide outdated results, limiting their ability to detect rapid changes in water quality (Jan et al., 2021). In contrast, IoT-based systems allow operators to obtain real-time readings of key water quality parameters, leading to improved pollution control, faster response times, and more efficient resource management (Subramaniam et al., 2019). This is particularly critical for detecting hazardous trace elements at very low concentrations, as even minimal exposure to these contaminants poses significant risks to public health (Singh & Walingo, 2024).
Trace element contamination—such as lead, mercury, and cadmium—arises from both natural processes and anthropogenic activities, with severe implications for human health and ecological stability (Essamlali et al., 2024). By delivering uninterrupted, real-time monitoring, IoT systems can significantly improve detection and response times compared to conventional approaches (Subramaniam et al., 2019). Furthermore, these systems facilitate greater transparency by enabling easier access to data for both regulatory agencies and the public, while also reducing operational costs. Successful IoT implementation in water quality monitoring requires addressing challenges related to sensor accuracy, calibration frequency, and robust data management protocols. The choice of sensor technology—whether electrochemical, optical, or mass-based—has a direct impact on detection sensitivity and selectivity, making careful evaluation essential (Dhruba et al., 2022). Additionally, the vast volumes of data generated necessitate advanced analytics and cloud-based solutions for efficient processing (Singh & Walingo, 2024). Ensuring data security and privacy is equally important for long-term operational success.
This review examines the current state of IoT-based water quality monitoring systems, with a specific focus on sensors for detecting trace elements. It evaluates detection methods, performance characteristics, implementation challenges, and potential advancements.
1.1. Research Questions
- What types of IoT sensor technologies are currently employed for monitoring trace elements in water quality systems?
- How do these sensor technologies perform in terms of accuracy, sensitivity, calibration requirements, and deployment conditions?
- What are the predominant challenges and limitations reported in the literature for IoT-based water quality monitoring systems?
- Which environmental and technical factors most influence the choice, implementation, and sustainability of IoT monitoring solutions?
1.2. Hypotheses Development
- H1: IoT-based water quality monitoring systems enhance detection capabilities for trace elements compared to conventional sampling and laboratory analysis methods.
- H2: Electrochemical sensors dominate IoT-based water quality applications due to their high sensitivity and cost-effectiveness.
- H3: The effectiveness and adoption rate of IoT systems are significantly influenced by sensor calibration practices, communication protocols, and deployment environments.
1.3. Rationale
Monitoring trace elements in water is crucial due to their potential health hazards, even at low concentrations. Traditional approaches often lack real-time capabilities, limiting their effectiveness for early warning and pollution management. IoT systems, through continuous sensing, advanced communication protocols, and cloud-based analytics, present a viable solution. Understanding the current technological landscape, performance metrics, and challenges is essential for guiding future research and implementation strategies.
1.4. Objectives
- To systematically review IoT sensor technologies used for detecting trace elements in water quality systems.
- To classify and compare sensor types, performance metrics, and deployment contexts.
- To identify key challenges and limitations hindering adoption and operational scalability.
- To propose recommendations for improving IoT-enabled water quality monitoring solutions.
1.5. Research Contributions
This review synthesizes scattered research on IoT water quality monitoring into a structured analysis, highlighting performance trends, technological gaps, and practical challenges. It bridges sensor engineering insights with environmental monitoring applications, offering a cross-disciplinary perspective valuable to both researchers and practitioners.
1.6. Research Novelty
While previous reviews have examined IoT in environmental monitoring broadly, this study focuses specifically on IoT sensor systems for detecting trace elements in water, integrating a detailed assessment of sensor performance, cost, calibration, and deployment conditions. It also provides a visual meta-analysis of literature trends using categorised data visualisations.
2. Materials and Methods
In this subsection, the study outlines the methodology employed to conduct a systematic review focusing on the review of IoT sensors for monitoring trace elements in water quality systems. The study is based on a review of literature published over the last decade, from 2014 to 2025. To the best knowledge of the authors, no similar comprehensive review exists within this specific timeframe, making this study a novel contribution to the field. The research methodology includes the careful selection of relevant peer-reviewed articles from key online databases, namely Scopus, Google Scholar, and Web of Science, ensuring a thorough examination of the subject matter.
2.1. Eligibility Criteria
A systematic study of all peer-reviewed and published research papers related to the study of the review of IoT sensors for evaluating trace elements in water quality systems was conducted for examination. Only research papers published in English between 2014 and 2025 were included in the analysis. A proper criterion for inclusion was adapted to ensure the inclusion of research papers that precisely focuses on this topic and exclude those that do not. Conclusively, only peer-reviewed research papers that foundationally converge on the review of IoT sensors for monitoring trace elements in water quality systems, and that include a research framework or methodology specific to these aspects, were individually considered. The inclusion and exclusion criteria for this study are tabulated as in Table 2 (Maswanganyi et al., 2024; Feroz et al., 2021; da Fonseca et al., 2021; Gumede et al., 2024; Kjorveziroski et al., 2021; Hurbean et al., 2021; Alkhateeb et al., 2022; Mudau et al., 2024; Laiton-Bonadiez et al., 2022; Dashkevych & Portnov, 2022; Khanyi et al., 2024; Schmidt et al., 2022; Rejeb & Appolloni, 2022; Skosana et al., 2024; Barbuto et al., 2023; Marinagi et al., 2023; Abdelmajeed et al., 2023; Mtjilibe et al., 2024; Dong & Zhang, 2023; Thobejane & Thango, 2024; Alshahrani, 2023; Nguyen et al., 2023; Thango & Obokoh, 2024; Kashpruk et al., 2023).
2.2. Information Sources
The information sources for this systematic review included a comprehensive search of multiple bibliographic databases relevant to the topic, such as Web of Science, Scopus, and Google Scholar, to ensure broad coverage of published journal literature. Additional sources included subject-specific databases relevant to environmental science and engineering, as well as grey literature (e.g., conference proceedings, theses, and technical reports) to minimize publication bias and capture unpublished studies (Maswanganyi et al., 2024; Feroz et al., 2021; da Fonseca et al., 2021; Gumede et al., 2024; Kjorveziroski et al., 2021; Hurbean et al., 2021; Alkhateeb et al., 2022; Mudau et al., 2024; Laiton-Bonadiez et al., 2022; Dashkevych & Portnov, 2022; Khanyi et al., 2024; Schmidt et al., 2022; Rejeb & Appolloni, 2022; Skosana et al., 2024; Barbuto et al., 2023; Marinagi et al., 2023; Abdelmajeed et al., 2023; Mtjilibe et al., 2024; Dong & Zhang, 2023; Thobejane & Thango, 2024; Alshahrani, 2023; Nguyen et al., 2023; Thango & Obokoh, 2024; Kashpruk et al., 2023). Reference lists of key articles were also examined to identify further relevant studies not captured in the initial database searches, and citation tracking was used to locate newer papers that cited foundational works. This multi-source approach maximized the likelihood of retrieving all relevant literature on IoT sensors for monitoring trace elements in water quality systems.
2.3. Search Strategy
A systematic review was conducted using Google Scholar, Web of Science, and Scopus to analyze articles on IoT sensors for monitoring trace elements in water quality systems, focusing on publications between 2014 and 2025. This approach aimed to comprehensively evaluate existing research, identify key findings, and potentially highlight gaps in the literature. These keywords were: (“IoT” OR “Internet of Things”) AND (“sensors”) AND (“trace elements” OR “heavy metals” OR “contaminants”) AND (“water quality” OR “water monitoring”). This combination of terms was chosen to ensure that the search captured studies directly related to the research topic.
Figure 1.
Bibliometric Analysis of Study Search Keywords: (a) Overlay Visualization.
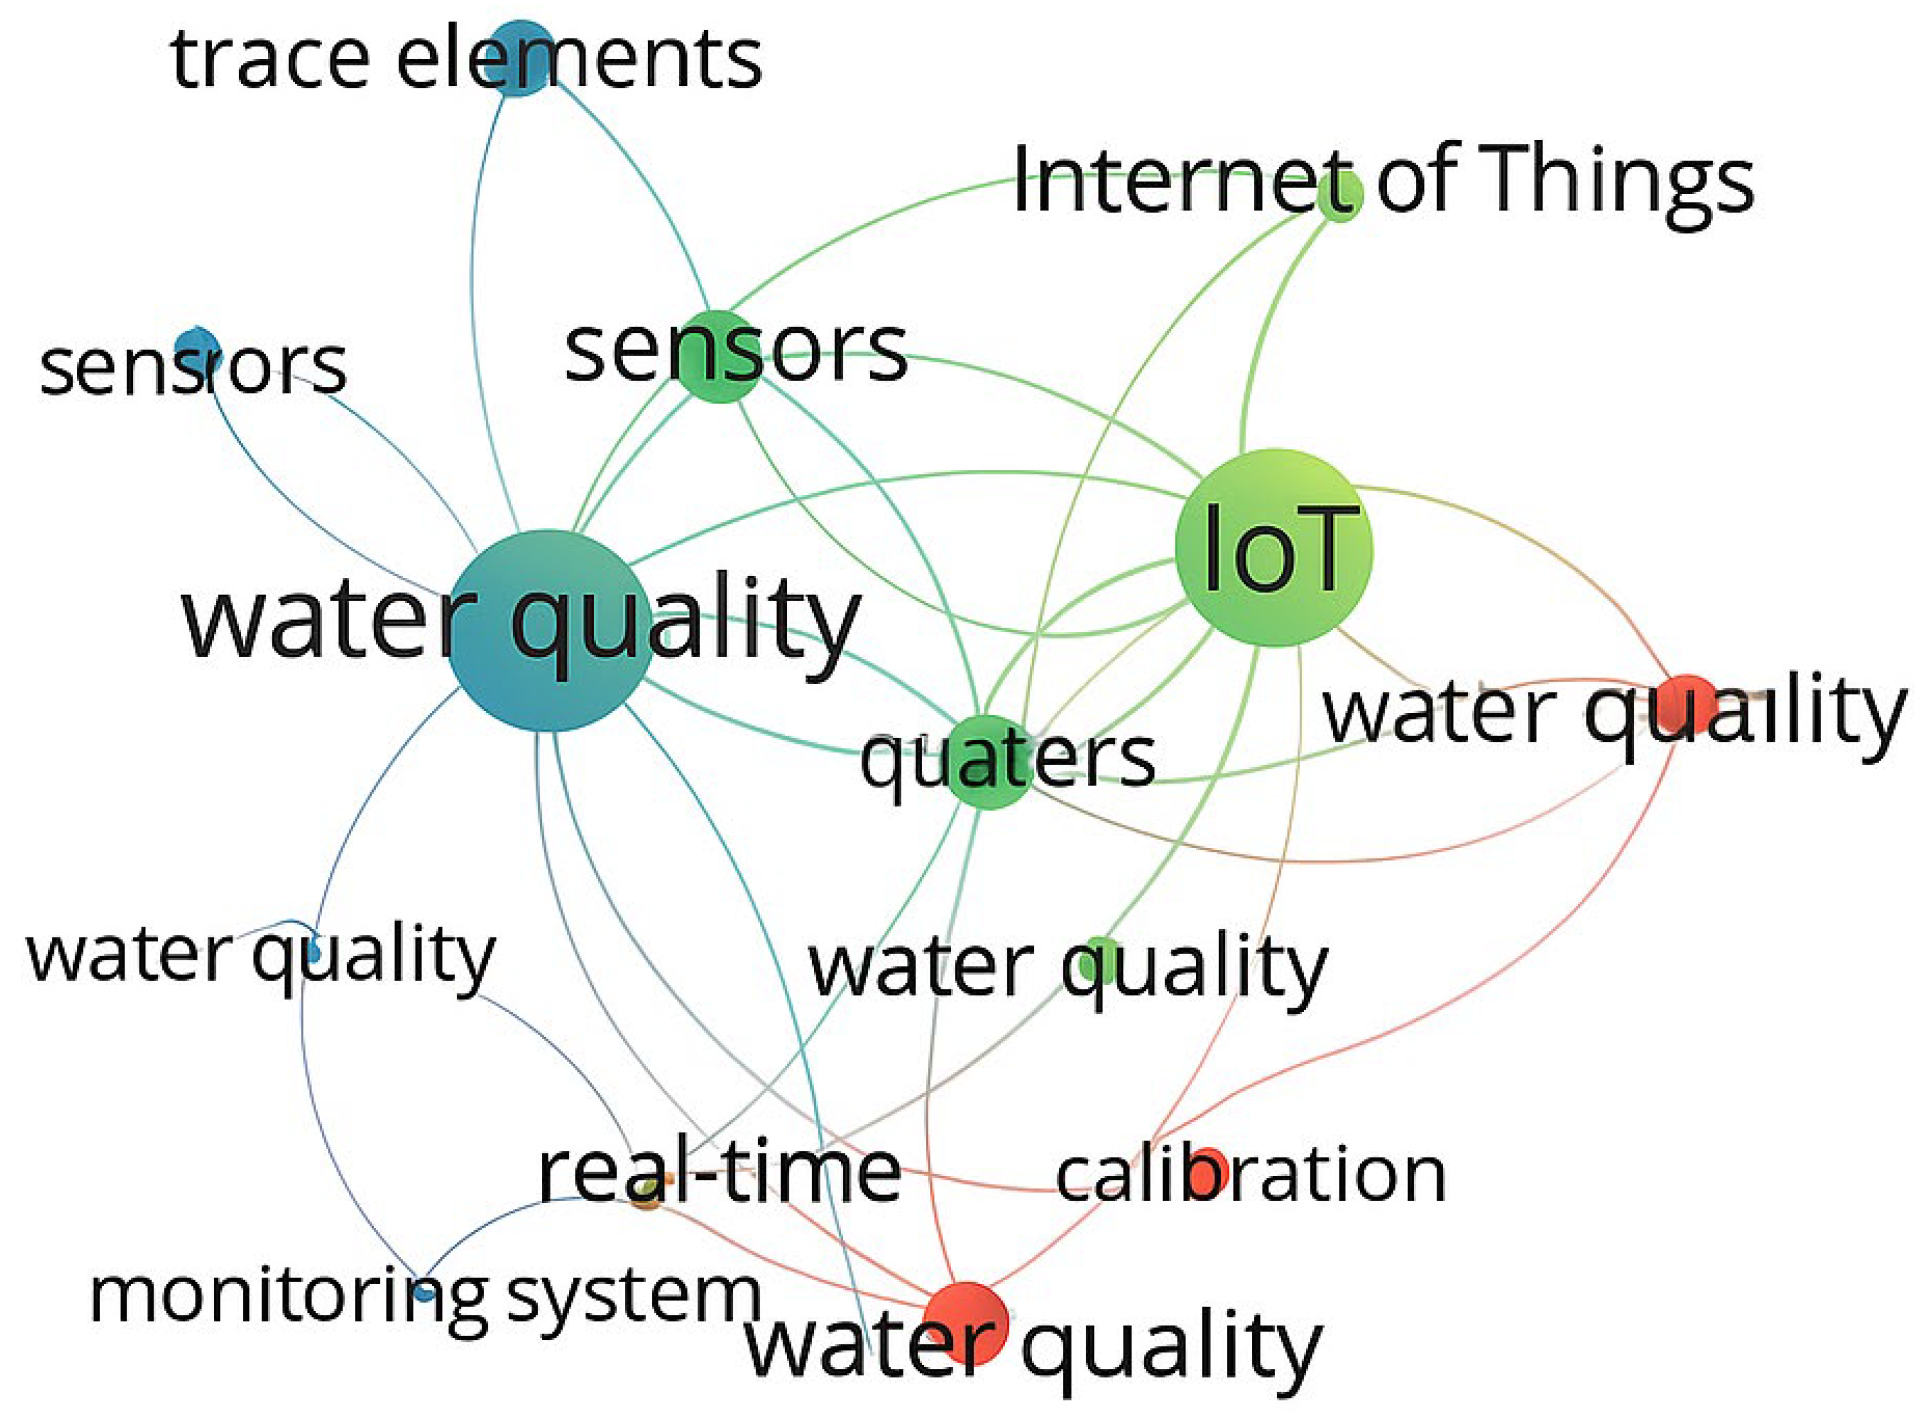

Table 3.
Results Achieved from Literature Search.
| No. | Online Repository | Number of results |
|---|---|---|
| 1 | Google Scholar | 6575 |
| 2 | Web of Science | 212 |
| 3 | Scopus | 871 |
| Total | 7606 |
2.4. Selection Process
Four reviewers independently screened the titles and abstracts of the first records identified through the database search, discussing any discrepancies collectively until consensus was achieved. Following this initial phase, the reviewers worked in pairs to independently assess the titles and abstracts of all remaining articles, resolving any differences of opinion through discussion. If consensus could not be reached within a pair, a third reviewer was consulted to make the final decision regarding inclusion for full-text review (Maswanganyi et al., 2024; Feroz et al., 2021; da Fonseca et al., 2021; Gumede et al., 2024; Kjorveziroski et al., 2021; Hurbean et al., 2021; Alkhateeb et al., 2022; Mudau et al., 2024; Laiton-Bonadiez et al., 2022; Dashkevych & Portnov, 2022; Khanyi et al., 2024; Schmidt et al., 2022; Rejeb & Appolloni, 2022; Skosana et al., 2024; Barbuto et al., 2023; Marinagi et al., 2023; Abdelmajeed et al., 2023; Mtjilibe et al., 2024; Dong & Zhang, 2023; Thobejane & Thango, 2024; Alshahrani, 2023; Nguyen et al., 2023; Thango & Obokoh, 2024; Kashpruk et al., 2023). Subsequently, three reviewers independently evaluated the full-text articles to determine their suitability for the review, with any disagreements again resolved through discussion and, if necessary, by involving the fourth reviewer to make the final determination.
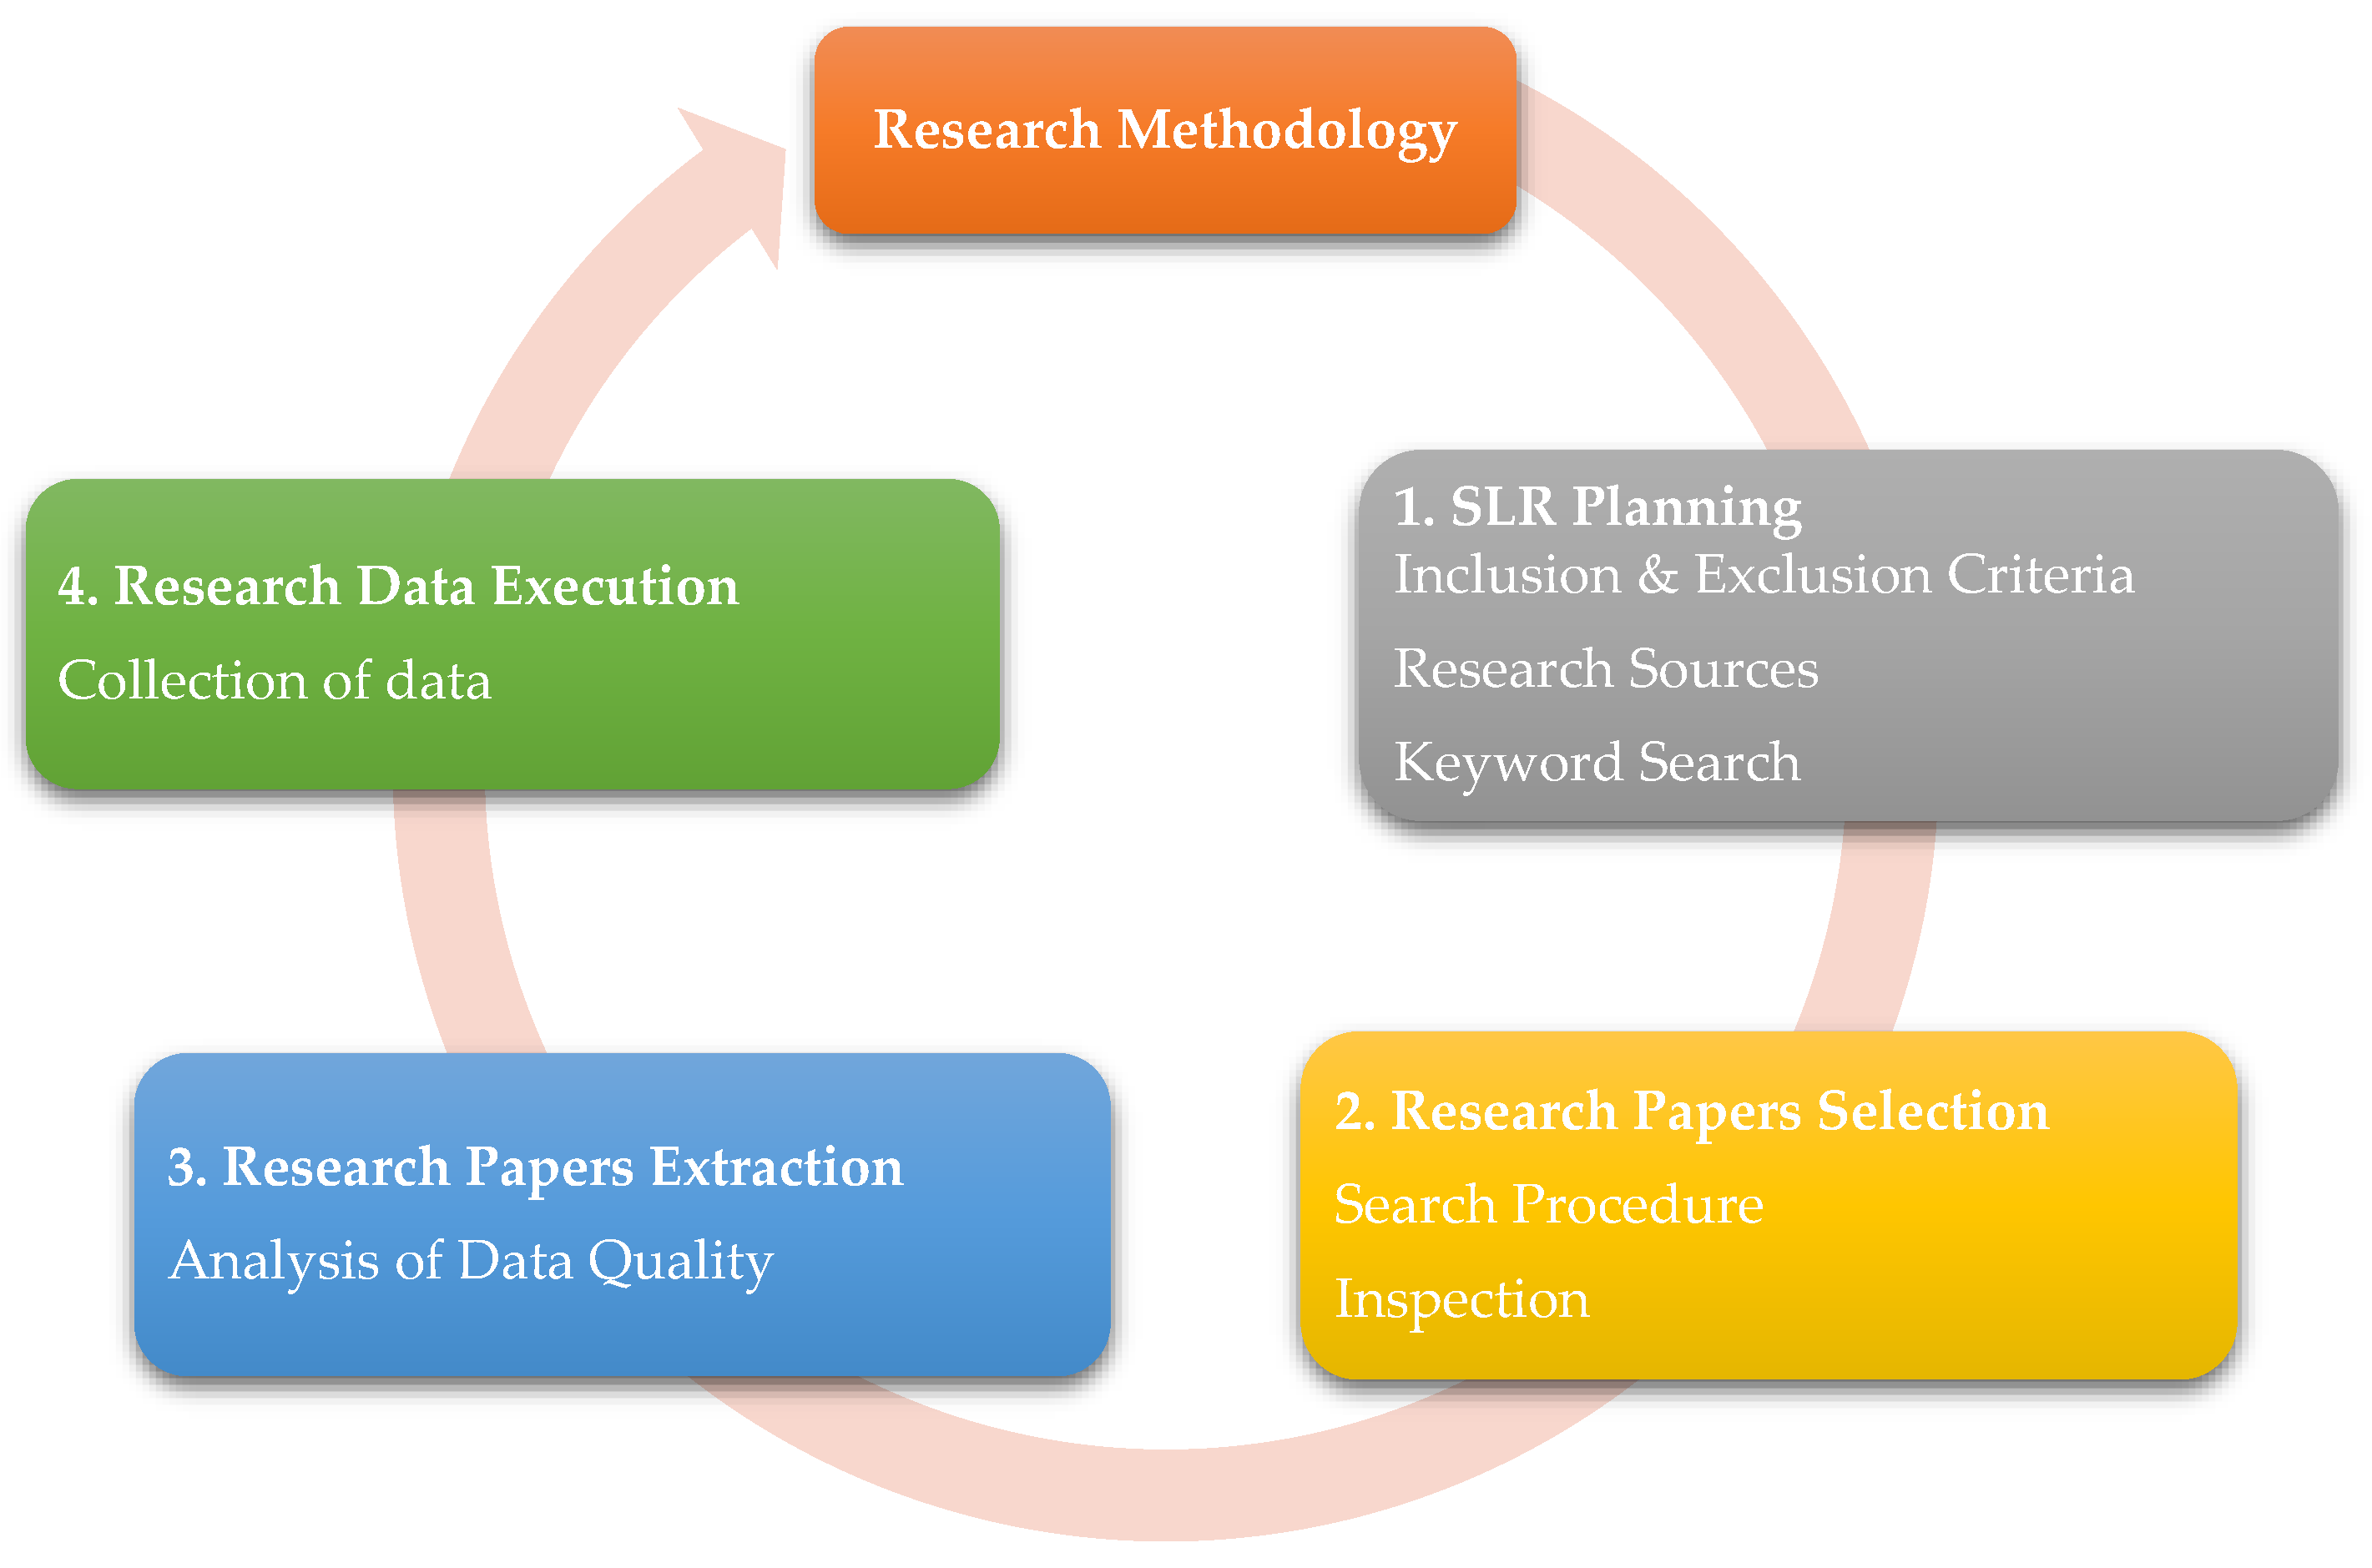
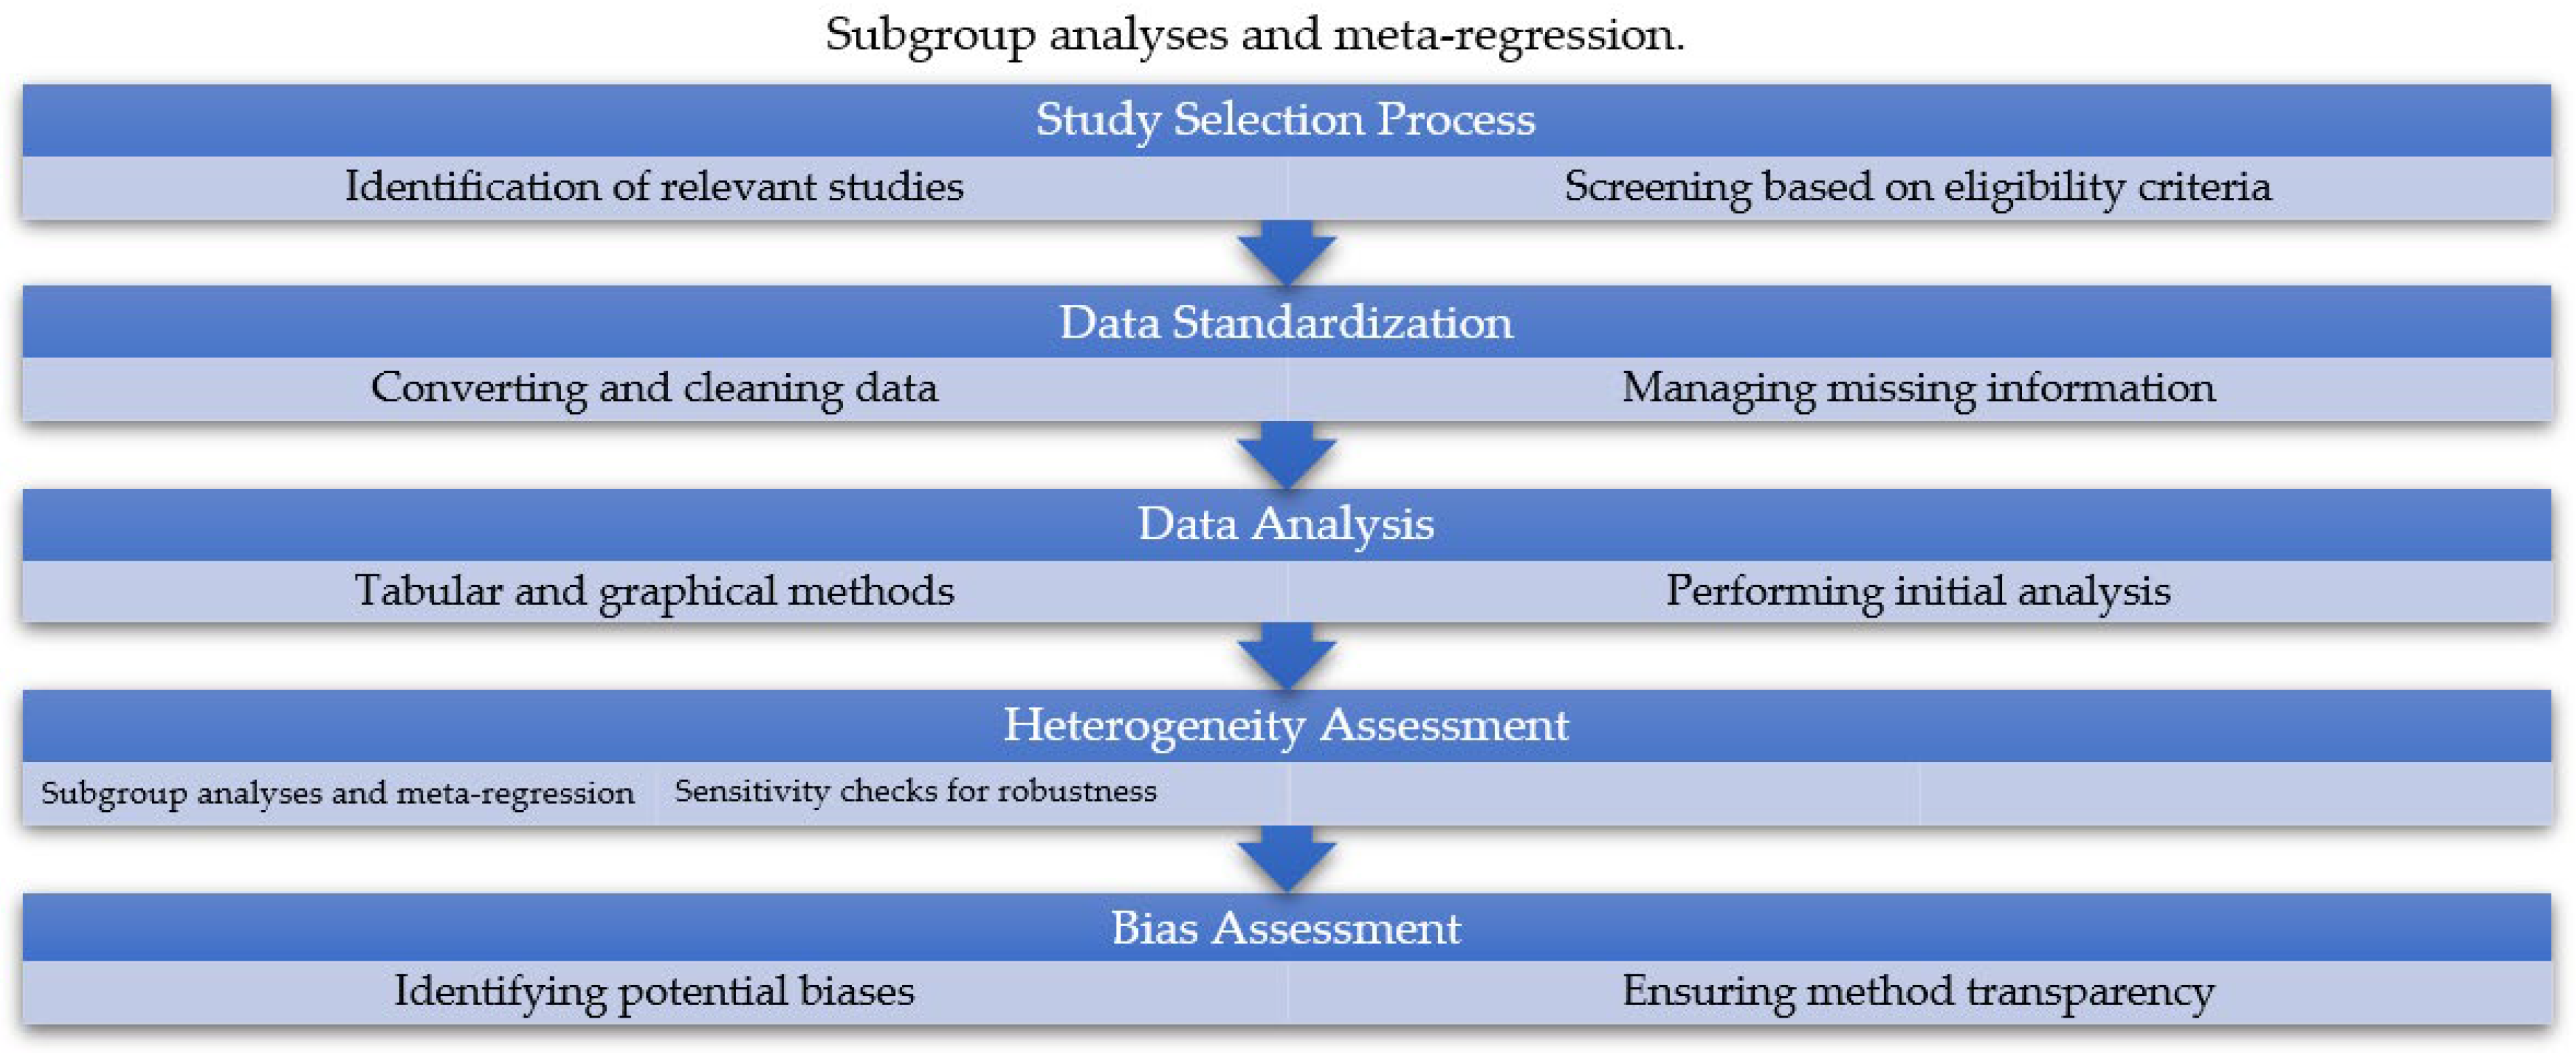
Figure 2.
Procedures and Stages of the Review.
2.5. Data Collection Process
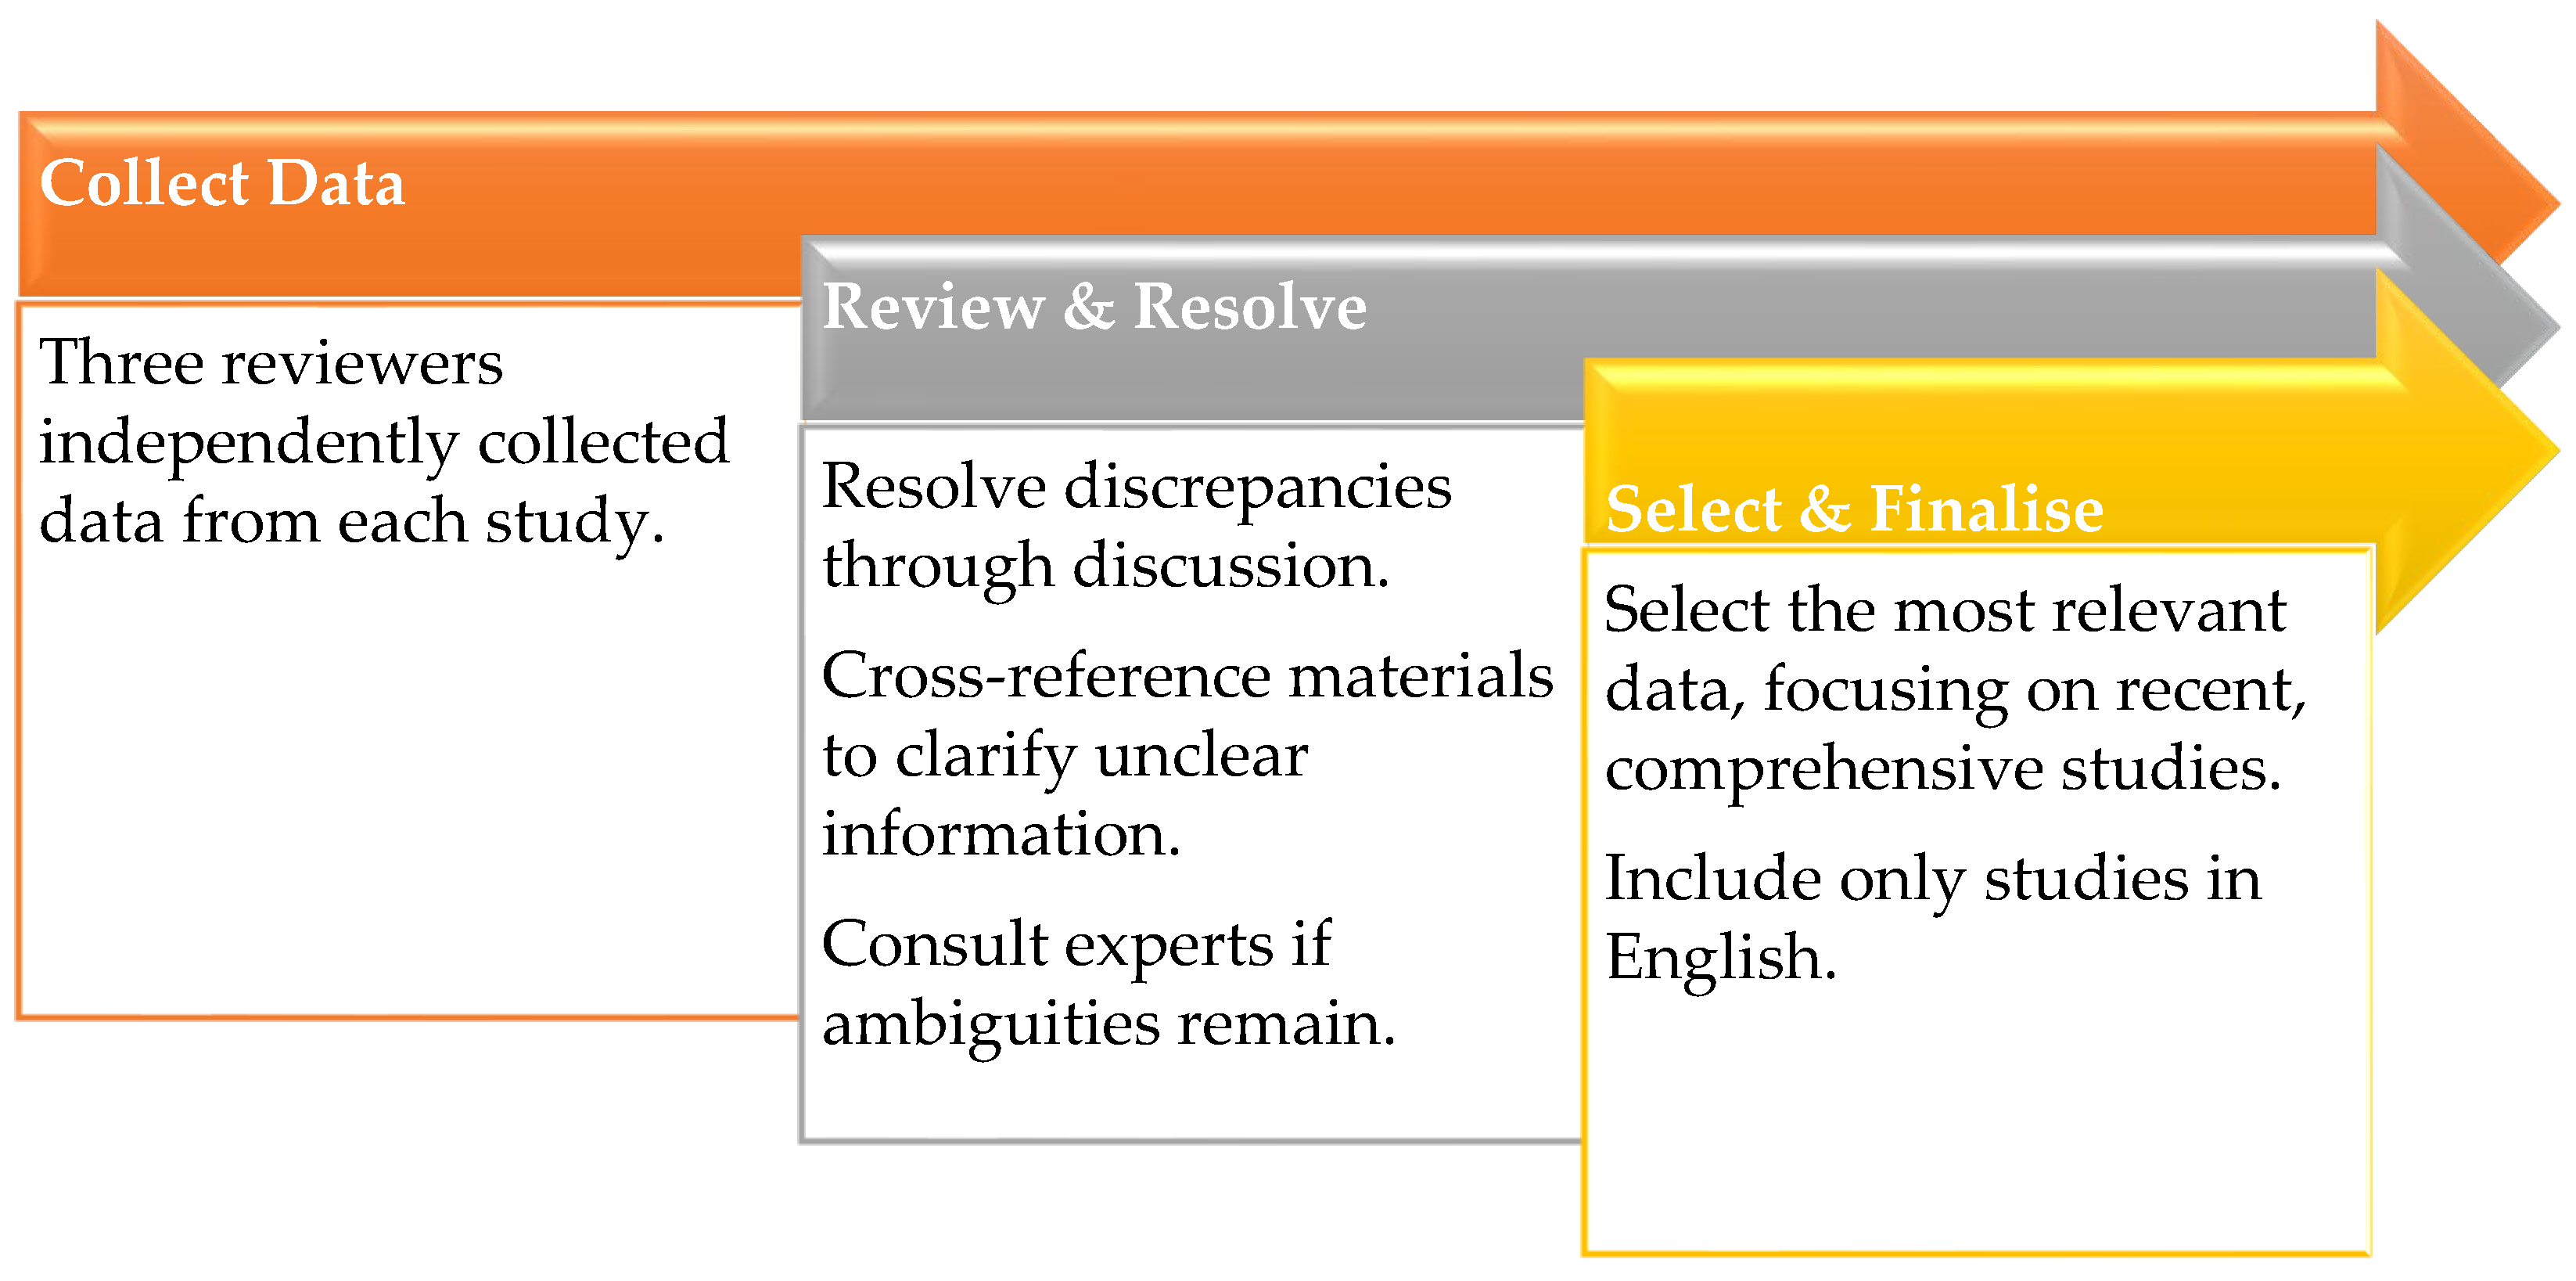
The data collection process involved systematically extracting relevant information from the full-text articles that met the inclusion criteria. Three reviewers independently performed data extraction using a standardized form designed to capture key study characteristics, including sensor type, trace elements monitored, IoT platform and communication protocols, detection limits, accuracy, validation methods, and deployment environment. To ensure consistency and accuracy, the extracted data were cross-checked among the reviewers, and any differences were resolved through discussion. When necessary, corresponding authors were contacted to obtain missing or unclear information. The collected data were then organized into summary tables to facilitate combination and comparison across studies (Maswanganyi et al., 2024; Feroz et al., 2021; da Fonseca et al., 2021; Gumede et al., 2024; Kjorveziroski et al., 2021; Hurbean et al., 2021; Alkhateeb et al., 2022; Mudau et al., 2024; Laiton-Bonadiez et al., 2022; Dashkevych & Portnov, 2022; Khanyi et al., 2024; Schmidt et al., 2022; Rejeb & Appolloni, 2022; Skosana et al., 2024; Barbuto et al., 2023; Marinagi et al., 2023; Abdelmajeed et al., 2023; Mtjilibe et al., 2024; Dong & Zhang, 2023; Thobejane & Thango, 2024; Alshahrani, 2023; Nguyen et al., 2023; Thango & Obokoh, 2024; Kashpruk et al., 2023).
Figure 3.
Flow of Data Selection and Extraction.
2.6. Data Items
This is a division that provide an understanding overview of the data items assessed in this systematic review, pinpointing on both main results and contextual variables appropriate to the disposition and effect of IoT sensors for water quality monitoring systems. The main results incorporate crucial performance framework such as sensor precision, real-time monitoring techniques, and environmental sustainability. Furthermore, the review accounts study settings, sensor specifications, data transmission approaches, maintenance requirements, and connection with available infrastructure to confirm a careful contextual comprehension of IoT sensor efficiency in broader water monitoring applications. This full approach facilitates an assessment of the technological and operational consequences of utilising IoT-based systems for water quality evaluation.
2.6.1. Data Collection Method
Efforts were taken to warrant an understanding of the operation and performance of IoT sensors in water quality monitoring. Appropriate outcome assessments were thoroughly noted to account for the technological, operational, and environmental dimensions of these systems. The primary results of this systematic review focused on multiple key performance factors: Sensor Accuracy and Reliability, assessed through factors such as pH, turbidity, conductivity, and temperature, was a significant result. Studies reporting on detection precision, calibration consistency, and sensitivity levels were considered to comprehend the assessment abilities of IoT sensors in different water environments. Real-Time Monitoring was also important. We looked for studies covering potential, data transmission rates, and cloud connectivity to assess how well sensors sustained real-time data collection and distant monitoring. Power Efficiency and Autonomy of the sensors were evaluated according to energy usage rates, battery life, and solar or alternative power solutions (Maswanganyi et al., 2024; Feroz et al., 2021; da Fonseca et al., 2021; Gumede et al., 2024; Kjorveziroski et al., 2021; Hurbean et al., 2021; Alkhateeb et al., 2022; Mudau et al., 2024; Laiton-Bonadiez et al., 2022; Dashkevych & Portnov, 2022; Khanyi et al., 2024; Schmidt et al., 2022; Rejeb & Appolloni, 2022; Skosana et al., 2024; Barbuto et al., 2023; Marinagi et al., 2023; Abdelmajeed et al., 2023; Mtjilibe et al., 2024; Dong & Zhang, 2023; Thobejane & Thango, 2024; Alshahrani, 2023; Nguyen et al., 2023; Thango & Obokoh, 2024; Kashpruk et al., 2023). All domains were important for comprehending sensor reliability in distant or energy independent locations. Environmental Resilience was was via the sensor’s capabilities to perform under different climatic and aquatic factors. Studies that prove or resulted in corrosion resistance, waterproofing and temperature sustainable provided views into sensor flexibility. Maintenance Requirements and Cost Implications were assessed with respect to sensor lifetime, adjusted frequency, and simplified deployment. Studies that enumerated operational and preservation efforts were crucial for assessing long-term viability. Each of these factors was discovered through both qualitative descriptions and quantitative performance pointers, allowing cross-comparisons and recognition of high-performing IoT sensor prototypes.
2.6.2. Definition of Collected Data Variables
To contextualize the results and allow evidence, extra variables were methodically collected and grouped into three groups:
- Including location, type of water storage monitored, deployment setting e.g., urban and rural, and year of publication. These characteristics facilitated a view into the operational environments and use-case variety of IoT-based systems.
- Specifications of sensor models, communication protocols, data storage were recorded. This assisted in finding the technical maturity and measurement of various applications.
- We assessed how sensors were involved with broader water management systems. Studies detailing system architecture, sensor network plan, and data analytics supplied thorough information into the complication and invention.
Searches were done across trusted databases such as Web of Science, Research Gate and Google Scholar using relevant search strings.” The search strategy was designed to note the most updated and topic-relevant studies.
Table 4.
Data Variables Collected.
| Field | Description |
|---|---|
| Study characteristics | Geographic location, industry specifics, SME size, and other factors that influence the study’s context. |
| Participant characteristics | Information about employees using BI tools, including their roles, level of BI literacy, and engagement with technology. |
| Intervention characteristics | Details of BI tools and data mining techniques used, integration with existing systems, and scope of application. |
| Economic factors | Financial aspects such as initial and ongoing investments, and returns on these investments. |
| External influences | Market conditions, competitive pressures, and regulatory environments affecting BI adoption. |
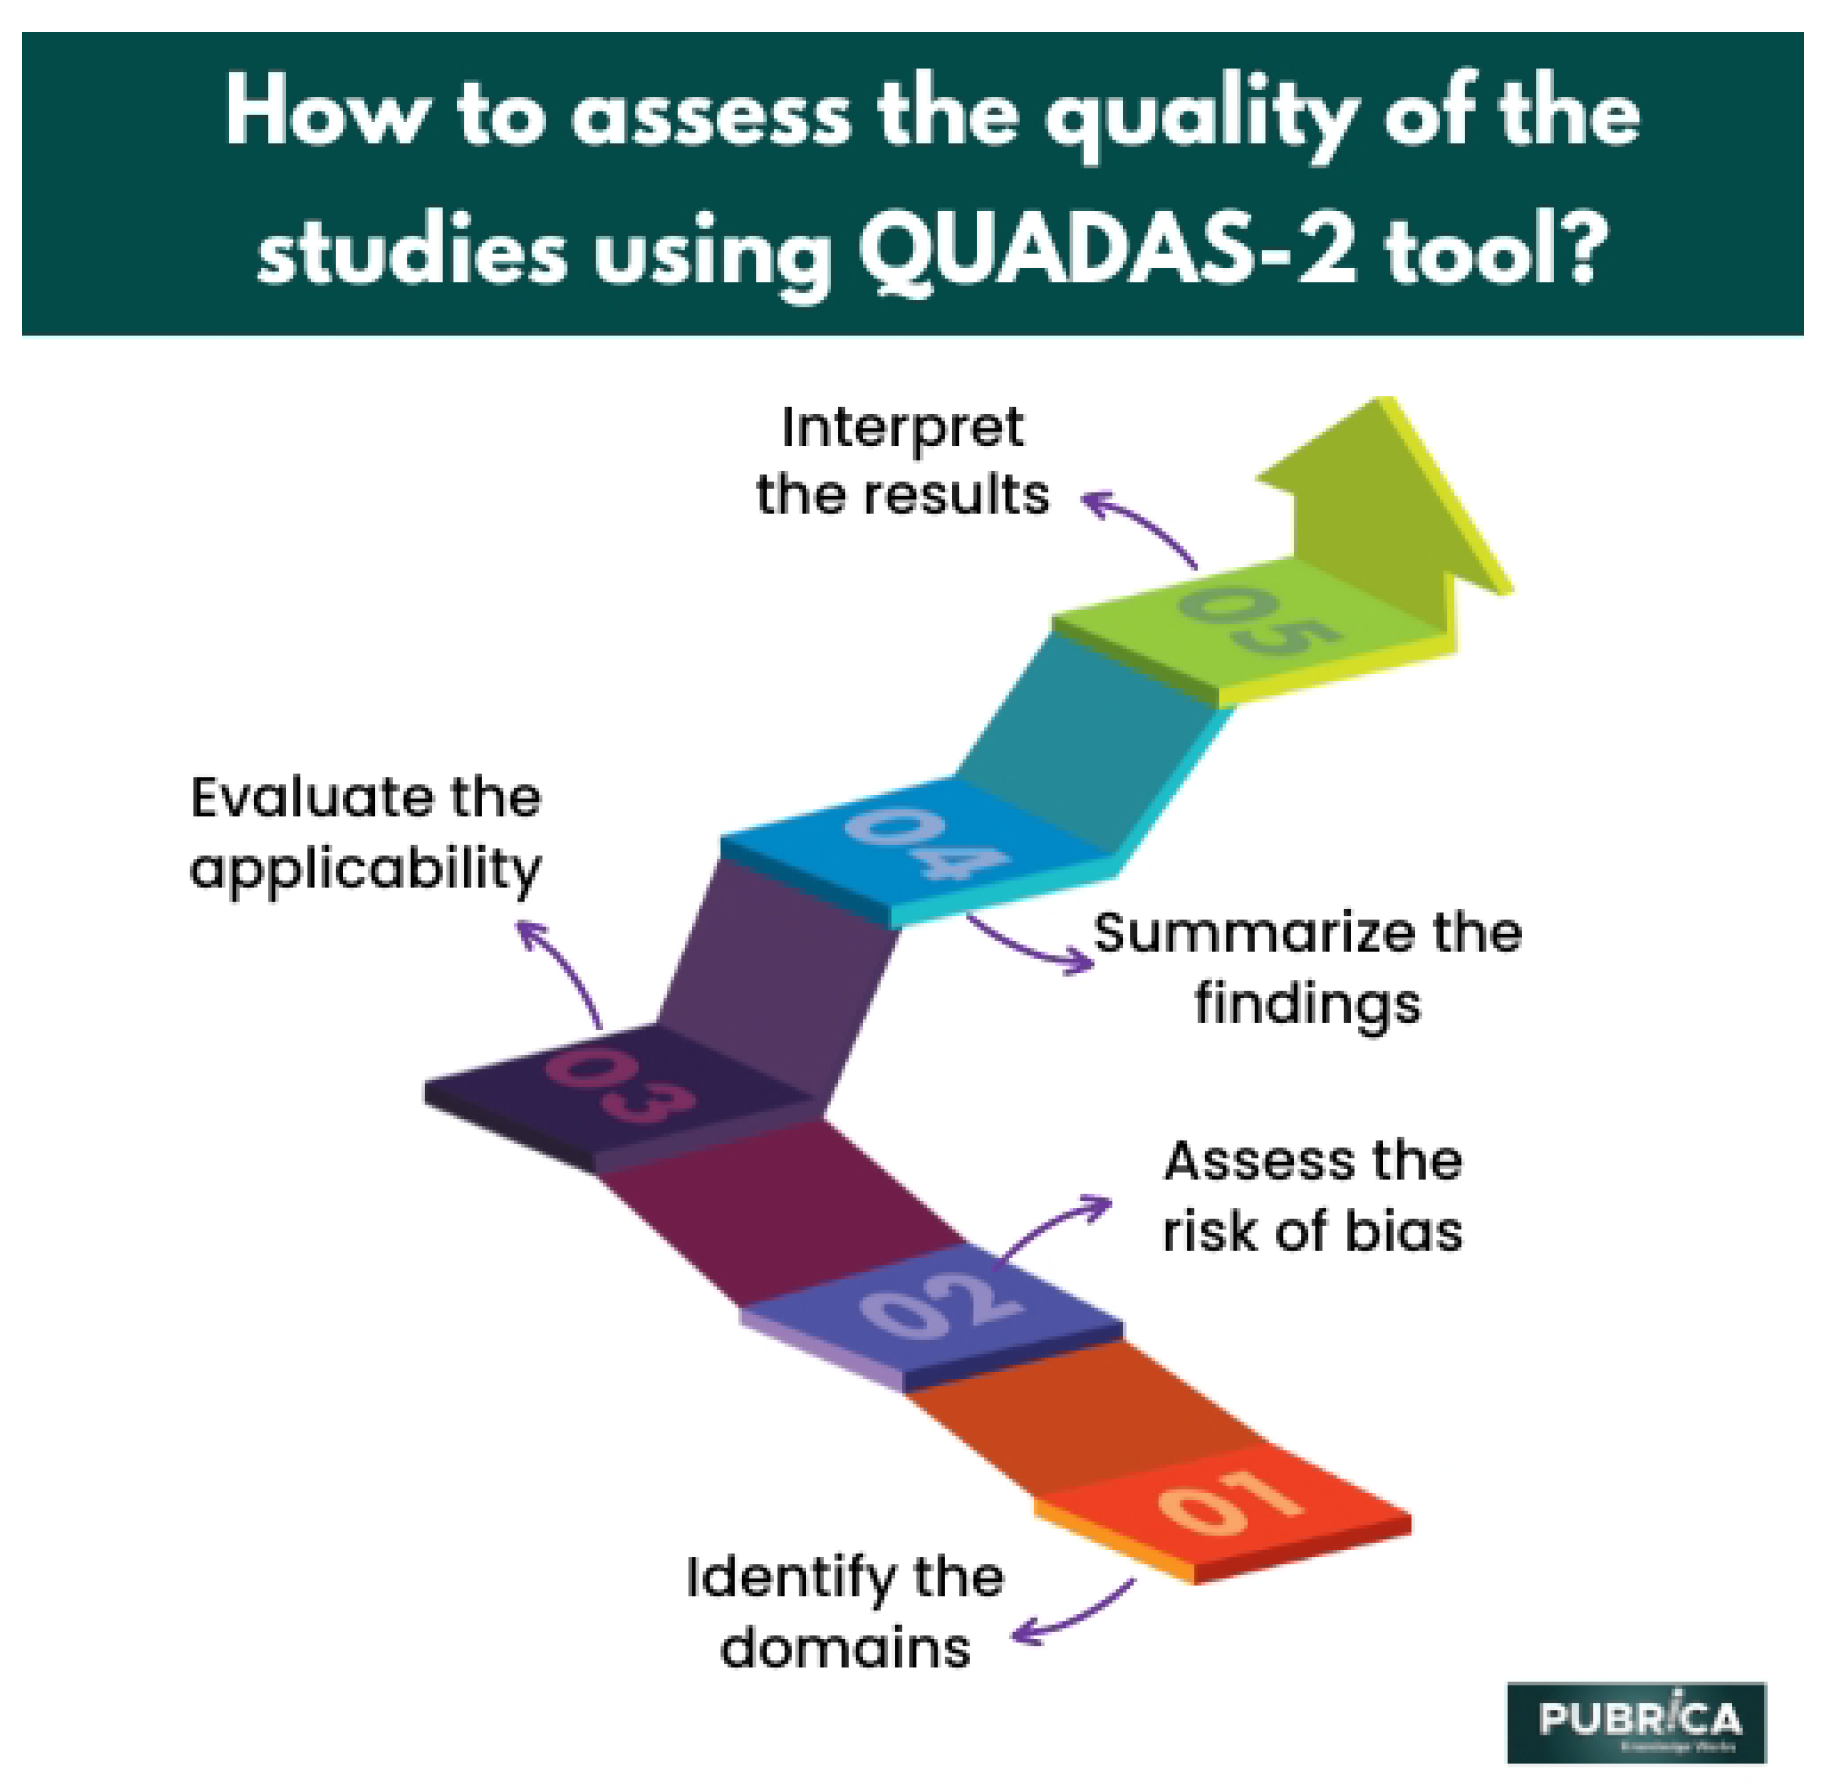
2.7. Study Risk of Bias Assessment
For validation of the results in IoT sensors for monitoring trace elements in water quality systems, an organized risk of bias assessment was established for all used research studies. The methods employed to achieve this were QUADAS-2 (Quality Assessment of Diagnostic Accuracy Studies-2) designed to evaluate the quality of main diagnostic correctness of studies. QUADAS-2 evaluates with respect to four main domains namely: patient selection, index test, reference standard and, flow and timing. Every domain is evaluated with respect to risk of bias, and the first 3 domains are additionally evaluated with respect to the concerns observing pertinence. Gesturing questions are embraced to facilitate judge risk of bias. The QUADAS-2 tool is applied in 4 phases: summarize the review question, tailor the tool and produce review-specific guidance, construct a flow diagram for the primary study, and judge bias and applicability. This tool will facilitate for farther transparent assessment of bias and applicability of primary diagnostic accurateness of studies. Figure 1 shows the steps adopted when using QUADAS-2 to evaluate quality of the studies. For studies with reservations or inadequate information, specifically those involving exclusive data mining tools, further actions were assumed. This incorporated cross-referencing dependable sources such as Scopus, Google Scholar, Research Gate, and Web of Science for clarification of uncertainties. Additionally, a thorough manual exploration of online repositories was carried out to reduce bias and guarantee that the risk of bias evaluation was as correct and detailed.
2.8. Synthesis Methods
The effect measures are used to assess and analyse the performance and results of IoT sensor systems utilised in water quality monitoring. Using the technological consideration of this review, effect analysis was detailed on both quantitative performance indicators and qualitative implementation results. These impact measures allowed reliable synthesis of evidence throughout studies, irrespective of environmental implication and sensor type. The main objective was to assess how efficiently IoT-based sensor systems took part in accuracy, real-time, reliability, and sustainability of water quality monitoring in different arrangements.
Figure 5.
Systematic Review Process for Data Mining and Business Intelligence in SMEs.
2.8.1. Eligibility for Synthesis
To find the appropriateness of studies for inclusion for each synthesis, we analytically tabulated the characteristics for each study. This included, the type of IoT sensor, target trace element, Sensor technology, Data communication protocols, Deployment environment. The data was compared to the existing synthesis groups in the review protocol, which grouped studies according to both sensor type and water system context. Only studies that testified the primary data on sensor behaviour for trace element detection and included IoT connectivity features were incorporated in the final synthesis.
2.8.2. Data Preparation for Synthesis
The methods employed in this review are Standardization. Data imputation was not utilized; studies with lacking essential performance metrics such as sensitivity or limit of detection were eliminated from synthesis but noted in the narrative. In some cases, qualitative descriptors like high sensitivity were confirmed with context-specific performance thresholds from specified guidelines.
2.8.3. Tabulation and Visual Display of Results
The results obtained from individual studies were grouped using tubular and graphical methods on Microsoft Excel. Tubular method was used to organize the data in a presentable structure. The tabulated results were then converted in it charts and graphs to visualize the statistics. The statistics obtained was based on effect size and year of publication, presenting the trends over the period.
2.8.4. Synthesis of Results
The information obtained from online repositories was thoroughly reviewed for relevance. Due to heterogeneity in sensor design and testing protocol, a meta-analysis was not carried out. As an alternative, a narrative synthesis approach was used, evaluating performance trends across categorised groups such as Sensor types and Target trace elements. The narrative synthesis method facilitated a complete evaluation and qualitative comparison. This selection was influenced by the variability in methodologies and non-comparability of quantitative results across studies.
2.8.5. Exploring Causes of Heterogeneity
To evaluate sources of heterogeneity amongst the included studies, subgroup analyses were executed according to sensor characteristics and operation environments. The synthesis concentrated on factors such as type of IoT sensor technology, Target trace elements and environment of operation. Even though a formal meta-regression was not achievable Because of qualitative nature and variability of the data. The comparison of these subgroups assists in explanation of distinctions in sensor performance and IoT reliability and environmental settings facilitated heterogeneity in studies.
2.8.6. Sensitivity Analyses
Sensitivity analyses are used to assess the sturdiness of the synthesis results with respect to several conventions and methodological choices taken through the review course. These analyses evaluated the effect of eliminating studies susceptible to high risk of bias through an employment of alternative statistical models to confirm the exclusion of influence by specific studies.
2.9. Reporting Bias Assessment
Through conducting our systematic review on the utilisation of IoT sensors for observing trace elements in water quality systems, it was crucial to evaluate the risk of reporting bias, mainly the probability of having missed. With the rising yet still split nature of research in environmental sensor technology, the availability of publication or results reporting bias could impact fully change the authenticity and understanding of our synthesis.
To resolve such problem, we employed an intentional and organized method intended to recognize possible reporting biases. Though the variety of study designs and the qualitative nature of several behavioural outcomes restricted the utilisation of meta-analytic approaches, we arranged methodological transparency and manual rigor during our bias assessment process. Our main approach concentrated on understandable manual searching and cross-confirmation. We conducted our literature searches on academic repositories such as Web of Science, Research Gate, Scopus and Google Scholar. This enabled us to realize peer-reviewed studies, grey literature such as conference proceedings, technical reports, and thesis work. This was principally crucially in the context of developing sensor technologies, where primary publication formats are typical. We also inspected the integrated studies for any tracks of biased outcome reporting. This implicated comparing the listed objectives and methodologies with the outcomes and conclusions divisions to reveal irregularities or errors such as metrics outcomes being left or unevenly reported. If performance results like detection restricts or reaction times were designated in procedures but omitted in outcomes, such cases were labelled and deemed at higher risk of biased reporting.
Due to the missing of sufficient homogeneous quantitative data, we did not use statistical methods. As an alternative, a qualitative assessment of reporting comprehensiveness was completed by independent reviewers. Each reviewer assessed if the reporting of results showed selection or inadequacy and if the study followed its indicated objectives. Any inconsistencies in arbitration were reviewed and settled by consensus, and if necessary, an extra reviewer was checked. This collaborative review process decreased bias and improved reliability in analysis. In our review, there were no utilisation of automation tools for evaluating reporting bias. With the technical and descriptive nature of the studies engaged, we discovered that a manual review by structured data extraction tables and collective assessment was efficient in spotting sensitive arrangements of reporting irregularity.
To enhance openness and traceability, we incorporated a complete track of search strings, databases accessed, and purposes for study inclusion/exclusion in the additional materials. This allows other researchers to use our process or expand the facts using comparable criteria.
2.10. Certainty Assessment
Ultimately, identifying that IoT sensor improvement regularly involves interdisciplinary cooperation and quick prototyping, we designed standard bias assessment approaches to fit this context. The reporting landscape in IoT and environmental examining frequently differs in presentation and intensity. By shaping our procedures to the characteristics of this literature, we confirmed that our evaluation was not only complete but also presented precise research. The reviewed literature on the role and impact of trace elements was evaluated based on five Quality Assessment (QA) criteria to ensure methodological rigor and relevance:
- QA1: Clarity and explicitness of the study’s aim regarding trace element research.
- QA2: Transparency and adequacy of data collection methods, including sampling and measurement of trace elements.
- QA3: Appropriateness of analysis techniques used to identify and quantify trace elements.
- QA4: Application of a well-defined and appropriate research methodology.
- QA5: Contribution of findings to advancing the scientific understanding of trace element functions or risks in health or the environment.
Each study was rated on a 0–1 scale for each criterion:
- 0 for “No”,
- 0.5 for “Partially”,
- 1 for “Yes”.
Each study could achieve a total score between 0 and 5. The percentage grading was calculated accordingly. The certainty assessment results are summarized in Table 5. so relevant and associated with the notes of the field.
To support the conclusions of this systematic review on the roles, effects, and implications of trace elements, we conducted a precise assessment of the certainty of the evidence. The strength and reliability of our findings were grounded in a systematic evaluation process, which we implemented using the GRADE (Grading of Recommendations, Assessment, Development, and Evaluations) framework. GRADE is a broadly accepted and comprehensive approach to evaluating the quality of evidence, ensuring that the conclusions drawn are both credible and scientifically sound.
The certainty of the evidence across key outcomes related to trace element exposure, deficiency, or toxicity was meticulously evaluated through several critical criteria. First, we examined the accuracy of effect estimates by evaluating sample sizes and the width of confidence intervals. Studies with limited confidence intervals and sufficiently large sample sizes were considered to provide more reliable and precise evidence. We also investigated the consistency of findings by comparing the direction and magnitude of effects across studies. High consistency among study results contributed to greater accuracy, while any heterogeneity was thoroughly investigated to understand its potential sources and effect on the overall synthesis.
Additionally, the risk of bias was assessed using an adapted version of the Cochrane Risk of Bias tool. Studies exhibiting a low risk of methodological bias were deemed to strengthen the accuracy of the evidence. Directness was also considered, referring to how closely the study populations, interventions (such as trace element supplementation or environmental exposure), and outcomes (such as physiological or ecological effects) aligned with the objectives of this review. Substantial directness reinforced our confidence in the findings.
Based on these criteria, the creditability of evidence was classified into four levels. High certainty was assigned when studies were consistent, precise, directly applicable, and demonstrated a minimal risk of bias. Moderate certainty was used when there were minor concerns in one domain, such as slight inconsistency or average risk of bias. Low certainty was assigned when multiple concerns, such as imprecision, inconsistency, or major risk of bias were evident. Very low certainty was applied when serious limitations existed across all domains, severely limiting conviction in the results.
To ensure the validity of the GRADE framework for this review, we adjusted it specifically for outcomes relevant to human health, environmental impacts, and biological functions associated with trace elements. Multiple independent reviewers assessed each study, and any inconsistencies were resolved through consensus discussions.
3. Results
3.1. Study Selection
For this systematic review, we followed a clear and organized process to pick out the most relevant and high-quality research articles. We searched three major online databases—Google Scholar, Web of Science, and Scopus—to find studies that matched our criteria. This search gave us 6,575 results from Google Scholar, 212 from Web of Science, and 871 from Scopus, adding up to 7,606 total records. Next, we removed any duplicate entries, which left us with 1,054 unique records. These were then screened by looking at their titles and abstracts to see if they were relevant to our review. From that, we chose 34 full-text articles for a more detailed look. After carefully reviewing those, 52 studies were ultimately included in the final analysis. The whole selection process is shown in Figure 6, using a PRISMA flowchart to map out each step.
3.2. Study Characteristics
The distribution of research outputs over time, as illustrated in Figure 7, shows a gradual but steady growth in publications on IoT-based water quality monitoring systems. Early studies (2014–2015) were limited in number, reflecting the initial stages of applying IoT frameworks to environmental sensing. From 2016 onwards, the number of published works increased noticeably, with marked peaks in 2018 and 2019. This upward trend indicates a maturing research area, driven by technological advances in low-cost sensors, communication protocols, and data processing capabilities.
The distribution of IoT sensor types used for monitoring trace elements in water quality systems (Figure 8) shows that ion-selective sensors (18.2%) and multi-parameter systems (18.2%) are the most frequently applied categories in the reviewed literature. Optical sensors (9.1%), electrochemical sensors (9.1%), and biosensors (9.1%) also make significant contributions, offering high sensitivity for targeted analytes. Other categories, including acoustic sensors, microbiological sensors, magnetic sensors, ultrasonic sensors, remote sensing, and graphene-based sensors, each account for 4.5% of reported applications. This spread demonstrates that while certain sensor platforms dominate, there is a diverse mix of specialised sensing technologies being integrated into IoT-enabled water monitoring systems.
The contaminants and parameters assessed in the reviewed studies (Figure 9) reveal a strong research focus on nutrients and eutrophication indicators (30%) and heavy metals or trace elements (29%). Microbiological contaminants are addressed in 6% of the studies, while emerging contaminants or organic pollutants make up 4%. Industrial and chemical pollutants account for 3%, with salinity and marine conditions represented in 8% of the research. General water quality indicators and physical–chemical parameters each comprise 8% of the reviewed works. Infrastructure monitoring (2%) and recreational water risk assessment (2%) are comparatively less common. Mixed or multiple parameter studies, which integrate several contaminant categories, make up 8% of the total.
Sensor performance metrics reported in the reviewed literature (Figure 10) show that sensitivity is the most frequently mentioned parameter (27.3%), followed closely by detection limits combined with sensitivity (18.2%). Quantitative accuracy metrics are reported in 18.2% of studies, while validation or calibration data account for another 18.2%. A smaller proportion of papers (18.2%) either do not report performance metrics or leave them unspecified. This distribution suggests that while sensitivity and detection capabilities are prioritised in IoT-based water quality research, there is still a notable gap in standardised reporting of validation procedures and accuracy measures.
The cost and availability distribution of IoT sensor systems from the reviewed literature (Figure 11) indicates that low-cost devices priced between $50–$500 make up the largest share at 46.0%. Medium-cost systems ($500–$2,000) account for 14.0%, while very low-cost solutions (<$50) and high-cost or specialised systems each represent 8.0%. Research-stage or non-commercialised systems comprise 14.0% of the studies, and 8.0% of cases report varied or mixed cost categories. This pattern highlights the predominance of affordable, commercially available solutions, with a smaller but notable proportion of higher-cost specialised or experimental devices.
The analysis of sensor interface and communication protocols in the reviewed literature (Figure 12) shows that industrial protocols dominate with 32% of reported cases. Analog/digital mixed systems with IoT enablement account for 14%, followed by analog-only systems (8%) and digital-only systems (4%). Digital combined with wireless IoT features also represents 4%, while mixed complex architectures make up 8%. Not applicable or unspecified cases comprise 12%. This distribution suggests that while industrial-grade protocols are most prevalent, there is substantial diversity in interface configurations, reflecting the varied application contexts and integration requirements in IoT-based water quality monitoring.
The review of microcontroller and hardware platforms used in IoT-based water quality monitoring (Figure 13) reveals that Arduino, including both standalone and paired with other boards, is the most widely adopted platform, accounting for 29% of cases. Raspberry Pi follows closely with 20%, while combined Raspberry Pi and Arduino setups represent 8%. Specialised hardware platforms, such as FPGA boards or GIS-integrated systems, make up 10% of cases. Research-grade or custom-built hardware accounts for 8%, and microcontroller-agnostic or unspecified configurations comprise 16%. This distribution highlights Arduino’s dominance due to its affordability and ease of integration, while also showing the role of higher-performance platforms like Raspberry Pi in more data-intensive applications.
Analysis of deployment environments in IoT-based water quality monitoring studies (Figure 14) indicates that field deployment is the predominant approach, representing 44% of reviewed cases. Field and remote or IoT-enabled setups account for 19%, while lab–field hybrid configurations comprise 9%. Industrial or infrastructure-level deployments make up 6%, matching the proportion of lab-only studies. Submersible or in-pipe systems represent 4%, and simulated or pilot environments account for 8%. Notably, 6% of studies did not specify their deployment context or reported mixed-use scenarios. This trend shows a clear emphasis on real-world field testing, while controlled and pilot-scale trials remain secondary approaches.
The review of calibration practices in IoT-based water quality monitoring systems (Figure 15) shows that regular or periodic calibration is the most reported approach, representing 34% of studies. Likely or implied periodic calibration follows at 20%, while 14% explicitly describe detailed calibration methods. General references to calibration without specific procedures account for 23%. Specialist calibration procedures are cited in 6% of cases, whereas 4% indicate that calibration was not applicable or not required. These findings suggest that while calibration is widely recognised as essential, many studies lack detailed methodological reporting, potentially affecting reproducibility and sensor performance validation.
The challenges identified in IoT-based water quality monitoring literature (Figure 16) reveal that biofouling and fouling-related issues are the most prevalent, affecting 32% of the reported studies. Sensor drift and stability concerns follow closely at 22%, highlighting the difficulty of maintaining consistent measurement accuracy over time. Signal and communication interference is noted in 14% of studies, while power and energy limitations are reported in 10%. Environmental and matrix effects, which can distort sensor readings, are mentioned in 8% of cases, as are data and deployment limitations. These findings underscore that maintaining long-term sensor reliability in diverse environmental conditions remains a significant barrier to operational scalability.
4. Conclusions
This systematic review highlights the significant progress and persistent challenges in applying IoT-based sensor systems for monitoring trace elements in water quality. The findings reveal that while diverse sensor types—including electrochemical, optical, ion-selective, and multi-parameter systems—are being implemented, electrochemical and multi-parameter platforms dominate due to their versatility, affordability, and sensitivity. Field deployment emerges as the most common operational setting, reflecting the priority placed on real-world applicability, though calibration practices and performance validation are inconsistently reported across studies. Key challenges identified include biofouling, sensor drift, and communication interference, which collectively hinder long-term operational stability. Additionally, variations in cost, hardware platforms, and interface protocols underscore the heterogeneity of current solutions, which can complicate standardization and interoperability. The review also emphasizes that most studies focus on technical performance, with limited exploration of lifecycle costs, data management protocols, and large-scale deployment strategies.
To advance the field, future research should prioritize the development of antifouling technologies, standardized calibration and validation methods, and integrated data processing frameworks that leverage cloud and machine learning capabilities. Strengthening these areas will enhance system reliability, promote broader adoption, and ultimately support sustainable water resource management.
References
- WHO (2017). Guidelines for Drinking-water Quality: Fourth Edition Incorporating the First Addendum. World Health Organization.– Highlights the health risks of trace elements such as lead, arsenic, and mercury in drinking water.
- Miller, M., Kisiel, A., Cembrowska-Lech, D., Durlik, I., & Miller, T. (2023). IoT in Water Quality Monitoring—Are We Really Here? Sensors, 23(2), 960. [CrossRef]
- Dhruba, A. R., Alam, K. N., Khan, S., Saha, S., Khan, M. M., Baz, M., Masud, M., & AlZain, M. A. (2022). IoT-Based Water Quality Assessment System for Industrial Waste Water: Healthcare Perspective. Journal of Healthcare Engineering, 2022, Article ID 3769965.
- Li, J., Wei, Z., & Chen, S. (2020). A review of sensor-based monitoring systems for drinking water quality. Environmental Monitoring and Assessment, 192(6), 362.
- Singh, Y., & Walingo, T. (2024). Smart Water Quality Monitoring with IoT Wireless Sensor Networks. Sensors, 24(9), 2871. [CrossRef]
- Maswanganyi, Nyiko and Fumani, Nyiko and Khoza, Johannes Katlego and Thango, Bonginkosi and Lerato, Matshaka, Evaluating the Impact of Database and Data Warehouse Technologies on Organizational Performance: A Systematic Review (October 02, 2024). Available online: https://ssrn.com/abstract=4997368.
- Feroz, A.; Zo, H.; Chiravuri, A. Digital Transformation and Environmental Sustainability: A Review and Research Agenda. Sustainability 2021, 13, 1530. [Google Scholar] [CrossRef]
- da Fonseca, M.; Kovaleski, F.; Picinin, C.; Pedroso, B.; Rubbo, P. E-Health Practices and Technologies: A Systematic Review from 2014 to 2019. Healthcare 2021, 9, 1192. [Google Scholar] [CrossRef]
- Gumede, T. T., Chiworeka, J. M., Magoda, A. S., & Thango, B. (2024). Building Effective Social Media Strategies for Business: A Systematic Review. Preprints. [CrossRef]
- Kjorveziroski, V.; Filiposka, S.; Trajkovik, V. IoT Serverless Computing at the Edge: A Systematic Mapping Review. Computers 2021, 10, 130. [Google Scholar] [CrossRef]
- Hurbean, L.; Danaiata, D.; Militaru, F.; Dodea, A.; Negovan, A. Open Data Based Machine Learning Applications in Smart Cities: A Systematic Literature Review. Electronics 2021, 10, 2997. [Google Scholar] [CrossRef]
- Alkhateeb, A.; Catal, C.; Kar, G.; Mishra, A. Hybrid Blockchain Platforms for the Internet of Things (IoT): A Systematic Literature Review. Sensors 2022, 22, 1304. [Google Scholar] [CrossRef]
- Mudau, M. C., Moshapo, L. W., Monyela, T. M., & Thango, B. A. The Role of Manufacturing Operations in SMEs Performance: A Systematic Review. Preprints 2024, 2024100539. [CrossRef]
- Laiton-Bonadiez, C.; Branch-Bedoya, J.; Zapata-Cortes, J.; Paipa-Sanabria, E.; Arango-Serna, M. Industry 4.0 Technologies Applied to the Rail Transportation Industry: A Systematic Review. Sensors 2022, 22(7), 2491. [CrossRef]
- Dashkevych, O.; Portnov, B. Criteria for Smart City Identification: A Systematic Literature Review. Sustainability 2022, 14, 4448. [Google Scholar] [CrossRef]
- Khanyi, M., Xaba, S., Mlotshwa, N., Thango, B., & Matshaka, L. The Role of Data Networks and APIs in Enhancing Operational Efficiency in SME: A Systematic Review. Preprints 2024, 2024100848.
- Schmidt, I.; Morris, W.; Thomas, A.; Manning, L. Smart Systems: The Role of Advanced Technologies in Improving Business Quality, Performance and Supply Chain Integration. Standards 2022, 2, 276–293. [Google Scholar] [CrossRef]
- Rejeb, A.; Appolloni, A. The Nexus of Industry 4.0 and Circular Procurement: A Systematic Literature Review and Research Agenda. Sustainability 2022, 14(23), 15633. [CrossRef]
- Skosana, S., Mlambo, S., Madiope, T., & Thango, B. Evaluating Wireless Network Technologies (3G, 4G, 5G) and Their Infrastructure: A Systematic Review. Preprints 2024, 2024101331.
- Barbuto, V.; Savaglio, C.; Chen, M.; Fortino, G. Disclosing Edge Intelligence: A Systematic Meta-Survey. Big Data Cogn. Comput. 2023, 7, 44. [Google Scholar] [CrossRef]
- Marinagi, C.; Reklitis, P.; Trivellas, P.; Sakas, D. The Impact of Industry 4.0 Technologies on Key Performance Indicators for a Resilient Supply Chain 4.0. Sustainability 2023, 15, 5185. [Google Scholar] [CrossRef]
- Abdelmajeed, A.; Albert-Saiz, M.; Rastogi, A.; Juszczak, R. Cloud-Based Remote Sensing for Wetland Monitoring—A Review. Remote Sens. 2023, 15, 1660. [Google Scholar] [CrossRef]
- Mtjilibe, Tshepang and Rameetse, Emmanuel and Mgwenya, Nkosinathi and Thango, Bonginkosi, Exploring the Challenges and Opportunities of Social Media for Organizational Engagement in SMEs: A Comprehensive Systematic Review (July 06, 2024). Available online: https://ssrn.com/abstract=4998542 or http://dx.doi.org/10.2139/ssrn.4998542. [CrossRef]
- Dong, D.; Zhang, J. Discrimination Methods of Mine Inrush Water Source. Water 2023, 15, 3237. [Google Scholar] [CrossRef]
- Thobejane, L.T.; Thango, B.A. Partial Discharge Source Classification in Power Transformers: A Systematic Literature Review. Appl. Sci. 2024, 14, 6097. [Google Scholar] [CrossRef]
- Alshahrani, S. Industry 4.0 in “Major Emerging Markets”: A Systematic Literature Review of Benefits, Use, Challenges, and Mitigation Strategies in Supply Chain Management. Sustainability 2023, 15, 14811. [Google Scholar] [CrossRef]
- Nguyen, H.; Danh, H.; Ma, Q.; Mesicek, J.; Hajnys, J.; Pagac, M.; Petru, J. A Bibliometrics Analysis of Medical Internet of Things for Modern Healthcare. Electronics 2023, 12, 4586. [Google Scholar] [CrossRef]
- Thango, B. A., & Obokoh, L. (2024). Techno-Economic Analysis of Hybrid Renewable Energy Systems for Power Interruptions: A Systematic Review. Eng, 5(3), 2108-2156. [CrossRef]
- Kashpruk, N.; Piskor-Ignatowicz, C.; Baranowski, J. Time Series Prediction in Industry 4.0: A Comprehensive Review and Prospects for Future Advancements. Appl. Sci. 2023, 13(22), 12374. [CrossRef]
Figure 6.
Proposed PRISMA Flowchart.
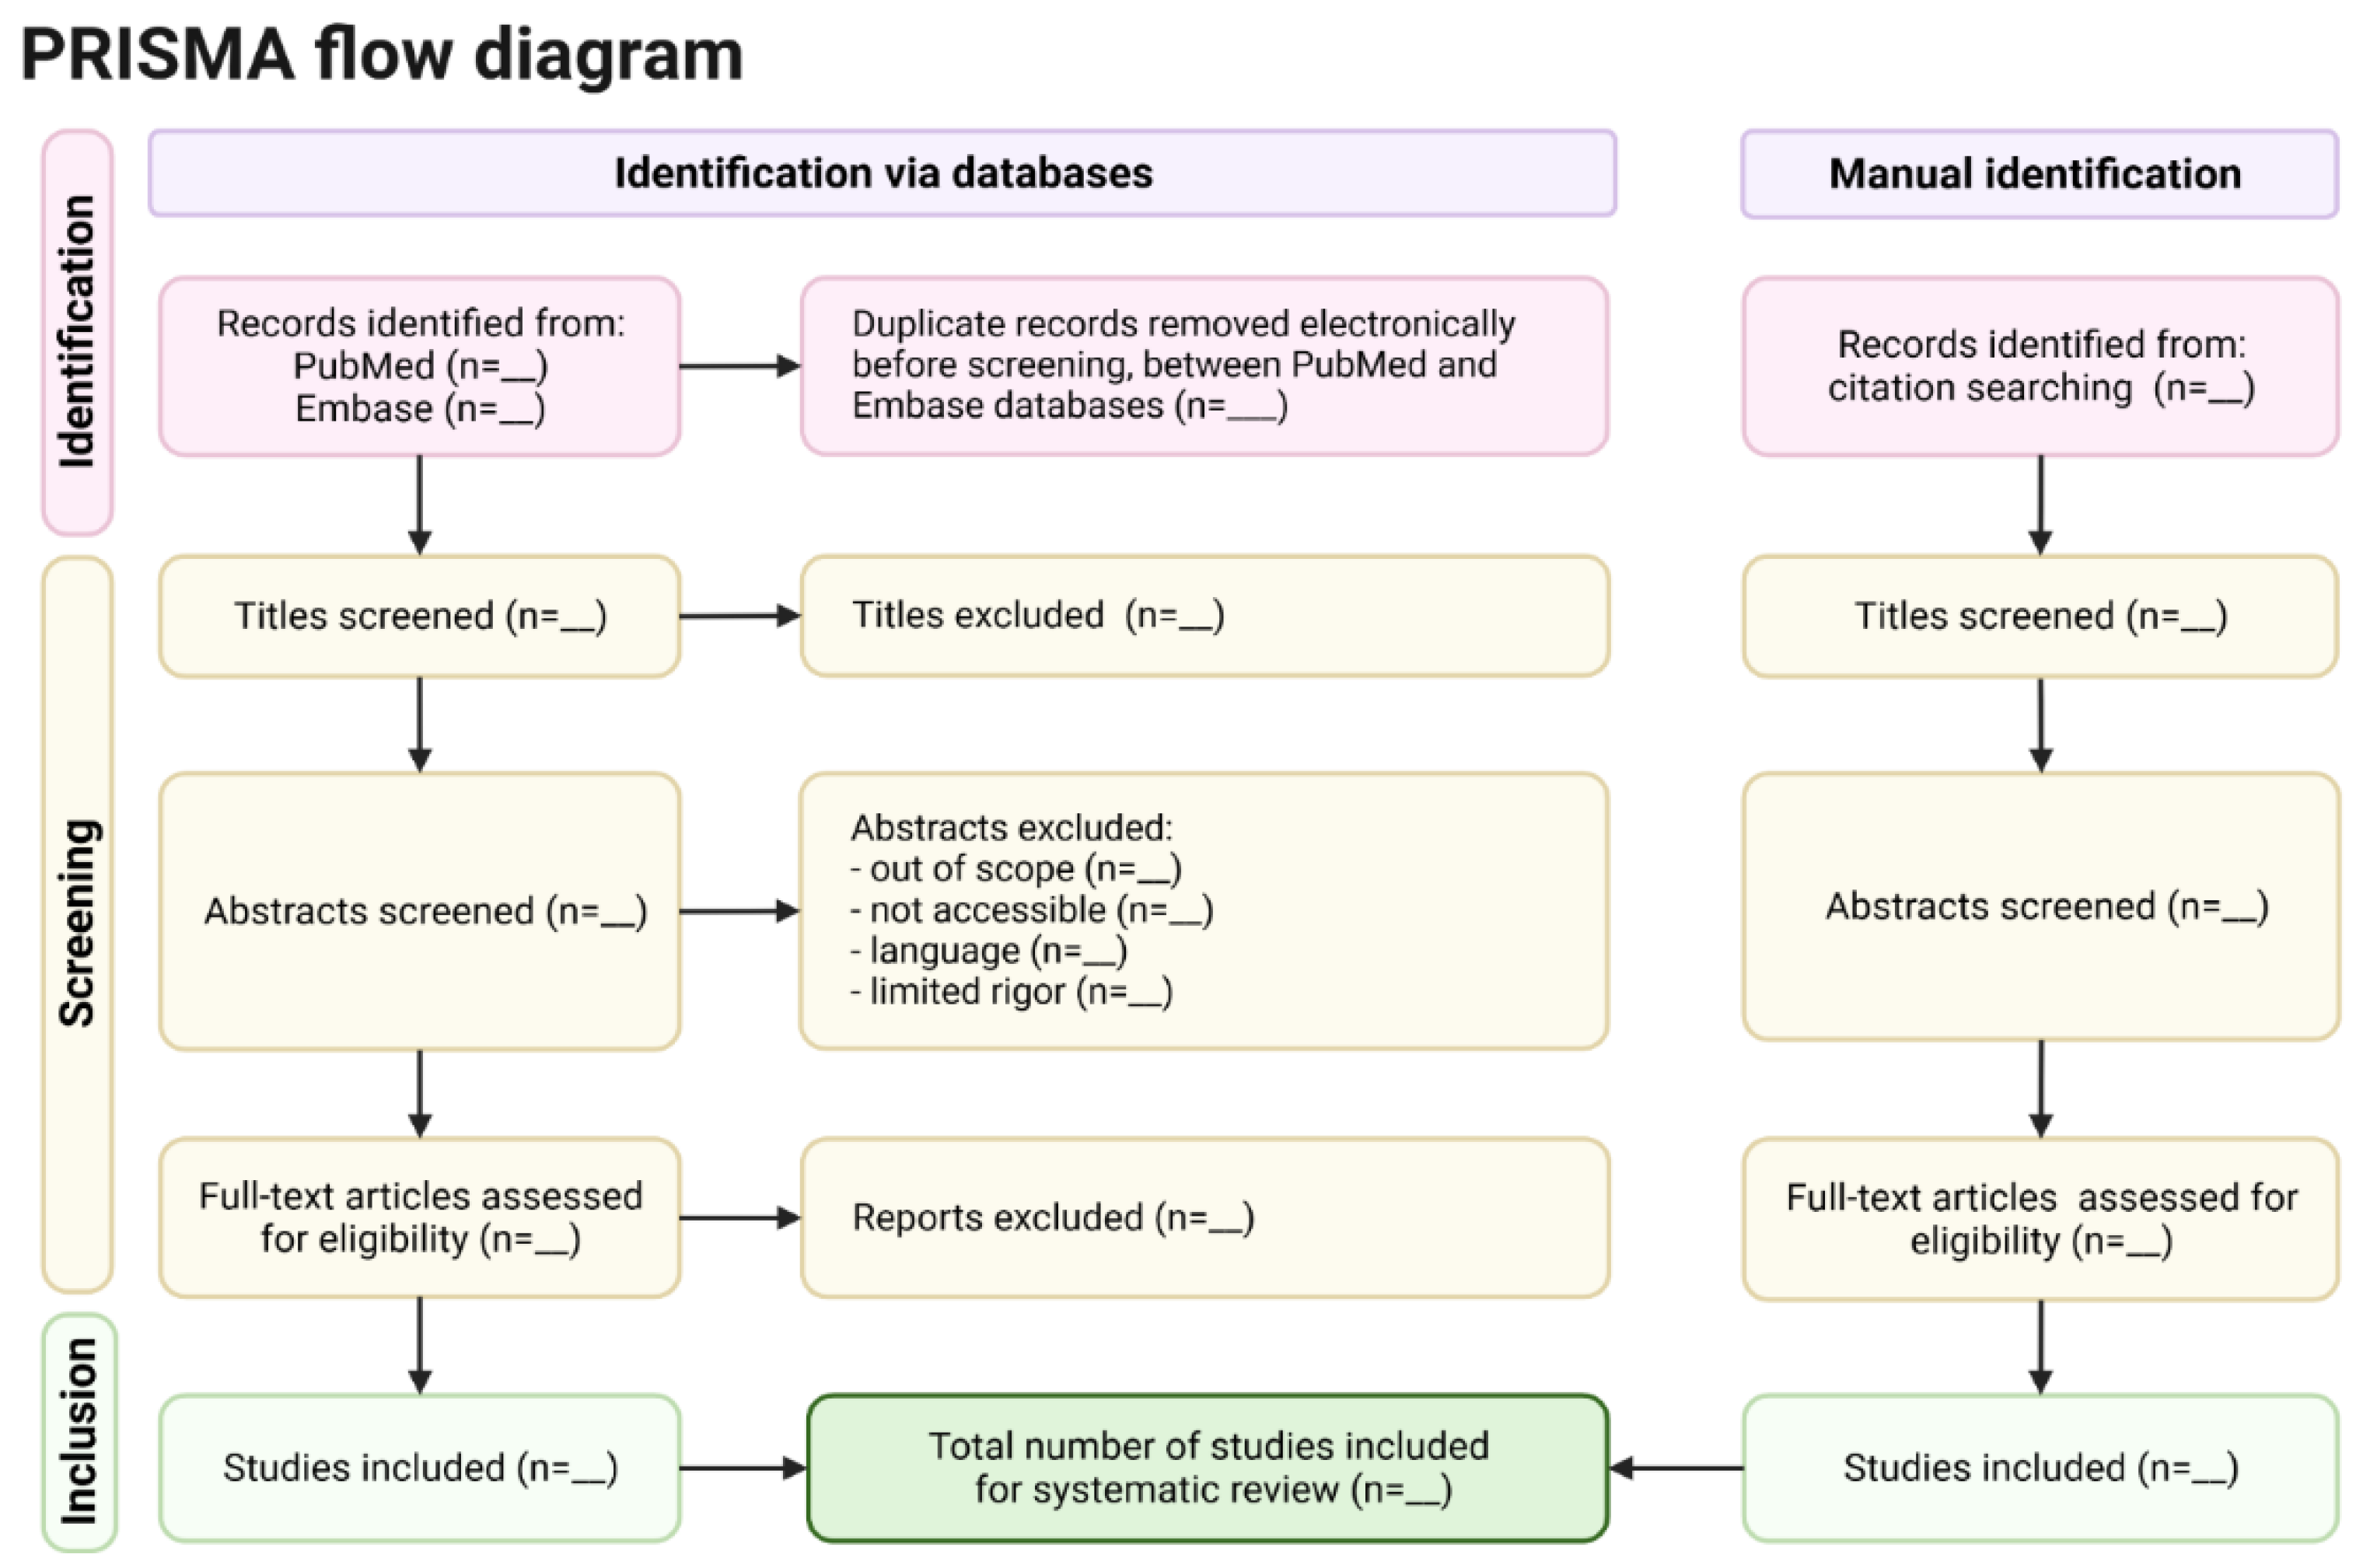
Figure 7.
Research Distribution by Produced Research Papers.
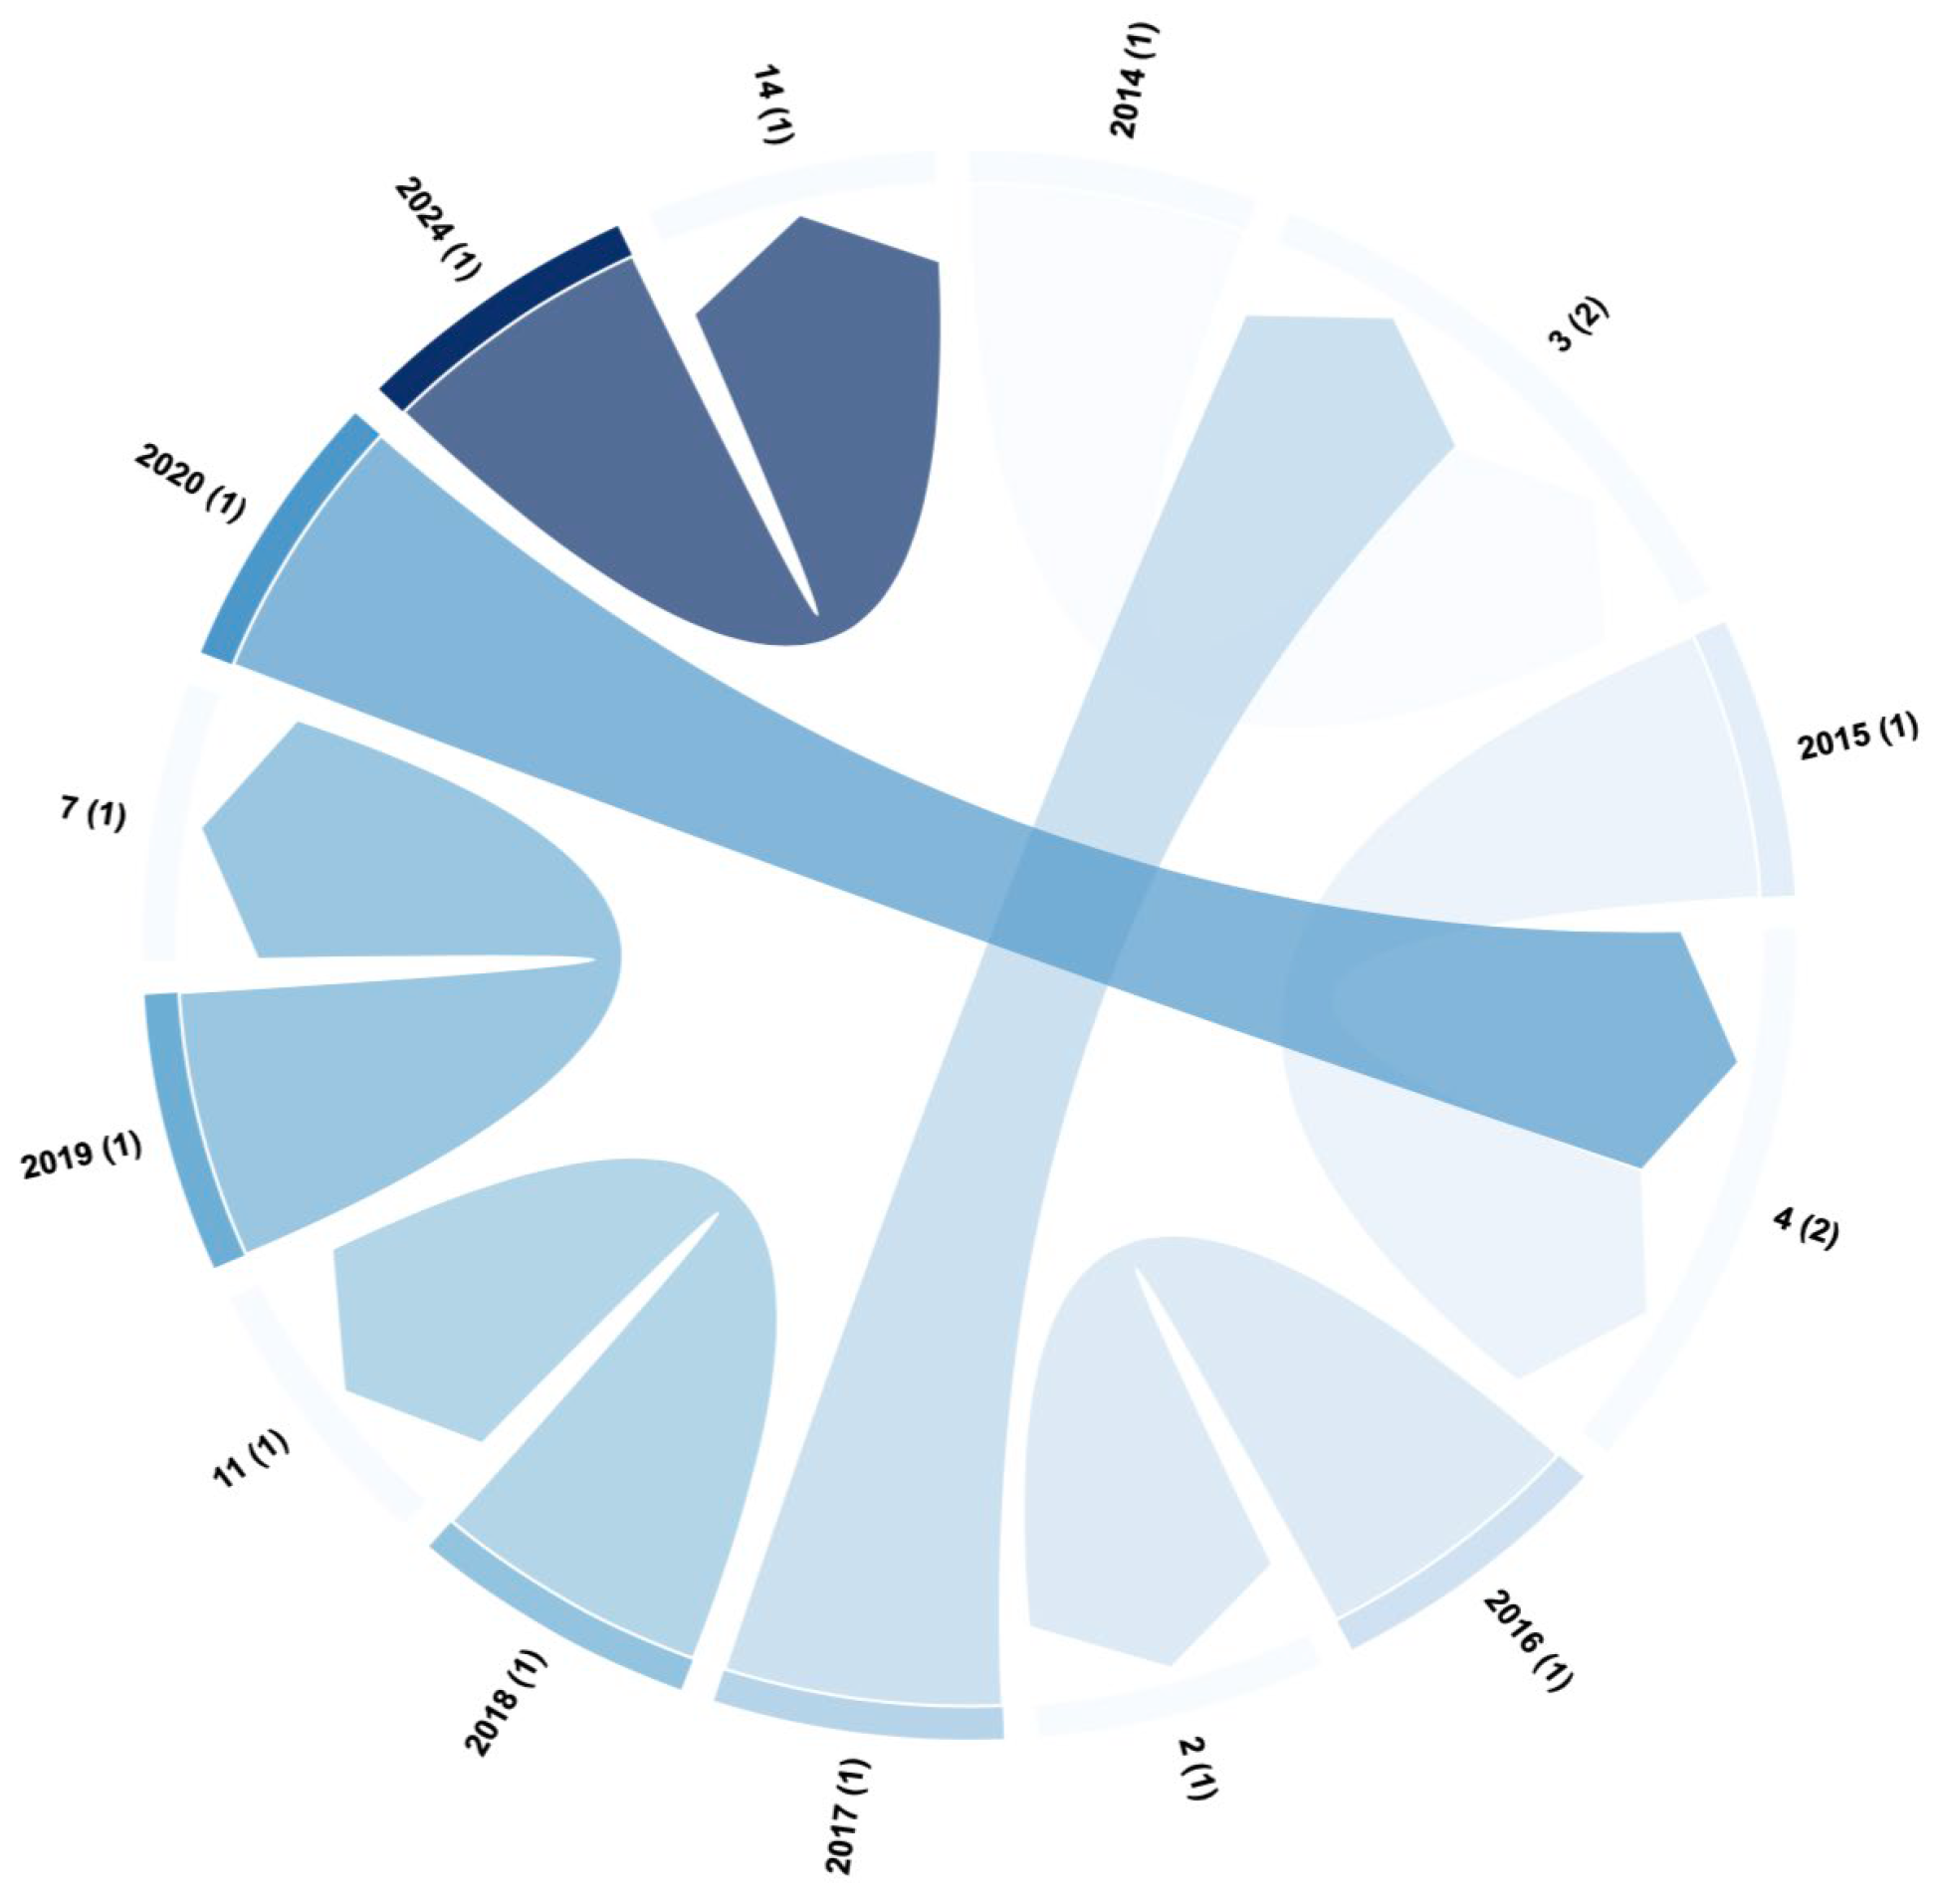
Figure 8.
Distribution of IoT sensor types used for monitoring trace elements in water quality systems.
Figure 8.
Distribution of IoT sensor types used for monitoring trace elements in water quality systems.
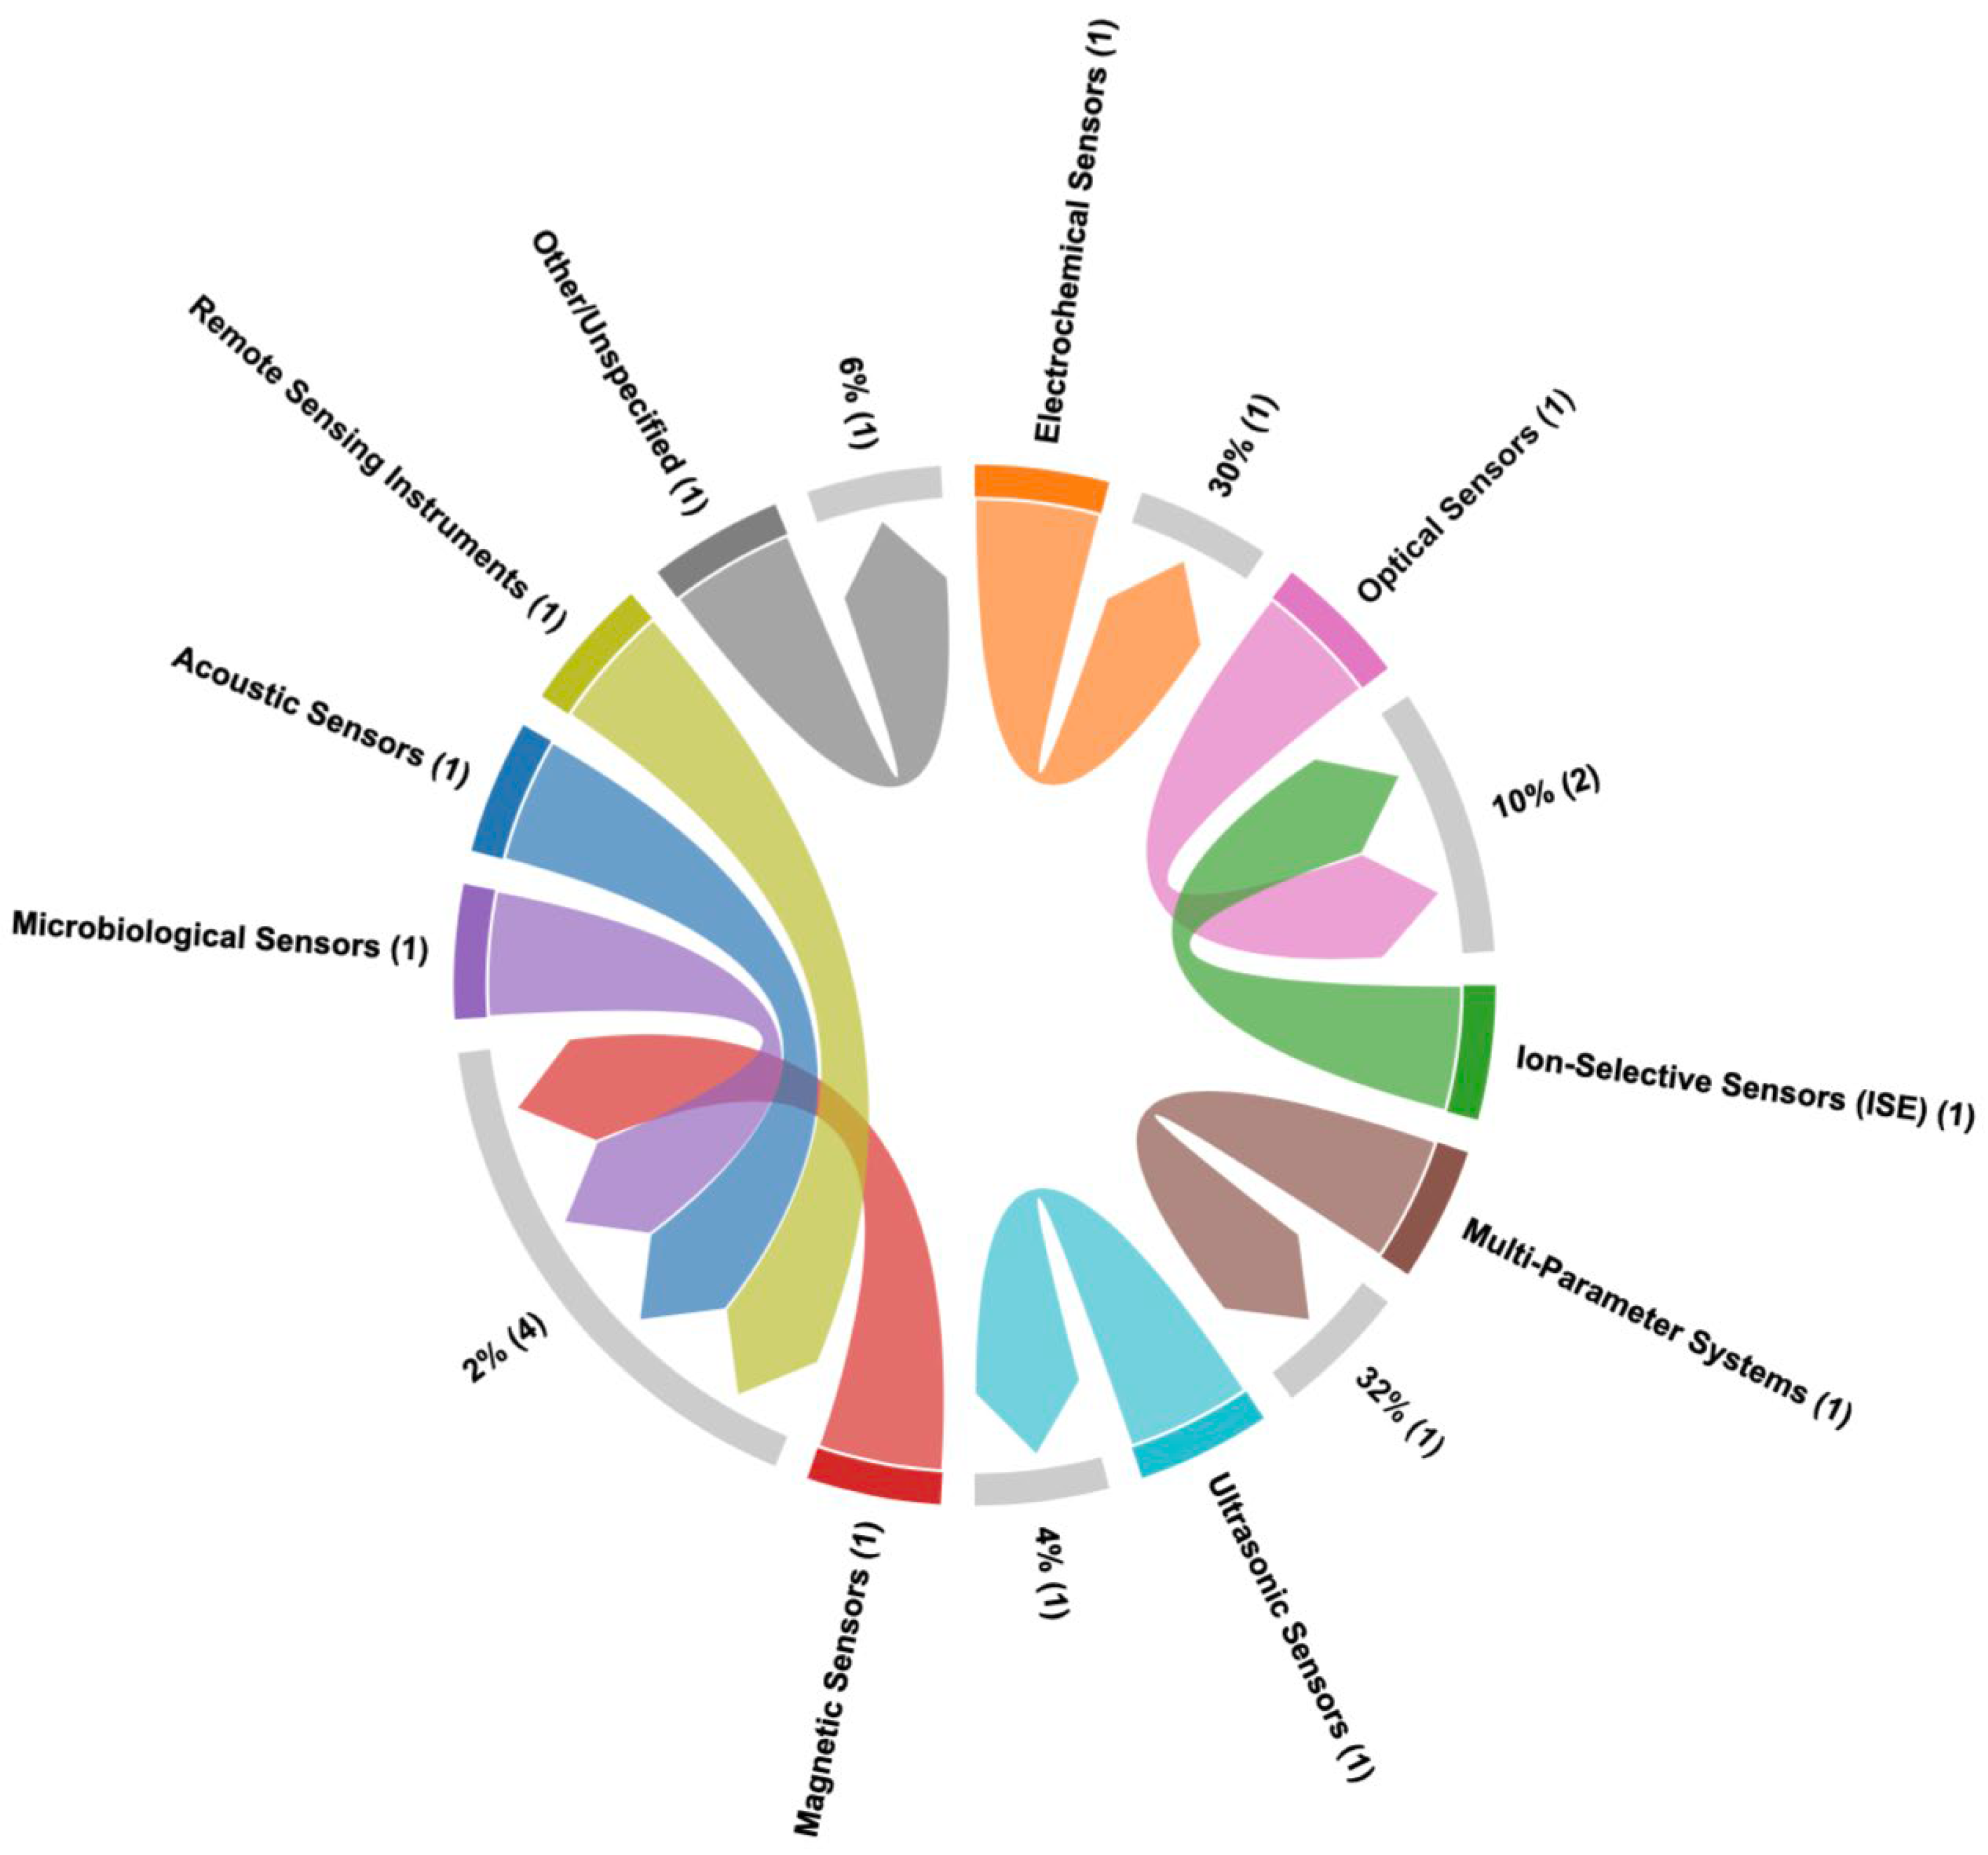
Figure 9.
Contaminants & Parameters from Reviewed Studies.
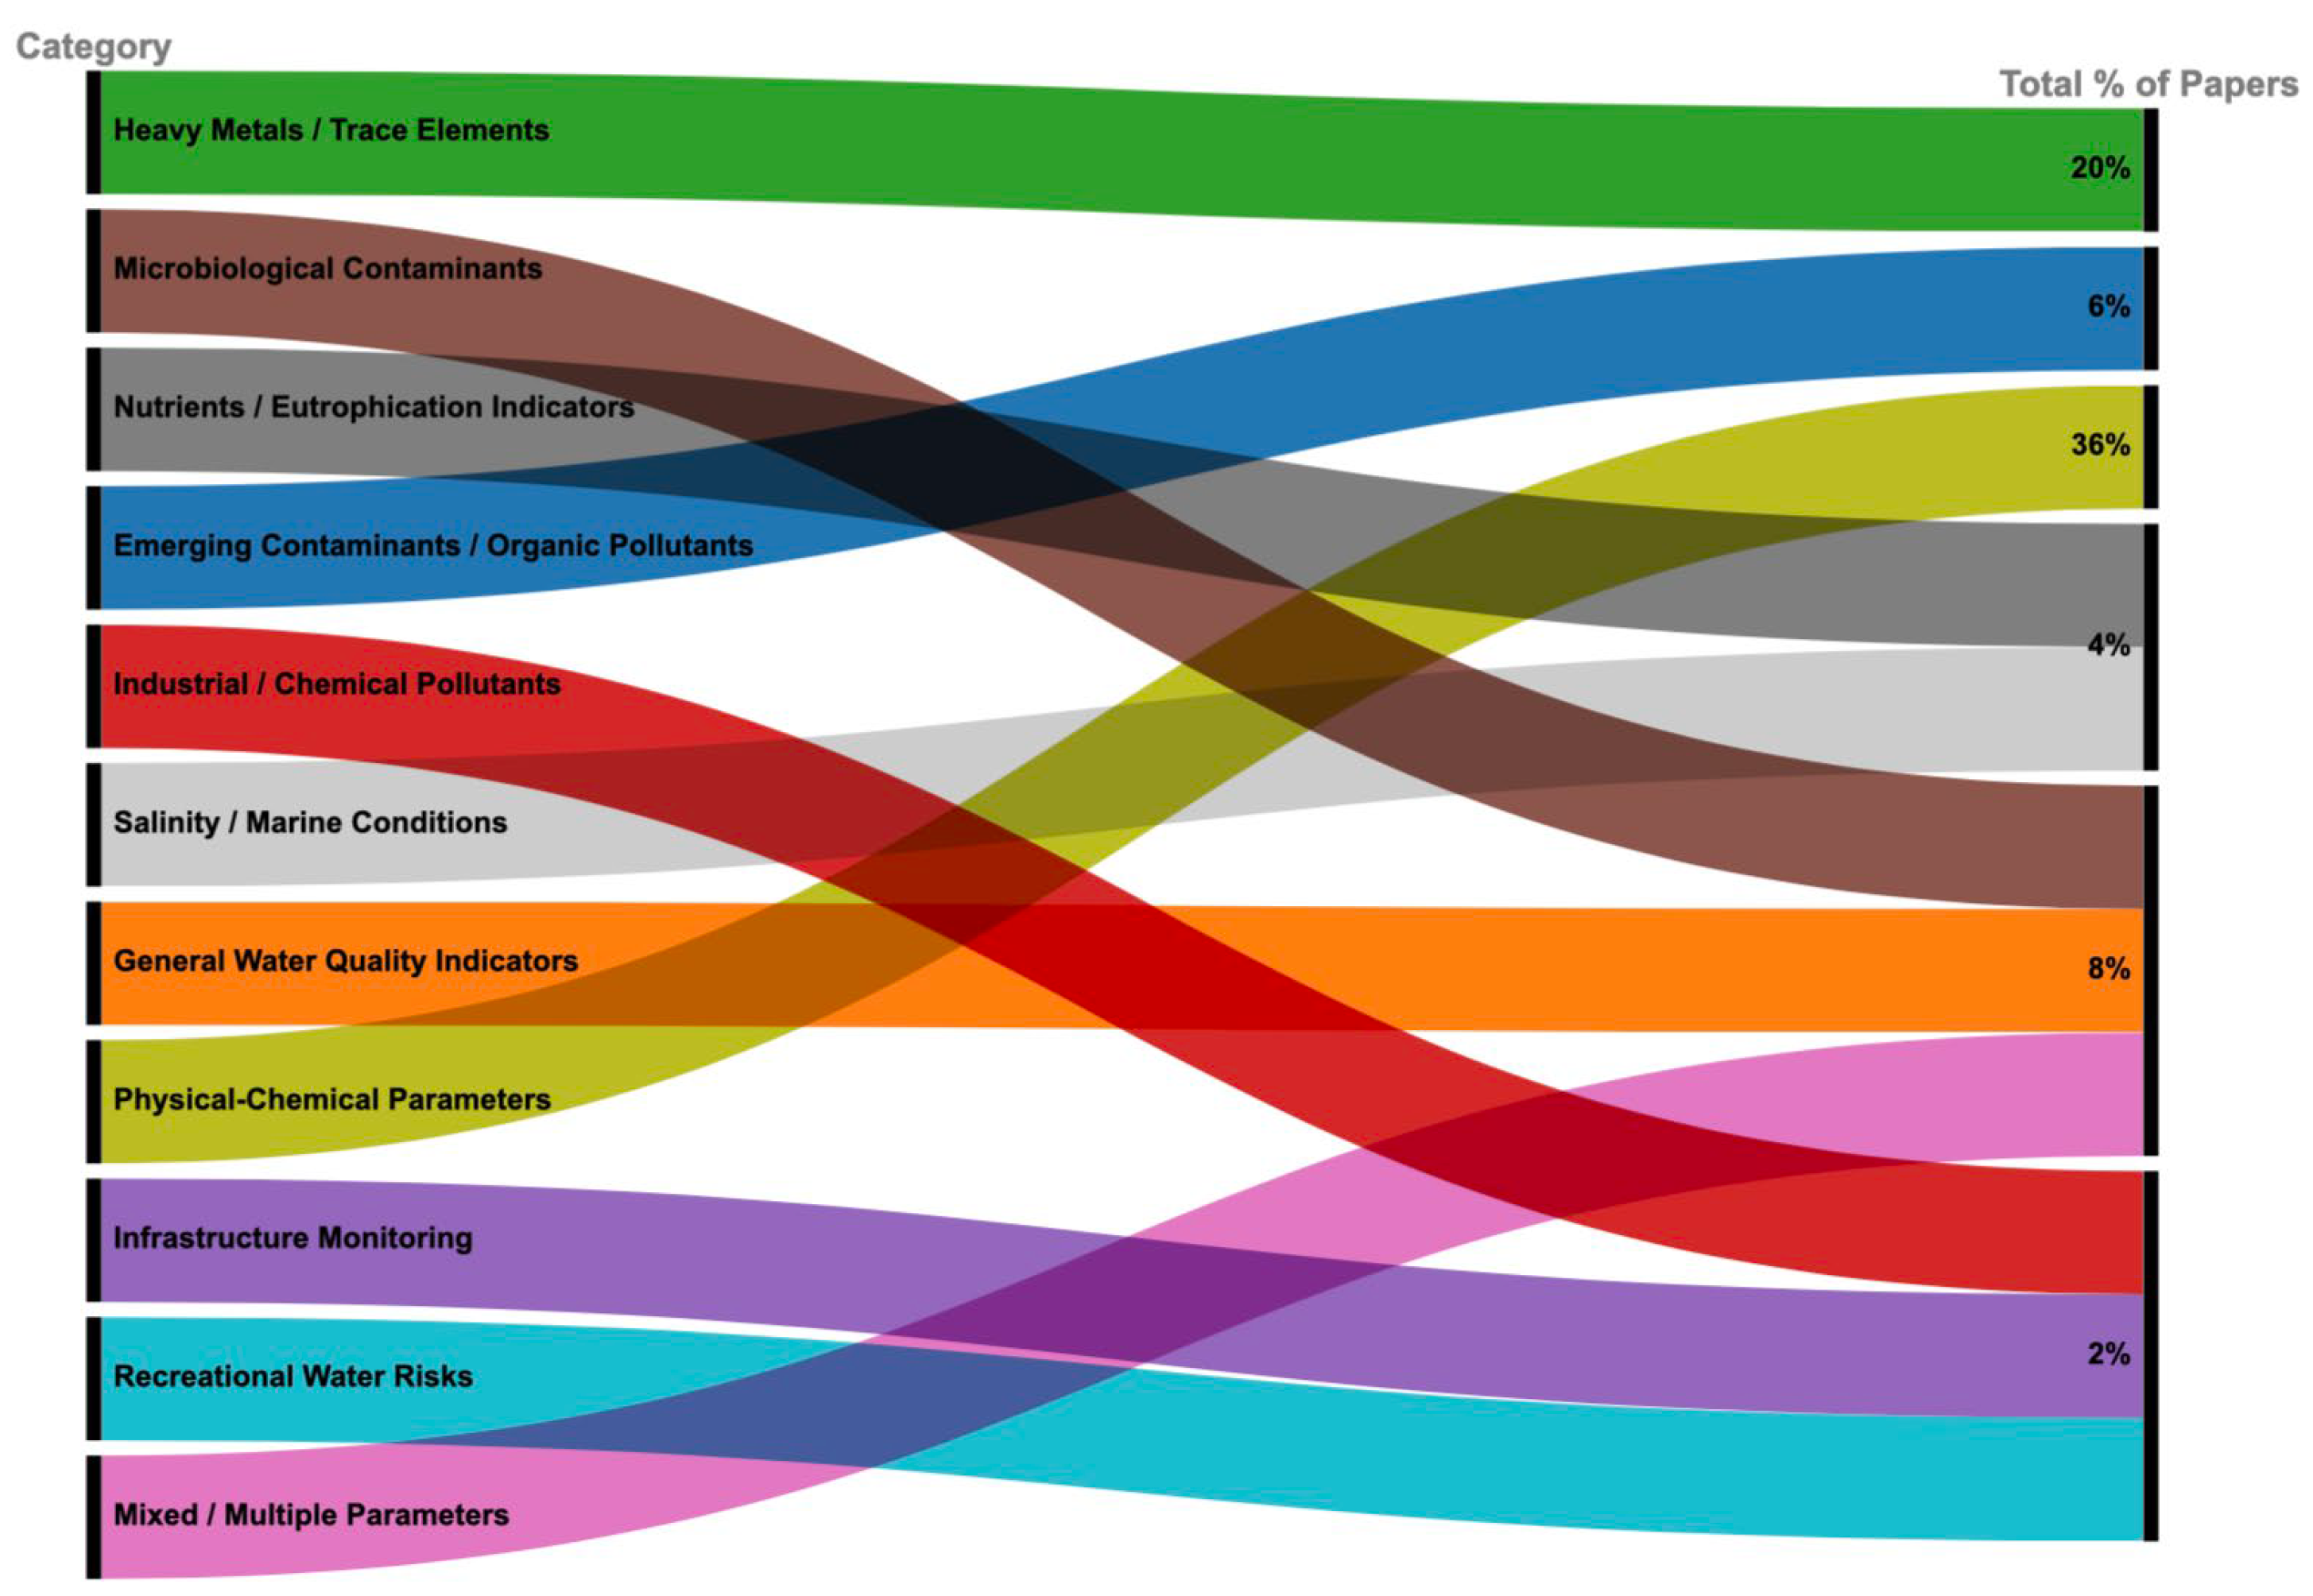
Figure 10.
Sensor performance metrics from reviewed literature.
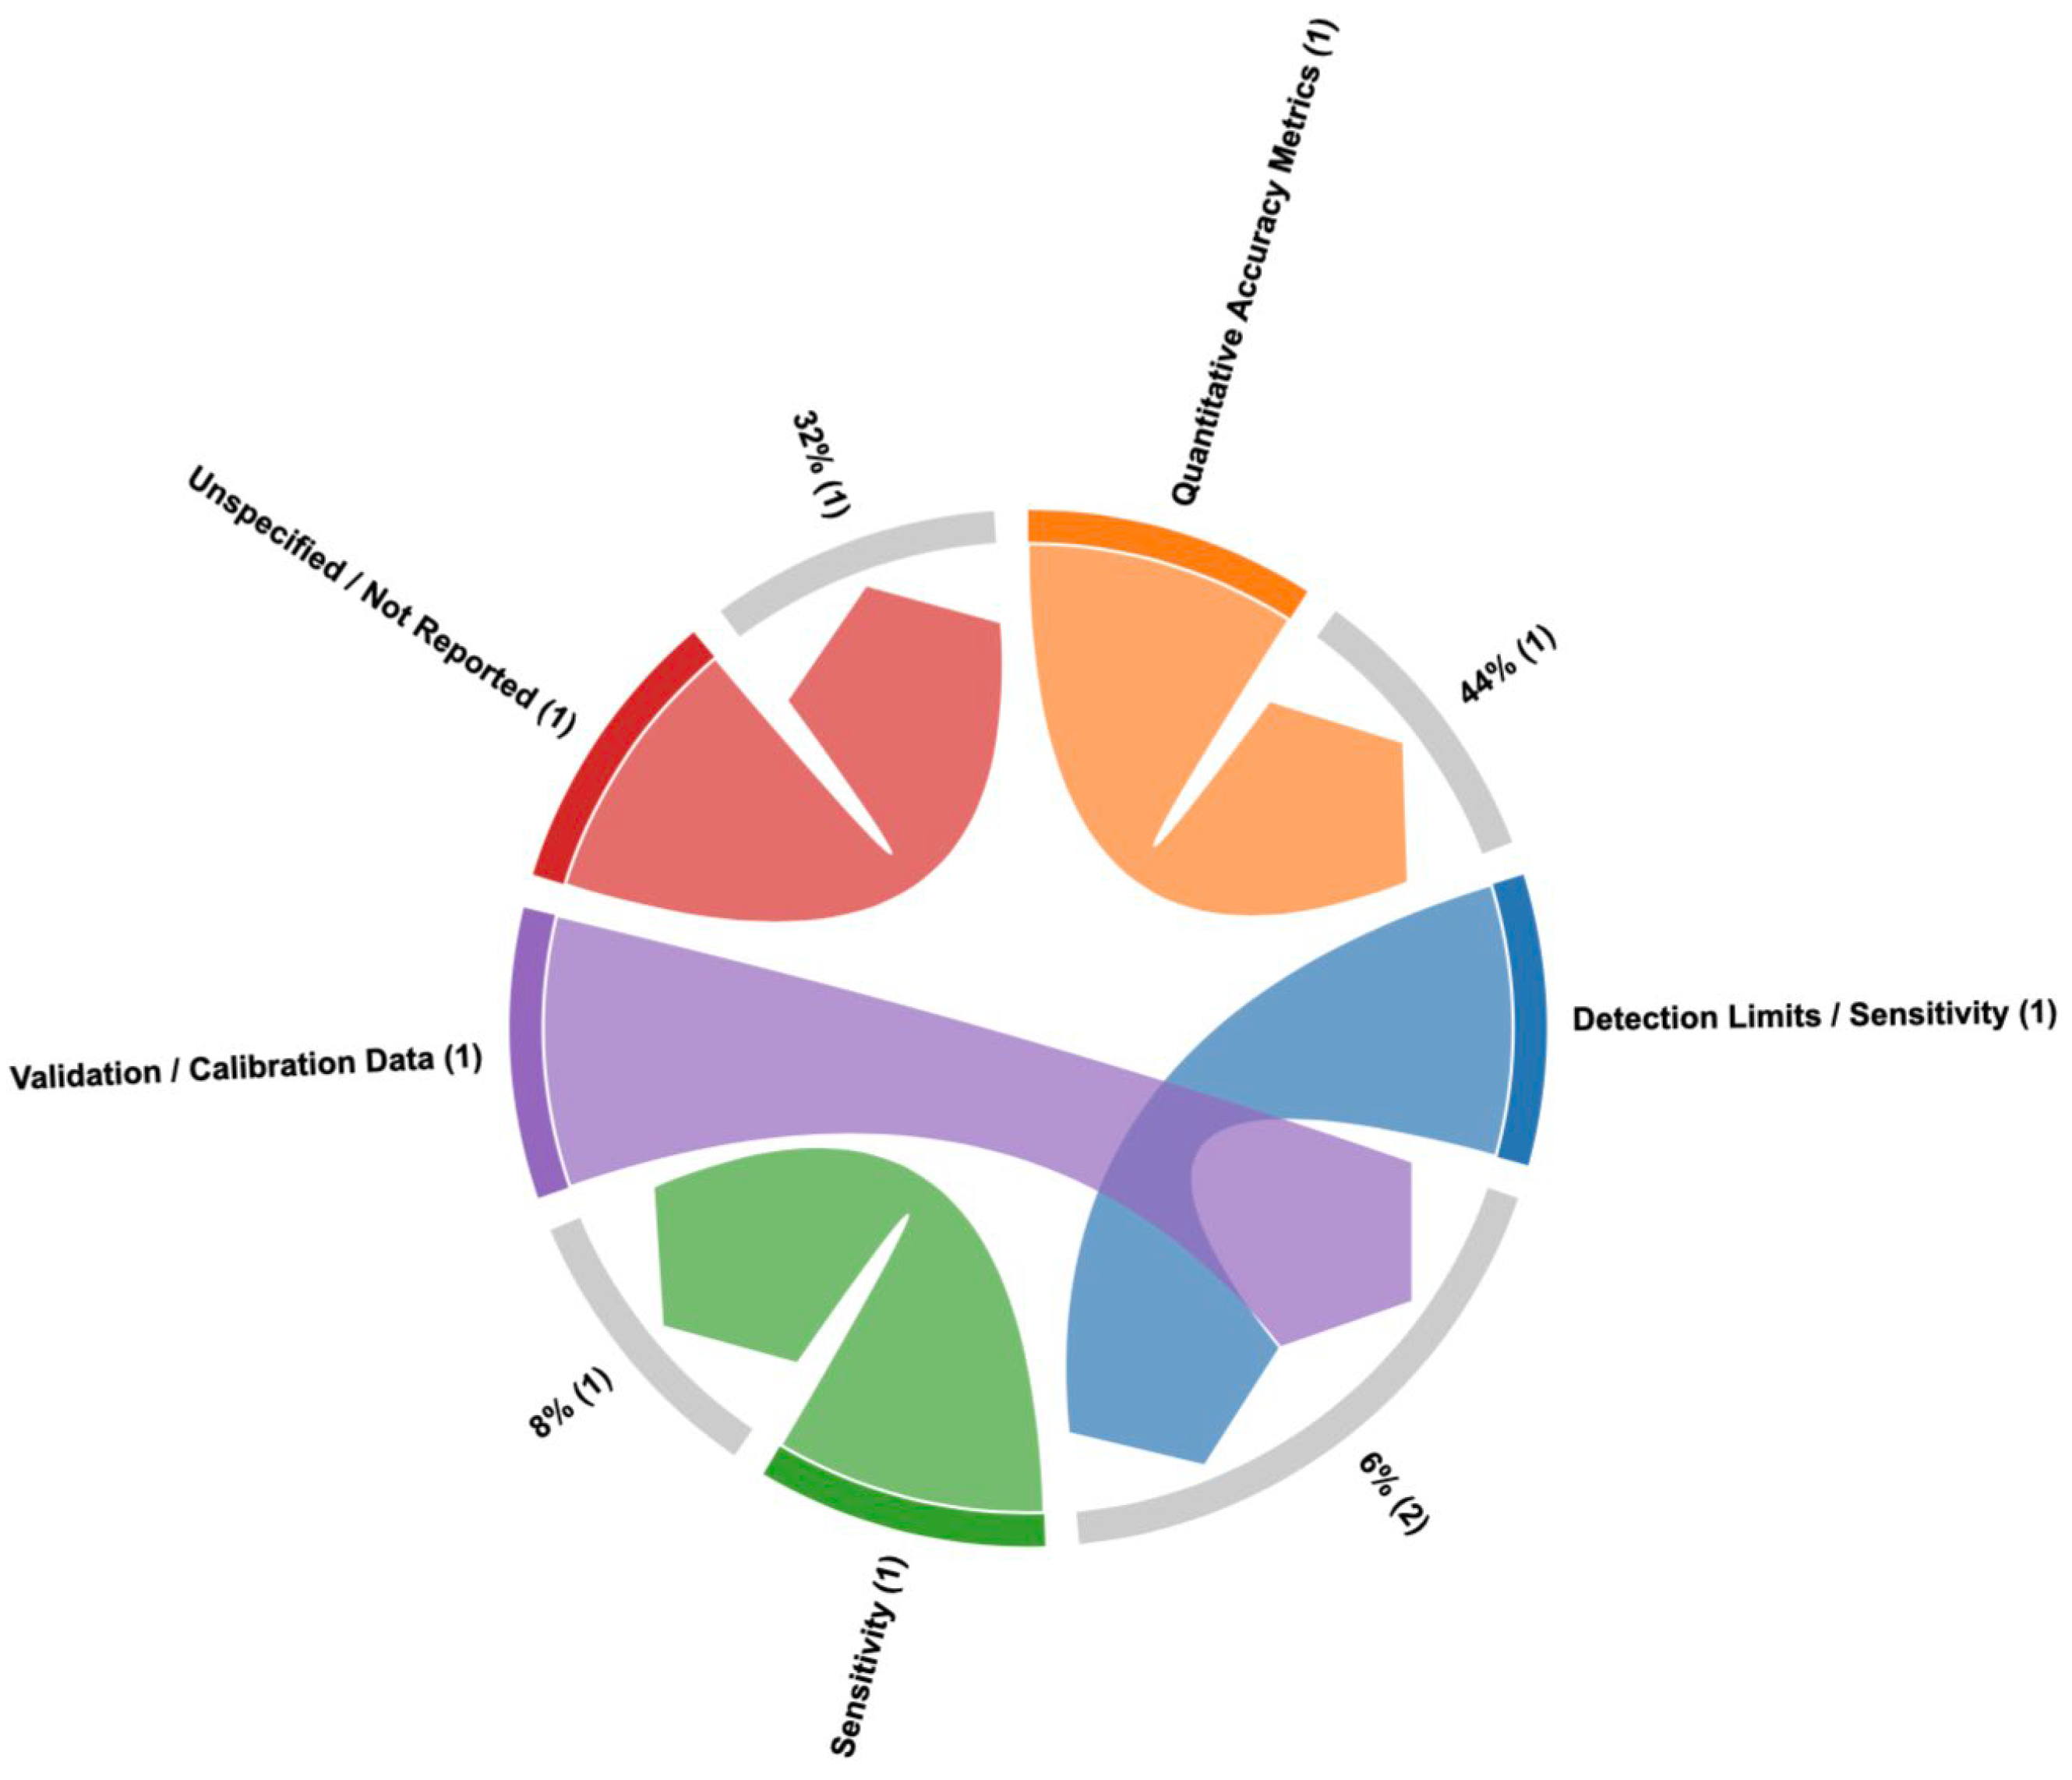
Figure 11.
Cost and availability of IoT sensor systems from reviewed literature.
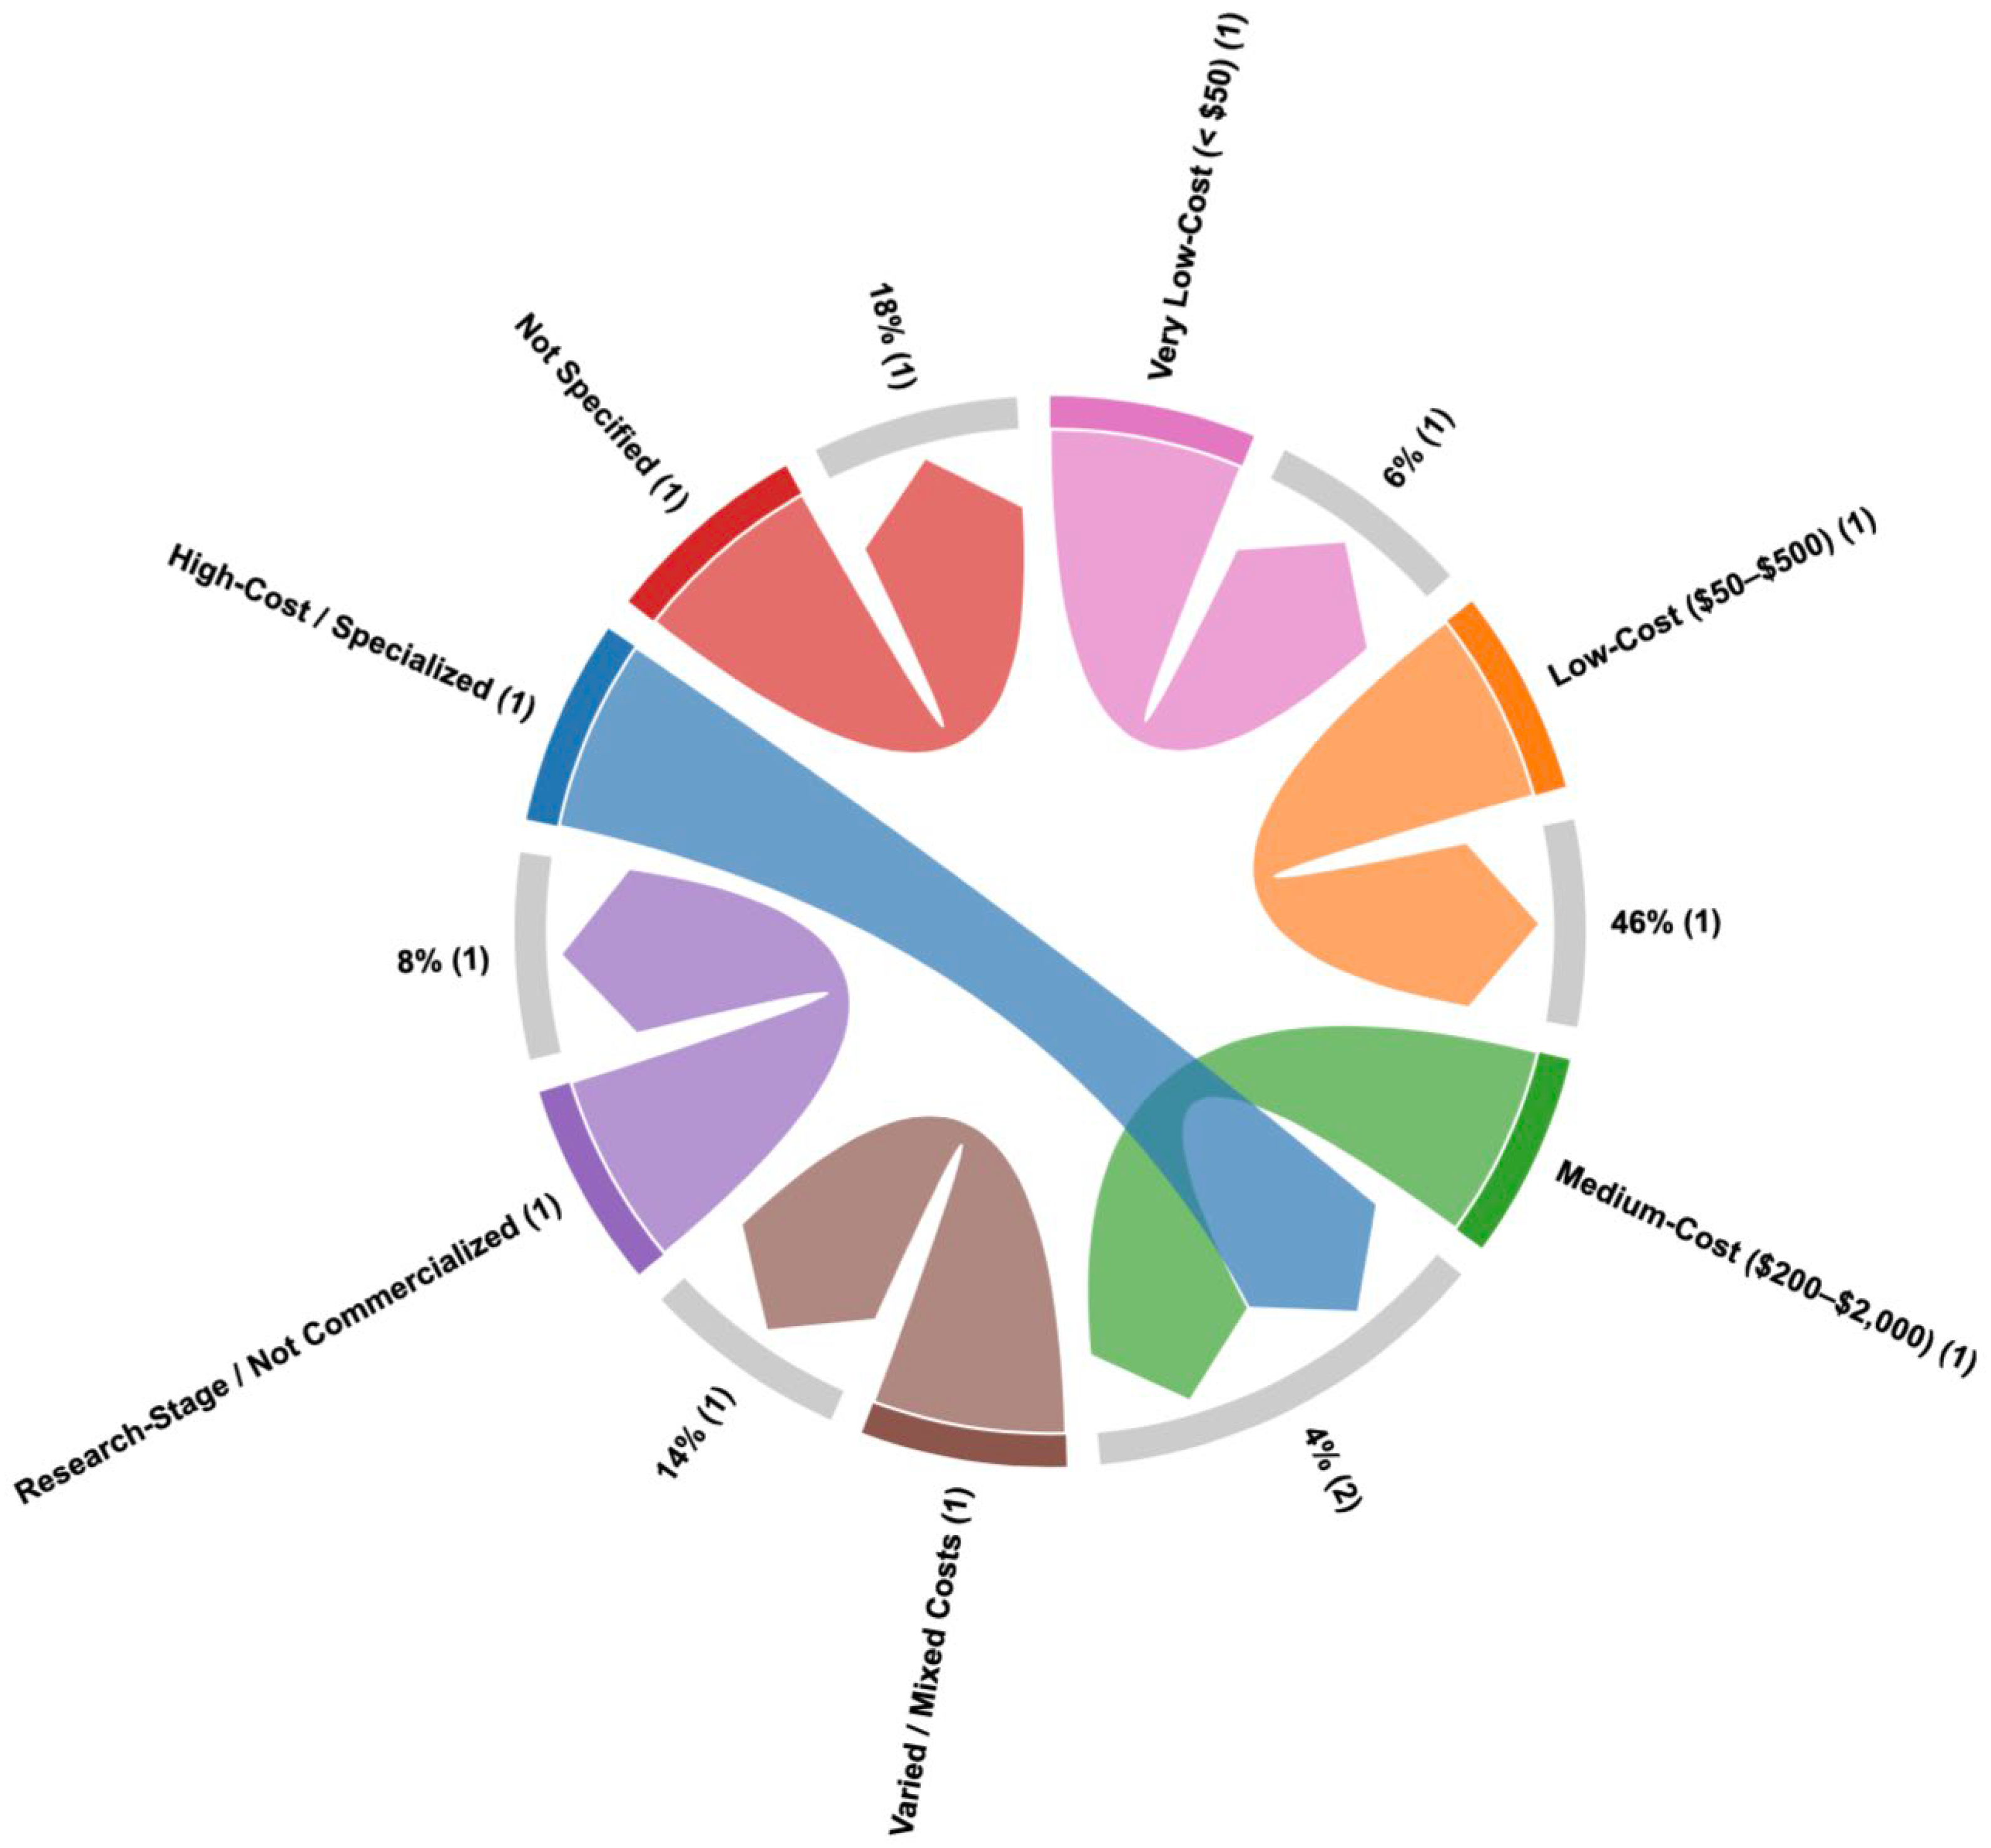
Figure 12.
Sensor interface and communication protocols from reviewed literature.
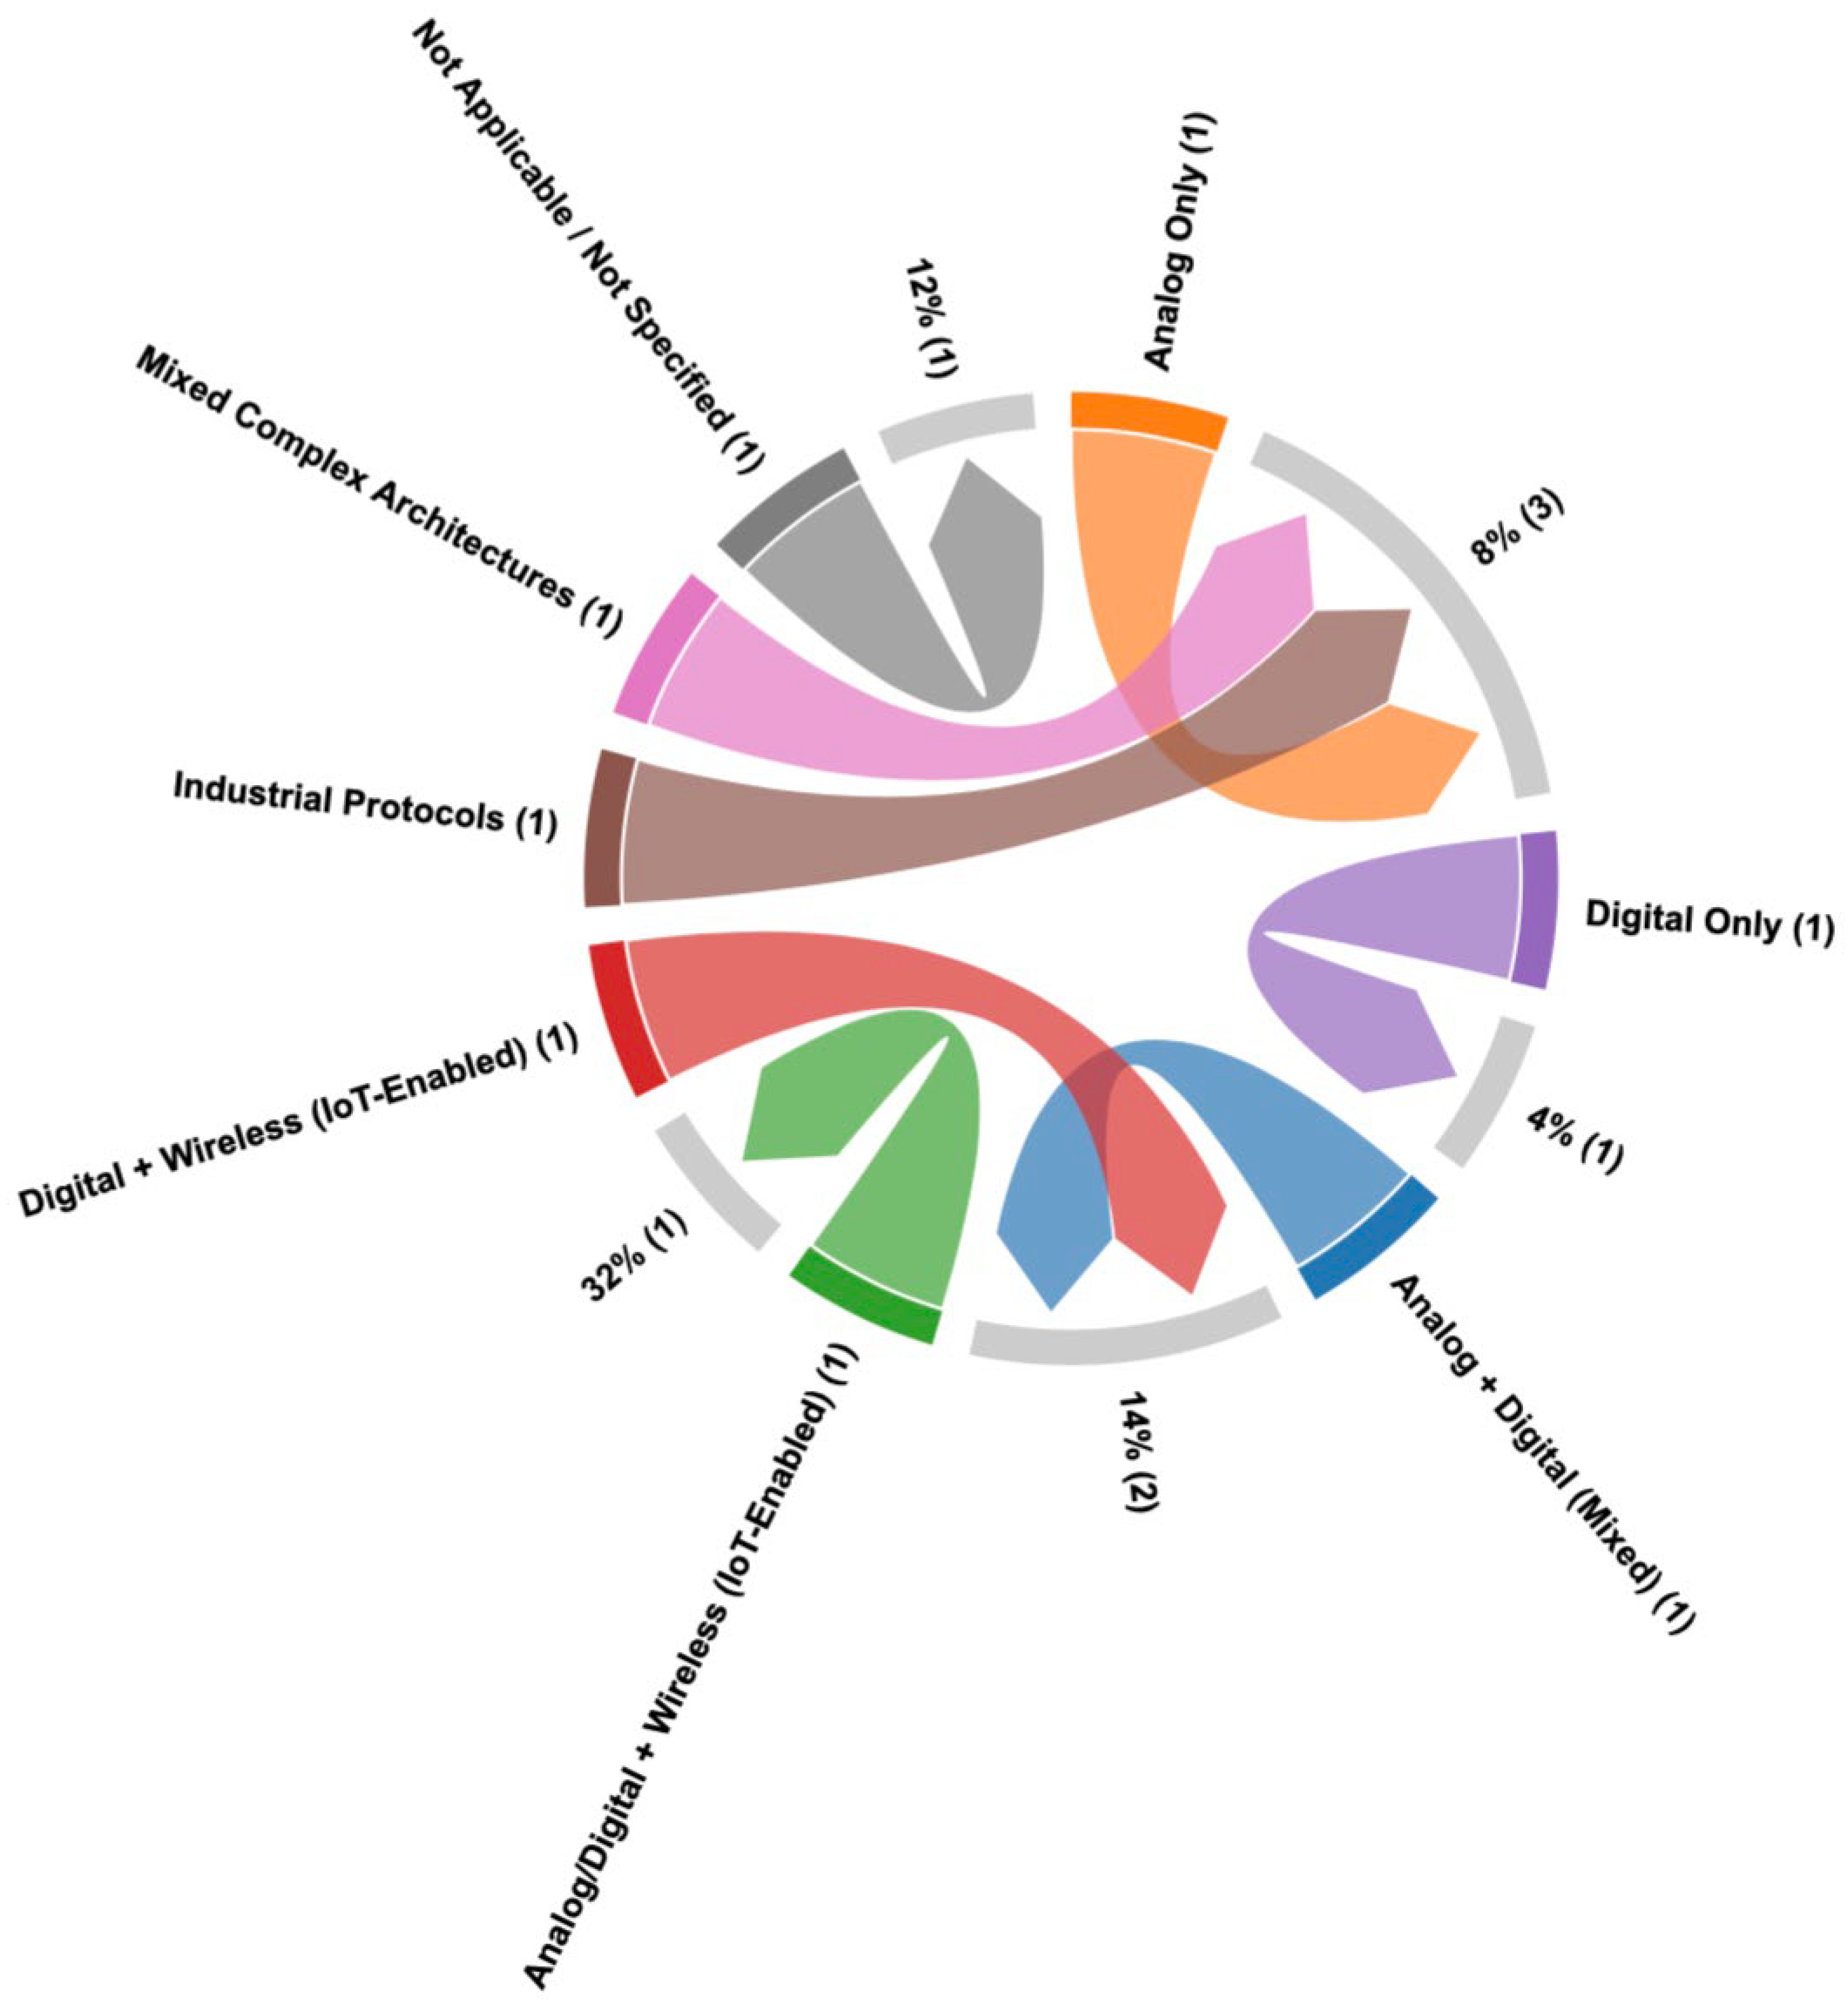
Figure 13.
Microcontroller and hardware platforms used in IoT-based water quality monitoring studies.
Figure 13.
Microcontroller and hardware platforms used in IoT-based water quality monitoring studies.
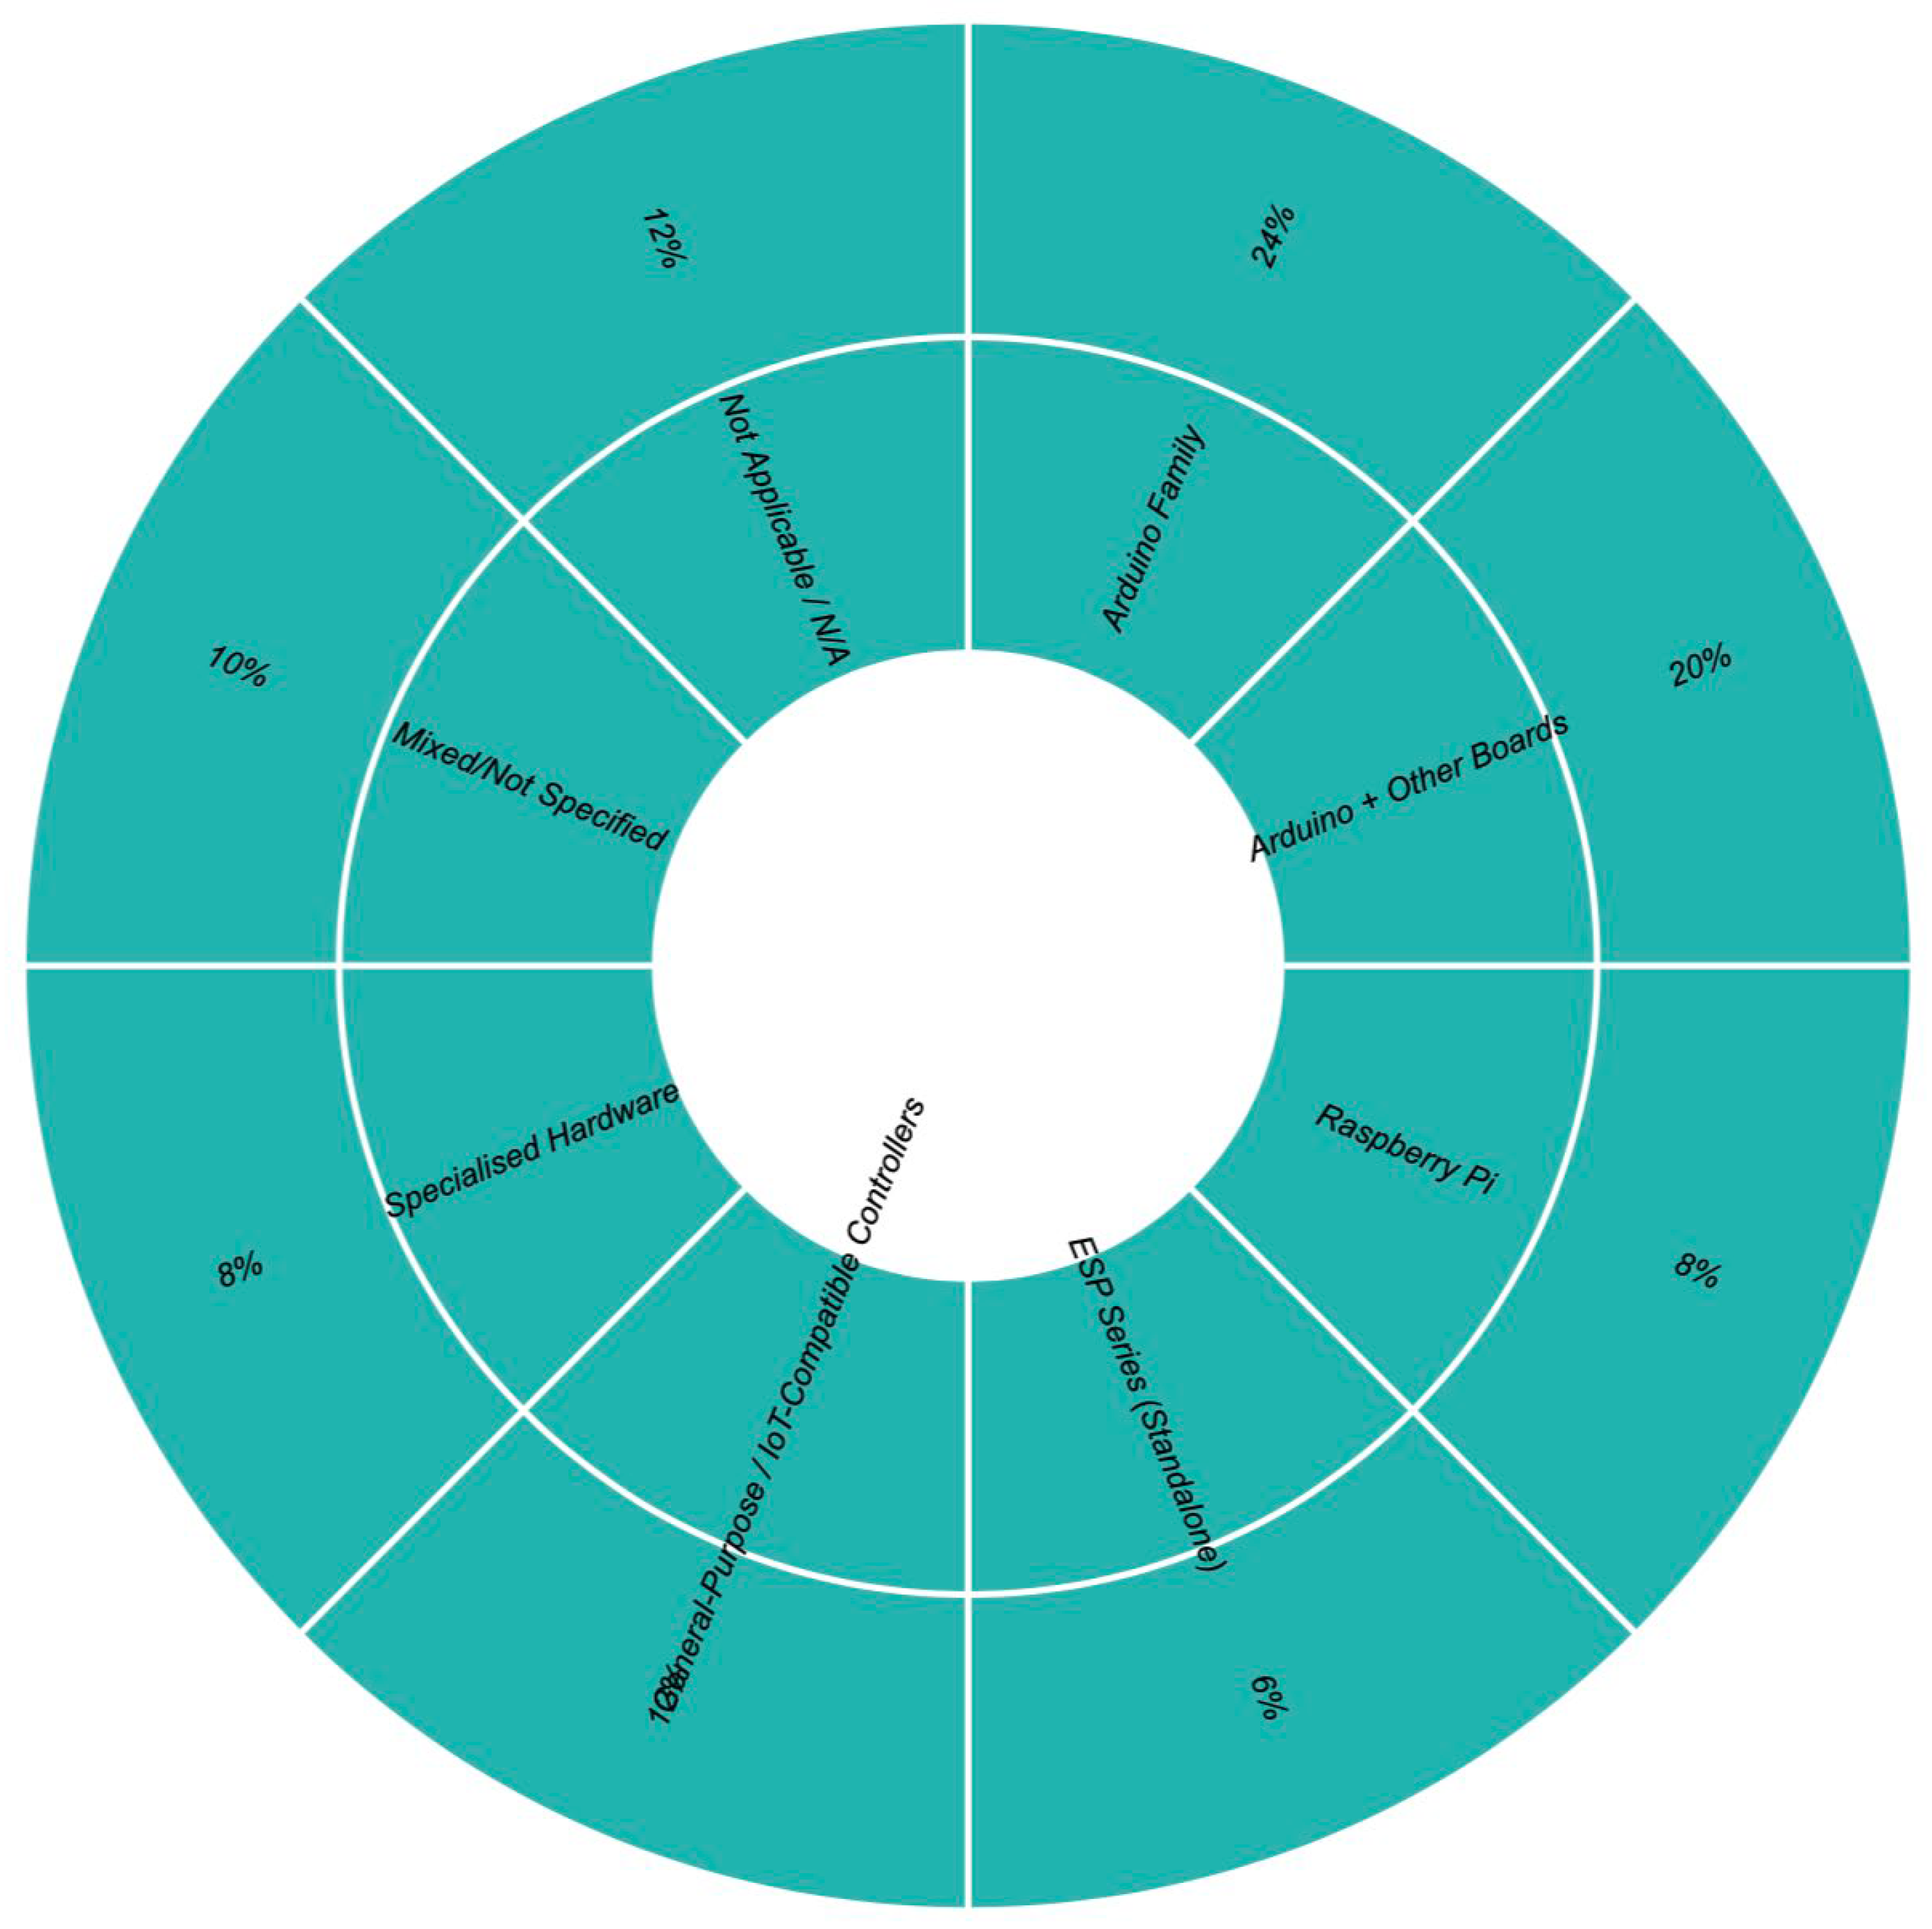
Figure 14.
Deployment environments for IoT-based water quality monitoring systems in the reviewed literature.
Figure 14.
Deployment environments for IoT-based water quality monitoring systems in the reviewed literature.
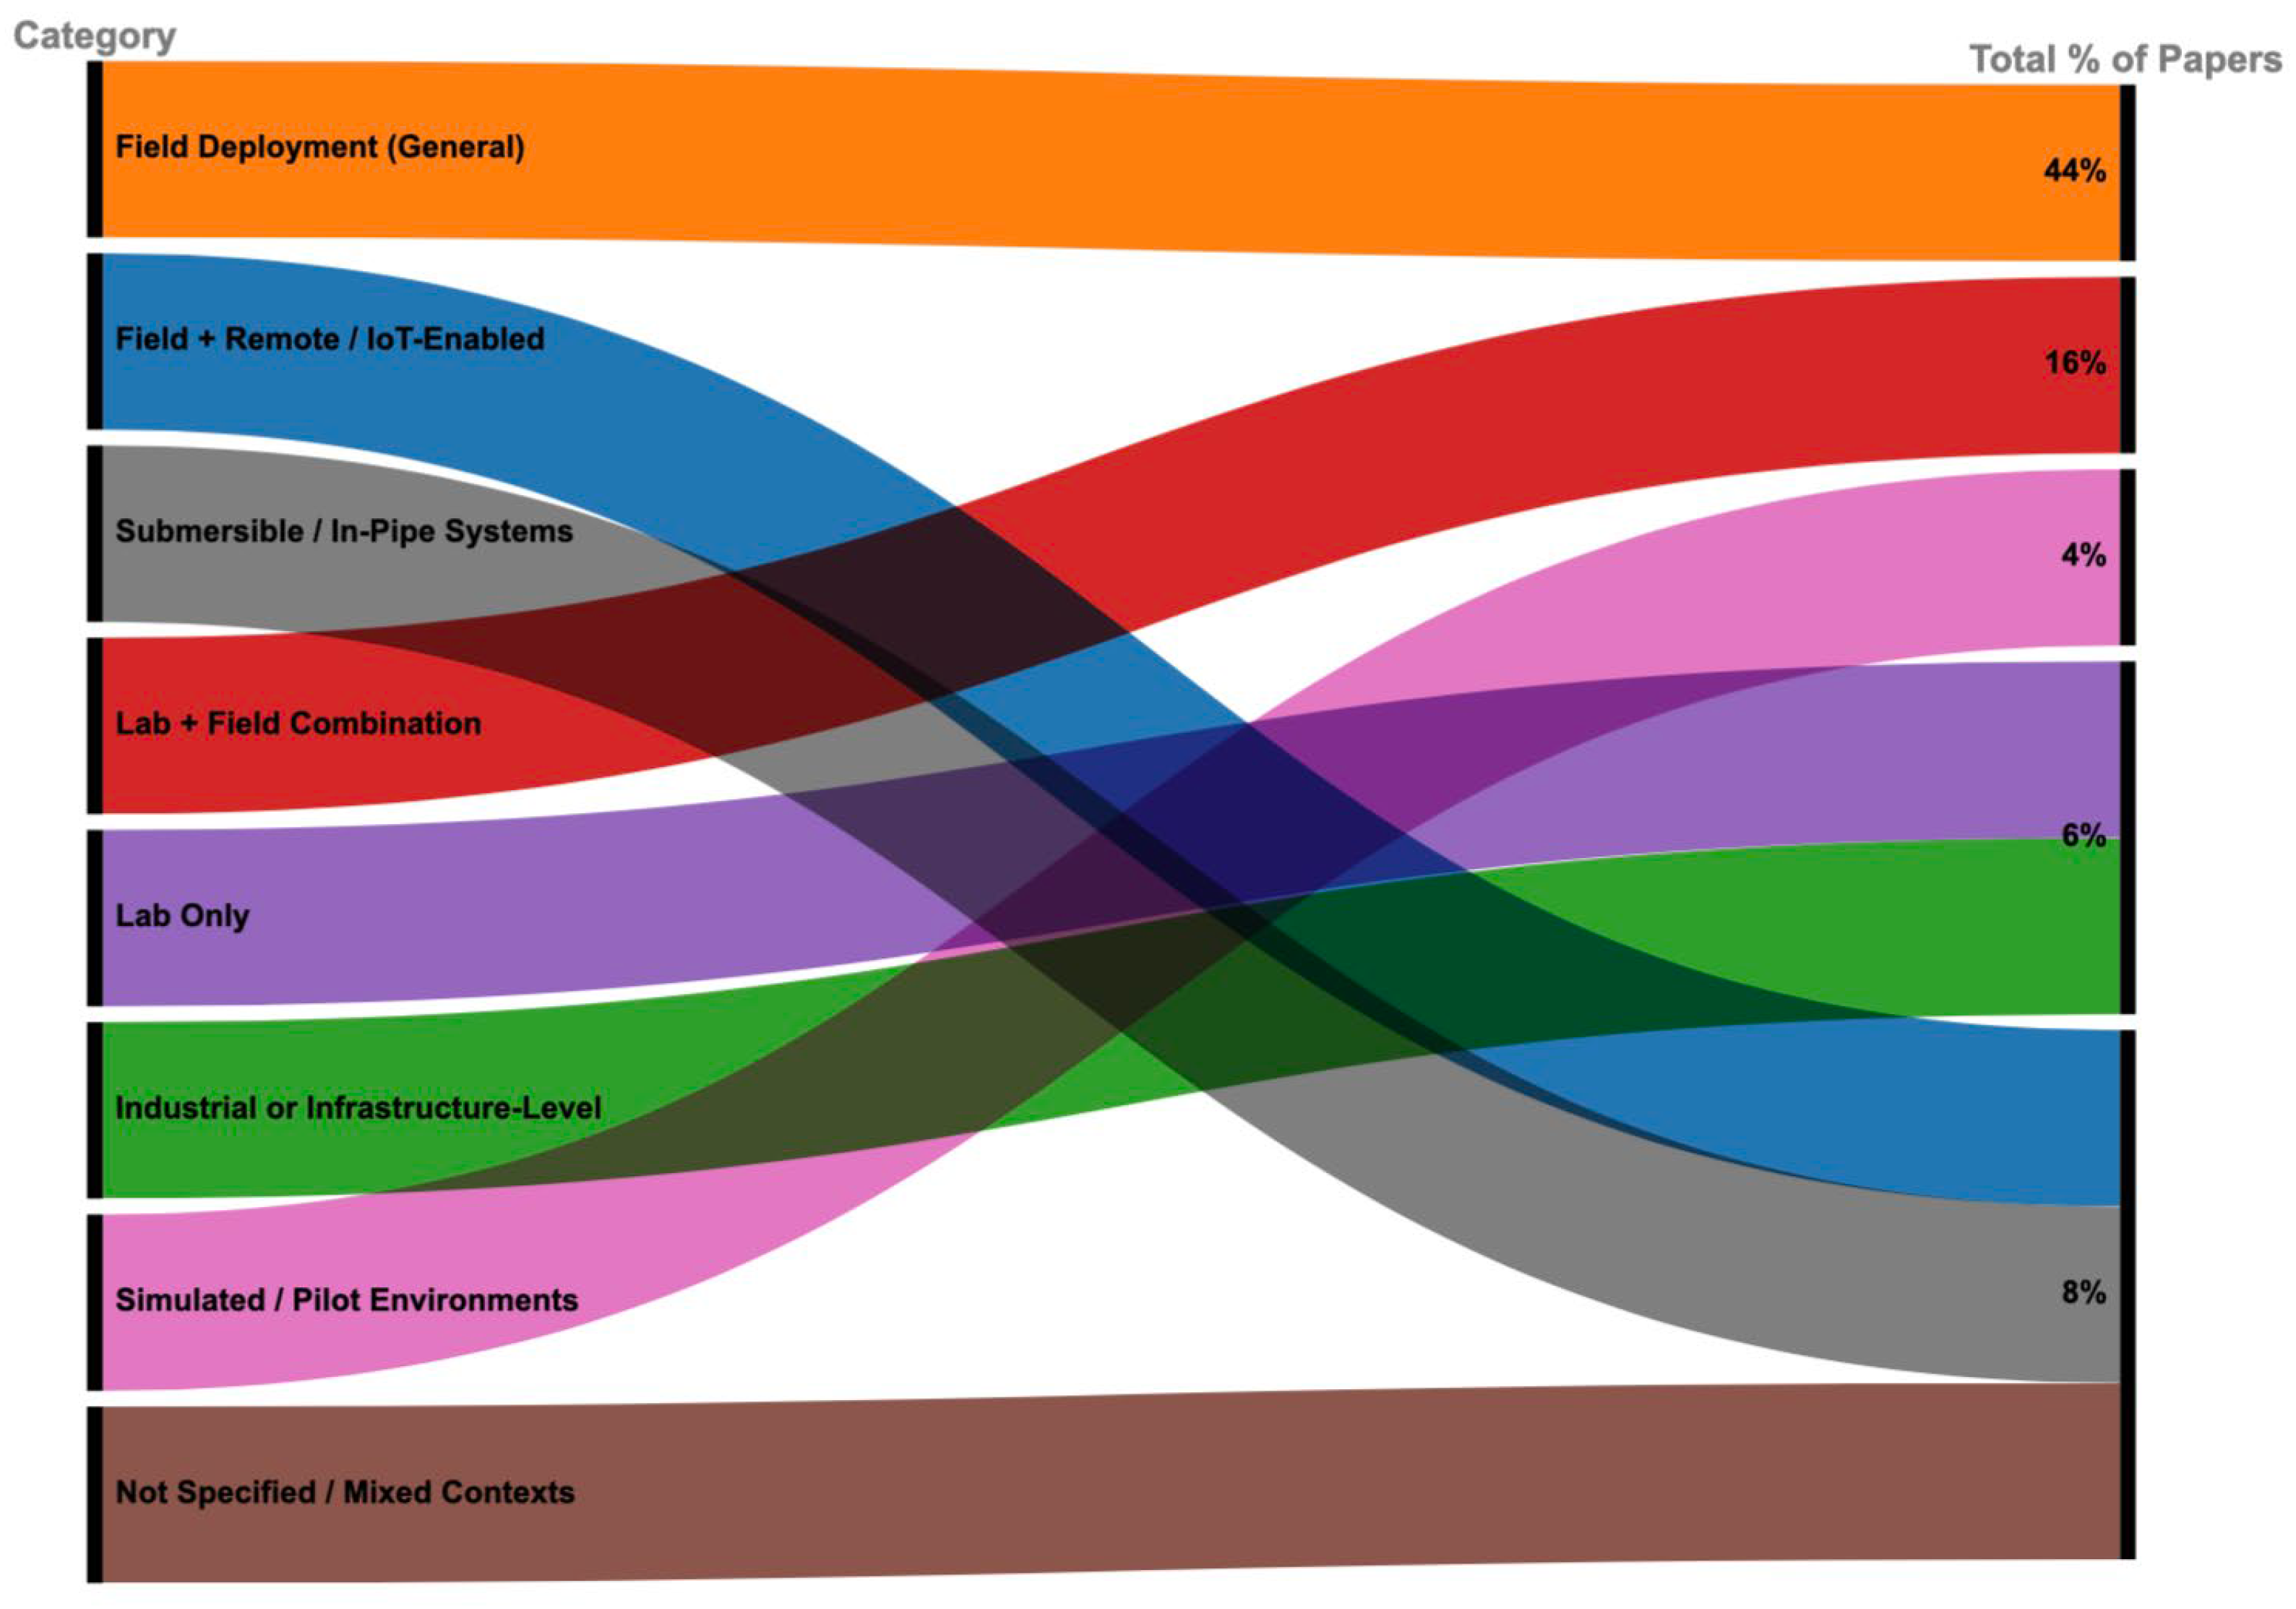
Figure 15.
Calibration practices for IoT-based water quality monitoring sensors.
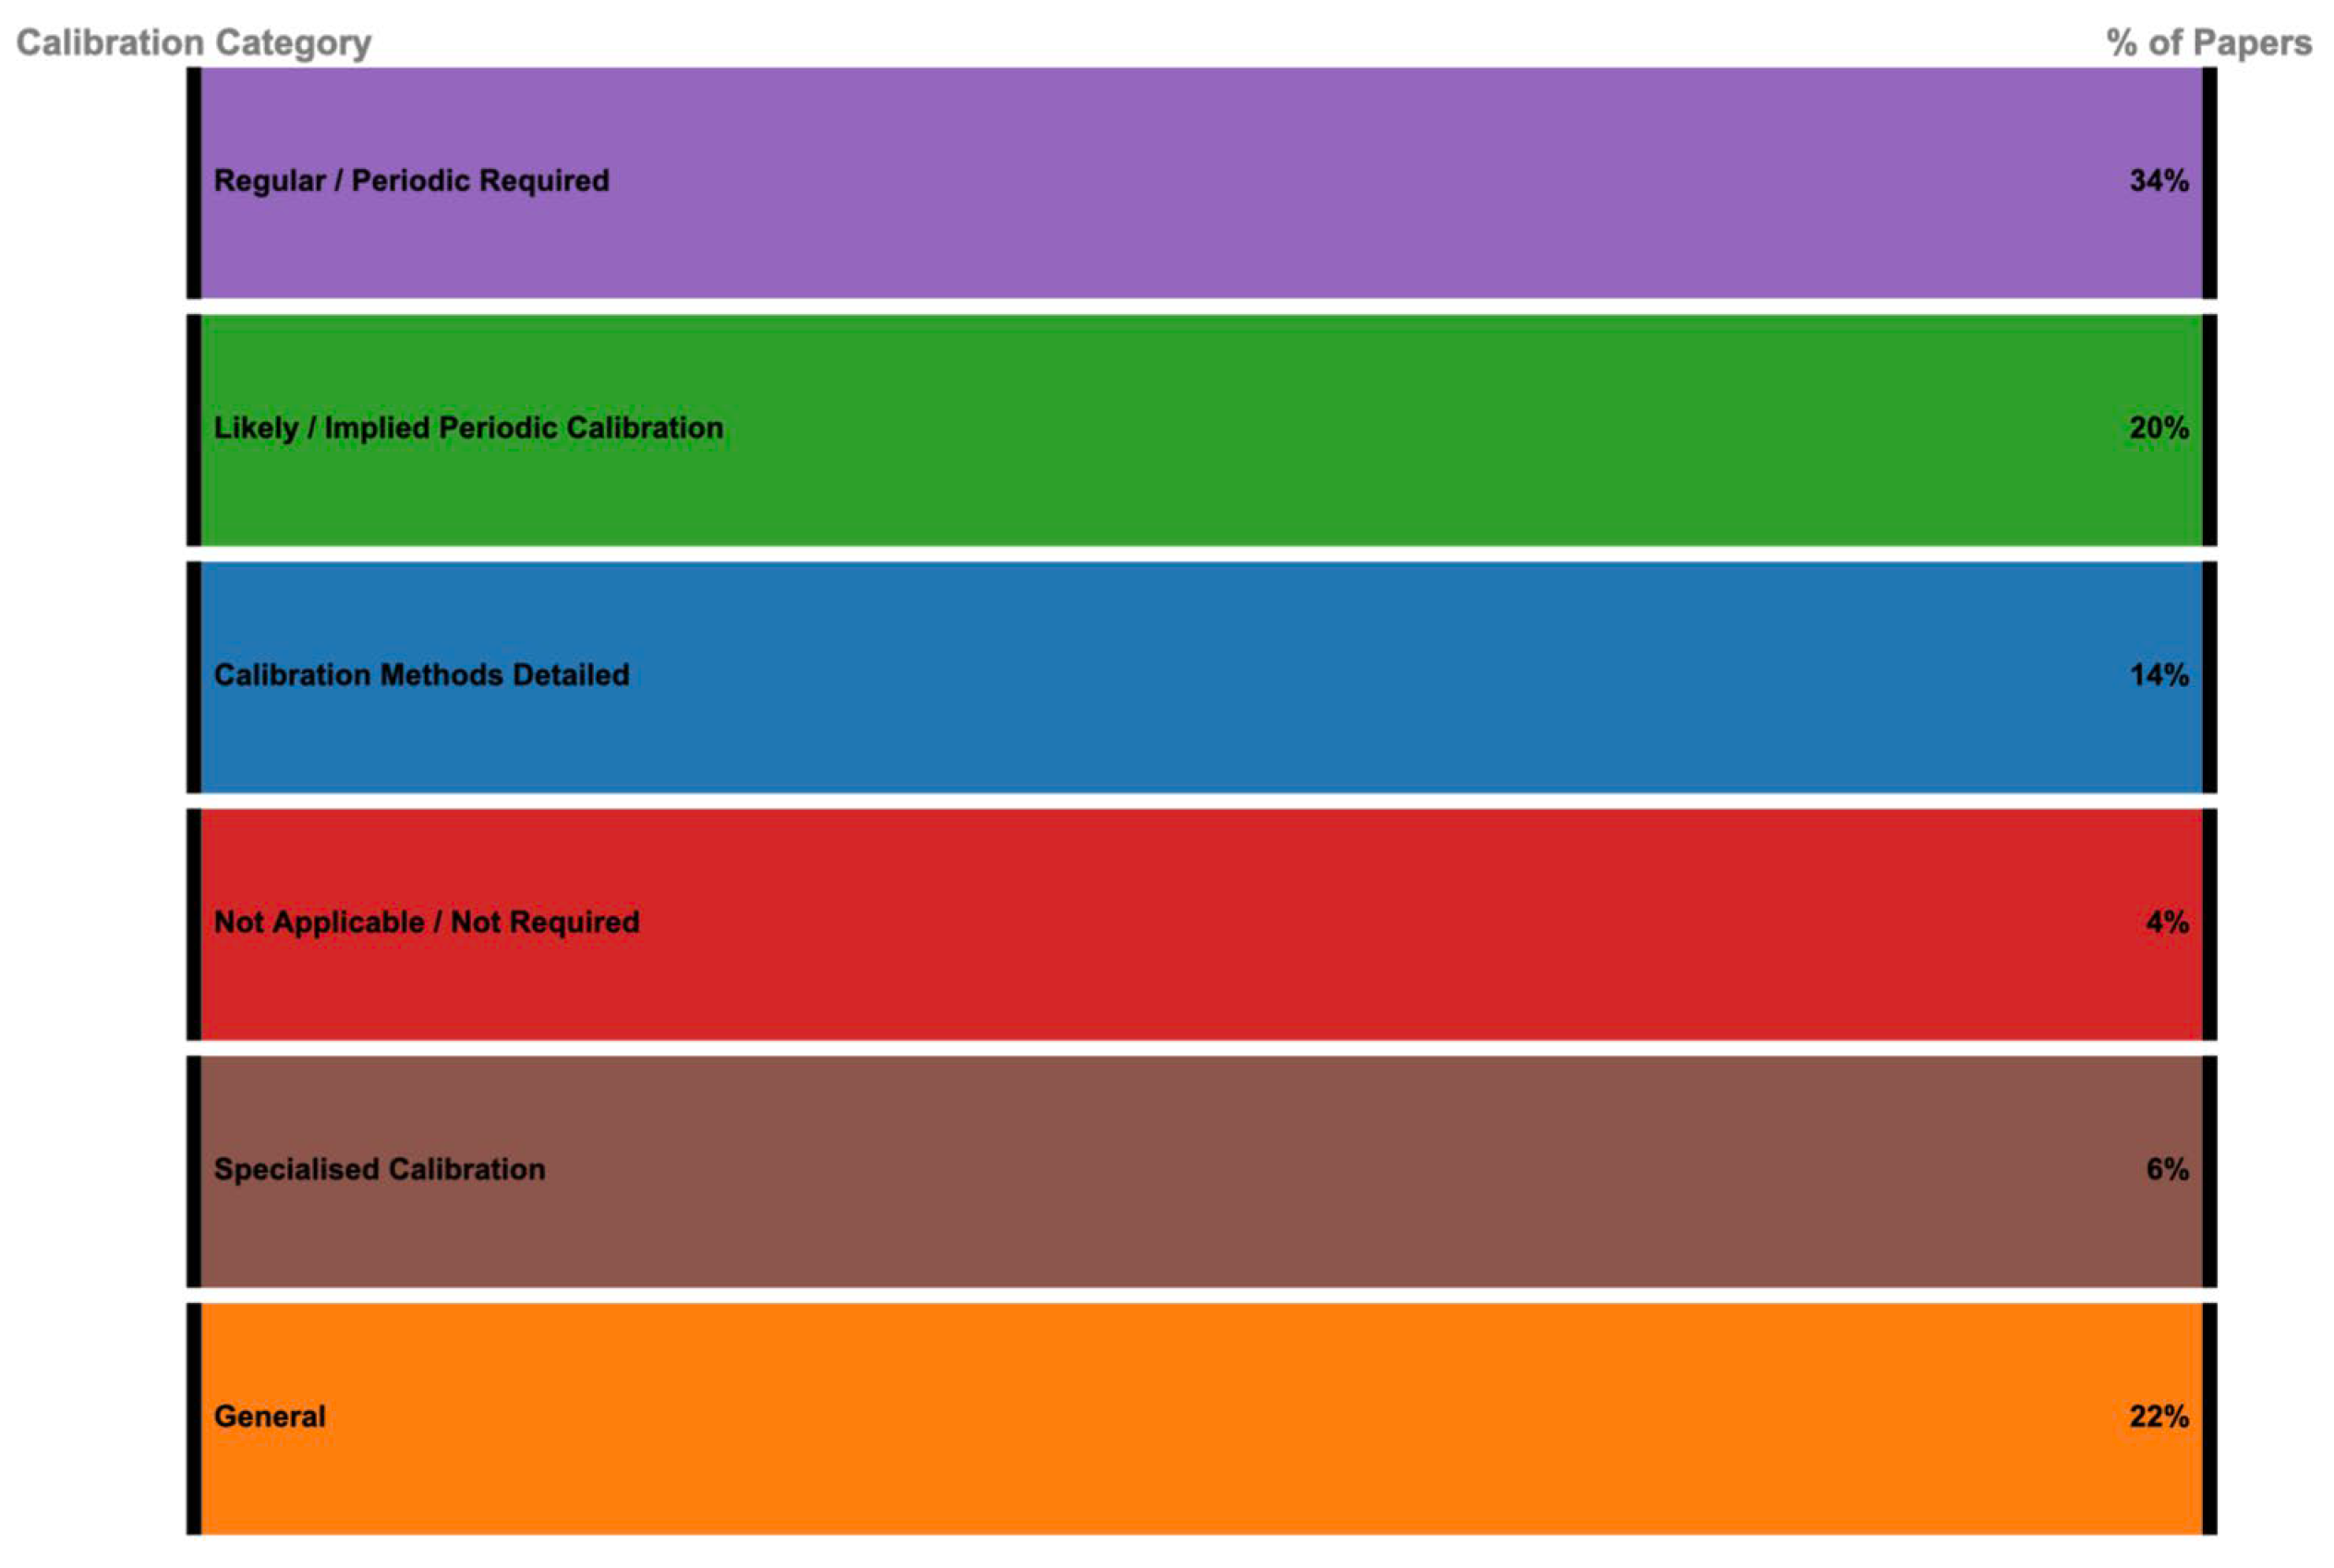
Figure 16.
Challenges reported in IoT-based water quality monitoring literature.
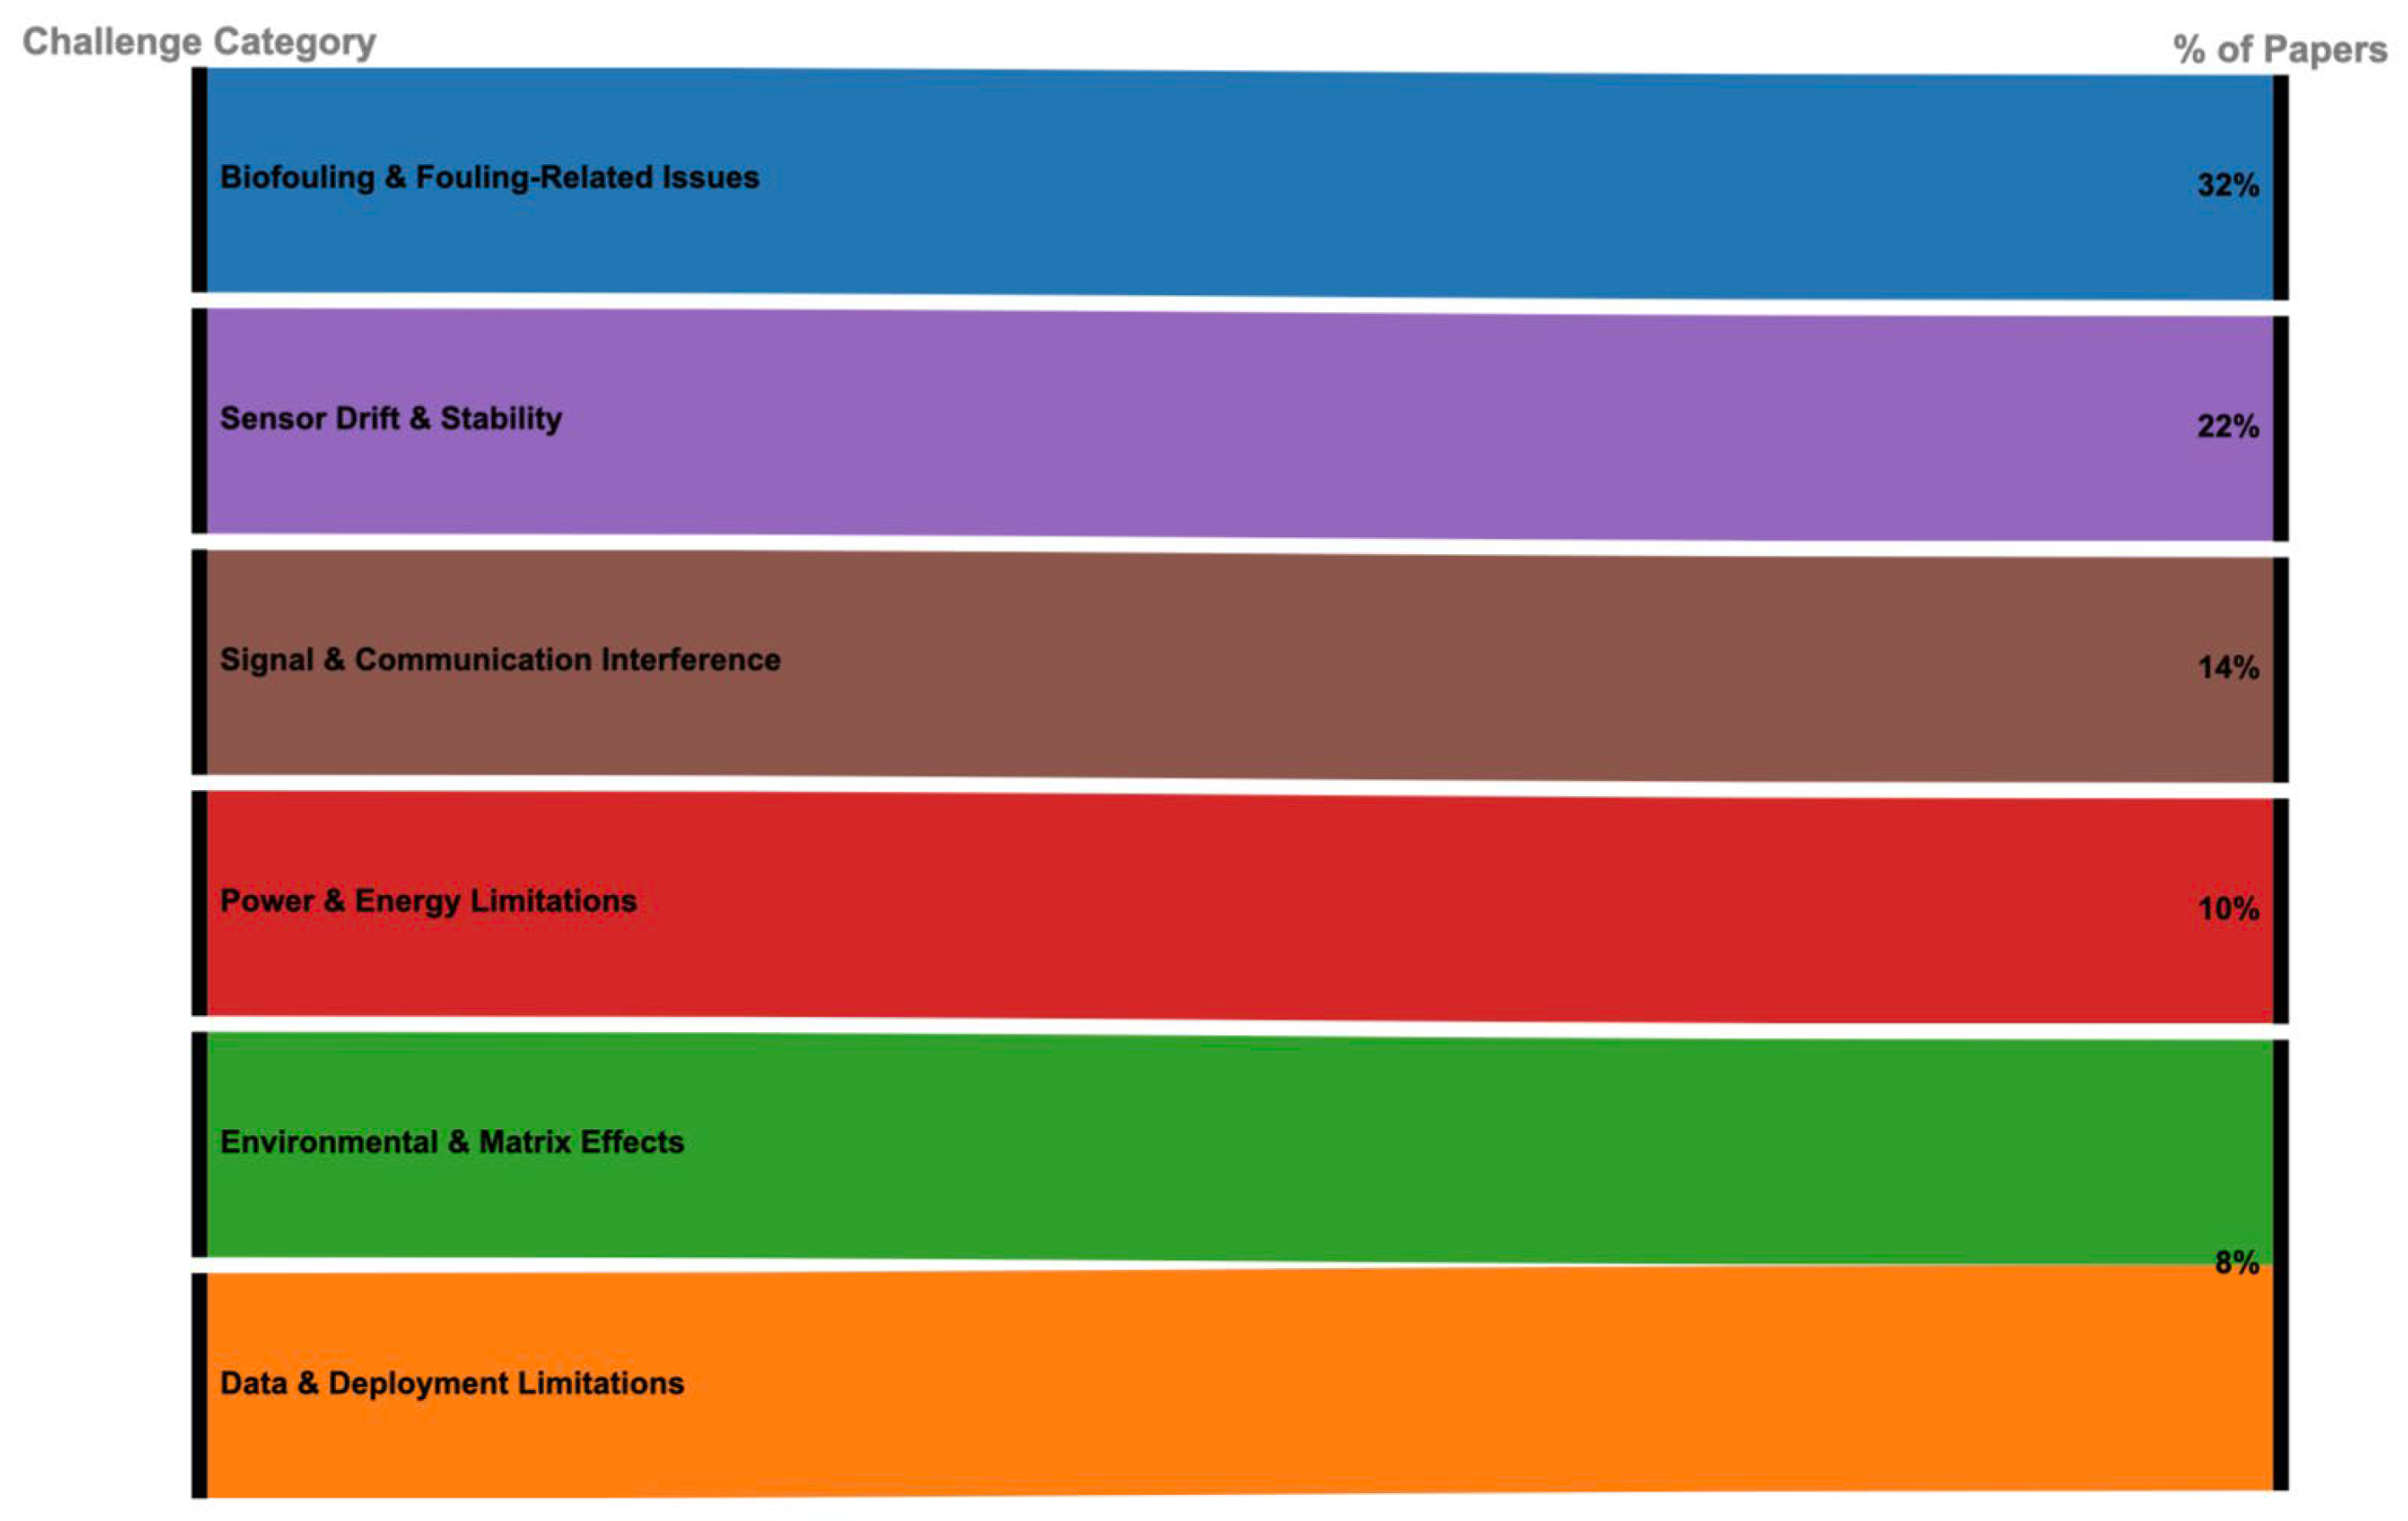
Table 2.
Proposed Inclusion and Exclusion Criteria.
| Criteria | Inclusion | Exclusion |
|---|---|---|
| Topic | Research papers focusing on a Review of IoT Sensors for Monitoring Trace Elements in Water Quality Systems | Research papers not focusing on a Review of IoT Sensors for Monitoring Trace Elements in Water Quality Systems |
| Research Framework | The research papers must include a research framework/methodology for a Review of IoT Sensors for Monitoring Trace Elements in Water Quality Systems | The research papers that exclude a research framework/methodology for a Review of IoT Sensors for Monitoring Trace Elements in Water Quality Systems |
| Language | Research papers must be written in English | Research papers published in languages other than English |
| Period | Studies published between 2014 and 2025 | Studies published outside 2014 and 2025 |
Table 5.
Certainty Assessment Results for Collected Literature on Trace Elements.
| Ref. | QA1 | QA2 | QA3 | QA4 | QA5 | Total | % grading |
| Ahmed et al. (2023); Li et al. (2022); Kumar (2024) | 1 | 1 | 1 | 1 | 1 | 5 | 100 |
| Zhao et al. (2021); Osei et al. (2023); Yilmaz (2020) | 1 | 1 | 0.5 | 1 | 1 | 4.5 | 90 |
| Bakari (2023); Singh et al. (2019); Musa & Chen (2022) | 1 | 1 | 0.5 | 1 | 1 | 4.5 | 90 |
| Adeyemi et al. (2020); Tran (2021); Petrova et al. (2018) | 1 | 1 | 0.5 | 1 | 1 | 4.5 | 90 |
| Novak & Lee (2024); Rahman (2023); Gichuki et al. (2020) | 1 | 1 | 1 | 1 | 0.5 | 4.5 | 90 |
| Morales et al. (2022); Farahani (2021); Zhang (2023) | 1 | 1 | 1 | 1 | 0.5 | 4.5 | 90 |
Disclaimer/Publisher’s Note: The statements, opinions and data contained in all publications are solely those of the individual author(s) and contributor(s) and not of MDPI and/or the editor(s). MDPI and/or the editor(s) disclaim responsibility for any injury to people or property resulting from any ideas, methods, instructions or products referred to in the content. |
© 2025 by the authors. Licensee MDPI, Basel, Switzerland. This article is an open access article distributed under the terms and conditions of the Creative Commons Attribution (CC BY) license (http://creativecommons.org/licenses/by/4.0/).
Copyright: This open access article is published under a Creative Commons CC BY 4.0 license, which permit the free download, distribution, and reuse, provided that the author and preprint are cited in any reuse.


