
Submitted:
21 August 2025
Posted:
22 August 2025
You are already at the latest version
Abstract
The effects of administering 10 mL of maternal bovine appeasing substance (mBAS) or water (control) at weaning (day 0) before transport on feedlot adaptation and efficiency were evaluated in twenty-two Angus-influenced heifers (n = 11/treatment) over 28 days. Growth (BW, ADG), salivary cortisol, blood for complete blood cell count, rectal temperature, chute score and exit speed were collected on days 0, 14 and 27. Intake, feeding duration, frequency and rate, as well as activity and rumination were monitored daily using automated systems. Treated heifers spent less time eating (P < 0.001) on weeks 1 and 2, with greater feeding rate and activity (P < 0.05) in week 1, followed by reduced activity (P < 0.05) in weeks 2, 3 and 4. Rumination was longer (P < 0.05) in weeks 3 and 4, coinciding with greater (P < 0.05) final BW, ADG0–27, ADG14–27, and G:F0–27, G:F14–27. Lymphocyte and hematocrit were lower (P = 0.01) on days 14 and 27, respectively, and platelet tended to be greater (P = 0.07) than CT for the entire period. Treated heifers achieved greater profit margins (P < 0.05) than CT. Overall, mBAS enhanced feedlot adaptability post-weaning, improving production efficiency and profitability.
Keywords:
cattle
; confinement
; FerAppease
; stress
; weaning
; welfare
1. Introduction
In the North American beef industry, weaning calves from their mothers, typically between 6 and 8 months of age [1], marks a profoundly stressful transition due to the loss of both maternal presence and milk [2,3]. This initial stress is often intensified by a cascade of other challenges calves encounter around weaning or upon feedlot entry. These can include processing procedures such as ear tagging, vaccination, and growth implants, as well as stress from transportation and auction markets [1]. Over their first days in the feedlot, calves must also adapt to entirely new feed sources and establish new social structures, leading to competition [4]. The cumulative effect of these stressors significantly compromises their immune systems, leaving them highly vulnerable to Bovine Respiratory Disease (BRD), which is the primary driver of morbidity, mortality, and substantial economic losses within the industry [5,6]. To cope with these stressors, calves employ subtle behavioral and physiological adaptations, including altered feeding patterns and immune system activation [7], aiming to facilitate their adjustment to the new environment.
Management strategies such as preconditioning, which involves practices like vaccinating calves at least 30-60 days before weaning [8], as well as castrating and dehorning at least three weeks prior to transport, and acclimating them to feed bunks, are known to reduce stress and improve calf health and welfare [1,9]. However, the implementation of preconditioning programs across North America has been inconsistent, largely due to concerns about their cost-effectiveness for both cow-calf and feedlot producers [1,8]. In Canada, preconditioned calves typically do not receive price premiums, further limiting uptake [1]. As a result, there is a critical need for effective, low-cost strategies that can mitigate stress, support adaptation to the feedlot environment, and enhance the overall welfare of newly weaned calves.
All mammals, including bovine species, possess an evolutionarily conserved mechanism in which maternal appeasing substances (mBAS), a complex blend of volatile and non-volatile compounds such as fatty acids, are released by specialized sebaceous glands, primarily around the mammary and inguinal regions [10,11]. These pheromone-like substances play a vital role in establishing cow-calf bonding and promoting behavioral and physiological stability in offspring during stressful events [10]. The mBAS used in this study consists of a blend of palmitic, oleic, and linoleic acids, that replicate the natural pheromone and has been demonstrated to be effective for up to 15 days [12,13]. Multiple studies conducted in the U.S. have demonstrated promising results with mBAS in beef cattle during weaning or feedlot entry, showing improved growth performance [12,14,15,16,17,18] and immune responses [16,17,18] while enhancing feed efficiency [15,18], increasing feed intake [15,19] and reducing physiological stress responses [12,14,15,17,18] during the feedlot period. However, the effects on feed intake and feed efficiency remain inconclusive in the literature [14,16,17,18,19], possibly due to the fact that those previous studies have primarily relied on both pen-level average feed intake and growth rates, which may mask individual variations. Thus, further studies are needed to evaluate mBAS’ impact on individual-level feed intake, growth, and feed efficiency, along with physiological and behavioral metrics of stress and health that may influence these outcomes in a feedlot setting.
The objective of this study was to evaluate the effects of mBAS administration at weaning on the behavioral and physiological adaptation of beef heifers during the 28-day feedlot receiving period following transportation, as well as its impact on return-on-investment (ROI). We hypothesized that administration of mBAS at weaning would mitigate stress and weight loss following transportation and promote improved behavioral and physiological adaptation in beef heifers during their first 28 days in the feedlot. Specifically, we hypothesized that mBAS-treated heifers would exhibit greater feed intake, longer duration and more frequent visits to the feed bunk, improved growth performance and feed efficiency, leading to greater profitability, and reduced indicators of stress and immune activation compared to untreated control heifers.
2. Materials and Methods
2.1. Animals, Treatment, and Management
A total of 22 Angus-influenced heifers (238.1 ± 10.96 days of age), born and housed as a single herd with their dams on pasture at Olds College Smart Farm (OCSF) research facilities (Olds, Alberta, Canada), were assessed over a 28-day experimental period. On day 0, heifers underwent abrupt weaning, were individually restrained in a hydraulic squeeze chute, weighed (weaning weight, kg) and assessed for reactivity at handling (see details below). Immediately thereafter, heifers were randomly assigned in equal numbers to one of two treatment groups, ranked by age, reactivity at handling, and weaning weight. One treatment group was assigned to receive a topical application (on the nuchal area and muzzle; 5 mL each) of a mBAS substance (FerAppease; FERA Diagnostics and Biologicals, College Station, TX; mBAS, n = 11), while the other group was assigned to receive a placebo (5 mL per site of water as a control group; CT, n = 11). To prevent cross-contamination between treatment groups, all handling procedures described below were first carried out on the CT group while the mBAS group remained in a separate holding pen.
Later on (day 0), heifers were handled again for a second weaning weight measurement, baseline sampling (rectal temperature, saliva, and blood; see details below), a second reactivity at handling assessment and treatment administration, and were then held in a pen until all animals in the group had been processed. Immediately following processing, the CT group was loaded into a livestock trailer and transported for 84 km (1-hour duration) to simulate the stress of typical hauling conditions experienced by weaned calves in Western Canada [20]. After the CT group had been loaded, the mBAS group underwent the same procedures (day 0), including weighing, rectal temperature, saliva and blood sampling, and transportation in an identical separate trailer. Both groups were subjected to the same transportation conditions (the same space allowance per animal per trailer, the same route, same duration of diet and water deprivations, and a controlled, predesignated speed), until they returned to the same facilities at the OCSF. An automatic recording device was installed inside each trailer’s animal compartment to monitor temperature and humidity. Upon return, each treatment group was housed in a separate experimental feedlot pen located at a distance of 148 meters from each other, and feed was withheld for two hours (resting period).
After the resting period, animals were again herded to the cattle handling facilities at OCSF, where each heifer was individually weighed (shrunk BW, kg), underwent a second-round of rectal temperature and saliva sampling, and a third reactivity at handling assessment. During this handling event, a radio frequency identification (RFID) ear tag fitted with an automated data logger was applied to the left ear of all animals (see details below). All animals were also vaccinated against Bovine Rhinotracheitis, Viral Diarrhea, Parainfluenza-3, Respiratory Syncytial Virus, and Mannheimia haemolytica (Pyramid®5+; Boehringer Ingelheim Animal Health USA Inc., St. Joseph, MO), as well as Clostridium spp. (Fermicon 7/Somnugen; Boehringer Ingelheim Animal Health USA Inc., St. Joseph, MO). Following the handling procedures, CT heifers returned to their respective experimental feedlot pen. The same resting period, sampling, and procedures were applied to the mBAS group upon their return at the OCSF (day 0). Additionally, the exact times of treatment administration, loading, unloading, and sampling were recorded to ensure that both treatment groups were subjected to the same conditions, including an approximately three-hour fasting period encompassing processing, transportation, and resting period.
While housed in the experimental feedlot pens (from day 0 to day 27), animals from both treatment groups were housed in two identical pen environments based on space allocation (~80 m2 per animal/pen), and the pen’s infrastructures including windbreak fencing, and management procedures. Wood shavings were provided for bedding and replenished as needed throughout the trial. On day 14 post-weaning, groups swapped pens, following Cooke et al. [12], to minimize pen effects on the experimental outcomes. For the entire experimental period, all heifers had ad libitum access to water and feed; a total mixed ration (TMR) diet formulated according to the Nutritional Requirements of Beef Cattle [21] (Table 1), which was offered twice daily (~0900h and ~1500h) in seven Vytelle SENSE™ (Vytelle™ SENSE, Calgary, AB) feed bunks per pen.
2.2. Measurements and Sampling Events
2.2.1. Feed Intake and Feeding Behavior Metrics
The measurements obtained from the Vytelle SENSE™ feed bunk system included individual dry matter intake (DMI, kg/day), feeding duration (min/day), and feeding frequency (visits/day). The collected data (intake and duration) were used to calculate feeding rate (g/min) for the entire experimental period (from day 0 to 27 post-weaning), as described by González et al. [22].
2.2.2. Growth Performance Metrics
On day 0, both weaning weights recorded prior to transportation were averaged to determine the pre-travel BW (kg). This value was used in combination with the shrunk BW (post-transportation) to calculate the BW loss (%) using the following equation (1):
Additionally, the BW obtained pre- and post-transportation (pre-travel BW and shrunk BW, respectively) were averaged to generate the initial BW (baseline measurement). This was done to reduce variability associated with gut fill resulting from the absence of a fasting period prior to weighing [23,24]. Two additional BW assessments were conducted on days 14 (BW14, kg) and 27 (final BW, kg) post-weaning. The BW measurements obtained during the sampling events described above were used to calculate the slope of a linear regression, which determined average daily gain (ADG, kg/day) for three different periods: ADG0-14 (initial BW and BW14), ADG14-27 (BW14 and Final BW), and ADG0-27 (initial BW and Final BW).
In addition, the average DMI (kg/day) obtained in the initial two-weeks (from day 0 to 13; DMI0-13), last two-weeks (from day 14 to 27, DMI14-27), and the entire experimental period (from day 0 to 27, DMI0-27) were included in the G:F ratio calculation, using each corresponding ADG period to determine the G:F0-13, G:F14-27, and G:F0-27 (g/kg).
2.2.3. Stress and Health Parameters
Sensor-derived behavioral metrics (activity and rumination) were monitored in all calves (from day 0 to 27 post-weaning) using a 3-dimensional accelerometer attached to their RFID ear tags (CowManager SensOor, Agis, Harmelen, the Netherlands). Data from the sensors were transmitted via a router to a computer, for storage. Each minute, the sensor continuously collected data from individual animals, classifying their behavior into one of four categories: ‘non-active’, ‘highly active’, ‘active’ or ‘rumination’, as previously described by Reynold et al. [25]. Active was obtained by summing the ‘active’ and ‘highly active’ behaviors associated with any movement, except eating and rumination. Non-active indicated no movement including rumination, eating, and activity, while rumination indicated ear movement associated with regurgitation, rumination, salivation, and swallowing of ingesta in a standing or lying position [20].
Both chute score (CS, score) [26] and chute exit speed (ES, m/s) [27] were used as behavioral indicators of reactivity at handling. The CS and ES methods were conducted immediately before and after weighing the animals, respectively, during multiple sampling occasions: twice on day 0 before treatment administration (baseline), once after the resting period, and on days 14 and 27 post-weaning. Briefly, the CS method was performed by an experienced observer by assessing the level of agitation and excitability of individual cattle that were in the squeeze chute but not restrained by the head gate, for a 4-second period. After 4 seconds, the observer categorized the animal on a scale of 1 to 4 where greater score values indicated greater excitability, as follow: CS 1) animal does not offer resistance, remains with head, ears, and tail relaxed; CS 2) animal shows some movement with head up and ears erect and may flick its tail occasionally; CS 3) frequent movement but not vigorous, head, ears and/or tail movements and; CS 4) abrupt and vigorous movements of the whole animal as well as the head, ear, and/or tail and may jump and/or fall. The ES method included an electronic device (FarmTek, Inc., Texas, USA) with two pairs of photoelectric cells, a chronometer and a small processor programmed that recorded the time taken by each animal to pass a known distance immediately after releasing the animal from the squeeze chute. Faster animals were considered to have more excitable reactivity at handling.
To assess acute stress at handling, saliva samples were collected twice on days 0, immediately prior to treatment administration (baseline) and after resting period as well as days 14 and 27 post-weaning, by swabbing the oral cavity with a cotton swab applicator. Samples were immediately placed in a plastic tube and frozen at -20°C. Samples were subsequently analyzed for salivary cortisol concentration (cortisol, nmol/L) using an enzyme immunoassay kit (Salimetrics, State College, PA), as previously described by Meléndez et al. [28], with intra- and inter-assay reliability 5.8% and 16.4%, respectively. Rectal temperature was collected twice on day 0 (immediately prior to transportation, used as baseline, and after the resting period), as well as days 14 and 27 using a digital thermometer (GLA Agricultural Electronics, M750 Livestock Thermometer, San Luis Obispo, CA). Additionally, the same two research personnel monitored all heifers daily (from day 0 to 27 post-weaning) for clinical signs of illness or distress, removing suspected animals from the pen as needed for rectal temperature assessment and health treatments.
To assess stress and immune response, blood samples were collected from the coccygeal vein from all heifers into 6-mL vacuum tubes containing EDTA (BD Vacutainer; Becton Dickinson Co., Franklin Lakes, NJ) on day 0 (immediately prior to transportation; baseline) and on days 14 and 27 post-weaning. These samples were analyzed to determine the complete blood cell count (CBC) using an Element HT5 Analyzer (Heska, Loveland, CO). The CBC included measurements for red blood cells (RBC, x106/µL), hematocrit (HCT, %), hemoglobin (HGB, g/L) white blood cells (WBC, x103/µL), neutrophils (NEU, x103/µL), lymphocytes (LYM, x103/µL), monocytes (MONO, x103/µL), eosinophils (EOS, x103/µL), and platelet counts (PLT, x103/µL). The neutrophil-to-lymphocyte (N:L) ratio was calculated.
2.2.4. Profitability Metrics
The profitability (adapted from Pickett et al. [17]) was calculated by first determining the net gain. This involved summing the individual BW measurements within each pen to obtain the total BW at weaning (day 0; total initial BW, kg/pen) and at the end of the trial (day 27; total final BW, kg/pen). A 4% shrink was applied to both total initial and final BW to account for excretory losses. The adjusted BW values were then multiplied by a sales price of CAD$4.00/kg to estimate the initial and final values per pen (CAD$/pen), as shown in the following equation (2):
where κ represents the corresponding initial value or final value and λ represents the corresponding initial BW or final BW.
Profit per pen (CAD$/pen) over the experimental period (from day 0 to 27) was calculated as the difference between the final value and the initial value, total feed costs, and total medication costs, as described by Pickett et al. [17] using the following equation (3):
The return-of-investment (ROI) was then calculated using the following equation (4):
where ROI indicates the return of investment; profit difference refers to the difference in profit obtained between the two treatment groups; and treatment cost represents the total cost of mBAS.
2.3. Data management and Statistical Analysis
A single heifer (CT group) exhibited weight loss (-0.08 kg/day) between days 14 and 27; therefore, its growth performance data for day 27, and respective ADG calculation were excluded from the final dataset. Feed intake and feeding behavior recorded from all heifers on day 27 were included in the dataset up to the handling event (10:00 AM). Then, the final intake and feeding behavior dataset were summarized on a daily- and weekly-basis (average data obtained from day 0 to 6, 7 to 13, 14 to 20, and 21 to 27 representing weeks 1, 2, 3, and 4, respectively). Sensor-derived behavioral data (activity and rumination) were cleaned by including only records after the completion of all handling procedures in both treatment groups (day 0; starting at 4:00 PM). Similarly, data recorded during the two-hour handling period (for both groups) on day 14 were removed. On day 27, sensor-derived data was collected until 10:00 AM for both groups. The final activity and rumination dataset were summarized on a daily- and weekly-basis (as described above). Additionally, for any animals suspected of illness or distress that were removed from the pen for rectal temperature assessment, the timeframe during which they were handled was noted, and corresponding sensor data were excluded from the final dataset. Prior to statistical analysis, all activity and rumination data were converted to percentages; each value was divided by the number of minutes in 24 hours (1440 minutes) and multiplied by 100.
Data analyses were carried out using SAS® Studio platform (SAS OnDemand for Academics, 2022). Animals were considered as experimental units, as groups were rotated between pens. Generalized linear mixed-effects models (SAS PROC GLIMMIX) were used in all analyses described below. For feed intake, feeding behavior, sensor-derived behavioral metrics, CBC, ES, cortisol, and rectal temperature, the statistical model included treatment, day, and their interaction as fixed effects. Animal was included as a random effect, and sampling days were treated as repeated measures using the RANDOM statement. Moreover, for CS, ES, cortisol, and temperature, the initial BW (calculated as the average of BW recorded pre- and post-transportation) served as the covariate. Additionally, for CBC metrics, ES, rectal temperature and cortisol, all pre-treatment measurements of the dependent variables were included as covariates in the model. The optimal distribution was selected based on the Bayesian Information Criterion (BIC), followed by the evaluation of covariance structures, with the one yielding the lowest Schwarz’s BIC selected for the final analysis.
For shrunk BW, BW14, BW27, BW loss, as well as ADG, G:F, and net gain metrics, treatment was included as a fixed effect. For shrunk BW, the average of the two weaning weights was used as a covariate. For BW14, BW27, ADG, and G:F the initial BW served as the covariate.
Results are presented as least square means with corresponding 95% lower and upper confidence limits (Cl). Least square means differences were determined using the PDIFF option in SAS. A post-hoc test (Tukey) was employed to compare the adjusted means. Main effects were considered significant at P ≤ 0.05 and a tendency at 0.05 < P < 0.10.
3. Results
3.1. Feed Intake and Feeding Behavior Metrics
Results for feed intake and feeding behavior metrics are presented in Table 2 as well as Figure 1, Figure 2 and Figure 3. On a daily-basis, a tendency (treatment × day; P = 0.09) interaction was found for dry matter intake. Likewise, a tendency (treatment × day; P = 0.07) was observed for feeding duration while a significant interaction (treatment × day; P = 0.01) was detected for feeding frequency, and a significant effect (treatment effect; P < 0.01) was found for feeding rate.
During the first two weeks post-weaning, heifers administered mBAS exhibited a tendency of greater dry matter intake on day 6 (P = 0.06) than CT heifers (Figure 1). In the final two weeks of the trial, mBAS heifers had greater (P < 0.05) intake on day 15 and tendency of greater intake on days 17 (P = 0.06) and 19 (P = 0.08) post-weaning. No differences (P > 0.10) were observed on the remaining days of the experimental period (Figure 1).
Shorter (P < 0.001) feeding durations on day 0, as well as from days 2 to 7 (P < 0.05), and on days 10, 14, 18, 23, and 24 post-treatment (P < 0.05) than CT heifers (Figure 1). Although feeding duration tended (P = 0.06) to be longer on day 1 for mBAS heifers, they showed a tendency (P = 0.08) for reduced feeding duration on days 8, 9, 13, 21, as well as reduced on days 22 (P = 0.07) and day 25 (P = 0.09) compared to CT heifers, as illustrated in Figure 2. No differences (P > 0.10) were observed on days 11, 12, 15, 16, 17, 19, 20, 26, or 27 post-treatment administration (Figure 2).
Conversely, mBAS-treated heifers exhibited significantly lower (P < 0.001) feeding frequency on day 0, but greater (P < 0.05) on day 9, with a trend (P = 0.07) for increased frequency on day 17 than CT heifers (Figure 3). No differences (P > 0.10) were observed on the remaining days of the experimental period (Figure 3).
Additionally, the mBAS-treated heifers had greater (treatment effect; P = 0.01) feeding ratio than CT heifers (Table 2).
When data were analyzed on a weekly-basis, a tendency of treatment × day (P = 0.06) interaction was observed for dry matter intake (Table 2); however, differences were primarily within rather than between treatments (data not shown). Significant treatment × day (P < 0.05) interactions were detected for feeding duration, feeding frequency, and feeding rate (Table 2). The mBAS-treated heifers had a shorter (P < 0.001) feeding duration during week 1 (112.7 min/week, 95% Cl: 139.28 – 172.04) and showed a tendency for shorter (P = 0.06) duration in week 2 (178.2 min/week, 95% Cl: 185.69 – 228.77) than CT heifers (154.8 min/week, 95% Cl: 100.54 – 126.36 and 206.1 min/week, 95% Cl: 158.94 – 199.76, for weeks 1 and 2, respectively), with no differences (P > 0.10) observed in weeks 3 or 4 (data not shown). Differences in feeding frequencies were detected within treatment groups rather than between groups (data not shown). On the other hand, mBAS-treated heifers had a significantly greater (P < 0.001) feeding ratio during week 1 (52.7 min/week, 95% Cl: 47.68 – 58.22) compared with CT heifers (40.7 min/week, 95% Cl: 37.12 – 44.67), with no differences (P > 0.10) observed in weeks 2, 3, or 4 (data not shown).
3.2. Growth Performance Metrics
Results for growth performance metrics are presented in Table 3. As per the study design, no difference (P > 0.10) was found for initial BW. Although no significant (P > 0.10) differences were found for shrunk BW, BW loss, BW 14, or initial ADG, mBAS heifers had greater (P < 0.05) final BW, final ADG, and total ADG compared to CT heifers. Likewise, no differences (P > 0.10) were found for initial G:F; however, greater (P < 0.05) final and total G:F ratio were observed for mBAS compared to CT heifers.
3.3. Stress and Health Parameters
Results for sensor-derived behavioral metrics (activity and rumination) are presented in Table 4 and in Figure 4, Figure 5, Figure 6 and Figure 7, while reactivity at handling metrics, cortisol, rectal temperature, and CBC metrics are presented in Table 5. Significant (treatment × day or week; P < 0.05) interactions were found on both daily- and weekly-basis sensor-derived behavioral metrics.
On a daily-basis, mBAS-treated heifers exhibited greater (P < 0.01) percentages of active behavior from days 1 to 4 and day 17, but lower (P < 0.05) percentages on days 7, 10, 14, 15, 16, 18, 19, 21, 22, 25, and 26 compared to CT heifers (Figure 4). No differences (P > 0.10) were observed between treatment groups on the remaining days (Figure 4). Conversely, mBAS heifers showed greater (P < 0.05) percentages of non-active behavior on days 0, 7, 15, 18, 19, and 26, but lower (P < 0.05) percentages from days 1 to 3, and 17 compared with CT heifers (Figure 4). Again, no differences (P > 0.10) were observed for non-active behavior on the remaining days (Figure 4).
When analyzed on a weekly-basis, mBAS heifers displayed a greater (P < 0.01) percentage of active behavior on week 1, but lower percentage of active behavior (P < 0.05) on weeks 2, 3, and 4 than CT heifers (Figure 5). For non-active behavior, mBAS heifers had lower (P < 0.05) percentage active behavior on week 1 than CT heifers, but no differences (P > 0.10) were detected on weeks 2, 3, or 4 (Figure 5).
For rumination behavior, mBAS heifers exhibited lower (P < 0.01) rumination behavior percentages on day 0, but greater (P < 0.05) percentages on days 14, 15, 19, as well as from days 21 to 23, and on day 26 compared to CT heifers (Figure 6). Additionally, mBAS heifers tended to have greater (P = 0.07) percentages on days 7 and 25, and a tendency for greater (P = 0.06) rumination behavior percentages on day 16 than CT heifers (Figure 6).
On a weekly-basis, mBAS heifers exhibited greater (P < 0.05) percentages of rumination on weeks 3 and 4 (30.2 and 31.7 %, respectively) compared to CT heifers (23.0 and 23.8 %, respectively), but no differences (P > 0.10) were found on weeks 1 or 2 (Figure 7).
No significant differences (P > 0.10) were observed in reactivity at handling parameters (CS or ES), salivary cortisol, or rectal temperature between treatment groups (Table 5). However, significant (treatment × day; P < 0.05) interactions were observed for three out of the ten CBC parameters (RBC, HCT, and LYM) and tendencies (treatment effect; P = 0.08) were found for N:L ratio and PLT (Table 5). No differences (P > 0.10) were found for HGB, WBC, NEU, MONO, or EOS between treatment groups (Table 5).
For the CBC parameters, although a significant (treatment × day; P < 0.05) interaction was observed for RBC (Table 5), pairwise differences occurred within treatment groups rather than among them (data not shown). The mBAS heifers exhibited greater (P < 0.01) HCT percentage on day 27 (36.2 %, 95% Cl: 34.90 – 37.53) compared to CT heifers (33.6 %, 95% Cl: 32.31 – 34.86), but no differences (P > 0.10) were observed on day 14 (data not shown). Conversely, lower (P < 0.05) LYM counts were observed in mBAS heifers on day 14 (5.9 × 10³/µL, 95% Cl: 5.50 – 6.37) compared to CT heifers (6.6 × 10³/µL, 95% Cl: 6.13 – 7.09), with no differences detected on day 27 (data not shown). Similarly, a tendency for lower (P = 0.08) N:L ratio and a tendency for greater (P = 0.07) PLT counts were observed in mBAS heifers compared with CT heifers for the entire experimental period (Table 5).
One animal from each treatment had to be treated more than once (days 0 and 14) due to rectal temperature greater than 40°C (data not shown). No incidence of mortality was observed during the experimental period.
3.4. Profitability Metrics
Results for total profitability metrics are shown in Table 6. When using net gain metrics for the ROI calculation, our findings indicate that for every CAD$1 spent on mBAS treatment, the return is approximately CAD$11.74 in profit, based on liveweight-adjusted mBAS treatment costs.
4. Discussion
Weaning is widely recognized as one of the most stressful events in a beef calf’s life, with substantial consequences for health, welfare, and subsequent growth performance. In Western Canada and across North America, where beef production systems emphasize efficient feedlot performance, mitigating the adverse effects of weaning stress is essential. During this critical transition, calves are subjected to multiple concurrent stressors, including abrupt maternal separation, transportation, commingling with unfamiliar animals, and dietary changes [1,2], that trigger behavioral and physiological responses aimed at promoting adaptation [29]. Common adaptive responses may include elevated cortisol concentrations, immune suppression, reduced feed intake, and impaired growth, all of which can negatively impact animal welfare and feedlot profitability [10]. However, the magnitude and nature of these responses can vary widely among individuals, reflecting differences in stress resilience and coping abilities [30]. Therefore, this study aimed to determine whether a single pre-transport administration of 10-mL mBAS at weaning could mitigate transport-induced weight loss (shrunk BW) and enhance individual-level feedlot adaptation in Angus-influenced beef heifers. While mBAS positively affected certain indicators of health, stress, and growth for feedlot adaptation, the overall results did not fully meet our initial expectations.
As anticipated from the study design, no differences in initial body weight were observed between treatment groups. However, a delayed positive effect of mBAS emerged, with treated heifers demonstrating superior growth performance during the third- and fourth-weeks post-weaning compared to their water-treated counterparts. By the end of the 28-day trial, mBAS-treated heifers were approximately 2.6% heavier (+9.5 kg) than the controls. Notably, during weeks three and four, these heifers gained nearly 36% more weight per day (+600 g/day), contributing to a cumulative average daily gain (ADG) that was 22.2% higher (+400 g/day) over the entire feeding period. These findings align, in part, with those of Cooke et al. [12], who evaluated the administration of mBAS either at weaning while Bos indicus-influenced calves remained on their home pasture or at feedlot entry after transportation. In contrast to our results, the authors reported increased ADG during the first two weeks post-weaning in calves treated with mBAS, regardless of the timing of administration. Notably, additional improvements in ADG were observed after day 15 when mBAS was administered at feedlot entry; however, total weight gain over a 45-day period improved only when mBAS was applied at weaning [12]. In contrast, one study reported increased ADG during the first three weeks post-weaning (days 0 to 19) in mBAS-treated calves compared with placebo, when the product was administered either immediately prior to loading or at feedlot entry; however, these effects did not persist beyond 60 days when administered at feedlot entry [15]. Likewise, Pickett [17] also reported a lack of mBAS effects on ADG assessed over 60 days when the product was administered at feedlot receiving. These discrepancies between the current and previous studies remain unclear but suggest that the efficacy of mBAS may be context-dependent, potentially influenced by factors such as timing of administration, transportation duration, environmental conditions, length of the study duration, or breed-specific stress responses during feedlot adaptation, warranting further investigation. Notably, the enhanced growth observed in the current study was not driven by differences in dry matter intake. Overall, both groups consumed similar amounts of feed, averaging approximately 7.0 kg/head/day, consistent with previous findings for feedlot cattle during the first four weeks post-weaning [31]. Instead, the improved performance likely reflects greater feed efficiency across the entire trial period, but particularly evident during the latter half of the study. The magnitude of gain-to-feed ratio improvements observed in the current study exceeded those reported over a 45-day period in Angus-influenced steers (approximately 40% for mBAS and 34% for controls) treated with mBAS at feedlot entry [12]. Conversely, when Bos taurus x Bos indicus heifers and steers were evaluated over a 42-day feeding period [16] and Angus-influenced steers over a 60-day period [17], mBAS administration at feedlot receiving showed no effect on gain-to-feed ratio. The enhanced efficiency observed in the current study may resulted from mBAS-mediated attenuation of stress-induced activation of the hypothalamic–pituitary–adrenal (HPA) axis, reducing secretion of adrenocorticotropic hormone (ACTH) and cortisol [32,33]. By diminishing the physiological stress response, mBAS likely decreases the metabolic costs associated with stress, thereby supporting more efficient nutrient utilization and contributing to the growth advantage observed. The discrepancies among studies may be partly explained by differences in experimental conditions. The previously cited studies [16,17,18] were conducted with larger group sizes (over 40 animals per treatment) and involved longer transportation durations (ranging from 2 to 12 hours), where animals were exposed to higher risks of disease and greater social stress. In contrast, the current study was conducted under lower disease risk conditions (e.g., shorter transportation duration and smaller group sizes per pen), which may have induced lower stress-levels and contributed to a greater feed efficiency. Therefore, the outcomes observed in this study should be interpreted with caution, as they may not fully reflect the conditions or results expected in typical commercial feedlot environments.
Given the lack of effect on shrunk body weight and percentage of body weight loss (both groups lost 1.4 % of BW), it is possible that the transportation conditions in this trial were not sufficient to elicit a measurable stress response capable of triggering acute metabolic losses during transportation. Heifers were transported approximately 84 km (1 hour), and all handling procedures, including loading, transport, unloading, resting, and post-transport weighing and sampling, were carried out calmly by experienced handlers. The entire process was completed in approximately three hours per group. These lower stress conditions likely contributed to minimal activation of the HPA axis, as indicated by the similar salivary cortisol concentrations observed between treatment groups post-transport and within groups before and after transportation. However, it is also important to note that the peak cortisol response may have occurred outside the sampling window. Cortisol, a glucocorticoid hormone commonly referred to as the "stress hormone," is synthesized and released by the adrenal cortex in response to activation of the HPA axis [32]. It plays a crucial role in the physiological adaptation to stress by mobilizing energy for the "fight-or-flight" response [32]. This is achieved through gluconeogenesis, where cortisol facilitates the breakdown of glycogen, muscle proteins, and fat stores to provide glucose and alternative energy sources [10,34]. While this mechanism is vital for acute stress adaptation, prolonged cortisol elevation can lead to muscle loss, immune suppression, and impaired growth, negatively impacting animal health and performance [10,34]. Previous research has shown that salivary cortisol concentrations in calves rise within 20 minutes following artificial ACTH stimulation (as a proxy of stress response) and typically return to baseline in approximately three hours [35]. In contrast, a previous study involving longer transportation duration (more than 400 km) have reported greater body weight loss (approximately 7.4%), indicating a more intense stress response [36]. Our findings align with previous studies [12,15,16] reporting no differences in serum (or plasma) cortisol concentrations between mBAS-treated and untreated cattle. This lack of physiological differences was consistent with the absence of behavioral differences at handling, as assessed through chute score and exit speed. In contrast, stress-mitigating effects of mBAS have been observed in other contexts, such as reduced plasma cortisol on day 7, but not on days 17, 31, or 45 [18]. On the other hand, Schubach et al. [16] reported no effect of mBAS on plasma cortisol at days 7, 14, 28, or 42, but observed a tendency for lower exit speed by day 7 and a significant lower exit speed by day 14, and decreased hair cortisol concentrations also on day 14, a marker of chronic stress in cattle [37]. These discrepancies underscore the context-dependent nature of transport- and handling-induced stress and suggest that the physiological and behavioral benefits of mBAS may be more pronounced under prolonged or more intense (or chronic) stress conditions. Therefore, future studies should evaluate the efficacy of mBAS in scenarios involving extended transportation, multiple simultaneous stressors (e.g., weaning, commingling), or adverse environmental conditions to more fully assess its potential for mitigating transport-related stress and maintaining metabolic homeostasis.
Although mBAS heifers demonstrated indications of greater dry matter intake than controls on days 6, 15, 17, and 19 of the 28-day period, the absence of consistent overall differences aligns with previous research, where mBAS administration prior to loading or at feedlot entry in both Bos indicus and Bos taurus cattle produced inconsistent or negligible effects on intake when evaluated at the pen level [14,15,16,17,18]. These inconsistencies may be attributed to differences in social dynamics, metabolic regulation, or breed-specific temperament. In addition, variation in feed intake measurement methodology, especially between individual- versus pen-level data, may further contribute to uneven outcomes. To the best of our knowledge, this is the first study to evaluate mBAS effects using individual feed intake data from feedlot cattle in North America, allowing for a more precise assessment of feeding behavior.
Interestingly, during the first two weeks, treated heifers spent less time at the feed bunk but consumed feed at a faster rate during week 1, despite only slight differences between treatments in bunk visits. This feeding pattern mirrors findings by Proudfoot et al. [38], who reported that multiparous dairy cows in competitive environments, such as the initial feeding period, increased their eating rate to maintain intake while reducing time at the bunk. Similarly, mBAS-treated heifers appeared to adopt a feeding strategy characterized by shorter, more purposeful bouts at the bunk, thereby limiting energy expenditure and competition while supporting recovery and adjustment to the feedlot environment. A previous study also reported that mBAS-treated calves spent more time in physical activity such as engaging in social behaviors (e.g., mounting) compared with untreated calves, particularly during the first eight days in the feedlot, a behavior associated not only with reproductive activity but also with the establishment of social hierarchy [16].
The behavioral shift observed, from an early burst of activity to later periods of reduced activity, suggests faster stabilization and adaptation to the new environment. The initial increase in activity, may reflect stress due to maternal separation [2], but it can also indicate exploratory behavior or motivation to engage with the novel setting, such as feed bunk [16,39]. In contrast, the subsequent decline indicates calmer behavior and greater efficiency in energy use, as also reported by Schubach et al. [16]. In their study, mBAS treated calves exhibited increased physical activity on day 1 compared with controls, but no differences were observed on subsequent days (days 2, 4, 8, 16, and 32) following treatment administration at feedlot receiving. Although the mechanisms remain unclear, this shift likely reflects reduced stress reactivity and more effective allocation of energy toward nutrient utilization, ultimately contributing to improved feed efficiency [40]. Given the known 15-day efficacy of mBAS [12,13], these findings suggest that the product may help calves transition more smoothly during the critical early adaptation period by modulating feeding dynamics and behavioral responses [15,16].
In line with this, mBAS-treated heifers exhibited greater rumination during the third- and fourth-weeks post-weaning. Rumination is a recognized indicator of stress, as stress can disrupt feeding behavior and gastrointestinal function, leading to decreased rumination [41,42]. On the other hand, increased rumination has been associated with enhanced weight gain and feed efficiency in cattle [41,43], which may partially explain the improved growth performance observed in the latter phase of the trial. The extended rumination observed in mBAS-treated heifers may also indicate improved fiber digestibility and rumen development [44]. This could result from a calmer physiological state that promotes greater saliva production, more stable rumen pH, and enhanced microbial activity [45,46]. Together, these changes in rumination and feeding behavior suggest that mBAS-treated heifers adopted a coping strategy that enhanced nutrient utilization and growth without increasing feed intake, ultimately contributing to improved feed efficiency. The observation that mBAS-treated heifers spent less time ruminating on day 0 compared to controls contradicts our initial hypothesis and remains unclear; however, since this difference was observed solely on day 0 and represented a difference of 0.9%; data not shown), it may lack biological significance. Notably, to the best of our knowledge, this is the first study to assess rumination as a behavioral indicator of stress in response to mBAS treatment in feedlot calves, and more studies are warranted to better understand its role in evaluating the long-term effects of mBAS on the welfare and adaptation of cattle entering the feedlot. Future research should explore whether these short-term behavioral changes contribute to long-term metabolic adaptation and overall immune resilience.
Although the stressors experienced by the animals in this study do not fully replicate those encountered in commercial Canadian feedlots, our findings suggest that mBAS treatment may help mitigate stress and support immune function during challenging events such as weaning. At feedlot entry, a recognized significant stressor [10], the acute phase response primes the body to defend against potential injury or infection [47]. This is evidenced particularly by lower LYM on day 14 and a tendency for increased PLT counts across the study period in the mBAS-treated group compared with controls. Reduced LYM counts, a subset of leukocytes, are often associated with stress-induced immunosuppression, which can increase an animal’s susceptibility to infections and disease. These shifts in leukocyte profiles form part of the acute phase response, a complex physiological process triggered by stress that modulates immune function and alters hematological parameters [48]. Furthermore, the observed tendency for greater PLT counts in mBAS-treated heifers may reflect enhanced hemostatic or immune readiness. Platelets play a critical role not only in clot formation but also in immune responses, including inflammation and pathogen defense [49]. Stress can influence PLT activation and numbers [50], and the elevated PLT counts in mBAS animals might indicate a more robust capacity to respond to injury or infection during stressful transitions. This finding aligns with the concept that mBAS may modulate stress pathways, supporting better physiological resilience. An increase in HCT typically reflects hemoconcentration, often resulting from dehydration or plasma volume shifts due to stress-induced reductions in water intake and elevated respiration. However, given that greater HCT was observed only on day 27, these findings likely lack biological meaning, especially considering that the acute phase response generally returns to baseline within 4 weeks post-feedlot receiving [46]. Similarly, the minimal difference in N:L ratio between groups (+0.1) may not represent a meaningful biological effect. Previous studies using acute-phase proteins (APPs) such as haptoglobin have reported reduced stress responses and improved immune function in mBAS-treated cattle under commercial feedlot conditions [12,16]. The authors also reported improved humoral immunity acquired from vaccination against respiratory viruses in mBAS-treated cattle compared to untreated cohorts [16]. In addition, enhanced earlier detection and rapid treatment of bovine respiratory disease (BRD) in “high-risk” feedlot cattle treated with mBAS was also previously reported [17]. Our findings support previous evidence that mBAS may mitigate stress-induced immune alterations; however, the absence of rectal temperature differences, and the corresponding lack of changes in other leukocyte parameters (WBC, NEU), warrants further investigation.
The behavioral and physiological benefits previously described contributed to the increased profitability associated with mBAS treatment, primarily through improvements in growth performance and feed efficiency. These results are consistent with findings by Picket et al. [17], who evaluated 120 Angus-influenced steers over a 60-day period. The slightly lower return on investment (ROI) observed in our study (~1,174%) compared to theirs (1,541%) may be attributed to differences in experimental design, study duration, animal population, environmental conditions, management practices, and baseline health status. As highlighted by Picket et al. [17], such economic evaluations should be interpreted with caution, as feed efficiency and other performance metrics may vary under different production scenarios. Nonetheless, our findings reinforce the economic potential of mBAS, demonstrating its capacity to enhance growth and efficiency in feedlot cattle, which may contribute to improved profitability over time. Despite these encouraging results, several limitations of this study should be acknowledged. The relatively small sample size may reduce the generalizability of the findings to larger, commercial-scale feedlot operations. Environmental and management variables, such as transport duration, pen replication and feed availability, could also have influenced behavioral and performance responses. Future research should consider larger sample sizes, extended monitoring periods, and diverse management systems to more robustly assess the efficacy of mBAS across commercial production contexts.
5. Conclusions
This study demonstrates that, although mBAS did not affect weight loss associated with transportation or consistently alter feed intake, it positively influenced the adaptability of weaned beef heifers to the feedlot by modulating feeding behavior, enhancing growth performance, improving specific immune parameters, and favorably affecting behavioral responses, including activity and rumination. These benefits contributed to increased feed efficiency and potentially higher profitability, suggesting that mBAS could be a valuable tool for feedlot operations seeking to mitigate weaning stress and optimize production outcomes. Given these promising results, further research is warranted to evaluate the long-term effects of mBAS and its applicability across different cattle management systems. Adoption of mBAS in commercial feedlot settings may support both improved animal welfare and economic sustainability in the beef industry.
Author Contributions
Conceptualization, D.G.; methodology, D.G.; Y.L.; A.N.; L.S.; E.E.; B.B.; B.E.; formal analysis, D.G; investigation, D.G.; Y.L.; A.N.; L.S.; E.E.; B.B.; B.E.; resources, D.G.; data curation, D.G., A.N.; writing—original draft preparation, D.G.; writing—review and editing, Y.L., A.N., L.S., E.E., I.W., S.T.; supervision, S.T.; project administration, S.T.; funding acquisition, D.G. All authors have read and agreed to the published version of the manuscript.
Funding
FERA Diagnostics and Biologicals is acknowledged for funding the project.
Institutional Review Board Statement
All animals were cared for in accordance with policies and guidelines of the Canadian Council on Animal Care [1] after review and approval by the Olds College Institutional Animal Care and Use Committee (Protocol AUP 096).
Data Availability Statement
The raw data supporting the conclusions of this article will be made available by the authors on request.
Acknowledgments
We gratefully acknowledge the Olds College of Agriculture & Technology Smart Farm team for their support during the trial.
Conflicts of Interest
The authors declare no conflicts of interest. The funders had no role in the design of the study; in the collection, analyses, or interpretation of data; in the writing of the manuscript; or in the decision to publish the results.
References
- Welfare Issues in Feedlot Cattle. In The Welfare of Cattle; Schwartzkopf-Genswein, K., Gellatly, D., Suarez, D.M., Marti, S., Janzen, E., Eds.; CRC Press, 2018 ISBN 978-1-315-28245-9.
- Enríquez, D.; Hötzel, M.J.; Ungerfeld, R. Minimising the Stress of Weaning of Beef Calves: A Review. Acta Vet Scand 2011, 53, 28. [CrossRef]
- Lynch, E.; Earley, B.; McGee, M.; Doyle, S. Effect of Abrupt Weaning at Housing on Leukocyte Distribution, Functional Activity of Neutrophils, and Acute Phase Protein Response of Beef Calves. BMC Vet Res 2010, 6, 39. [CrossRef]
- Corkum, M.J.; Bate, L.A.; Tennessen, T.; Lirette, A. Consequences of Reduction of Number of Individual Feeders on Feeding Behaviour and Stress Level of Feedlot Steers. Applied Animal Behaviour Science 1994, 41, 27–35. [CrossRef]
- Taylor, J.D.; Fulton, R.W.; Lehenbauer, T.W.; Step, D.L.; Confer, A.W. The Epidemiology of Bovine Respiratory Disease: What Is the Evidence for Predisposing Factors? Can Vet J 2010, 51, 1095–1102.
- Edwards, T.A. Control Methods for Bovine Respiratory Disease for Feedlot Cattle. Vet Clin North Am Food Anim Pract 2010, 26, 273–284. [CrossRef]
- Guasco, C.; Moriconi, M.; Vitale, N.; Fusi, F.; Schleicherová, D.; Razzuoli, E.; Vevey, M.; Bergagna, S. Weaning as Stressor for Calf Welfare. Animals (Basel) 2025, 15, 1272. [CrossRef]
- Canfax Economic Considerations on Preconditioning Calves. 2015.
- Otto M. Radostits; Gay, C.C.; Hinchcliff, K.W.; Constable, P.D. Veterinary Medicine: A Textbook of the Diseases of Cattle, Sheep, Goats, Pigs and Horses; 10th ed.; Elsevier Health Sciences, 2006;
- Cappellozza, B.I.; Cooke, R.F. Administering an Appeasing Substance to Improve Performance, Neuroendocrine Stress Response, and Health of Ruminants. Animals (Basel) 2022, 12, 2432. [CrossRef]
- Brennan, P.A. Pheromones and Mammalian Behavior. In The Neurobiology of Olfaction; Menini, A., Ed.; Frontiers in Neuroscience; CRC Press/Taylor & Francis: Boca Raton (FL), 2010 ISBN 978-1-4200-7197-9.
- Cooke, R.F.; Millican, A.; Brandão, A.P.; Schumaher, T.F.; de Sousa, O.A.; Castro, T.; Farias, R.S.; Cappellozza, B.I. Short Communication: Administering an Appeasing Substance to Bos Indicus-Influenced Beef Cattle at Weaning and Feedlot Entry. Animal 2020, 14, 566–569. [CrossRef]
- Osella, M.C.; Cozzi, A.; Spegis, C.; Turille, G.; Barmaz, A.; Lecuelle, C.L.; Teruel, E.; Bienboire-Frosini, C.; Chabaud, C.; Bougrat, L.; et al. The Effects of a Synthetic Analogue of the Bovine Appeasing Pheromone on Milk Yield and Composition in Valdostana Dairy Cows during the Move from Winter Housing to Confined Lowland Pastures. Journal of Dairy Research 2018, 85, 174–177. [CrossRef]
- Cappellozza, B.I.; Bastos, J.P.; Cooke, R.F. Short Communication: Administration of an Appeasing Substance to Bos Indicus-Influenced Beef Cattle Improves Performance after Weaning and Carcass pH. Livestock Science 2020, 238, 104067. [CrossRef]
- Fonseca, V.G.L.; Cappellozza, B.I.; de Sousa, O.A.; Sagawa, M.; Rett, B.; Chizzotti, M.L.; Cooke, R.F. Strategic Administration of an Appeasing Substance to Improve Performance and Physiological Responses of Bos Indicus Feedlot Cattle. Journal of Animal Science 2021, 99, skab322. [CrossRef]
- Schubach, K.M.; Cooke, R.F.; Daigle, C.L.; Brandão, A.P.; Rett, B.; Ferreira, V.S.M.; Scatolin, G.N.; Colombo, E.A.; D’Souza, G.M.; Pohler, K.G.; et al. Administering an Appeasing Substance to Beef Calves at Weaning to Optimize Productive and Health Responses during a 42-d Preconditioning Program. Journal of Animal Science 2020, 98, skaa269. [CrossRef]
- Pickett, A.T.; Cooke, R.F.; De Souza, I.S.; Mackey, S.J. Administering the Maternal Bovine Appeasing Substance Improves Overall Productivity and Health in High-Risk Cattle during a 60-d Feedlot Receiving Period. Journal of Animal Science 2024, 102, skae221. [CrossRef]
- Colombo, E.A.; Cooke, R.F.; Brandão, A.P.; Wiegand, J.B.; Schubach, K.M.; Sowers, C.; Duff, G.C.; Gouvêa, V.N.; Cappellozza, B.I. Administering an Appeasing Substance to Optimize Welfare and Performance of Receiving Cattle1. Translational Animal Science 2020, 4, S1–S5. [CrossRef]
- Cooke, R.F.; Mackey, S.J.; de Souza, I.S.; Mello, I.A.S.; Barreto, Y.M.; Gouvea, V.N. Administering the Maternal Appeasing Substance to Bos Taurus and B. Indicus Cattle Placed as Yearlings in Feedlots with Different Environmental Conditions. Translational Animal Science 2025, 9, txaf022. [CrossRef]
- Hodder, A.; Pajor, E.; Van Der Meer, F.; Louden, J.; Thompson, S.; Orsel, K. Feeding Behaviour and Activity of Beef Calves during the First Week at the Feedlot: Impact of Calf Source and Commingling Ratios. Applied Animal Behaviour Science 2023, 258, 105810. [CrossRef]
- Nutrient Requirements of Beef Cattle, 8th Revised Edition; National Academies Press: Washington, D.C., 2015; ISBN 978-0-309-31702-3.
- González, L.A.; Schwartzkopf-Genswein, K.S.; Caulkett, N.A.; Janzen, E.; McAllister, T.A.; Fierheller, E.; Schaefer, A.L.; Haley, D.B.; Stookey, J.M.; Hendrick, S. Pain Mitigation after Band Castration of Beef Calves and Its Effects on Performance, Behavior, Escherichia Coli, and Salivary Cortisol1. Journal of Animal Science 2010, 88, 802–810. [CrossRef]
- Kvamme, K.; Marques, R.S.; Alves Cruz, V.; Limede Cintra, A.; Ogg, M.A.; McCoski, S.R.; Posbergh, C.J.; Bradbery, A.N.; Mercadante, V.R.G.; Mackey, S.J.; et al. Multiple Administrations of Bovine-Appeasing Substance during a 42-d Preconditioning Program Followed by Feedlot Receiving and Its Effects on Physiologic, Health, and Performance Responses of Feeder Cattle. Journal of Animal Science 2024, 102, skae151. [CrossRef]
- Goodchild, A.V. Gut Fill in Cattle: Effect of Pasture Quality on Fasting Losses. Animal Science 1985, 40, 455–463. [CrossRef]
- Reynolds, M.A.; Borchers, M.R.; Davidson, J.A.; Bradley, C.M.; Bewley, J.M. Technical Note: An Evaluation of Technology-Recorded Rumination and Feeding Behaviors in Dairy Heifers. J Dairy Sci 2019, 102, 6555–6558. [CrossRef]
- Santana, M.L.; Eler, J.P.; Ferraz, J.B.S.; Mattos, E.C. Genetic Relationship between Growth and Reproductive Traits in Nellore Cattle. Animal 2012, 6, 565–570. [CrossRef]
- Burrow, H.; Seifert, G.; Corbet, N. A New Technique for Measuring Temperament in Cattle; 1988; Vol. 17;.
- Meléndez, D.M.; Marti, S.; Pajor, E.A.; Moya, D.; Heuston, C.E.M.; Gellatly, D.; Janzen, E.D.; Schwartzkopf-Genswein, K.S. Effect of Band and Knife Castration of Beef Calves on Welfare Indicators of Pain at Three Relevant Industry Ages: I. Acute Pain. J Anim Sci 2017, 95, 4352–4366. [CrossRef]
- Grandin, T. Review of Stress and Animal Welfare by Donald Broom and Ken G. Johnson. Animals (Basel) 2020, 10, 363. [CrossRef]
- Koolhaas, J.M.; Van Reenen, C.G. ANIMAL BEHAVIOR AND WELL-BEING SYMPOSIUM: Interaction between Coping Style/Personality, Stress, and Welfare: Relevance for Domestic Farm Animals. J Anim Sci 2016, 94, 2284–2296. [CrossRef]
- Silvestre, A.M.; Cruz, G.D.; Owens, F.; Ceola Stefano Pereira, M.; Hicks, B.; Millen, D. Dry Matter Intake by Feedlot Beef Cattle: Factors That Impact Intake Patterns. animal 2023, 17, 100734. [CrossRef]
- Moberg, G.P. Biological Response to Stress: Implications for Animal Welfare. | The Biology of Animal Stress: Basic Principles and Implications for Animal Welfare. Available online: https://www.cabidigitallibrary.org/doi/10.1079/9780851993591.0001 (accessed on 26 March 2025).
- Riek, A.; Schrader, L.; Zerbe, F.; Petow, S. Comparison of Cortisol Concentrations in Plasma and Saliva in Dairy Cattle Following ACTH Stimulation. J Dairy Res 2019, 86, 406–409. [CrossRef]
- Carroll, J.A.; Forsberg, N.E. Influence of Stress and Nutrition on Cattle Immunity. Veterinary Clinics of North America: Food Animal Practice 2007, 23, 105–149. [CrossRef]
- Arthington, J.D.; Eichert, S.D.; Kunkle, W.E.; Martin, F.G. Effect of Transportation and Commingling on the Acute-Phase Protein Response, Growth, and Feed Intake of Newly Weaned Beef Calves. J Anim Sci 2003, 81, 1120–1125. [CrossRef]
- González, L.A.; Schwartzkopf-Genswein, K.S.; Bryan, M.; Silasi, R.; Brown, F. Factors Affecting Body Weight Loss during Commercial Long Haul Transport of Cattle in North America1. Journal of Animal Science 2012, 90, 3630–3639. [CrossRef]
- Moya, D.; Schwartzkopf-Genswein, K.S.; Veira, D.M. Standardization of a Non-Invasive Methodology to Measure Cortisol in Hair of Beef Cattle. Livestock Science 2013, 158, 138–144. [CrossRef]
- Proudfoot, K.L.; Veira, D.M.; Weary, D.M.; von Keyserlingk, M. a. G. Competition at the Feed Bunk Changes the Feeding, Standing, and Social Behavior of Transition Dairy Cows. J Dairy Sci 2009, 92, 3116–3123. [CrossRef]
- Weary, D.M.; Jasper, J.; Hötzel, M.J. Understanding Weaning Distress. Applied Animal Behaviour Science 2008, 110, 24–41. [CrossRef]
- Nascimento, B.M.; Cavani, L.; Caputo, M.J.; Marinho, M.N.; Borchers, M.R.; Wallace, R.L.; Santos, J.E.P.; White, H.M.; Peñagaricano, F.; Weigel, K.A. Genetic Relationships between Behavioral Traits and Feed Efficiency Traits in Lactating Holstein Cows. Journal of Dairy Science 2024, 107, 8141–8149. [CrossRef]
- Welch, J.G. Rumination, Particle Size and Passage from the Rumen. Journal of Animal Science 1982, 54, 885–894. [CrossRef]
- Hansen, S.S.; Nørgaard, P.; Pedersen, C.; Jørgensen, R.J.; Mellau, L.S.B.; Enemark, J.D. The Effect of Subclinical Hypocalcaemia Induced by Na2EDTA on the Feed Intake and Chewing Activity of Dairy Cows. Vet Res Commun 2003, 27, 193–205. [CrossRef]
- Aldrighi, J.; Branco, R.H.; Cyrillo, J.N. dos S.G.; Magnani, E.; Nascimento, C.F. do; Bonilha, S.F.M.; Mercadante, M.E.Z. Ingestive Behavior and Temperament of Nellore Cattle Classified for Residual Feed Intake. Semina: Ciências Agrárias 2019, 40, 457–468.
- Diao, Q.; Zhang, R.; Fu, T. Review of Strategies to Promote Rumen Development in Calves. Animals (Basel) 2019, 9, 490. [CrossRef]
- Beauchemin, K.A.; Yang, W.Z. Effects of Physically Effective Fiber on Intake, Chewing Activity, and Ruminal Acidosis for Dairy Cows Fed Diets Based on Corn Silage*. Journal of Dairy Science 2005, 88, 2117–2129. [CrossRef]
- Fleshner, M.; Watkins, L.R.; Lockwood, L.L.; Bellgrau, D.; Laudenslager, M.L.; Maier, S.F. Specific Changes in Lymphocyte Subpopulations: A Potential Mechanism for Stress-Induced Immunomodulation. J Neuroimmunol 1992, 41, 131–142. [CrossRef]
- Alotiby, A. Immunology of Stress: A Review Article. Journal of Clinical Medicine 2024, 13, 6394. [CrossRef]
- de Souza, K.A.; Cooke, R.F.; Schubach, K.M.; Brandão, A.P.; Schumaher, T.F.; Prado, I.N.; Marques, R.S.; Bohnert, D.W. Performance, Health and Physiological Responses of Newly Weaned Feedlot Cattle Supplemented with Feed-Grade Antibiotics or Alternative Feed Ingredients. Animal 2018, 12, 2521–2528. [CrossRef]
- Jenne, C.N.; Urrutia, R.; Kubes, P. Platelets: Bridging Hemostasis, Inflammation, and Immunity. Int J Lab Hematol 2013, 35, 254–261. [CrossRef]
- Sonmez, O.; Sonmez, M. Role of Platelets in Immune System and Inflammation. Porto Biomed J 2017, 2, 311–314. [CrossRef]
Figure 1.
Least square means of dry matter intake (min/day) of Angus-influenced heifers housed in feedlot pens over a 28-day period1, following treatment with either 10-mL maternal appeasing substance (mBAS; n = 11) or 10-mL water, used as control group (CT; n = 11) at weaning, immediately prior to a 1-hour transportation1. On day 27, feed intake data was collected until 10:00 AM for both treatment groups. *Symbol denotes means that differ significantly at the P < 0.05 level. †Symbol denotes a tendency of significance at 0.05 < P < 0.10 level. Days 0, 14, and 27 represent the handling event days. .
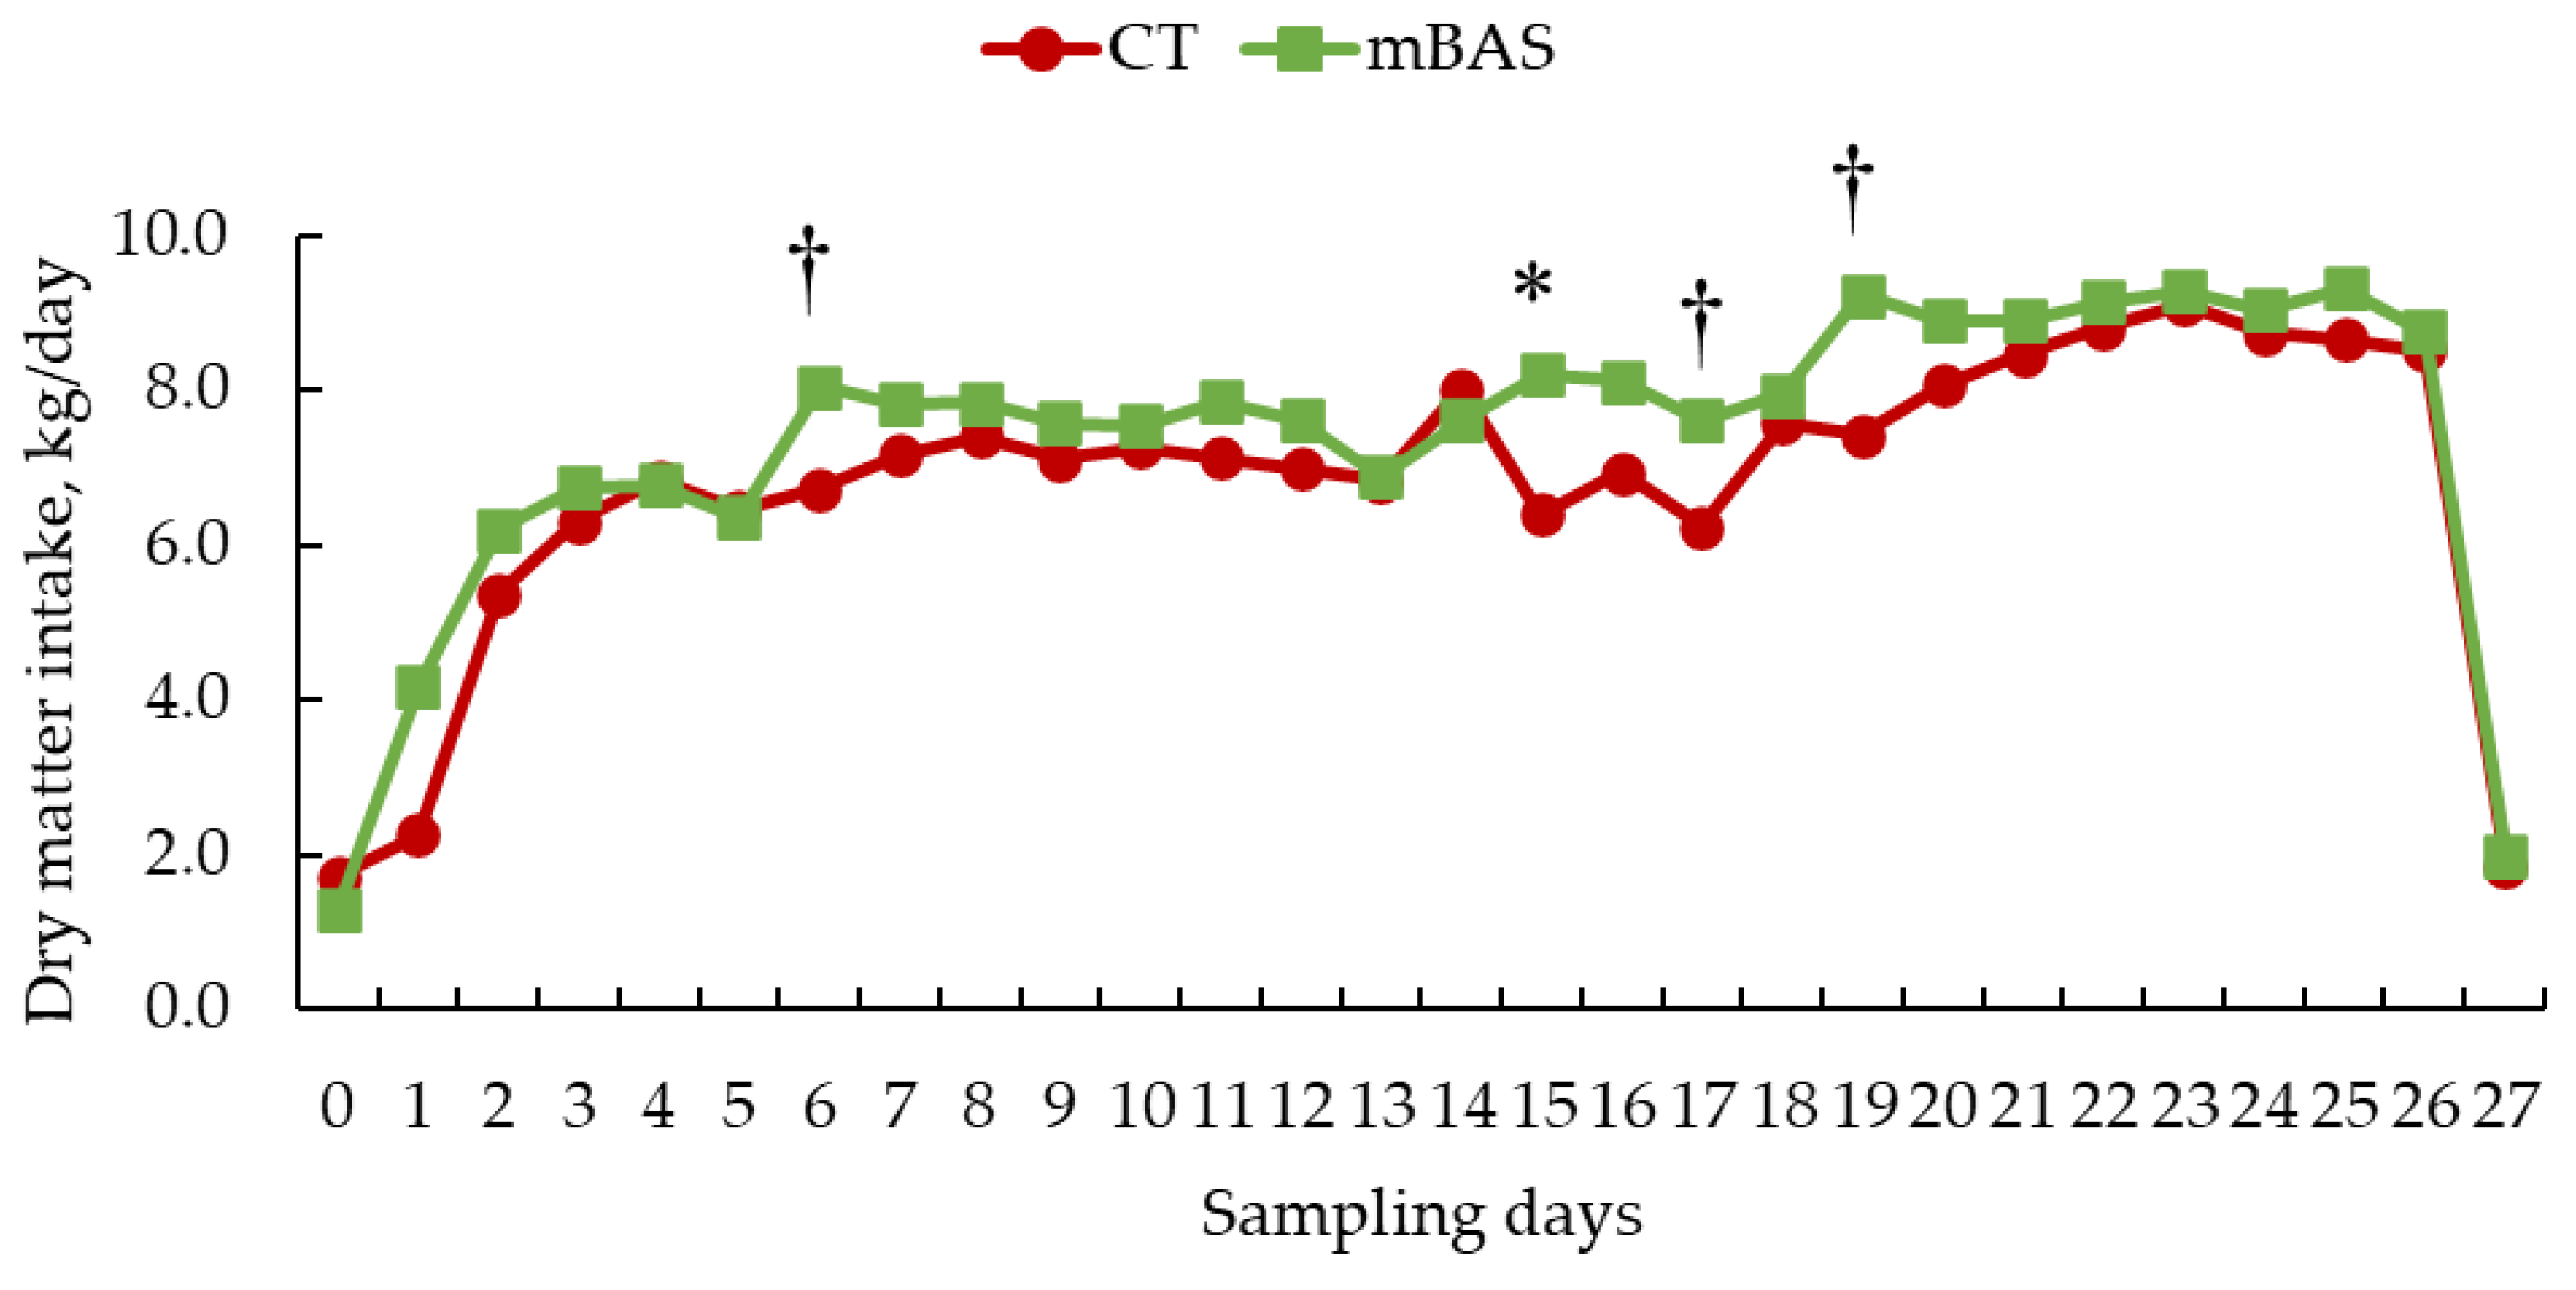
Figure 2.
Least square means of feeding duration (min/day) of Angus-influenced heifers housed in feedlot pens over a 28-day period1, following treatment with either 10-mL maternal appeasing substance (mBAS; n = 11) or 10-mL water, used as control group (CT; n = 11) at weaning, immediately prior to a 1-hour transportation1. On day 27, feeding duration data was collected until 10:00 AM for both treatment groups. *Symbol denotes means that differ significantly at the P < 0.05 level. †Symbol denotes a tendency of significance at 0.05 < P < 0.10 level. Days 0, 14, and 27 represent the handling event days. .
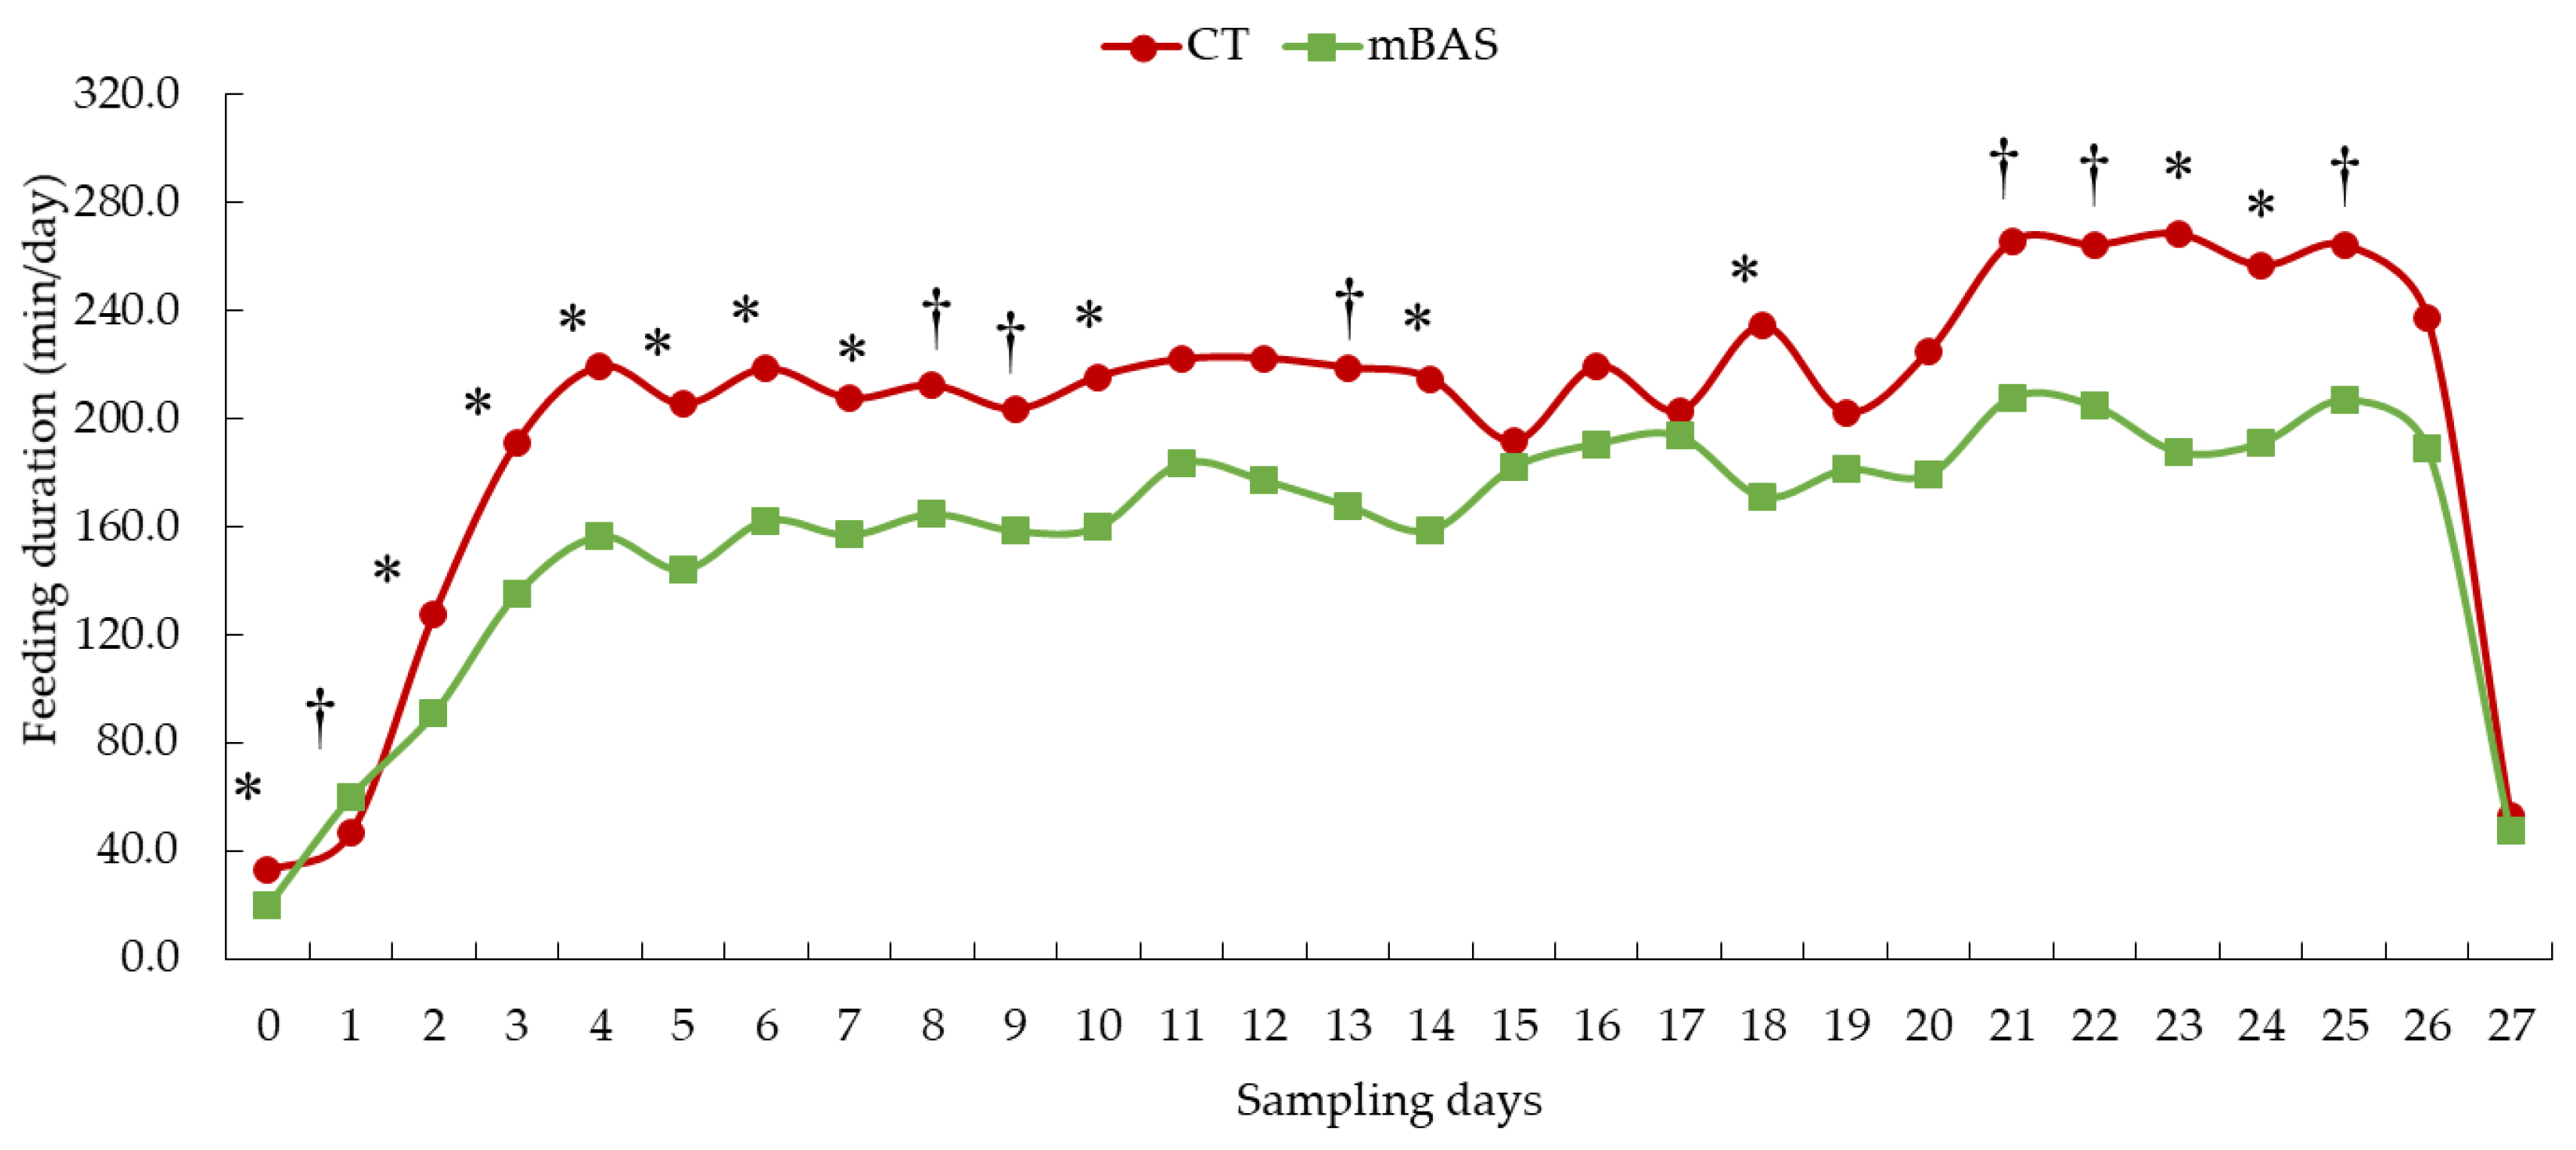
Figure 3.
Least square means of feeding frequency (visits/day) of Angus-influenced heifers housed in feedlot pens over a 28-day period1, following treatment with either 10-mL maternal appeasing substance (mBAS; n = 11) or 10-mL water, used as control group (CT; n = 11) at weaning, immediately prior to a 1-hour transportation1. On day 27, feed intake data was collected until 10:00 AM for both treatment groups. *Symbol denotes means that differ significantly at the P < 0.05 level. †Symbol denotes a tendency of significance at 0.05 < P < 0.10 level. Days 0, 14, and 27 represent the handling event days. .
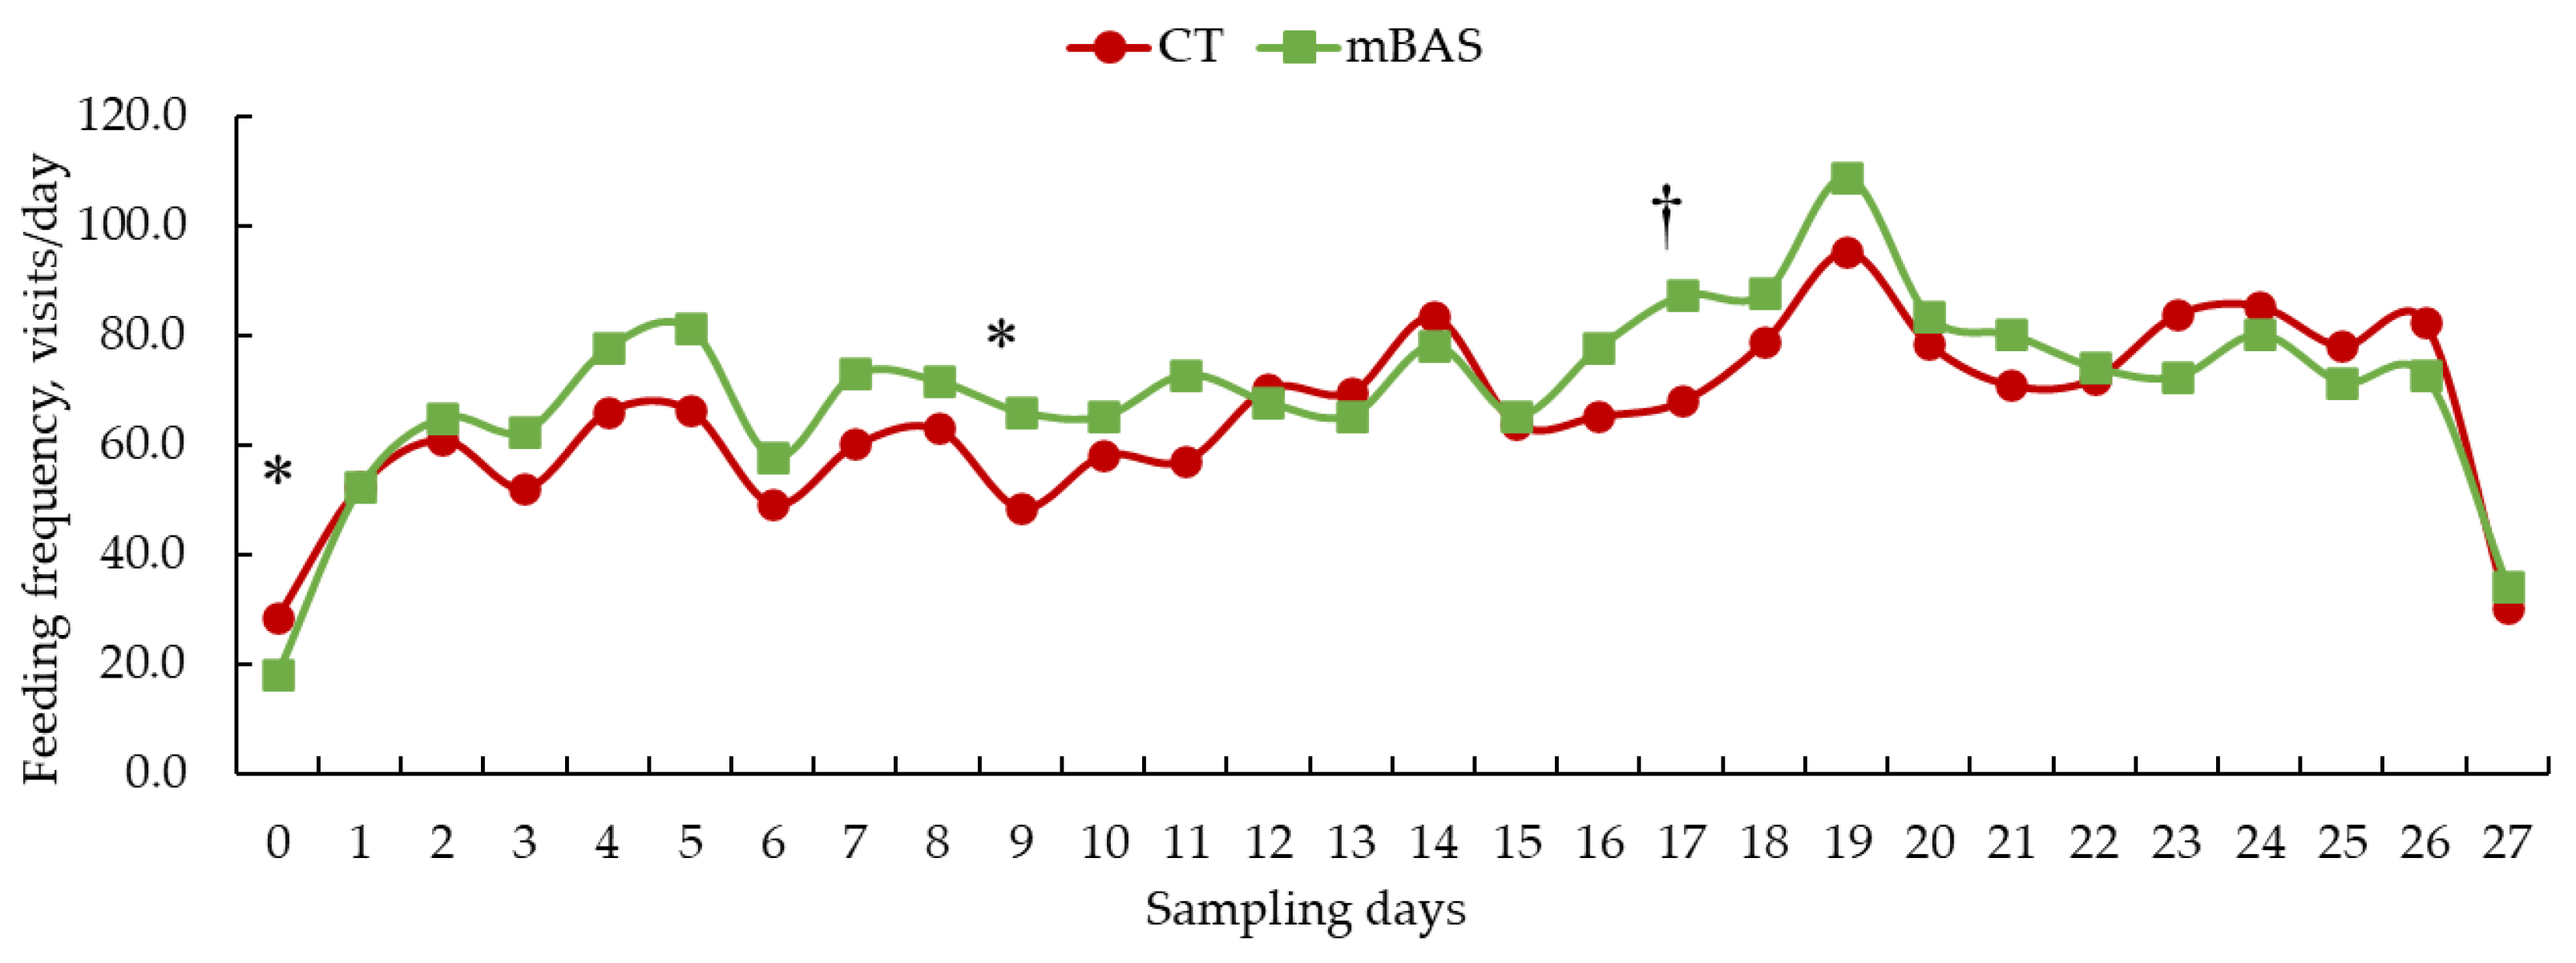
Figure 4.
Least square means for sensor-derived behavioral metrics (activity; active and non-active) of Angus-influenced heifers housed in feedlot pens over a 28-day period1, following treatment with either 10-mL maternal appeasing substance (mBAS; n = 11) or 10-mL water, used as control group (CT; n = 11) at weaning, immediately prior to a 1-hour transportation1. On day 27, sensor-derived data was collected until 10:00 AM for both treatment groups. *Symbol denotes (active) means that differ significantly at the P < 0.05 level. ‡Symbol denotes (non-active) means that differ significantly at the P < 0.05 level.
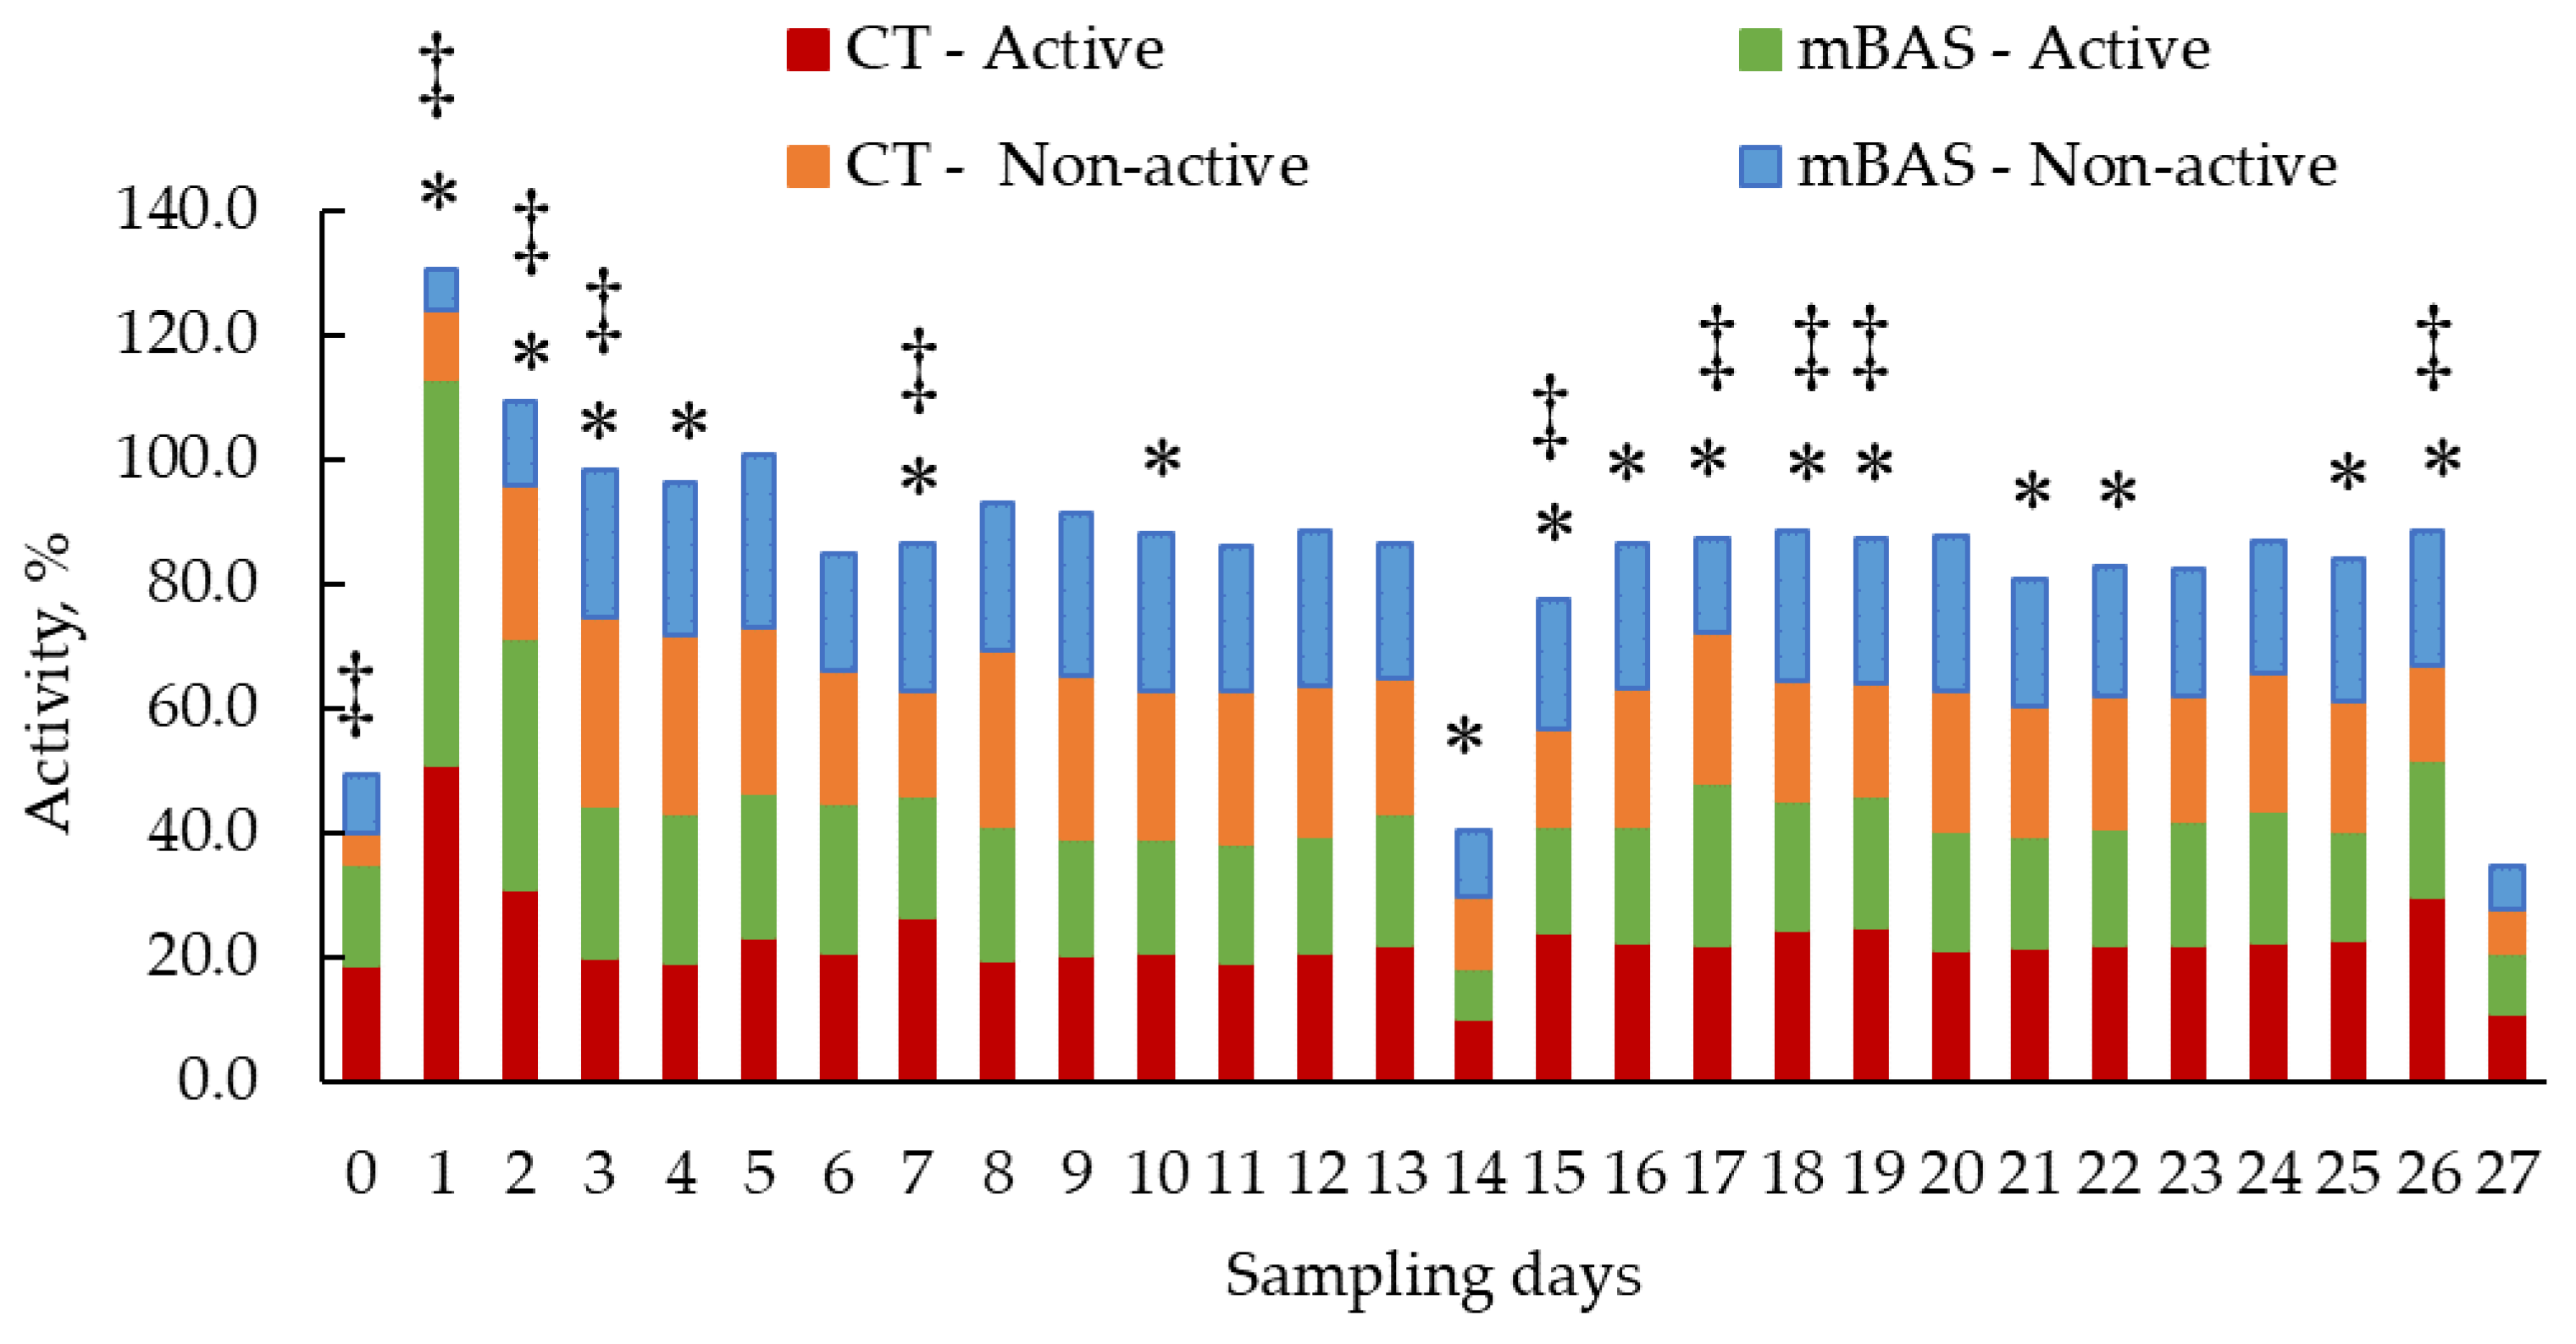
Figure 5.
Least square means for sensor-derived behavioral metrics (activity; active and non-active) of Angus-influenced heifers housed in feedlot pens over a 28-day period1, following treatment with either 10-mL maternal appeasing substance (mBAS; n = 11) or 10-mL water, used as control group (CT; n = 11) at weaning, immediately prior to a 1-hour transportation1. On day 27, sensor-derived data was collected until 10:00 AM for both treatment groups. *Symbol denotes (active) means that differ significantly at the P < 0.05 level.
Figure 6.
Least square means for sensor-derived behavioral metrics (rumination) of Angus-influenced heifers housed in feedlot pens over a 28-day period1, following treatment with either 10-mL maternal appeasing substance (mBAS; n = 11) or 10-mL water, used as control group (CT; n = 11) at weaning, immediately prior to a 1-hour transportation1. On day 27, sensor-derived data was collected until 10:00 AM for both treatment groups. *Symbol denotes means that differ significantly at the P < 0.05 level.
Figure 7.
Least square means for sensor-derived behavioral metrics (rumination) of Angus-influenced heifers housed in feedlot pens over a 28-day period1, following treatment with either 10-mL maternal appeasing substance (mBAS; n = 11) or 10-mL water, used as control group (CT; n = 11) at weaning, immediately prior to a 1-hour transportation1. On day 27, sensor-derived data was collected until 10:00 AM for both treatment groups. * Symbol denotes means that differ significantly at the P < 0.05 level.

Table 1.
Composition and nutritional profile of the total mixed ration offered for ad libitum consumption to Angus-influenced heifers housed in feedlot pens over a 28-day period, following treatment with either 10-mL maternal appeasing substance (mBAS; n = 11) or 10-mL water, used as control group (CT; n = 11) at weaning, immediately prior to a 1-hour transportation.
| Item | Value |
|---|---|
| Dry-matter, % | 56.1 |
| Composition, dry matter basis | |
| Wheat silage, % | 78.3 |
| Barley grain, % | 15.8 |
| Mineral mix1, % | 5.9 |
| Nutritional profile2, dry matter basis | |
| Net energy for maintenance, Mcal/kg | 0.80 |
| Net energy for gain, Mcal/kg | 0.51 |
| Total digestible nutrients, % | 70.0 |
| Neutral detergent fiber, % | 37.5 |
| Crude protein, % | 11.3 |
1Containing 0.61% calcium, 0.26% phosphorus, 0.17% magnesium, 1.19% potassium, 0.21% sodium, 295.00 ppm iron, 104.00 ppm manganese, 91.00 zinc, 30.00 copper (BE 32:12 Grower Supplement M440 – MSH; Bullseyefeeds®, Strathmore, Alberta, Canada). 2Wet chemistry procedures conducted by the Cumberland Valley Analytical Services, Waynesboro, PA.
Table 2.
Least square means (lower and upper limits) of dry matter intake and feeding duration, feeding frequency, and feeding rate of Angus-influenced heifers housed in feedlot pens over a 28-day period, following treatment with either 10-mL maternal appeasing substance (mBAS; n = 11) or 10-mL water, used as control group (CT; n = 11) at weaning, immediately prior to a 1-hour transportation.
| Item1 | Treatments | P-value2 | |||
|---|---|---|---|---|---|
| mBAS | CT | T | D | T × D | |
| Daily-basis | |||||
| Dry matter intake, kg/day | 6.9 (6.27 - 7.62) | 6.4 (5.81 - 6.95) | NS | <0.001 | 0.093 |
| Feeding duration, min/day | 144.9 (126.99 – 165.32) | 183.5 (162.29 – 207.51) | 0.004 | <0.001 | 0.079 |
| Feeding frequency, visits/day | 67.7 (57.95 – 79.03) | 63.6 (55.01 – 73.46) | NS | <0.001 | 0.015 |
| Feeding rate, g/min/day | 41.6a (38.84 – 44.63) | 38.8b (36.36 – 41.36) | 0.002 | <0.001 | NS |
| Weekly-basis | |||||
| Dry matter intake, kg/day | 6.9 (6.19 – 7.69) | 7.3 (6.6 – 8.02) | NS | <0.001 | 0.059 |
| Feeding duration, min/day | 168.4 (151.68 – 187.02) | 191.7 (174.16 – 210.88) | 0.073 | <0.001 | <0.001 |
| Feeding frequency, visits/day | 73.7 (58.56 – 92.83) | 65.4 (52.97 – 80.71) | NS | <0.001 | 0.025 |
| Feeding rate, g/min/day | 42.5 (38.91 – 46.43) | 38.9 (35.91 – 42.20) | NS | <0.001 | <0.001 |
a-b Different letters denote significance at P < 0.05 level. 1 The values correspond to non-transformed means and lower and higher 95% Cl; however, the P-values correspond to ANOVA analysis using log-normal transformed data. 2 T: treatment; D: day; NS = means no significant differences at P > 0..
Table 3.
Least square means (lower and upper limits) of growth performance metrics of Angus-influenced heifers housed in feedlot pens over a 28-day period, following treatment with either 10-mL maternal appeasing substance (mBAS; n = 11) or 10-mL water, used as control group (CT; n = 11) at weaning, immediately prior to a 1-hour transportation.
| Item | Treatments | P-value2 | |
|---|---|---|---|
| mBAS | CT | ||
| Initial BW, kg | 314.3 (291.08 – 337.44) | 317.5 (289.75 – 345.17) | NS |
| Shrunk BW, kg | 310.9 (309.05 – 312.83) | 311.4 (308.84 – 313.99) | NS |
| BW loss, % | 1.4 (1.05 – 1.81) | 1.4 (0.91 – 1.89) | NS |
| BW 14, kg | 346.6 (341.84 – 351.38) | 344.6 (338.93 – 350.34) | NS |
| Final BW, kg | 362.0 (355.55 – 368.38) | 352.5 (345.81 – 359.27) | 0.048 |
| ADG0-14, kg/day | 2.2 (1.88 – 2.56) | 2.1 (1.67 – 2.48) | NS |
| ADG14-27, kg/day | 1.4a (0.99 – 1.76) | 0.8b (0.42 -1.22) | 0.050 |
| ADG0-27, kg/day | 1.8 (1.54 – 2.02) | 1.4 (1.18 – 1.68) | 0.048 |
| G:F0-141, g/kg | 340 (292 – 391) | 300 (248 – 351) | NS |
| G:F14-271, g/kg | 150a (107 – 215) | 90b (60 – 125) | 0.032 |
| G:F0-271, g/kg | 240a (217 – 264) | 190b (170 – 208) | 0.002 |
a-b Different letters denote significance at P < 0.05 level. 1 The values correspond to non-transformed means and lower and higher 95% Cl; however, the P-values correspond to ANOVA analysis using log-normal transformed data. 2 NS = means no significant differences at P > 0.10.
Table 4.
Least square means (lower and upper limits) of sensor-derived behavioral metrics of Angus-influenced heifers housed in feedlot pens over a 28-day period, following treatment with either 10-mL maternal appeasing substance (mBAS; n = 11) or 10-mL water, used as control group (CT; n = 11) at weaning, immediately prior to a 1-hour transportation.
| Item1 | Treatments | P-value2 | |||
|---|---|---|---|---|---|
| mBAS | CT | T | D | T × D | |
| Daily-basis | |||||
| Active, % | 20.4 (19.53 – 21.37) | 21.8 (20.86 – 22.82) | 0.043 | <0.001 | <0.001 |
| Non-active, % | 19.2 (17.55 – 21.00) | 19.1 (17.42 – 20.84) | NS | <0.001 | <0.001 |
| Rumination, % | 25.2 (20.95 – 30.41) | 22.6 (18.73 – 27.19) | NS | <0.001 | <0.001 |
| Weekly-basis | |||||
| Active, % | 21.4 (20.54 – 22.37) | 22.7 (21.78 – 23.72) | 0.055 | <0.001 | 0.002 |
| Non-active, % | 20.5 (18.65 – 22.46) | 20.5 (18.71 – 22.54) | NS | <0.001 | 0.001 |
| Rumination, % | 29.4 (24.89 – 34.71) | 25.4 (21.48 – 29.95) | NS | <0.001 | 0.002 |
1 The values correspond to non-transformed means and lower and higher 95% Cl; however, the P-values correspond to ANOVA analysis using log-normal transformed data. 2 T: treatment; D: day; NS = means no significant differences at P > 0.10.
Table 5.
Least square means (± lower and upper limits) of reactivity at handling and health metrics of Angus-influenced heifers housed in feedlot pens over a 28-day period, following treatment with either 10-mL maternal appeasing substance (mBAS; n = 11) or 10-mL water, used as control group (CT; n = 11) at weaning, immediately prior to a 1-hour transportation.
| Item1 | Treatments | P-value2 | |||
|---|---|---|---|---|---|
| mBAS | CT | T | D | T × D | |
| CS3, score | 1.7 (1.38 – 2.19) | 2.0 (1.50 -2.68) | NS | 0.005 | NS |
| ES, m/s | 1.1 (0.91 – 1.19) | 1.0 (0.89 – 1.18) | NS | 0.009 | NS |
| Cortisol, nmol/L | 2.6 (2.09 – 3.22) | 3.2 (2.56 – 3.95) | NS | NS | NS |
| Temperature, °C | 39.3 (39.12 – 39.49) | 39.2 (39.00 – 39.38) | NS | <0.001 | NS |
| RBC3, x106/µL | 9.8 (9.33 – 10.24) | 9.7 (9.21 – 10.10) | NS | <0.001 | 0.019 |
| HCT3, % | 36.4 (36.35 – 101.51) | 34.6 (34.56 – 101.61) | 0.041 | 0.001 | 0.015 |
| HGB3, g/L | 124.1 (120.12 – 128.25) | 120.2 (116.50 – 124.08) | NS | NS | NS |
| WBC3, x103/µL | 8.9 (8.19 – 9.62) | 9.6 (8.77 – 10.36) | NS | 0.016 | NS |
| NEU3, x103/µL | 2.0 (1.63 – 2.34) | 2.4 (2.02 – 2.86) | NS | 0.001 | NS |
| LYM3, x103/µL | 6.2 (5.78 – 6.66) | 6.4 (5.98 – 6.86) | NS | 0.510 | 0.012 |
| N:L3, ratio | 0.3 (0.29 – 0.36) | 0.4 (0.34 – 0.41) | 0.085 | <0.001 | NS |
| MONO3, x103/µL | 0.2 (0.18 – 1.10) | 0.2 (0.19 – 1.10) | NS | 0.019 | NS |
| EOS3, x103/µL | 0.1 (0.10 – 0.19) | 0.2 (0.13 – 0.23) | NS | NS | NS |
| PLT3, x103/µL | 453.8 (377.74 – 545.12) | 354.9 (292.98 – 429.83) | 0.079 | 0.625 | NS |
1CS = chute score; ES = exit speed; Cortisol = salivary cortisol concentration; Temperature = rectal temperature; RBC = red blood cell count; HCT = hematocrit; HGB = hemoglobin; WBC = white blood cell count; NEU = neutrophils; LYM = lymphocyte; N:L = neutrophil-to-lymphocyte ratio; MONO = monocytes; EOS = eosinophil; PLT = platelets. 2NS = means no differences between treatment groups (P > 0.10). 3The values correspond to non-transformed means and lower and higher 95% Cl; however, the P-values correspond to ANOVA analysis using log 10 transformed data.
Table 6.
Net gain outcomes used for the return-on-investment (ROI) calculation for Angus-influenced heifers housed in feedlot pens over a 28-day period, following treatment with either 10-mL maternal appeasing substance (mBAS; n = 11) or 10-mL water, used as control group (CT; n = 11) at weaning, immediately prior to a 1-hour transportation; adapted from Pickett et al. [17].
| Item1 | Net gain1 | Difference2 | |
|---|---|---|---|
| mBAS | CT | ||
| Initial BW, kg/pen | 3,420.46 | 3,446.92 | -26.46 |
| Final BW, kg/pen | 3,943.98 | 3,562.97 | 381.02 |
| Medication, $/pen | 205.54 | 253.25 | -47.71 |
| Feed, $/pen | 625.28 | 667.76 | -42.47 |
| Initial value, $/pen | 13,134.57 | 13,236.18 | -101.60 |
| Final value, $/pen | 15,144.89 | 13,681.79 | 1,463.11 |
| Profit, $/pen | 1,179.50 | 628.03 | 551.46 |
| ROI, % | 1,174.07 | --- | --- |
1 Net gain metrics: Medication = sum of the medication costs within each treatment pen during the entire experimental period. Feed = sum of feed costs within each treatment pen during the entire experimental period. Initial and final BW = sum of the body weight within each treatment pen obtained at weaning (prior- and post-transportation; initial) and at the end of the experimental period (final). Initial and final values = calculated using the summing of pen body weight and adding a 4% shrink, and $4.00/kg for initial and final values. Profit = estimated as final value - (initial value + feed cost + medication cost) [17]. ROI = (profit difference / treatment cost) × 100; considering 11 doses per pen, which amounts to CAD$46.97 per pen (mBAS cost = approximately CAD$4.27 per 10 mL dose x 11 animals per pen). 2Difference of net gain (mBAS in relation to CT).
Disclaimer/Publisher’s Note: The statements, opinions and data contained in all publications are solely those of the individual author(s) and contributor(s) and not of MDPI and/or the editor(s). MDPI and/or the editor(s) disclaim responsibility for any injury to people or property resulting from any ideas, methods, instructions or products referred to in the content. |
© 2025 by the authors. Licensee MDPI, Basel, Switzerland. This article is an open access article distributed under the terms and conditions of the Creative Commons Attribution (CC BY) license (http://creativecommons.org/licenses/by/4.0/).
Copyright: This open access article is published under a Creative Commons CC BY 4.0 license, which permit the free download, distribution, and reuse, provided that the author and preprint are cited in any reuse.


