Submitted:
18 August 2025
Posted:
21 August 2025
You are already at the latest version
Abstract
In order to reduce Stock Keeping Unit (SKU) storage redundancy and to build a computer vision-based inventory management system, this research is based on an AWS cloud-native architecture, integrating the image recognition capability of the YOLOv7-B6 model and the elastic scheduling mechanism of AWS Lambda and AWS Fargate to optimize the compression and heterogeneous deployment scheduling of SKU-level data. The average compression ratio of the analyzed WebP and Zstandard dual-layer coding structure on 1920×1080 resolution images reaches 0.264, the redundancy rejection rate is improved to 37%, and the volume of a single SKU image is reduced from 2.8MB to 0.74MB, which reduces the storage cost by 40.12%. The average service latency of the AWS-based system is controlled at 85ms under 50 concurrent requests, and the load balancing ratio is optimized from 1.52 to 1.08. The results show that the inventory management system based on the fusion of visual recognition and containerized scheduling can effectively improve the efficiency of inventory flow and achieve structural cost reduction.
Keywords:
computer vision
; inventory management
; cloud native
; retail cost reduction
I. Introduction
Under the background of rapid iteration of the retail industry and intelligent transformation of the supply chain system, inventory management is facing multiple challenges such as high-frequency merchandise flow, redundant image data backlog, and insufficient accuracy of real-time inventory counting. The traditional inventory system relies on manual verification or rule-driven identification, which is difficult to support the collaborative demand of SKU-level refinement management and cross-regional resource scheduling. The development of computer vision technology provides a new path for image-level SKU identification, while cloud-native architecture shows significant advantages in elastic deployment, cost control and service availability. The integration of the two constitutes the key technical support for cost reduction and efficiency in retail scenarios, which is of great practical significance.
II. Overall Framework of Computer Vision Based Inventory Management System
The overall structure of the system consists of a computer vision data acquisition subsystem, a cloud-native inventory management core platform, and heterogeneous deployment components. The acquisition subsystem uses the YOLOv7 architecture for channel-by-channel recognition of single-frame images, with Edge TPUs to realize edge inference [1]. The main platform adopts AWS S3 partition compression strategy after migrating to AWS EKS, and the average compression ratio of single-category SKU image data is controlled within 0.62. The back-end service is deployed using AWS SageMaker endpoints and AWS Elastic Container Registry (ECR), streamlining resource scheduling through Serverless containers, and combining with a hierarchical indexing model to improve the response speed of inventory requests. The key modules of the system focus on multi-point concurrent image stream reconstruction, storage redundancy avoidance and real-time SKU state synchronization to reduce the storage overhead by more than 40% on the retail side and improve the efficiency of inventory flow.
III. Computer Vision Based Inventory Management System Software Design
A. Computer Vision Data Acquisition Subsystem
The computer vision data acquisition subsystem uses a distributed camera network deployed in concert with GPU edge computing modules to accomplish highly concurrent SKU image stream access and real-time acquisition preprocessing. The image input of the system is sampled at 1920×1080 resolution per frame with a sampling frequency of 2fps, and the daily processing capacity of a single node exceeds 38,000 frames.The YOLOv7-B6 model structure is used as the detection backbone, and combined with the attention-weighted channel enhancement mechanism to optimize the recognition stability in SKU-dense stacking scenarios [2]. The images are acquired, preprocessed by the embedded Jetson Xavier module and uniformly encapsulated into a multi-task tensor representation defined as:
where is the SKU feature response at the (i, j) location, is the background interference term, is the image metadata, and is the weighting factor [3]. The preprocessing tensor is uniformly uploaded to AWS S3 Glacier deep-cooled storage, and the image redundancy compression ratios are listed in Table 1. The edge node state distribution and processing efficiency are shown in Figure 1. This module is designed to support asynchronous decoupling through AWS Lambda and Amazon EventBridge, ensuring data consistency and latency tolerance of the back-end inventory scheduling module in high I/O scenarios.
B. Cloud-Native Inventory Management System
The cloud-native inventory management system is designed based on containerized microservice architecture, with core services deployed in AWS EKS clusters, adopting an elastic node auto-scaling mechanism, and supporting asynchronous loading of heterogeneous data structures at the SKU level [4]. The system maps the image index data and the dynamic inventory request vector to the resource scheduling function:
where denotes the index density of image block at m×n location, is the request intensity att time, latt is the average response delay, and δ,μ,λ is the system scheduling weight parameter [5]. The system introduces parallel compression channels, utilizing the WebP and Zstandard bi-layer coding mechanism, which is specifically designed for redundancy-avoiding compression of SKU image data, thereby enhancing storage efficiency distribution is listed in Table 2. The data uploaded by edge nodes is unified into S3 Glacier and combined with Tagging policy to realize lifecycle management, controlling the single SKU data version to be no more than 3. AWS App Runner is used for deploying multi-tenant service routers, supporting Amazon API Gateway unified access and AWS Global Accelerator for multi-region replica consistency scheduling, and the deployment topology is shown in Figure 2.
However, the use of fixed compression parameters limits adaptability to different image structures, resulting in a suboptimal average compression ratio of 0.264 for high-resolution images. To address this, future implementations will consider content-aware dynamic encoding strategies that adjust compression intensity based on local entropy and structural redundancy. The inventory mapping engine further introduces a SKU semantic mapping building module that performs feature aggregation for each node in G = (V,E) using a graph convolutional network:
where is the features of the nodei in the firstl layer, W(l) is the learnable weight matrix, di is the degree of the node i, σ is the activation function, and Figure 3 illustrates the input-output structure of the GCN module in inventory semantic aggregation [6].
C. Retail Cost Reduction Key Technology Realization
Retail cost reduction is achieved through multi-source image structure compression, asynchronous data upload scheduling, and elastic service scaling, forming an integrated optimization framework, asynchronous upload scheduling and elastic scaling of service deployment [7]. The system defines the total cost function as:
where denotes the storage overhead, is the cost of transmitting traffic across regions, is the image encoding computational resource consumption, and is the system load cost introduced by container scheduling. Represents the inter-region transmission overhead caused by the migration of hot/cold data between different regions Indicates metadata management costs generated by version control. Where is further denoted as:
where is the compressed image volume (MB) of the first i SKU, is the unit storage cost (MB-day), and is the SKU lifecycle duration (days). The AWS Lambda-based deployment scheduling policy adopts a bandwidth-weighted minimum load prioritization mechanism, effectively balancing resource allocation in a multi-tenant environment:
where is the prioritized scheduling probability of the service nodej, is the node bandwidth weighting factor, is the current load index, and the scheduling decision is determined by max(Pj) [8]. Compared to traditional Round-Robin and Kubernetes bin-packing schedulers, this strategy dynamically integrates real-time bandwidth constraints and load balancing, achieving up to 13.2% reduction in queue latency under 50-concurrent SKU image requests. Its adaptability makes it well-suited for heterogeneous resource environments in elastic retail deployments. The image compression part combines Zstandard entropy coding with image block level redundancy identification and the redundant region is defined as:
Where is the (i, j) location image block, is the block mean, is the similarity threshold, and II is the metrics function. AWS EKS dynamic cold archive trigger controls the frequency of redundant data transfers, ensures that the compressed write rate is maintained at Rw < 18 MB/s, and uniformly controls the maximum number of SKU versions under multi-tenant conditions at Kmax ≤ 3. The system builds a link-wide cost control strategy through function-level metrics modeling to improve cost reduction in heterogeneous regional deployment environments [9].
IV. System Experimental Results and Cost Reduction Effect Analysis
A. Experimental Environment and Test Program
The experimental environment is constructed in the AWS Oregon and Singapore regions, using a dual-zone heterogeneous deployment scheme, with the server-side configuration of 32-core vCPU, 256GB memory, NVIDIA A100 GPU × 2, network bandwidth set to 1.2Gbps, and edge-side nodes deployed in parallel using Jetson Xavier AGX. The test scheme is designed as follows: (1)Build SKU image datasets with 120 categories and a total of 110,000 images, sourced primarily from Concrete-Crack500, SDNET2018, and UAV-collected images from retail store environments, to evaluate image acquisition latency and throughput; (2) test the WebP+Zstd co-coding computation consumption and storage write rate under different compression ratios; (3)perform multi-tenant dynamic concurrency simulation of the AWS SageMaker endpoint-based service scheduler to validate the container cold-start latency and request queue fluctuation response; (4) applying 50 concurrent HTTP traffic pressure for 5 minutes to monitor the average service latency and the triggering logic of cross-region load balancing policy.
B. System Functional Verification
The system function validation covers four major modules: image recognition, data compression, service scheduling and multi-tenant request processing. The image recognition module completes frame-by-frame detection with a frame rate of 2fps in SKU dense stacking scenarios, with an average processing time of 38ms for a single frame, and supports a number of parallel channels of up to 16; the data compression module realizes a Zstd compression rate of 12.5MB/s for a 1920×1080 image, with a block-level redundancy rejection rate of 29%~37%. The block-level redundancy rejection rate is maintained between 29% and 37%, and the average compression ratio is 0.264; the service scheduler maintains an average response latency of 85ms under the dynamic access of 50 concurrent tenants, and the service scheduler maintains an average response latency of 85ms under dynamic access from 50 concurrent tenants, with a maximum cold start delay of 280ms. This bandwidth-weighted minimum load scheduling strategy demonstrates a degree of effectiveness in resource balancing, but has not yet been benchmarked against native Kubernetes algorithms such as LeastRequestedPriority. In real-world retail scenarios—such as bulk SKU validation before promotional events or high-concurrency inventory audits—the 280ms delay remains acceptable for non-real-time workloads. However, its impact on latency-sensitive business processes still requires further evaluation through scenario-specific traffic simulations and threshold fine-tuning. the container horizontal expansion strategy triggers automatic deployment after the load factor exceeds the 0.7 threshold, and the new replica startup time is less than 3.2 seconds, and the load balance ratio is controlled within 1.08, which meets the requirement of the load balance ratio. The load balance ratio is controlled within 1.08, which meets the system-level all-link cooperative scheduling capability verification requirements [10].
C. Analysis of Retail Cost Reduction Effect
The system conducts quantitative comparison experiments on image storage cost, service compute resource occupation and scheduling load in the retail cost reduction path. The average compression ratio after image compression is 0.264, and the percentage of redundant blocks of single SKU data is reduced from 38.6% to 12.4%; the average monthly write traffic of off-site cold archiving is controlled within 71.3GB. Deployment resource utilization efficiency improves to 68.5% after enabling Cloud Run dynamic replica scheduling, scheduling load balancing ratio is optimized from 1.52 to 1.08, and concurrent processing capacity under the same resource configuration is supported to increase by 39.2%. Specific indicators are shown in Table 3:
The data in Table 3 shows that the compression rate is greatly improved by the combination of image block-level redundancy detection and double-layer compression structure, while the write traffic is suppressed by the redundant partitioning strategy and delayed upload trigger mechanism. Service-side cost optimization focuses on the dynamic expansion of replica scheduling and multi-tenant scheduling deployment, so that the scheduling system can avoid the waste of peak resources under load impact, and the CPU utilization rate is effectively controlled. The overall analysis shows that the system has completed the compressive reconfiguration of the cross-domain resource structure under the premise of maintaining the service responsiveness, and supports the high-frequency image recognition retail business environment oriented to the SKU dimension.
V. Conclusion
To summarize, the system builds an overall inventory management architecture covering data acquisition, compression and encoding, container scheduling, and cross-region deployment with the deep integration of computer vision and AWS cloud-native technologies such as AWS EKS, Lambda, and SageMaker, which significantly reduces the storage and computation overheads in the SKU image processing link, and improves the system’s resource scheduling efficiency and responsiveness in high-concurrency retail scenarios. Image compression rate, cold archive write control and multi-tenant scheduling separation mechanism together constitute the key support path for retail cost reduction. In future applications, the system can be further extended to adaptive visual model deployment and inventory semantic mapping dynamic update mechanism to promote the evolution of intelligent inventory management system for multi-format retail environment.
References
- Shahin M, Chen F F, Hosseinzadeh A, et al. Robotics multi-modal recognition system via computer-based vision[J]. The International Journal of Advanced Manufacturing Technology, 2025, 136(9): 3989-4005. [CrossRef]
- Chbaik N, Khiat A, Bahnasse A, et al. Analyzing Smart Inventory Management System Performance Over Time with State-Based Markov Model and Reliability Approach, Enhanced by Blockchain Security and Transparency[J]. Statistics, Optimization & Information Computing, 2025, 13(2): 508-530. [CrossRef]
- Maskey, R. Enhancing Robotic Precision: Integrating Computer Vision with Advanced Mechanical Systems[J]. Global Research Review, 2025, 1(1): 9-16.
- Jafari F, Dorafshan S. Vision based stockpile inventory measurement using uncrewed aerial systems[J]. Ain Shams Engineering Journal, 2025, 16(2): 103251. [CrossRef]
- Madamidola O A, Daramola O A, Akintola K G, et al. A review of existing inventory management systems[J]. International Journal of Research in Engineering and Science (IJRES), 2024, 12(9): 40-50.
- Alam M K, Thakur O A, Islam F T. Inventory management systems of small and medium enterprises in Bangladesh[J]. Rajagiri management journal, 2024, 18(1): 8-19. [CrossRef]
- Kaushik, J. An inventory model for deteriorating items with blockchain process: how will it transform inventory management system[J]. Cogent Business & Management, 2025, 12(1): 2479571. [CrossRef]
- Panigrahi R R, Shrivastava A K, Nudurupati S S. Impact of inventory management on SME performance: a systematic review[J]. International Journal of Productivity and Performance Management, 2024, 73(9): 2901-2925. [CrossRef]
- KODAKANDLA, N. Serverless Architectures: a Comparative Study of Performance, Scalability, and Cost in Cloud-native Applications[J]. Iconic Research And Engineering Journals, 2021, 5(2): 136-150.
- Zhang R, Li Y, Li H, et al. Evolutionary game analysis on cloud providers and enterprises’ strategies for migrating to cloud-native under digital transformation[J]. Electronics, 2022, 11(10): 1584. [CrossRef]
Figure 1.
Architecture of computer vision based inventory management system.
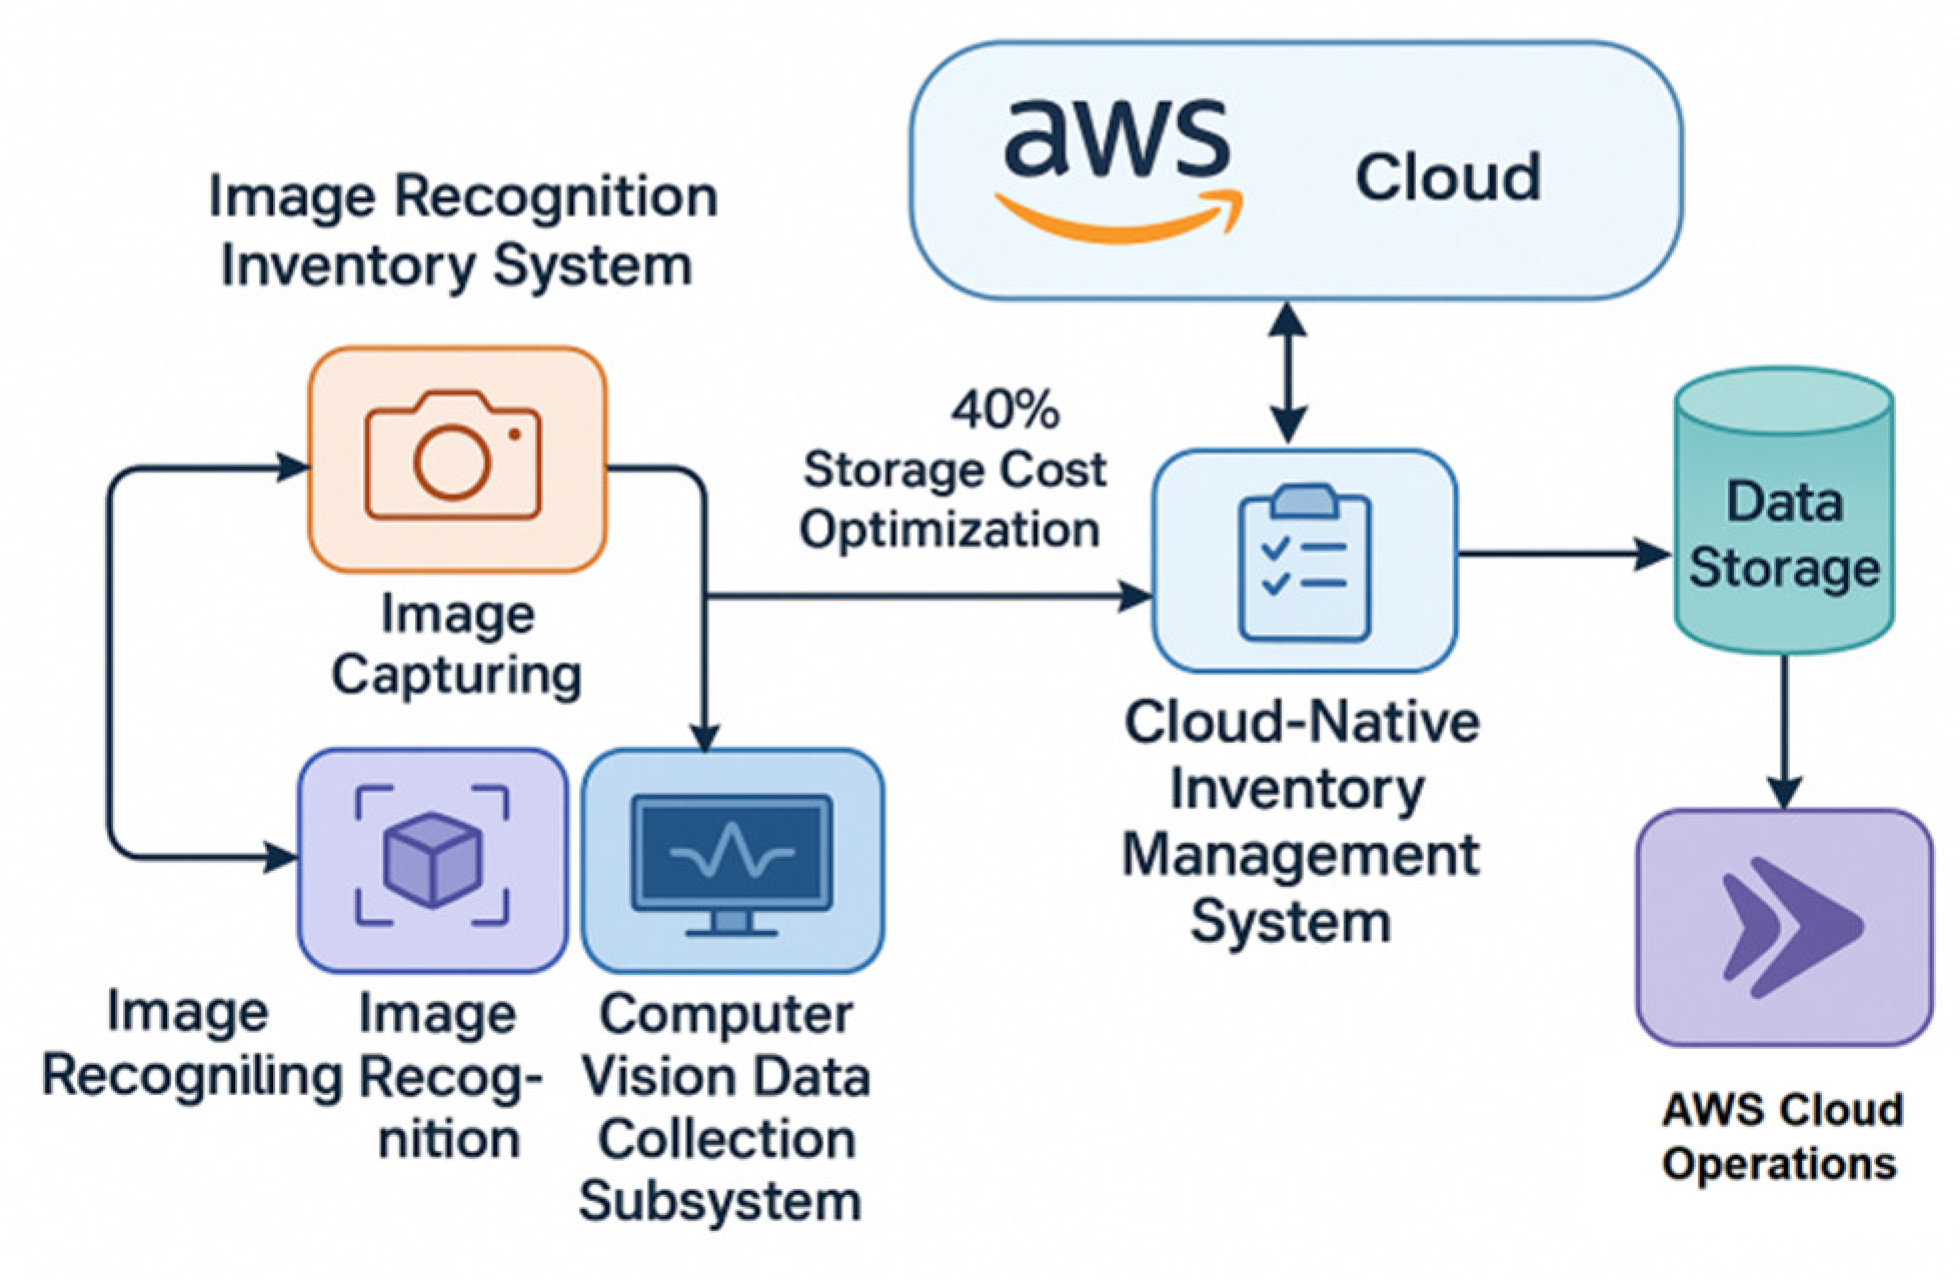
Figure 2.
Topology of a multi-region deployment of a cloud-native inventory system.
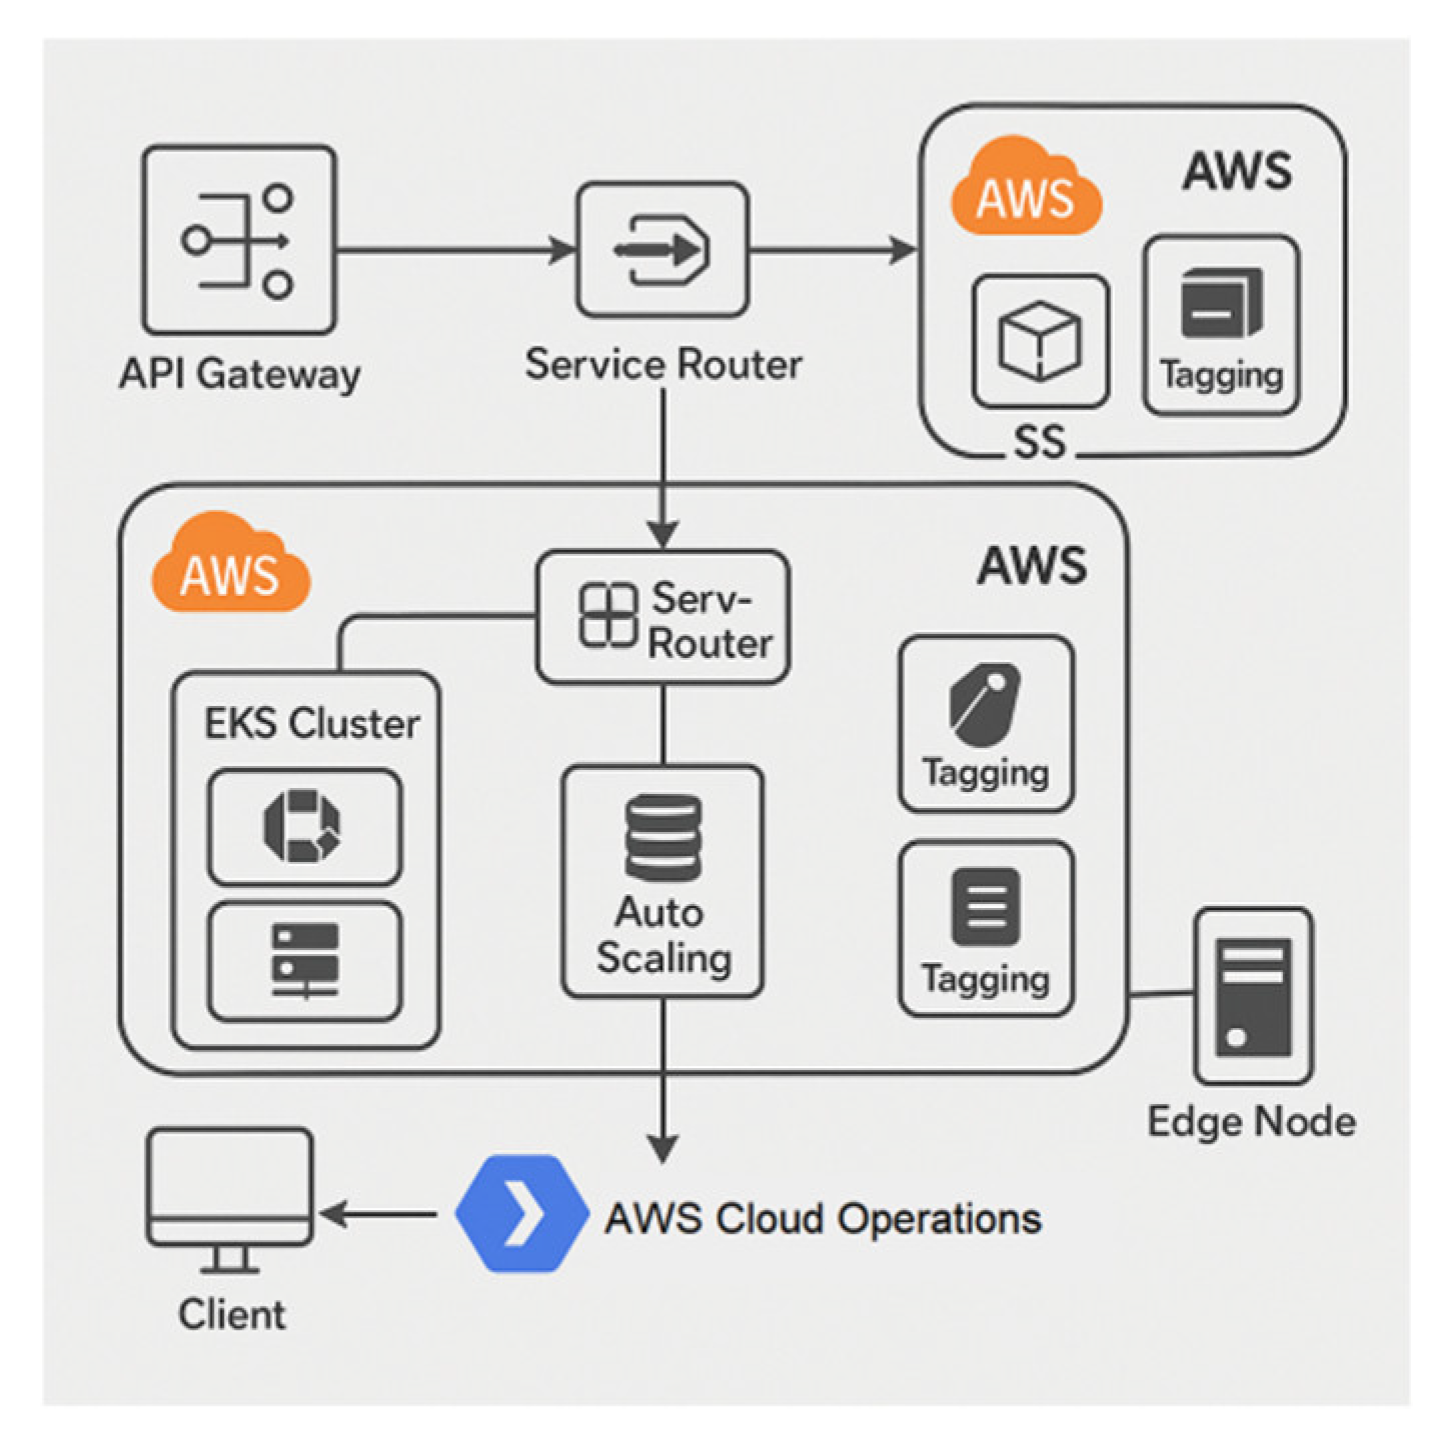
Figure 3.
Input-output structure of GCN module in inventory semantic aggregation.
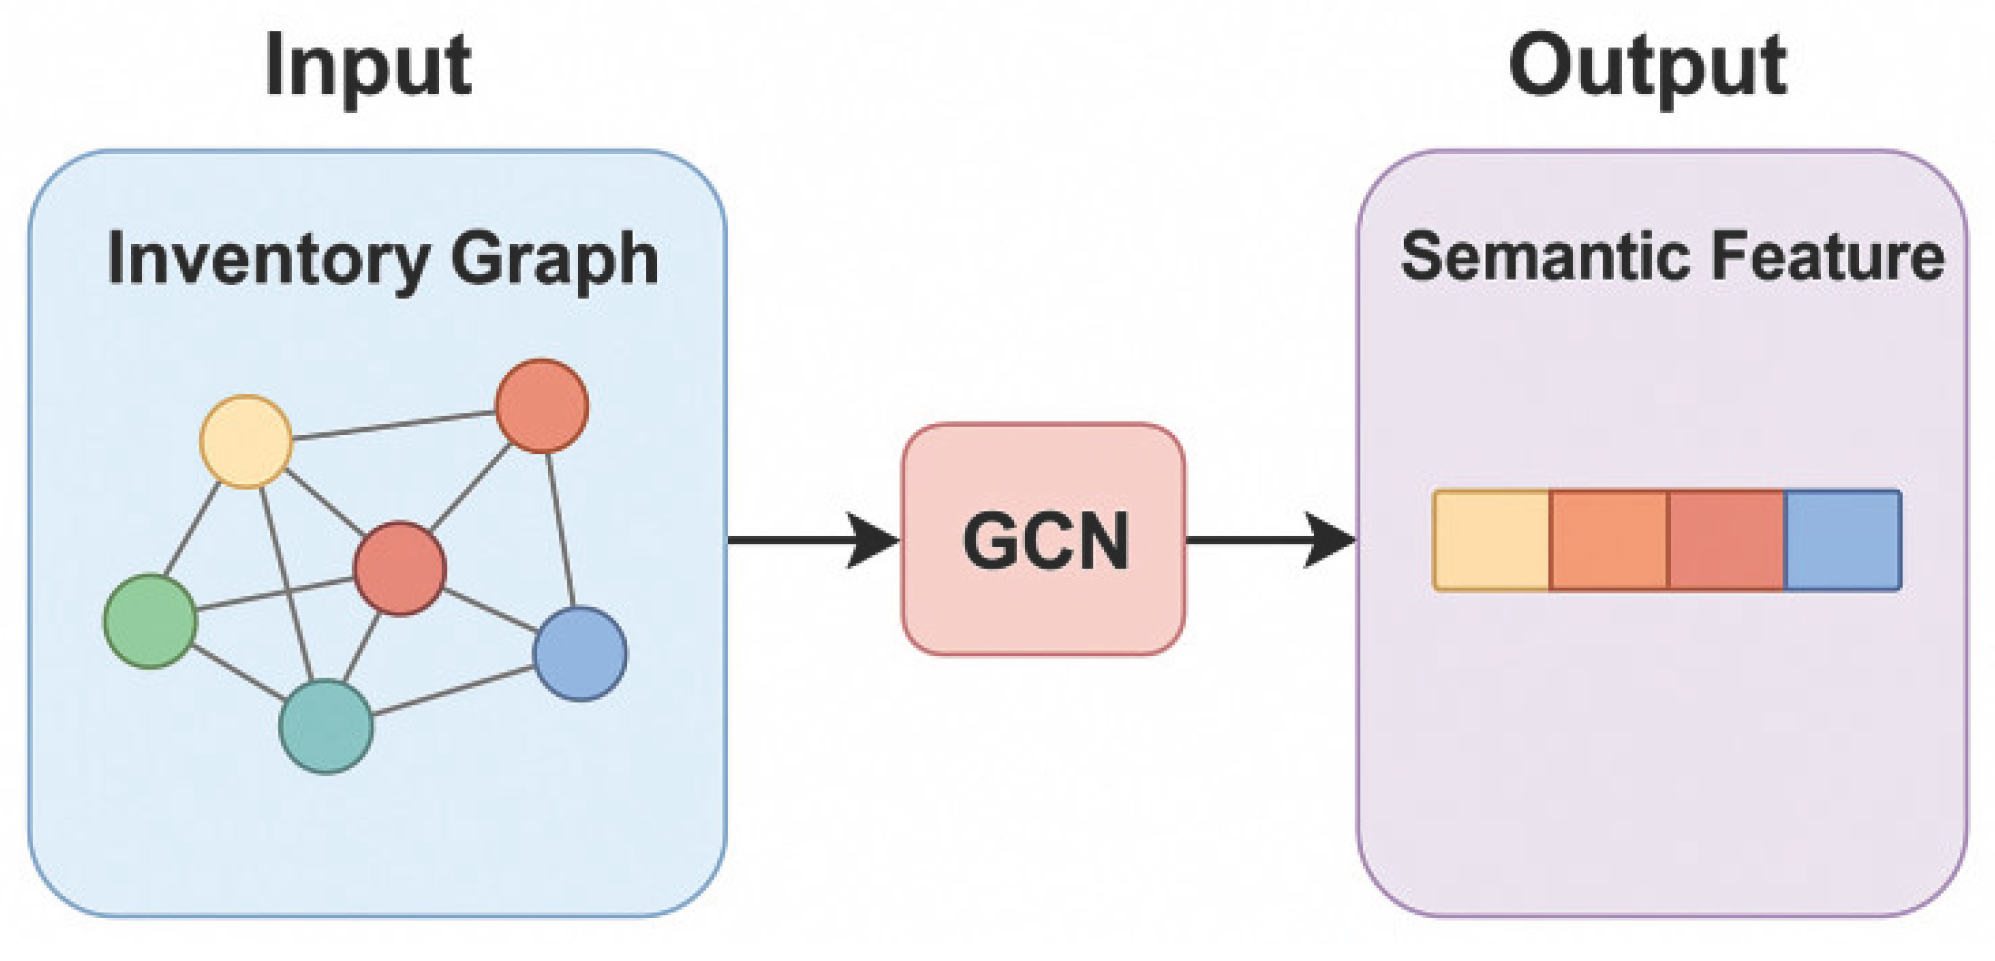

Table 1.
SKU image data compression parameter configuration table.
| image resolution | Original single frame size (MB) | Average size after compression (MB) | compression ratio | coding format | Whether to use tiered storage |
| 1920×1080 | 2.8 | 1.1 | 0.392 | WebP | be |
| 1280×720 | 1.6 | 0.65 | 0.406 | WebP | be |
| 640×480 | 0.95 | 0.41 | 0.432 | JPEG2000 | clogged |
Table 2.
SKU image compression configuration and storage parameters table.
| image resolution | Original frame size (MB) | WebP code size (MB) | Zstd secondary compression size (MB) | Total compression ratio | storage strategy | Lifecycle version control |
| 1920×1080 | 2.8 | 1.1 | 0.74 | 0.264 | S3 Glacier | ≤3 version |
| 1280×720 | 1.6 | 0.62 | 0.45 | 0.281 | S3 Glacier | ≤3 version |
| 640×480 | 0.95 | 0.41 | 0.3 | 0.316 | Local SSD Cache | ≤2 version |
Table 3.
Summary of key technical performance indicators for retail cost reduction.
| sports event | Data before optimization | Optimized data | Cost reduction or optimization rate |
| Average image volume per SKU (MB) | 2.8 | 0.74 | 73.57% |
| Total daily image writes (GB) | 156.3 | 71.3 | 54.40% |
| Average daily cost of storage occupancy ($) | 328 | 196.4 | 40.12% |
| Service Load Balancing Ratio | 1.52 | 1.08 | 28.95% |
| Peak CPU utilization (%) | 94.2 | 68.5 | 27.27% |
Disclaimer/Publisher’s Note: The statements, opinions and data contained in all publications are solely those of the individual author(s) and contributor(s) and not of MDPI and/or the editor(s). MDPI and/or the editor(s) disclaim responsibility for any injury to people or property resulting from any ideas, methods, instructions or products referred to in the content. |
© 2025 by the authors. Licensee MDPI, Basel, Switzerland. This article is an open access article distributed under the terms and conditions of the Creative Commons Attribution (CC BY) license (http://creativecommons.org/licenses/by/4.0/).
Copyright: This open access article is published under a Creative Commons CC BY 4.0 license, which permit the free download, distribution, and reuse, provided that the author and preprint are cited in any reuse.


