Submitted:
20 August 2025
Posted:
21 August 2025
You are already at the latest version
Abstract
The study focuses on the implementation of flow rate sensing and measurement in smart inhalers for the effective management of respiratory diseases. It highlights the importance of adhering to proper inhalation techniques and maintaining consistency for managing respiratory conditions. Methods and relevant commercial and prototype research-type devices for sensing and measuring inhalation flow rate in smart inhalers are evaluated and compared. The findings show that the utilisation of acoustic analysis combined with air-pressure sensing is a promising approach to detect and assess the inhaling action, ultimately allowing for improvement in treatment outcomes and quality of life for patients with respiratory diseases.
Keywords:
Experimental study
; smart inhaler
; inhalation flowrate
; airflow measurement
1. Introduction
The work presented in this paper builds upon the review of inhalation flow rate measurement in portable smart inhalers [1]. The review confirms that proper inhaler technique and consistent adherence are essential for the effective management of respiratory conditions. At the same time, inhalation flow rate monitoring has emerged as a promising approach in achieving it. Unfortunately, the prevalence of inhaler mishandling remains a significant clinical challenge, particularly in ensuring accurate dose delivery, which depends on the optimal inhalation flow rate specific to each inhaler model.
The literature (e.g., [2,3,4,5,6,7,8,9,10,11]) supports the advantages of employing training devices to guide and improve inhalation technique. Despite their benefits, these devices are not without limitations, such as the inconvenience of private usage and compatibility issues across various medications and inhaler models. Moreover, the selection and utilisation of inhalers still rely on consultations with healthcare professionals. This highlights the need for continued research to develop and evaluate a new generation of smart inhaler devices. Such devices should be capable of measuring flow rates and offer personalised feedback, potentially reducing the need for regular training and healthcare personnel involvement while enhancing treatment efficacy. This necessitates the development of innovative technologies for measuring and controlling the inhalation flow rate.
An approach utilising cost-effective acoustic sensors in conjunction with signal analysis for airflow measurements has been proposed as a promising avenue for research and development in smart inhalers [1]. Unfortunately, despite the potential of acoustic-based (in a broader sense, vibration-based) solutions, they have not yet been thoroughly researched for the utilisation in smart inhaler devices. This emphasises the need for an experimental study and characterisation of the approach's applicability in the smart inhaler domain.
The primary focus of the research presented in this paper is the investigation of the correlation between the inhalation flow rate and the associated vibrations (acoustic signals) in the smart inhaler enclosure. The paper is organised as follows. Section 2 outlines the experimental setup developed for the reported study. Section 3 presents detailed results of the experimental research. The findings are then discussed and summarised in Section 4, along with providing conclusions and directions for future research.
2. Experimental Study Setup
A reliable experimental setup (Figure 1) was essential to ensure the quality and validity of the study examining the relationship between airflow rate and inhaler enclosure vibrations. This setup used a placebo pressurised metered-dose inhaler (pMDI) [12] as an input device.
The airflow rate of interest was 30-60 Standard Litres Per Minute (SLPM or just LPM for brevity), which is the average optimal breathing rate for pMDI [13,14]. The inhaler enclosure outlet was connected to the airflow sensor (Mass Airflow Sensor, Honeywell AWM720P1 [15]) using plastic pipe connectors, allowing flexibility. The airflow sensor was protected with a simple filter, as required by the datasheet. It had a sufficient flow rate range of up to 200 LPM, with the highest sensitivity in the 0-60 LPM range, which met all the study requirements. The airflow sensor was powered by a 10 V DC power supply (Thurlby Thandar Instruments PL320QMD [16]). The correlation between output voltage and flow rate can be determined by fitting the manufacturer’s calibration data shown in Table 1. The airflow sensor measurements could then be used to analyse the air flow properties in terms of real-time airflow rate, the inhaled volume, and the inhalation duration (Figure 2).
The study investigated the vibration response of the inhaler enclosure within the frequency spectrum of 0-50 kHz. A vibration sensor (DiMarzio DP130 Acoustic Model [17]) was attached to the inhaler enclosure using a reusable adhesive, ensuring a strong connection for vibration transmission. A battery-powered amplifier with a gain of 10.5 dB, operating within the 0.5-20 kHz frequency range, was used to amplify the signal received from the vibration sensor. The sensors’ outputs were connected to a computer via a data acquisition module (DAQ) DT9832 [18], which offered a signal bandwidth of 10 MHz, ±1 mV of analogue input accuracy within the ±10 V range, and 16-bit resolution, thus adequately meeting the study's requirements. The employed MATLAB software [19] included R2015b (version 8.6.0.267246) for interfacing with the module and recording signals, and R2022b (version 9.13.0.2105380, Update 2) for signal processing.
The operation and functionality of the experimental setup were successfully tested and validated by recording responses for three scenarios: a) the placebo injection, b) breathing without the placebo injection, and c) the placebo injection followed by breathing. Each recording was 10 seconds long and had a sampling rate of 40,000 samples per second (SPS), enabling the detection of frequencies up to 20 kHz.
A second experimental setup, shown in Figure 3, was used to examine the relationship between the amplitude of the vibration signal in a noise-free frequency range and the airflow rate value. The experimental setup included a container with a removable lid that housed the inhaler. The inhaler’s mouthpiece passed through a sealed hole in the enclosure. Compressed air was directed through an airflow sensor before entering the container. The airflow rate was regulated by a valve located remotely from the setup to minimise noise caused by pressure fluctuations around the valve. When the container lid was closed, the airflow had to pass through the inhaler before exiting the enclosure. This configuration is referred to as the “Through Enclosure” setup. Measurements were also made using a second configuration where the container lid was removed. This allowed the air to exit the enclosure without passing through the inhaler. This configuration is referred to as the “Pass By” setup.
The objective of creating the modified setup was to distinguish the vibration signal originating from the inhaler enclosure from the signal emitted by other sources and carried by air. The vibrations caused by air passing through the enclosure were obtained with the enclosure’s lid on (“Through Enclosure” configuration). The background noise from the compressed air and external vibrations was aimed to be captured using the configuration with the enclosure’s lid removed (or “Pass By”) configuration.
To evaluate the efficiency of the proposed two-configuration setup arrangements, eight pairs of recordings were collected. Each pair had a different constant airflow rate, which was determined by the airflow sensor output voltage level. Each recording was 5 seconds long and had a sampling rate of 100 kHz. The recordings captured responses from both the airflow and vibration sensors simultaneously, including a timestamp.
The vibration response of the recordings was analysed and compared in the time and frequency domains using a Fast Fourier Transform [FFT] [20], as well as by evaluating the power spectral density (PSD) [21]. This was used to identify the distinct differences in the vibration responses between the two setup configurations. The data was then analysed to determine how the inhaler enclosure vibrations varied with the different flow rates. The goal was to identify several specific vibration frequencies that were correlated with the signal strength of the flow rate passing through the inhaler enclosure. A FFT smoothing algorithm that used averaging FFT values into a smaller number of bins was applied to obtain a smoothed representative spectral graph for ease of analysis.
The differences found during the analysis were further examined by measuring the flow rate in a quasi-real-time mode. This involved measuring the vibration signal over short time intervals (50 ms), processing the signal to estimate the mean flow rates within each interval, and repeating the cycle. The vibration signal was analysed in the frequency domain by calculating the sum of the amplitudes within specific spectral bands. This will be referred to below as the FFT “Total Amplitude” for the spectral band.
The method was assessed using the selected spectral bands. The assessment involved a quasi-real-time recording that collected vibration-based metrics, including the flow rate, the mean flow rate per interval, and the timestamp. The main difference from previous recordings was that the flow rate varied over time within a single recording. The recordings’ lengths were extended to 30 seconds to capture a range of flow rates and transient processes. It was also crucial to estimate the time needed to process the data after recording in each interval, as one of the primary aims of developing a smart inhaler was to provide a 'real-time” feedback function to users (i.e., with only a negligible delay). The time estimate was obtained by measuring the total time taken to make a recording and dividing it by the number of recording cycles.
3. Experimental Investigations and Their Results
For the experimental setup (Figure 1), a script was created to record and plot flow rate and vibration signals. The placebo injection was performed without breathing, and the response was recorded and plotted. It was observed that both the airflow and vibration sensors could detect the placebo injection process, as shown in Figure 4, which illustrates the temporal variations in the readings from the airflow and vibration sensors. It is important to note that, although most of the injected substance entered the airflow meter due to the direction of injection, a small fraction could also move in the opposite direction.
The breathing without injection was performed, and the response was recorded. The airflow sensor showed a clear response. At the same time, in comparison to the placebo injection response, the vibration sensor did not register any significant fluctuations during just inhalation breathing (Figure 5). Additionally, no audible sound of air passing through the experimental setup was observed.
The placebo injection followed by breathing was performed, and the response was recorded. The record validated the results of both the placebo injection without breathing and the breathing without injection tests (Figure 6).
The setup for experiments with the constant air flow was assembled according to the schematic diagram (Figure 2) and set to the “Pass By” configuration. In total, eight recordings were taken. The setup was then switched to the “Through Enclosure” configuration, and the recordings were made.
A script was developed to open the recordings and plot the temporal variations of the flow rate and vibration signals. Time-domain analysis of the recordings revealed a correlation between airflow rate and vibrations in both “Pass By” and “Through Enclosure” configurations (Figure 7). The figure includes six graphs, each showing the temporal fluctuations of raw airflow and vibration sensor data, measured in voltage. The top row of graphs represents the “Pass By” setup, while the bottom row corresponds to the “Through Enclosure” setup. These graphs are arranged in sequence based on increasing mean airflow rates.
The difference between the configurations was barely noticeable even at high flow rates, as shown in Figure 8. The figure features two sets of graph pairs, each illustrating a side-by-side comparison of vibration sensor outputs for two flow rates across the two setup configurations.
Another script was developed to open the recordings, process data, and then plot vibration readings in the frequency domain. The spectral analysis showed a rise in vibration amplitudes corresponding to the increased constant flow rates across both “Pass By” and “Through Enclosure” setup configurations, as shown in Figure 9. The figure illustrates the frequency domains for both configurations, with different constant flow rates distinctly marked by different colours. Notably, airflow passing through the inhaler enclosure caused higher vibration magnitudes than airflow bypassing the enclosure. In both configurations, the spectral impact of airflow was highly prominent in the 0-20 kHz frequency range.
At a zero flow rate, the spectral data for both setup configurations showed similar shapes, as illustrated in Figure 10 for both setup configurations. This was also reflected in the PSD graphs (Figure 11), showing a shift of the 99% occupied bandwidth into the 0-20 kHz frequency range as the flow rate increased.
Low-frequency noise was detected at 50 Hz, 100 Hz, and 536.6 Hz. The 536.6 Hz noise disappeared in the “Through Enclosure” setup configuration (Figure 12, the left graph). It was also notable that, within the 0-1,000 Hz band, the presence of airflow had a greater impact on enclosure vibrations in the “Pass By” configuration (Figure 12, the middle and right graphs).
Considering the above, the frequency band from 1 kHz to 20 kHz was selected for further investigations. The aim was to identify narrow spectral bands affected solely by the airflow rate passing through the inhaler enclosure. Further examination of the “Pass By” and “Through Enclosure” vibration spectra was conducted using readings for the constant flow rate of 97 LPM, as it resulted in the most prominent spectral levels, as shown in Figure 13. The spectral resolution in the figure is reduced to 100 Hz for improved visual clarity. It was observed that the frequency distribution patterns differed markedly between the setup configurations. Two spectral bands (1 kHz -4 kHz and 13 kHz -15.5 kHz) were selected for further investigation (highlighted in orange in Figure 13).
Identifying vibration signals that naturally originate from the inhaler enclosure was essential. The analysis of the 1 kHz - 4 kHz and 13 kHz - 15.5 kHz bands revealed four narrow regions where airflow influence was noticeable in the “Through Enclosure” setup but negligible in the “Pass By” setup. These regions were 1.25 kHz - 1.50 kHz, 2.45 kHz - 2.80 kHz, 3.40 kHz - 3.70 kHz, and 14.45 kHz - 14.70 kHz. They are illustrated in Figure 14 and Figure 15, with the selected bands highlighted in green.
Focused examinations were carried out on each of the selected spectral regions. Figure 16 displays visualisations for the 1.25 kHz - 1.50 kHz and 2.45 kHz - 2.80 kHz bands, while Figure 17 shows the vibration spectra for the 3.40 kHz - 3.70 kHz and 14.45 kHz - 14.70 kHz frequency bands, respectively. Each figure consists of four graphs corresponding to the respective spectral band. Graph [A] depicts the vibration spectra across various flow rates in the “Pass By” setup configuration, while graph [B] does the same for the “Through Enclosure” configuration. Graph [C] presents the PSD of vibrations at different flow rates for the “Pass By” setup configuration, and graph [D] presents the PSD of vibrations at different flow rates for the “Through Enclosure” setup configuration.
The analysis across all selected bands yielded consistent results. The vibration spectra in the “Pass By” setup configuration (graph [A]) exhibited a minimal or negligible correlation with the flow rate. In contrast, the “Through Enclosure” configuration vibration spectra (graph [B]) showed distinct variations across flow rates, evidenced by the amplification of vibration signal amplitudes as the flow rate increased. Similar trends appeared in the PSD graphs, although it was less evident due to the logarithmic scale (see graphs [C] and [D]).
The initially selected bands were then further adjusted due to the narrower signal concentration (highlighted in green in graphs [A] and [B]): 1.25 kHz - 1.50 kHz to 1.30 kHz -1.45 kHz; 2.45 kHz - 2.80 kHz to 2.48 kHz -2.78 kHz; 3.40 kHz - 3.70 kHz to 3.42 kHz - 3.66 kHz; and 14.45 kHz -14.70 kHz to 14.48 kHz -14.64 kHz.
The results obtained in the selected frequency bands confirmed the potential of assessing airflow rates by measuring vibrations in the inhaler enclosure.
For further investigation, a script was developed to record and process data in a quasi-real-time regime. For each of the selected spectral bands, the vibration response to temporally fluctuating flow rates was recorded twice: once in the “Pass By” setup configuration and again in the “Through Enclosure” configuration. Each recording consisted of 400 data collection intervals, each with a duration of 50 ms (approximately 20 seconds of data collection in total), and a sampling rate of 30 kHz SPS. The data was processed between data collecting intervals and involved first processing the vibration signal using an FFT. The “Total Amplitude” (sum of the FFT magnitude values) was then calculated within a selected spectral band. The resultant value was then saved alongside a timestamp and the mean flow rate within the data collecting interval. The data processing interval of 32.6±0.3 ms enabled the obtaining of at least 10 FFT Total Amplitude values per second.
Another script was created to visualise the data recorded and processed in near real-time. The plotted data aimed to uncover any potential correlation between the flow rate and the calculated FFT Total Amplitude, as shown in Figure 18 and Figure 19. Each figure contains two pairs of graphs. Each pair corresponds to a specific band. The left graphs in each pair display data collected in the “Pass By” setup, while the right graphs show data from the “Through Enclosure” setup. These graphs present quasi real-time recordings of both the flow rate and the FFT Total Amplitude within the respective band. Empirical observation suggested that the FFT Total Amplitude, derived from vibration readings, exhibited varying degrees of correlation with the flow rate. Notably, the vibration response in the “Through Enclosure” setup aligned with the readings of the flow rate sensor. In contrast, the correlation between flow rate and vibrations in the “Pass By” setup was less clear.
The results obtained enabled the derivation of a mathematical equation linking the airflow rate passing through the inhaler enclosure to the subsequent vibrations. The FFT Total Amplitude values, obtained in the “Through Enclosure” configuration, were plotted against the corresponding flow rate values as shown in Figure 20. The figure comprises four charts, each representing one of the selected spectral bands. The following equations were derived using a linear trendline in Table 2.
The linear coefficients from the equations were applied to the FFT Total Amplitude values obtained during quasi-real-time recordings. The adjusted FFT Total Amplitude values were visualised to verify the established linear relationships, as shown in Figure 20. The figure contains four graphs, each representing one of the selected spectral bands. Each graph displays quasi-real-time recordings of both the actual flow rate and the rate calculated from vibrations within one of the chosen bands. The adjusted response closely matches the respective flow rate, with the best agreement seen in the 2.48 kHz - 2.78 kHz and 3.42 kHz - 3.66 kHz frequency bands, which correspond to the highest R2 values for their trend lines. The adjusted measurements showed a positive offset, effectively shifting the zero baseline to an average of approximately 10 LPM.
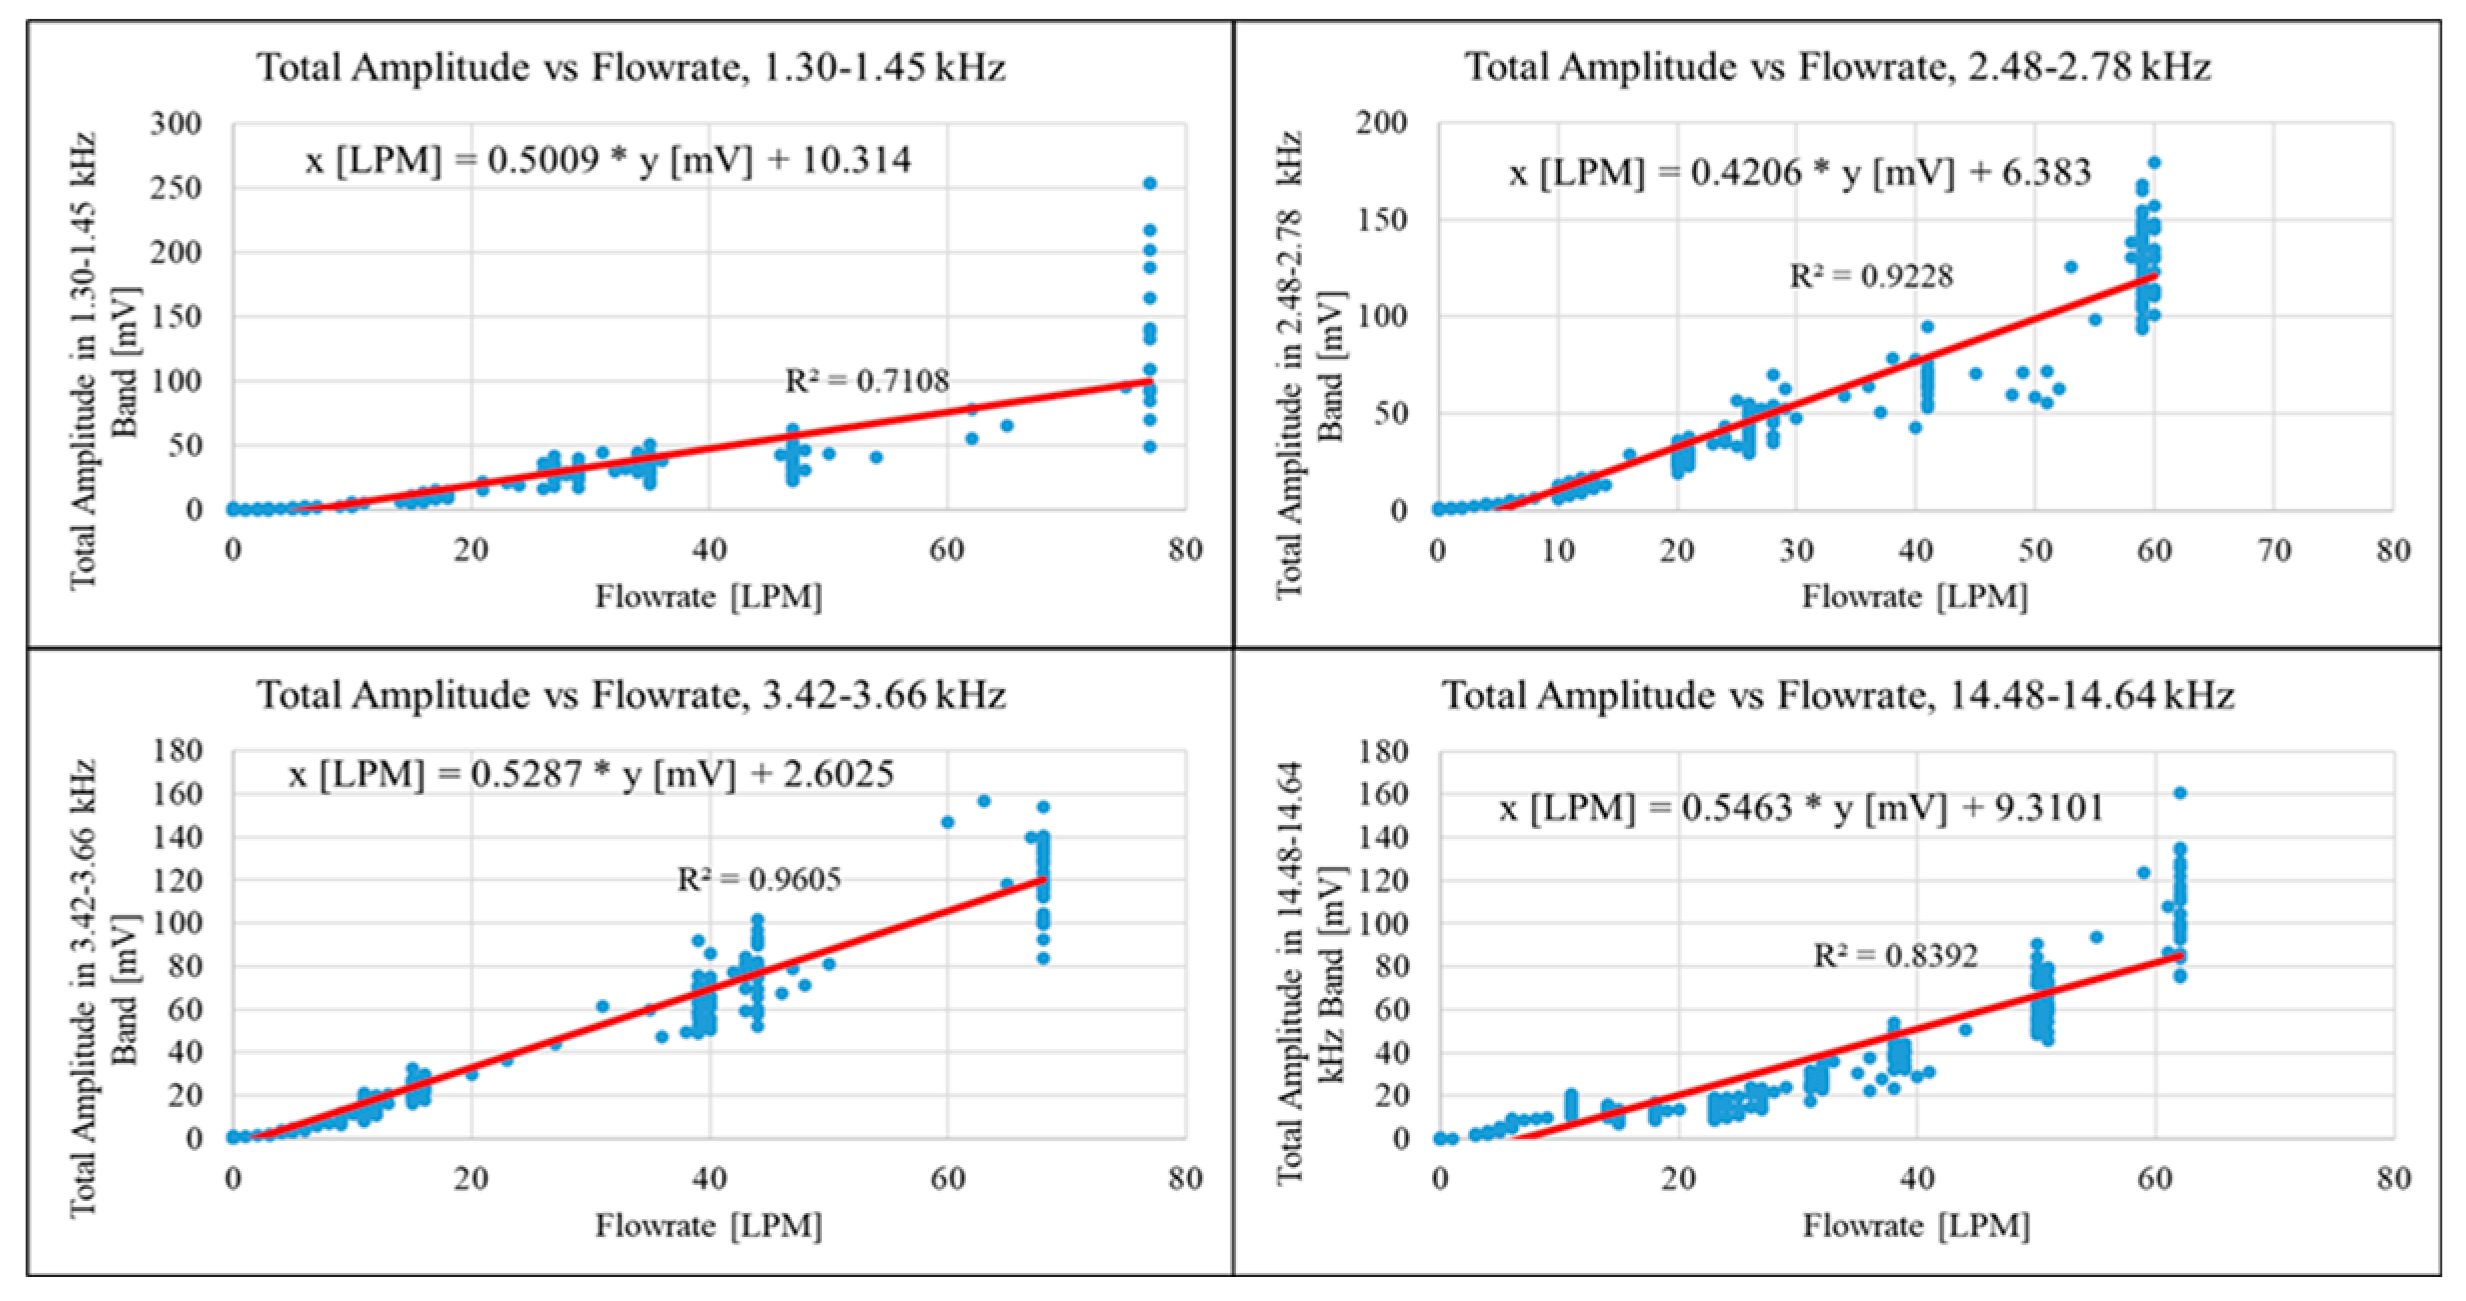
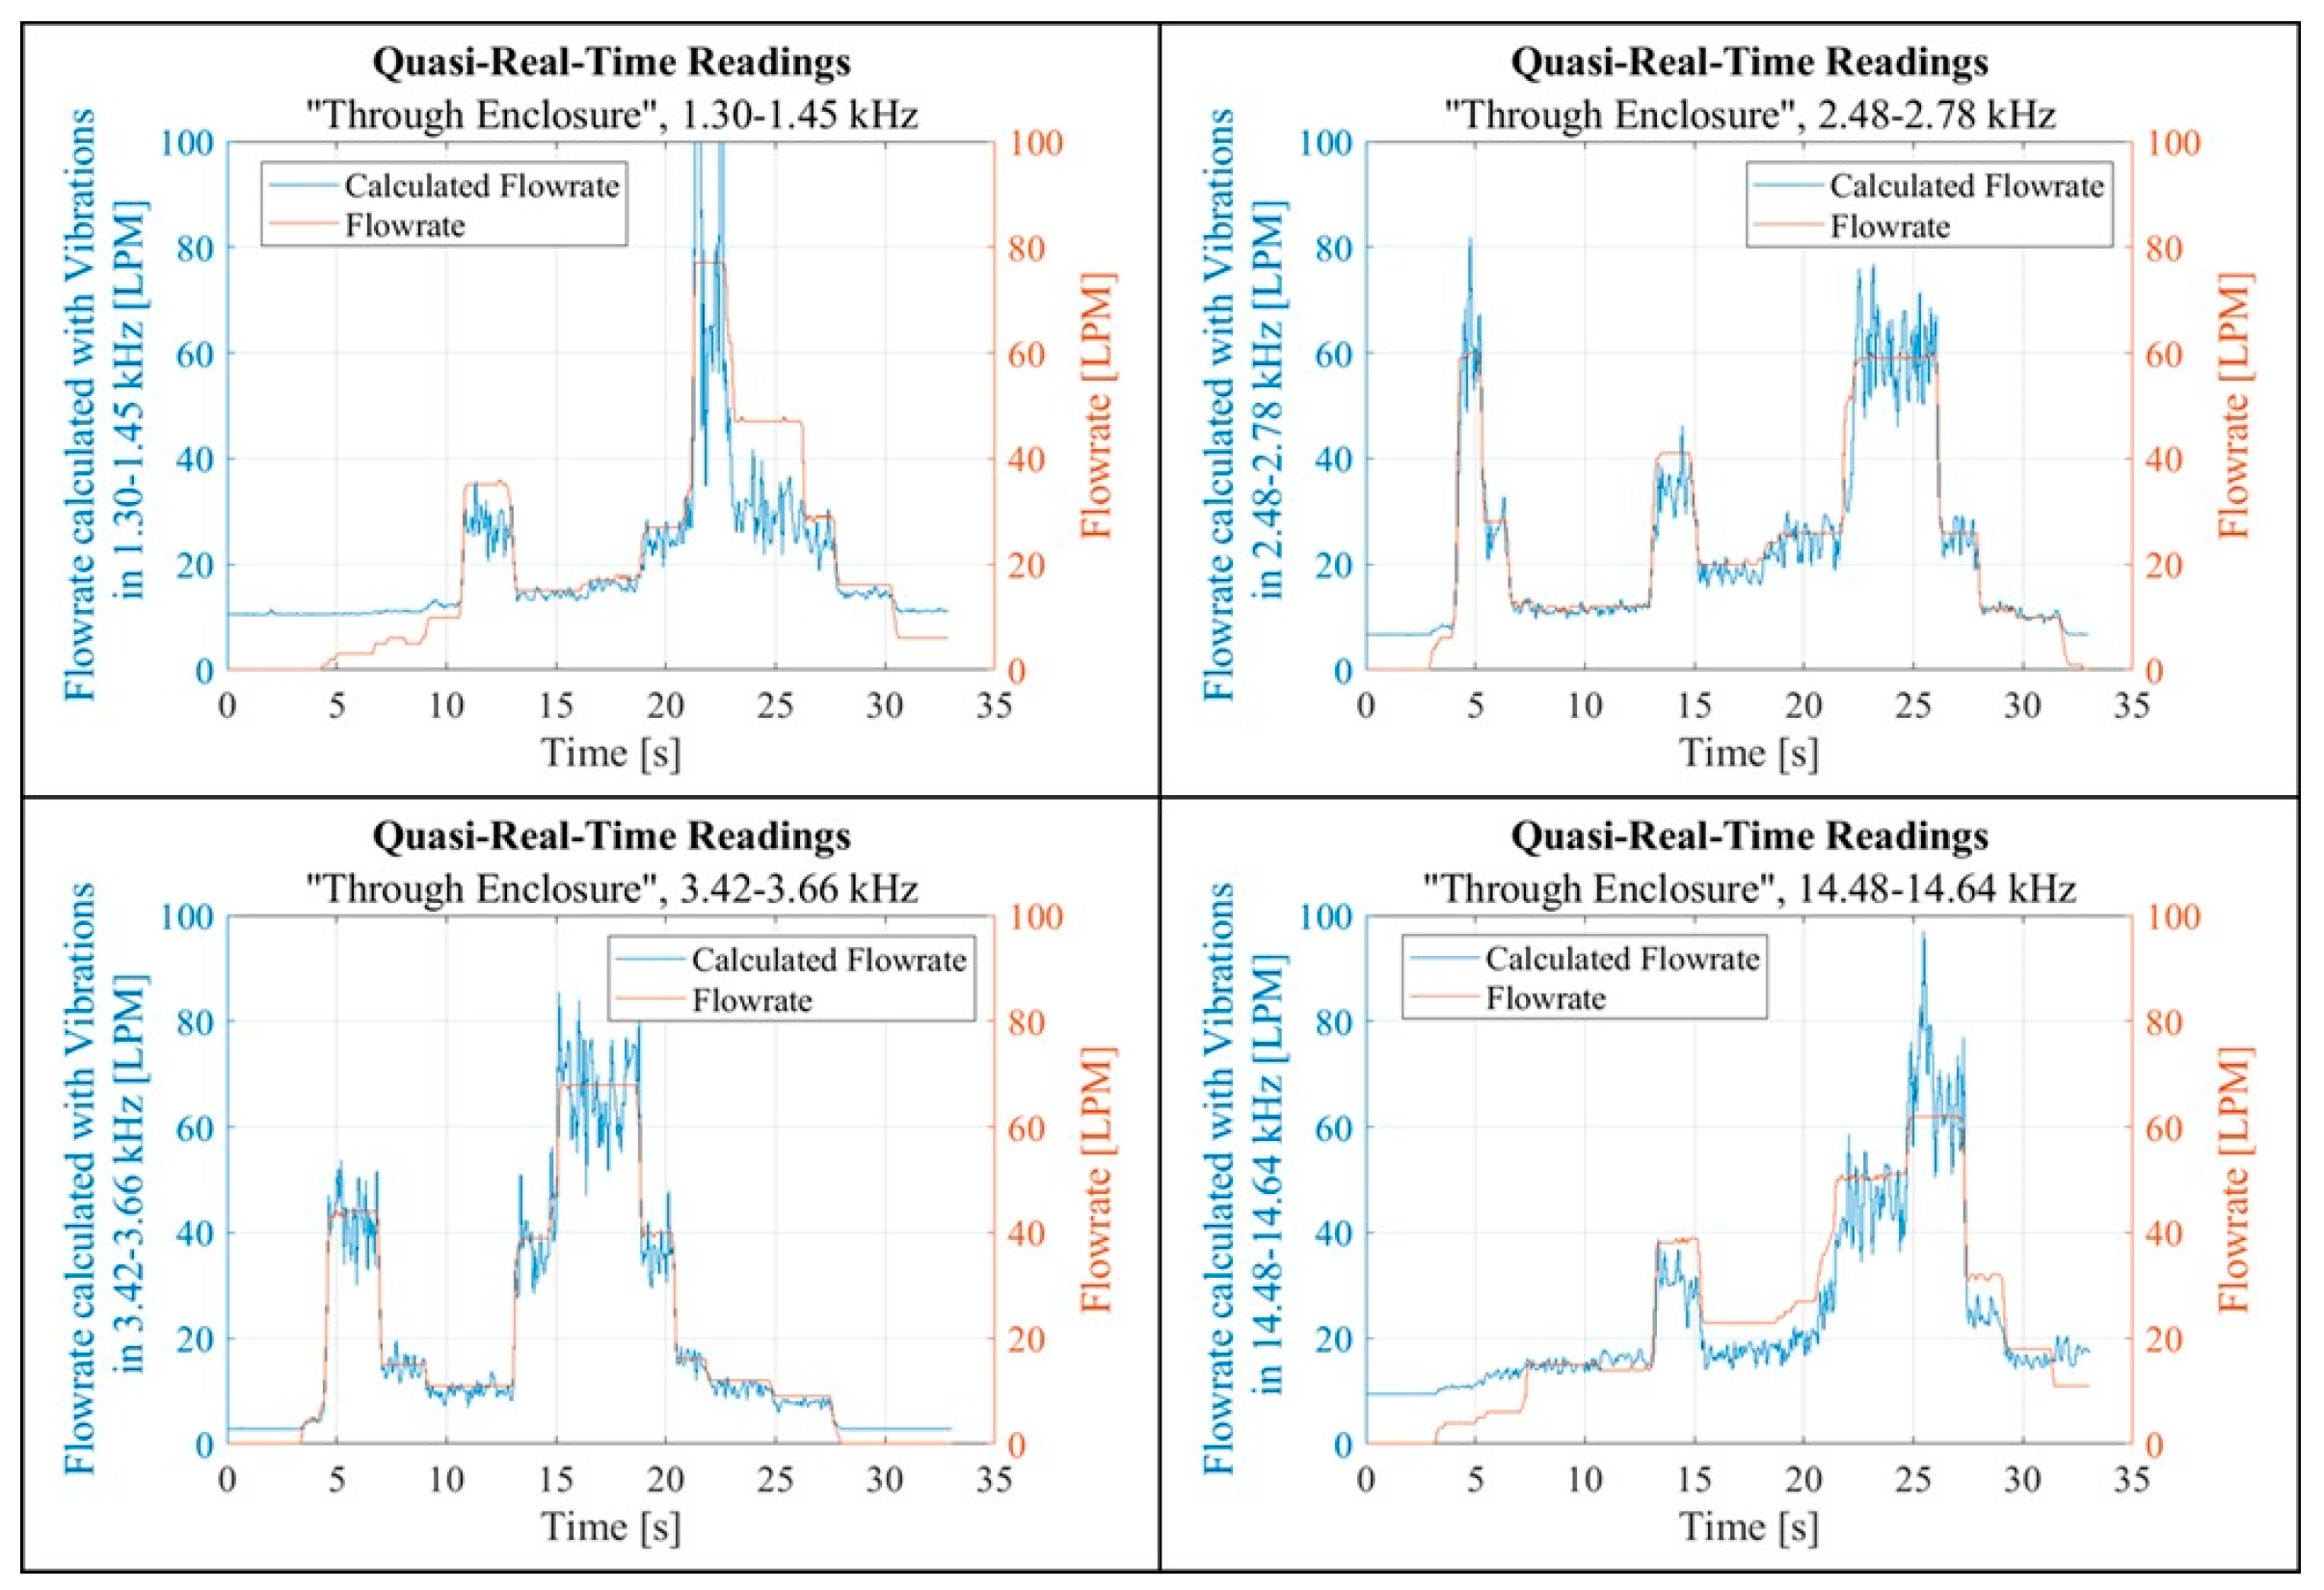
Figure 20.
Fitting of the FFT Total Amplitude values in selected frequency bands with respect to corresponding flowrate values.
Figure 20.
Fitting of the FFT Total Amplitude values in selected frequency bands with respect to corresponding flowrate values.
Figure 21.
Quasi-real-time readings, the Total Amplitude values are adjusted with linear coefficients.
Figure 21.
Quasi-real-time readings, the Total Amplitude values are adjusted with linear coefficients.
4. Conclusions
The reported study is part of a research project aimed at developing a portable smart inhaler device [1]. It demonstrated the feasibility of correlating the airflow rate through an inhaler enclosure with the resultant vibrations of the enclosure. Specifically, it focused on analysing inhaler vibrations under constant airflow conditions.
A laboratory experimental setup was established to examine the correlation between airflow rate and the acoustic responses of the inhaler’s enclosure. The investigation into the vibration behaviour of the inhaler enclosure was carried out under constant airflow conditions. It revealed a notable linear relationship between flow rates and vibration activity across four spectral domains. A clear correlation was observed with the vibrations and the airflow rate through the inhaler enclosure, but not with the bypass airflow. These regions were not in the ultrasonic range. Besides, there were no significant vibrations below 1 kHz. These four spectral bands were identified as the most sensitive to the airflow rate variations and suitable for quasi-real-time flow rate estimation. It is noteworthy that these bands exhibited low vibration amplitudes compared to other spectra and contributed relatively little to the overall signal power. Moreover, the proposed quasi-real-time method, even without optimisation, proved to be feasible for providing low-delayed vibration assessment and feedback on the inhalation technique.
In summary, this suggests that vibration patterns within specific frequency bands can serve as viable indicators for near-real-time estimation of inhalation flow rate, thereby indicating the method’s potential.
However, before this method can reach practical application, further investigations and experimental research activities will be required. They will include, for example, experiments involving human participation, where the actual use of the smart inhaler prototype devices will be simulated. This will stipulate the transition between the in vitro and human-centric approaches that need to be carried out under diverse conditions, including those that replicate real-life scenarios. Elimination or reduction of the unwanted airflow noise effects is another area of future study. The specification, development, and application of advanced micro-miniature electronic instrumentation and measurement devices and components will also need to be carried out. Exploring alternative inhaler designs, models, or alterations better suited to the vibration-based methodology can also be explored. Potential modifications may include designs accommodating higher flow rates, noisy passages, or the integration of an auxiliary vibration-sensitive component.
While the practical deployment of the method under investigation presents challenges, these issues also offer opportunities for addressing them in future research activities, thereby contributing to the ongoing pursuit of enhanced asthma and other respiratory disease cure and effective management.
Author Contributions
Conceptualisation, I.M., M.L., M.T.C. and S.D.; methodology, I.M., M.L. and S.D.; formal analysis, I.M., M.L. and S.D.; investigation, I.M., M.L. and S.D.; writing—original draft preparation, I.M.; writing—review and editing, I.M., M.L. and S.D.; supervision, M.L. and S.D.; project administration, M.L., M.T.C., and S.D.; funding acquisition, M.L., M.T.C. and S.D. All authors have read and agreed to the published version of the manuscript.
Funding
The research was supported in part by the Massey University Research Fund for the project RM25587 "Real-Time Analysis for Flow Rate Estimation in a Medical Aerosol Application and Smart Inhaler Development”.
Conflicts of Interest
The authors declare that they have no conflicts of interest.
References
- Mysovskikh, I.; Legg, M.; Demidenko, S. Flowrate Sensing and Measurement in Portable Smart Inhalers. Sensors 2024, 24, 6848. [Google Scholar] [CrossRef] [PubMed]
- Lavorini, F.; Pistolesi, M.; Usmani, O. Recent advances in capsule-based dry powder inhaler technology. Multidiscip. Respir. Med. 2017, 12, 11. [Google Scholar] [CrossRef] [PubMed]
- Fortescue, R.; Kew, K.; Mathioudakis, A. Interventions to improve inhaler technique for people with asthma. Cochrane Database Syst. Rev. 2017, 3, CD012286. [Google Scholar] [CrossRef] [PubMed]
- Canday Medical Ltd. 2Tone Trainer—The Metered Dose Inhaler (MDI) Training Device. Available online: http://2tonetrainer.net/index.html (accessed on 20 July 2025).
- Ammari, W.; Chrystyn, H. Optimizing the inhalation flow and technique through metered dose inhalers of asthmatic adults and children attending a community pharmacy. J. Asthma 2013, 50, 505–513. [Google Scholar] [CrossRef] [PubMed]
- Flexicare. Inhaler Technique • Trainers. Available online: https://flexicare.com/en-us/product-category/inhaler-technique/train/ (accessed on 20 July 2025).
- Ammari, W.; Obeidat, N.; Anani, A.; AlKalbani, R.; Sanders, M. Evaluation of Trainhaler and Flo-Tone Cr training devices to help adults with asthma optimize their pressurized metered dose inhaler technique and inhalation flow. Am. J. Respir. Crit. Care Med. 2017, 195, A3004. [Google Scholar]
- Nicola, M.; Elberry, A.; Sayed, O.; Hussein, R.; Saeed, H.; Abdelrahim, M. The impact of adding a training device to familiar counselling on inhalation technique and pulmonary function of asthmatics. Adv. Ther. 2018, 35, 1049–1058. [Google Scholar] [CrossRef] [PubMed]
- Tony, S.; Abdelrahman, M.; Osama, H.; Abdelrahim, M. Advanced counselling using training device and smartphone application on inhalation technique from metered-dose inhaler with spacer equipped with different interfaces in asthmatic children. Int. J. Clin. Pract. 2021, 75, e14413. [Google Scholar] [CrossRef] [PubMed]
- Tony, S.; Abdelrahman, M.; Osama, H.; Elgendy, M.; Abdelrahim, M. The effect of adding a training device and a smartphone application to traditional verbal counseling in asthmatic children. Pulm. Ther. 2021, 7, 549–562. [Google Scholar] [CrossRef] [PubMed]
- Tony, S.; Abdelrahman, M.; Elsalam, M.; Shafik, M.; Abdelrahim, M. Effect of using the acoustic flo-tone training device and its smartphone application on enhancing inhalation technique from metered-dose inhaler with spacer in asthmatic children. Exp. Lung Res. 2022, 48, 224–238. [Google Scholar] [CrossRef] [PubMed]
- Sanders, M. Placebo Pressurized Metered Dose Inhalers (pMDIs): Understanding How to Maximize Our Use of These Valuable Training Aids. American J. of Respiratory and Critical Care Medicine 2017, 195, A3331. [Google Scholar]
- Haidl, P.; Heindl, S.; Siemon, K.; Bernacka, M.; Cloes, R. Inhalation device requirements for patients’ inhalation maneuvers. Respir. Med. 2016, 118, 65–75. [Google Scholar] [CrossRef] [PubMed]
- Hua, J.; Ye, X.; Du, C.; Xie, N.; Zhang, J.; Li, M.; Zhang, J. Optimizing inhalation therapy in the aspect of peak inhalation flow rate in patients with chronic obstructive pulmonary disease or asthma. BMC Pulm. Med. 2021, 21, 302. [Google Scholar] [CrossRef] [PubMed]
- Honeywell. Airflow Sensors, AWM700 Series, Compensated/Amplified. Available online: https://prod-edam.honeywell.com/content/dam/honeywell-edam/sps/siot/zh-cn/products/sensors/airflow-sensors/amplified/awm700/documents/sps-siot-airflow-sensors-awm700-series-datasheet-32301627-b-en-ciid-50061.pdf (accessed on 15 July 2025).
- TTi. Thurlby Thandar Instruments. PL series. Precision Laboratory DC Power Supplies. Available online: https://www.brltest.com/pdf/pdf_other/481.pdf (accessed on 15 July 2025).
- DiMarzio. Acoustic Model. SKU: DP130BK. Available online: https://www.dimarzio.com/pickups/acoustic/acoustic-model (accessed on 15 July 2025).
- Data Translation. UM-22058-L. DT9832 Series User’s Manual. Available online: https://support.elmark.com.pl/datatranslation/DT-9832/manual/UM9832.pdf (accessed on 15 July 2025).
- The MathWorks, Inc. MATLAB. Available online: https://au.mathworks.com/products/matlab.html (accessed on 15 July 2025).
- The MathWorks, Inc. MATLAB, fft - Fast Fourier Transform. Available online: https://au.mathworks.com/help/matlab/ref/fft.html (accessed on 15 July 2025).
- The MathWorks, Inc. MATLAB. Power Spectral Density Estimates Using FFT. Available online: https://au.mathworks.com/help/signal/ug/power-spectral-density-estimates-using-fft.html (accessed on 15 July 2025).
Figure 1.
The experimental setup used to measure the acoustic and airflow signals caused by inhalation breathing and the placebo inhaler device.
Figure 1.
The experimental setup used to measure the acoustic and airflow signals caused by inhalation breathing and the placebo inhaler device.
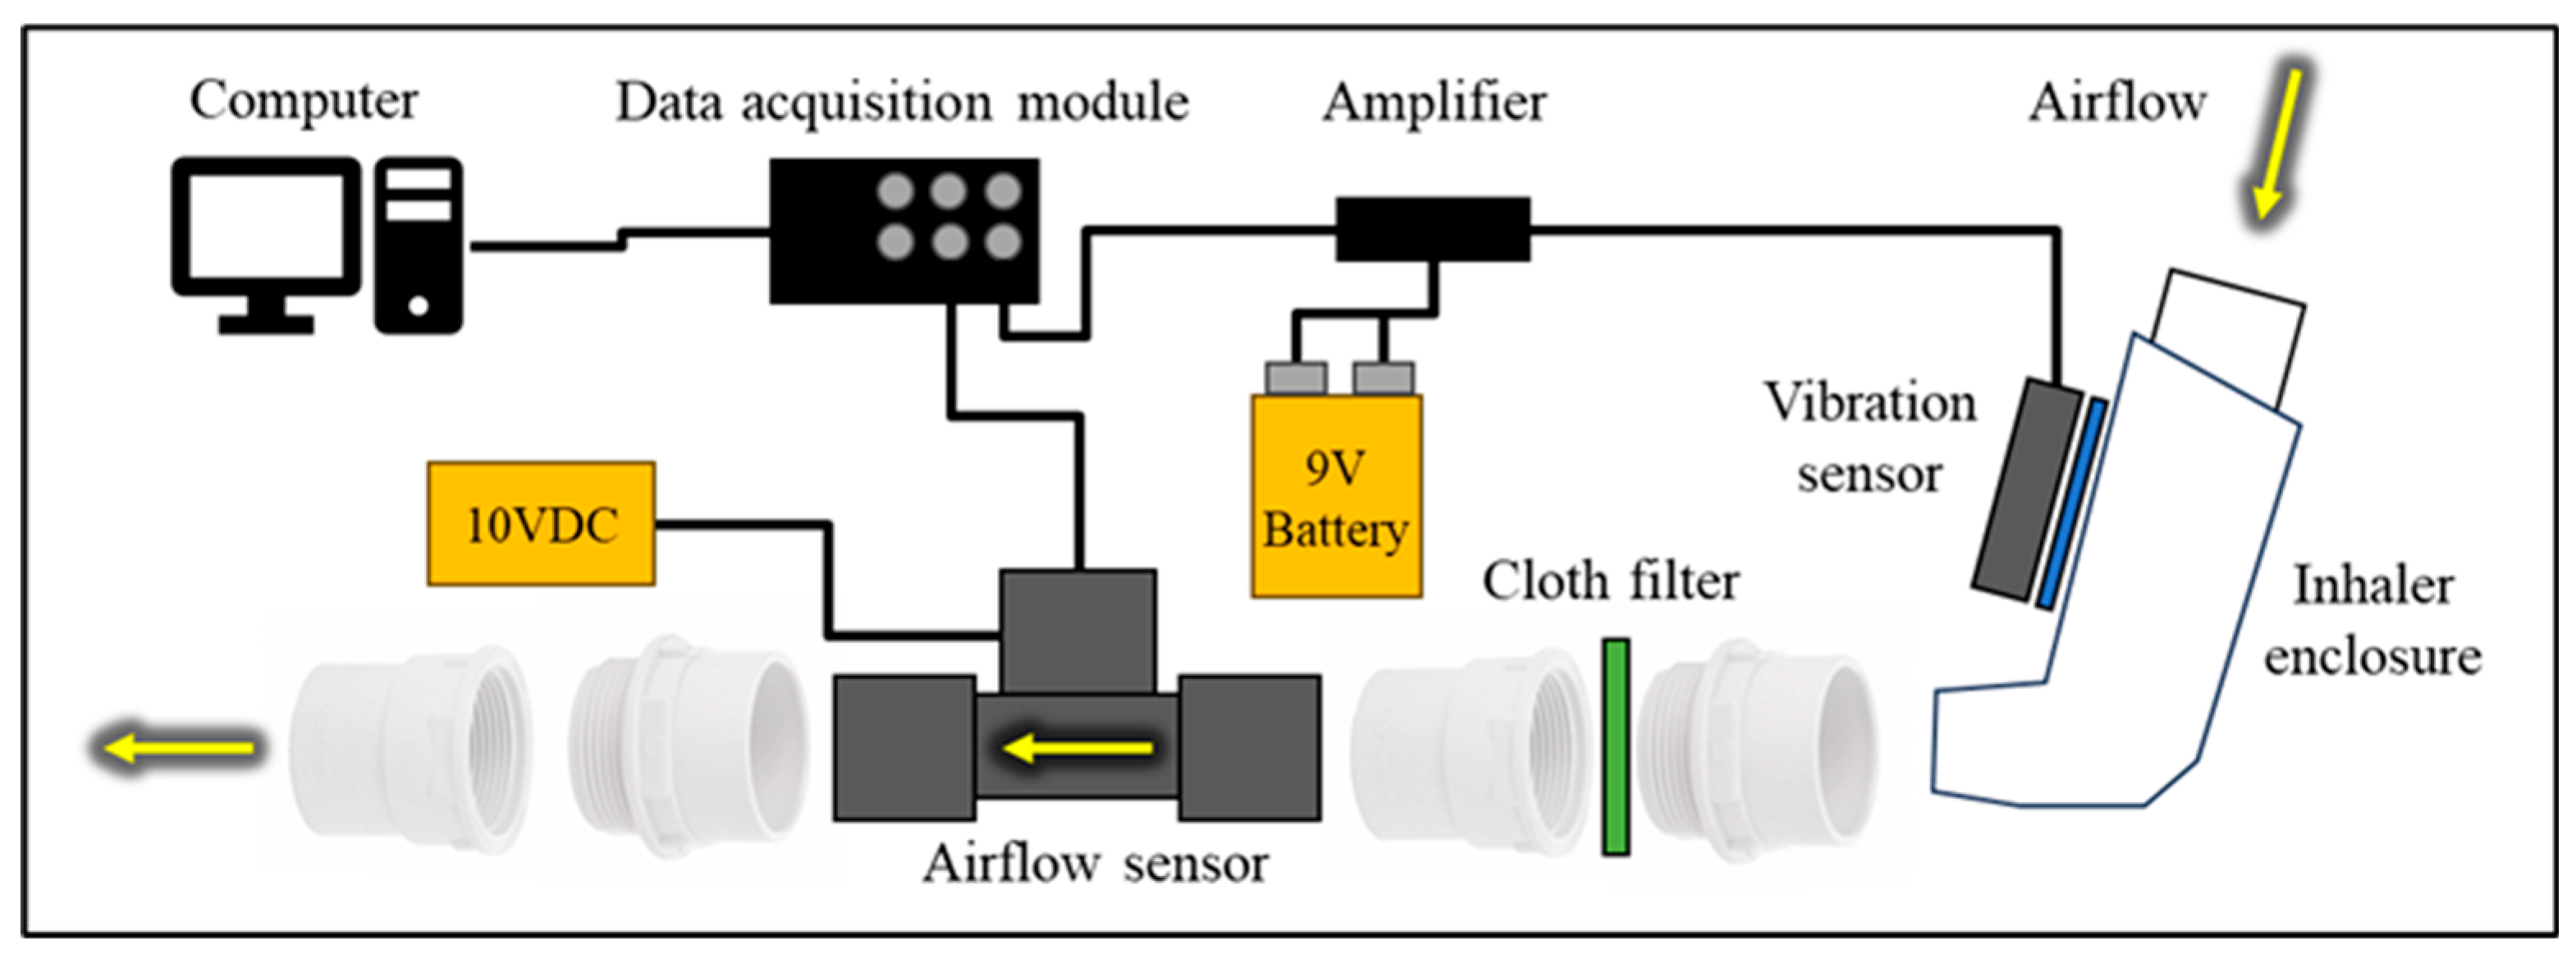
Figure 2.
Inhalation parameters and airflow profile.
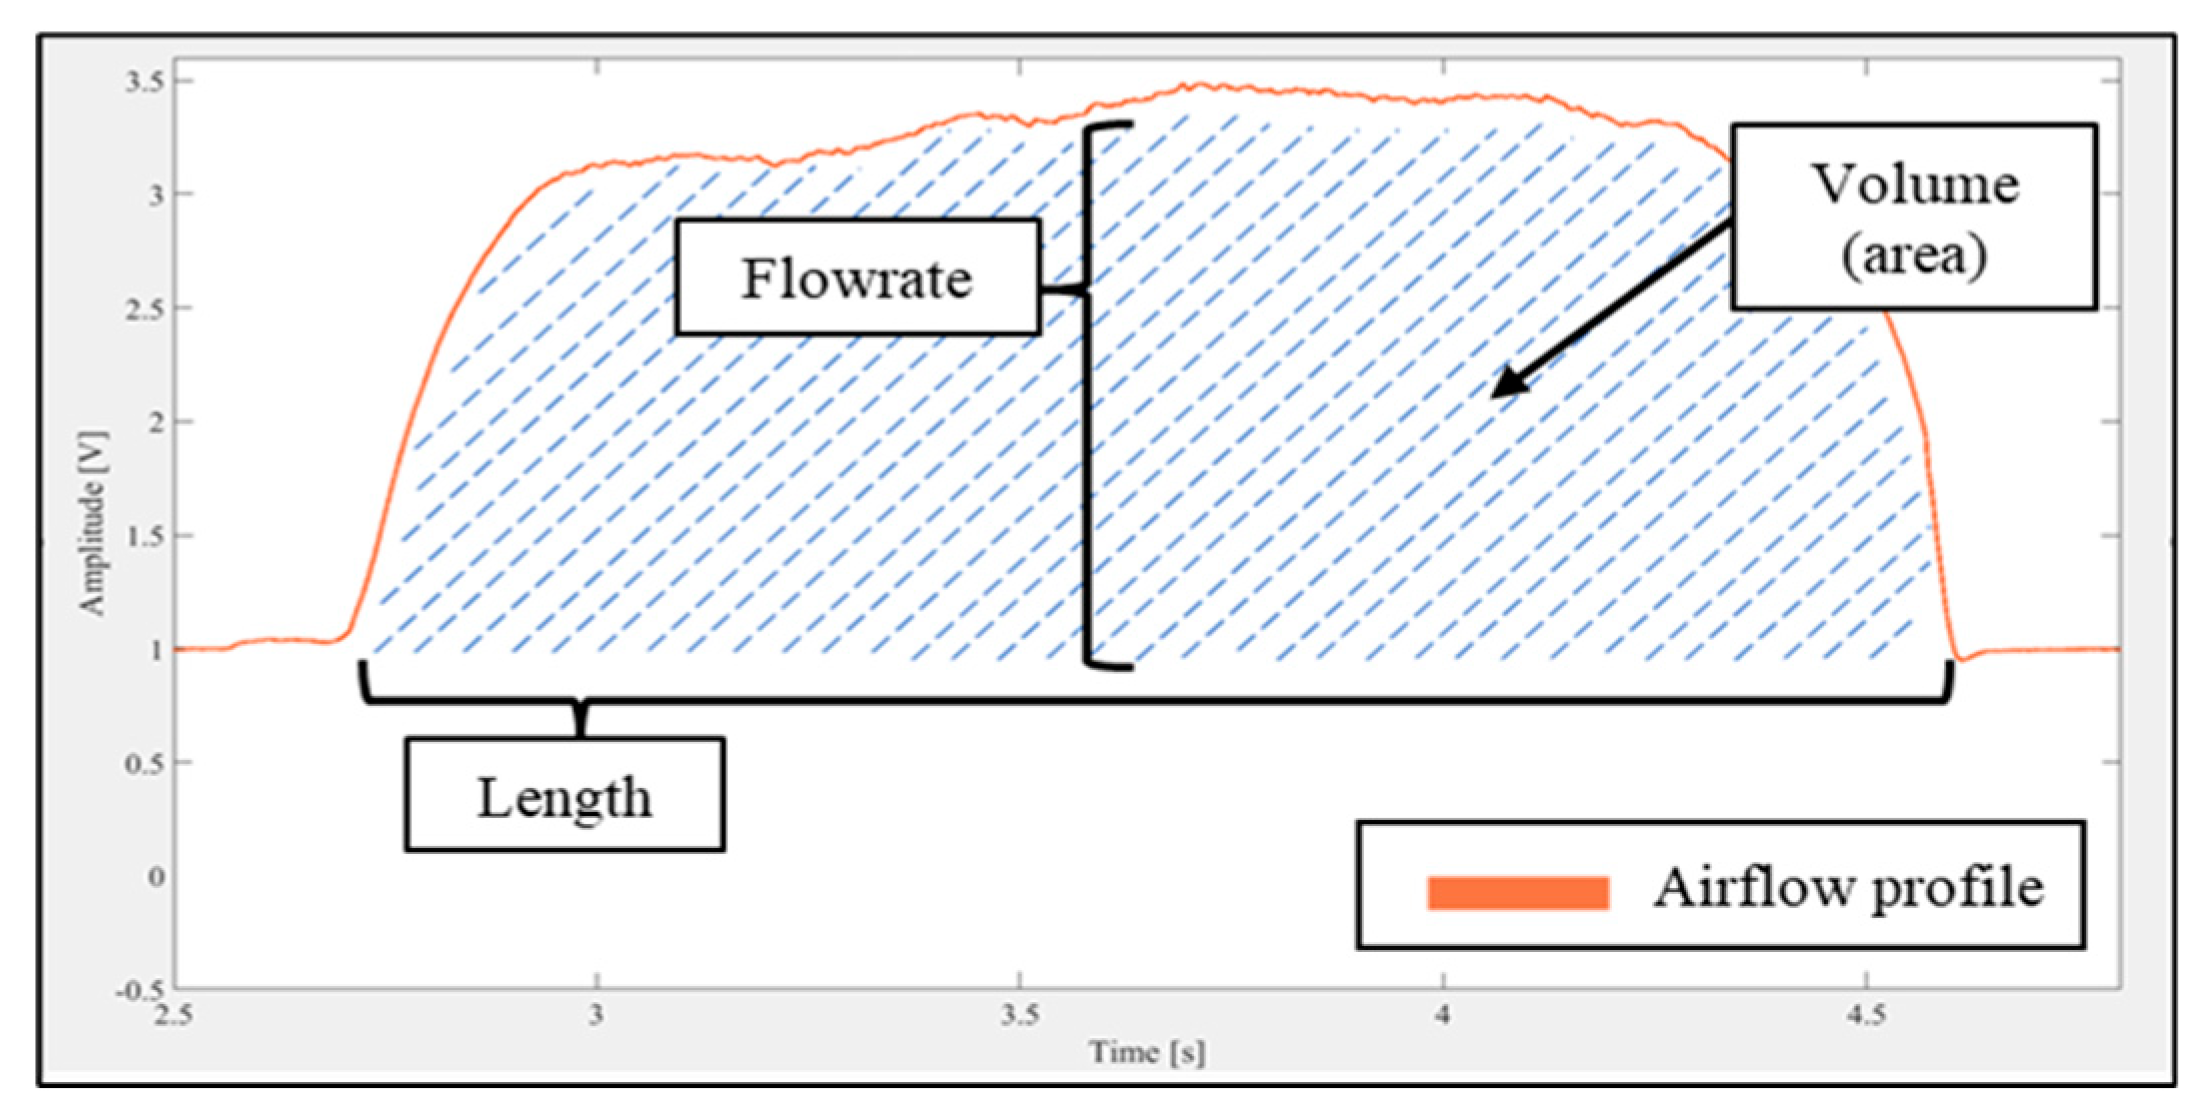
Figure 3.
Experimental setup used for measurements with constant airflow.
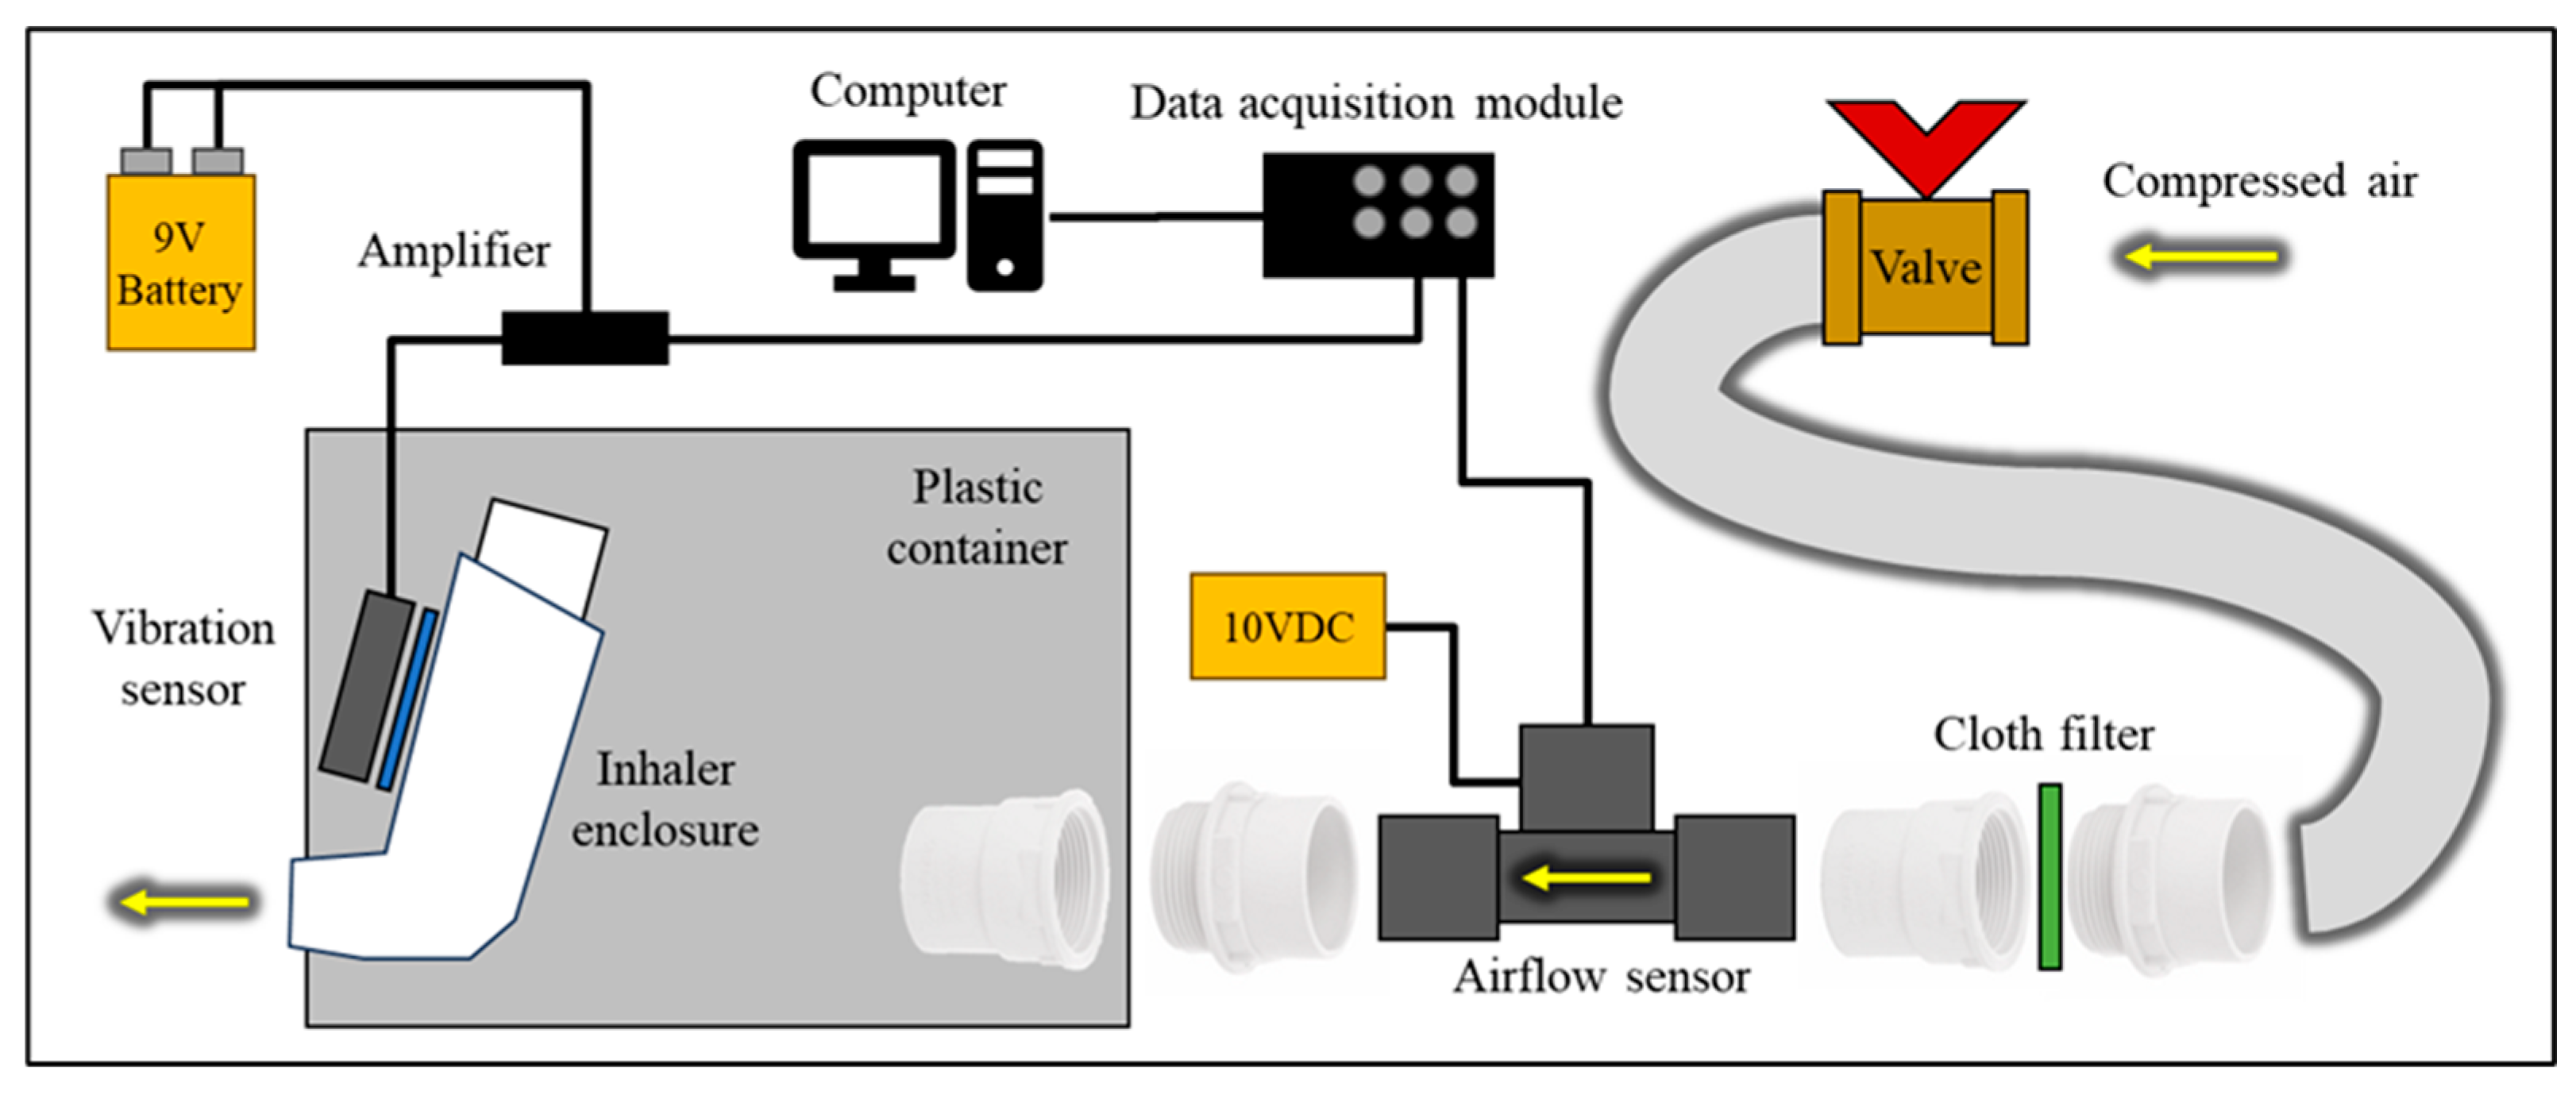
Figure 4.
Signal corresponding to the placebo injection without breathing (inhalation).
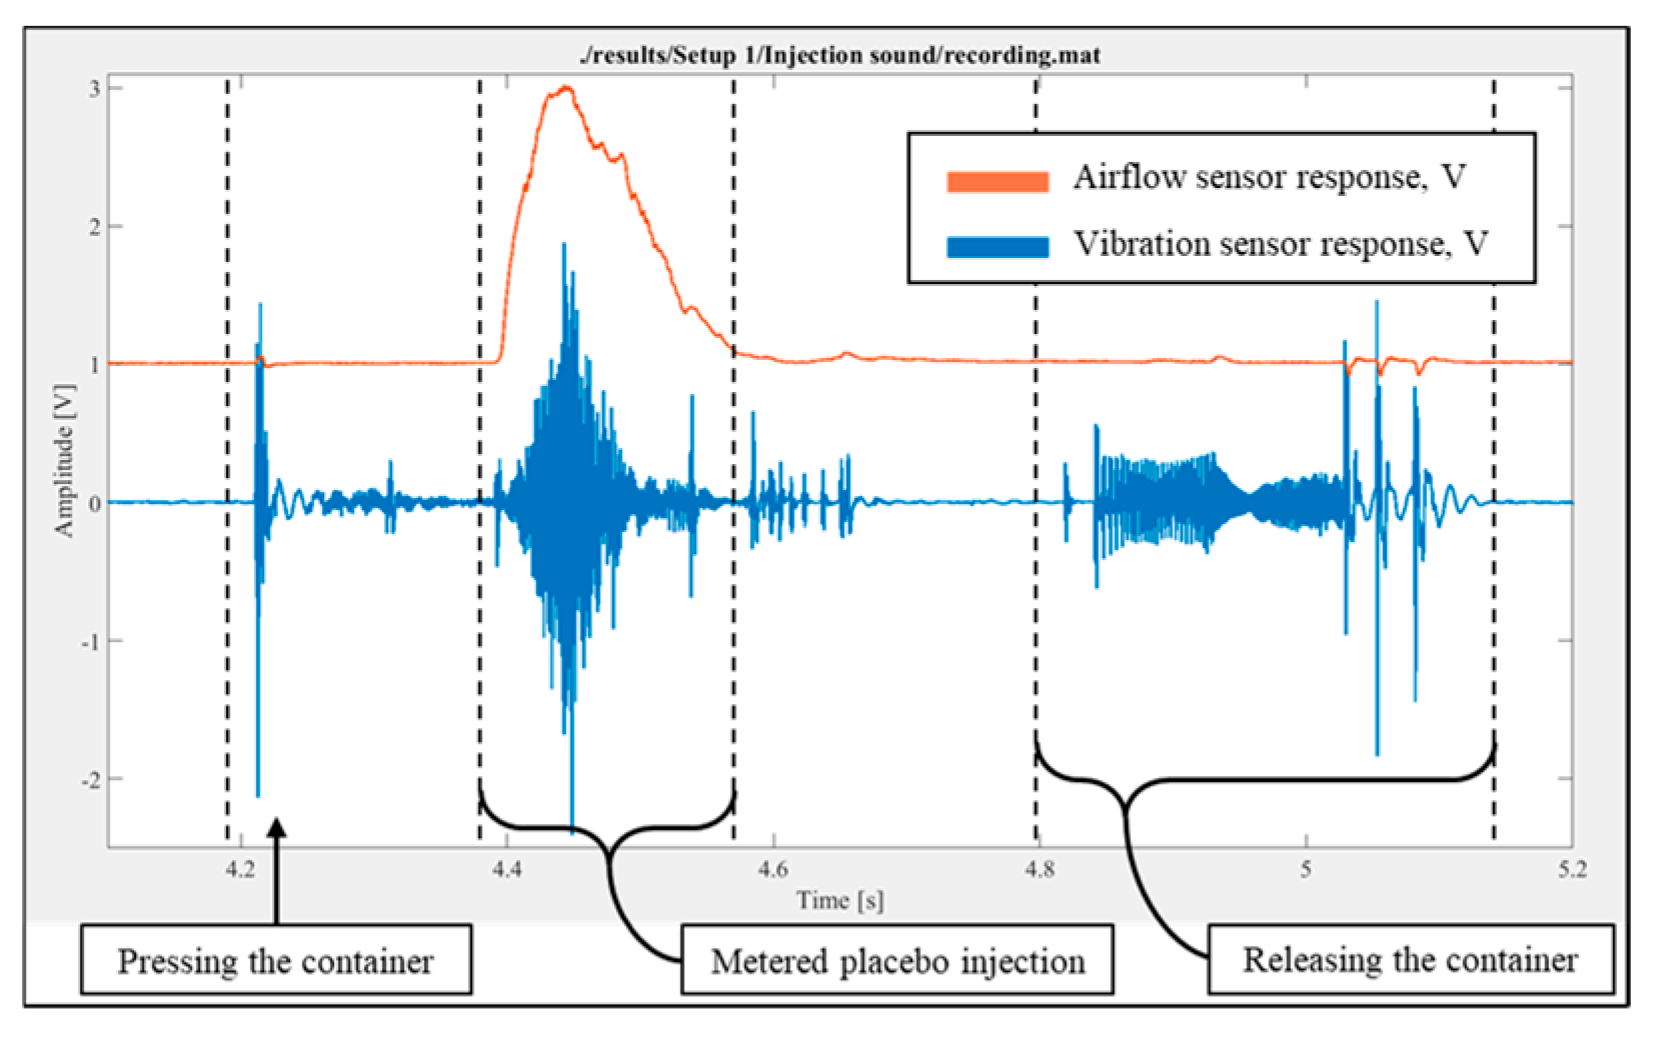
Figure 5.
Airflow and vibration sensor responses during inhalation breathing without the injection of an inhaler.
Figure 5.
Airflow and vibration sensor responses during inhalation breathing without the injection of an inhaler.
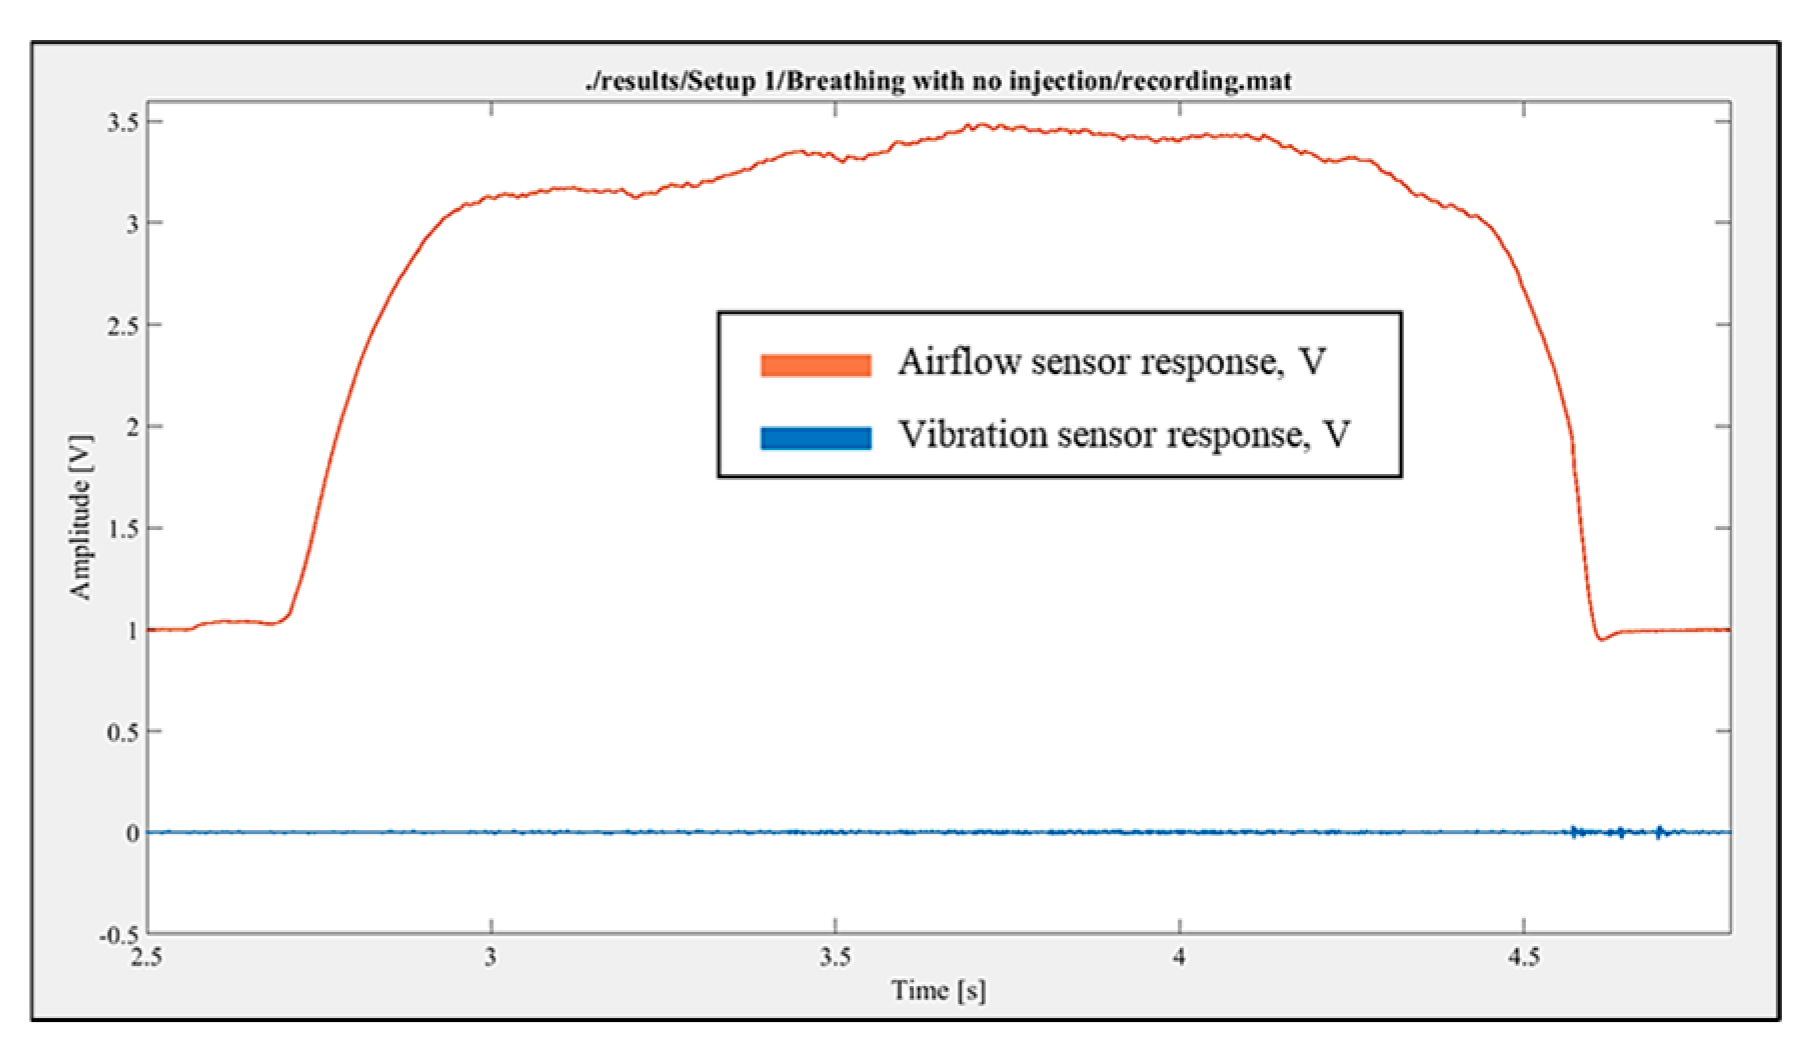
Figure 6.
Experimental results for the placebo injection followed by inhalation breathing.
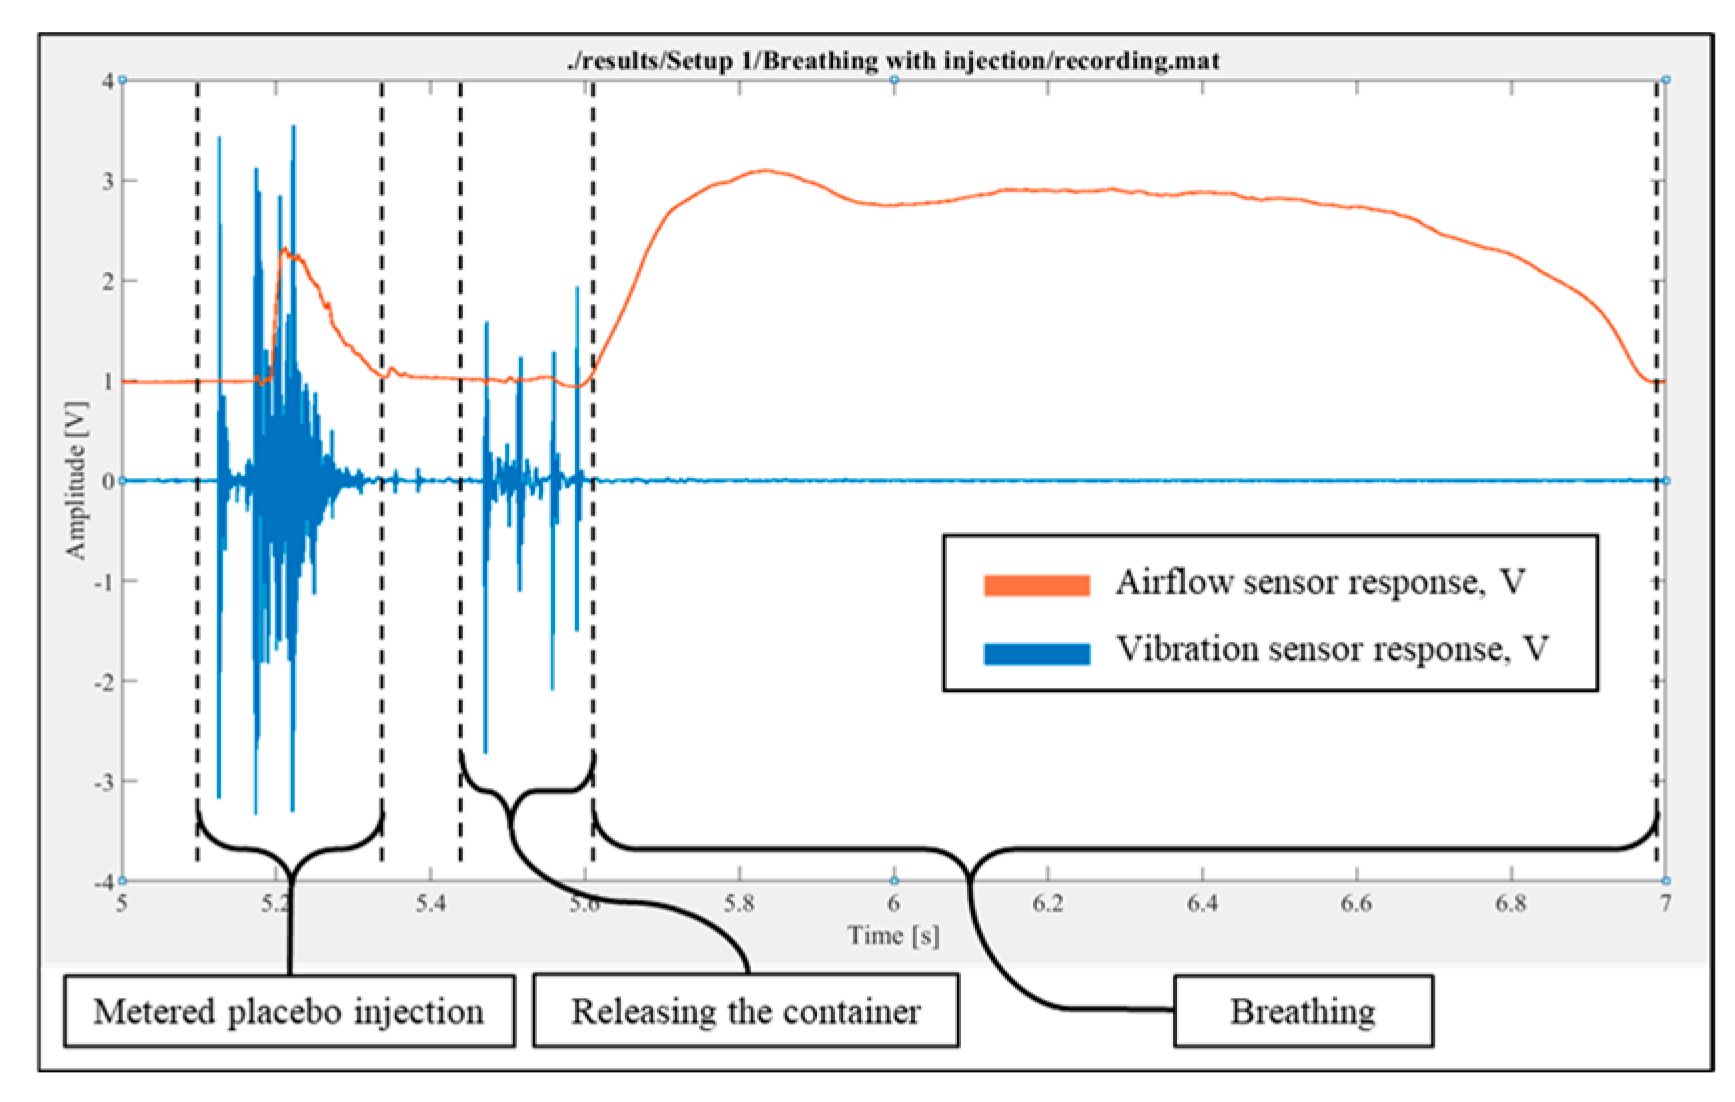
Figure 7.
Vibration and air flow readings for different flow rates in “Pass By” and “Through Enclosure” configurations.
Figure 7.
Vibration and air flow readings for different flow rates in “Pass By” and “Through Enclosure” configurations.
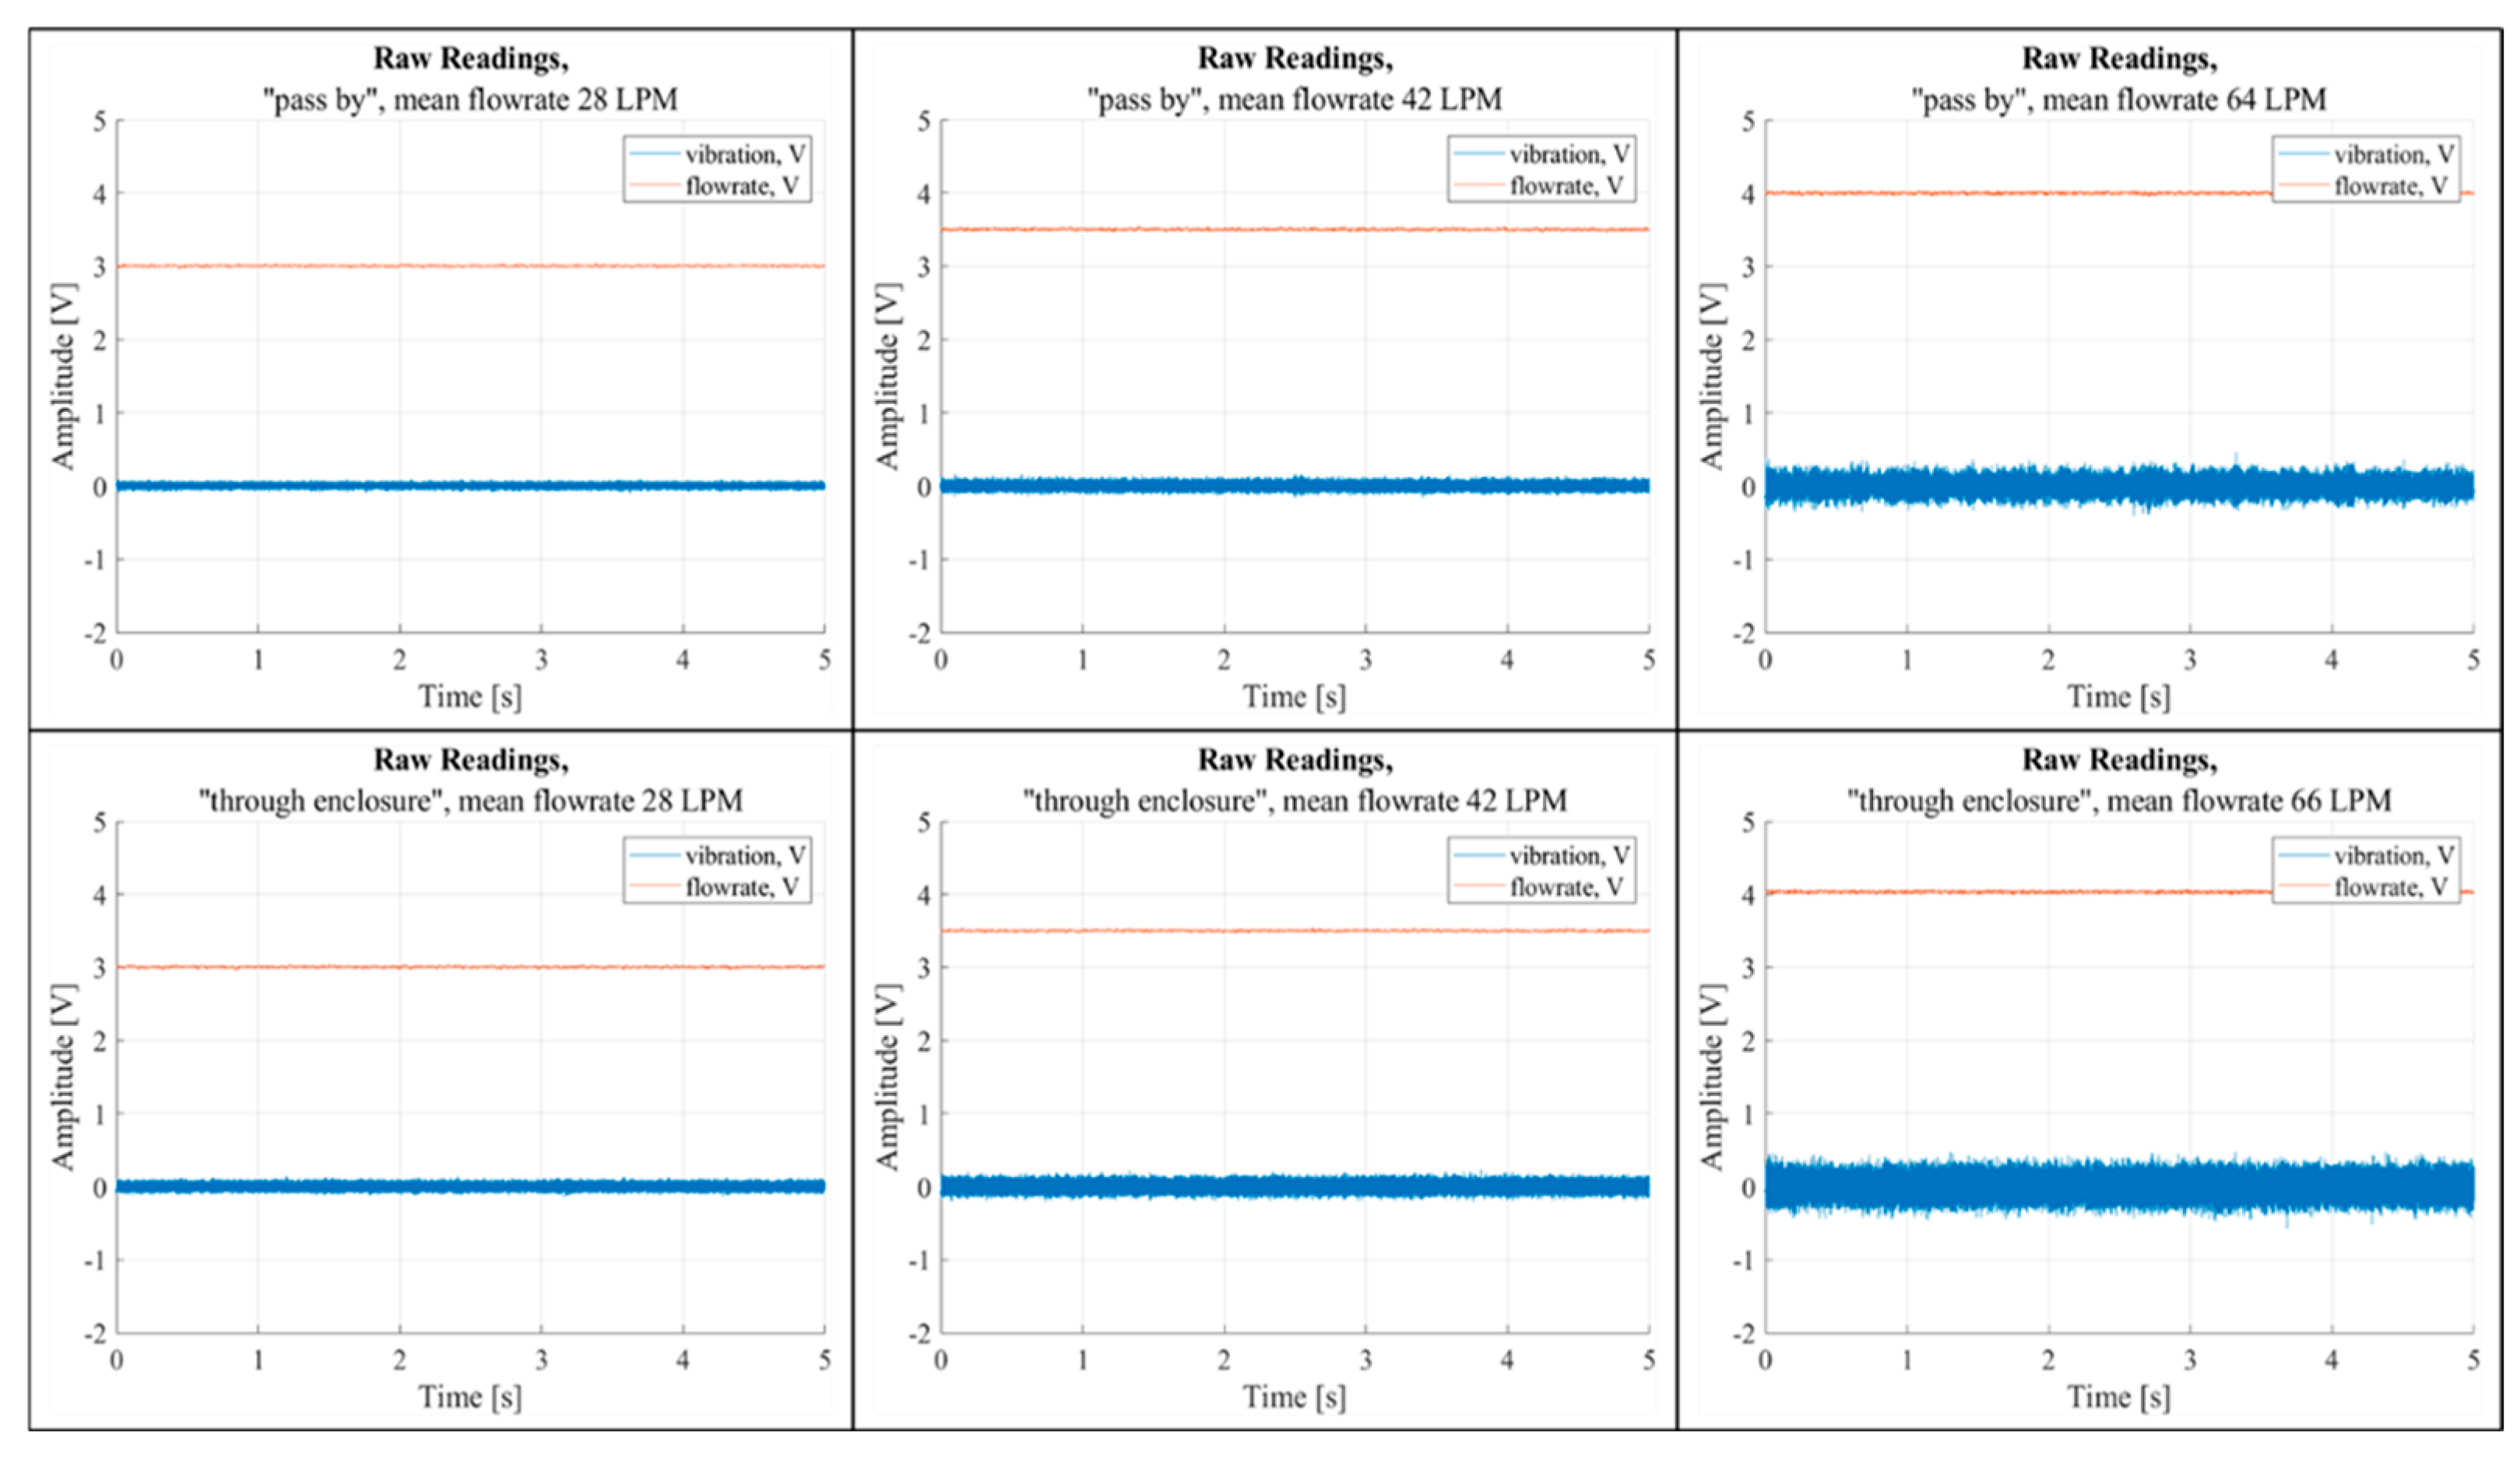
Figure 8.
Temporal vibration sensor readings in “Pass By” and “Through Enclosure” configurations.
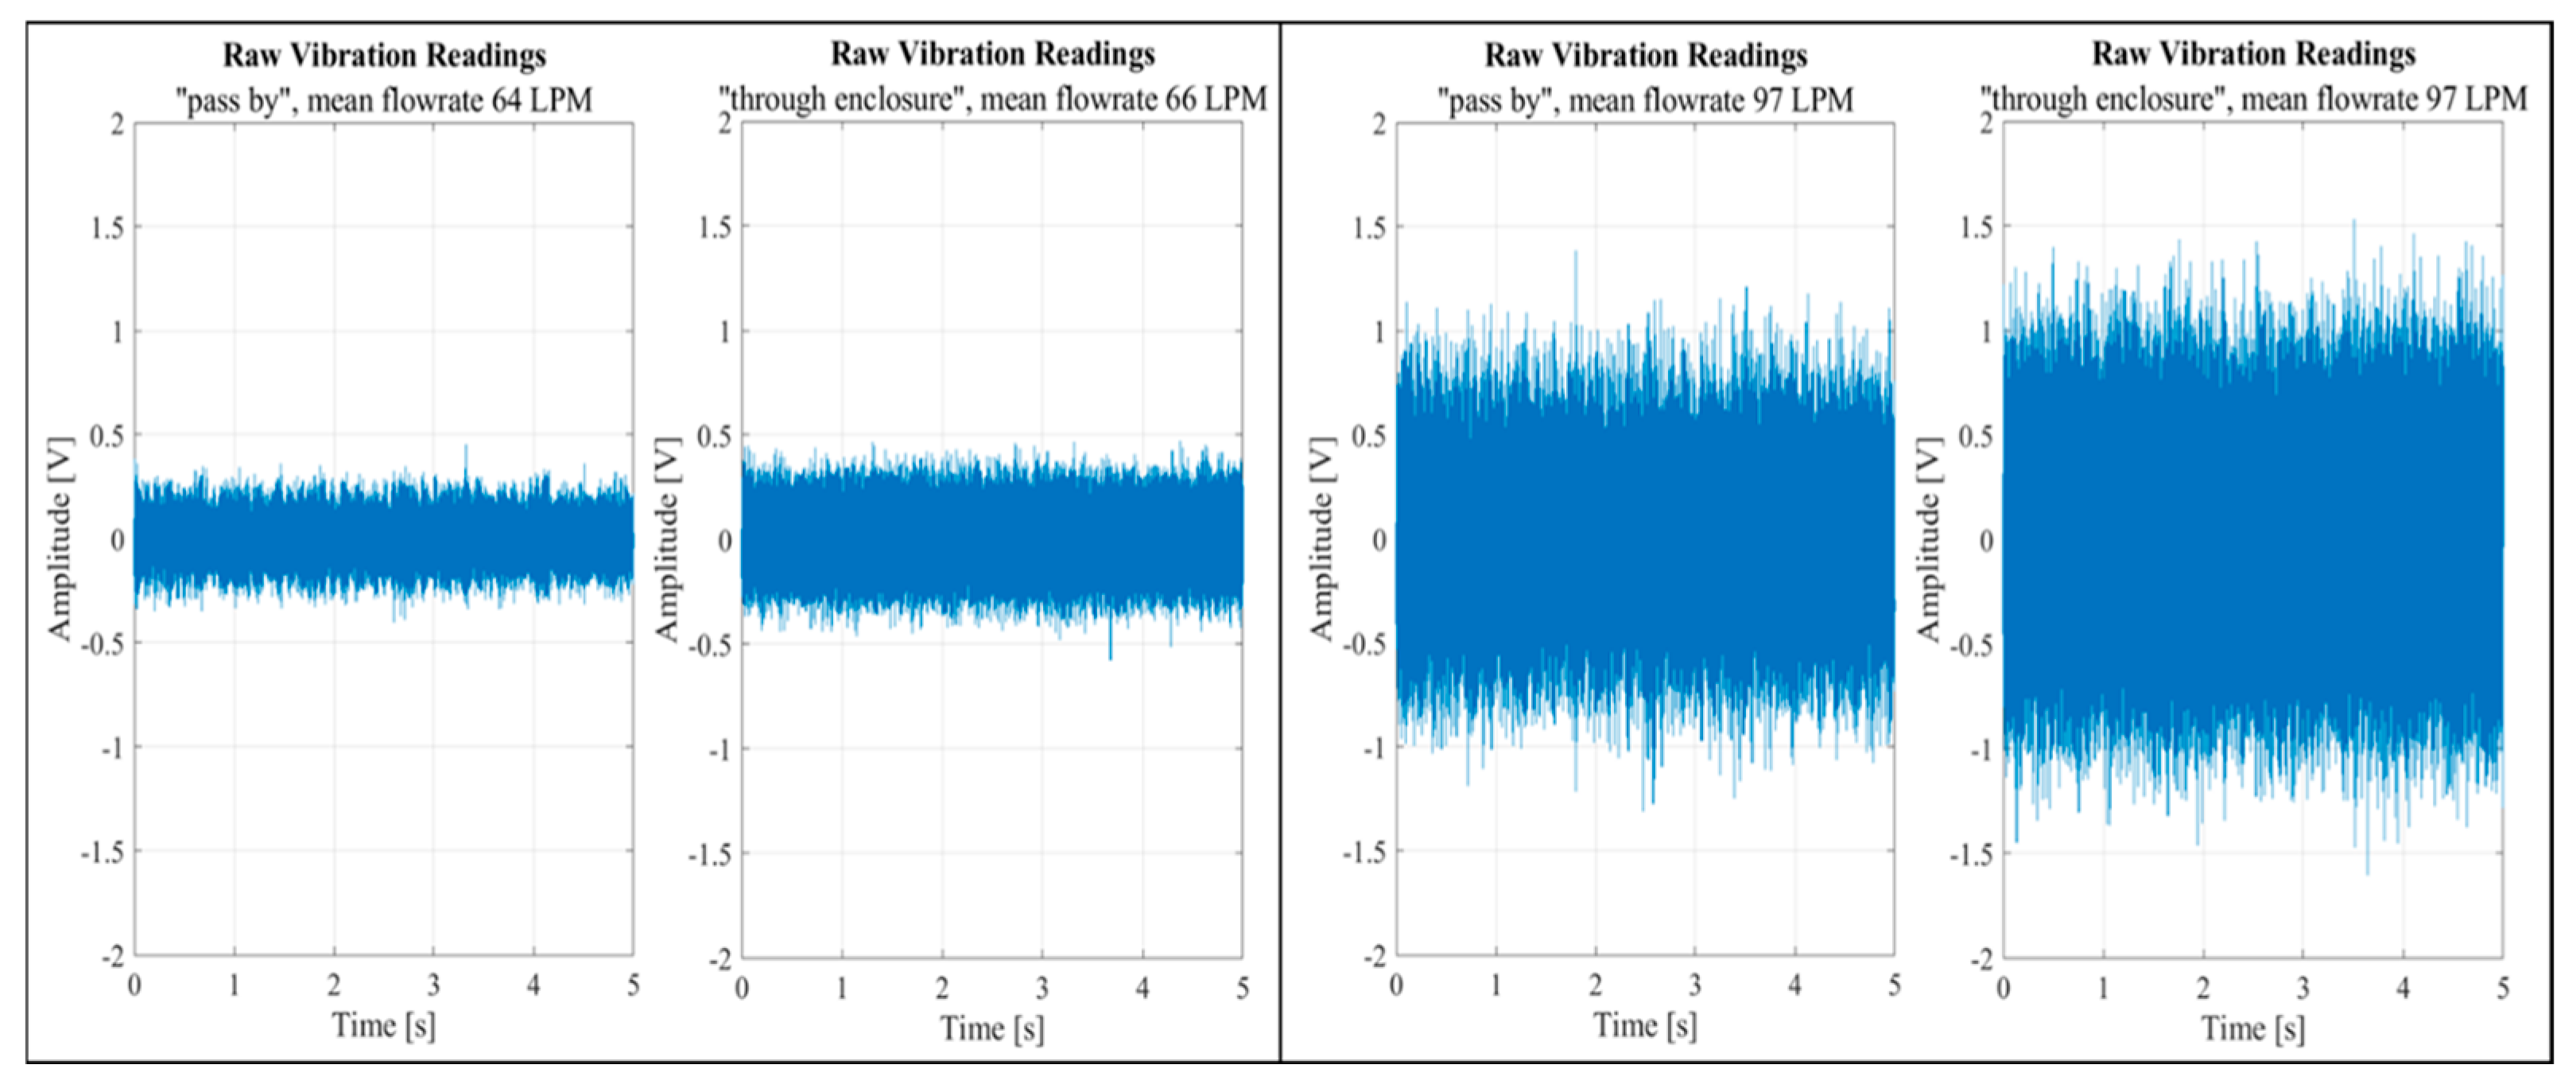
Figure 9.
Vibration spectra at different flow rates in two setup configurations (“Pass By” and “Through Enclosure”).
Figure 9.
Vibration spectra at different flow rates in two setup configurations (“Pass By” and “Through Enclosure”).
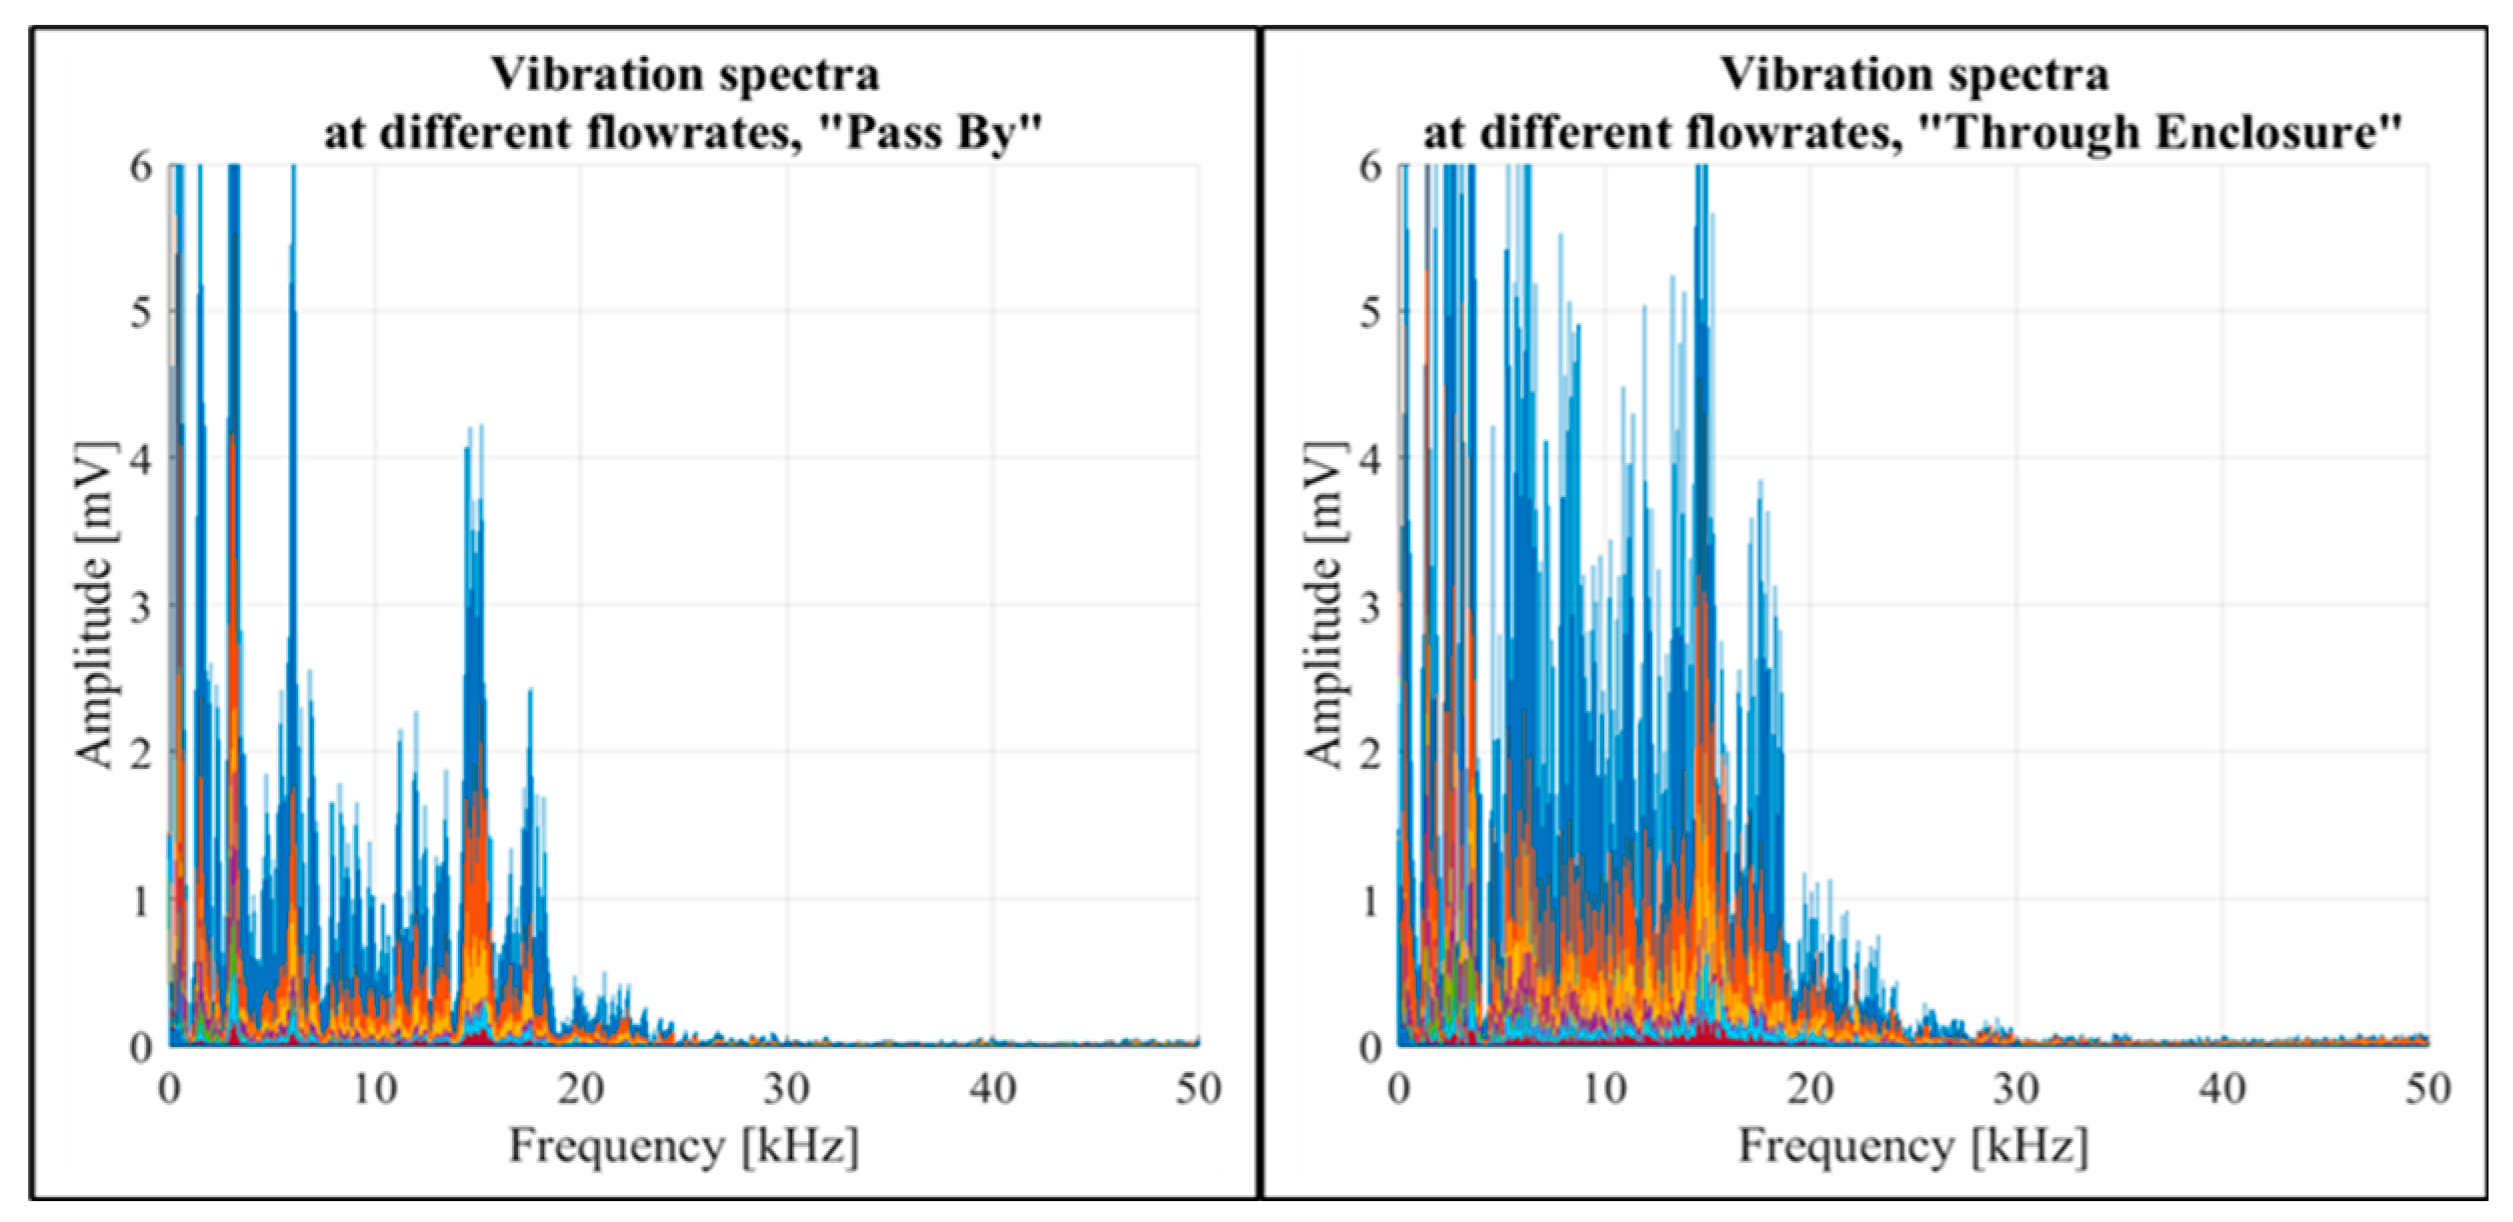
Figure 10.
Vibration spectrum at zero flow rate for two setup configurations.
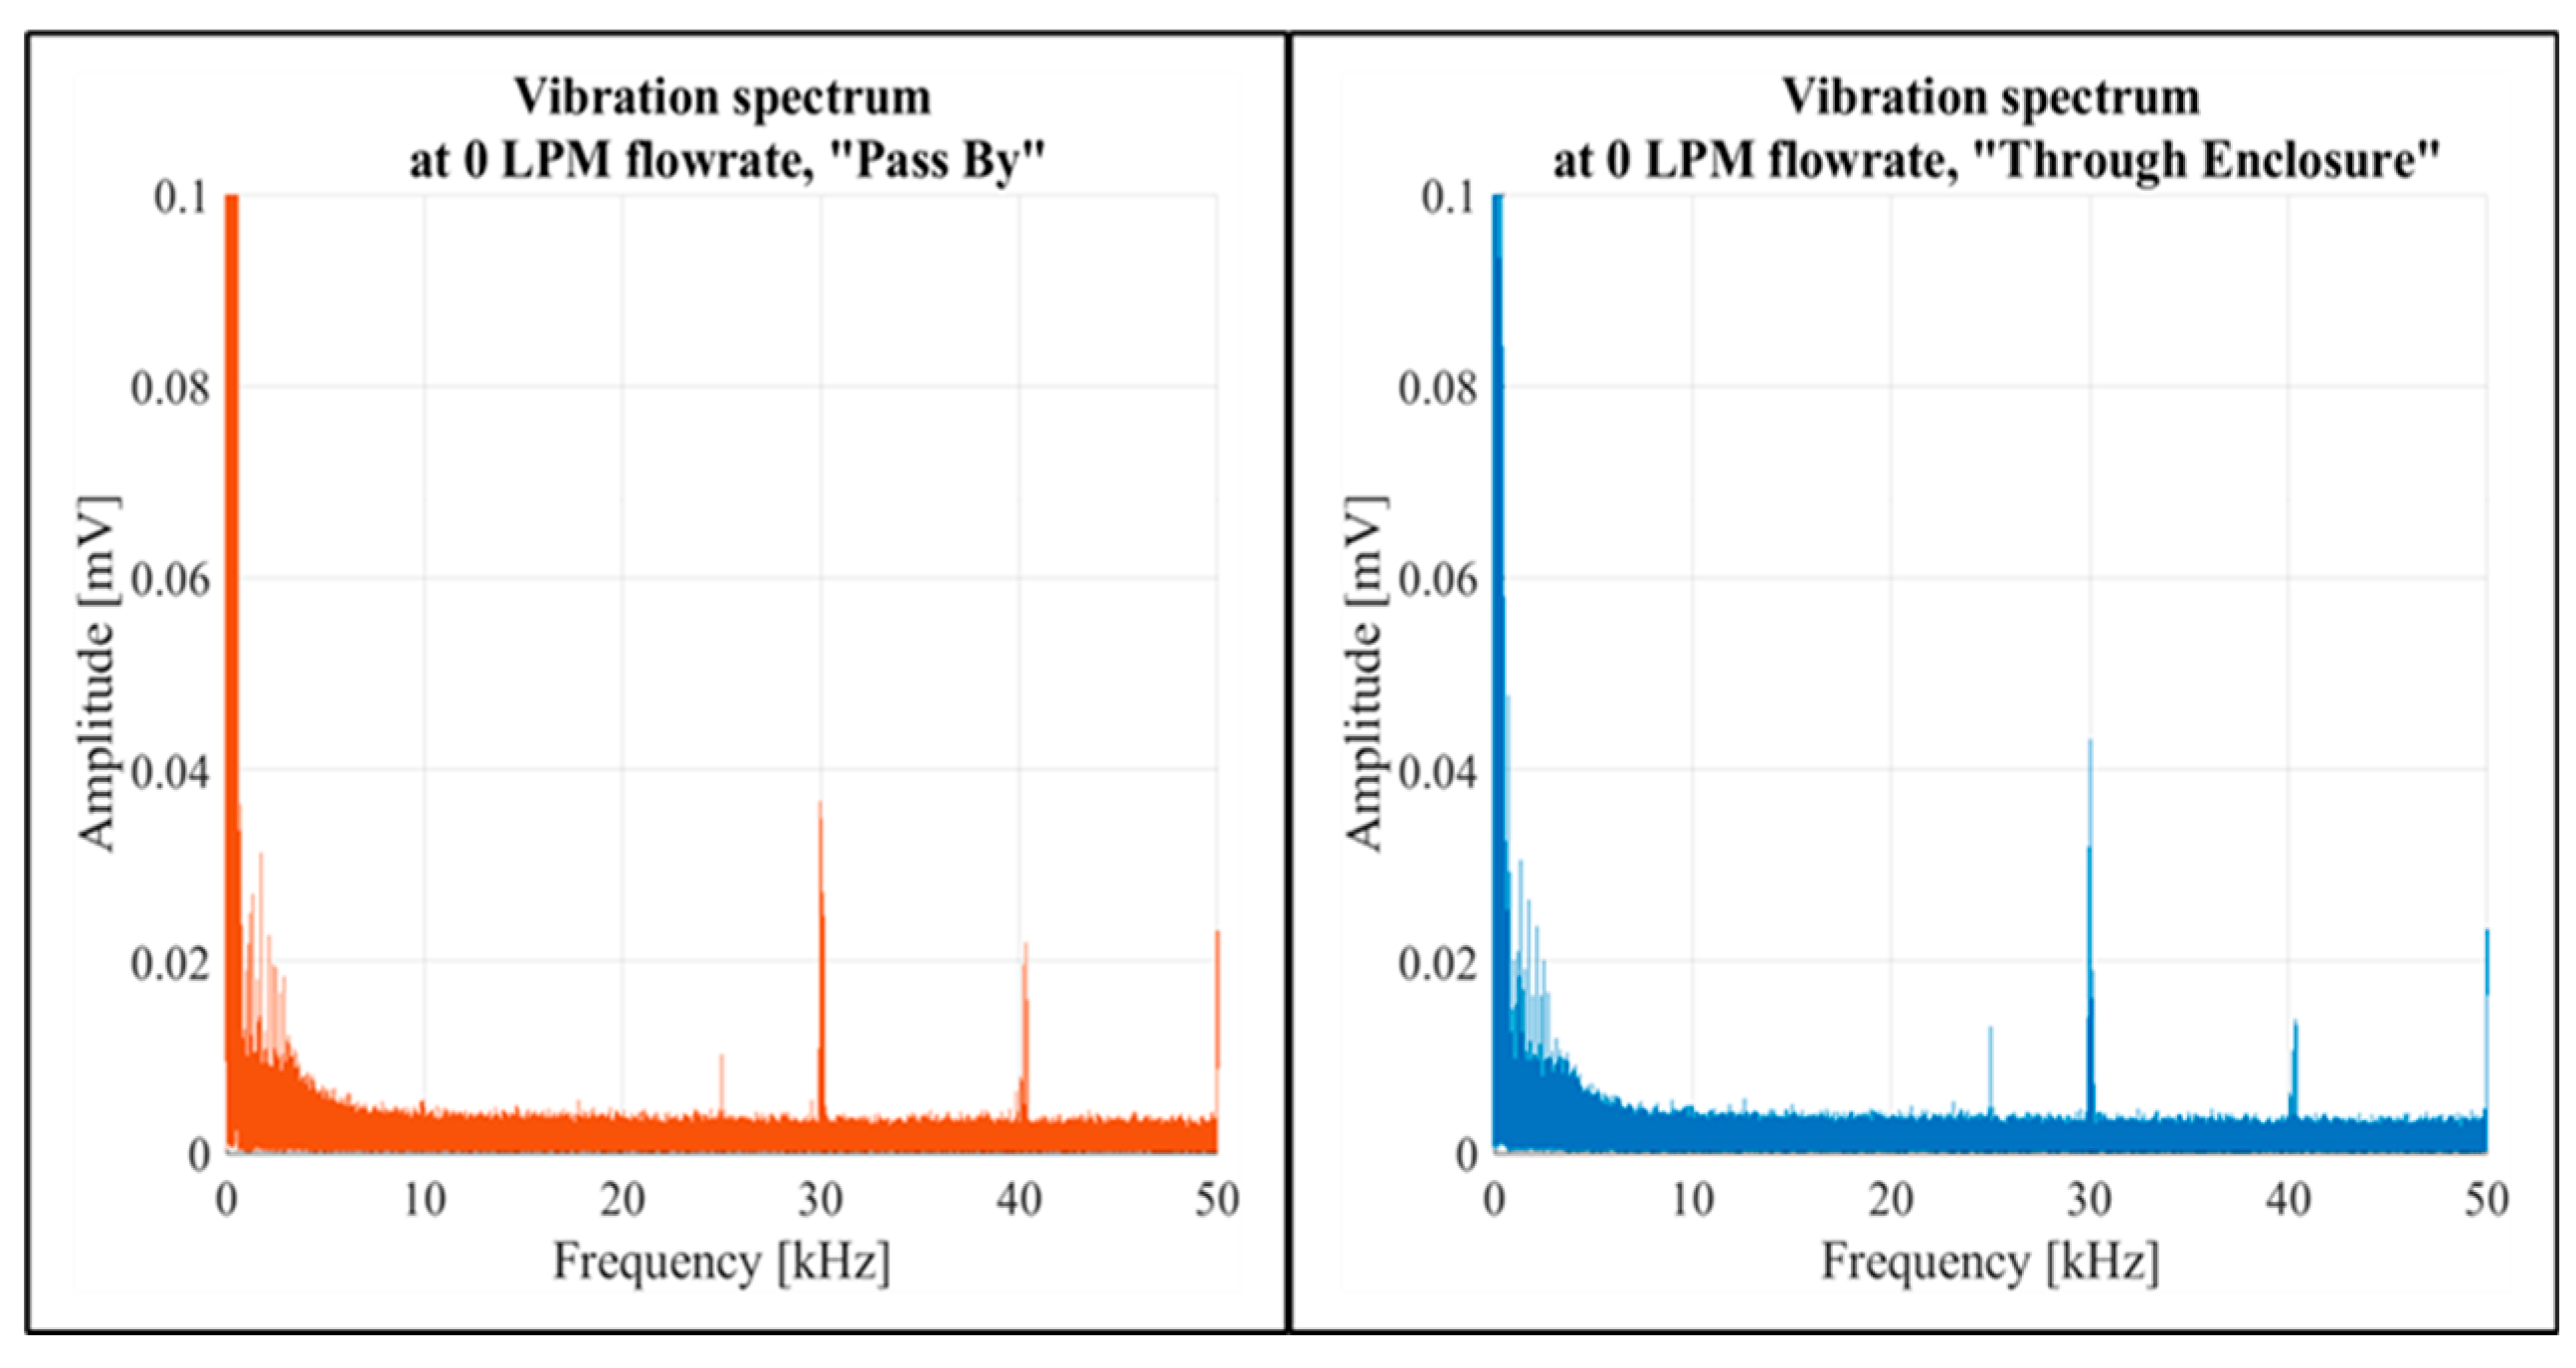
Figure 11.
Vibration PSD at different constant flow rates for two setup configurations (“Pass By” and “Through Enclosure”).
Figure 11.
Vibration PSD at different constant flow rates for two setup configurations (“Pass By” and “Through Enclosure”).
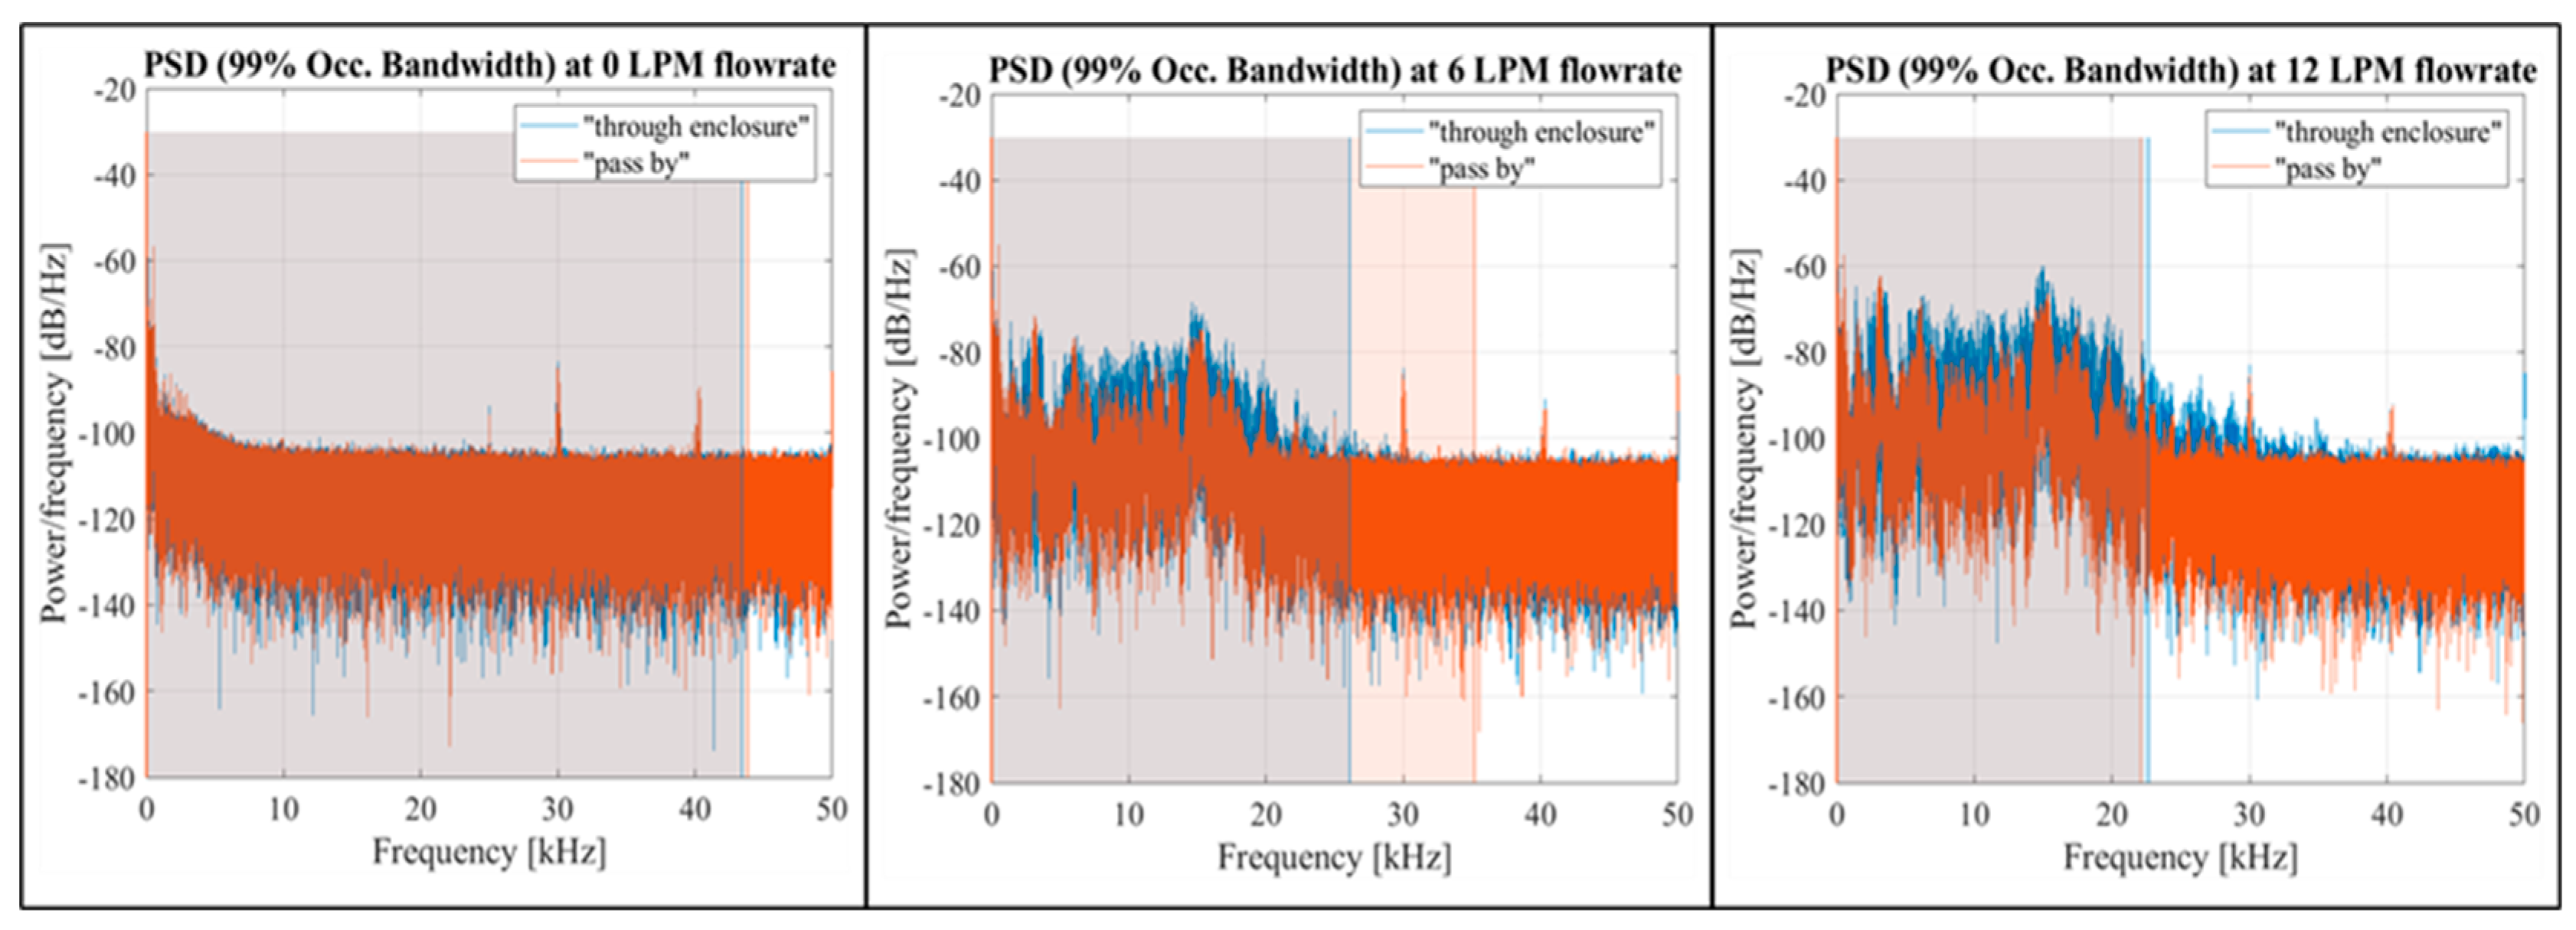
Figure 12.
Vibration spectra at different constant flow rates in the 0-1,500 Hz frequency band for two setup configurations.
Figure 12.
Vibration spectra at different constant flow rates in the 0-1,500 Hz frequency band for two setup configurations.
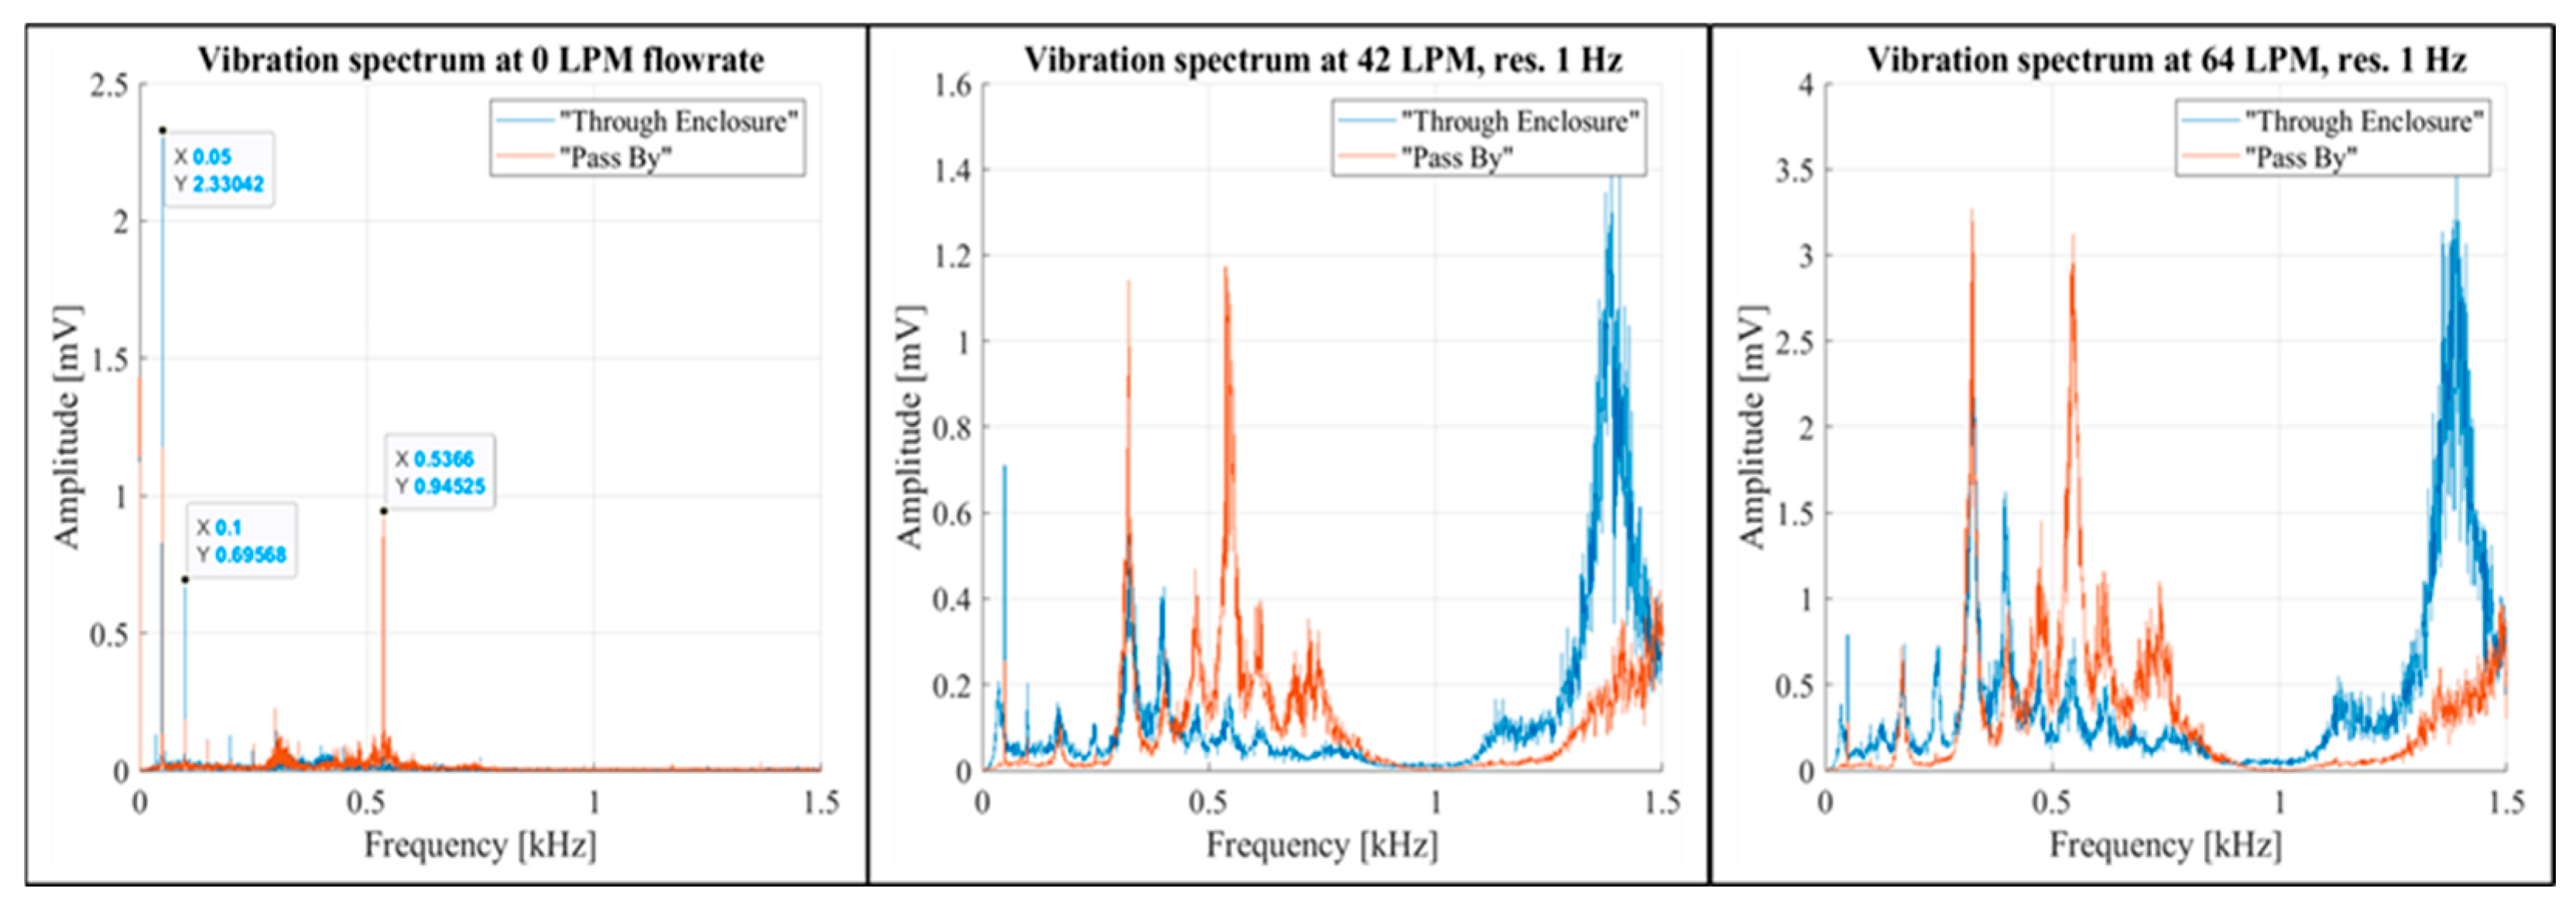
Figure 13.
Vibration spectrum at 97 LPM flow rate.
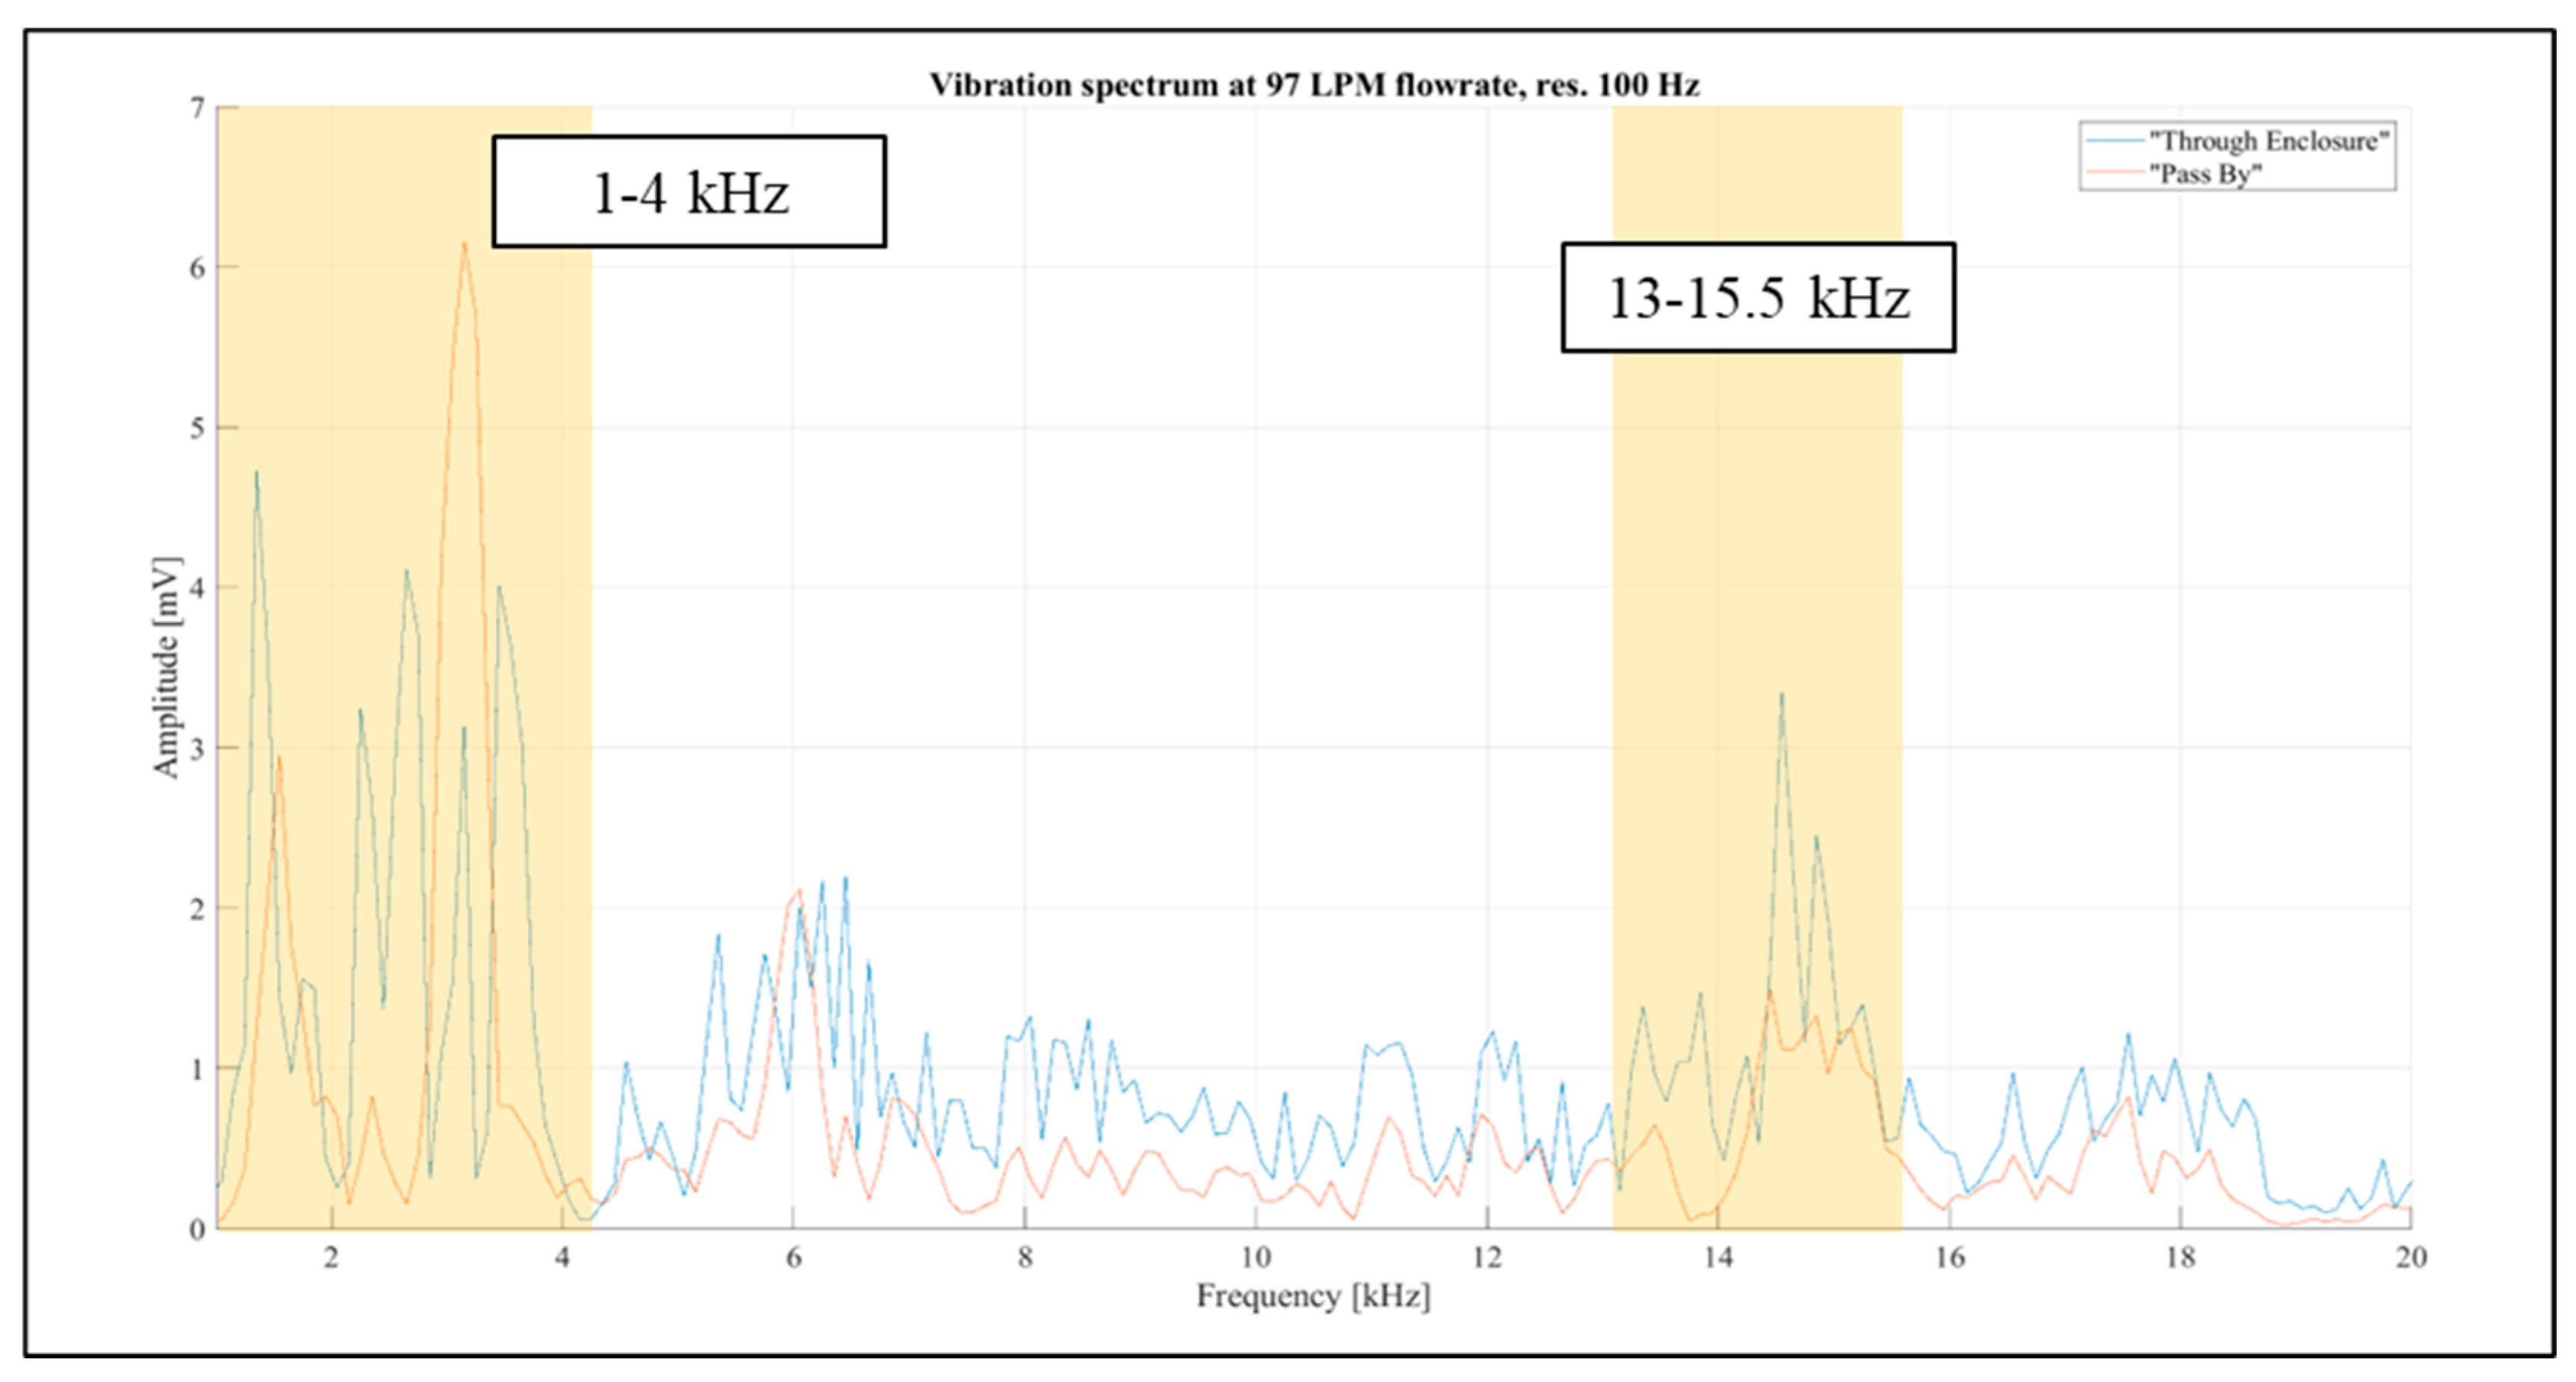
Figure 14.
Vibration spectrum at 97 LPM flow rate in 1 kHz - 5 kHz frequency band for two setup configurations.
Figure 14.
Vibration spectrum at 97 LPM flow rate in 1 kHz - 5 kHz frequency band for two setup configurations.
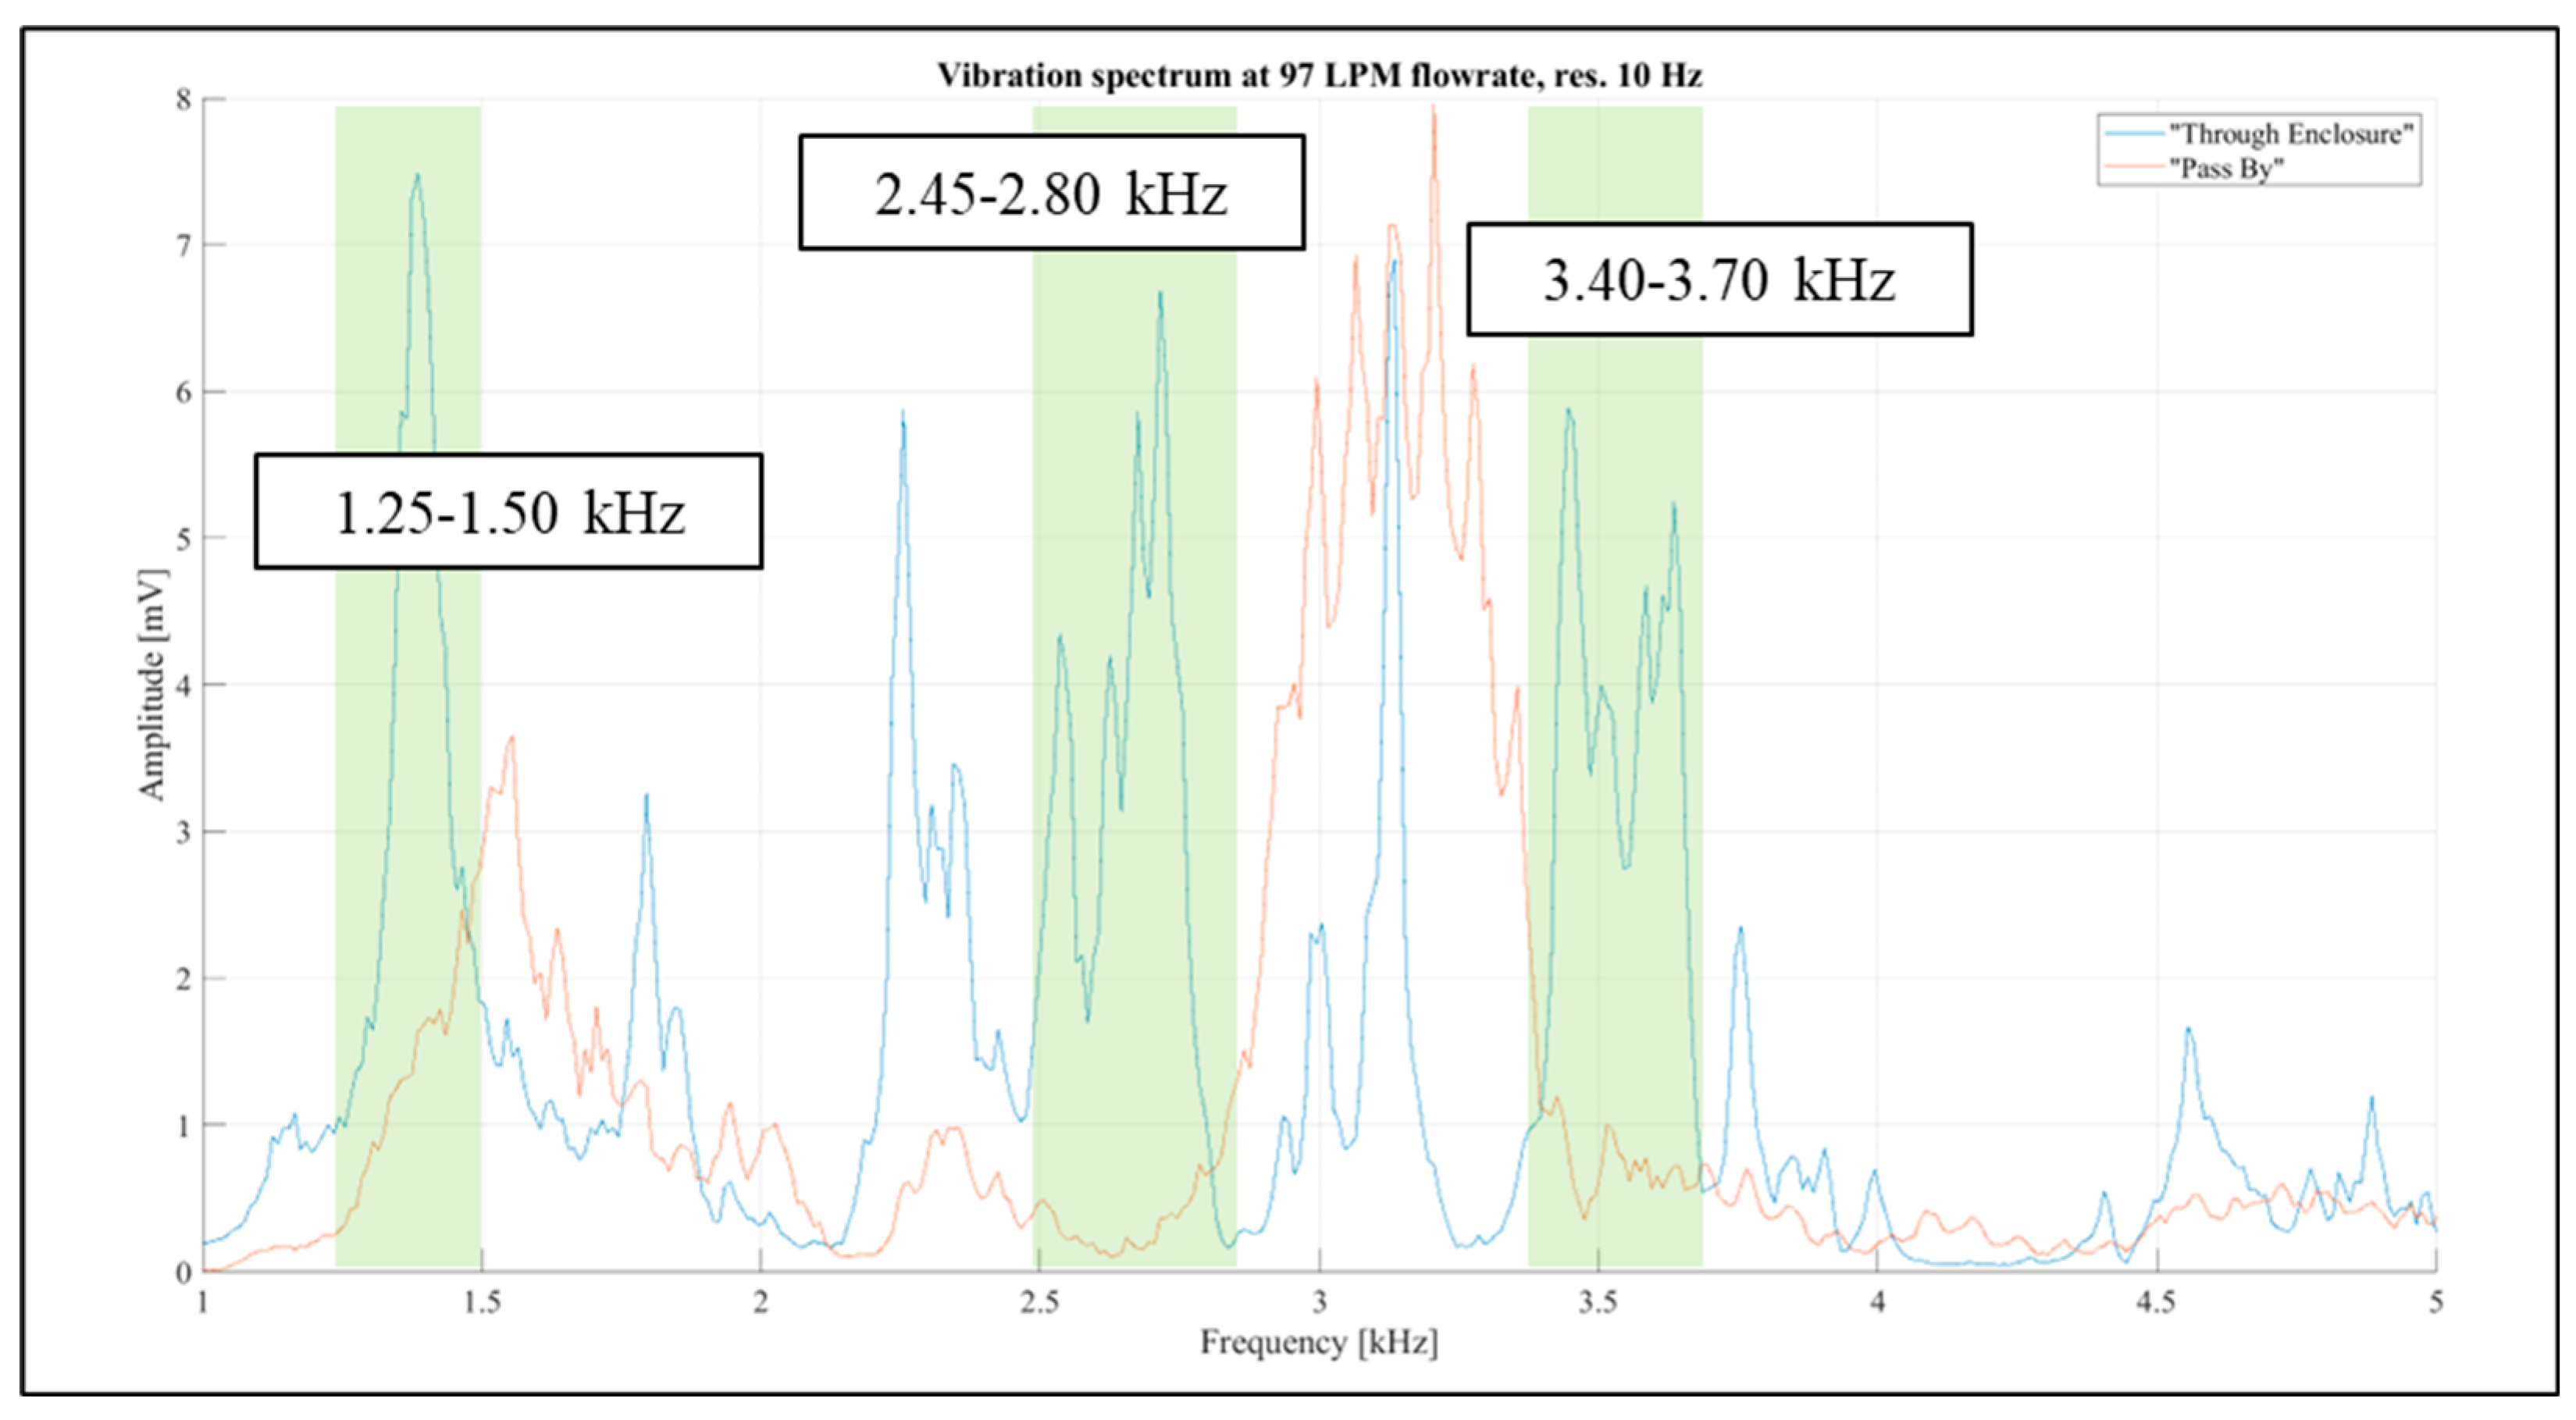
Figure 15.
Vibration spectrum at 97 LPM flow rate in 13 kHz - 17 kHz frequency band for two setup configurations.
Figure 15.
Vibration spectrum at 97 LPM flow rate in 13 kHz - 17 kHz frequency band for two setup configurations.
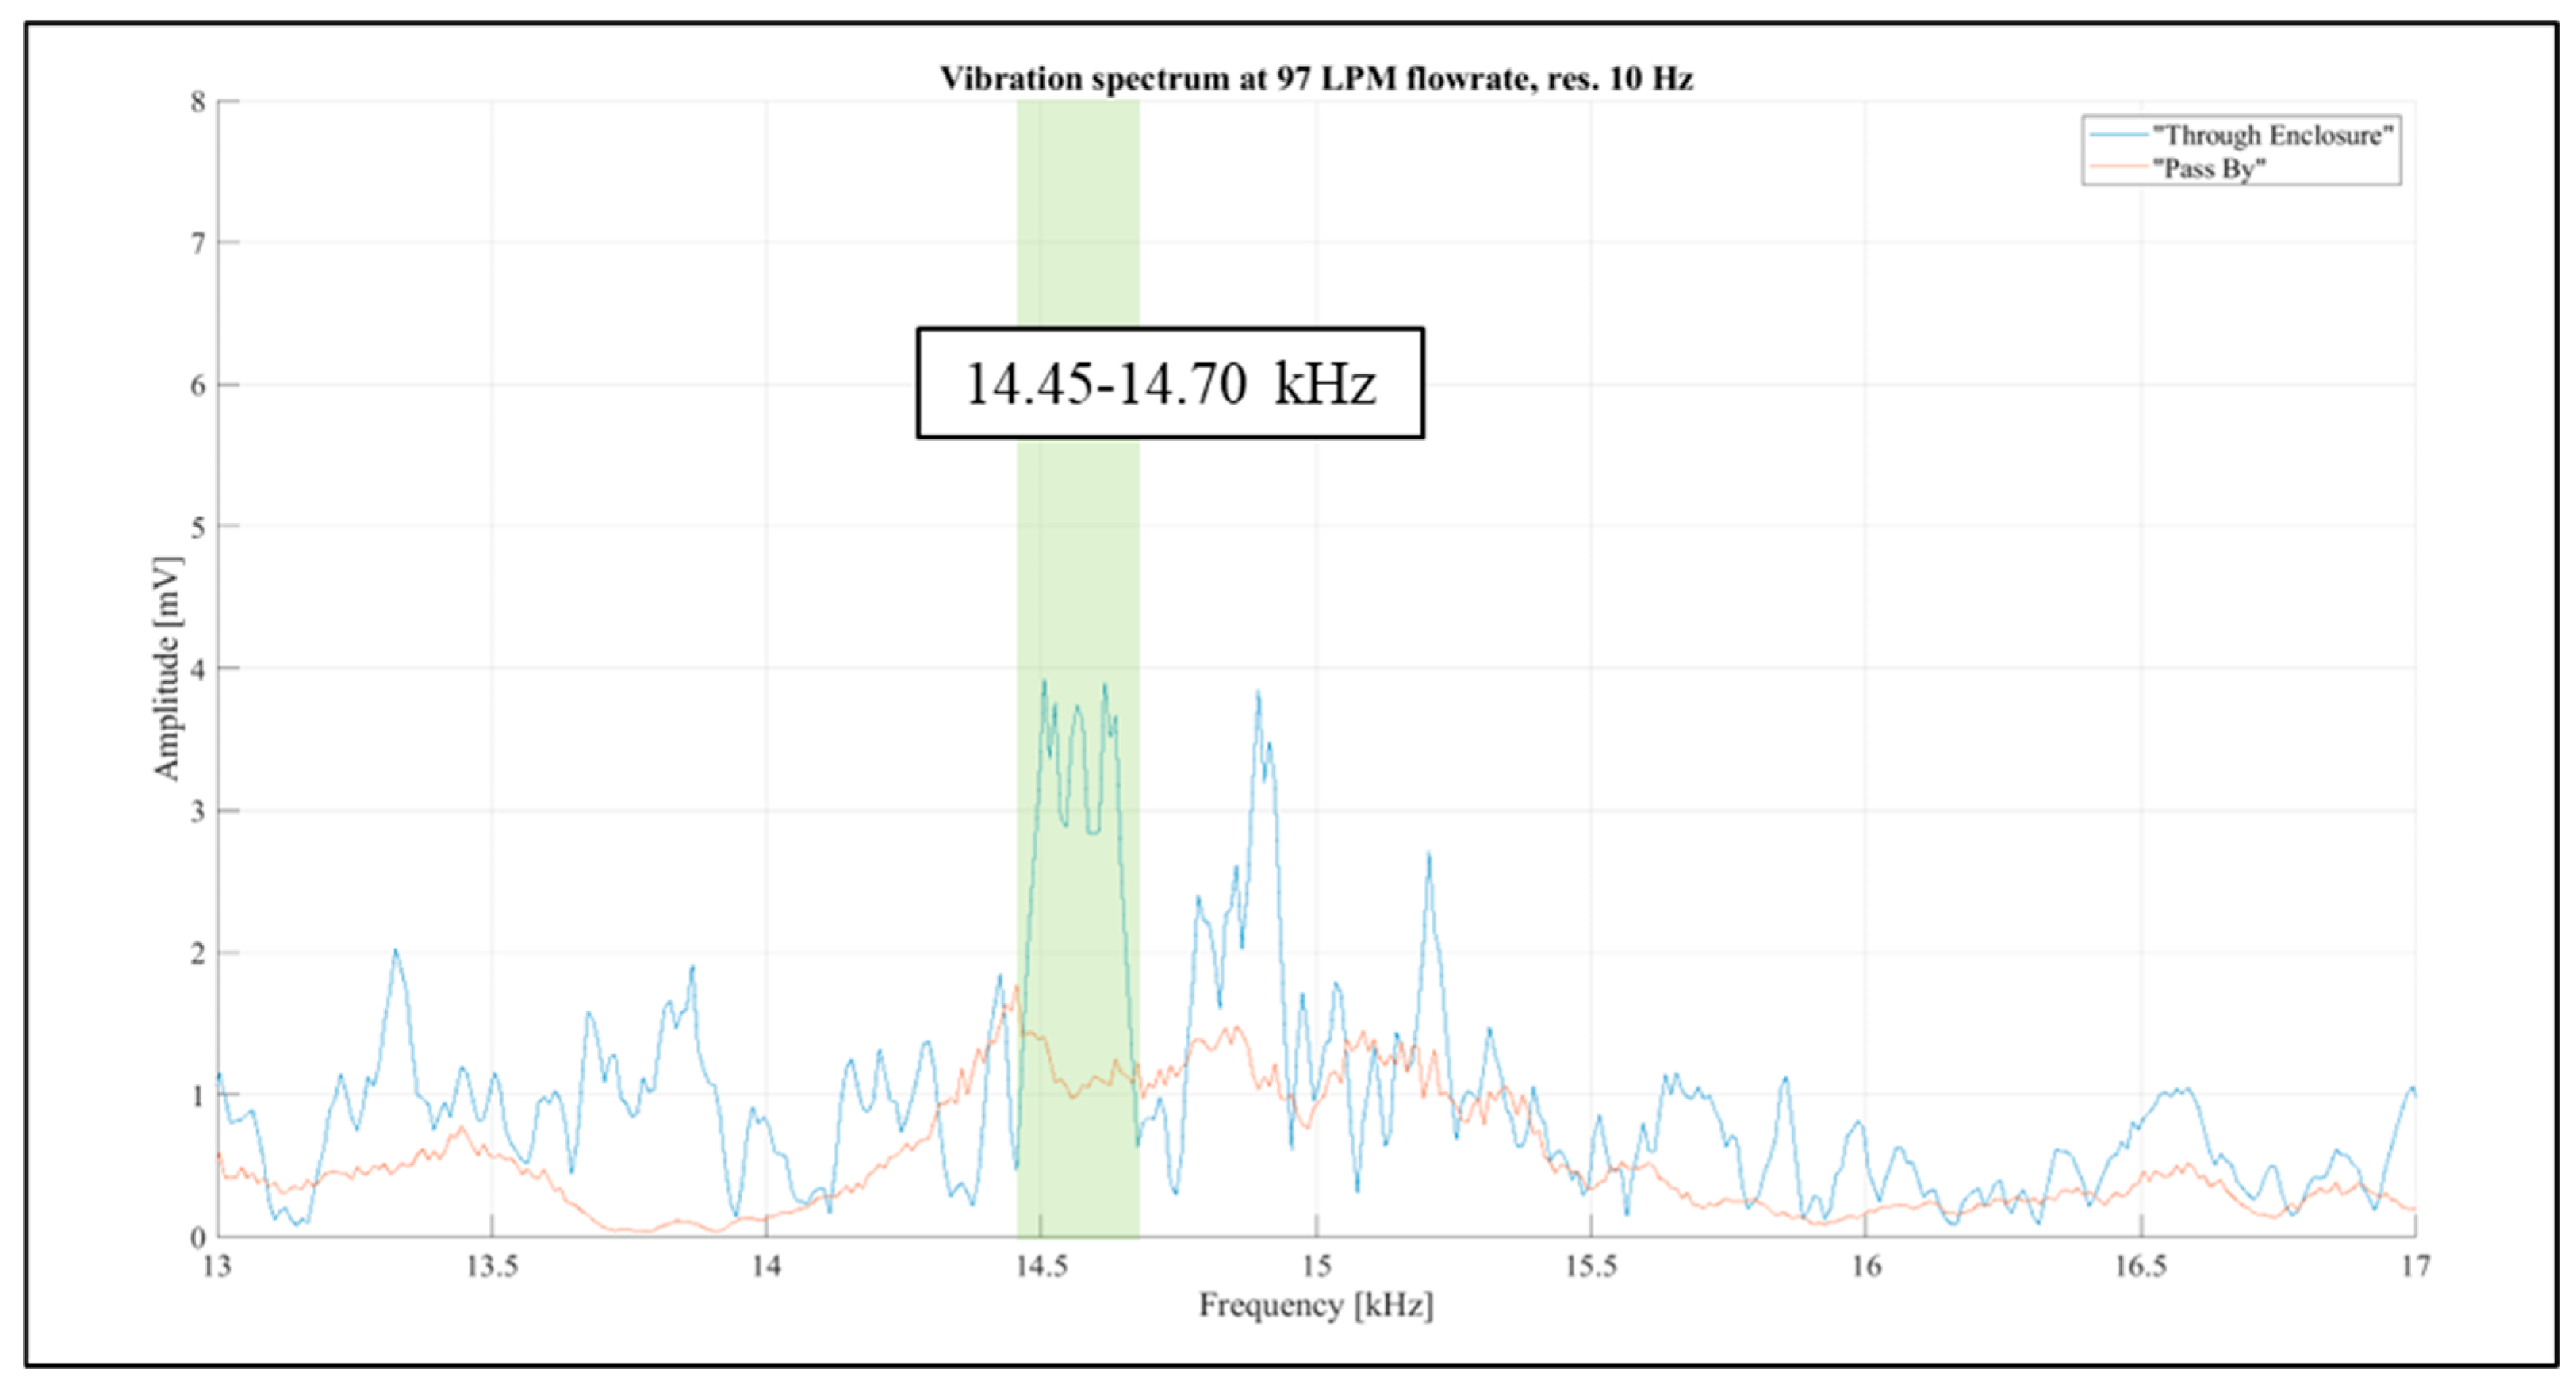
Figure 16.
Vibration spectra at different flow rates in the 1.25 kHz - 1.5 kHz frequency band (left) and in the 2.45 kHz -2.8 kHz frequency band (right).
Figure 16.
Vibration spectra at different flow rates in the 1.25 kHz - 1.5 kHz frequency band (left) and in the 2.45 kHz -2.8 kHz frequency band (right).
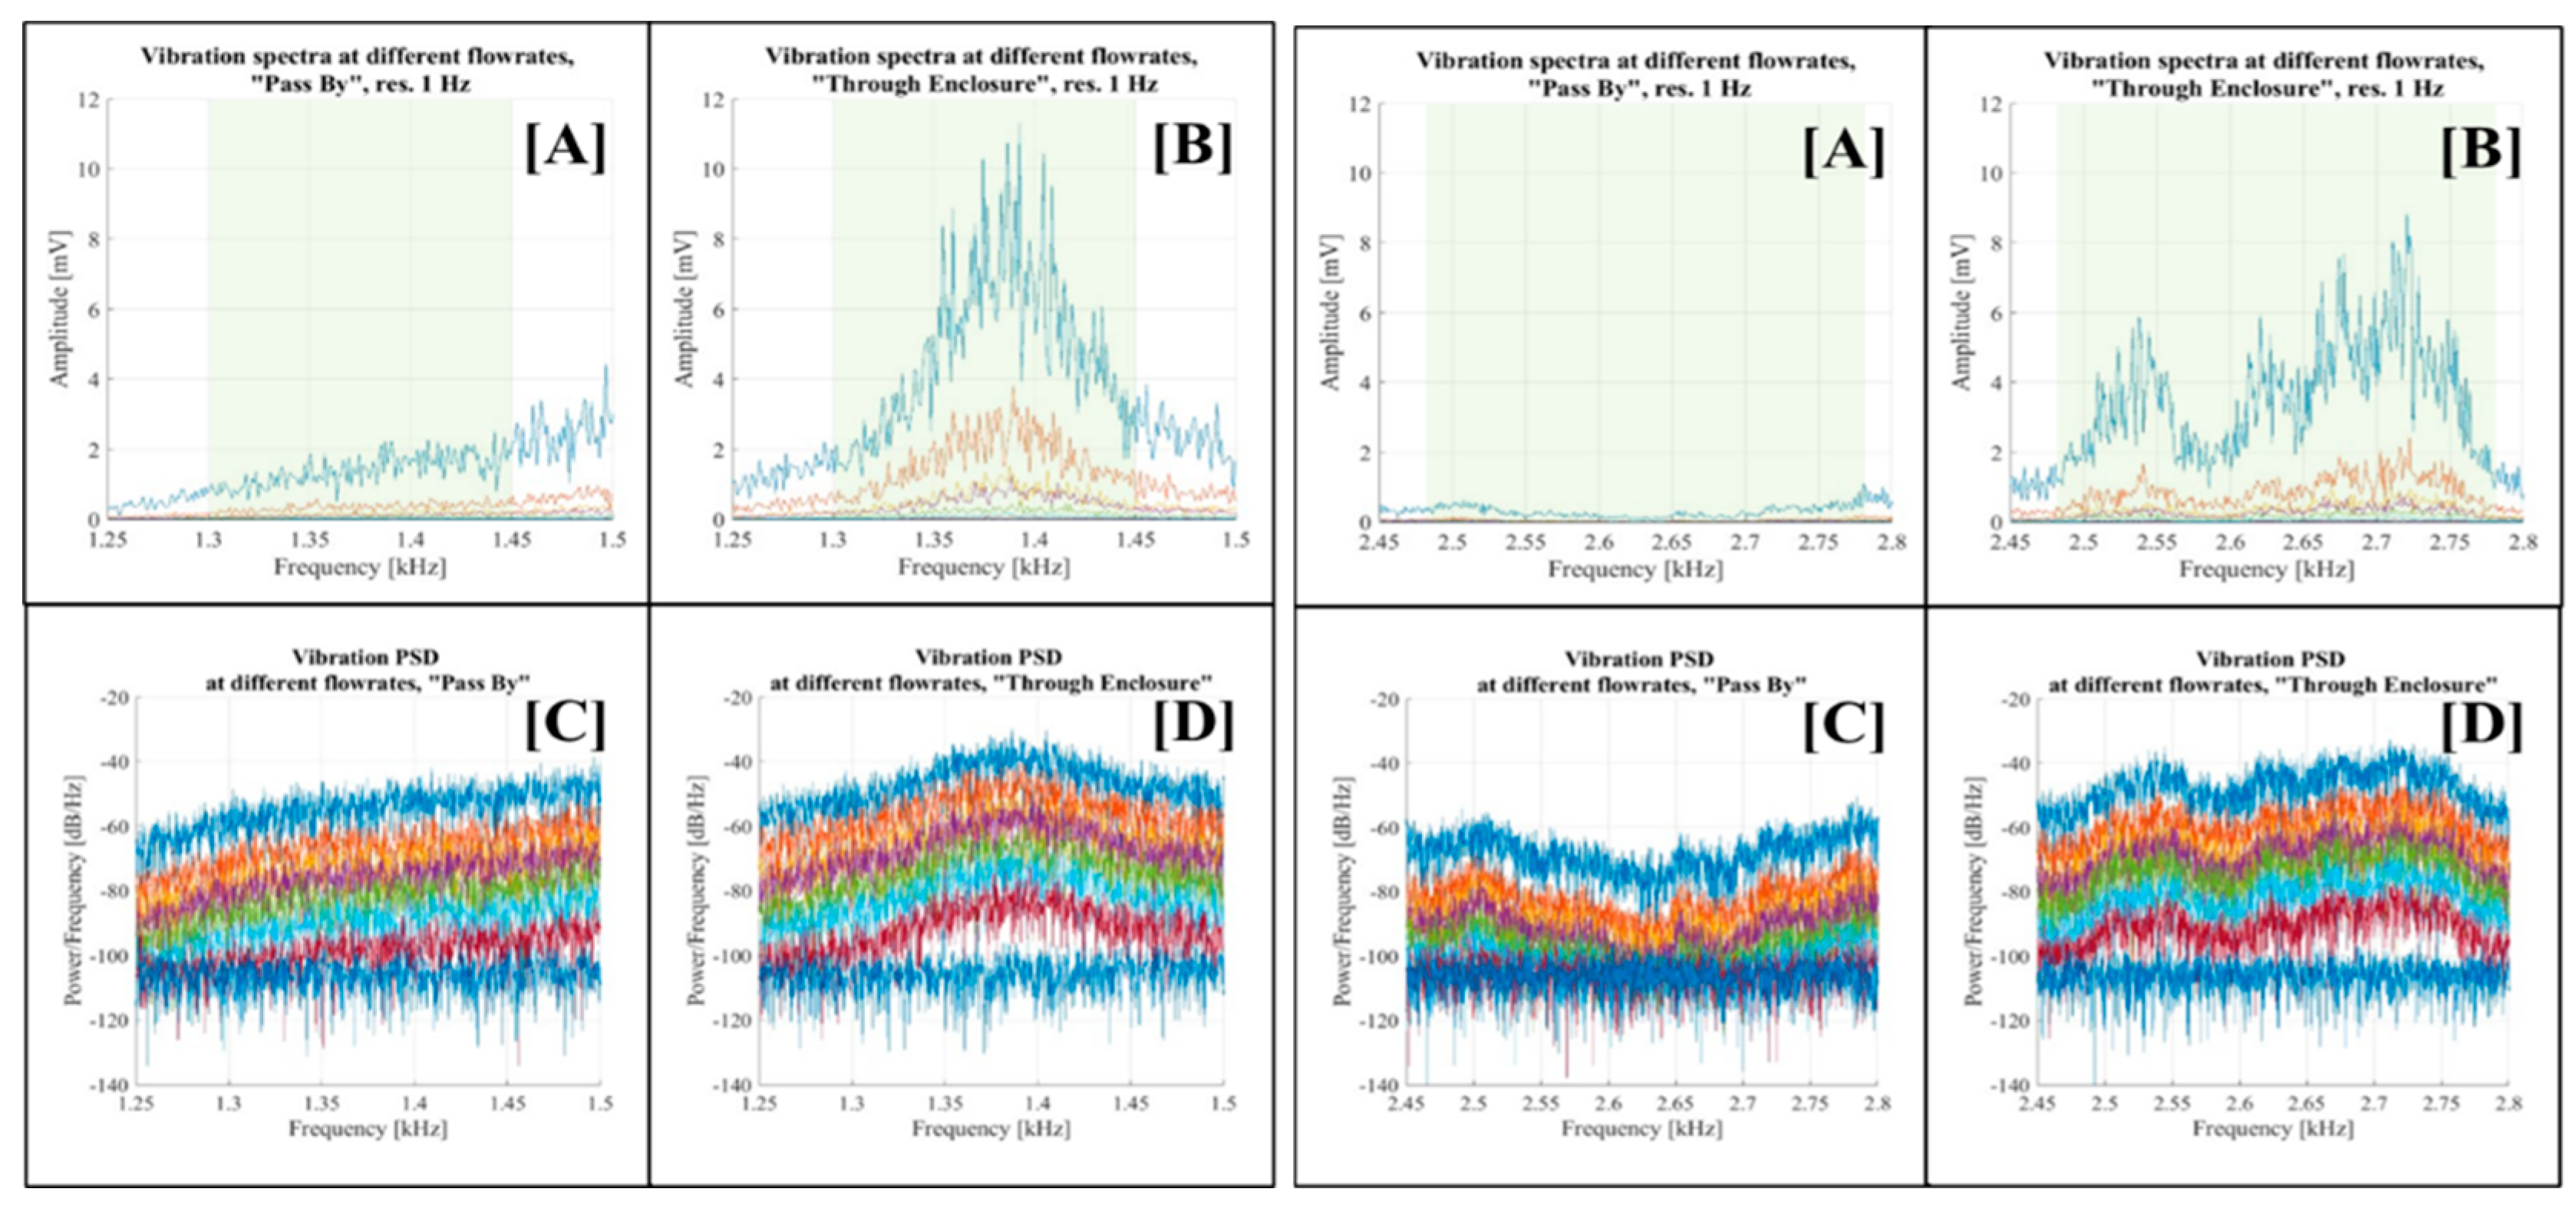
Figure 17.
Vibration spectra at different flow rates in the 3.4 kHz - 3.7 kHz frequency band (left) and in the 14.45 kHz -14.7 kHz frequency band (right).
Figure 17.
Vibration spectra at different flow rates in the 3.4 kHz - 3.7 kHz frequency band (left) and in the 14.45 kHz -14.7 kHz frequency band (right).
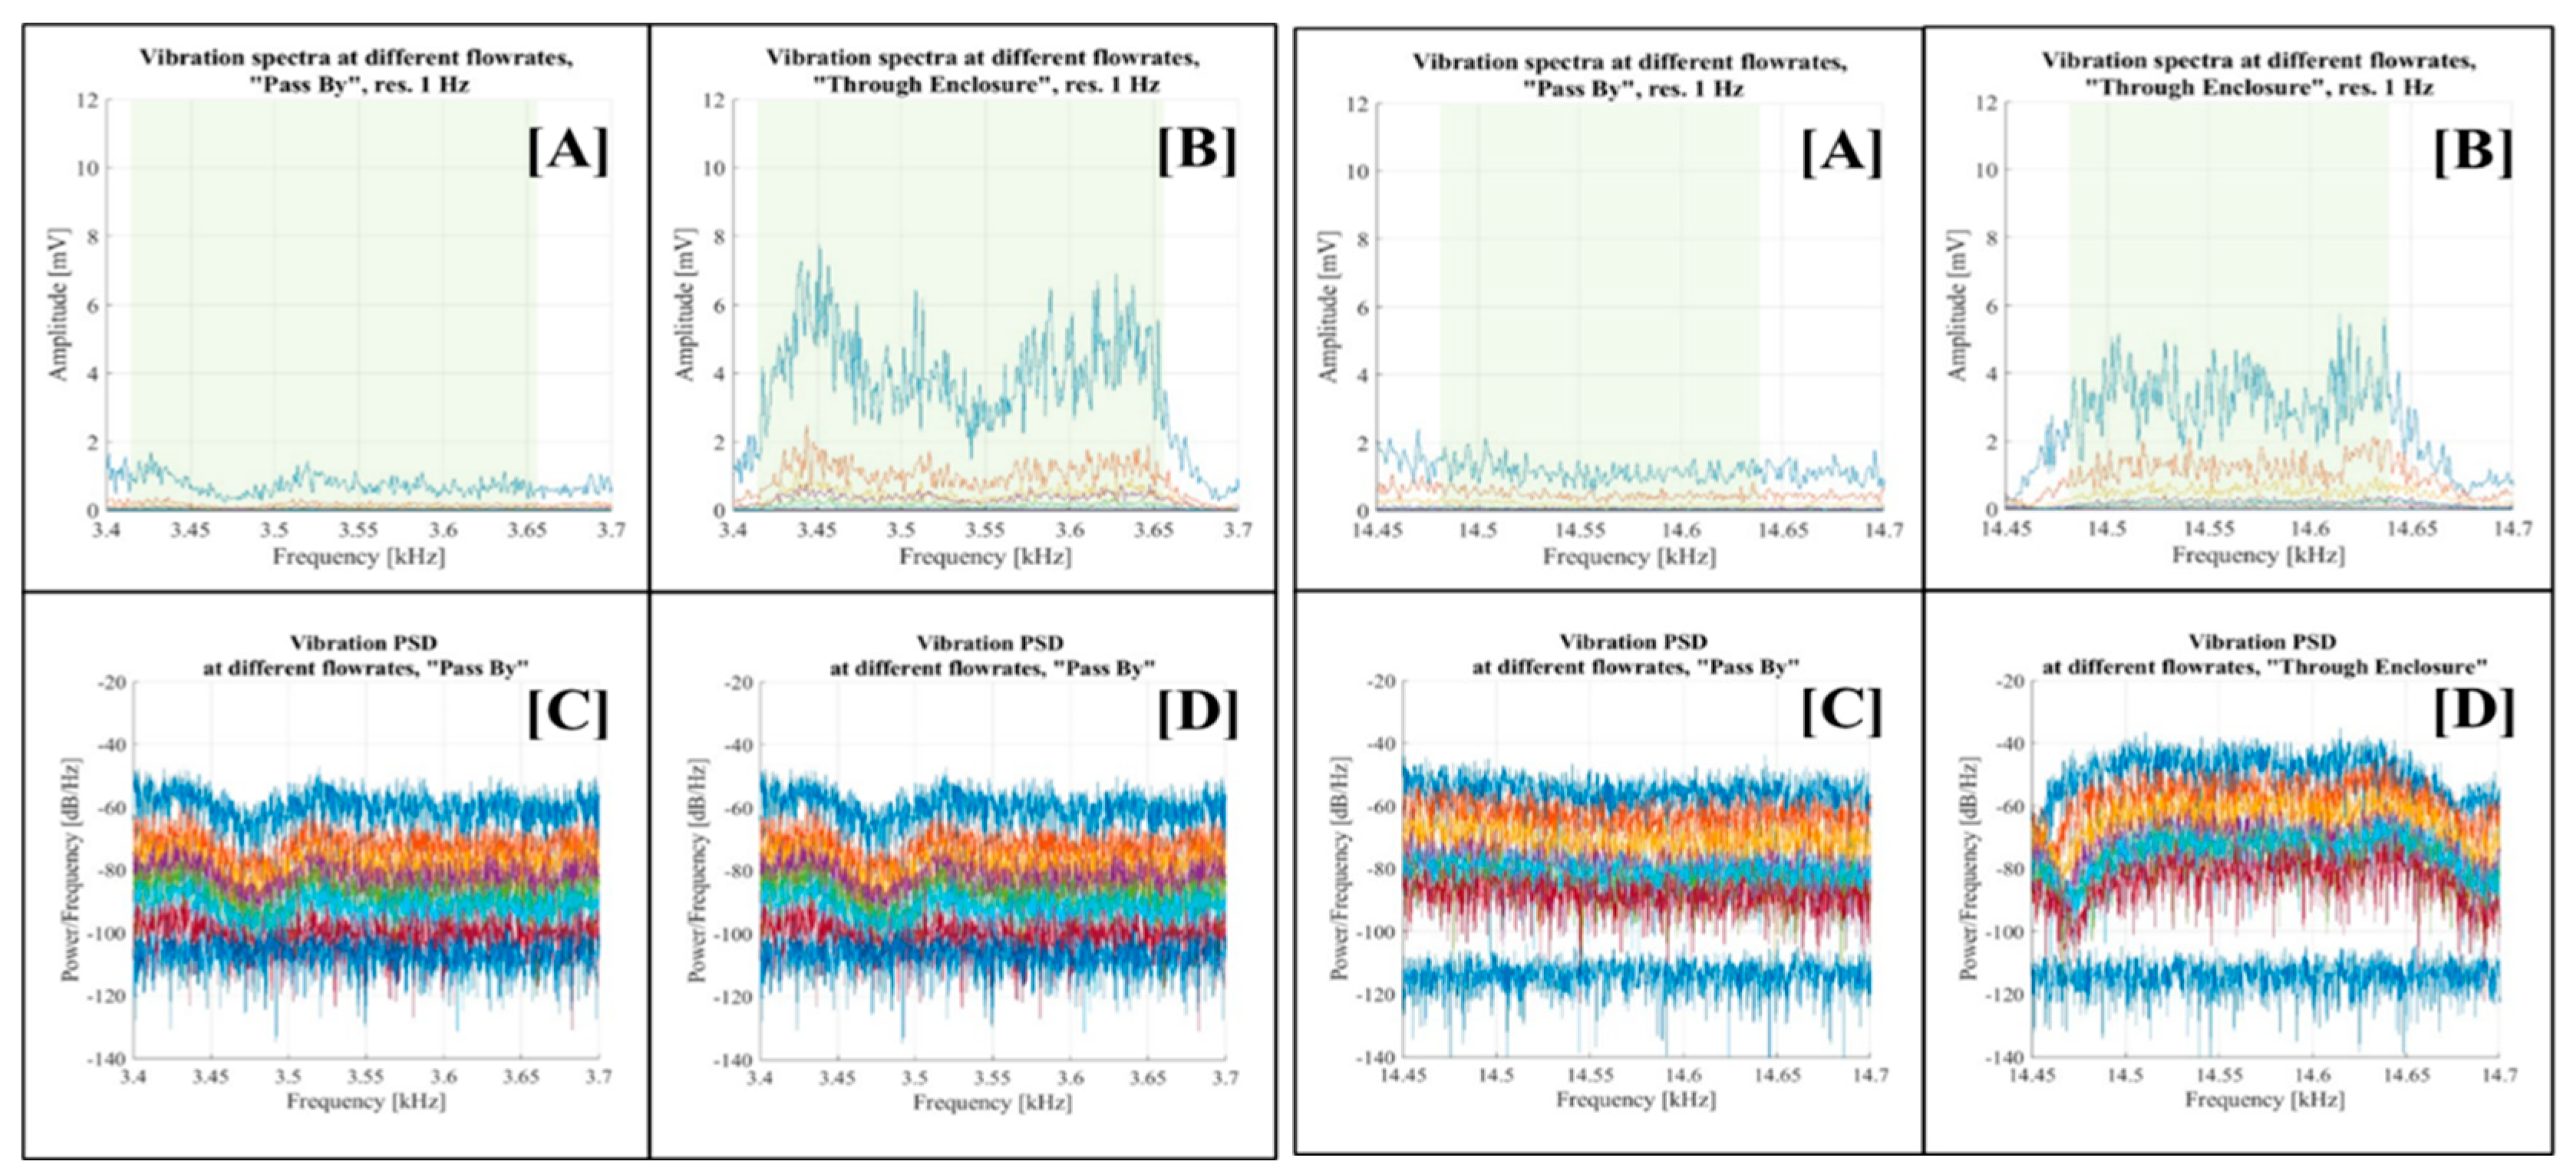
Figure 18.
Quasi-real-time readings in the 1.30 kHz - 1.45 kHz frequency band (top) and the 2.48 kHz - 2.78 kHz band (bottom).
Figure 18.
Quasi-real-time readings in the 1.30 kHz - 1.45 kHz frequency band (top) and the 2.48 kHz - 2.78 kHz band (bottom).
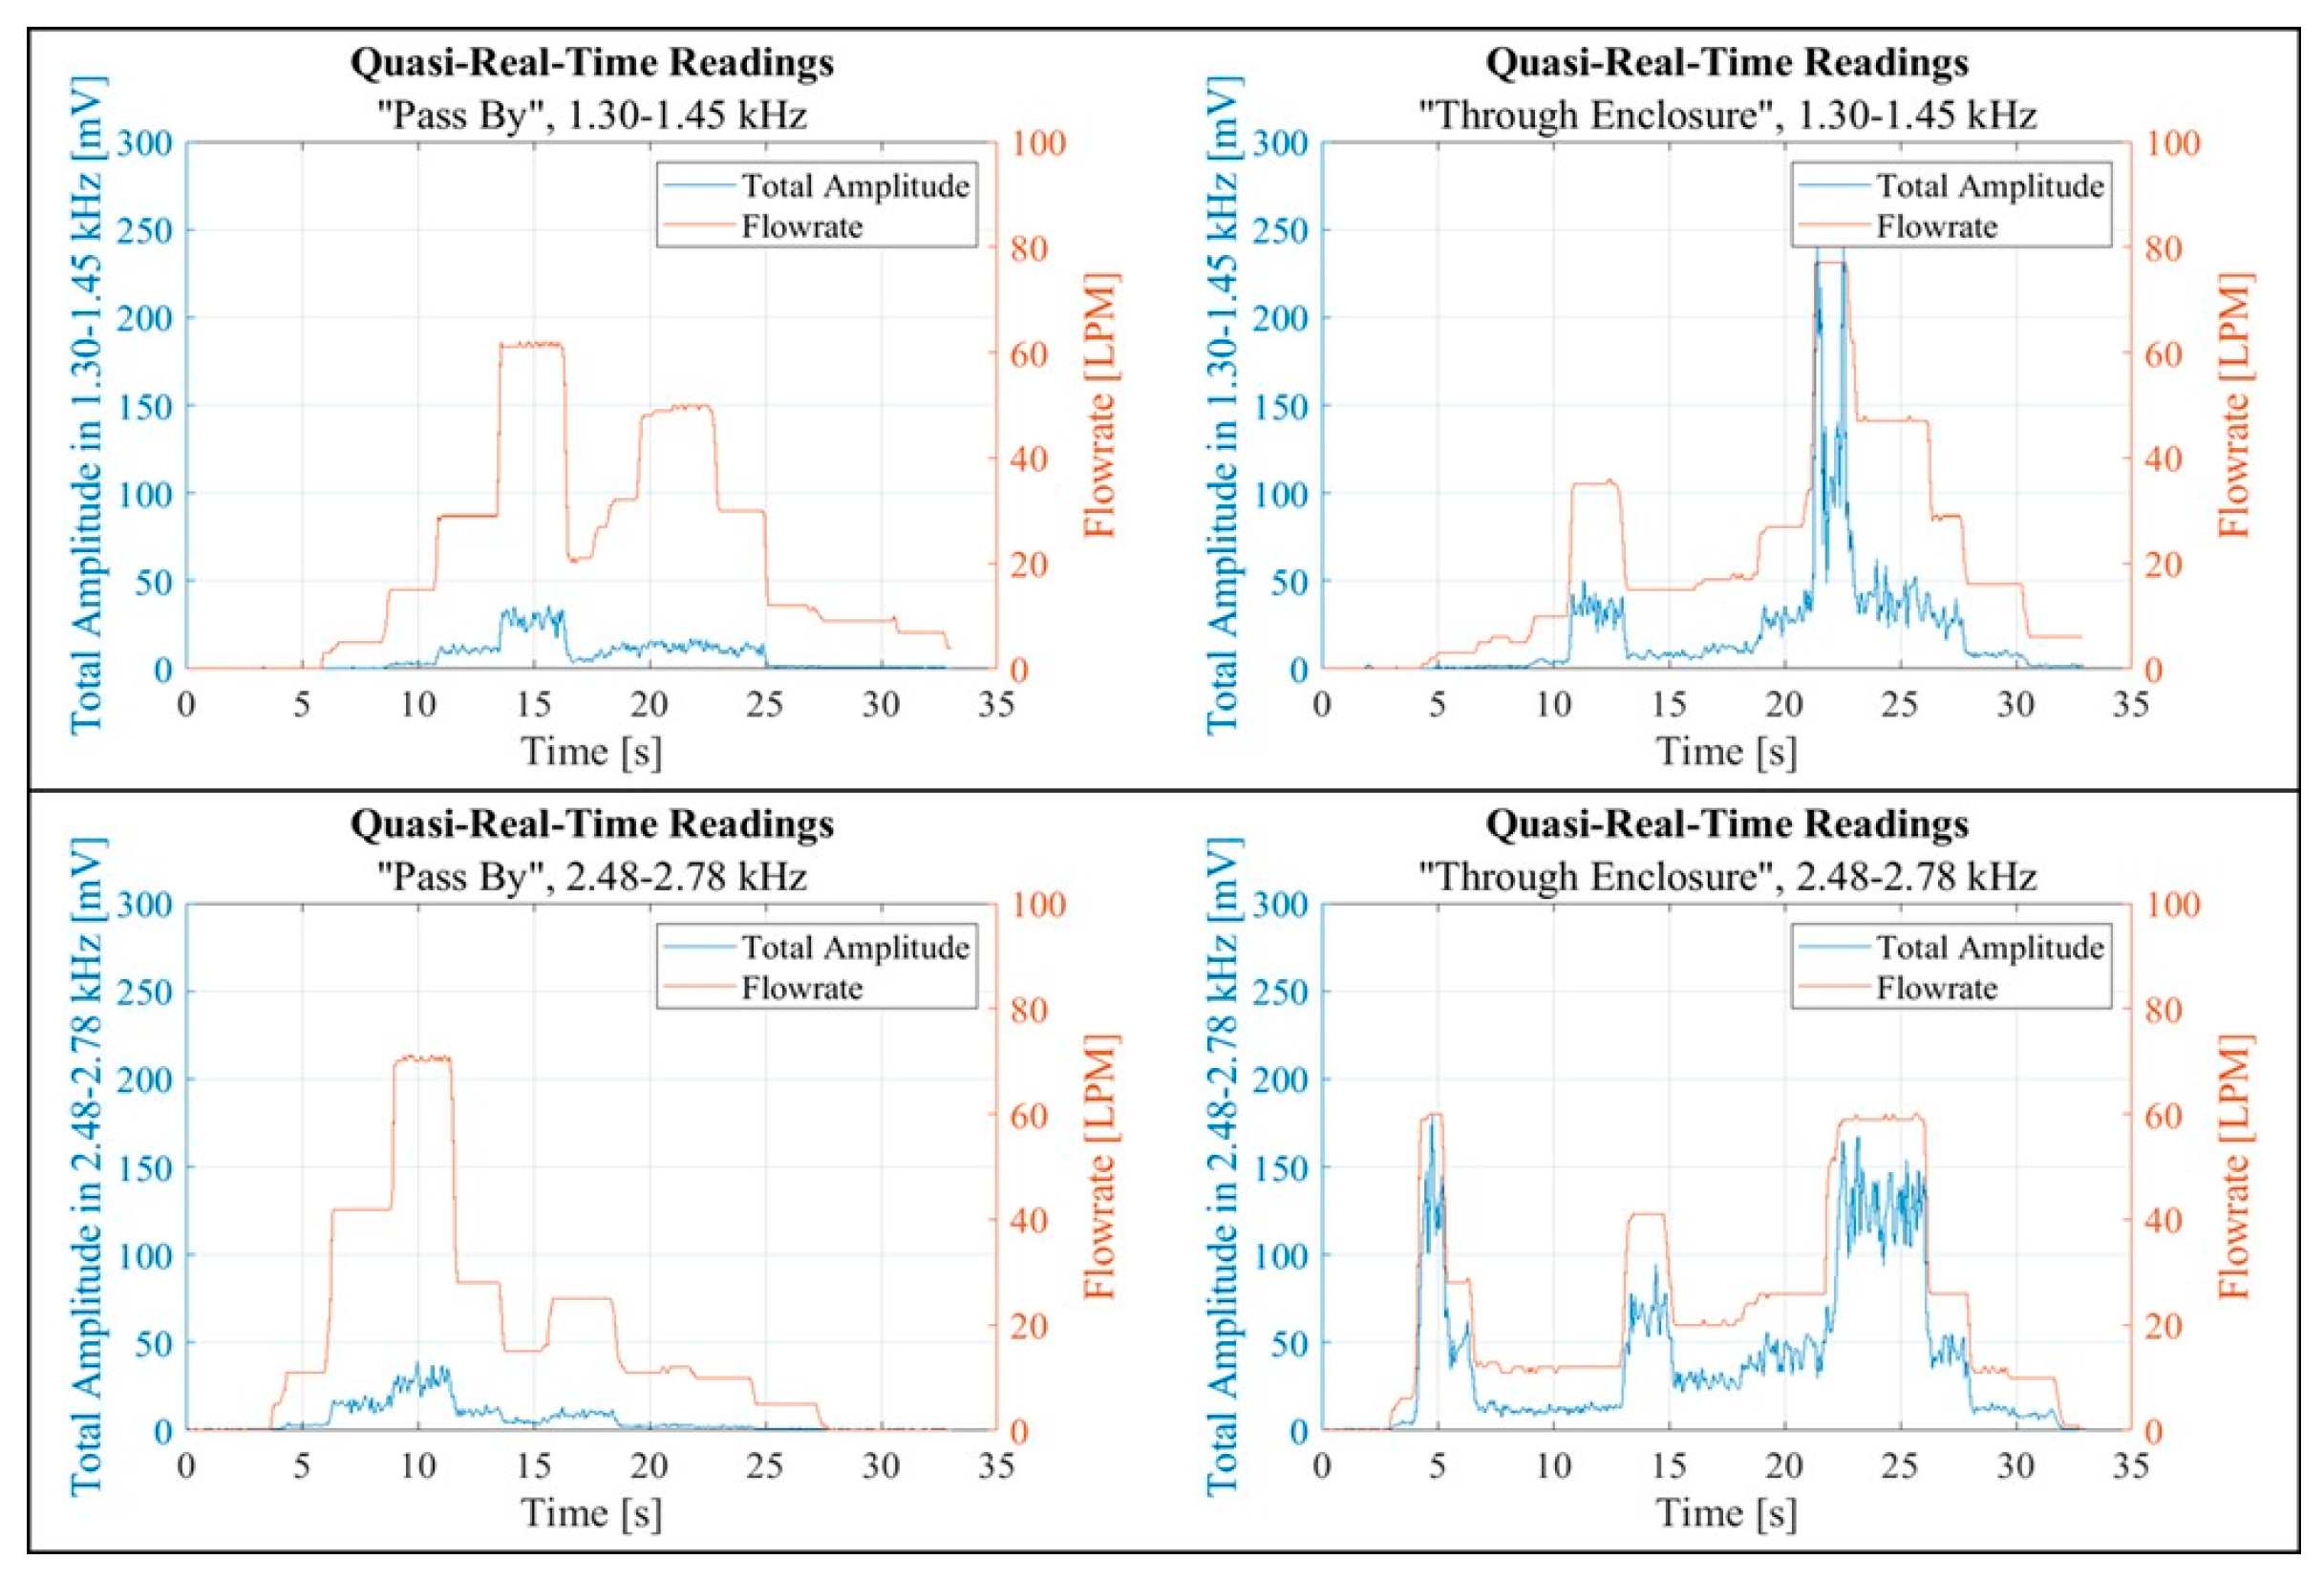
Figure 19.
Quasi-real-time readings in the 3.42 kHz - 3.66 kHz frequency band (top) and the 14.48 kHz - 14.64 kHz frequency band (bottom).
Figure 19.
Quasi-real-time readings in the 3.42 kHz - 3.66 kHz frequency band (top) and the 14.48 kHz - 14.64 kHz frequency band (bottom).
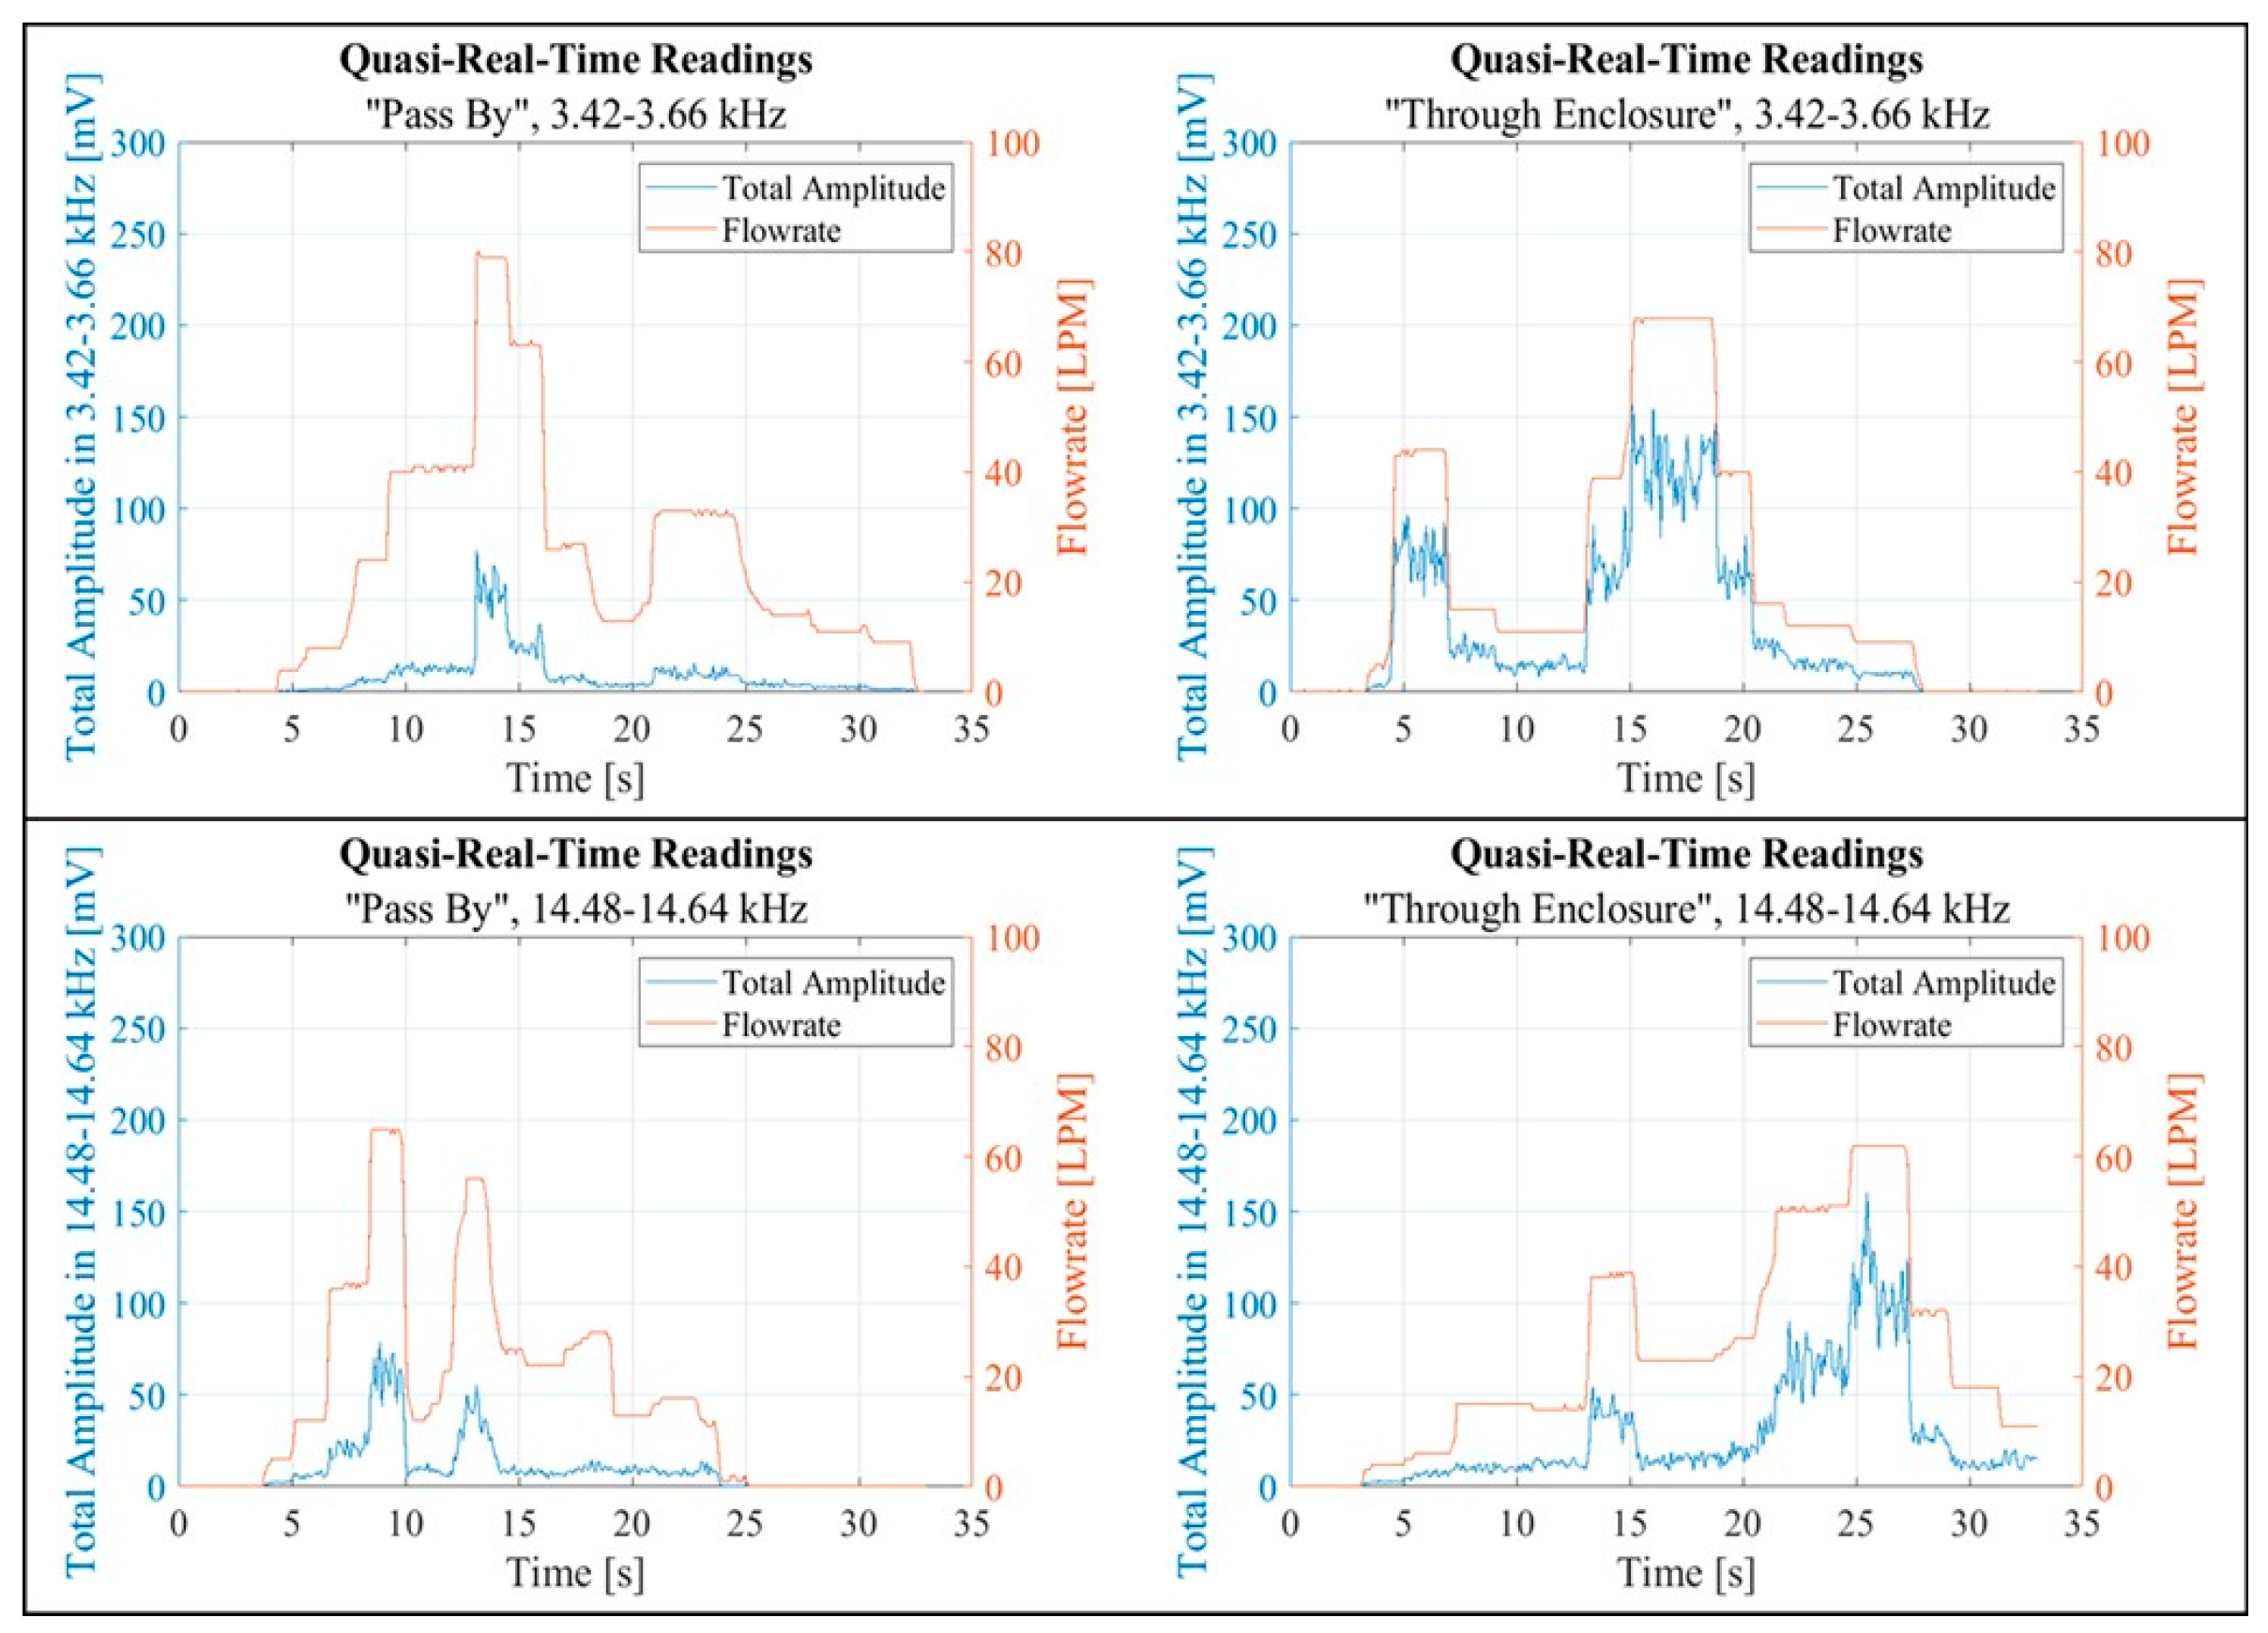

Table 1.
Airflow rate vs sensor output measurement.
| Output Voltage | Airflow Rate |
| [V] | [LPM] |
| 1.0 | 0 |
| 1.5 | 6 |
| 2.0 | 12 |
| 2.5 | 18 |
| 3.0 | 28 |
| 3.5 | 42 |
| 4.0 | 64 |
| 4.5 | 97 |
Table 2.
.
| Flow Rate | Flow Rate Model | R2 |
| [kHz] | [LPM] | |
| 1.30- 1.45 | Flowrate = 0.5009 Total Amplitude + 10.314 | 0.7108 |
| 2.48 - 2.78 | Flowrate = 0.4206 Total Amplitude + 6.3830 | 0.9228. |
| 3.42 - 3.66 | Flowrate = 0.5287 Total Amplitude + 2.6025 | 0.9605 |
| 14.48 - 14.64 | Flowrate = 0.5463 Total Amplitude + 9.3101 | 0.8392 |
Disclaimer/Publisher’s Note: The statements, opinions and data contained in all publications are solely those of the individual author(s) and contributor(s) and not of MDPI and/or the editor(s). MDPI and/or the editor(s) disclaim responsibility for any injury to people or property resulting from any ideas, methods, instructions or products referred to in the content. |
© 2025 by the authors. Licensee MDPI, Basel, Switzerland. This article is an open access article distributed under the terms and conditions of the Creative Commons Attribution (CC BY) license (http://creativecommons.org/licenses/by/4.0/).
Copyright: This open access article is published under a Creative Commons CC BY 4.0 license, which permit the free download, distribution, and reuse, provided that the author and preprint are cited in any reuse.


