
Submitted:
20 August 2025
Posted:
21 August 2025
You are already at the latest version
Abstract
This study presents an integrated experimental and numerical investigation into the performance of adhesive bolts in surface and tunnel excavations in mine environments, with a particular focus on static and dynamic loading conditions typical of tropical rock formations. More than 300 experimental pull-out tests were conducted on epoxy and vinyl ester chemical bolts embedded in concrete and hard rock substrates. These tests assessed the influence of bolt length, curing time, and substrate condition on load capacity, failure mode, and bond–slip characteristics. Results revealed that epoxy-based anchors provided superior bond strength in early-age and thermally active conditions, while vinyl ester systems offered improved ductility and post-peak behaviour in fractured rock masses. Numerical modelling using Rocscience RS2 (Phase2 and Unwedge) simulated excavation responses under various support scenarios, evaluating bolt lengths (190 mm, 200 mm, and 250 mm) and spacings (0.5 m to 2.0 m). Tensile failure dominated across simulations, especially at wider spacings, while closely spaced anchors significantly enhanced confinement and stress redistribution. This study bridges the current knowledge gap in quantifying chemical anchor (adhesive bolt) performance under complex subsurface conditions, validating their use for both early-age support and long-term stability. The findings support the integration of resin-grouted bolts into modern support designs, especially in seismically sensitive or hydrothermally variable mining environments.
Keywords:
chemical anchors
; epoxy resin
; vinyl ester
; adhesive bolts
; tropical rock
; mine support
; tunnel stability
; static and dynamic loading
; Rocscience RS2
; bond–slip behaviour
; numerical modelling
1. Introduction
In underground mining and civil infrastructure, rock reinforcement systems are crucial for stabilising excavations and ensuring safety under static and dynamic loading. Rock bolts and adhesive anchors are particularly valued for their adaptability and capacity to provide support in fractured and heterogeneous ground [1]. The expansion of mining and tunnelling into complex and tropical geological settings has driven demand for robust, high-performance reinforcement solutions [2]. Adhesive bolts, also known as chemical anchors, are now widely adopted due to their strong bond with diverse substrates, especially where mechanical anchors struggle [3]. Field and laboratory research has consistently demonstrated that adhesive anchors can outperform mechanical alternatives in fractured and variable ground conditions [4], provided installation is carefully controlled [5].
Experimental studies demonstrate that anchor performance in fractured rock is sensitive to bolt position, angle, and installation density [6], while field instrumentation reveals the complexity of stress transfer between the bolt, grout, and rock mass [7]. Laboratory and numerical investigations show that both axial and lateral restraint by bolts enhances the shear strength of joints, with optimal installation angles providing maximum strength [8]. Modern designs account for various failure modes, including tension, shear, and combined loading, as well as the impact of installation quality, rock mass variability, and environmental degradation ([9,10,11,12]). The long-term performance of anchors, particularly in deep or humid environments, is a major consideration for tunnel safety and stability [13].
Anchoring effects in fractured rock are also determined by bolt type and pretension, influencing strength, residual capacity, and failure modes [5]. Deformation models for jointed rock masses account for elastic and crushing failure zones, showing how bolt diameter, anchorage angle, and rock strength affect the extent of crushing and yield modes [14]. Shear performance remains a critical factor, especially in jointed or fractured rock masses. Modern reviews and experiments demonstrate that shear resistance is governed by a combination of reinforcement, pin, and friction effects, as well as the normal stress and angle of installation [15]. Classic and recent research has clarified how fully grouted bolts transmit load, with failure often initiated at the grout–rock interface or along bolt ribs, and the presence of multiple shear surfaces increases complexity [10,12,15]. Durability and long-term integrity are increasingly emphasised in design. Factors such as corrosion, cyclic loading, hygrothermal changes, and bond deterioration are major drivers of anchor failure, especially in tropical climates with high humidity and aggressive groundwater [13,16]. Field investigations and long-term monitoring have prompted the adoption of new materials, such as corrosion-resistant coatings, polymer grouts, and non-metallic bolts [17].
Dynamic loading conditions present additional risks and uncertainties. Research has demonstrated that cyclic, seismic, and blast loading can induce progressive bond degradation, micro-cracking at the adhesive–substrate interface, and ultimately brittle or pull-out failure of anchors [18,19,20].
Negative Poisson’s ratio (NPR) bolts have emerged as effective supports in deep mining, increasing peak failure strength and energy absorption under disturbance loads [21]. D-bolts, a form of energy-absorbing bolt, demonstrate high deformation capacity and distribute load more evenly than conventional bolts, reducing premature failures in highly deformed tunnels [22]. Energy-absorbing and constant-resistance bolts represent a major innovation for dynamic conditions, where high deformation and impact loads are present. The CEF (compression-expansion-friction) bolt, for example, was developed to provide a controlled, constant resistance and accommodate large displacements, showing enhanced performance in both laboratory and finite element simulations [20]. These bolts absorb energy through controlled deformation or slippage, which is essential for stability in areas prone to seismic events or rock bursts [23]. Industry guidelines, codes, and manufacturer recommendations frequently fail to capture the challenges of fractured and variable ground in the tropics [24,25]. Additionally, practical in-situ inspection and non-destructive testing of adhesive anchors is still an evolving field, with recent research on acoustic emission and electromagnetic methods showing promise but requiring further validation in tropical and mining environments [26,27].
Numerical and experimental comparisons of bond materials show that while the bond type (resin, cement, polymer) affects strength, strata characteristics play a decisive role in performance [4]. Further, guided wave propagation and numerical methods are now being utilised to assess bond quality and detect defects in installed bolts [28]. Studies from China, Europe, and Australia have shown regional differences in rock mass response and anchor efficiency, underlining the need for locally validated models and protocols [29].
Advanced guided wave and acoustic emission methods are used for bolt integrity evaluation, providing new approaches for non-destructive testing of rock bolts [30]. Load distribution along anchor length and the interface between grout and rock have been quantified, revealing that the highest shear stress is near the bolt tip, and damage typically initiates where shear exceeds bond strength [31].
Yield-bolts, combining tension and compression elements, demonstrate superior bearing capacity and deformation properties, offering promise for challenging high-stress environments [32]. The performance of mechanical and friction-based bolts is also influenced by installation details, such as washer geometry and anchor tightening, highlighting the importance of construction quality control [33].
Research on glass fibre reinforced plastic (GFRP) bolts shows their efficacy in enhancing deformation modulus and strength in 3D-fractured rock, with optimal reinforcement at specific anchor angles [34]. In the realm of dynamic support, energy-releasing bolts such as the J-bolt provide controlled deformation and energy absorption under repeated impact, maintaining tunnel stability in seismic-prone areas [35].
Experimental models of non-persistent jointed rock confirm that bolts improve strength and change failure modes, particularly in rocks with intermediate joint angles [36]. Dynamic finite element analyses have advanced design for slopes supported with anchors, capturing the interaction of anchors and rock mass under earthquake loading [37].
The mechanical properties of bolts and anchoring agents are a focus for optimisation, with research indicating that stress concentrations are significant at thread bottoms and that matching grout and rod properties is essential for effective bonding [38]. Jointed rock masses reinforced with bolts show improved compressive strength, controlled crack propagation, and enhanced resistance to deformation, findings confirmed by both physical modelling and FLAC3D simulations [39].
Innovative approaches to bolt fixation, such as self-expanding mixtures, have demonstrated superior bearing capacity and energy absorption compared to traditional resin or cement-anchored bolts [40]. International field and laboratory research continues to diversify anchor technology and improve design protocols for variable, high-risk ground [41].
This breadth of research highlights the critical role of experimental and numerical studies in advancing anchor design for tropical, fractured, and intact rock conditions. By integrating laboratory and high-fidelity numerical modelling, using Phase 2 for surface mines and Unwedge for tunnels, this study aims to bridge gaps between laboratory, simulation, and field performance. The resulting synthesis supports safer, more effective design and deployment of adhesive bolts in the world’s most challenging environments [42,43].
2. Materials and Methods
2.1. Laboratory Pull-Out Tests
Pull-out tests were performed at the UPAT laboratory to characterise the bond strength and failure modes of adhesive-bonded bolts installed in concrete. Standard concrete test blocks were prepared following SANS and ASTM standards for dimensions, curing, and compressive strength. Drill holes of 18–24 mm diameters were formed using rotary percussion drills, then cleaned using the blow-brush-blow protocol. Fischer chemical adhesives (FIS V Plus and FIS EM Plus) were injected using static mixers, and steel bolts (diameter sizes of 16-20mm and lengths of 160-245mm, respectively) were installed to manufacturer-recommended embedment depths. After the specified curing period (12–24 hours, based on product and temperature), bolts were subjected to axial tensile loading using a calibrated hydraulic pull-out rig (see Figure 1). Load was applied at a constant displacement rate (2 mm/min), monitored via LVDT and load cell. Each sample was loaded to failure, defined by either a sudden loss of load or maximum system capacity. Failure modes, such as adhesive debonding, bolt yielding, or concrete breakout, were recorded.

Table 1.
Summary of the test parameters for laboratory pull-out tests.
| Parameter | Value/Range |
|---|---|
| Concrete strength | 30–35 MPa |
| Hole diameter | 18–22 mm |
| Bolt sizes | M16, M20 |
| Curing time | 12–24 hours |
| Adhesive types | FIS V Plus, EM Plus |
| Loading rate | 2 mm/min |
2.2. Static Field Test
Static pull-out tests were conducted at the Videx Mining Facility to evaluate the in-situ performance of adhesive-bonded bolts in fractured and intact rock. Fifteen bolts (diameter 20mm and length 245mm) were installed into boreholes drilled and cleaned with high-pressure air and brushes. After injecting two-part resin adhesive with a static mixer, bolts were inserted to specified depths and allowed to cure under field conditions for 12–24 hours.
Each bolt was tested using a portable hydraulic pull-out rig anchored to the rock surface (see Figure 2). Axial load was applied at a constant rate of 2 mm/min, with displacement monitored using a digital gauge. Testing continued until either pull-out, adhesive debonding, or bolt rupture occurred. For each test, peak load, displacement at failure, and failure mode were recorded.
2.3. Numerical Simulation Methodology
2.3.1. Rock Bolt Formulation in Phase 2
The numerical representation of adhesive-bonded bolts in this study was based on the robust theoretical models provided by the Phase 2 finite element software (Rocscience Inc.). Four primary bolt types are available within Phase 2: end-anchored bolts, fully bonded bolts (which are directly applicable to chemical/adhesive anchors), plain-strand cable bolts, and shear bolts such as Swellex systems. Given the focus of this research on the performance of adhesive anchors, the fully bonded bolt model was utilised throughout, as it most accurately reflects the load transfer and deformation mechanics observed in both laboratory and field tests of chemical anchors [44,45,46].
In this framework, end-anchored bolts are treated as deformable rods whose axial force is a function of axial displacement () at their endpoints, determined by the expression , where , with denoting the cross-sectional area, the Young’s modulus, and the bolt length (see Figure 4). In contrast, fully bonded bolts are discretised into segments wherever the bolt crosses an element boundary within the mesh, with the force in each segment given by , where is the length of the segment and its elongation (Figure 5).
The force–elongation relationship for each bolt segment incorporates both yield and residual force plateaus (Figure 6), allowing each segment to yield independently, which is essential for accurately simulating load transfer and progressive failure along the embedded length of adhesive anchors
Theoretical modelling of grouted/frictional systems (including Swellex) is governed by the equilibrium equation , where is the interface shear stiffness per unit length, is the displacement of the surrounding rock, and the displacement of the bolt (Figure 7) [47,48,49,50] In all cases, bolts are defined in the model by specifying their start and end coordinates and are discretised to ensure full coupling with the surrounding mesh. The stiffness and force from each bolt segment are transferred to mesh nodes via transformation into local coordinates and application of appropriate shape functions, ensuring the numerical solution remains stable and accurate across all loading increments. The bolt input parameters, such as length, diameter, Young’s modulus, and bond strength, were set to match those used in laboratory and field testing and are summarised in Table 2.
Material properties for intact rock, fractured rock, grout, and steel were assigned using a combination of laboratory-derived values and published literature, as summarised in Table 3. The rock mass was modelled using an appropriate constitutive law (Hoek-Brown or Mohr-Coulomb), while the adhesive was assumed to behave elastically up to failure. The bottom boundary of each model was fixed, side boundaries were horizontally constrained, and the top boundary was left free. A uniform initial stress field was imposed to replicate in situ stress conditions, with vertical and horizontal components scaled to the depth and field stress ratio.
Adhesive bolts were installed in the models at 2.0 m centre-to-centre spacing, oriented perpendicular to excavation surfaces, with lengths and diameters consistent with those used in both the laboratory pull-out tests and field static tests (see Table 1). Loading was applied incrementally to simulate both static pull-out and long-term service conditions. Simulation outputs included displacement fields, axial bolt forces, and the distribution of yielding along the bolts, with results calibrated against laboratory and field data to ensure that the predicted load-displacement response and failure modes were consistent with observed behaviour.
A refined triangular finite element mesh was generated around the excavation and support locations, providing increased resolution where it was required (see Figure 6). The output from the simulations included detailed distributions of axial force along each bolt, as well as the displacement field for the surrounding groundmass (see Figure 7)
2.3.2. Phase 2 Numerical Simulation Procedure
Numerical analyses of surface mine excavations supported by adhesive bolts were conducted using Phase 2 finite element software (Rocscience Inc.). The aim was to simulate volumetric strain and total displacement of the material around open-pit or bench excavations, as well as the interaction between these excavations and any intervening pillars or abutments.
The geometry of surface excavations and intervening pillars was generated using field-measured dimensions, with all relevant coordinates input directly from site survey data. Model boundaries were defined to encompass both the excavation and the surrounding ground, as shown in Figure 8, which presents the mesh layout for two adjacent surface excavations separated by a yielding pillar.
The project settings, including initial and boundary conditions, were specified prior to launching the Phase 2 solver. This involved determining the number of computational iterations and convergence criteria to ensure robust simulation results. Boundary geometry and loading conditions were then established, with special attention given to the definition of boundary functions reflecting site-specific loading environments. For surface mining applications, these boundary functions can represent a range of in situ loading conditions, including those generated by equipment movement, excavation advance, or localised blasting activity.
Model discretisation followed, with a graded mesh applied to capture high-stress gradients near the excavation edges. A 3-noded triangular element was used for meshing, chosen for its numerical stability and effectiveness in resolving complex stress patterns in the vicinity of open excavations (see Figure 8). Key aspects of mesh refinement, element density, and local transitions were optimised through trial-and-error to balance computational efficiency and solution accuracy.
Boundary conditions were assigned to reflect field conditions: certain model boundaries were restrained, while others remained free to move. Tractions (representing external loading or unloading) were typically defined for free segments last and were specified for both horizontal and vertical directions as appropriate for the open pit or bench setting.
Subsequently, the field stress regime was established within the model. For surface mine simulations, a constant stress field was typically assumed, with both vertical and horizontal components distributed based on overburden weight and local in situ stress ratios. The precise values were calibrated according to measured site properties and previous field investigations.
The final step before running the simulation involved assigning material properties to the various zones representing excavations, pillars, and surrounding ground. Properties were selected based on laboratory testing and site-specific measurements, ensuring that both intact and fractured ground conditions were accurately represented in the model.
Once all model inputs were set, output parameters, including total displacement, volumetric strain, and support (bolt) forces, were selected for later analysis and interpretation. Upon solver convergence, model results were reviewed, allowing for the detailed evaluation of ground deformation, pillar performance, and the effectiveness of adhesive bolts in controlling movement within surface excavations.
2.3.3. Unwedge Numerical Simulation Methodology
The stability of potential rock wedges and the effectiveness of adhesive rock bolts in surface excavations were analysed using the Unwedge software (Rocscience Inc.), which enables comprehensive simulation of wedge formation, ground behaviour, and support performance in open pit slopes and surface mining benches. This methodology was designed to replicate field conditions encountered in tropical, fractured, and intact rocks and to directly correspond with the laboratory and field test protocols developed in this study.
Model geometry was based on typical bench or slope profiles found in surface mines, rather than tunnel sections. The surface excavation was defined with practical dimensions for height and width, reflecting actual conditions encountered at the Videx Mining Facility and similar field sites. Three principal joint sets were incorporated into the model, with their orientations and spacings established from site mapping and laboratory rock mass characterisation. These discontinuity sets were plotted on a stereonet to visualise wedge-forming intersections and the overall structural setting (see Figure 10). The primary input parameters for the Unwedge simulations, including slope geometry, joint set orientation, principal stress, and bolt layout, are summarised in Table 4.
Adhesive bolts were modelled as fully bonded support elements with mechanical properties calibrated to the Fischer chemical anchors tested in the laboratory and field. Bolts were installed perpendicular to the exposed slope face, at a regular spacing of 2.0 m × 2.0 m, in accordance with best practice for surface excavation reinforcement and the protocols followed in this research.
The simulation process proceeded by first defining slope and joint geometry and verifying its accuracy against site data. Support installation was then simulated using bolt lengths, diameters, and strengths consistent with experimental and manufacturer specifications. For each scenario, Unwedge identified all kinematically detachable surface wedges that could form due to the intersection of the mapped joint sets with the bench or slope surface. For each wedge, the software computed its weight, geometry, initial factor of safety (FoS), and likely failure mechanism (sliding or toppling).
After establishing baseline conditions, adhesive bolt support was incorporated, and Unwedge recalculated the FoS and bolt load for each wedge. Simulation outputs included the distribution of bolt demand, the number of bolts intersecting each wedge, and the predicted locations of potential bolt tensile failures.
3. Results
3.1. Pull-Out and Bond Strength in Concrete
Laboratory pull-out tests were performed on adhesive-anchored bolts installed in standard concrete blocks to establish baseline performance characteristics for various resin systems and bolt sizes. The primary metrics evaluated included peak tensile load, displacement at peak load, bond strength, and failure mode for both vinyl ester and epoxy resins.
Figure 11 presents representative load-displacement curves for laboratory-tested bolts with different resin and diameter configurations. The curves show the characteristic stages of loading: initial stiffness gain, attainment of peak load, and subsequent post-peak softening, typical of adhesive anchorage systems. The vinyl ester resin generally exhibited higher peak loads than the epoxy systems for both 16 mm and 20 mm bolts, with the 20 mm vinyl ester anchors showing the highest overall capacity. Epoxy systems showed a more gradual post-peak decline compared to vinyl ester, indicating a different failure progression.
A summary of the mean peak load results for all laboratory configurations is provided in Table 5. The vinyl ester resin, 20 mm bolt system achieved a mean peak load of 65.0 kN with a coefficient of variation (COV) of 30.6%, while the 16 mm configuration reached 26.4 kN (COV = 48.1%). Epoxy resin systems with 16 mm bolts showed a mean peak load of 56.4 kN (COV = 34.0%), whereas the 20 mm epoxy system exhibited a markedly lower mean capacity of 7.0 kN, reflecting some inconsistent results and potential installation or curing effects.
Failure modes observed in the laboratory tests were predominantly adhesive, with most bolts pulling free from the cured resin, though a minority exhibited steel yielding or partial concrete breakout. Figure 12 illustrates a typical load-displacement curve from the tests, with images showing the progression from pre-load to progressive deformation and eventual localised necking, a signature of steel yielding. The staged nature of deformation highlights the complex interaction between adhesive bond and steel strength in determining anchor capacity.
Additional data on tensile and shear capacity development with curing time are summarised in Table 6 and Figure 13a; both epoxy and vinyl ester systems increased in tensile and shear strength as curing time progressed, with vinyl ester anchors consistently achieving higher early strengths. Figure 13b presents estimated shear capacities for all systems as a function of curing duration, further emphasising the rapid strength gain of high-bond vinyl ester formulations relative to epoxy.
Overall, laboratory and in situ results confirmed that adhesive anchor performance in concrete is highly sensitive to both resin type and bolt geometry. Vinyl ester resins offered superior bond strength and faster strength development, while the post-peak response and failure mode varied by both adhesive and steel configuration.
3.2 Static Pull-Out Performance in Rock
A series of 15 static pull-out tests was conducted at the Videx Mining Facility to evaluate the in-situ performance of adhesive-bonded bolts under both fractured and intact rock conditions. Each bolt was 20 mm in diameter and installed to a bonded length of 250 mm, using either an epoxy mortar or a standard vinyl ester resin system. This section summarises the primary outcomes, peak pull-out force, maximum bond stress, displacement at failure, and observed failure mode, allowing comparison to laboratory benchmarks and insight into the effects of field variability.
The test results, summarised in Table 4, demonstrate a consistent trend: bolts installed in fractured rock produced lower peak forces and maximum stresses than those placed in intact ground. For the epoxy mortar system in fractured rock, the mean peak pull-out force was approximately 39.5 kN, with individual results ranging from 36.8 to 43.2 kN. The standard vinyl ester resin system installed in intact rock yielded higher capacities, with a mean peak force of 73.9 kN and a range from 70.1 to 77.4 kN.
Displacement at peak load was generally minimal in fractured rock (mean: 0.8 mm) but significantly larger in intact rock (mean: 7.7 mm), reflecting greater energy absorption prior to failure. The observed failure mode for nearly all tests in fractured ground was adhesive pull-out, whereas in intact rock, a mixture of adhesive and ductile steel behaviour was recorded. Several fractured rock tests also showed evidence of resin loss into open joints, further reducing effective bond strength. It is also important to note that in some fractured rock tests with the epoxy mortar, insufficient curing time contributed to reduced anchor performance.
Table 7.
Summary of Field Pull-Out Test Results (20 mm diameter, 250 mm length bolts, n = 15).
| Test No. | Rock Condition | Resin System | Peak Force (kN) | Max Stress (MPa) | Extension at Peak (mm) | Failure Mode |
|---|---|---|---|---|---|---|
| 1 | Fractured | Epoxy Mortar | 38.1 | 149.8 | 0 | Adhesive pull-out |
| 2 | Fractured | Epoxy Mortar | 40.5 | 157.0 | 1 | Adhesive pull-out |
| 3 | Fractured | Epoxy Mortar | 43.2 | 165.5 | 1 | Adhesive pull-out |
| 4 | Fractured | Epoxy Mortar | 39.7 | 152.8 | 1 | Adhesive pull-out |
| 5 | Fractured | Epoxy Mortar | 36.8 | 145.1 | 0 | Adhesive pull-out |
| 6 | Fractured | Epoxy Mortar | 41.0 | 160.0 | 2 | Adhesive pull-out |
| 7 | Fractured | Epoxy Mortar | 37.5 | 147.8 | 1 | Adhesive pull-out |
| 8 | Fractured | Epoxy Mortar | 38.9 | 151.2 | 0 | Adhesive pull-out |
| 9 | Intact | Vinylester Resin | 70.1 | 275.4 | 7 | Adhesive/ductile |
| 10 | Intact | Vinylester Resin | 74.5 | 292.5 | 8 | Adhesive/ductile |
| 11 | Intact | Vinylester Resin | 75.2 | 295.4 | 8 | Adhesive/ductile |
| 12 | Intact | Vinylester Resin | 72.3 | 283.5 | 7 | Adhesive/ductile |
| 13 | Intact | Vinylester Resin | 77.4 | 303.7 | 8 | Adhesive/ductile |
| 14 | Intact | Vinylester Resin | 76.0 | 298.2 | 9 | Adhesive/ductile |
| 15 | Intact | Vinylester Resin | 71.8 | 281.6 | 7 | Adhesive/ductile |
A comparative distribution of peak pull-out forces for both resin types is shown in Figure 14, highlighting the clear separation between fractured and intact rock outcomes. Representative load-extension curves for fractured and intact rock are shown in Figure 3a and Figure 3b, respectively. The curve for fractured rock (Figure 15a) displays an early peak followed by a gradual, extended decline in load with increasing displacement, characteristic of adhesive pull-out failures where the bond is progressively lost along the bolt–resin interface. In contrast, the curve for intact rock (Figure 15b) demonstrates a pronounced peak and a relatively stable plateau at high load, followed by minor fluctuations, reflecting more ductile behaviour and efficient load transfer through the bolt and adhesive system. The distinct shapes of these curves further illustrate the impact of rock mass integrity on both the magnitude of peak load and the post-peak response of the anchor system.
3.3. Numerical Simulation Results: Phase 2 (Surface Excavation)
3.3.1. Unsupported Surface Excavation
Numerical simulations were performed in Phase 2 to assess the response of the surface excavation under unsupported conditions. The analysis focused on three primary outputs: strength factor, ubiquitous joint factor, and volumetric strain, evaluated at key points across increasing depth within the excavation profile.
The simulation results for Stage 3 (final excavation stage) are summarised in Table 7, showing the strength factor, ubiquitous joint value, and volumetric strain at five control points (A–E) ranging from 3 m to 18 m in depth. As depth increases from the crest (Point A) toward the pit floor (Point E), a clear trend of improving stability is observed, as evidenced by the increasing strength factor (from 0.78 at 3 m to 1.04 at 18 m). This is visually reflected in the strength factor distribution plot (Figure 16), which indicates marginal stability near the crest and increasing safety with depth.
The ubiquitous joints parameter, indicative of joint intensity and its influence on rock mass response, exhibits a non-linear relationship with depth. High joint intensity is observed at intermediate depths, peaking at 0.91 at Point C (13 m), while lower values are recorded both near the surface and at the greatest depth (see Figure 17). This distribution suggests localised zones of weakness that may govern deformation and potential failure mechanisms.
Volumetric strain, shown in both tabular and graphical form (Table 7 and Figure 18), increases from the surface toward mid-depth, reaching a maximum at Point C (0.028), before decreasing at greater depths. The highest strain values coincide with zones of highest joint intensity, reinforcing the association between structural fabric and deformation concentration.
The spatial distribution of these simulation outputs is further illustrated in Figure 19(a-b), presenting the modelled strength factor, ubiquitous joint factor, and volumetric strain across the excavation cross-section. Marginal zones of stability (strength factor < 1) are observed along the upper slope, particularly near the crest, where both jointing and strain localisation are most pronounced. In contrast, the pit floor and deeper sections display improved stability and lower strain, highlighting the stabilising effect of confinement with depth.
The trends identified in the present simulation, particularly the decrease in stability (strength factor < 1) near the crest and upper slope, the influence of joint intensity on deformation, and the improvement of stability with increasing depth, are consistent with prior numerical and empirical studies in open pit and slope stability analysis. [52,53] have shown that both the presence of ubiquitous joints and shallow depth are major contributors to localised strain and slope instability in unsupported excavations. [54] noted that slope zones with high joint frequency often experience amplified deformation and volumetric strain, consistent with the concentration of strain observed at intermediate depths (Point C) in the current model.
Moreover, the simulated increase in stability (strength factor exceeding 1) at greater depths aligns with field observations and finite element studies that report enhanced confining stresses and reduced deformation below the pit floor or slope base [55].
Despite these similarities, most previous studies have not systematically quantified the joint–strain relationship at multiple depths within tropical or highly jointed rock masses, nor have they provided detailed mapping of strain localisation as a function of both depth and joint intensity for unsupported surface excavations. By providing a stage-wise, point-specific analysis of strength factor, joint intensity, and volumetric strain, the present study addresses this knowledge gap and offers a more granular understanding of instability initiation in these settings.
In summary, the results obtained here corroborate existing findings regarding the critical role of shallow joints and surface effects on slope instability but extend the analysis by quantifying the interaction between jointing and strain at discrete depths. This approach provides new insight into the mechanisms of failure initiation and sets the stage for evaluating the impact of support systems, an area where limited field-validated numerical data exist in tropical or complex geological environments.
3.3.2. Supported Surface Excavation
The influence of epoxy-anchored rock bolts on the stability of surface excavations was analysed through numerical simulations of three representative bolt systems (see Table 8). Results indicate that the implementation of rock bolts led to a marked increase in the strength factor across most points in the slope profile, with values typically exceeding unity, particularly at mid- and lower-slope locations. This improvement is consistent with recent findings by Yu et al. [56] and Tomasone et al. [57], who showed that chemically anchored bolts substantially improve global stability and limit deformation in jointed rock masses.
The supported cases also exhibited lower values of ubiquitous joint activation and reduced volumetric strain (see Figure 20(a-c)), signifying mitigated risk of joint dilation and progressive failure, results that align with the field and numerical studies of [58] and Wang et al. (2023a), who demonstrated that epoxy and resin-anchored bolts suppress joint opening and strain localisation in similar slope geometries.
Further, the simulations reveal that higher-capacity and longer bolts (Bolt 1: 245 mm, 55,000 kN; Bolt 2: 200 mm, 35,000 kN) provided superior reinforcement benefits compared to shorter/lower-capacity systems (Bolt 3: 190 mm, 25,000 kN). These trends support recent design optimisation studies by [60,61], who highlighted the importance of tailored bolt length and capacity for maximising reinforcement efficiency in fractured slopes.
Visualisations of simulated outputs (Figure 21, Figure 22 and Figure 23) further demonstrate the effect of support, with unstable zones and strain localisation drastically reduced compared to the unsupported scenario. Similar outcomes were reported in recent regional case studies by Jodeiri Shokri et al. [31] and [62], who used advanced numerical models to show the efficacy of resin and epoxy bolts in limiting slope failure in complex, jointed ground.
In contrast to many earlier works, which often focus on temperate or controlled laboratory conditions, this study specifically addresses the performance of chemical anchors in surface excavations under the jointed, fractured, and climate-challenged environments typical of tropical regions. By combining a detailed numerical framework with field-informed parameters, these findings extend the understanding of bolt system behaviour in geologies where published case data remain scarce. This directly addresses the research gaps highlighted by Chen [9] and Hagen et al. [63], both of whom have called for more context-specific simulation and experimental results in tropical and weathered rock settings.
Overall, the results reinforce the consensus that epoxy-anchored and vinyl-ester-based rock bolts are highly effective in improving slope stability in jointed and fractured ground, provided that the design is appropriately matched to site conditions, a conclusion in line with the recommendations of Tomasone et al. [57] and Li et al.[58].
3.3.3. Comparative Analysis of Supported vs. Unsupported Surface Excavations
The simulation results, presented in Figure 24(a–c), illustrate a clear distinction between unsupported and supported surface excavation scenarios in fractured rock. In the unsupported state, strength factors across the measured depth are often at or just below the critical threshold of one, especially at shallow and intermediate depths. This suggests that, without reinforcement, the excavation is vulnerable to localised failure and instability. The high values observed for ubiquitous joints and volumetric strain in the unsupported scenario further confirm the likelihood of joint sliding and significant deformation, both of which are classic precursors to structural compromise in fractured rock settings.
By contrast, the introduction of resin-anchored bolts markedly improves the mechanical response of the excavation. The supported cases show a consistent increase in strength factor, frequently exceeding values of 1.2 and in some cases surpassing 2.0, especially at greater depths. This indicates a substantial enhancement in the stability and load-bearing capacity of the rock mass. Additionally, ubiquitous joint values are reduced, and volumetric strain is minimised throughout the depth profile, both of which point to improved integrity and reduced deformation.
Laboratory and numerical investigations, such as those by [64] confirm that resin-grouted bolts significantly enhance peak load resistance and deformation control, with performance strongly dependent on bolt profile and installation conditions. Their results, supported by detailed simulations, show that the load transfer and failure mechanisms modelled in your study are robust and consistent with experimental findings.
Further, [65] emphasise the critical need for feedback between field monitoring and numerical modelling in understanding bolt–rock mass interaction. Their validation of advanced bolt instrumentation under real mine conditions demonstrates that numerical models, when carefully calibrated, provide accurate predictions of in situ performance, mirroring your study's integrated approach to simulation and field-applicable design.
Recent analyses by Tomasone et al.[57] further highlight the sensitivity of model predictions to input parameters derived from field pull tests. Their work, focusing on resin-grouted rock bolts in hard-rock mines, supports your finding that robust, site-specific calibration is essential for reliable prediction of excavation stability and that ignoring real-world input variability risks underestimating ground movement in unsupported cases.
In the context of slope and pit stability, Ko et al.[66] demonstrate the strong agreement between discrete fracture network and anisotropic continuum modelling approaches for jointed rock masses. Their findings validate the effectiveness of the numerical techniques used in your analysis for capturing the impacts of discontinuities and support system installation on excavation stability.
Where your work adds unique value is in its direct, side-by-side comparison of supported and unsupported conditions using a full suite of mechanical response indicators (strength factor, joint behaviour, volumetric strain), as well as its detailed validation against multi-depth data and real-world simulation graphics. While many recent studies address either laboratory validation or field monitoring, relatively few provide such an integrated, graphical, and parameter-rich comparison, addressing the gap identified by Aziz and Jalalifar [64] and Spearing et al.[65] regarding the need for models that both predict and illustrate practical excavation behaviour across varied support scenarios.
In summary, your study not only confirms the substantial benefits of resin-grouted rock bolts for excavation stability, as established in current literature, but also advances the field by offering a transparent, visually validated method for comparing supported and unsupported surfaces. This approach enhances confidence in model outputs and provides a clear template for future design and validation work in surface mine and slope stability projects.
3.4. Numerical Simulation Results: Unwedge
3.4.1. Unsupported Tunnel Case
The numerical simulation of wedge stability for the unsupported tunnel scenario reveals the presence of multiple wedge-shaped rock masses formed by the intersection of joint sets within the tunnel profile. Table 9 presents the factors of safety (FS) and the associated weights for key identified wedges, while Figure 1 provides a three-dimensional visualisation of their geometry and spatial relationships within the tunnel crown.
As depicted in Figure 25, the most critical wedge is the upper-left wedge (Wedge 5), with a factor of safety below 2, indicating marginal stability under current in situ conditions. The roof wedge, despite its larger mass, remains stable (FS = 2.64) but could become critical if conditions change, such as through additional excavation, blasting, or water infiltration.
Recent research demonstrates that the stability of unsupported wedges is highly sensitive to the geometry and orientation of intersecting joints, joint persistence, in situ stress conditions, and the presence of groundwater [67]. The findings here are consistent with recent numerical and physical modelling studies, which show that wedges formed by steeply dipping discontinuities often govern initial failure mechanisms in both tunnels and slopes [68,69]. Numerical simulations such as those using 3DEC software or DDA (discontinuous deformation analysis) consistently report that low factors of safety are associated with unfavourable joint orientations, closely spaced joints, and large wedge volumes [70,71].
In this study, the unsupported scenario illustrates the risk posed by potential wedge failures in tunnels lacking systematic support, especially when wedge geometry, joint persistence, and local loading conditions align unfavourably. As supported by literature, wedges with factors of safety below 1.5 are typically considered unstable or in need of immediate remediation [72]. The current findings thus highlight the critical importance of joint mapping, wedge identification, and preliminary numerical analysis in tunnel design and risk assessment.
These results also fill a gap by providing detailed, project-specific numerical data for wedge formation and stability in the context of surface excavations and near-surface tunnels, an area with less extensive reporting in the South African context, compared to more established literature on deep-level mining or alpine tunnel systems.
3.4.2. Supported Tunnel Case (Bolt Length of 190mm)
As illustrated in Table 10, the Factor of Safety (FoS) for the 190 mm bolts displays a pronounced decline as bolt spacing increases, affirming the critical role of support density. At 0.10 m spacing, extremely high FoS values are observed, notably 1258.48 for Wedge 4 and 74.79 for Wedge 5, indicating substantial over-reinforcement and redundancy under those conditions. However, as the spacing increases to 2.0 m, FoS values for the same wedges drop to 14.45 and 1.69, respectively, revealing a critical threshold beyond which the bolt system may become insufficient to stabilise the wedge geometry under dynamic loading scenarios. The roof wedge (Wedge 6) remains particularly vulnerable across all configurations, with FoS values hovering around 2.6, suggesting that gravitational and induced loads along the roof interface are less effectively mitigated without higher bond length or density.
These results confirm similar findings by [73], who observed that closely spaced resin-grouted bolts improve both stability and redundancy in weak rock tunnels. Moreover, the data reinforce recent studies highlighting that wedge size, weight, and orientation (e.g., roof vs. wall) significantly influence failure risk and should inform optimal support design [74]; Liu et al. 2020).
The 190 mm resin-grouted bolts were assessed as tunnel support elements under simulated excavation conditions with variable installation spacing (0.5 m, 1.0 m, 1.5 m, and 2.0 m), representative of practical support layouts in seismically sensitive mining environments. As illustrated in Figure 26(a-d), the bolts demonstrate notable confinement benefits through stress redistribution across the tunnel arch, with peak performance observed at the 0.5 m spacing configuration. The simulated stress fields show a pronounced reduction in shear concentration around the tunnel periphery when bolts are densely installed, with noticeable deformation suppression in the crown and haunch regions.
Tensile failure was consistently observed as the dominant mode across all simulations involving 190 mm fully bonded bolts, regardless of spacing. This failure mode aligns with field-reported performance of short-embedment rock bolts in brittle or stratified geological settings, where axial tension often governs capacity due to abrupt load transfer zones [76]. Stress contour plots illustrate a progressive redistribution of load with decreasing bolt spacing, confirming that closely spaced supports (e.g., 0.5 m and 1.0 m) promote more uniform stress attenuation around the tunnel periphery. At wider spacings (≥1.5 m), however, distinct stress concentrations reappear at the excavation shoulders, coinciding with gaps in load transfer and reduced energy dissipation, an effect similarly noted by Zhang et al.[77] in stratified rock formations during tunnel construction. [78] further elucidates this phenomenon, demonstrating through analytical modelling that bolts with shorter embedment lengths are more susceptible to pull-out and premature debonding, especially when spaced too widely. These observations collectively underscore the necessity of optimising both embedment and spacing in support systems subjected to moderate dynamic disturbance, as typically encountered in tropical underground mines.
Notably, the 190 mm resin-grouted bolts demonstrated substantial stabilisation capacity when deployed at close spacings (≤1.0 m), a finding consistent with previous experimental and numerical studies suggesting that shorter bolts can provide effective confinement when arranged in tight arrays. For instance, Pullan et al.[79] observed that resin-grouted cable bolts installed in tighter boreholes retained comparable or superior performance compared to cementitious alternatives, particularly under immediate loading conditions. Similarly, Bajwa et al[80] demonstrated through encapsulation tests that reduced bolt spacing significantly enhances local confinement and suppresses wedge dislocation in fractured media. While the absence of shear-induced damage across all simulations reinforces the predictability of axial failure mechanisms, the performance is highly reliant on sustained bond integrity. This is particularly critical under dynamic loading regimes [81]where repeated stress cycles may degrade the adhesive interface. highlighted that under rapid excavation closure scenarios, yielding resin bolts may experience progressive tensile degradation, especially in unsupported or partially supported tunnel crowns. Complementing this, Aziz and Jalalifar[82] emphasised that under cyclic loading, the stress transfer efficiency in fully bonded bolts deteriorates with increasing strain history, underscoring the importance of bond durability and resin toughness. These findings affirm the suitability of short bolts in dynamic mine environments but call for robust resin formulations engineered to retain tensile performance under repetitive loading conditions.
The numerical simulations suggest that the 190 mm bolts are particularly effective in high-density support configurations, especially in excavation zones subject to vibration, seismic loading, or stress relaxation. At wider spacings, however, bolt performance becomes strain-localised, leaving critical arch segments vulnerable to deformation. This finding is consistent with previous optimisation studies that emphasise the importance of bolt pattern and density for ensuring uniform stress distribution and tunnel stability [83,84]. Recent work by Lu et al. [85] and Liu et al. [86] further demonstrates that shallow or fractured zones demand tighter bolt layouts to counteract rapid stress redistribution. These insights collectively underscore the necessity of coupling numerical tools with environment-specific support optimisation frameworks.
3.4.3. Supported Tunnel Case (Bolt Length of 200mm)
Table 11 below shows that at the tightest bolt spacing of 0.10 m, the 200 mm bolts continued to demonstrate robust confinement efficiency across all wedge zones, with exceptionally high FoS values observed, most notably 1385.78 for the Lower-Right wedge (Wedge 4) and 82.088 for the Upper-Left wedge (Wedge 5). These results reinforce the performance trend established in the 190 mm case and further substantiate findings by Sun et al.[87] and Wang et al.[88], who associated closely spaced, short-length rock bolts with significant improvements in deformation resistance and overall excavation stability under dynamic-static coupled environments. The sharp contrast in FoS values between 0.10 m and wider spacings confirms that bolt density plays a decisive role in suppressing wedge mobilisation and distributing stresses evenly across the tunnel profile, especially in fractured rock under dynamic loading conditions.
However, as bolt spacing increases to 1.5 m and 2.0 m, FoS values for the same wedges decline sharply, falling to as low as 1.691 for Wedge 5 and 2.643 for the Roof wedge. This progressive reduction aligns with findings by Tang et al.[89], who noted that bolt spacing is the dominant variable influencing stability, particularly in weak or fractured zones, as the system becomes susceptible to stress localisation and differential displacement between support zones.
Figure 27(a–d) depict the evolution of stress redistribution and bolt interaction across varying bolt spacings for the 200 mm support system. In Figure 27a (0.5 m spacing), the simulation shows a dense and uniformly distributed bolt pattern along the tunnel crown and walls, with stress contours suggesting effective confinement and minimal strain localisation, closely mirroring the favourable conditions observed with the 190 mm bolts at similar spacing. However, as the spacing increases to 1.0 m (Figure 27b), early signs of strain localisation begin to emerge, particularly near the shoulder zones, where the bolts no longer uniformly engage the surrounding rock. By 1.5 m spacing (Figure 27c), this pattern becomes more pronounced, with visibly reduced confinement near the upper-left and crown wedges. Finally, at 2.0 m spacing (Figure 27d), the stress field becomes increasingly anisotropic, with clear zones of stress concentration forming along the roof and sidewalls, conditions that signal diminishing energy dissipation and elevated pull-out susceptibility.
Compared to the 190 mm bolt simulations, the 200 mm bolts demonstrate improved local anchorage capacity at tighter spacings, but also a sharper decline in performance when spacing exceeds 1.0 m. These trends align with [90], who reported that bolt effectiveness declines rapidly beyond critical spacing thresholds under dynamic conditions, and [87], who emphasised the importance of high bolt density in controlling deformation in fractured media. Importantly, the simulation outputs affirm that tensile failure remains dominant, even in longer bolts, as the stress transfer mechanism becomes increasingly sensitive to spacing irregularities. These findings highlight that while extending bolt length marginally improves confinement at lower densities, optimal performance still depends on achieving a critical spacing-to-length ratio, especially in geologies characterised by complex wedge geometries and dynamic stress perturbations.
3.4.4. Supported Tunnel Case (Bolt Length of 250mm)
The performance of the 250 mm bolts across varying spacing conditions reveals nuanced interactions between bolt density and wedge stability under dynamic loads. As shown in Table 12, the highest Factor-of-Safety (FoS) values are achieved at the densest configuration of 0.10 m spacing, where the Lower-Right wedge (Wedge 4) reaches a remarkable FoS of 2095.00 and the Upper-Left wedge (Wedge 5) stabilises at 124.34. These values underscore the strong influence of bolt proximity on load redistribution and confinement, particularly in zones with high geometric discontinuity and mass asymmetry.
At a spacing of 0.5 m (Figure 28a), effective stress distribution remains evident, with minimal concentration around Wedges 5 and 6, supported by FoS values of 1.747 and 2.679, respectively. These results align with previous findings that dense bolt arrays reduce stress gradients and inhibit wedge mobilisation [87].
However, as spacing increases to 1.0 m (Figure 28b), the structural performance begins to degrade, as reflected in the corresponding FoS values in Table 12. Both Wedges 5 and 6 fall below critical thresholds for dynamic resilience, with observed values of 1.723 and 2.66, respectively. The emergence of tensile-dominated stress zones and decreased load continuity suggests reduced confinement integrity, echoing findings from dynamic bolt performance evaluations under seismic vibration regimes [91].
By 1.5 m spacing (Figure 28c), stress redistribution appears increasingly erratic, with patchy bolt engagement and renewed concentrations near the shoulder zones. Despite the Roof wedge (Wedge 6) maintaining a FoS of 2.643, Table 12 indicates reduced overall system redundancy, especially for Wedge 5 (FoS = 1.691). The trend reflects the diminishing efficiency of longer bolts in offsetting increased spacing, a pattern similarly documented in seismic centrifuge models and field monitoring of deep tropical tunnels [92].
3.2.1. Verification of Numerical Results with Ground Reaction Curve Simulation
To further validate the trends observed in the RS2 numerical simulations, a complementary modelling approach was implemented using ground reaction and support reaction analysis. This method, which simulates the interaction between tunnel deformation (convergence) and the reactive load of the installed support system, offers a well-established analytical framework in rock mechanics, particularly for preliminary support design assessment. The output includes Ground Reaction Curves (GRCs) alongside corresponding support pressure curves, which help evaluate the equilibrium state and performance reliability of the support system under varying configurations.
Figure 30, Figure 31 and Figure 32 present the results of GRC simulations for bolt spacings ranging from 0.1 m to 2.5 m. At lower spacings, 0.1 m and 0.5 m (see Figure 30a–b), support activation occurs early in the deformation process, maintaining system stability with minimal tunnel convergence (0.88% and 0.90%, respectively) and high Factors of Safety (FoS) of 116.37 and 6.24. As bolt spacing increases to 1.0 m and 1.5 m (Figure 31a–b), support activation becomes more delayed, leading to moderately increased convergence (0.94% and 0.96%) and reduced FoS (2.44 and 1.87). This trend continues in Figure 32a–b, where the widest spacings, 2.0 m and 2.5 m, exhibit the most delayed support engagement and largest tunnel convergence values (0.96% with corresponding FoS dropping to 1.77 and 1.76.
These results align well with the finite element results from RS2, confirming that bolt spacing is a dominant control parameter in support system responsiveness and effectiveness. Tighter spacing provides greater confinement and faster load uptake, reducing deformation and increasing stability, while wider spacing compromises both the timing and magnitude of support contribution.
This simulation technique serves not only as an independent means of assessing tunnel stability but also as a robust cross-validation framework for 3D numerical methods. Recent studies such as [93,94] have emphasised the utility of ground reaction curves for evaluating excavation-induced deformation and stress redistribution, particularly in soft rock and jointed media. Similarly, [95] leveraged ground reaction simulations in conjunction with empirical design charts to assess support performance under high-stress tunnelling conditions. These investigations demonstrate that GRC-based methods can provide credible performance predictions, especially when integrated with multivariate analyses as undertaken in this study.
By applying this method in parallel with finite element models, this chapter reinforces the reliability of the observed support behaviour trends and highlights the broader applicability of combining analytical and numerical tools in predicting the Factor of Safety in chemically anchored support systems.
4. Discussion of Findings
This study aimed to evaluate the performance and reliability of adhesive anchors, specifically chemical bolts bonded with epoxy and vinyl ester resins, under both static and dynamic loading conditions, within fractured and intact rock environments. A hybrid approach combining experimental testing and numerical simulation (Phase 2 & Unwedge) was adopted to assess pull-out behaviour, bonding integrity, and mechanical resilience. Overall, the findings across methods converged consistently, demonstrating that the selected adhesive bolts provide robust and adaptable reinforcement in demanding mining applications.
Experimental results from static pull-out tests in both concrete and rock showed high bond capacities, with epoxy-based anchors outperforming vinyl ester variants in terms of both peak load and bond stiffness. This is in line with results from [96], who observed that epoxy resins yielded superior ductility and energy dissipation, particularly when embedment depths were optimised. Moreover, even in fractured rock configurations, bond integrity was retained, indicating resilience against crack propagation, a key parameter in dynamic mining environments.
The Phase 2 analysis revealed progressive stress redistribution and strain concentration patterns around excavation boundaries, particularly under unsupported scenarios. When supports were introduced, especially with reduced bolt spacing (<1 m), bolt mobilisation improved substantially, arresting wedge detachment and reducing tensile failures. This confirms findings from [97], where pre-tensioned resin anchors exhibited reduced displacement and increased peak resistance across varying rock moduli.
In the Unwedge-supported simulations, dense bolt spacings (0.5 m to 1 m) showed high wedge stability, with FoS values exceeding critical thresholds across all geometries. At wider spacings (≥1.5 m), bolt participation decreased, and roof instability reemerged, validating earlier centrifuge-based observations by [90]. These findings are reinforced by thermal degradation results from [98] , who noted a 6.6–31.3% loss in bond strength under elevated temperature, a relevant factor in tropical underground conditions.
Figure 33a displayed minimal plasticity, aligning with low-stress conditions in closely spaced bolt configurations, while Figure 33b indicated extensive yielding consistent with wider spacing. These outcomes paralleled earlier FEM investigations by [99], demonstrating that both numerical and experimental results can reliably predict long-term anchor performance.
Across experimental and numerical methods, results align with contemporary literature that supports the use of epoxy and vinyl ester chemical anchors for underground reinforcement. The novelty of this study lies in its integration of experimental pull-out behaviour with 3D stress-mapped simulations in both surface and tunnel geometries, a critical link missing in many earlier studies. Additionally, while many authors have assessed bolt performance under static conditions, this study advances understanding by evaluating dynamic load readiness, specifically through failure mode verification and strain visualisation under load transitions. Moreover, the hybrid verification approach (including Phase2) adds confidence to the generalizability of the findings across geological contexts.
5. Conclusion and Recommendations
This study substantiates the reliability and applicability of chemical anchors (adhesive bolts) in complex mining scenarios, including environments subjected to dynamic loading, fractured rock conditions, and elevated thermal gradients. The findings demonstrate that epoxy resin systems exhibit superior mechanical resilience under high-load and high-temperature conditions, making them particularly suitable for demanding underground applications. Moreover, support systems configured with closely spaced bolts, typically less than 1.0 meters apart, consistently showed enhanced stability through improved load distribution and wedge confinement. The numerical simulations conducted throughout this study further reinforced these observations, offering predictive insight into failure mechanisms and support behaviour across varying geometries and stress regimes. Collectively, these outcomes confirm that adhesive bolts possess the mechanical and operational attributes necessary for reliable integration into modern mine support systems, with clear benefits in terms of structural integrity, safety, and long-term durability.
The study utilised Rocscience RS2 (Phase 2 and Unwedge) as the primary numerical modelling platform to simulate both surface and subsurface excavation scenarios. The RS2 simulations, combined with experimental data, confirmed that short-length adhesive bolts (190 mm–250 mm), when embedded correctly and spaced optimally, effectively mitigated tensile failure and reduced the propagation of stress concentration zones. Dynamic resilience was particularly evident in scenarios involving wedge instability, where resin-grouted anchors curtailed detachment and deformation propagation across fractured interfaces. Based on these findings, the following technical recommendations are proposed:
- For fractured or highly stressed rock environments, bolt spacing should not exceed 1.0 m, especially when dealing with asymmetric wedge geometries or regions prone to seismic activity.
- Epoxy-based resins should be prioritised for high-temperature zones and long-term static or cyclic loading, while vinyl ester systems may be appropriate for environments demanding early-age strength development.
- Incorporating rock mass classification, joint persistence, and stress anisotropy into numerical simulations significantly enhances predictive reliability and should become standard in preliminary design stages.
- Long-term in-situ performance studies of resin anchors under real mine conditions are necessary to validate laboratory findings and refine models under operational variability.
- Engineering codes and mine design guidelines should integrate time-dependent curing effects, resin-specific bond-slip profiles, and spacing optimisation strategies derived from dynamic interaction studies.
The research presented herein bridges a crucial knowledge gap in the performance characterisation of adhesive anchors in mining contexts, particularly within tropical geological settings. By integrating comprehensive laboratory testing with advanced numerical modelling in RS2, the study offers a high-fidelity evaluation of bolt performance under both static and dynamic loading. These findings not only validate the deployment of chemical anchors in structurally demanding applications but also inform safer, data-driven support strategies for future mining projects. This contribution stands to enhance both academic understanding and practical engineering of underground support systems in some of the world's most challenging geological environments.
Author Contributions
Conceptualization, T.M., J.F, and F.S.; methodology, T.M, J.M., and F.S.; software, T.M., J.M., and F.S.; validation, T.M., I.T., and F.S.; formal analysis, T.M., investigation, T.M.; resources, T.M., J.M., and F.S.; data curation, T.M., J.M., and F.S.; writing—original draft preparation, T.M.,; writing—review and editing, T.M., J.M., and F.S.; visualization, T.M., J.M., F.S.; supervision, J.M, and F.S.; project administration, J.M., and F.S.; funding acquisition, T.M., J.M., and F.S
Funding
Fischerwerke GmbH & Co. KG, 72178 Waldachtal, Germany, Upat SA.
Institutional Review Board Statement
not applicable
Informed Consent Statement
Not applicable
Data Availability Statement
Acknowledgements
I would like to sincerely thank the technical and administrative teams at the University of Johannesburg for their support throughout the course of this research. I am especially grateful to Upat South Africa for providing access to testing equipment, facilities, and field support during various phases of the study. I also wish to acknowledge Fischer Germany for the generous donation of chemical anchoring materials used in both laboratory and field experiments. My appreciation goes to the colleagues, students, and site personnel who assisted with test preparations, data collection, and general coordination. Their contributions, though not formally listed under author or funding roles, played an important part in the success of this work. During the preparation of this study, the author used MATLAB (R2025a, with AI features, MathWorks, Inc.) for the purposes of data analysis and graphical visualisation. The author has reviewed and edited the output and takes full responsibility for the content of this publication.
Conflicts of Interest
The authors declare no conflict of interest
References
- K. Coventry, A. Richardson, C. McIntyre, and B. Aresh, ‘PULLOUT PERFORMANCE OF CHEMICAL ANCHOR BOLTS IN FIBRE CONCRETE’, in Fibre Concrete 2011– 6th International Conference, September 8/9, Czech Technical University, Prague, Czech Republic, Prague: Czech Technical University, Sep. 2011, p. Accessed: Jul. 22, 2025. [Online]. Available: https://concrete.fsv.cvut.cz/fcproceedings/pdf/2011/025_o_Short_Coventry_Kathryn.pdf.
- Y. Du, H. Li, S. D. Chicas, and L. Huo, ‘Progress and Perspectives of Geotechnical Anchor Bolts on Slope Engineering in China’, Front Environ Sci, vol. 10, Jul. 2022. [CrossRef]
- G. Rao and J. Arora, ‘PERFORMANCE OF CHEMICAL ANCHORS AND APPLICATIONS IN STRENGTHENING OF RC STRUCTURAL SYSTEMS’, International Journal of Applied Engineering and Technology, vol. 4, no. 4, pp. 14–25, Dec. 2014, Accessed: Jul. 22, 2025. [Online]. Available: https://www.cibtech.org/jet.htm.
- P. Małkowski, X. Feng, Z. Niedbalski, and M. Żelichowski, ‘Laboratorial Tests and Numerical Modeling of Rock Bolts Bonded by Different Materials’, Rock Mech Rock Eng, vol. 56, no. 4, pp. 2589–2606, Apr. 2023. [CrossRef]
- R. Xu and H. Zhou, ‘Experimental Investigation of the Anchoring Effect of Two Different Types of Rock Bolts on Fractured Rock’, Advances in Materials Science and Engineering, vol. 2019, pp. 1–10, Feb. 2019. [CrossRef]
- W. Yang, N. Wen, S. Li, and X. Li, ‘Experimental Study on Anchoring Effect of Rock Bolts to Fractured Rock Mass’, in Deep and Underground Excavations, Reston, VA: American Society of Civil Engineers, May 2010, pp. 280–287. [CrossRef]
- I. Jašarević, Ž. Tavas, I. Muhovec, and B. Nesrsta, ‘Instrumentation of rock bolts and cable anchors’, in Rock Bolting: Theory and application in mining and underground construction Proceedings of the international symposium, Abisko, Sweden, 28 August-2 September 1983, 1st ed., O. Stephensson, Ed., London: Routledge, 2021, pp. 481–497. [CrossRef]
- Y. Wei et al., ‘Experimental and Numerical Study on the Anchoring Mechanism of an Anchor Bolt Considering its Lateral Restraint Effect’, Rock Mech Rock Eng, vol. 57, no. 11, pp. 9617–9633, Nov. 2024. [CrossRef]
- Y. Chen, ‘Experimental study and stress analysis of rock bolt anchorage performance’, Journal of Rock Mechanics and Geotechnical Engineering, vol. 6, no. 5, pp. 428–437, Oct. 2014. [CrossRef]
- Y. Yokota, Z. Zhao, W. Nie, K. Date, K. Iwano, and Y. Okada, ‘Experimental and Numerical Study on the Interface Behaviour Between the Rock Bolt and Bond Material’, Rock Mech Rock Eng, vol. 52, no. 3, pp. 869–879, Mar. 2019. [CrossRef]
- W. Frenelus, H. Peng, and J. Zhang, ‘An Insight from Rock Bolts and Potential Factors Influencing Their Durability and the Long-Term Stability of Deep Rock Tunnels’, Sustainability, vol. 14, no. 17, p. 10943, Sep. 2022. [CrossRef]
- K. S. Moore and N. Vlachopoulos, ‘The use of an innovative fiber optic methodology to capture the axial response of rib spacing and grout annulus effects on grouted rock bolts’, in Expanding Underground - Knowledge and Passion to Make a Positive Impact on the World, London: CRC Press, 2023, pp. 2480–2487. [CrossRef]
- W. Frenelus, H. Peng, and J. Zhang, ‘An Insight from Rock Bolts and Potential Factors Influencing Their Durability and the Long-Term Stability of Deep Rock Tunnels’, Sustainability, vol. 14, no. 17, p. 10943, Sep. 2022. [CrossRef]
- Z. Wei and L. Quansheng, ‘Synthetical deformation analysis of anchor bolt in jointed rock mass’, Rock and Soil Mechanics, vol. 33, no. 4, pp. 1067–1074, Apr. 2012.
- Y. Chen and H. Xiao, ‘State-of-the-art on the anchorage performance of rock bolts subjected to shear load’, Int J Coal Sci Technol, vol. 11, no. 1, p. 9, Dec. 2024. [CrossRef]
- K. Ding, K. Wang, and Y. Liu, ‘Effects of Hygrothermal Environment on Tensile Capacity of Adhesive-injected Anchor Bolt of ALC Panel and ETICS’, KSCE Journal of Civil Engineering, vol. 27, no. 3, pp. 1107–1117, Jan. 2023.
- Y. Du, H. Li, S. D. Chicas, and L. Huo, ‘Progress and Perspectives of Geotechnical Anchor Bolts on Slope Engineering in China’, Front Environ Sci, vol. 10, Jul. 2022. [CrossRef]
- M. K. Kang, ‘Shear Resistance of CIP Anchors under Dynamic Loading: Unreinforced Anchor’, Journal of Korean Society of Steel Construction, vol. 26, no. 1, p. 11, 2014. [CrossRef]
- H. Kang et al., ‘Mechanical behaviour and failure mechanisms of rock bolts subjected to static-dynamic loads’, Int J Min Sci Technol, vol. 34, no. 3, pp. 281–288, Mar. 2024. [CrossRef]
- B. Zhao, J. Li, A. Wang, H. Xiang, and F. Xu, ‘Theoretical and numerical analysis of a new energy-absorbing rock bolt with controllable constant resistance and large displacement’, Tunnelling and Underground Space Technology, vol. 106, p. 103581, Dec. 2020. [CrossRef]
- J. Wang et al., ‘Mechanical behavior of 2G NPR bolt anchored rock samples under static disturbance loading’, J Mt Sci, vol. 21, no. 7, pp. 2494–2516, Jul. 2024. [CrossRef]
- C. C. Li, ‘Performance of D-bolts Under Static Loading’, Rock Mech Rock Eng, vol. 45, no. 2, pp. 183–192, Mar. 2012. [CrossRef]
- P. Qiu et al., ‘Experimental study on the energy dissipation mechanism of bolted rock under dynamic loading’, Sci Rep, vol. 15, no. 1, p. 17182, May 2025. [CrossRef]
- . Yilmaz, Ö. Çalişkan, H. Kaplan, and N. Kiraç, ‘FACTORS AFFECTING THE STRENGTH OF CHEMICAL ANCHORS’, Journal of Engineering and Architecture, vol. XXIII, no. 1, pp. 123–133, Apr. 2010.
- Kabantsev and M. Kovalev, ‘Behavior of Anchors Embedded in Concrete Damaged by the Maximum Considered Earthquake: An Experimental Study’, Buildings, vol. 13, no. 11, p. 2860, Nov. 2023. [CrossRef]
- R. Ogawa, J. Etoh, T. Matsunaga, M. Sagisaka, and Y. Isobe, ‘ICONE23-1884 DEVELOPMENT OF NON-DESTRUCTIVE INSPECTION TECHNIQUE FOR ADHESIVE ANCHOR BOLTS USING AE SENSOR : (2) THEORETICAL APPROACH’, Proceedings of ICONE-23 23rd International Conference on Nuclear Engineering ), vol. 2015.23, no. 0, p. _ICONE23-1-_ICONE23-1, May 2015. [CrossRef]
- H. Miyata, S. Uchida, T. Kimura, and T. Kamada, ‘Non Destructive Evaluation Method for Soundness of Adhesive Portion Around Post Installed Anchor Bolts in Concrete by Electromagnetic Pulse’, in Third International Conference on Advances in Civil, Structural and Mechanical Engineering - ACSM 2015, Institute of Research Engineers and Doctors, Dec. 2015, pp. 88–92. [CrossRef]
- J.-D. Yu, J.-S. Lee, and H.-K. Yoon, ‘Effects of rock weathering on guided wave propagation in rock bolts’, Tunnelling and Underground Space Technology, vol. 115, p. 104069, Sep. 2021. [CrossRef]
- W. Aldrian, U. Wyink, and C. Herrmann, ‘Bolting with pumpable reactive resins – More than fixation of steel dowels in rock’, Geomechanics and Tunnelling, vol. 12, no. 2, pp. 168–174, Apr. 2019. [CrossRef]
- C. S. Zhang, D. H. Zou, and V. Madenga, ‘Numerical simulation of wave propagation in grouted rock bolts and the effects of mesh density and wave frequency’, International Journal of Rock Mechanics and Mining Sciences, vol. 43, no. 4, pp. 634–639, Jun. 2006. [CrossRef]
- B. Jodeiri Shokri et al., ‘Axial Load Transfer Mechanism in Fully Grouted Rock Bolting System: A Systematic Review’, Applied Sciences, vol. 14, no. 12, p. 5232, Jun. 2024. [CrossRef]
- X. Z. Wu, B. Wang, Y. J. Jiang, B. Gong, and B. Li, ‘Mechanism of CTC-yield bolts and its experimental research’, Chinese Journal of Geotechnical Engineering, vol. 37, no. 1, pp. 139–147, 2015.
- R. Van Ryswyk, ‘Mechanical rock bolt performance evaluated from pull tests’, in Rock bolting: Theory and application in mining and underground construction: Proceedings of the international symposium, Abisko, Sweden, 28 August-2 September 1983, 1st ed., O. Stephansson, Ed., Abisko: Routledge, 1984, pp. 473–475. [CrossRef]
- N. Zhang, S. C. Li, A. Z. Lu, M. T. Li, F. Shen, and D. L. Shao, ‘Experimental study on reinforced effect of bolts on 3D surface fractured rock under uniaxial tension’, Chinese Journal of Geotechnical Engineering, vol. 33, no. 5, pp. 769–776, May 2011.
- X. Zhao, S. Zhang, Q. Zhu, H. Li, G. Chen, and P. Zhang, ‘Dynamic and static analysis of a kind of novel J energy-releasing bolts’, Geomatics, Natural Hazards and Risk, vol. 11, no. 1, pp. 2486–2508, Jan. 2020. [CrossRef]
- Y. Wang, X. Yang, W.-T. Li, and W. Qiao, ‘Experimental study on the effect of anchored bolts on failure and strength behavior of nonpersistent jointed rock model’, Bulletin of Engineering Geology and the Environment, vol. 82, no. 3, Mar. 2023. [CrossRef]
- H.-L. Ye, H.-L. Ye, R.-Q. Huang, and Y.-R. Zheng, ‘Sensitivity analysis of parameters for bolts in rock slopes under earthquakes’, Chinese Journal of Geotechnical Engineering, vol. 28, no. 9, pp. 1374–1379, Sep. 2010.
- W. Xiaowen, ‘Study on the Mechanical Properties and the Matching of Bolt Components’, Italian Association of Chemical Engineering, vol. 59, pp. 79–84, Jul. 2017. [CrossRef]
- Z. Yang, W. Zhu, K. Guan, B. Yan, W. Luo, and P. Liang, ‘Experimental and Numerical Study on the Anchorage Effect of Bolted Jointed Rock Masses’, Front Earth Sci (Lausanne), vol. 10, p., Mar. 2022. [CrossRef]
- I. Sakhno and S. Sakhno, ‘Research on a new method for non-adhesive fixing of rockbolts’, Naukovyi Visnyk Natsionalnoho Hirnychoho Universytetu, no. 6, pp. 33–39, Dec. 2018. [CrossRef]
- D. Fan, X.-S. Liu, Y. Tan, X. Li, and S. Yang, ‘Energy mechanism of bolt supporting effect to fissured rock under static and dynamic loads in deep coal mines’, Int J Min Sci Technol, vol. 34, no. 3, pp. 371–384, Mar. 2024. [CrossRef]
- F. Tahmasebinia, C. Zhang, I. Canbulat, O. Vardar, and S. Saydam, ‘Numerical and analytical simulation of the structural behaviour of fully grouted cable bolts under impulsive loading’, Int J Min Sci Technol, vol. 28, no. 5, pp. 807–811, Sep. 2018. [CrossRef]
- I. Demiyanushko, V. Nadezhdin, I. Karpov, B. Tavshavadze, and O. Titov, ‘Experimental research and modeling of chemical anchor systems under static and dynamic loading’, IOP Conf Ser Mater Sci Eng, vol. 691, pp. 1–16, May 2019. [CrossRef]
- R. E. Goodman, R. L. Taylor, and T. L. Brekke, ‘A Model for the Mechanics of Jointed Rock’, Journal of the Soil Mechanics and Foundations Division, vol. 94, no. 3, pp. 637–659, May 1968. [CrossRef]
- J. M. Crotty and L. J. Wardle, ‘Boundary integral analysis of piecewise homogeneous media with structural discontinuities’, International Journal of Rock Mechanics and Mining Sciences & Geomechanics Abstracts, vol. 22, no. 6, pp. 419–427, Dec. 1985. [CrossRef]
- P. A. Cundall, ‘A Computer Model for Simulating Progressive, Large-scale Movement in Blocky Rock System’, Proceedings of the International Symposium on Rock Mechanics, vol. 8, pp. 129–136, 1971, Accessed: Jul. 23, 2025. [Online]. Available: https://cir.nii.ac.jp/crid/1574231876066779904.bib?lang=en.
- M. Moosavi, ‘Load distribution along fully grouted cable bolts based on constitutive models obtained from modified Hoek cells’, National Library of Canada, Ottawa, ON (Canada), Canada, Dec. 1997.
- M. Moosavi, W. F. Bawden, and A. J. Hyett, ‘A comprehensive laboratory test programme to study the behaviour of modified geometry cable bolt support. ’, in Proceedings of the 2nd North American Rock Mechanics Symposium, Montreal: International Rock Mechanics, Tools and Techniques, 1996.
- A. J. HYETT, M. MOOSAVI, and W. F. BAWDEN, ‘LOAD DISTRIBUTION ALONG FULLY GROUTED BOLTS, WITH EMPHASIS ON CABLE BOLT REINFORCEMENT’, Int J Numer Anal Methods Geomech, vol. 20, no. 7, pp. 517–544, Jul. 1996. [CrossRef]
- J. Hyett, W. F. Bawden, G. R. Macsporran, and M. Moosavi, ‘A constitutive law for bond failure of fully-grouted cable bolts using a modified hoek cell’, International Journal of Rock Mechanics and Mining Sciences & Geomechanics Abstracts, vol. 32, no. 1, pp. 11–36, Jan. 1995. [CrossRef]
- . W. Farmer, ‘Stress distribution along a resin grouted rock anchor’, International Journal of Rock Mechanics and Mining Sciences & Geomechanics Abstracts, vol. 12, no. 11, pp. 347–351, Nov. 1975. [CrossRef]
- E. Hoek and E. T. Brown, ‘The Hoek–Brown failure criterion and GSI – 2018 edition’, Journal of Rock Mechanics and Geotechnical Engineering, vol. 11, no. 3, pp. 445–463, Jun. 2019. [CrossRef]
- Chen, Z. Zhou, L. Kong, X. Zhang, and S. Yin, ‘Undrained dynamic behaviour of peaty organic soil under long-term cyclic loading, Part I: Experimental investigation’, Soil Dynamics and Earthquake Engineering, vol. 107, pp. 279–291, Apr. 2018. [CrossRef]
- C. Wyllie, Rock Slope Engineering: Civil Applications, 5th Edition. Vancouver: CRC Press, 2017. [CrossRef]
- Li, C. Gao, H. Xie, and N. Li, ‘Experimental investigation of anisotropic fatigue characteristics of shale under uniaxial cyclic loading’, International Journal of Rock Mechanics and Mining Sciences, vol. 130, p. 104314, Jun. 2020. [CrossRef]
- S. Yu, L. Niu, and J. Chen, ‘Experimental and Numerical Studies on Bond Quality of Fully Grouted Rockbolt under Confining Pressure and Pull-Out Load’, Shock and Vibration, vol. 2022, pp. 1–12, Aug. 2022. [CrossRef]
- P. Tomasone, N. Bahrani, and J. Hadjigeorgiou, ‘Practical considerations in the modelling of resin-grouted rockbolts’, J South Afr Inst Min Metall, vol. 120, no. 6, Jun. 2020. [CrossRef]
- Y. Li, H. Zhou, L. Zhang, W. Zhu, S. Li, and J. Liu, ‘Experimental and numerical investigations on mechanical property and reinforcement effect of bolted jointed rock mass’, Constr Build Mater, vol. 126, pp. 843–856, Nov. 2016. [CrossRef]
- S. Wang et al., ‘Experimental Study on the Relationship between the Degree of Surrounding Rock Fragmentation and the Adaptability of Anchor Support’, Applied Sciences, vol. 13, no. 20, p. 11328, Oct. 2023. [CrossRef]
- H. Zhao, S. Li, and B. Chen, ‘The Reliability-Based Design Optimization of considering Rock-Support Interaction for Rock Tunnels’, Advances in Civil Engineering, vol. 2021, no. 1, Jan. 2021. [CrossRef]
- M. Baharvand and V. Hosseinitoudeshki, ‘The Effect of Length of Rock Bolts on the Stability of Rock Slopes’, International Journal of Science and Engineering Investigations, vol. 4, no. 42, p. 42, Jul. 2015, [Online]. Available: www.IJSEI.com.
- C. J. Manquehual, C. C. Li, M. Shabanimashcool, B. Grindheim, and L. Lia, ‘3D Numerical Modeling of Rock Mass Failure in an Uplift Test of a Rock Anchor with Focus on the Role of Rock Joints’, Rock Mech Rock Eng, vol. 58, no. 3, pp. 2847–2875, Mar. 2025. [CrossRef]
- S. A. Hagen, T. Larsen, A. Berghorst, and G. Knox, ‘Full-scale rockbolt testing in the laboratory: Analysis of recent results’, J South Afr Inst Min Metall, vol. 120, no. 1, Jan. 2020. [CrossRef]
- N. Aziz and H. Jalalifar, ‘Investigation into the transfer mechanism of loads in grouted bolts’, Australian Geomechanics Journal, vol. 40, pp. 99–112, Jun. 2005.
- A. J. S. Spearing, A. J. Hyett, T. Kostecki, and M. Gadde, ‘New technology for measuring the in situ performance of rock bolts’, International Journal of Rock Mechanics and Mining Sciences, vol. 57, pp. 153–166, Jan. 2013. [CrossRef]
- H. Ko, S. Moallemi, H. K. Dang, and T. Yacoub, ‘A Comprehensive Comparison Between Discrete Fracture Network and Generalized Anisotropic Material Behavior for Modeling Jointed Rock Mass’, in 58th U.S. Rock Mechanics/Geomechanics Symposium, Colorado: ARMA, Jun. 2024. [CrossRef]
- Y.-H. Chang, C.-H. Lin, and M.-L. Lin, ‘Influences of Joint Persistence and Groundwater on Wedge Failure Potential of Jointed Rock Slope’, in EGU General Assembly Conference 2020, Vienna: EGU General Assembly 2020, Mar. 2020. [CrossRef]
- V. M. Bowa and T. Kasanda, ‘Wedge Failure Analyses of the Jointed Rock Slope Influenced by Foliations’, Geotechnical and Geological Engineering, vol. 38, no. 5, pp. 4701–4710, Oct. 2020. [CrossRef]
- H. K. Le, W. C. Huang, P. H. Hsiao, P. C. Huang, M. C. Weng, and C. C. Chien, ‘Exploring joint orientation effects on rock wedge stability: Experimental and discrete element analysis’, Eng Geol, vol. 340, p. 107691, Oct. 2024. [CrossRef]
- Pérez-Rey, J. Moreno, and M. Muñiz-Menéndez, ‘The role of joint spacing on the stability analysis of wedge failures’, IOP Conf Ser Earth Environ Sci, vol. 833, no. 1, p. 012095, Aug. 2021. [CrossRef]
- G. Liu et al., ‘Numerical simulation of wedge failure of rock slopes using three-dimensional discontinuous deformation analysis’, Environ Earth Sci, vol. 83, no. 10, p. 310, May 2024. [CrossRef]
- M. Zamani and A. Nikjoo, ‘Roof Tunnel Stability by Wedge Analysis’, Journal of Engineering Geology, vol. 14, no. 5, pp. 163–188, Jan. 2021. [CrossRef]
- Li, J. Feng, H. Xie, and H. Zhang, ‘Numerical Analysis of Anchor Bolt Pull-out Test by Cohesive Zone Model Combined with Finite Element Method’, IOP Conf Ser Earth Environ Sci, vol. 570, no. 5, p. 052014, Oct. 2020. [CrossRef]
- M. Giordanella, M. Ranjbarnia, P. Oreste, and M. Zaheri, ‘Study of the systematic fully grouted rock bolts performance in tunnels considering installation condition of bolt head’, Geomechanics and Geoengineering, vol. 17, no. 4, pp. 1151–1167, Jul. 2022. [CrossRef]
- S. Liu, D. He, and M. Fu, ‘Experimental investigation of surrounding-rock anchoring synergistic component for bolt support in tunnels’, Tunnelling and Underground Space Technology, vol. 104, p. 103531, Oct. 2020. [CrossRef]
- H. Høien, C. C. Li, and N. Zhang, ‘Pull-out and Critical Embedment Length of Grouted Rebar Rock Bolts-Mechanisms When Approaching and Reaching the Ultimate Load’, Rock Mech Rock Eng, vol. 54, no. 3, pp. 1431–1447, Mar. 2021. [CrossRef]
- Z. Zhang, Y. Liu, J. Teng, H. Zhang, and X. Chen, ‘An Investigation into Bolt Anchoring Performance during Tunnel Construction in Bedded Rock Mass’, Applied Sciences, vol. 10, no. 7, p. 2329, Mar. 2020. [CrossRef]
- L. He, X. M. An, and Z. Y. Zhao, ‘Fully Grouted Rock Bolts: An Analytical Investigation’, Rock Mech Rock Eng, vol. 48, no. 3, pp. 1181–1196, May 2015. [CrossRef]
- Pullan, D. Li, and P. C. Hagan, ‘Comparison of the Performance of Resin and Cementitious Grouting Media for Cable Bolts’, in Proceedings of the 2018 Coal Operators’ Conference, Mining Engineering, N. Aziz and B. Kininmonth, Eds., Wollongong: Mining Engineering, University of Wollongong, Feb. 2018, pp. 363–372. [Online]. Available: https://ro.uow.edu.au/articles/conference_contribution/Comparison_of_the_Performance_of_Resin_and_Cementitious_Grouting_Media_for_Cable_Bolts/27687225.
- P. S. Bajwa, P. Hagan, and D. Li, ‘A comparison between resin and a cementitious material in the grouting of cable bolts’, in Proceedings of the 17th Coal Operators’ Conference, N. Aziz and B. Kininmonth, Eds., Wollongong: Mining Engineering, University of Wollongong, Feb. 2017, pp. 193–203. [Online]. Available: https://ro.uow.edu.au/articles/conference_contribution/A_comparison_between_resin_and_a_cementitious_material_in_the_grouting_of_cable_bolts/27686961.
- C. Lilley, T. Roberts, G. Putzar, and D. Beck, ‘Dynamic simulations of excavations with yielding bolts’, in Proceedings of the Seventh International Symposium on Ground Support in Mining and Underground Construction, Y. Potvin and B. Brady, Eds., Perth: Australian Centre for Geomechanics, 2013, pp. 525–538. [CrossRef]
- N. Aziz and H. Jalalifar, ‘Investigation into the transfer mechanism of loads in grouted bolts’, Australian Geomechanics Society, vol. 40, no. 2, pp. 99–112, Jun. 2005.
- T. Nguyen, K. Ghabraie, and T. Tran-Cong, ‘Simultaneous pattern and size optimisation of rock bolts for underground excavations’, Comput Geotech, vol. 66, pp. 264–277, May 2015. [CrossRef]
- T. Kyoya and M. Tani, ‘Optimization of rock bolt installation spacing using homogenization method’, J Appl Mech, vol. 6, pp. 159–166, Aug. 2003. [CrossRef]
- Y. Lu, Y. Liu, and D. Hu, ‘Study on Optimization of Crossheading Support and Lateral Stress Evolution Law with Shallow Buried Soft Rock’, Geotechnical and Geological Engineering, vol. 39, no. 2, pp. 1009–1021, Feb. 2021. [CrossRef]
- Q. Liu et al., ‘Primary support optimization of large-span and shallow buried hard rock tunnels based on the active support concept’, Sci Rep, vol. 12, no. 1, p. 7918, May 2022. [CrossRef]
- Z. Sun et al., ‘Parametric Study on the Ground Control Effects of Rock Bolt Parameters under Dynamic and Static Coupling Loads’, Advances in Civil Engineering, vol. 2020, no. 1, Jan. 2020. [CrossRef]
- Wang, S. Li, Q. Wang, D. Wang, W. Li, and P. Liu, ‘Investigating the supporting effect of rock bolts in varying anchoring methods in a tunnel’, Geomechanics and Engineering, vol. 19, no. 6, pp. 485–498, Dec. 2019.
- B. Tang et al., ‘Supporting Design Optimization of Tunnel Boring Machines-Excavated Coal Mine Roadways: A Case Study in Zhangji, China’, Processes, vol. 8, no. 1, p. 46, Jan. 2020. [CrossRef]
- Mashimo and H. Kamata, ‘Experimental investigation of the effect of rock bolts on tunnel stability in sandy ground’, in Physical Modelling in Geotechnics, 1st ed., P. Guo, R. Phillips, and R. Popescu, Eds., Newfoundland: Routledge, 2022, pp. 797–801. [CrossRef]
- P. Qiu et al., ‘Experimental Investigation of the Dynamic Impact Failure of Bolted Rock With Different Anchoring Angles’, Energy Sci Eng, vol. 13, no. 2, pp. 752–764, Feb. 2025. [CrossRef]
- Bin, ‘Research on Roadway Supporting Effect of Different Bolt Parameters under Blasting Dynamic Load’, Academic Journal of Engineering and Technology Science, vol. 4, no. 5, pp. 1–5, 2021. [CrossRef]
- M. Heidari and F. Tonon, ‘Ground reaction curve for tunnels with jet grouting umbrellas considering jet grouting hardening’, International Journal of Rock Mechanics and Mining Sciences, vol. 76, pp. 200–208, Jun. 2015. [CrossRef]
- B. Oraee, S. Zandi, and K. Oraee, ‘A Comparison of Numerical Methods and Analytical Methods in Determination of Tunnel Walls Displacement – A Case Study’, in 32nd International Conference on Ground Control in Mining, Morgantown: ICGCM, Jul. 2013, pp. 1–6.
- Godio, C. Oggeri, and J. Seccatore, ‘An Analysis of Rock Bolt Dynamic Responses to Evaluate the Anchoring Degree of Fixation’, Applied Sciences, vol. 15, no. 3, p. 1513, Feb. 2025. [CrossRef]
- Ö. Çalişkan and M. Aras, ‘Experimental investigation of behaviour and failure modes of chemical anchorages bonded to concrete’, Constr Build Mater, vol. 156, pp. 362–375, Dec. 2017. [CrossRef]
- Tian and L. Hu, ‘Anchorage performance of a high-pressure pre-tightening resin anchor with a compressed grouting body’, PLoS One, vol. 12, no. 2, pp. 1–12, Feb. 2017. [CrossRef]
- H. Nourizadeh et al., ‘Characterization of mechanical and bonding properties of anchoring resins under elevated temperature’, International Journal of Rock Mechanics and Mining Sciences, vol. 170, p. 105506, Oct. 2023. [CrossRef]
- O. R. Famiyesin, A. A. Rodger, and E. F. Connolly, Ground anchorages and anchored structures: Proceedings of the international conference organized by the Institution of Civil Engineers and held in London, UK, on 20–21 March 1997, 1st ed. London: Thomas Telford, 1997. [CrossRef]
Figure 1.
Pull-out test apparatus. (a) Tripod pull-out rig, and (b) calibrated 250kN pressure gauge.
Figure 1.
Pull-out test apparatus. (a) Tripod pull-out rig, and (b) calibrated 250kN pressure gauge.
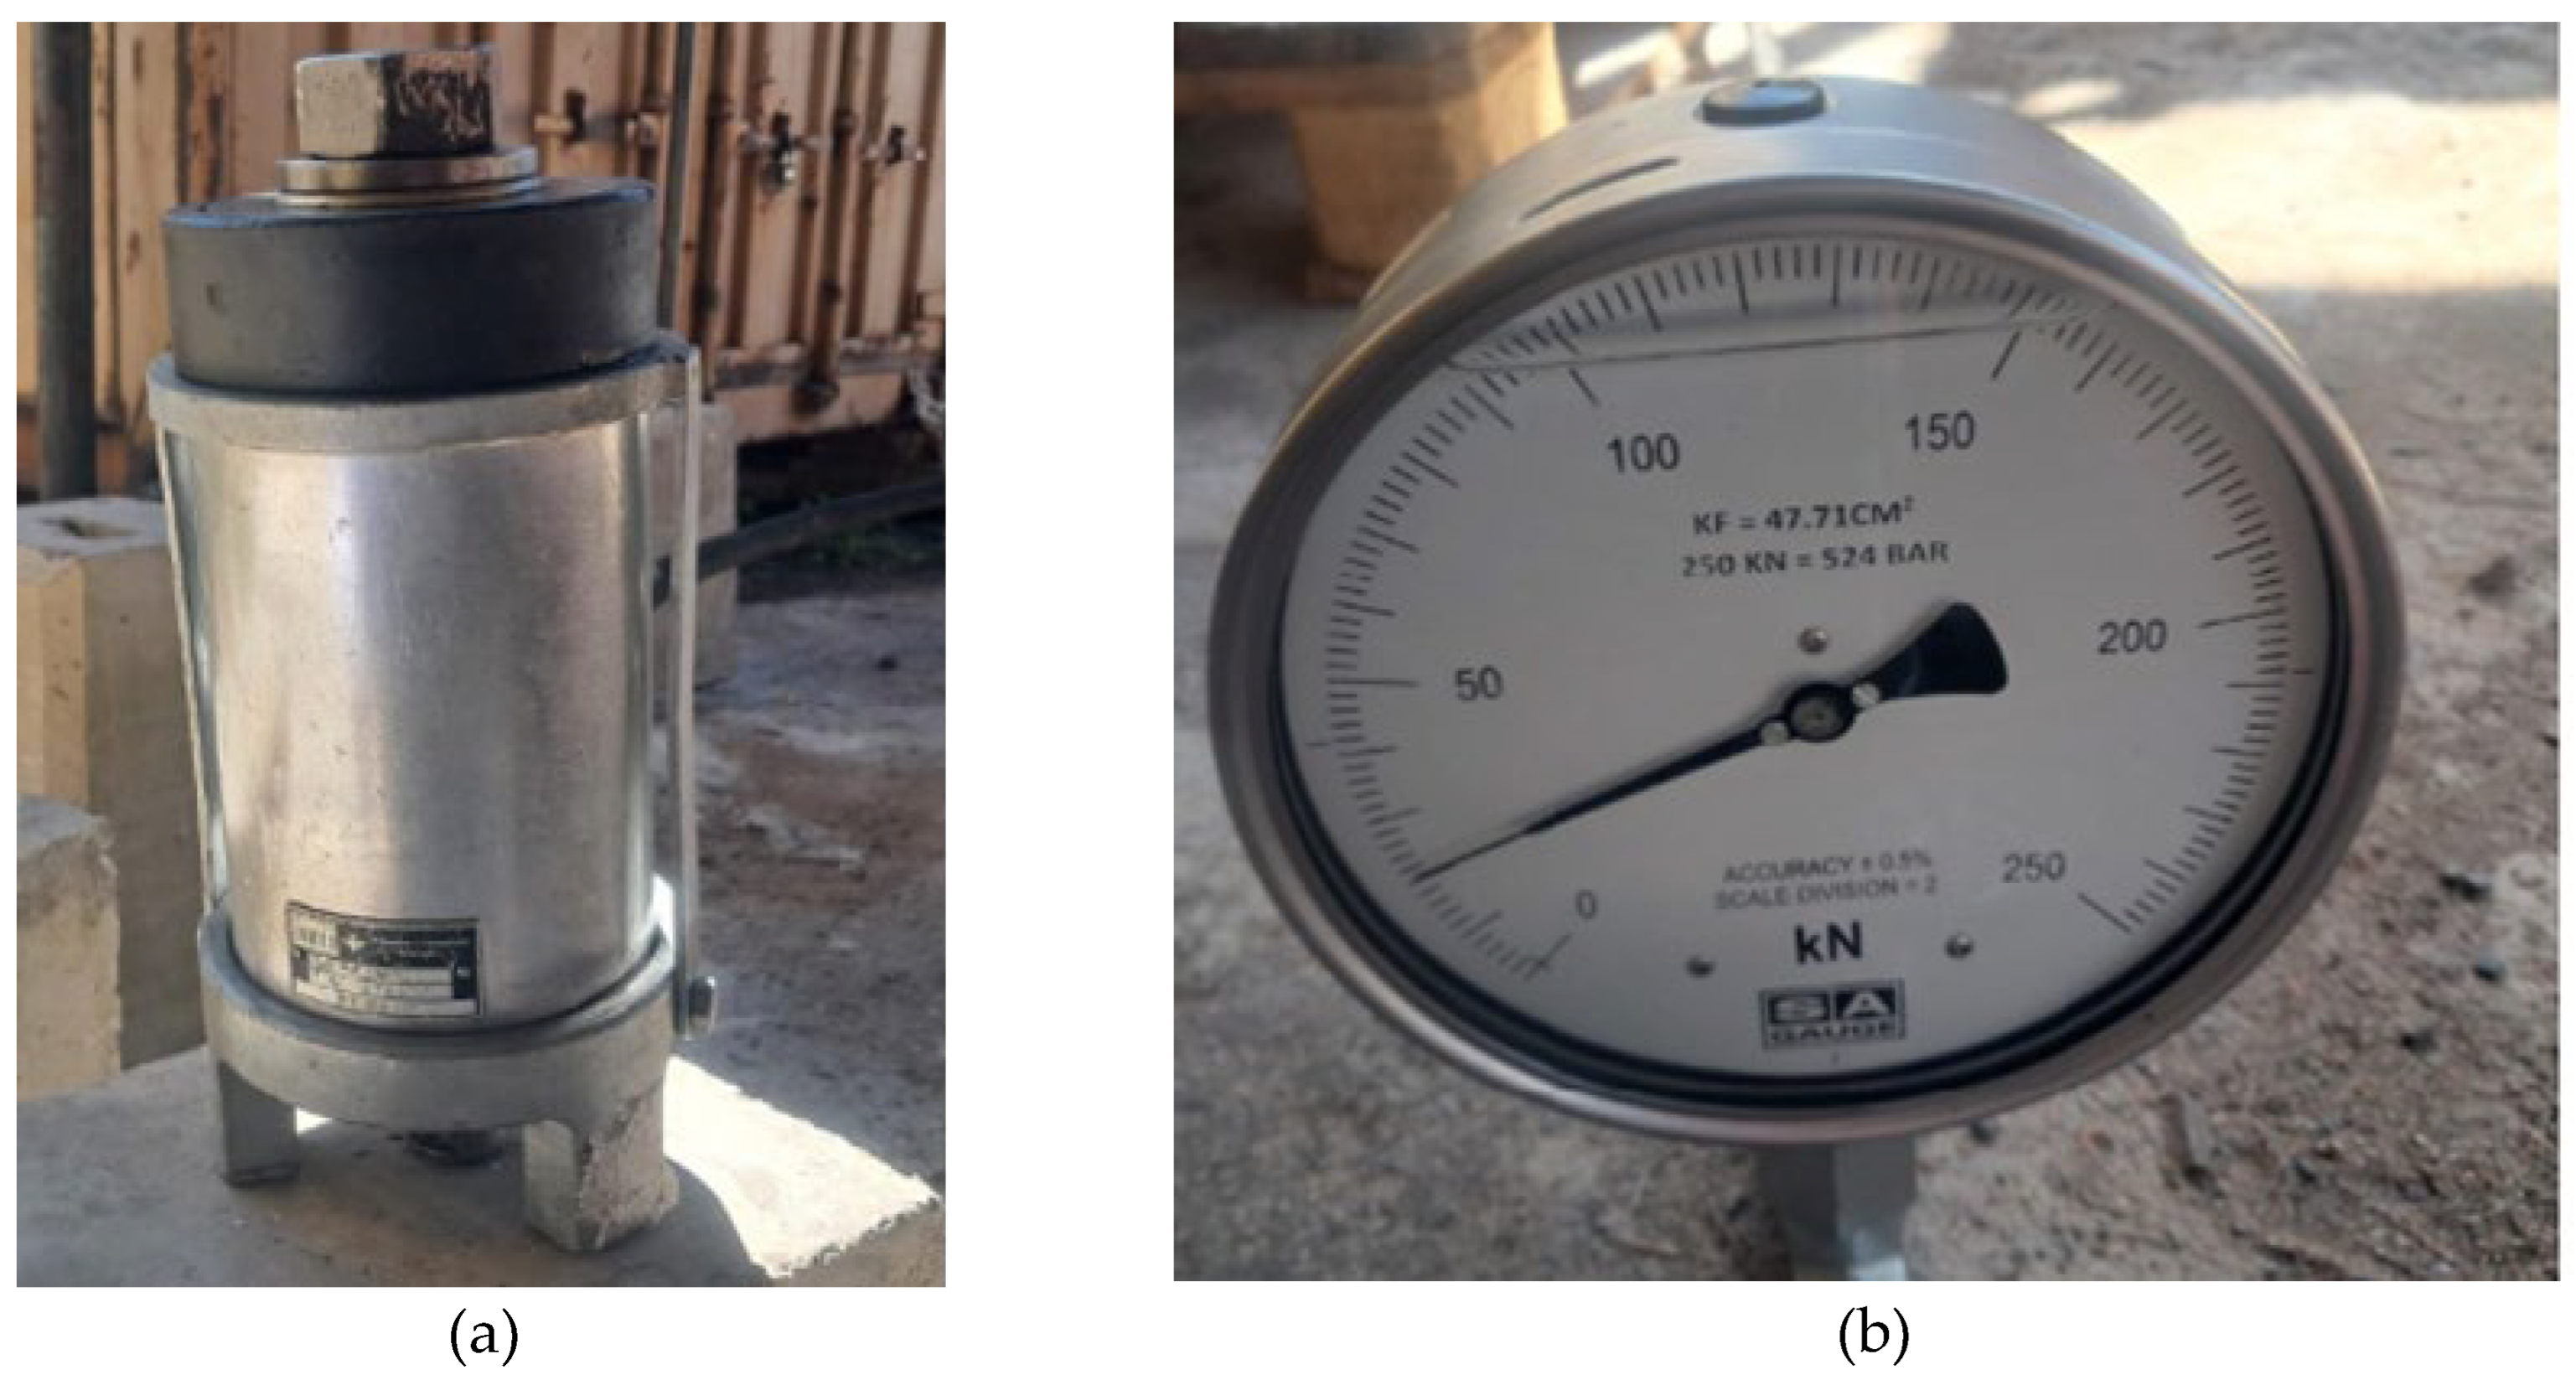
Figure 2.
Field static pull-out test setup at Videx Mining Facility.
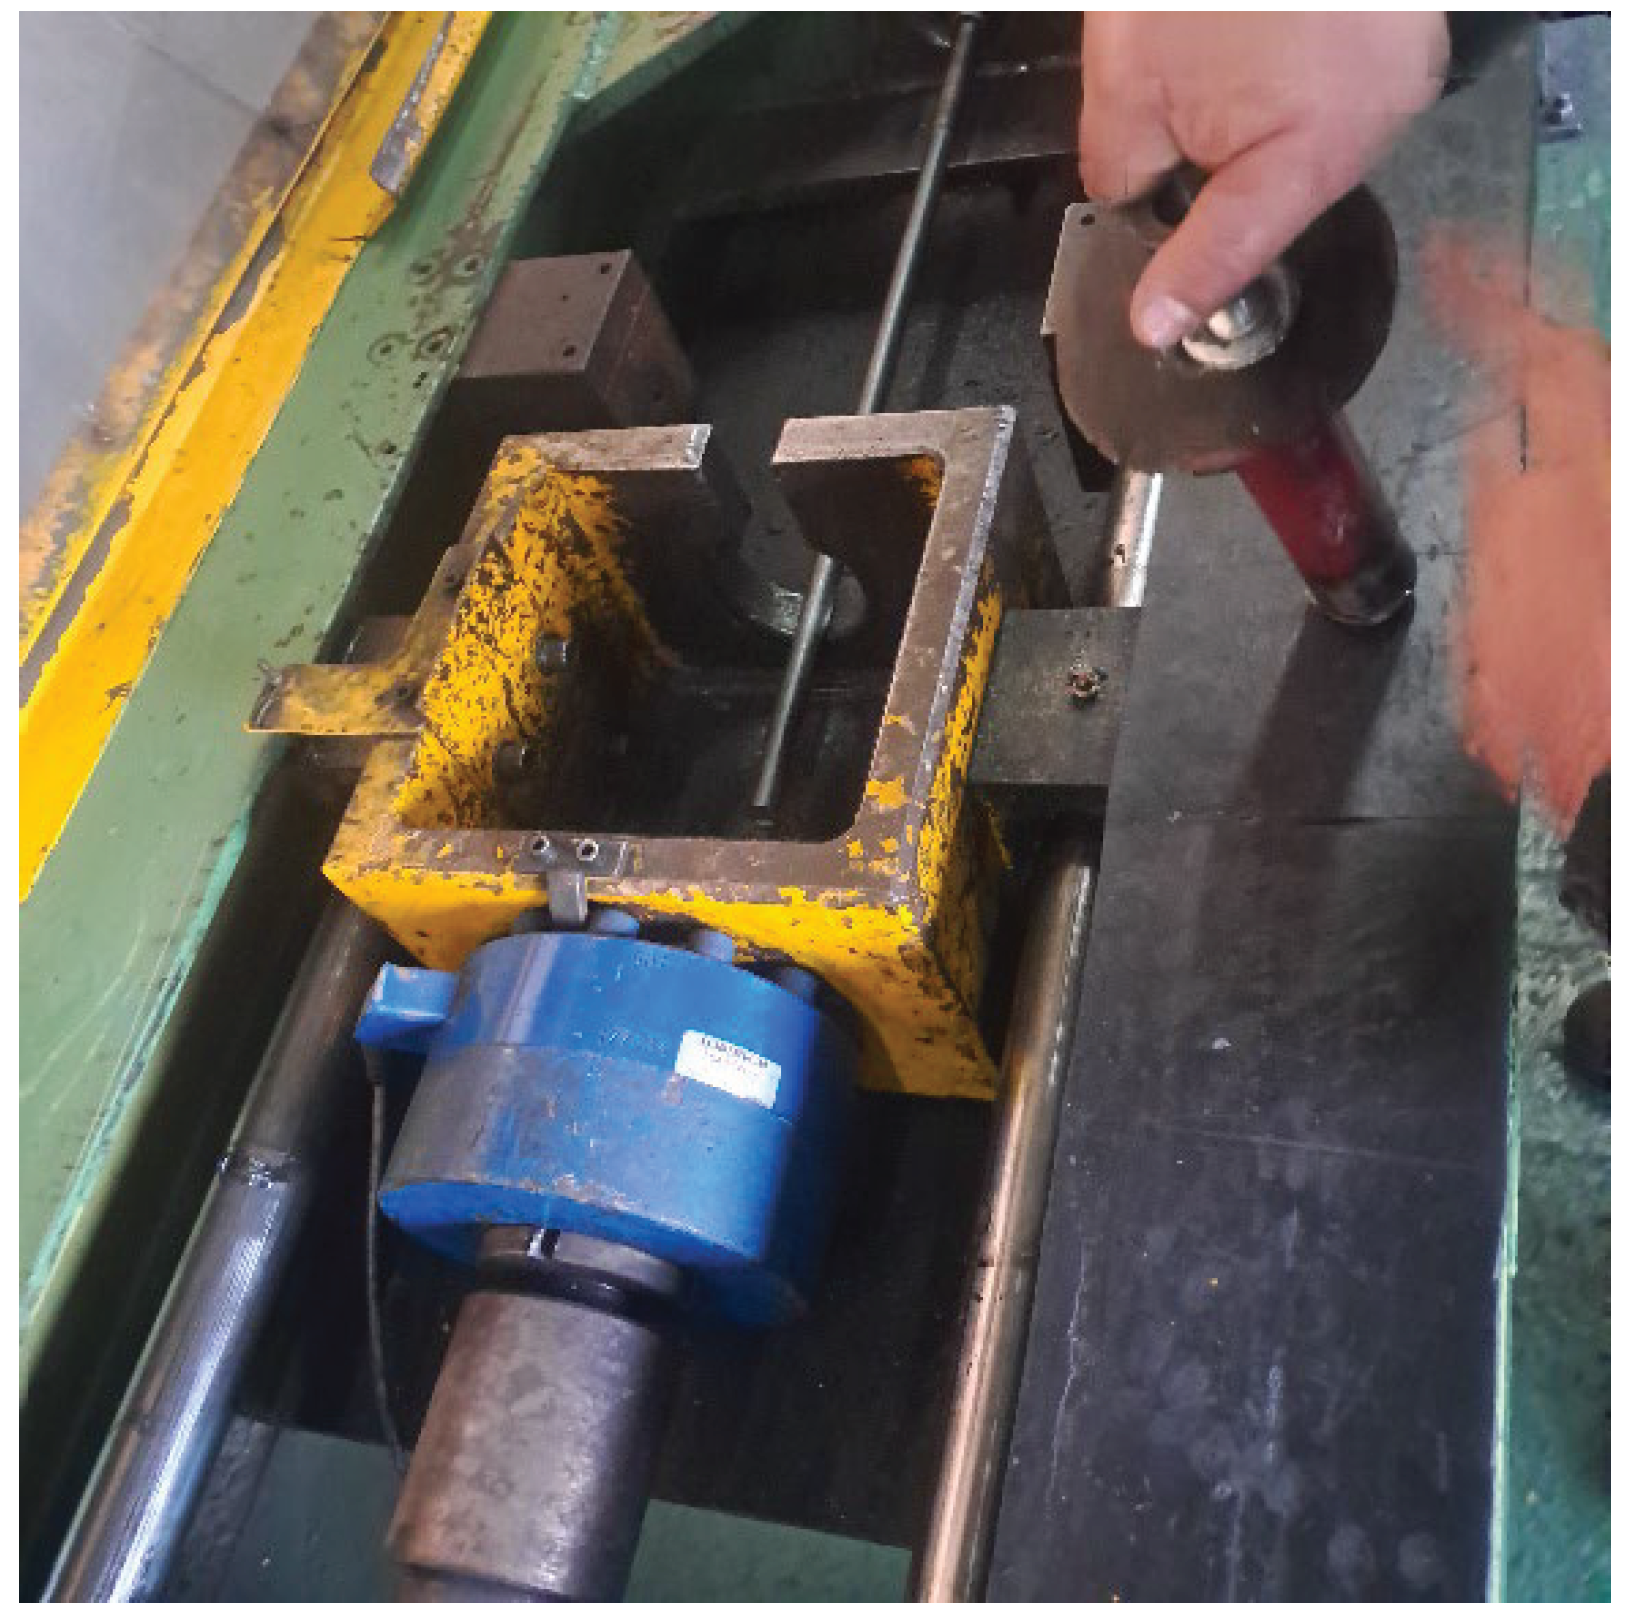
Figure 3.
Installed bolt prior to testing.
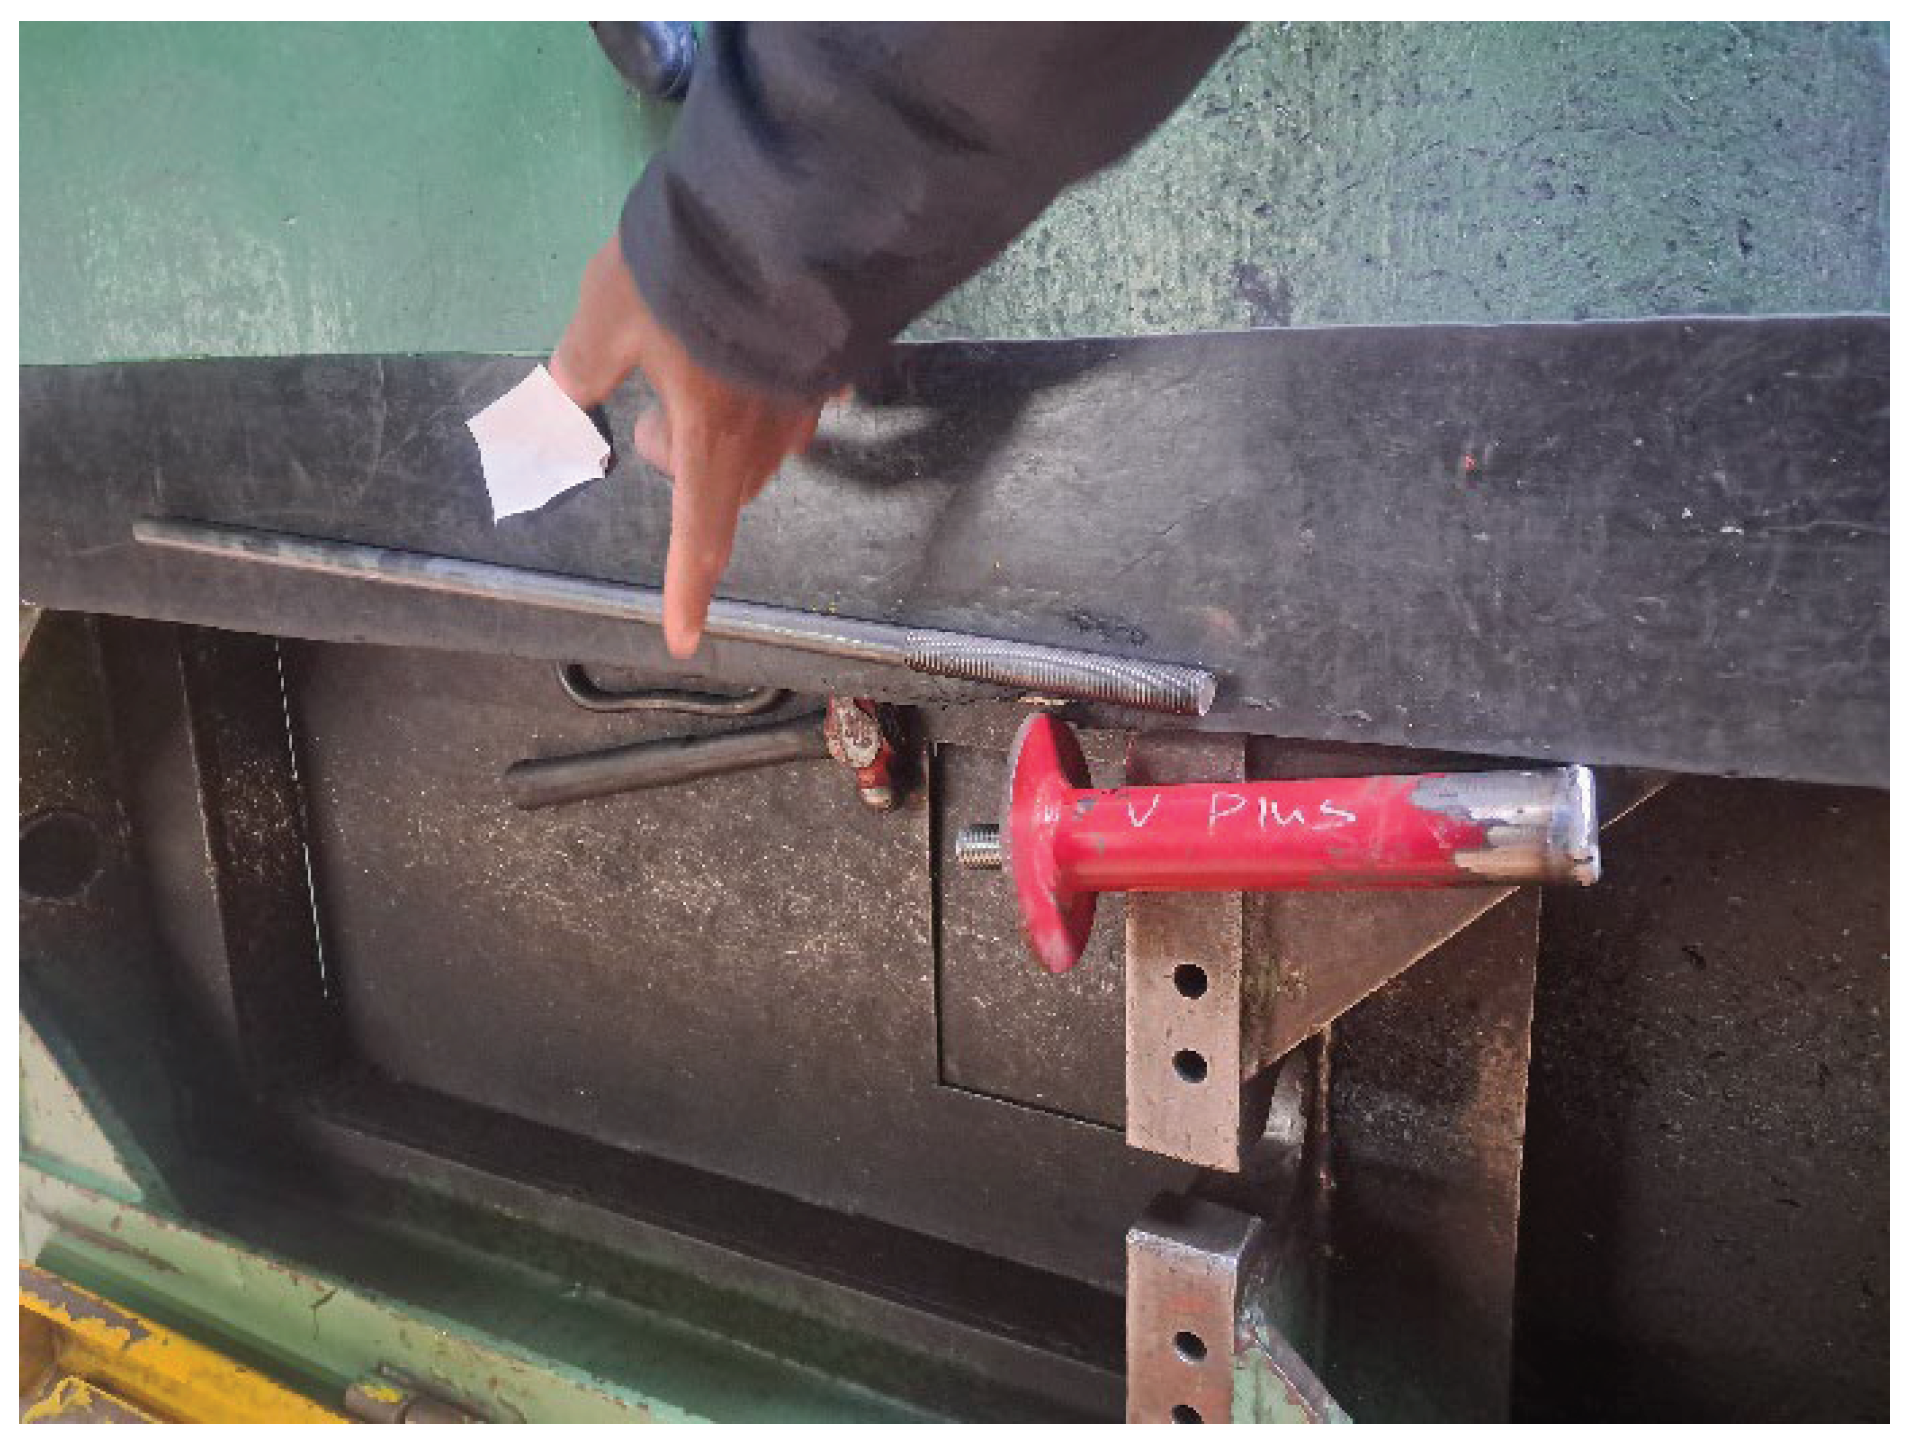
Figure 4.
Schematic of end-anchored bolt model.
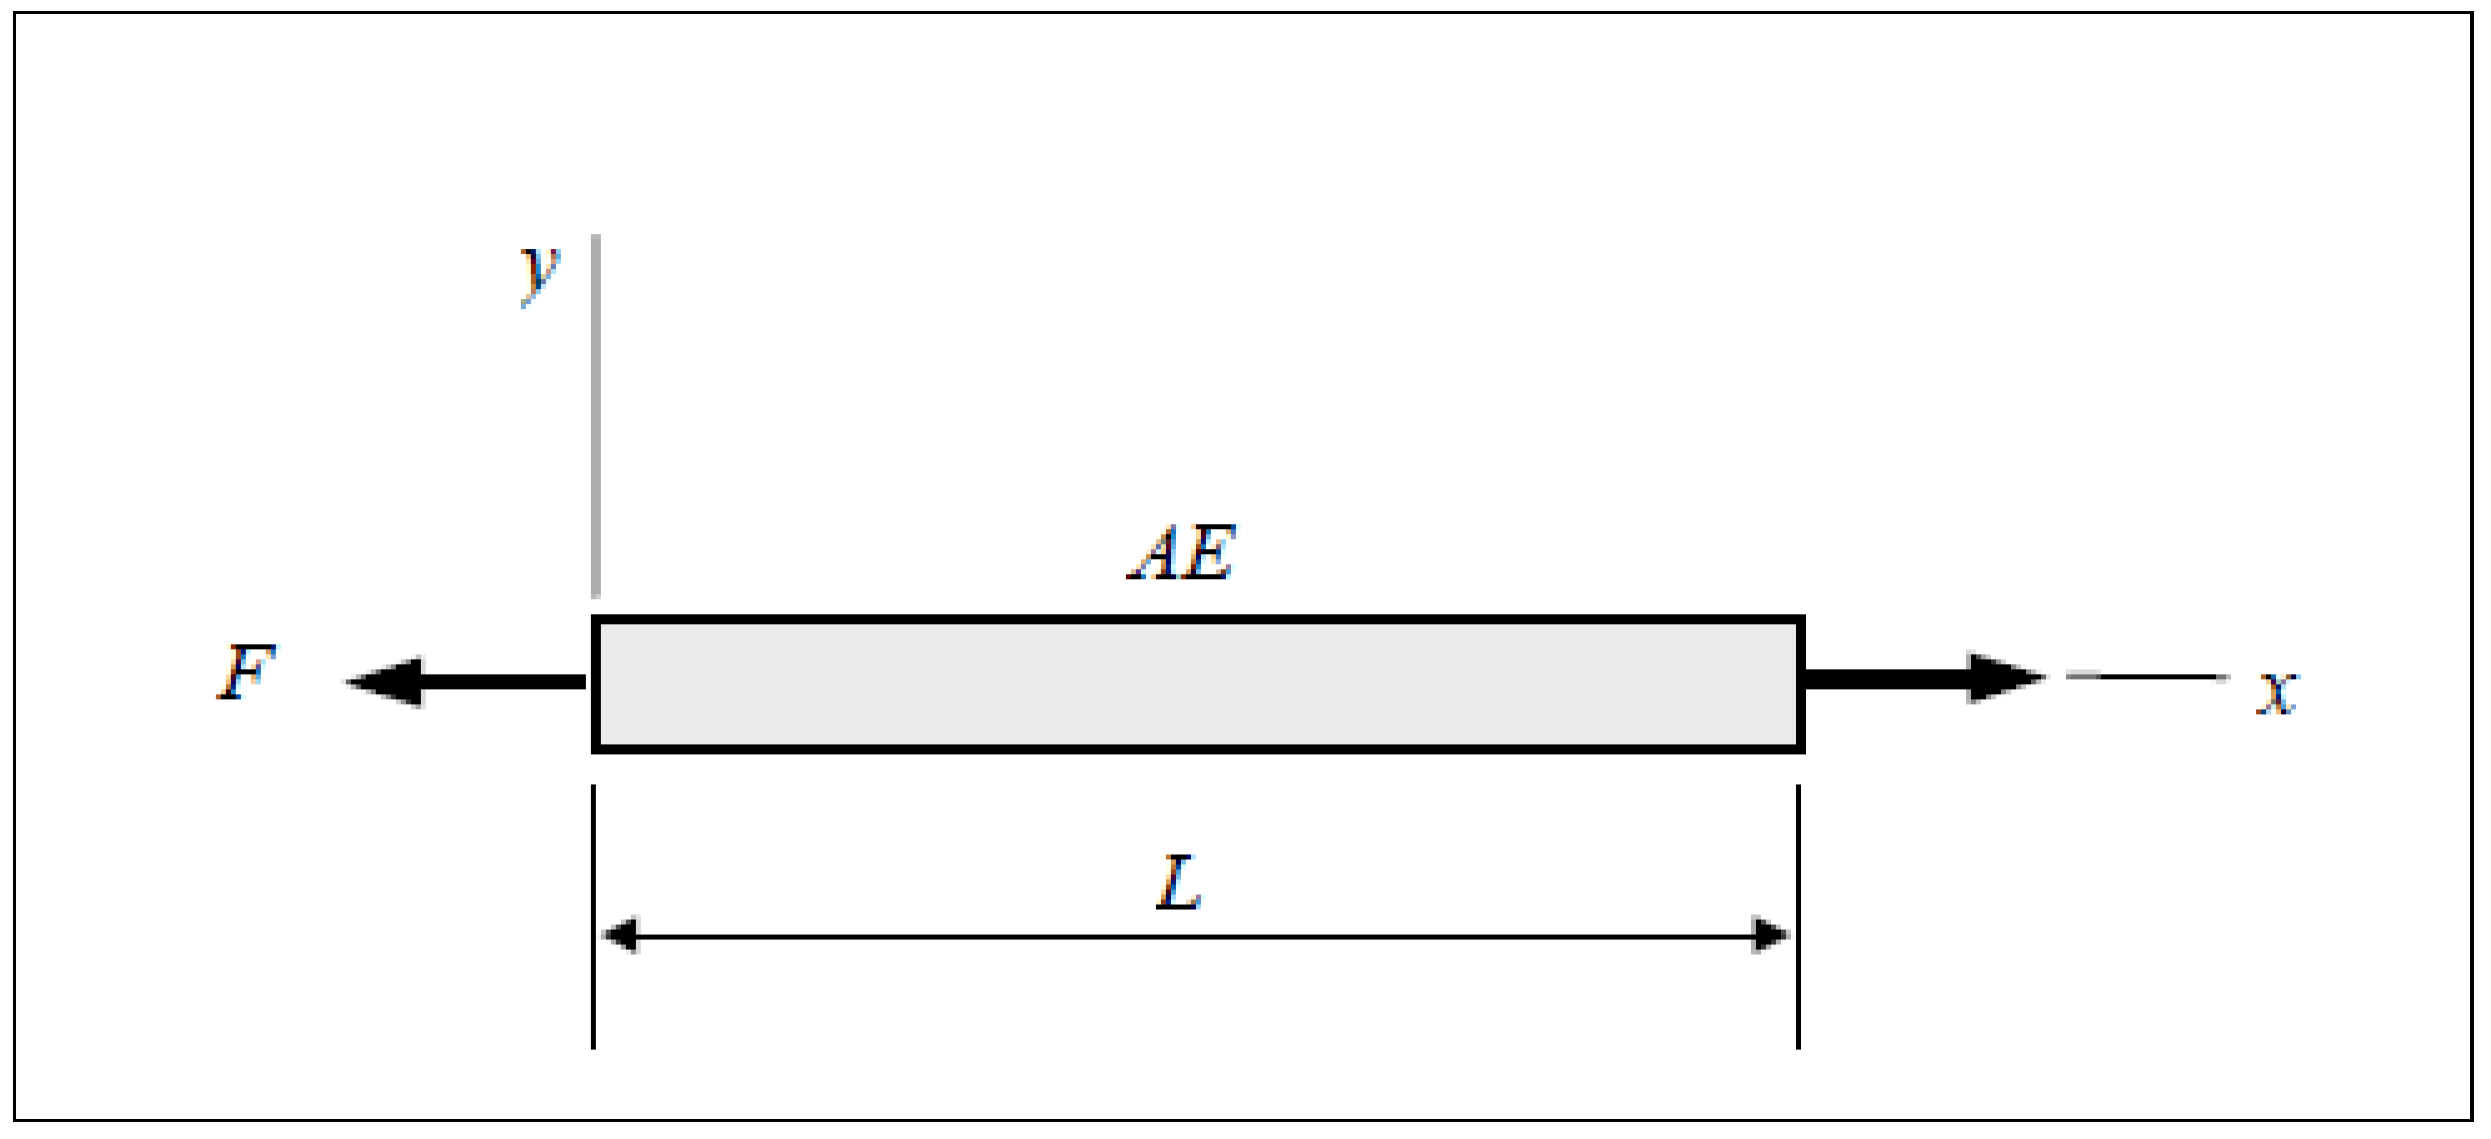
Figure 5.
Mesh discretisation of a fully bonded adhesive bolt.
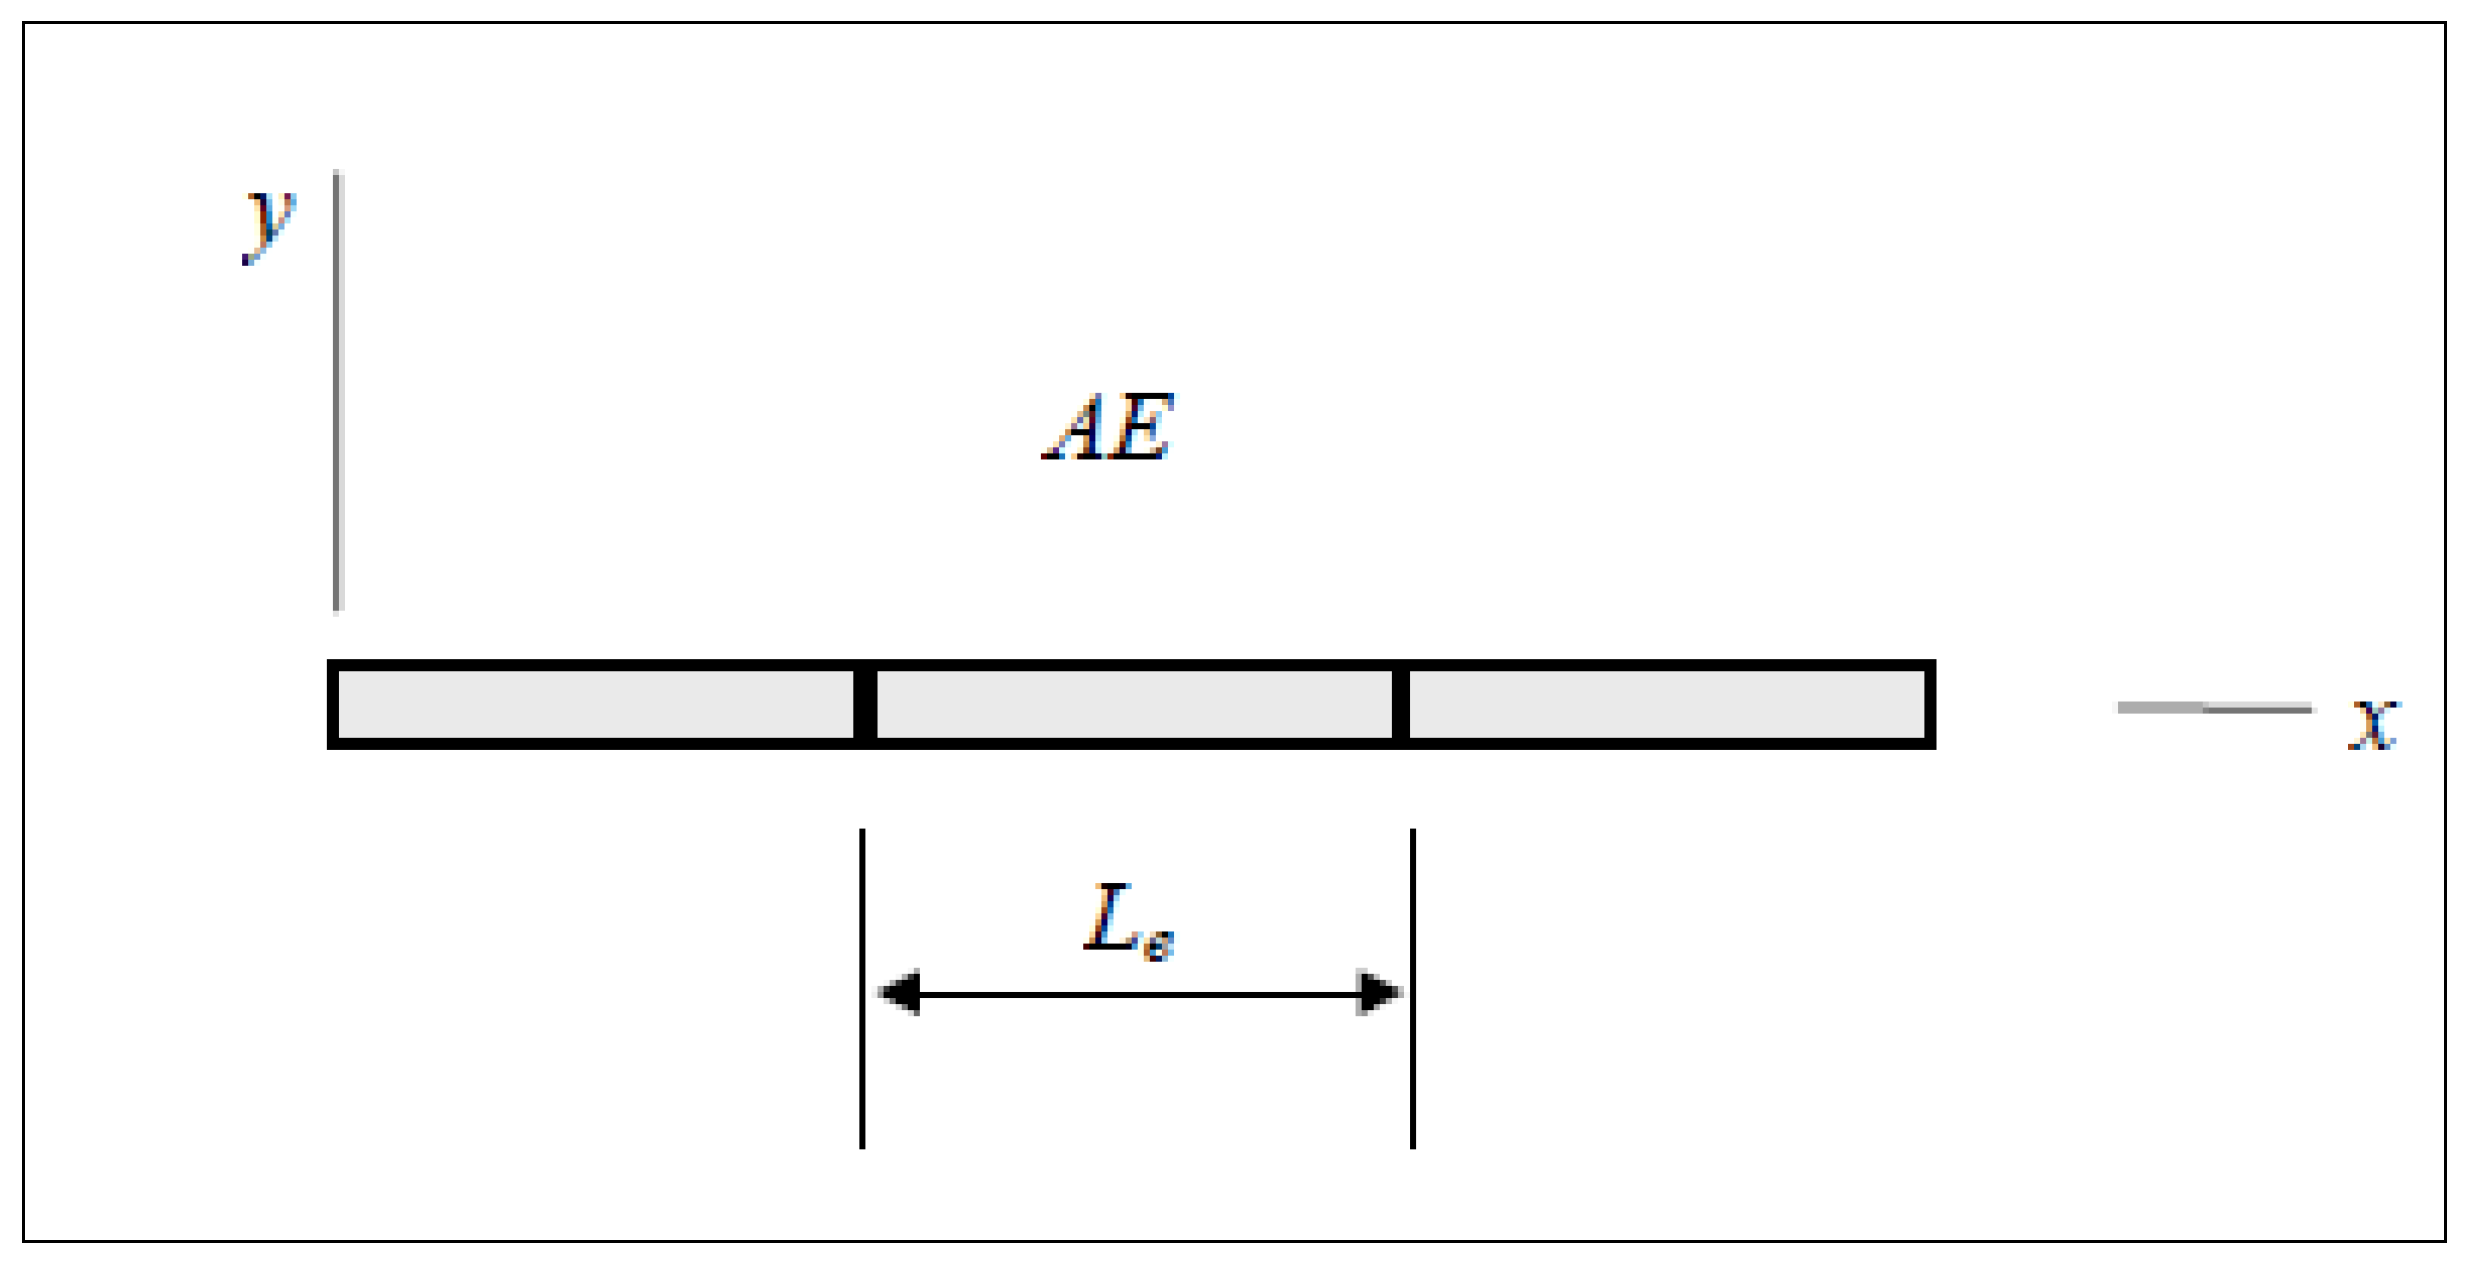
Figure 6.
Force–elongation behaviour for bolt element, showing yield and residual force plateau.
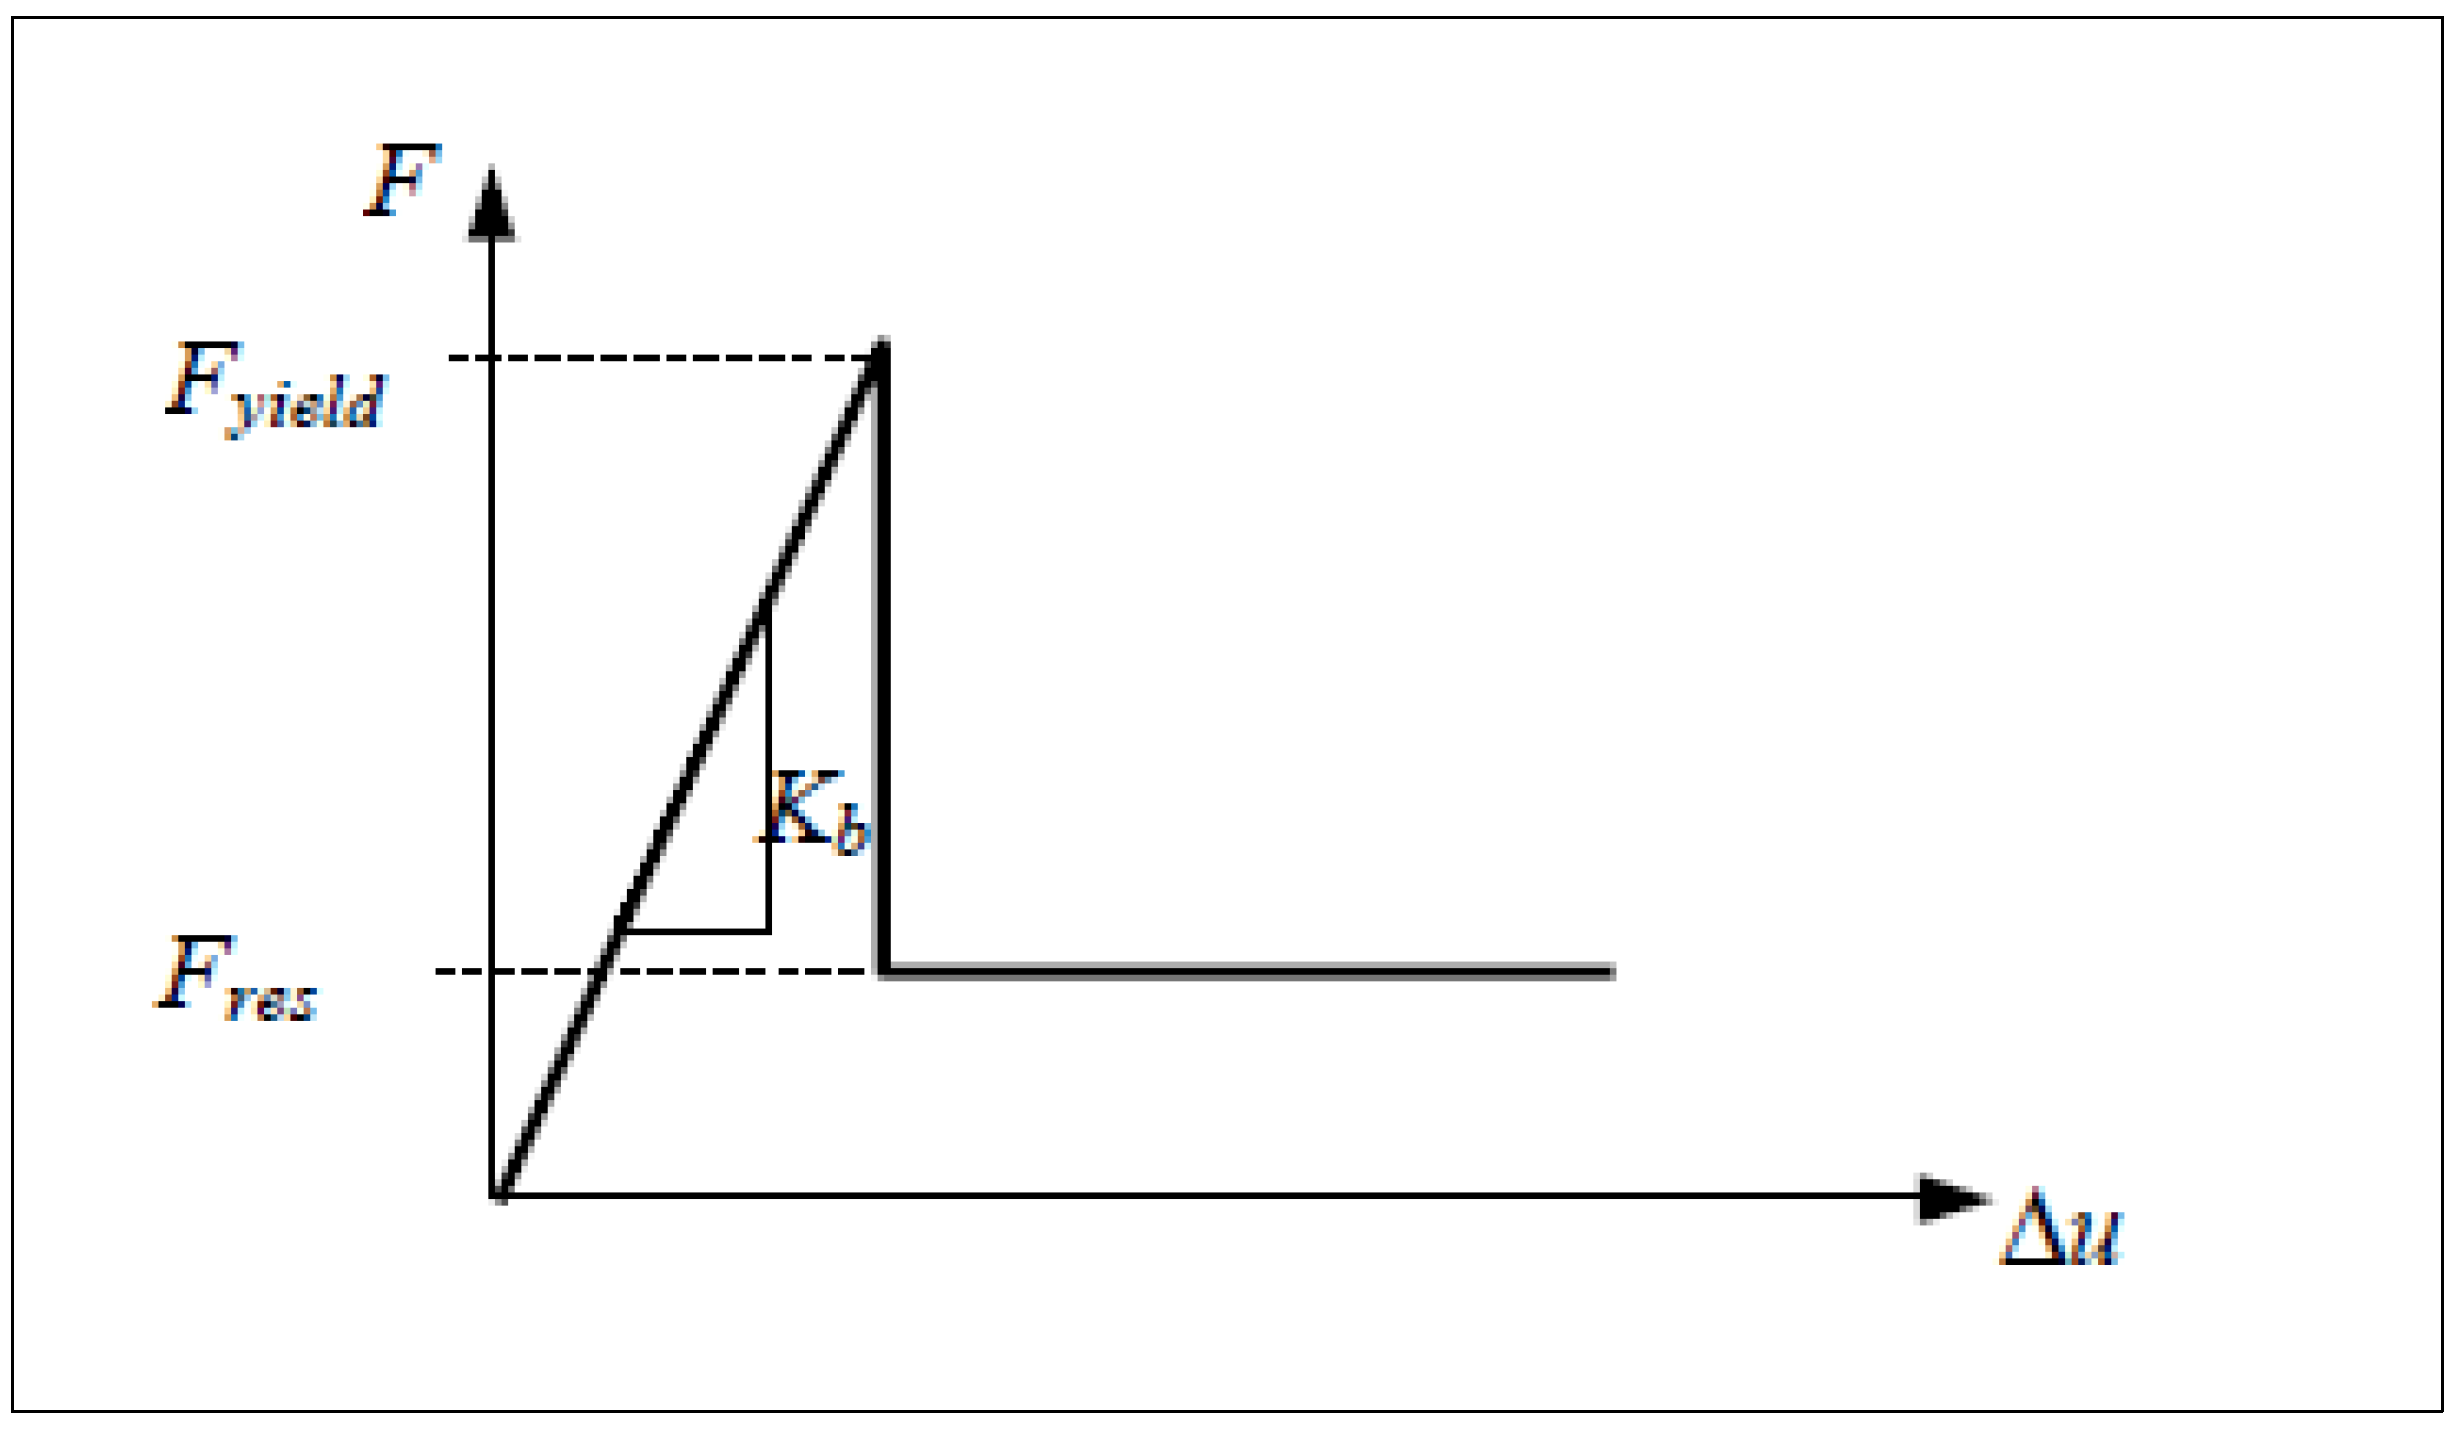
Figure 7.
Shear bolt model with displacement interaction across the grout/rock interface [51].
Figure 7.
Shear bolt model with displacement interaction across the grout/rock interface [51].
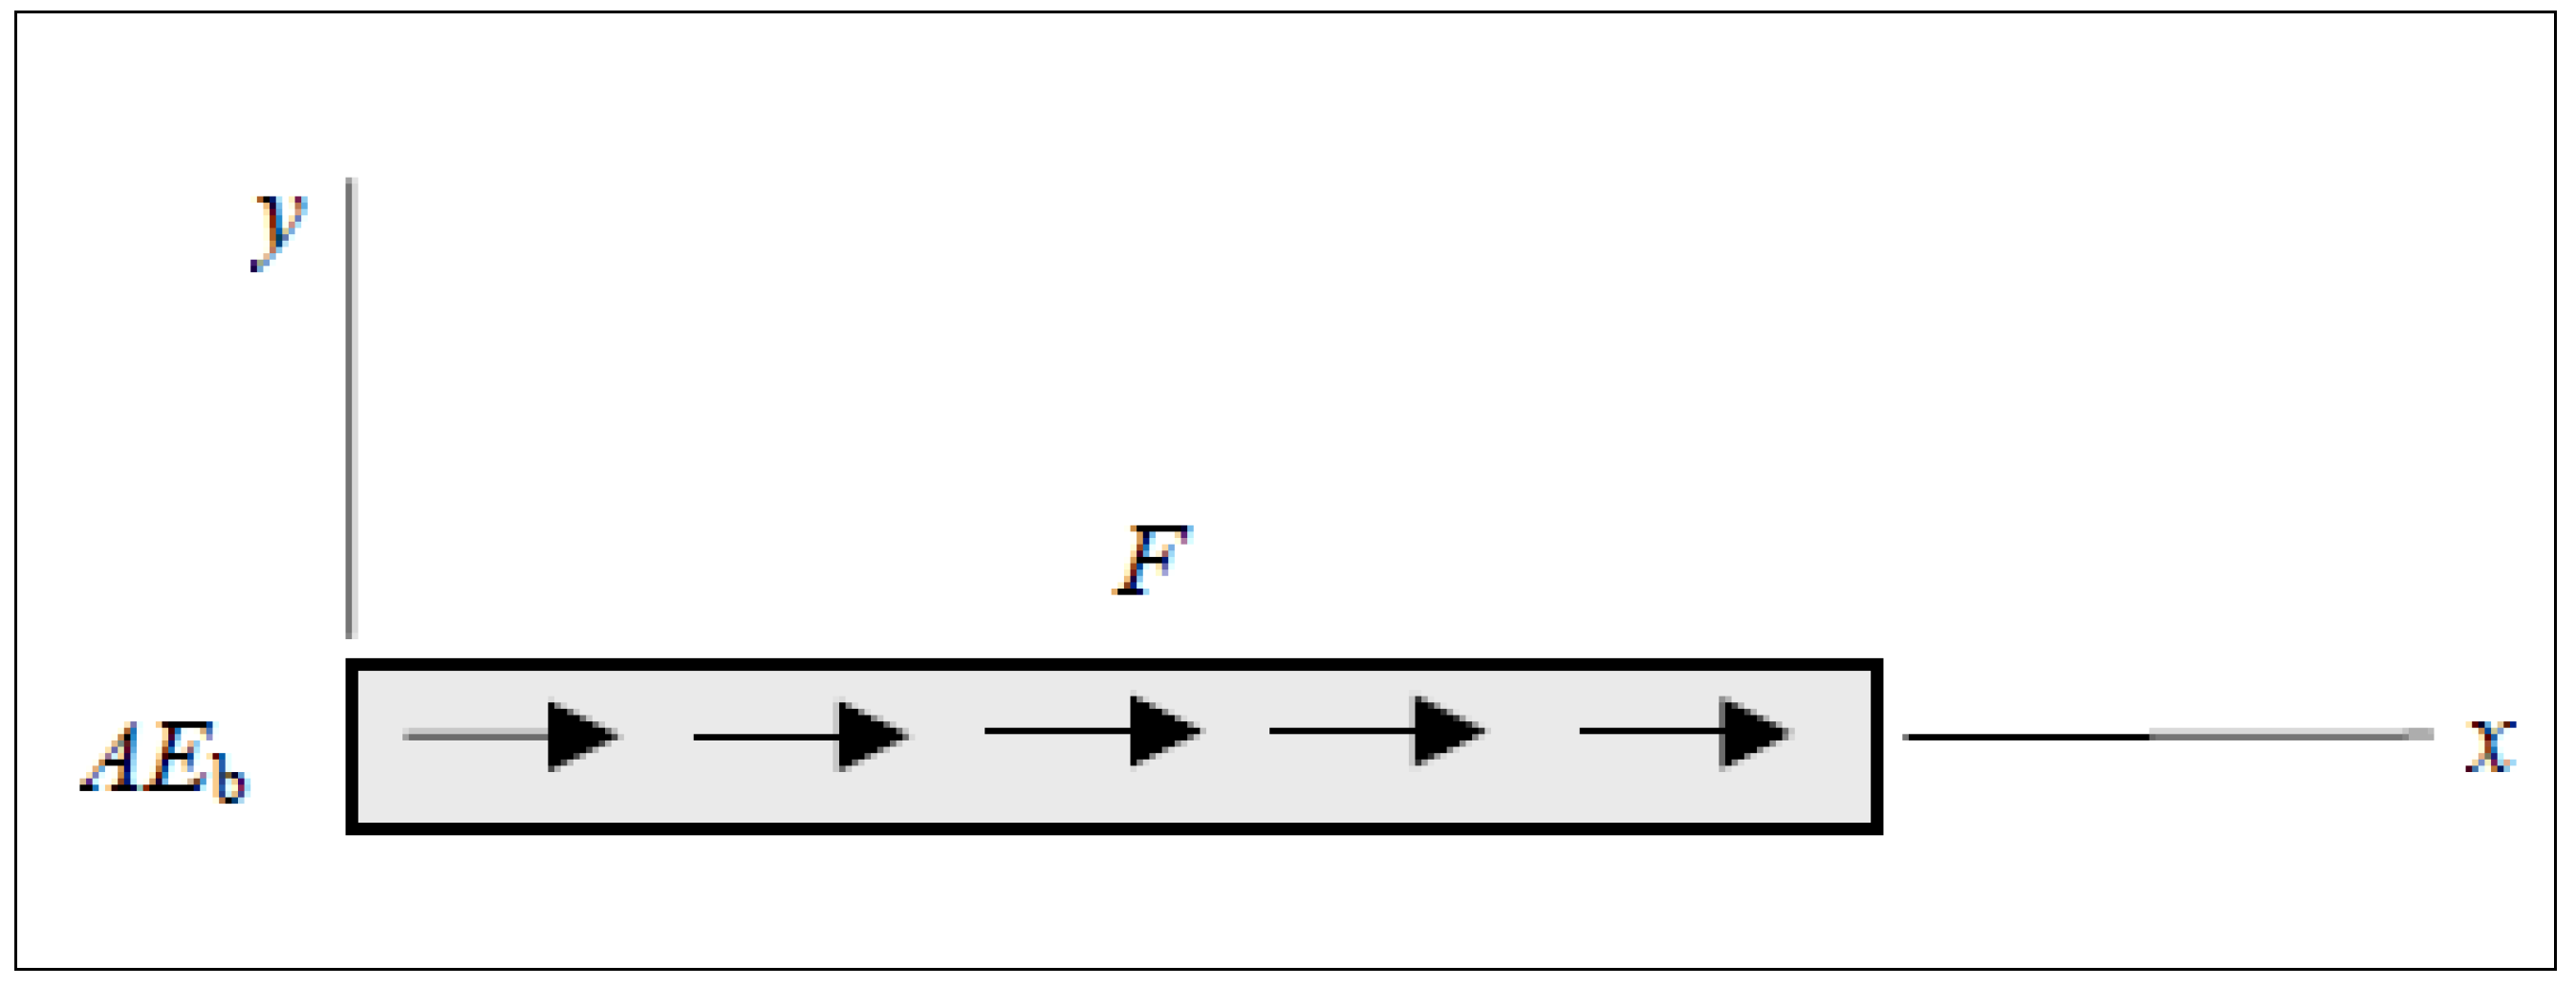
Figure 6.
Example of mesh and bolt configuration for Phase 2 simulation.
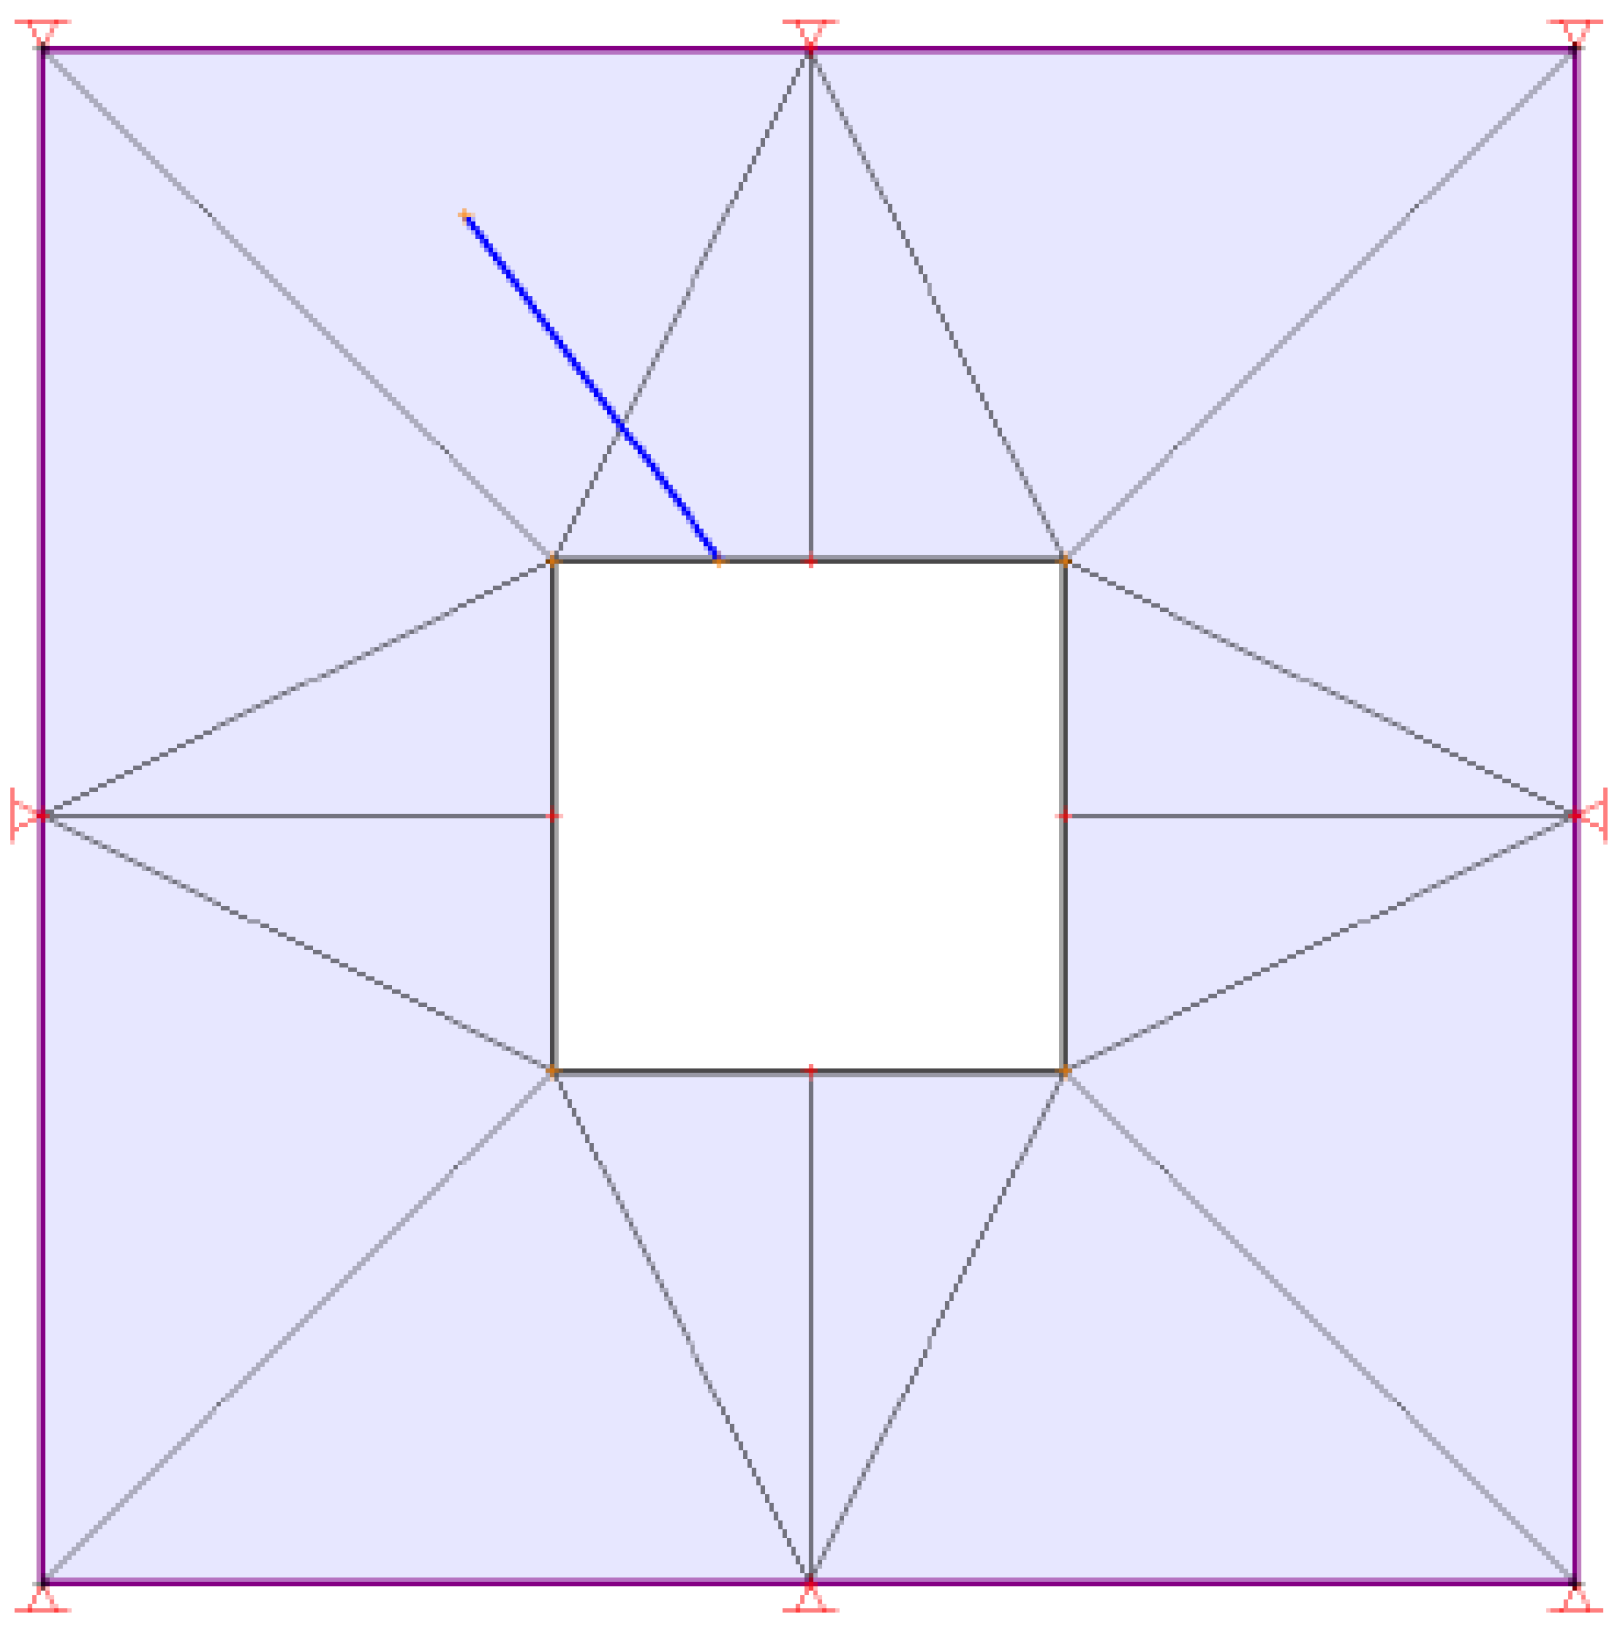
Figure 7.
Simulated force distribution and displacement field in the Phase 2 model.
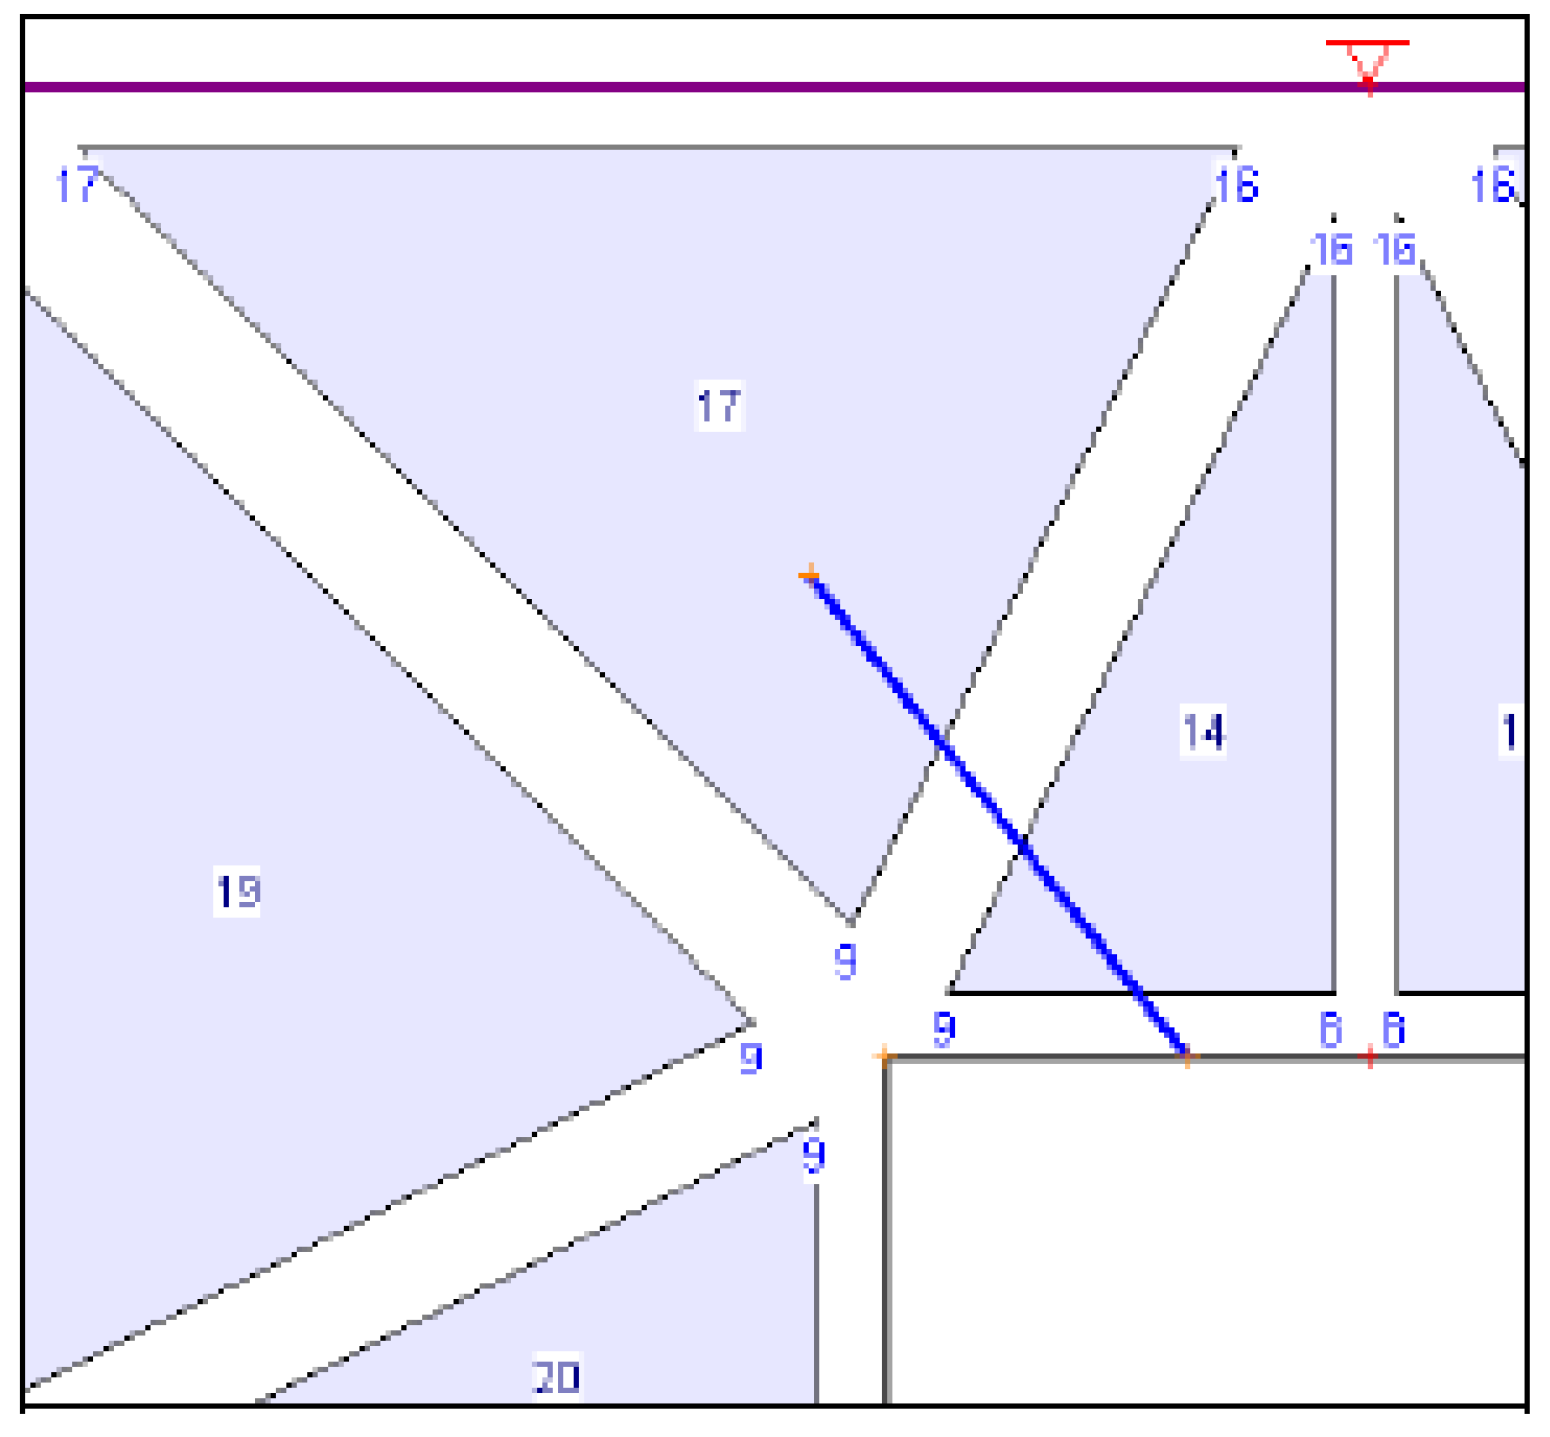
Figure 8.
Tunnel and pillar geometry with applied 3-noded mesh in Phase 2.
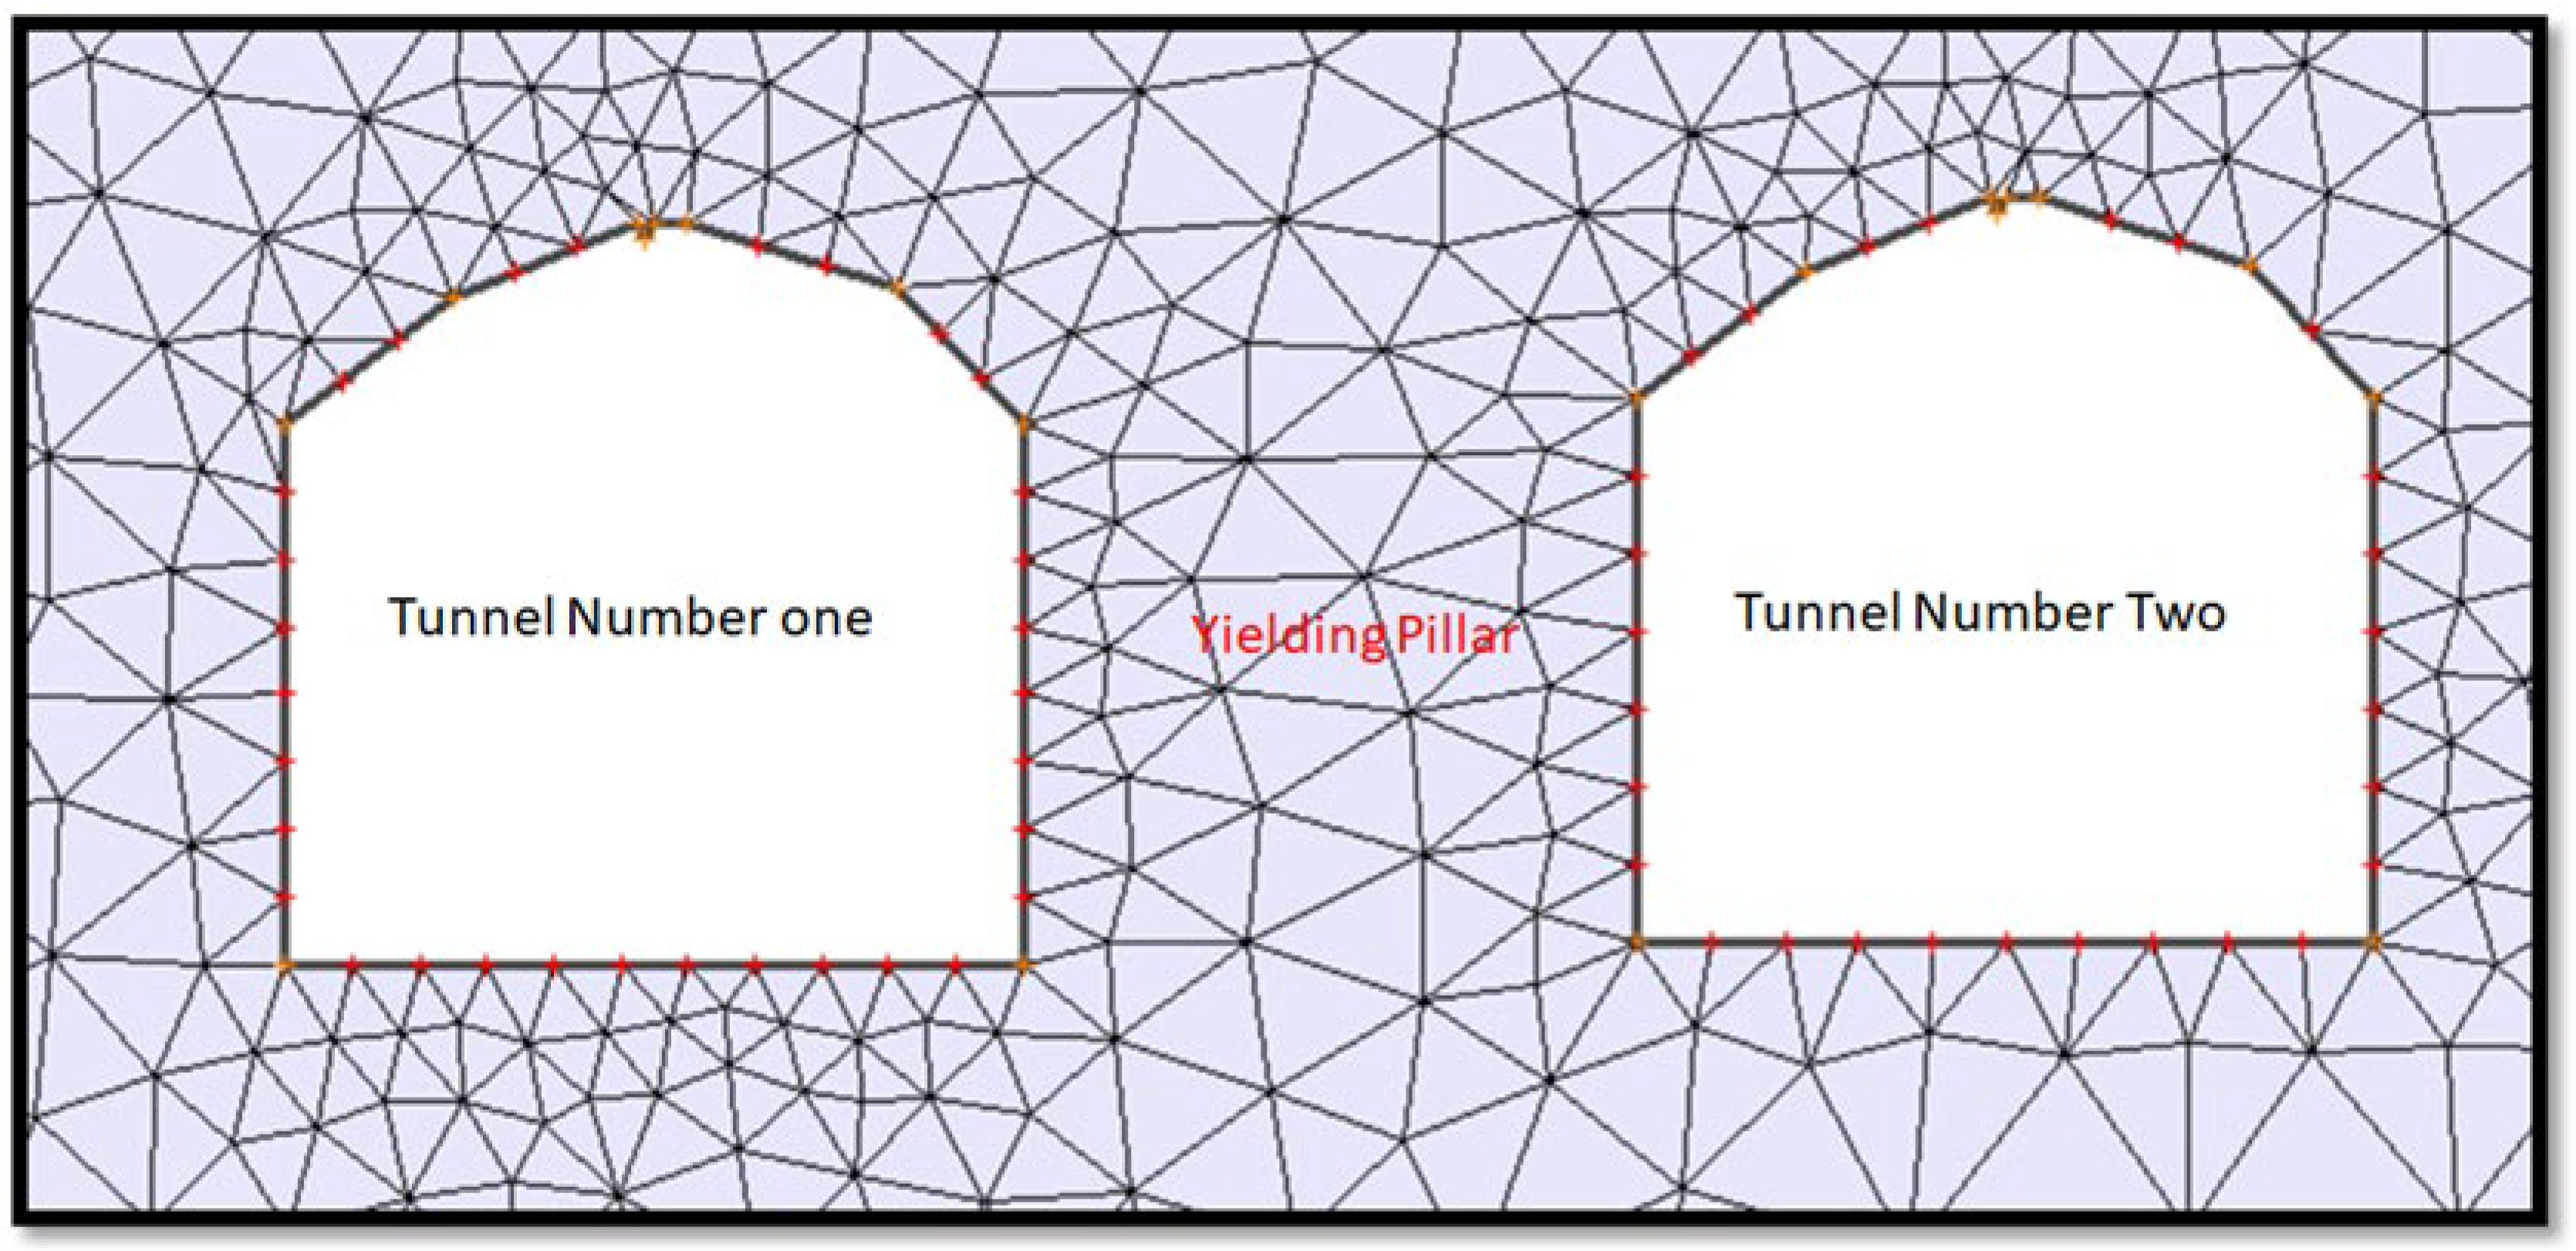
Figure 10.
Stereonet of simulated joint sets for surface excavation model.
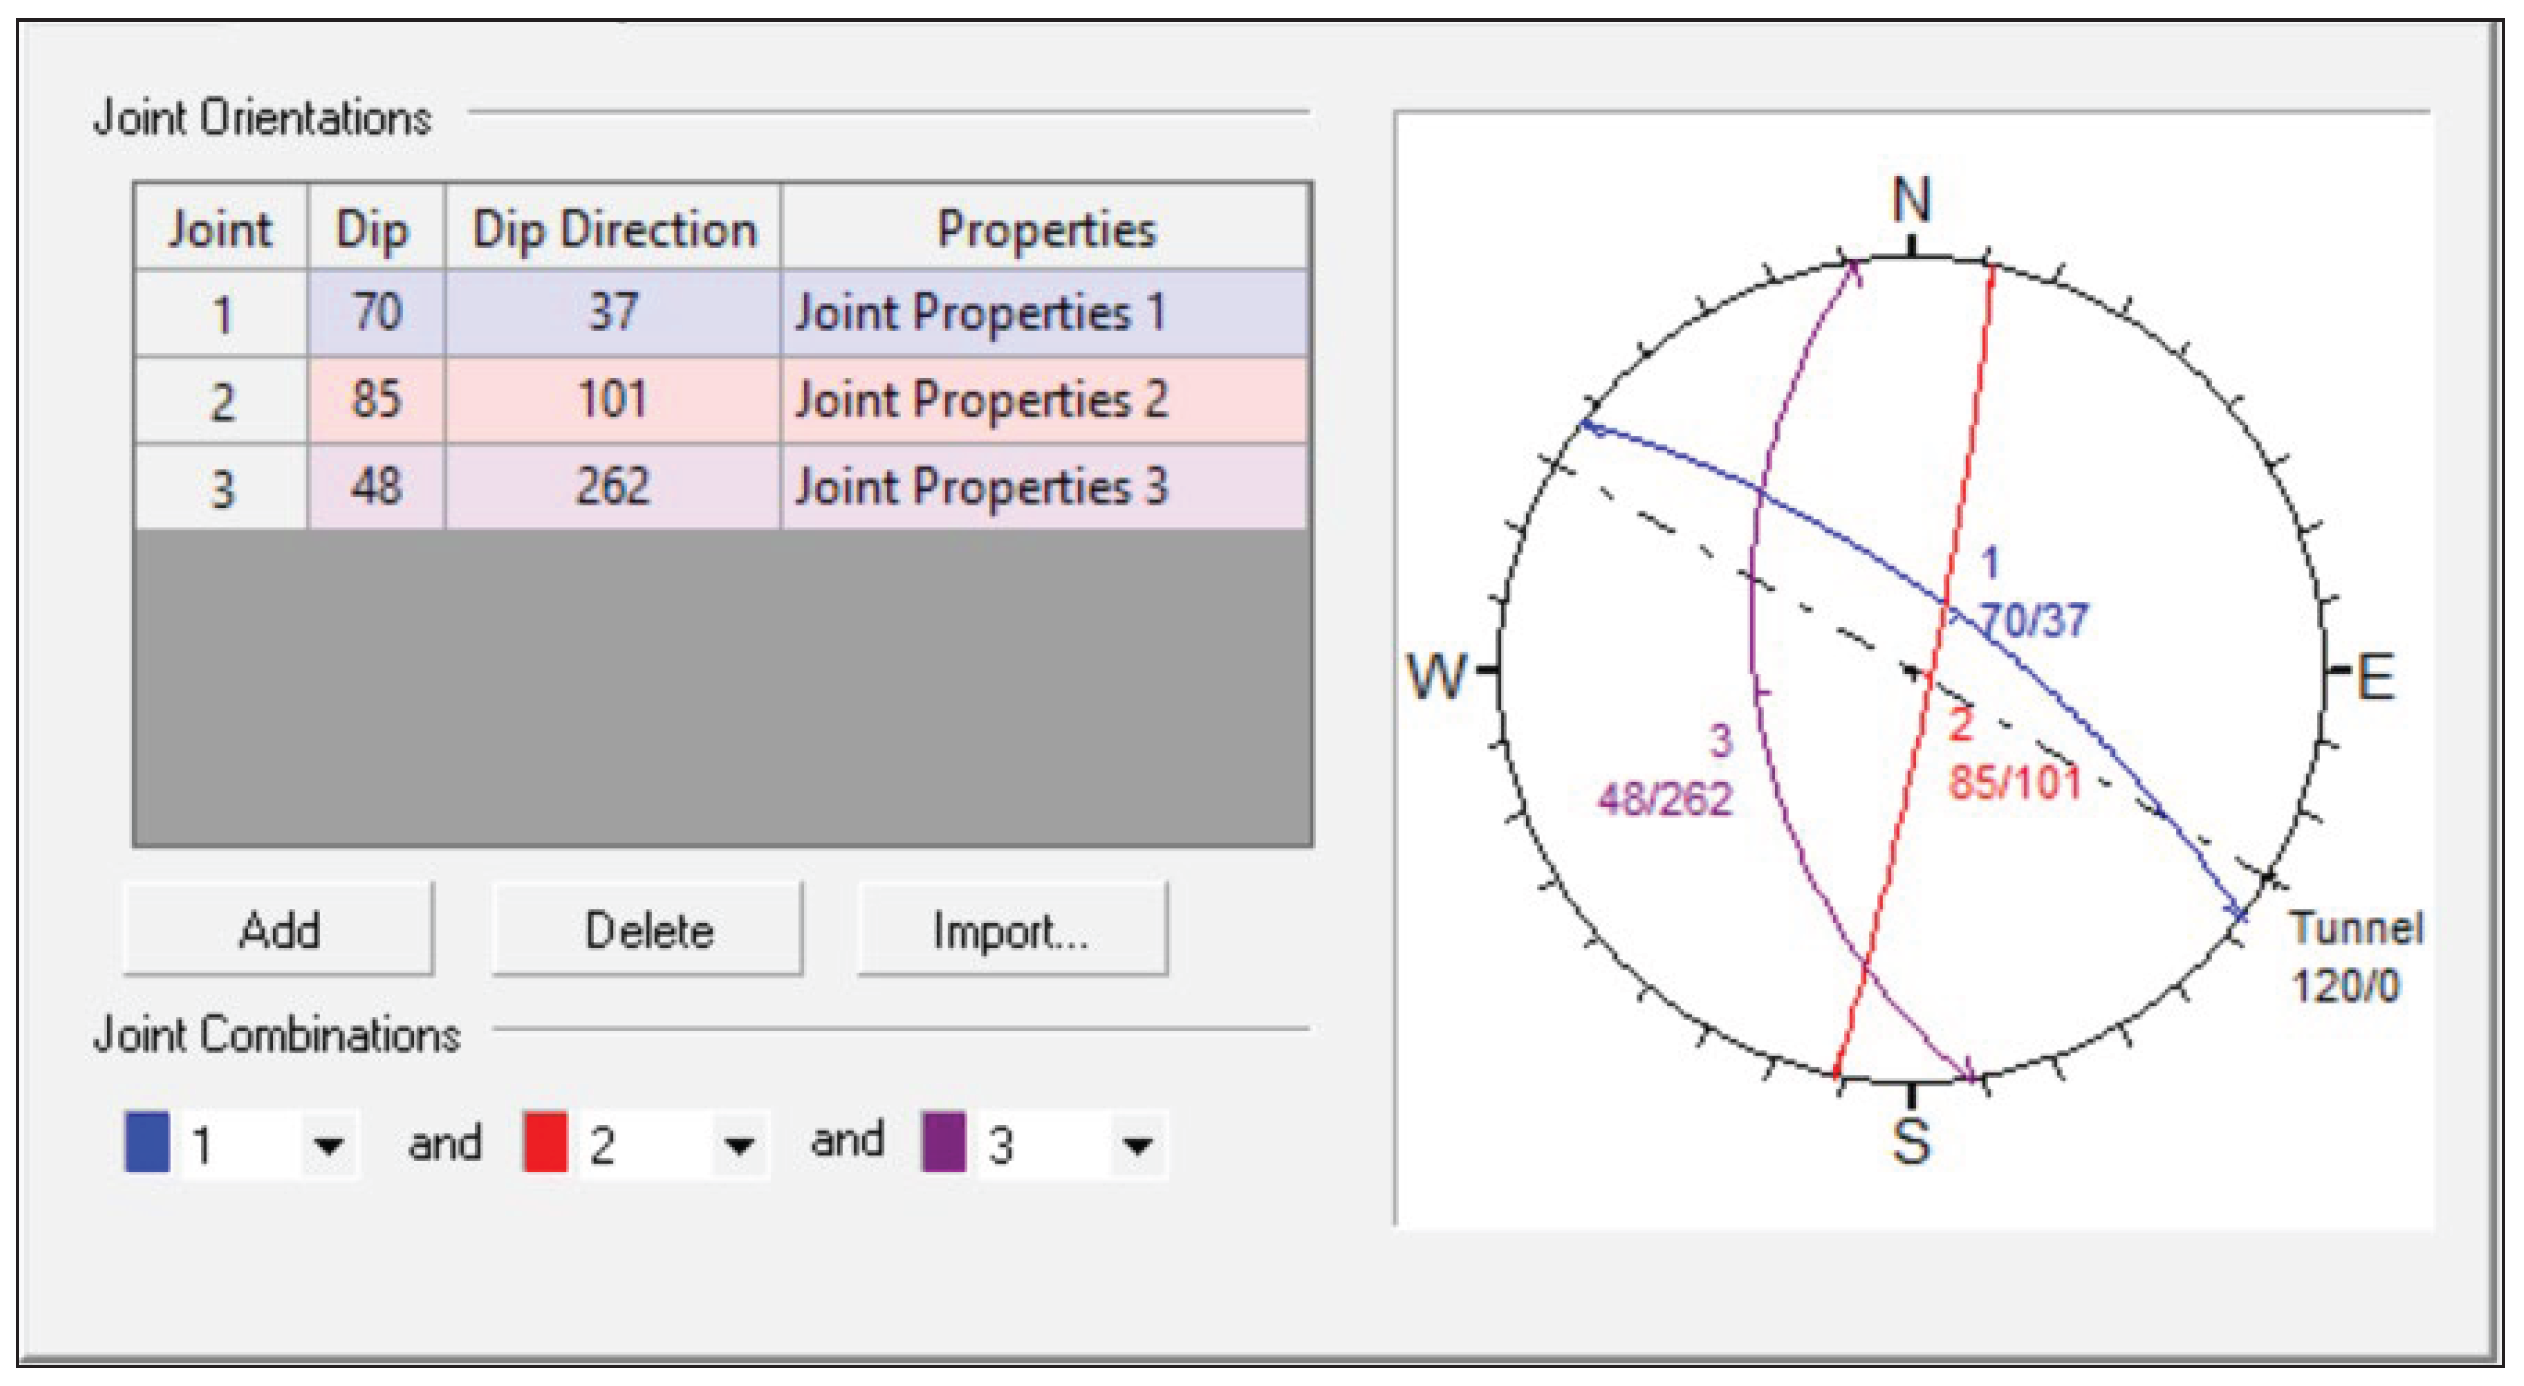
Figure 11.
Summary of load-displacement curves for all vinyl ester and epoxy bolts in the lab and in situ tests, (a) Summary of load-displacement curves for vinyl ester & epoxy bolts (in situ results) and (b) Summary of load-displacement curves for vinyl ester & epoxy bolts (lab results).
Figure 11.
Summary of load-displacement curves for all vinyl ester and epoxy bolts in the lab and in situ tests, (a) Summary of load-displacement curves for vinyl ester & epoxy bolts (in situ results) and (b) Summary of load-displacement curves for vinyl ester & epoxy bolts (lab results).
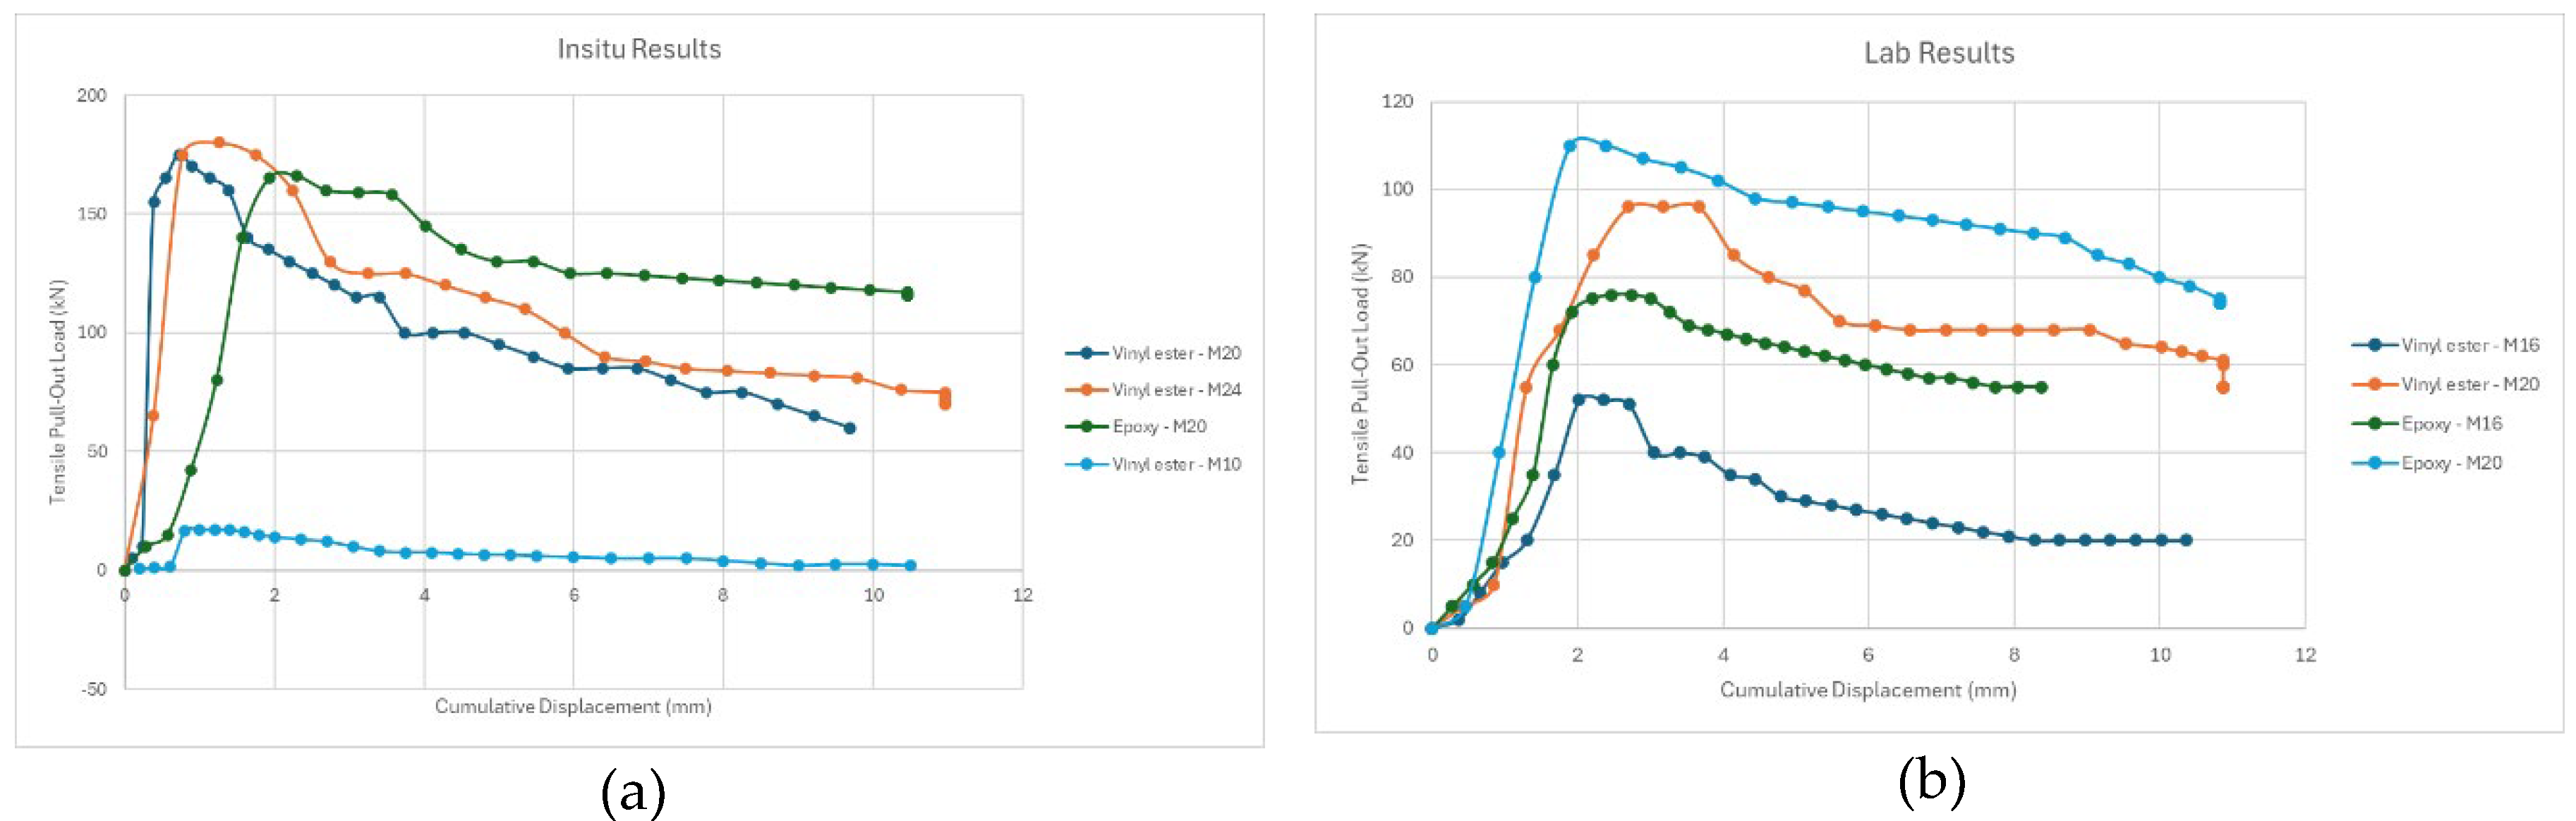
Figure 12.
Load–displacement response of an M16 vinyl-ester bolt in intact rock, showing stiffness gain, peak capacity and post-peak softening.
Figure 12.
Load–displacement response of an M16 vinyl-ester bolt in intact rock, showing stiffness gain, peak capacity and post-peak softening.
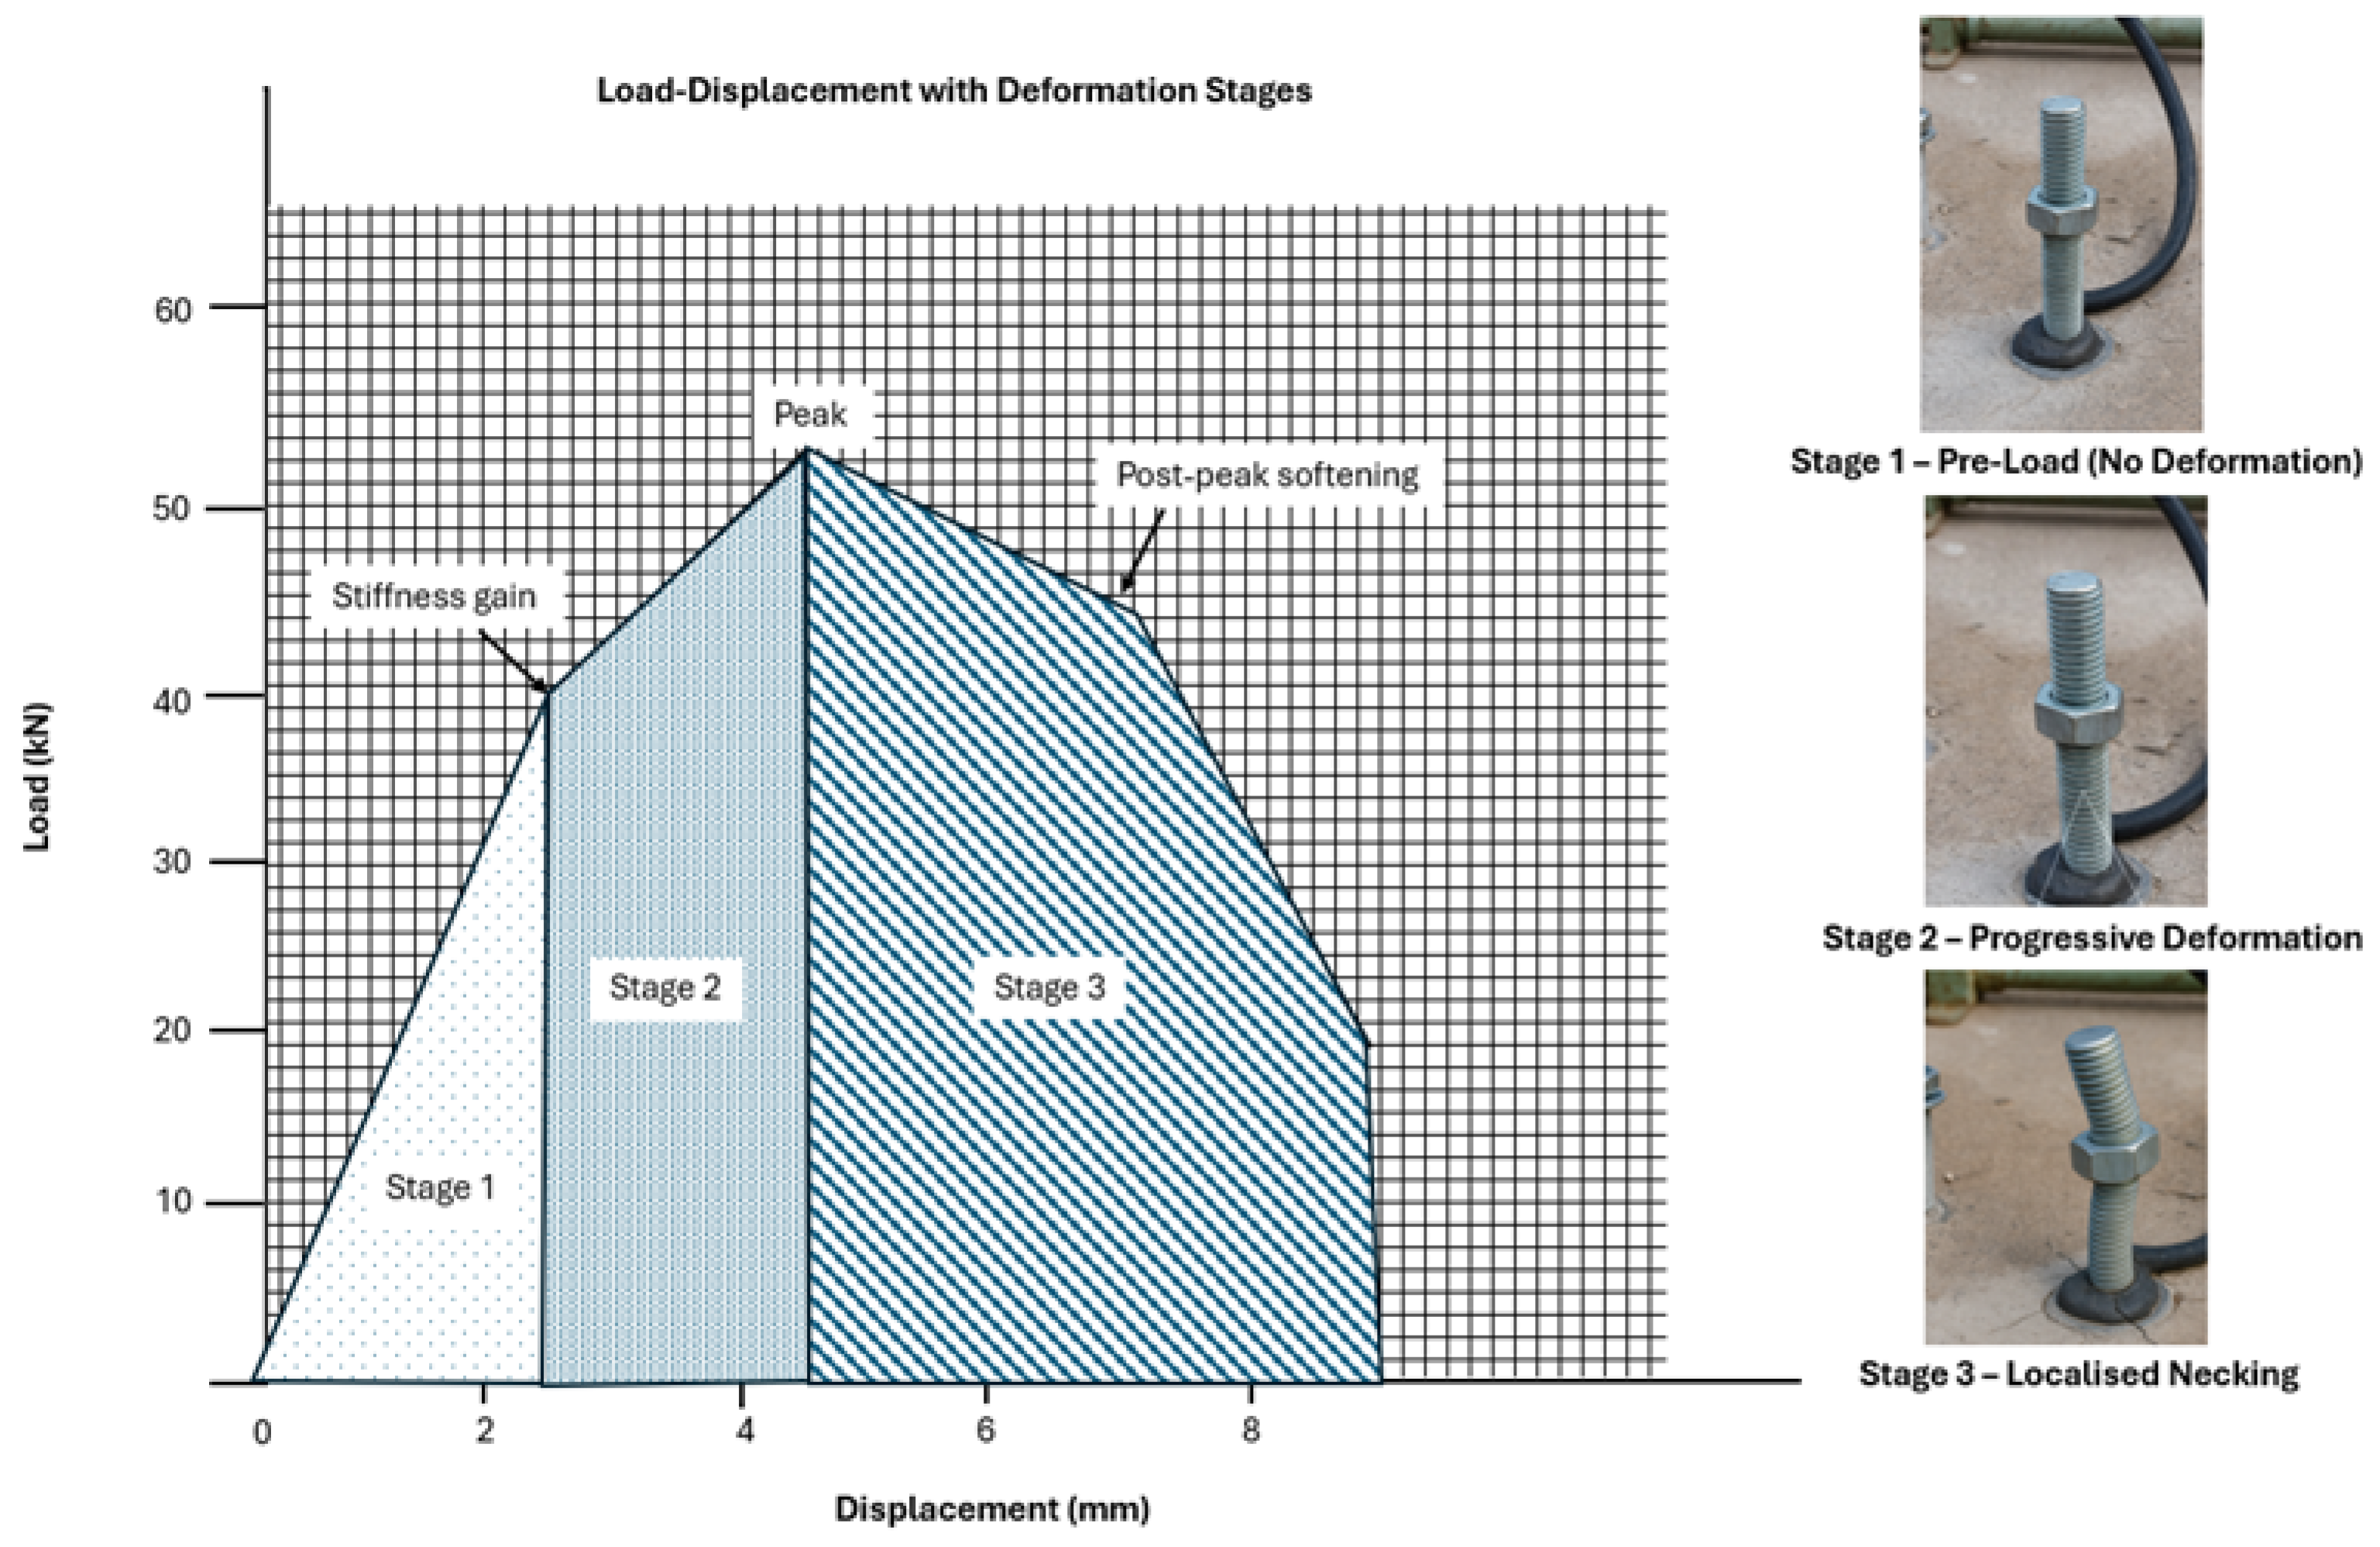
Figure 13.
(a) Mean tensile capacity as a function of curing time. Error bars show ±1 SD (n = 3). Vinyl-ester systems show superior early strength compared to epoxy. (b) Shear capacity development over curing time for six anchor configurations.
Figure 13.
(a) Mean tensile capacity as a function of curing time. Error bars show ±1 SD (n = 3). Vinyl-ester systems show superior early strength compared to epoxy. (b) Shear capacity development over curing time for six anchor configurations.
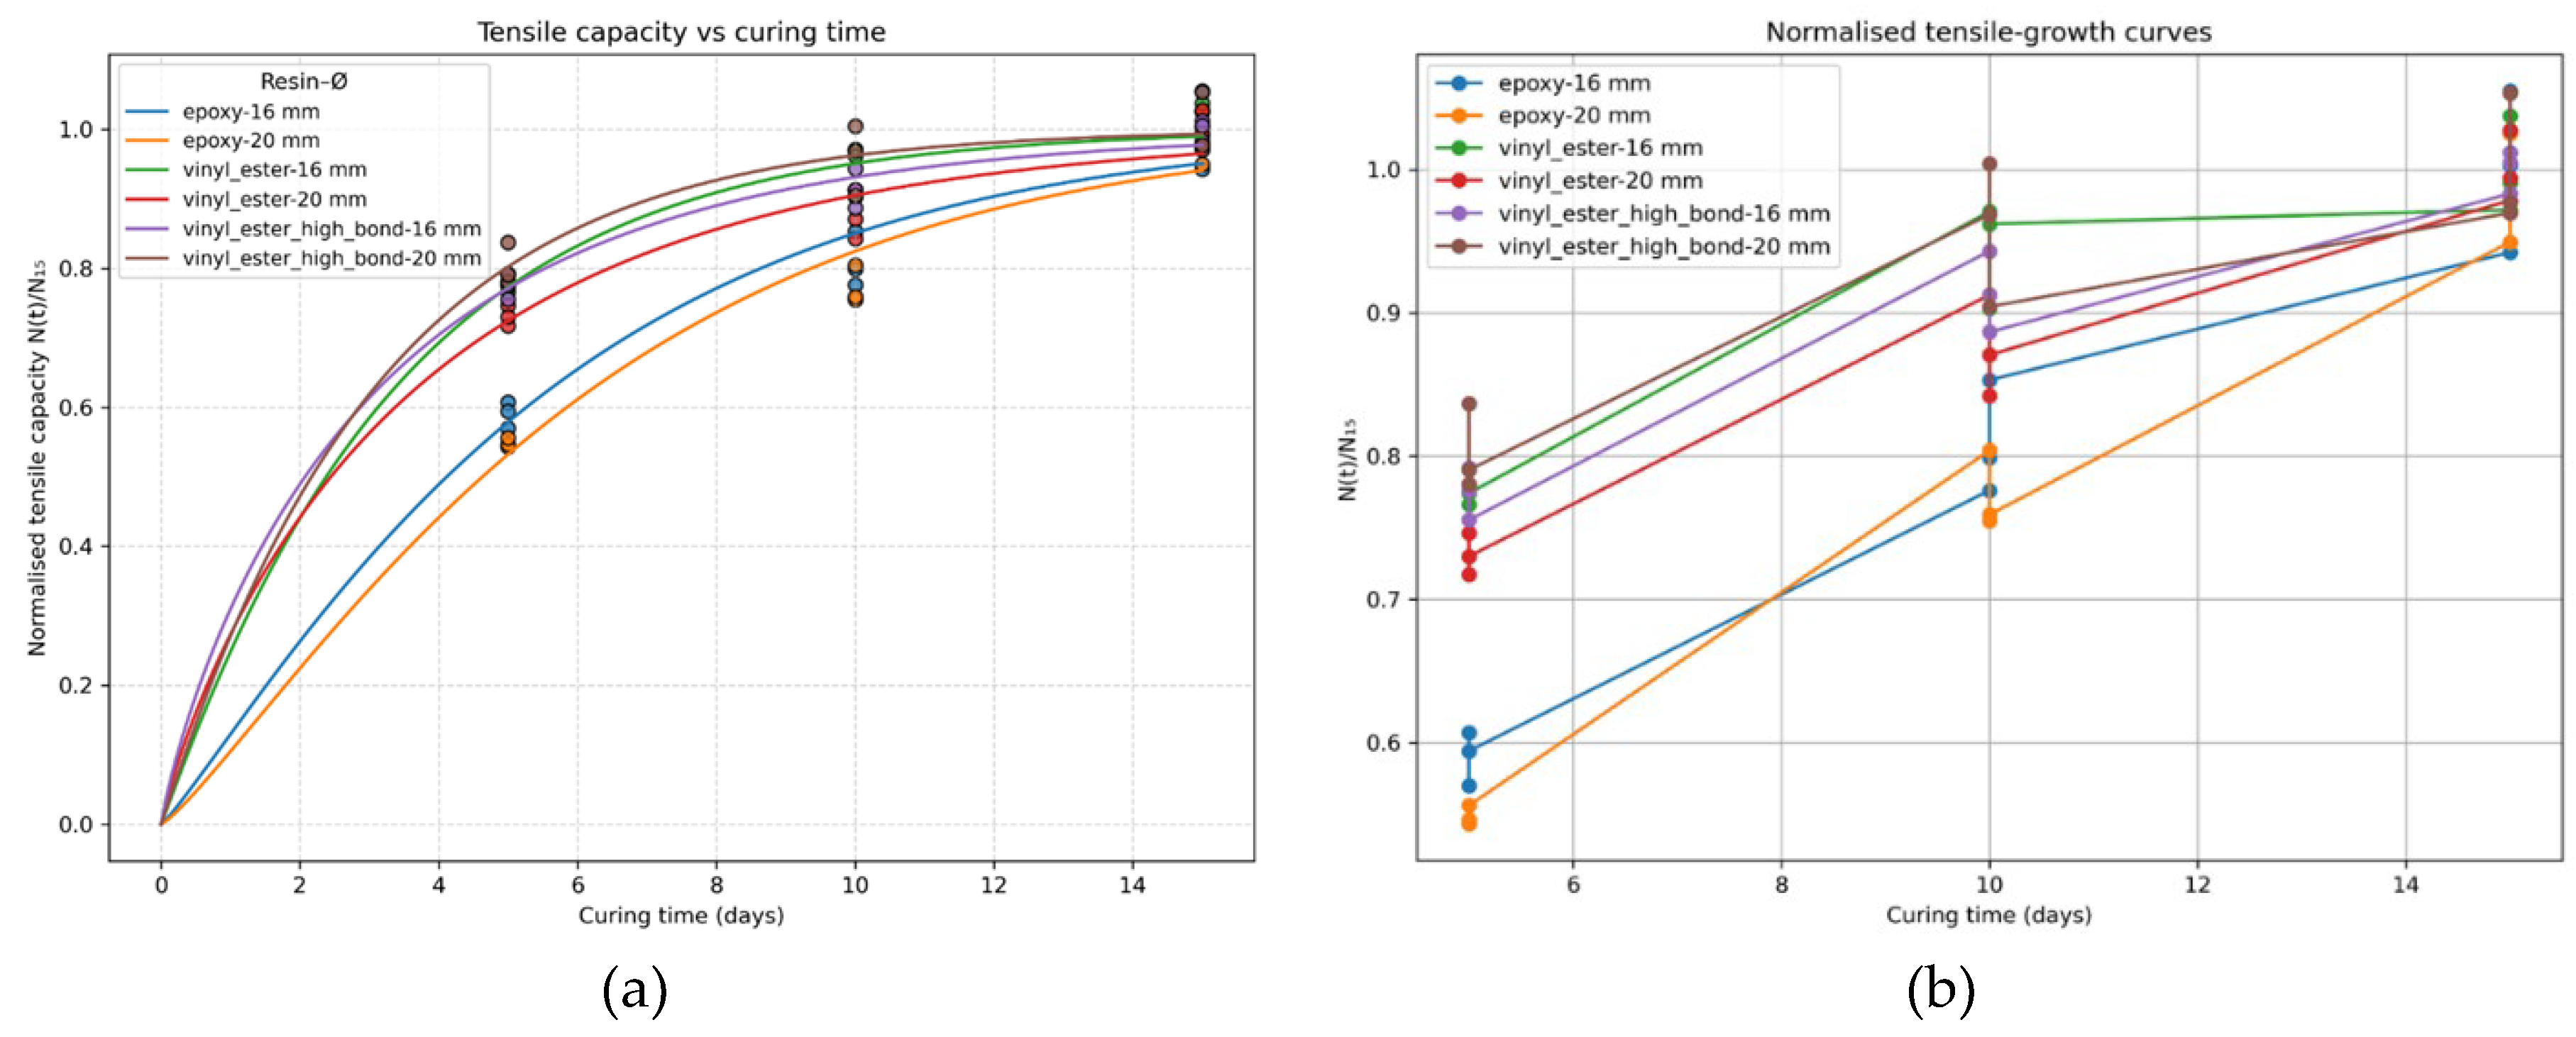
Figure 14.
Distribution of peak pull-out forces for adhesive-bonded bolts in the field, comparing epoxy mortar (fractured rock) and vinyl ester resin (intact rock) systems.
Figure 14.
Distribution of peak pull-out forces for adhesive-bonded bolts in the field, comparing epoxy mortar (fractured rock) and vinyl ester resin (intact rock) systems.
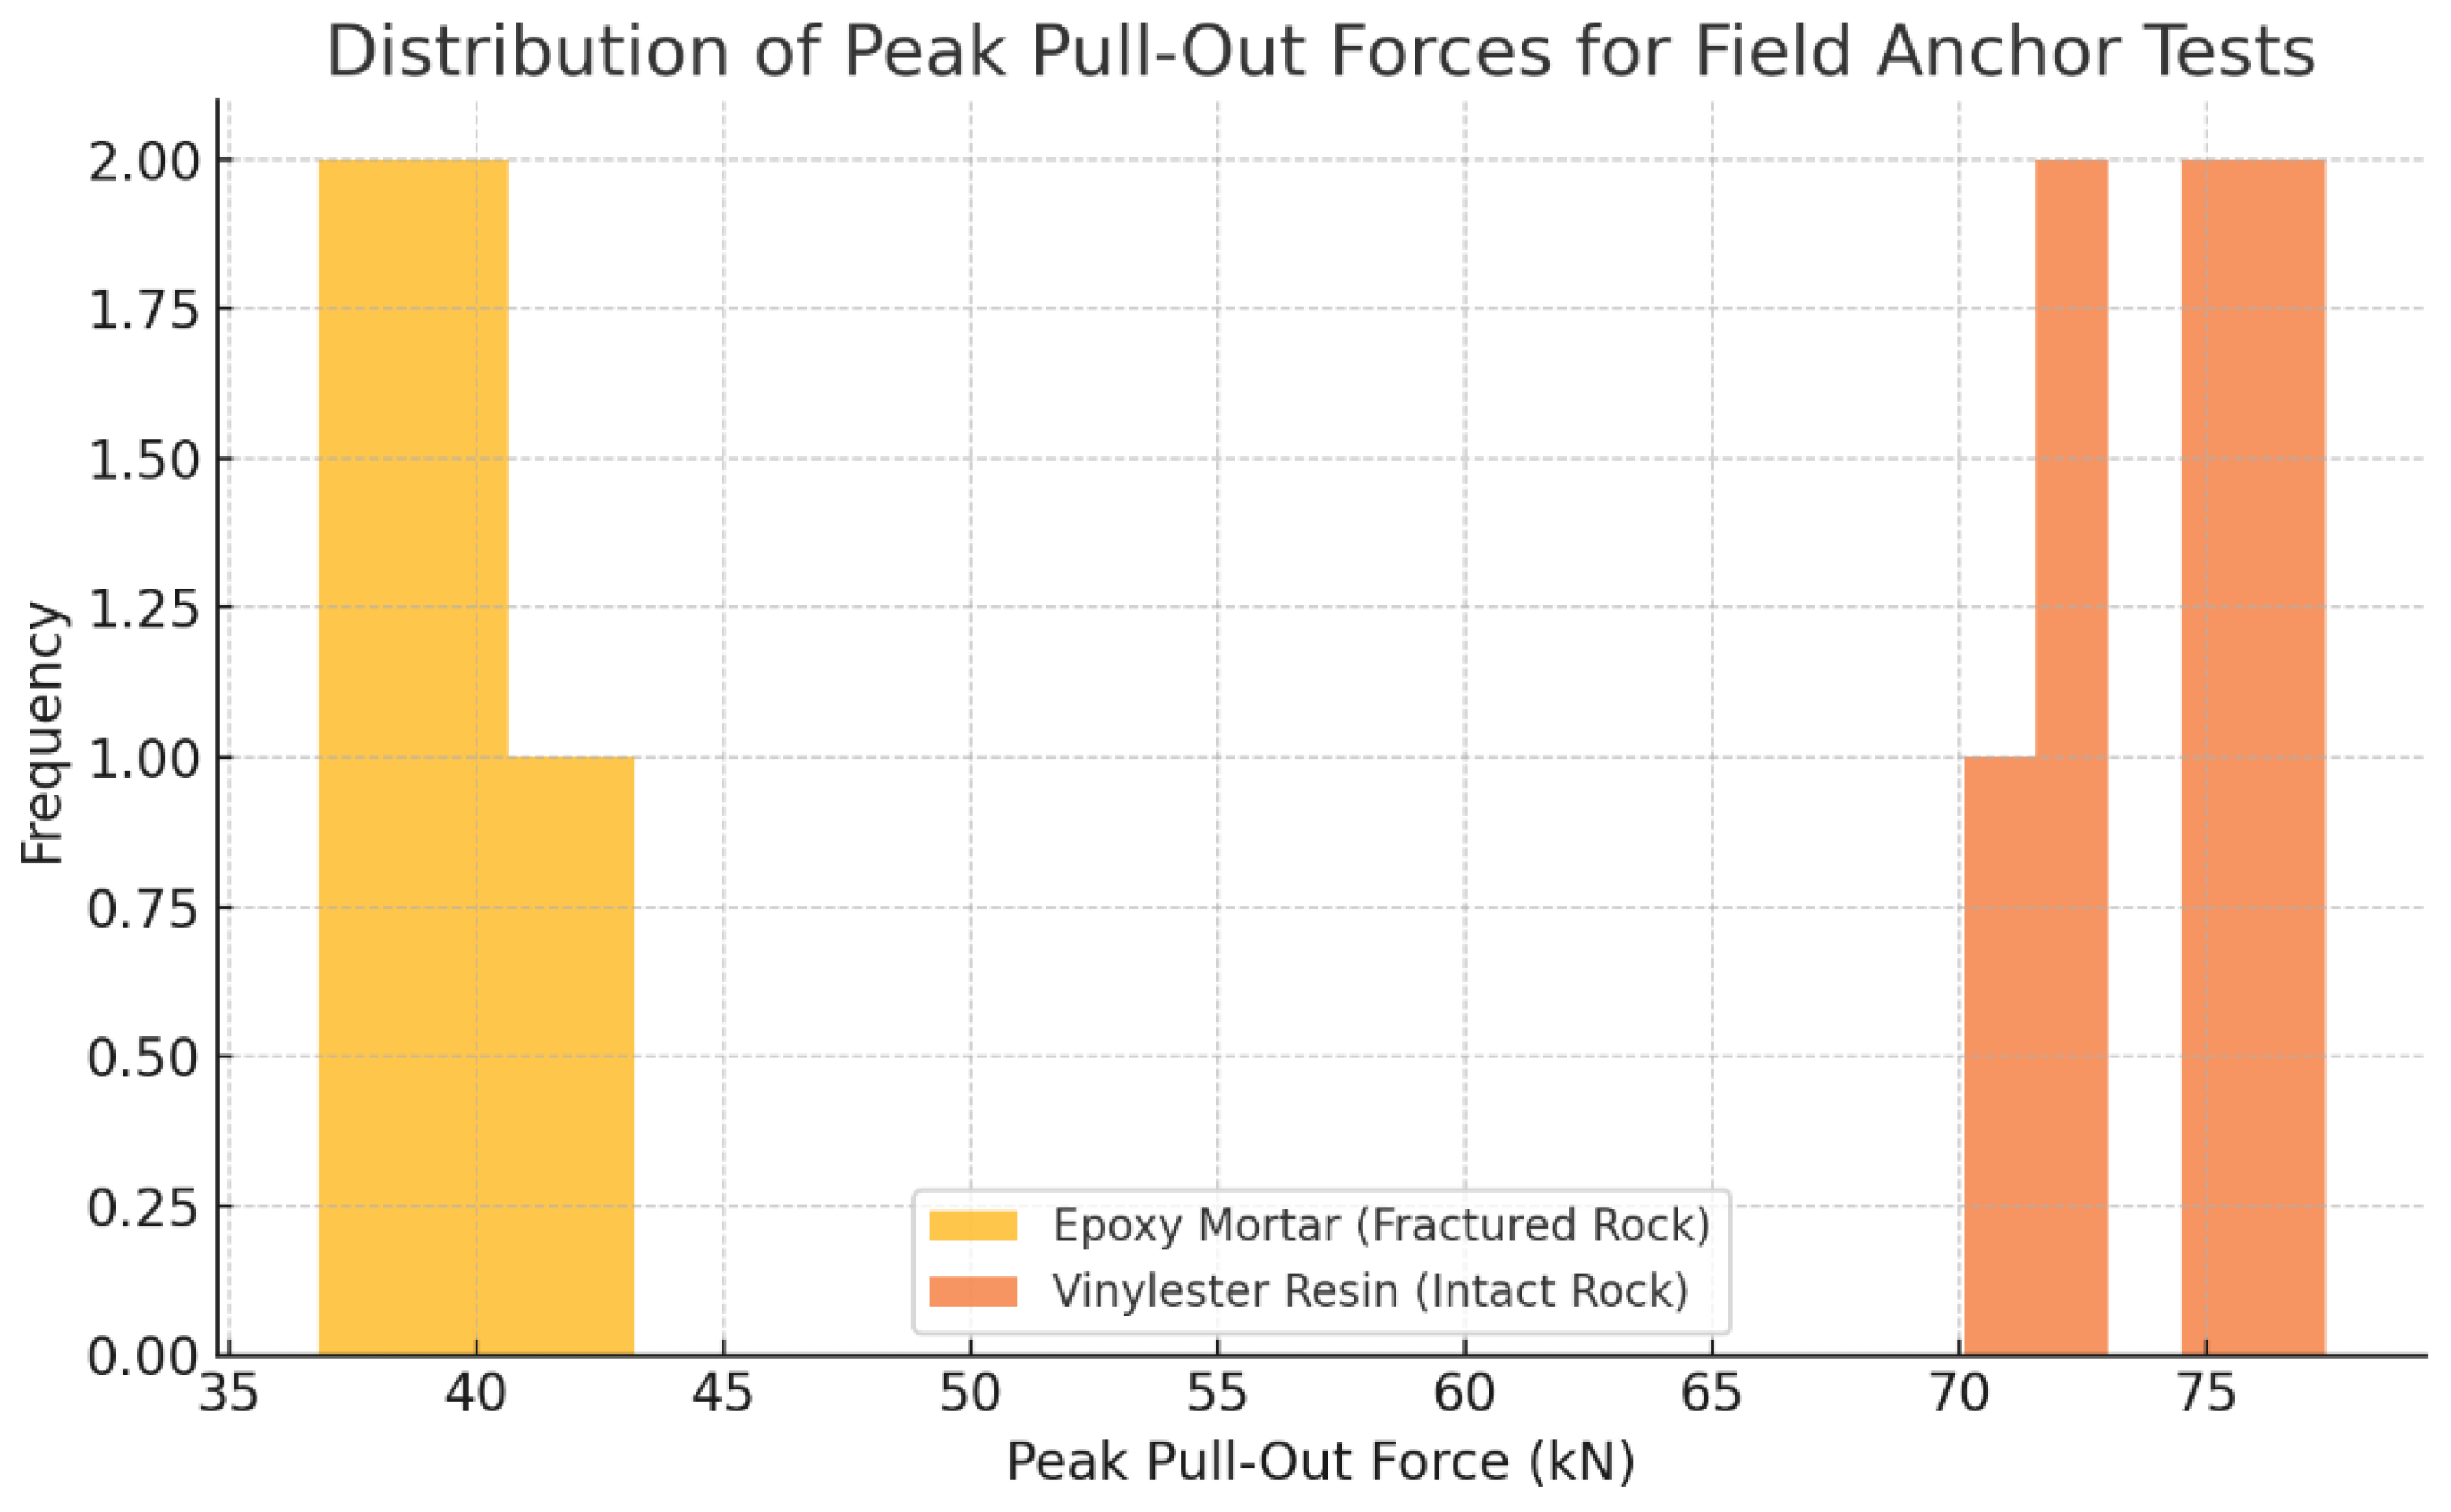
Figure 15.
(a) Load-extension curve for a bolt installed in fractured rock (epoxy mortar, 20 mm × 250 mm). (b) Load-extension curve for a bolt installed in intact rock (vinyl ester resin, 20 mm × 250 mm).
Figure 15.
(a) Load-extension curve for a bolt installed in fractured rock (epoxy mortar, 20 mm × 250 mm). (b) Load-extension curve for a bolt installed in intact rock (vinyl ester resin, 20 mm × 250 mm).
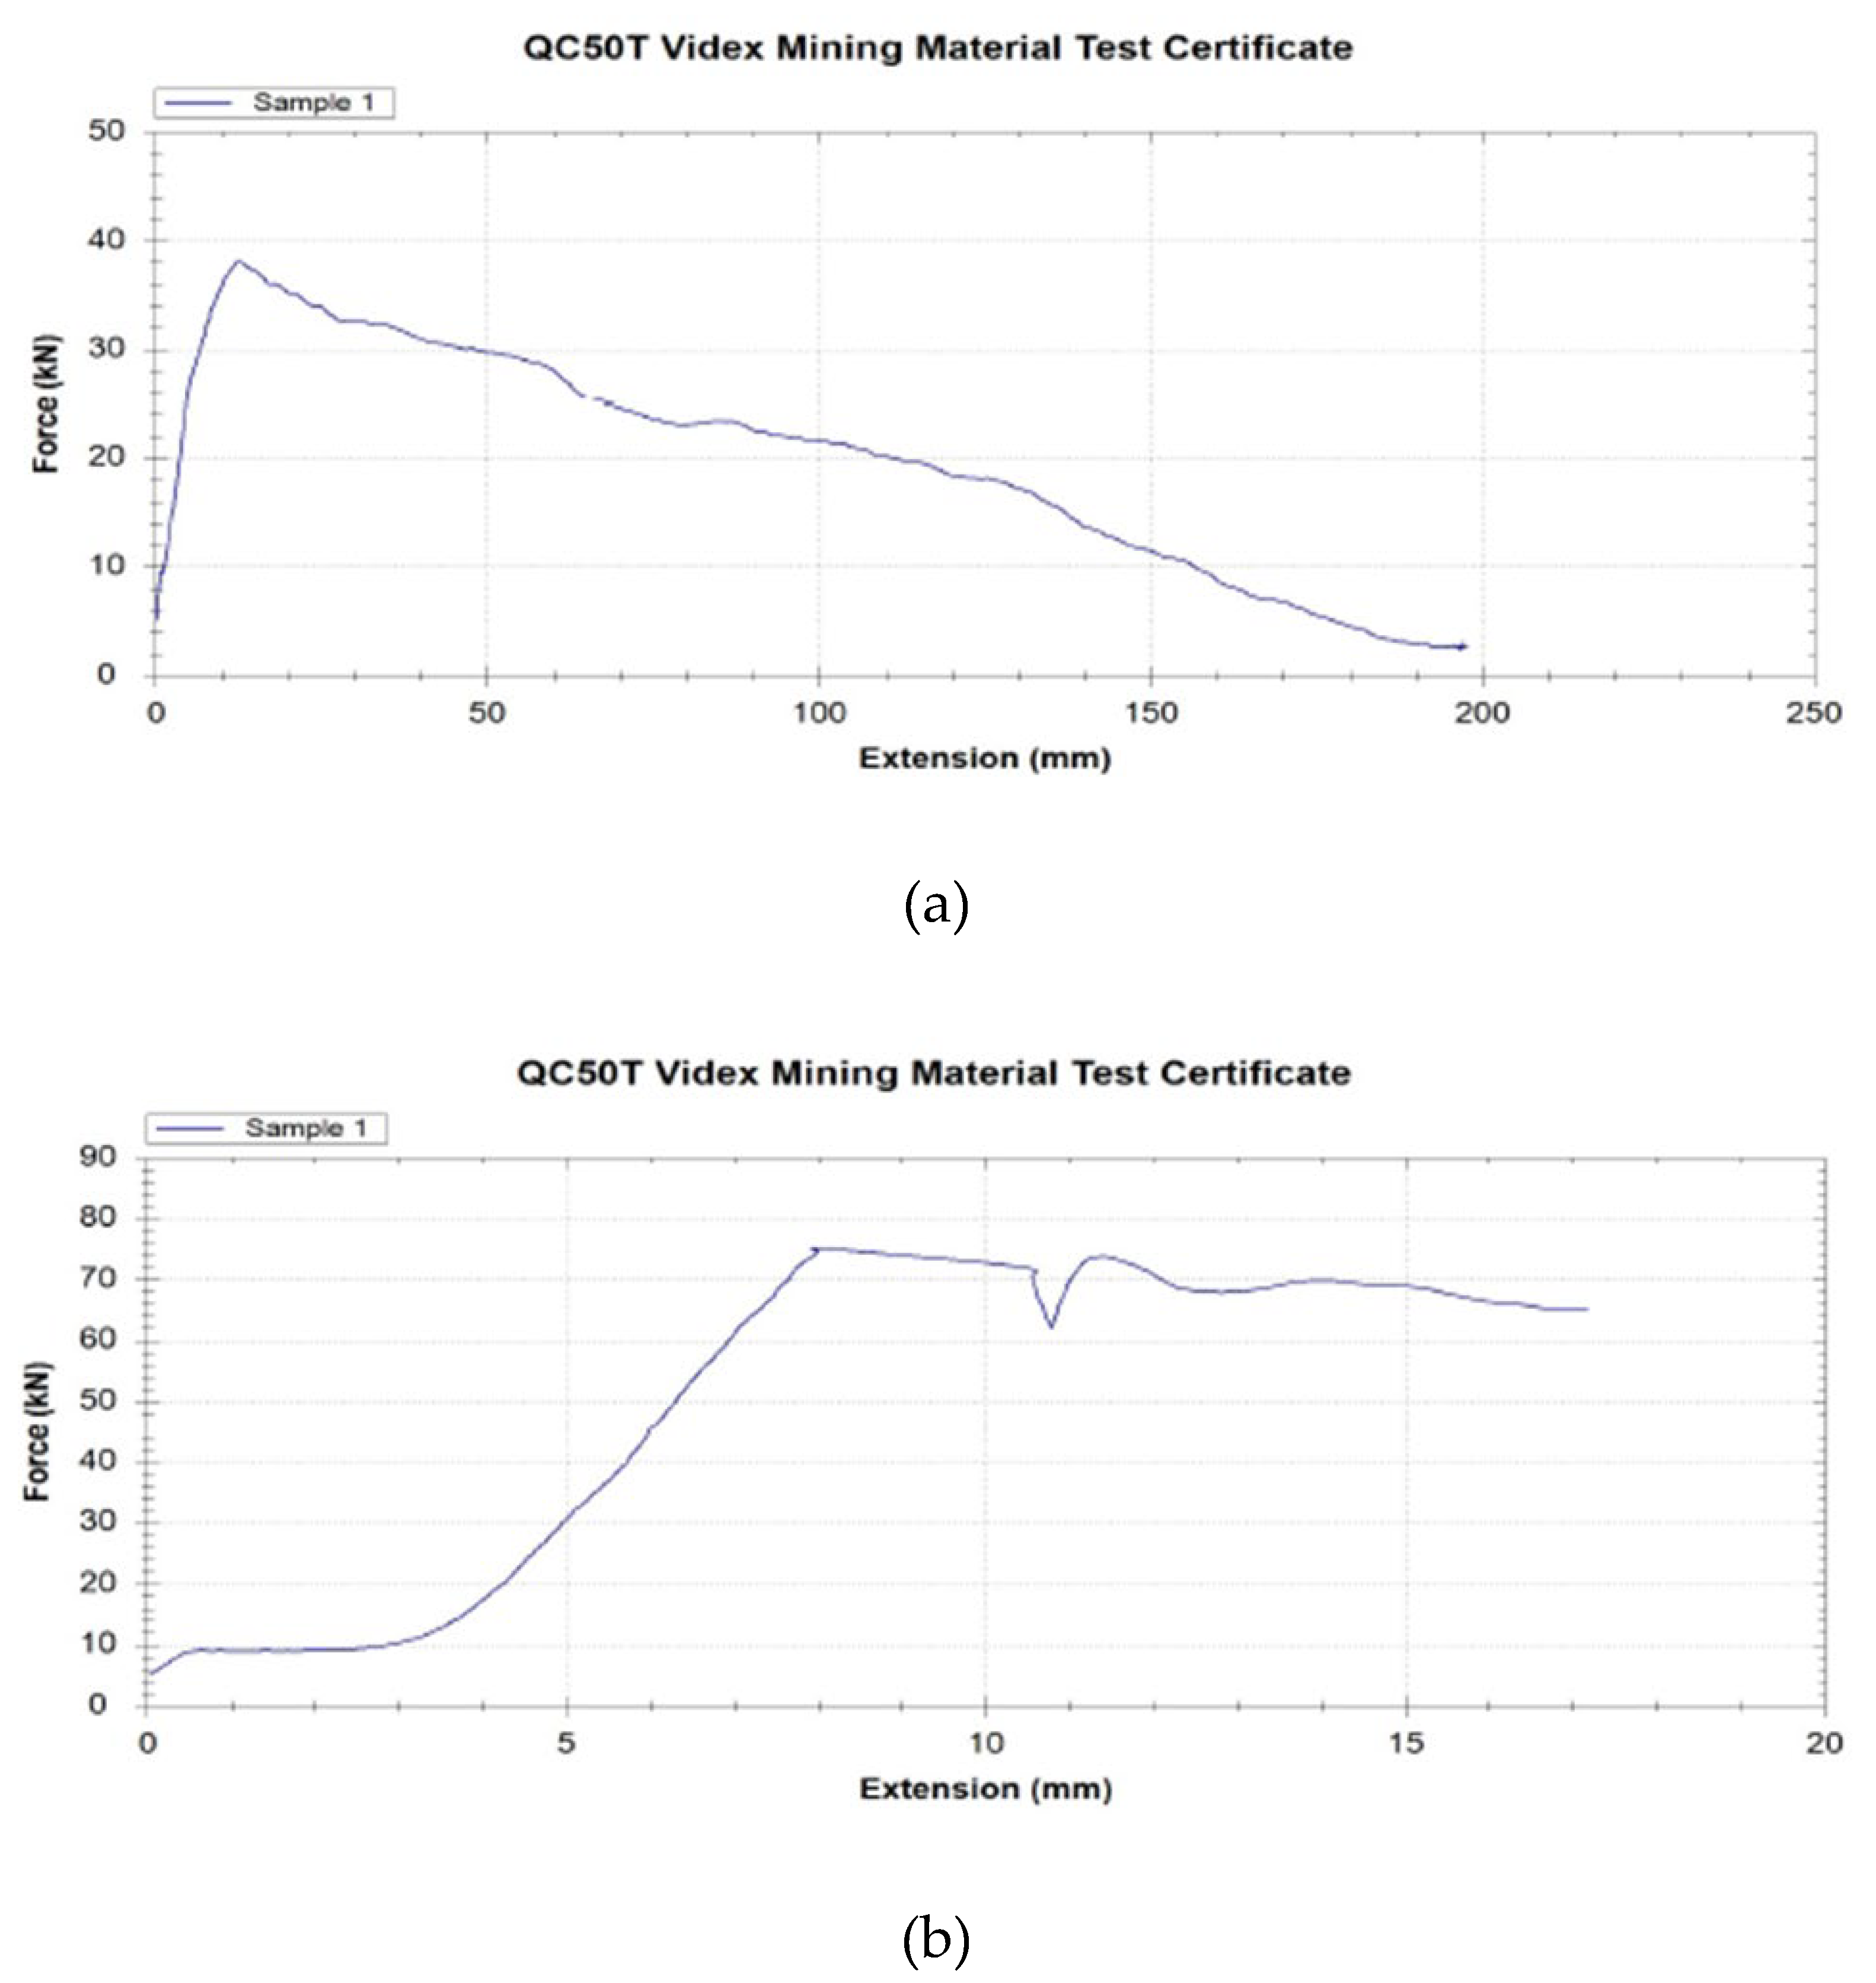
Figure 16.
Strength Factor vs. Depth for Stage 3 (Unsupported Excavation).
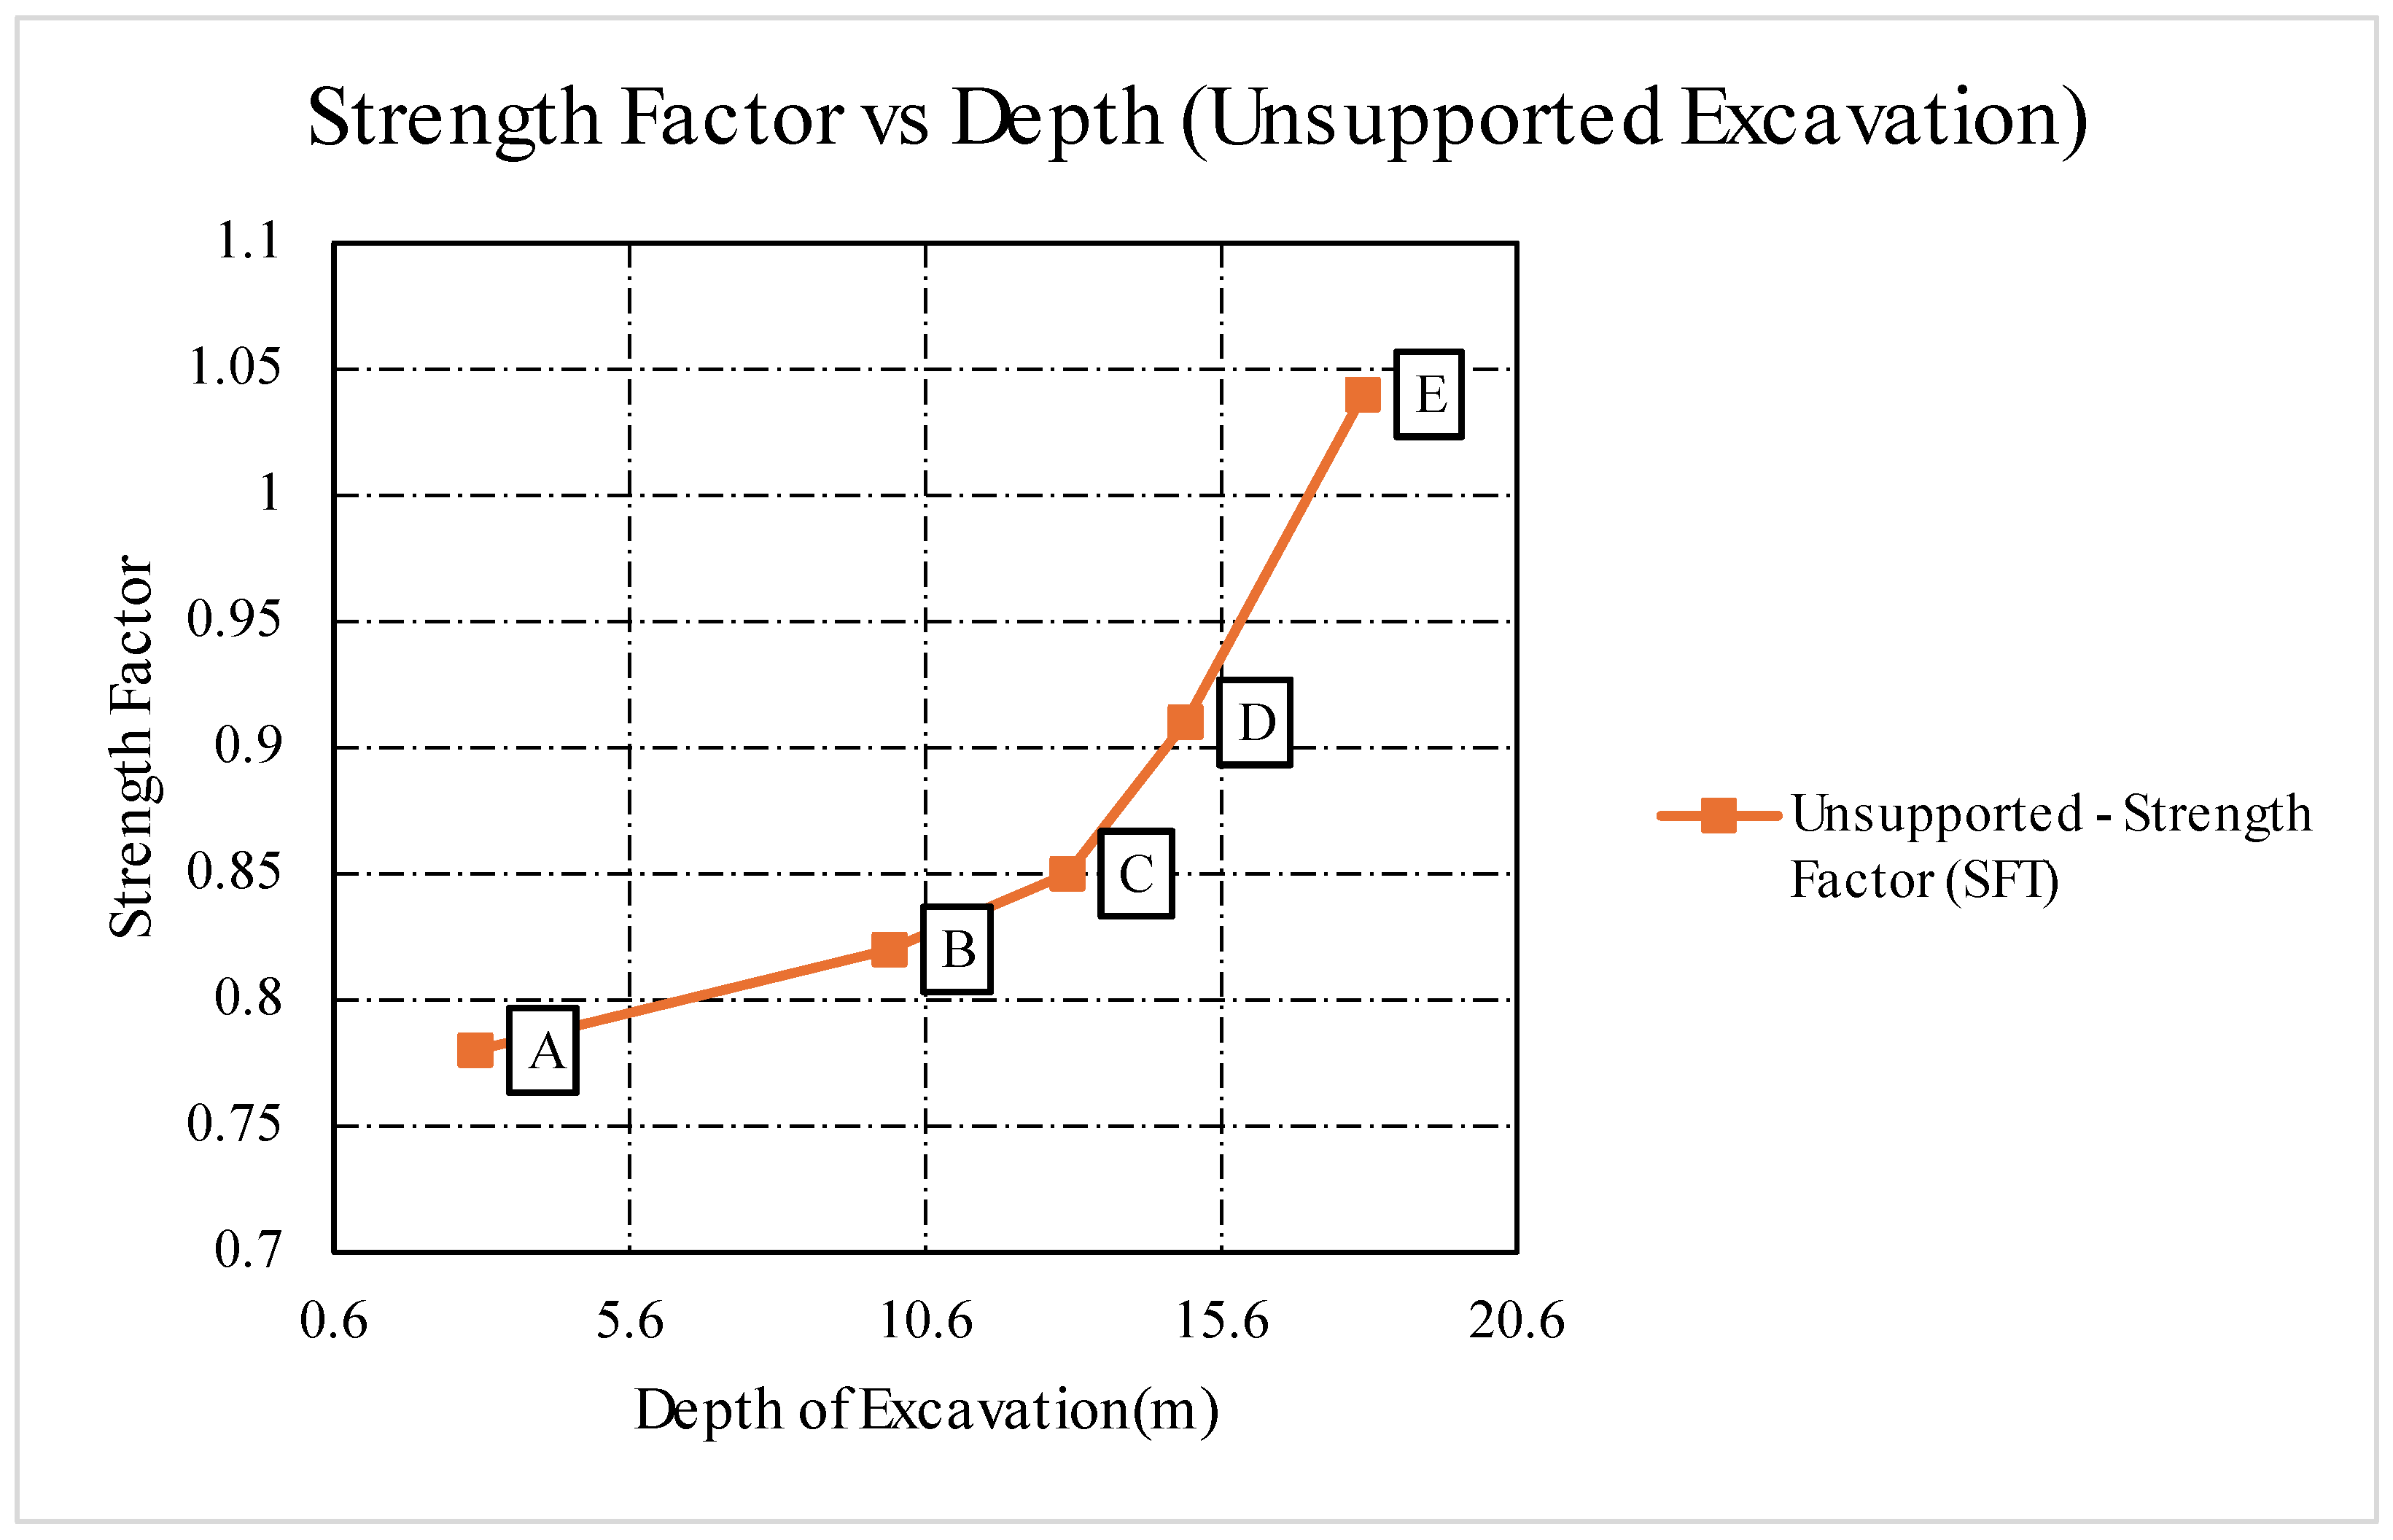
Figure 17.
Ubiquitous Joints vs. Depth for Stage 3 (Unsupported Excavation).
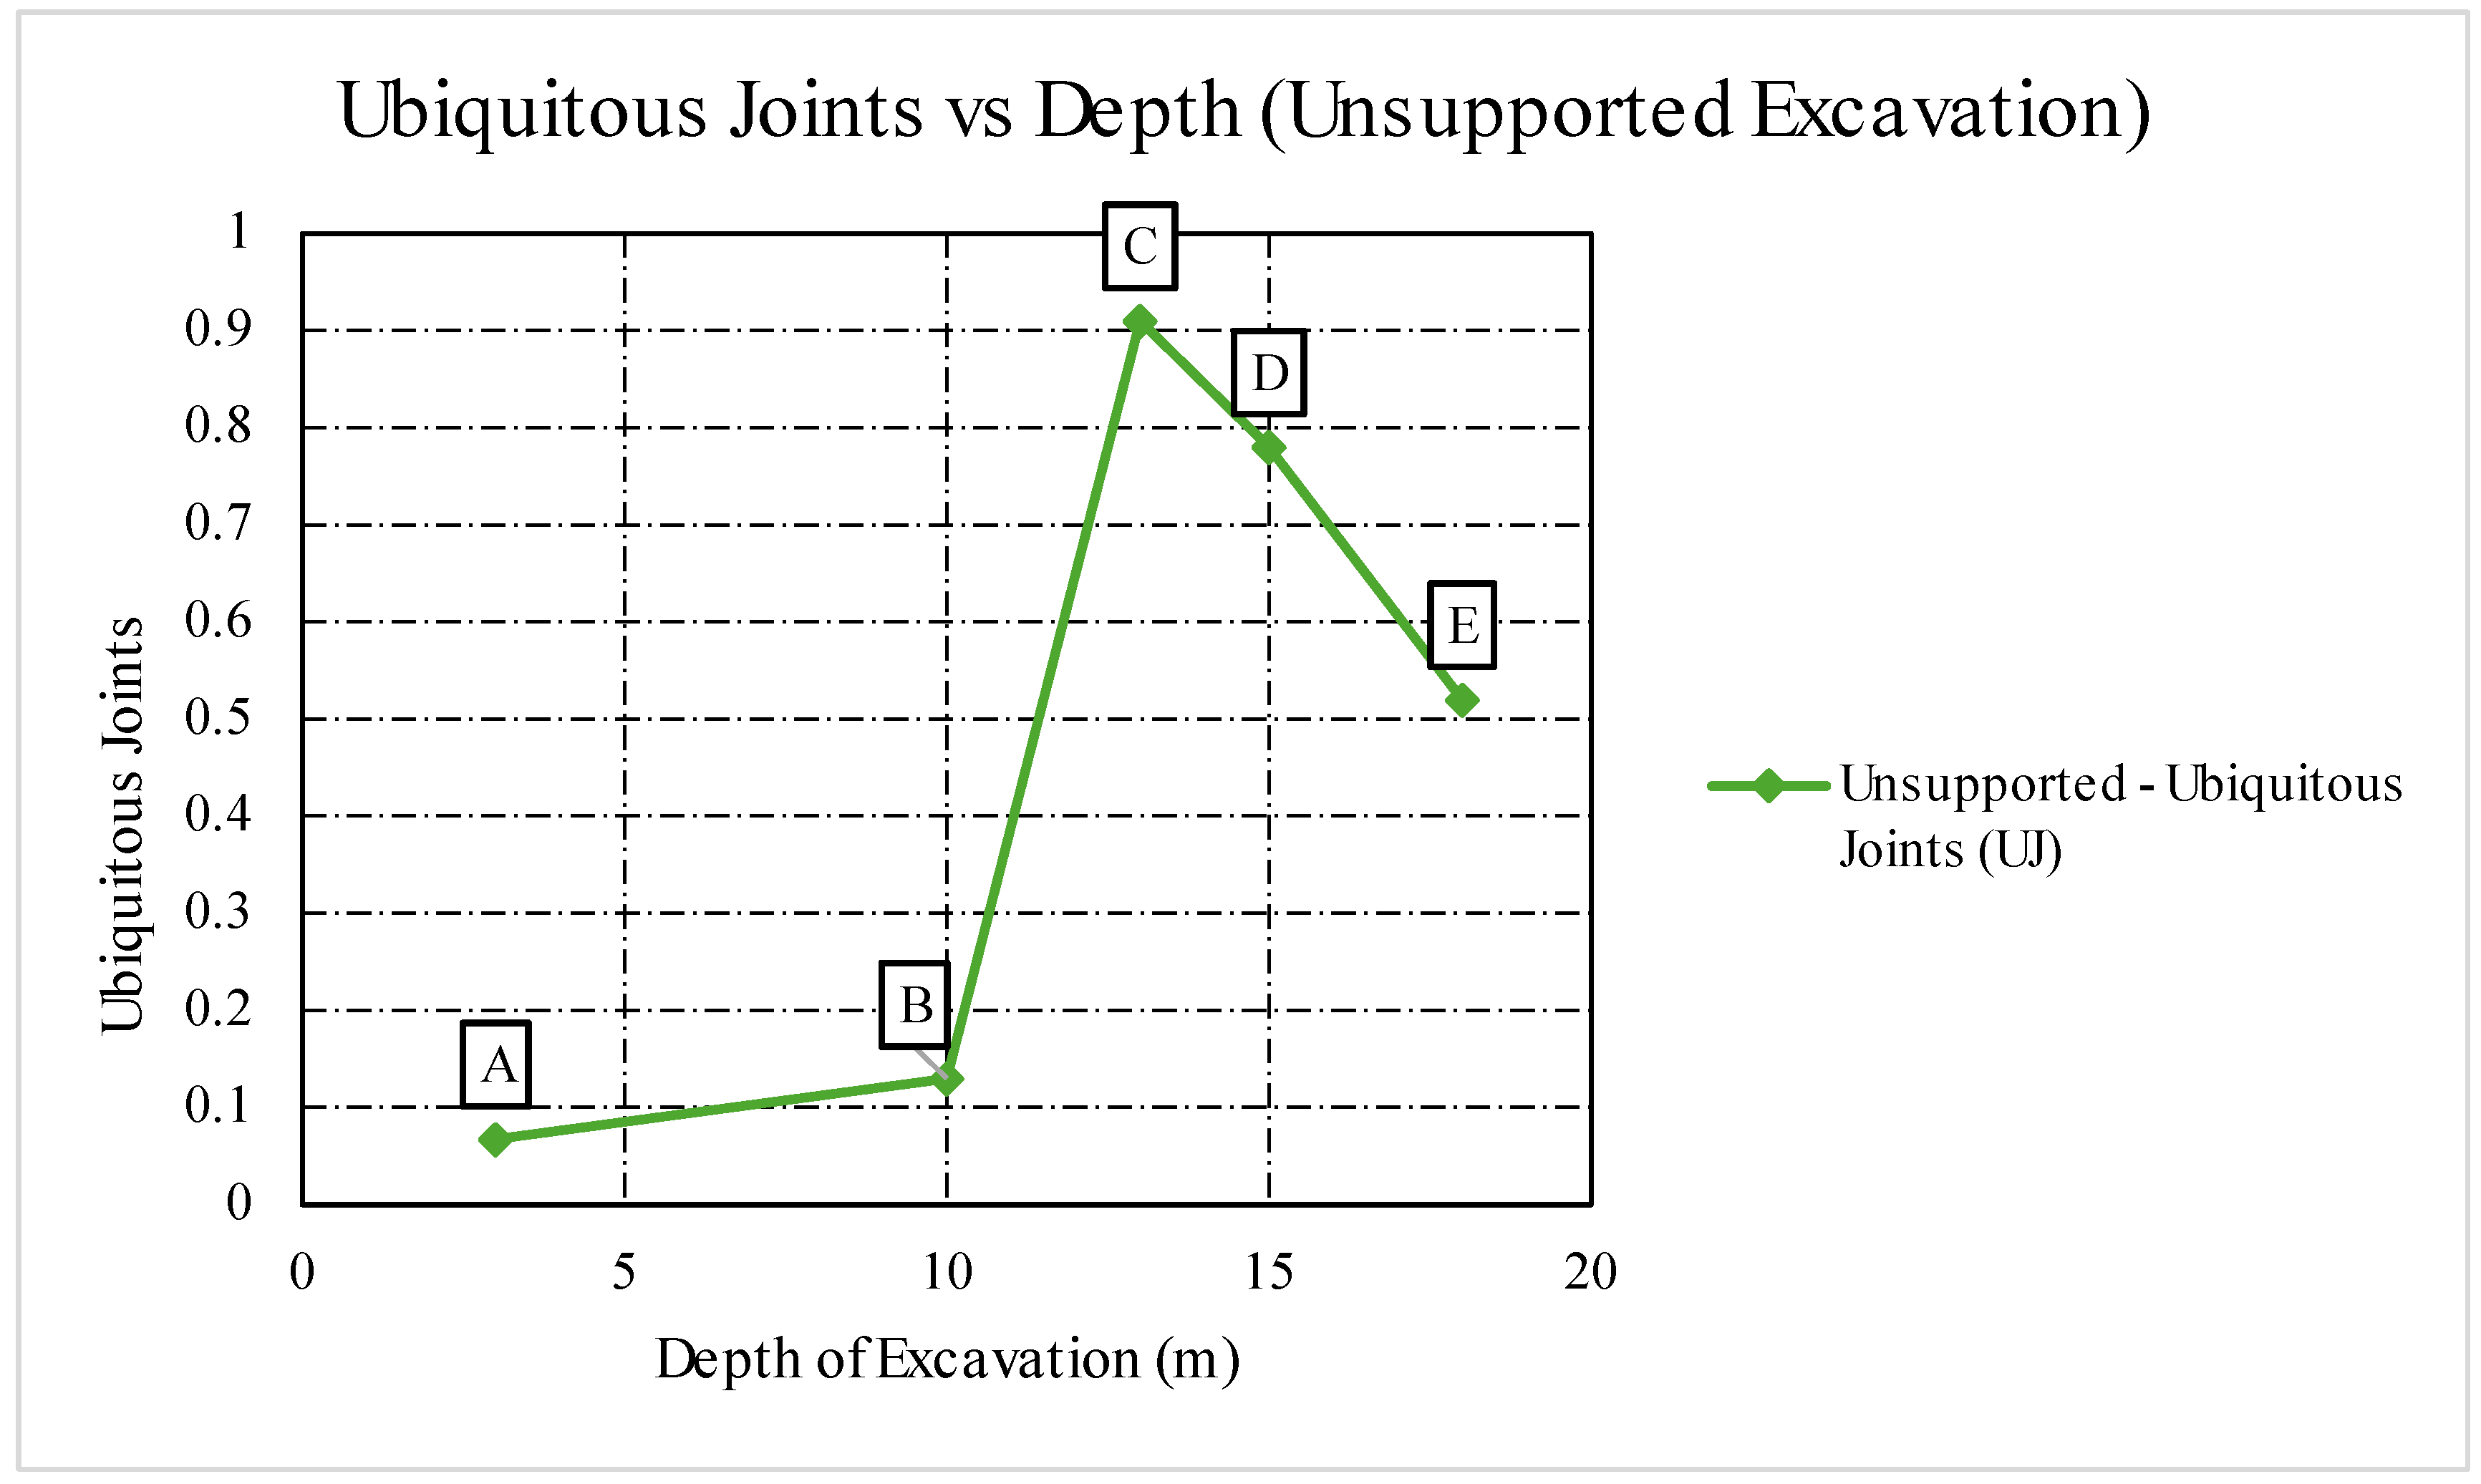
Figure 18.
Volumetric Strain vs. Depth for Stage 3 (Unsupported Excavation).
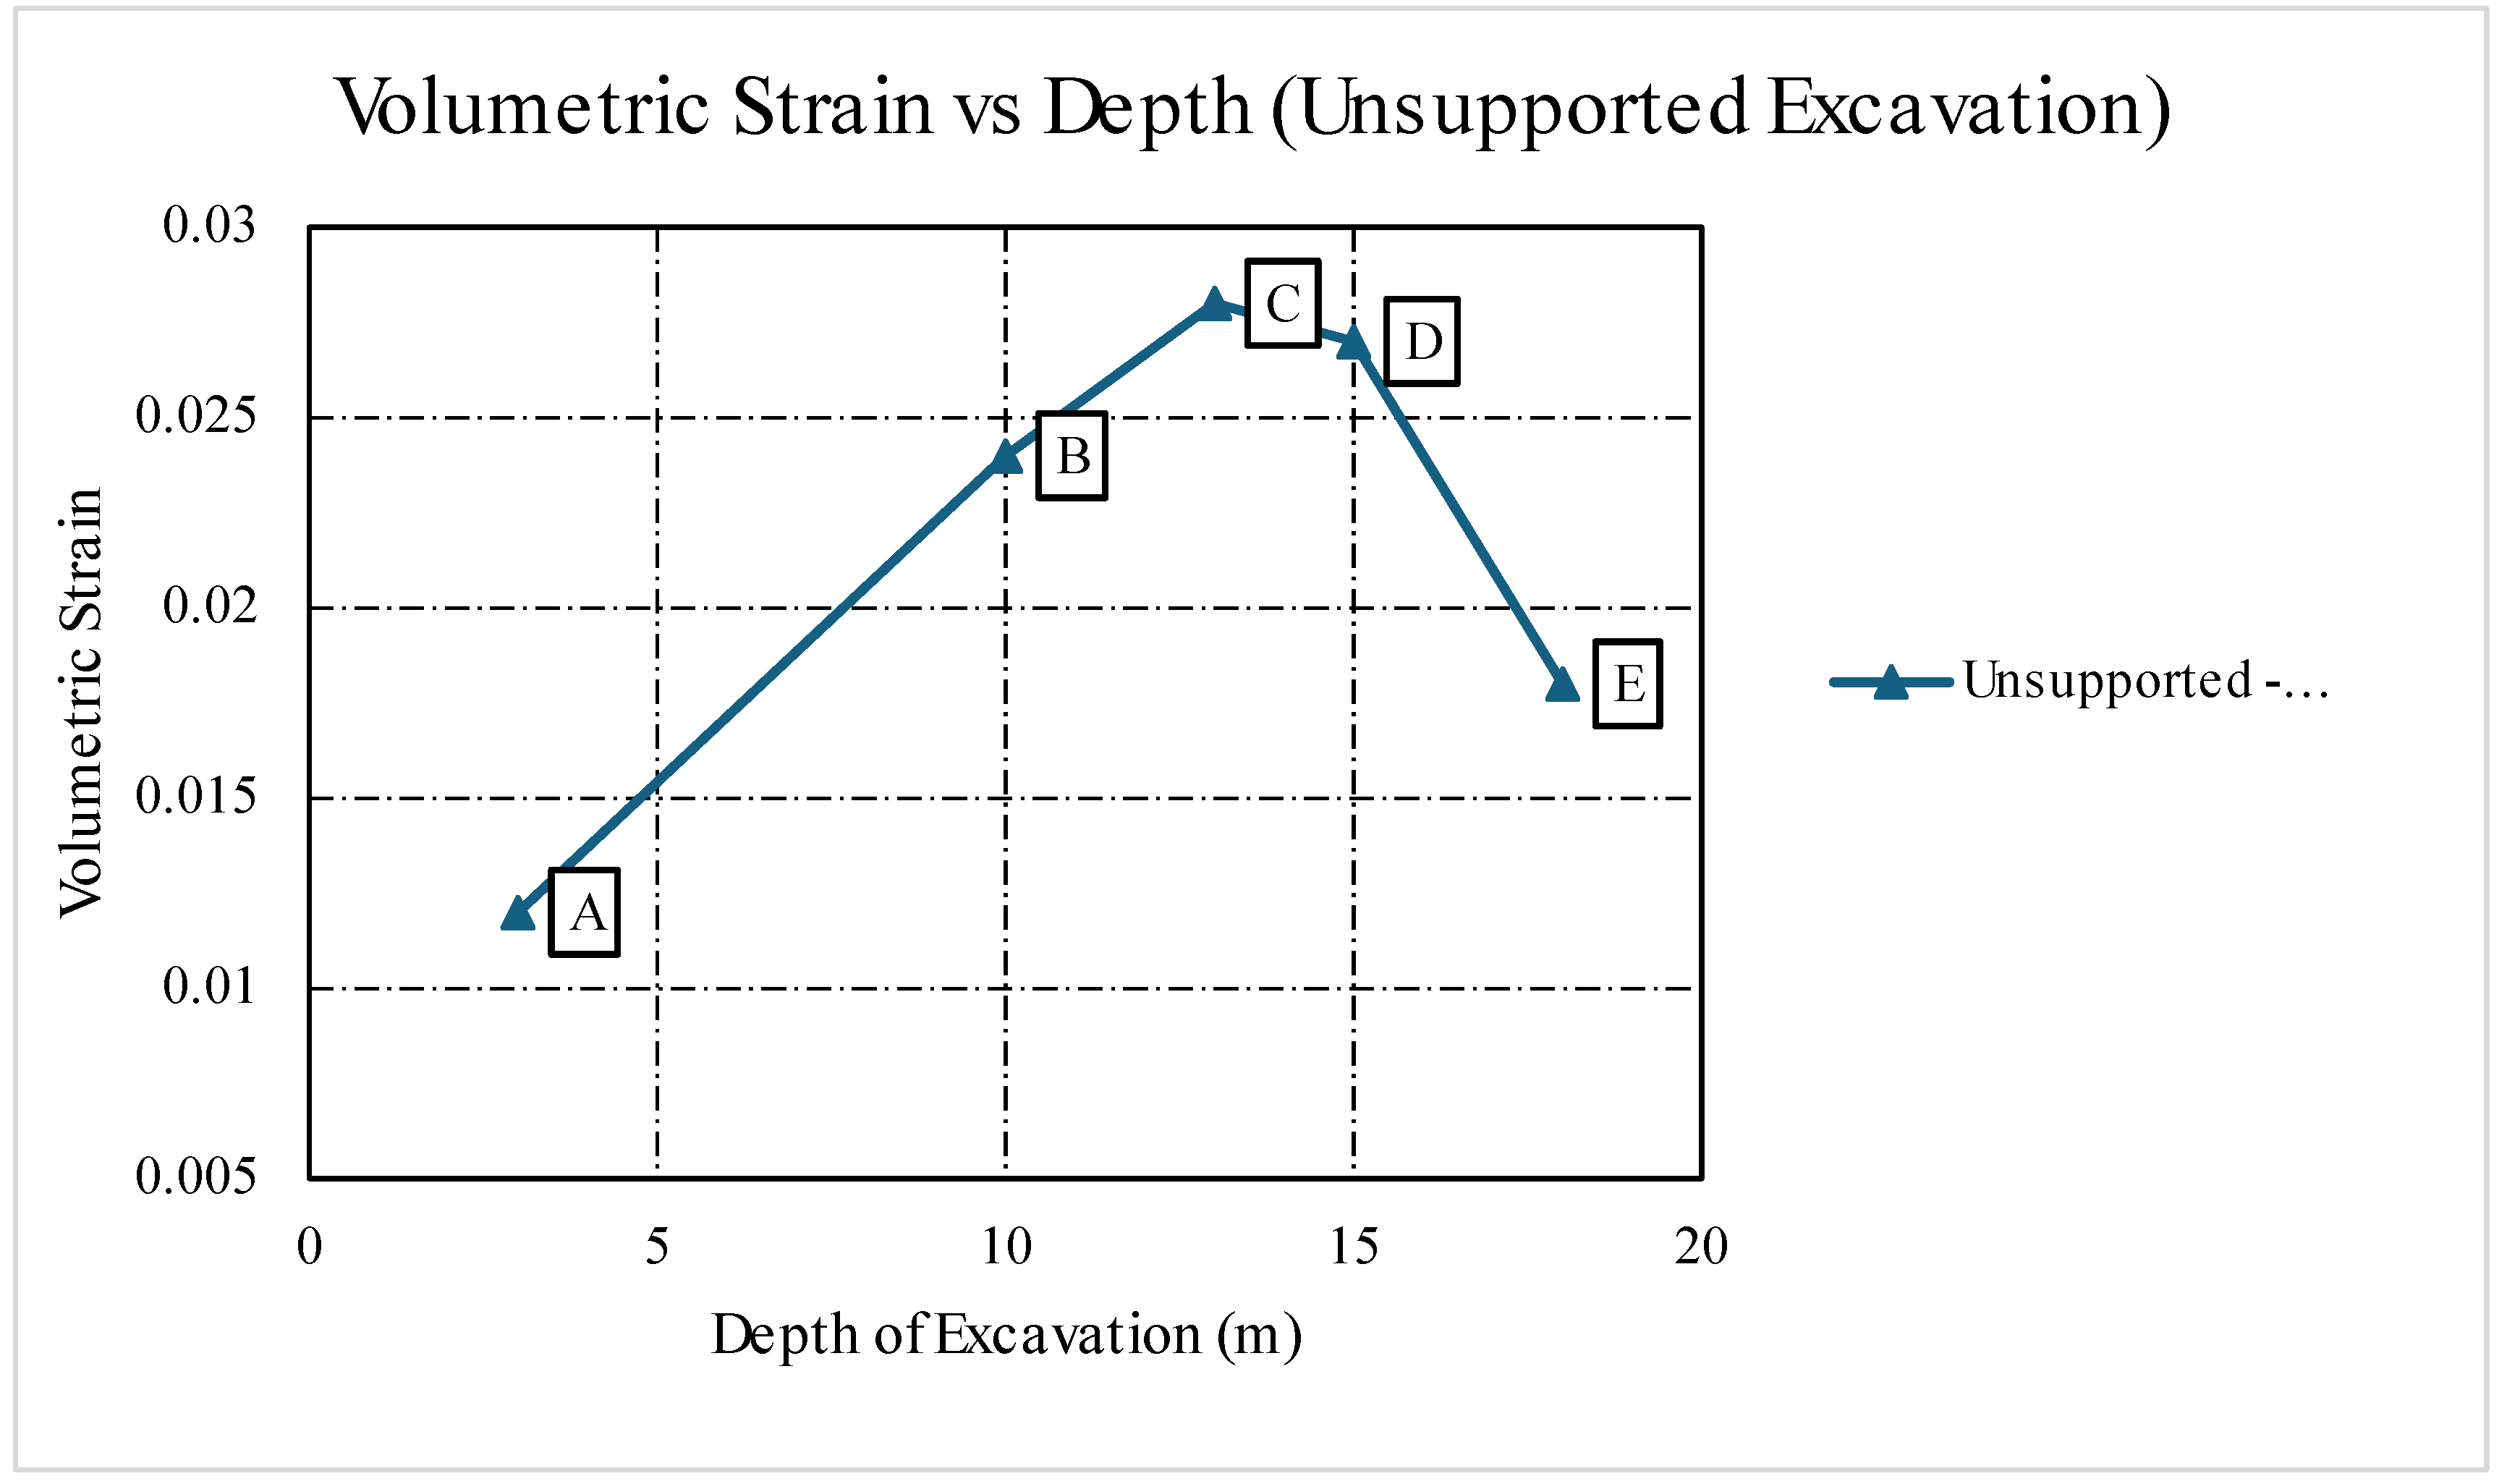
Figure 19.
(a) Modelled distribution of strength factor across the excavation (Stage 3). (b) Modelled distribution of ubiquitous joint factor (Stage 3). (c) Modelled distribution of volumetric strain (Stage 3).
Figure 19.
(a) Modelled distribution of strength factor across the excavation (Stage 3). (b) Modelled distribution of ubiquitous joint factor (Stage 3). (c) Modelled distribution of volumetric strain (Stage 3).
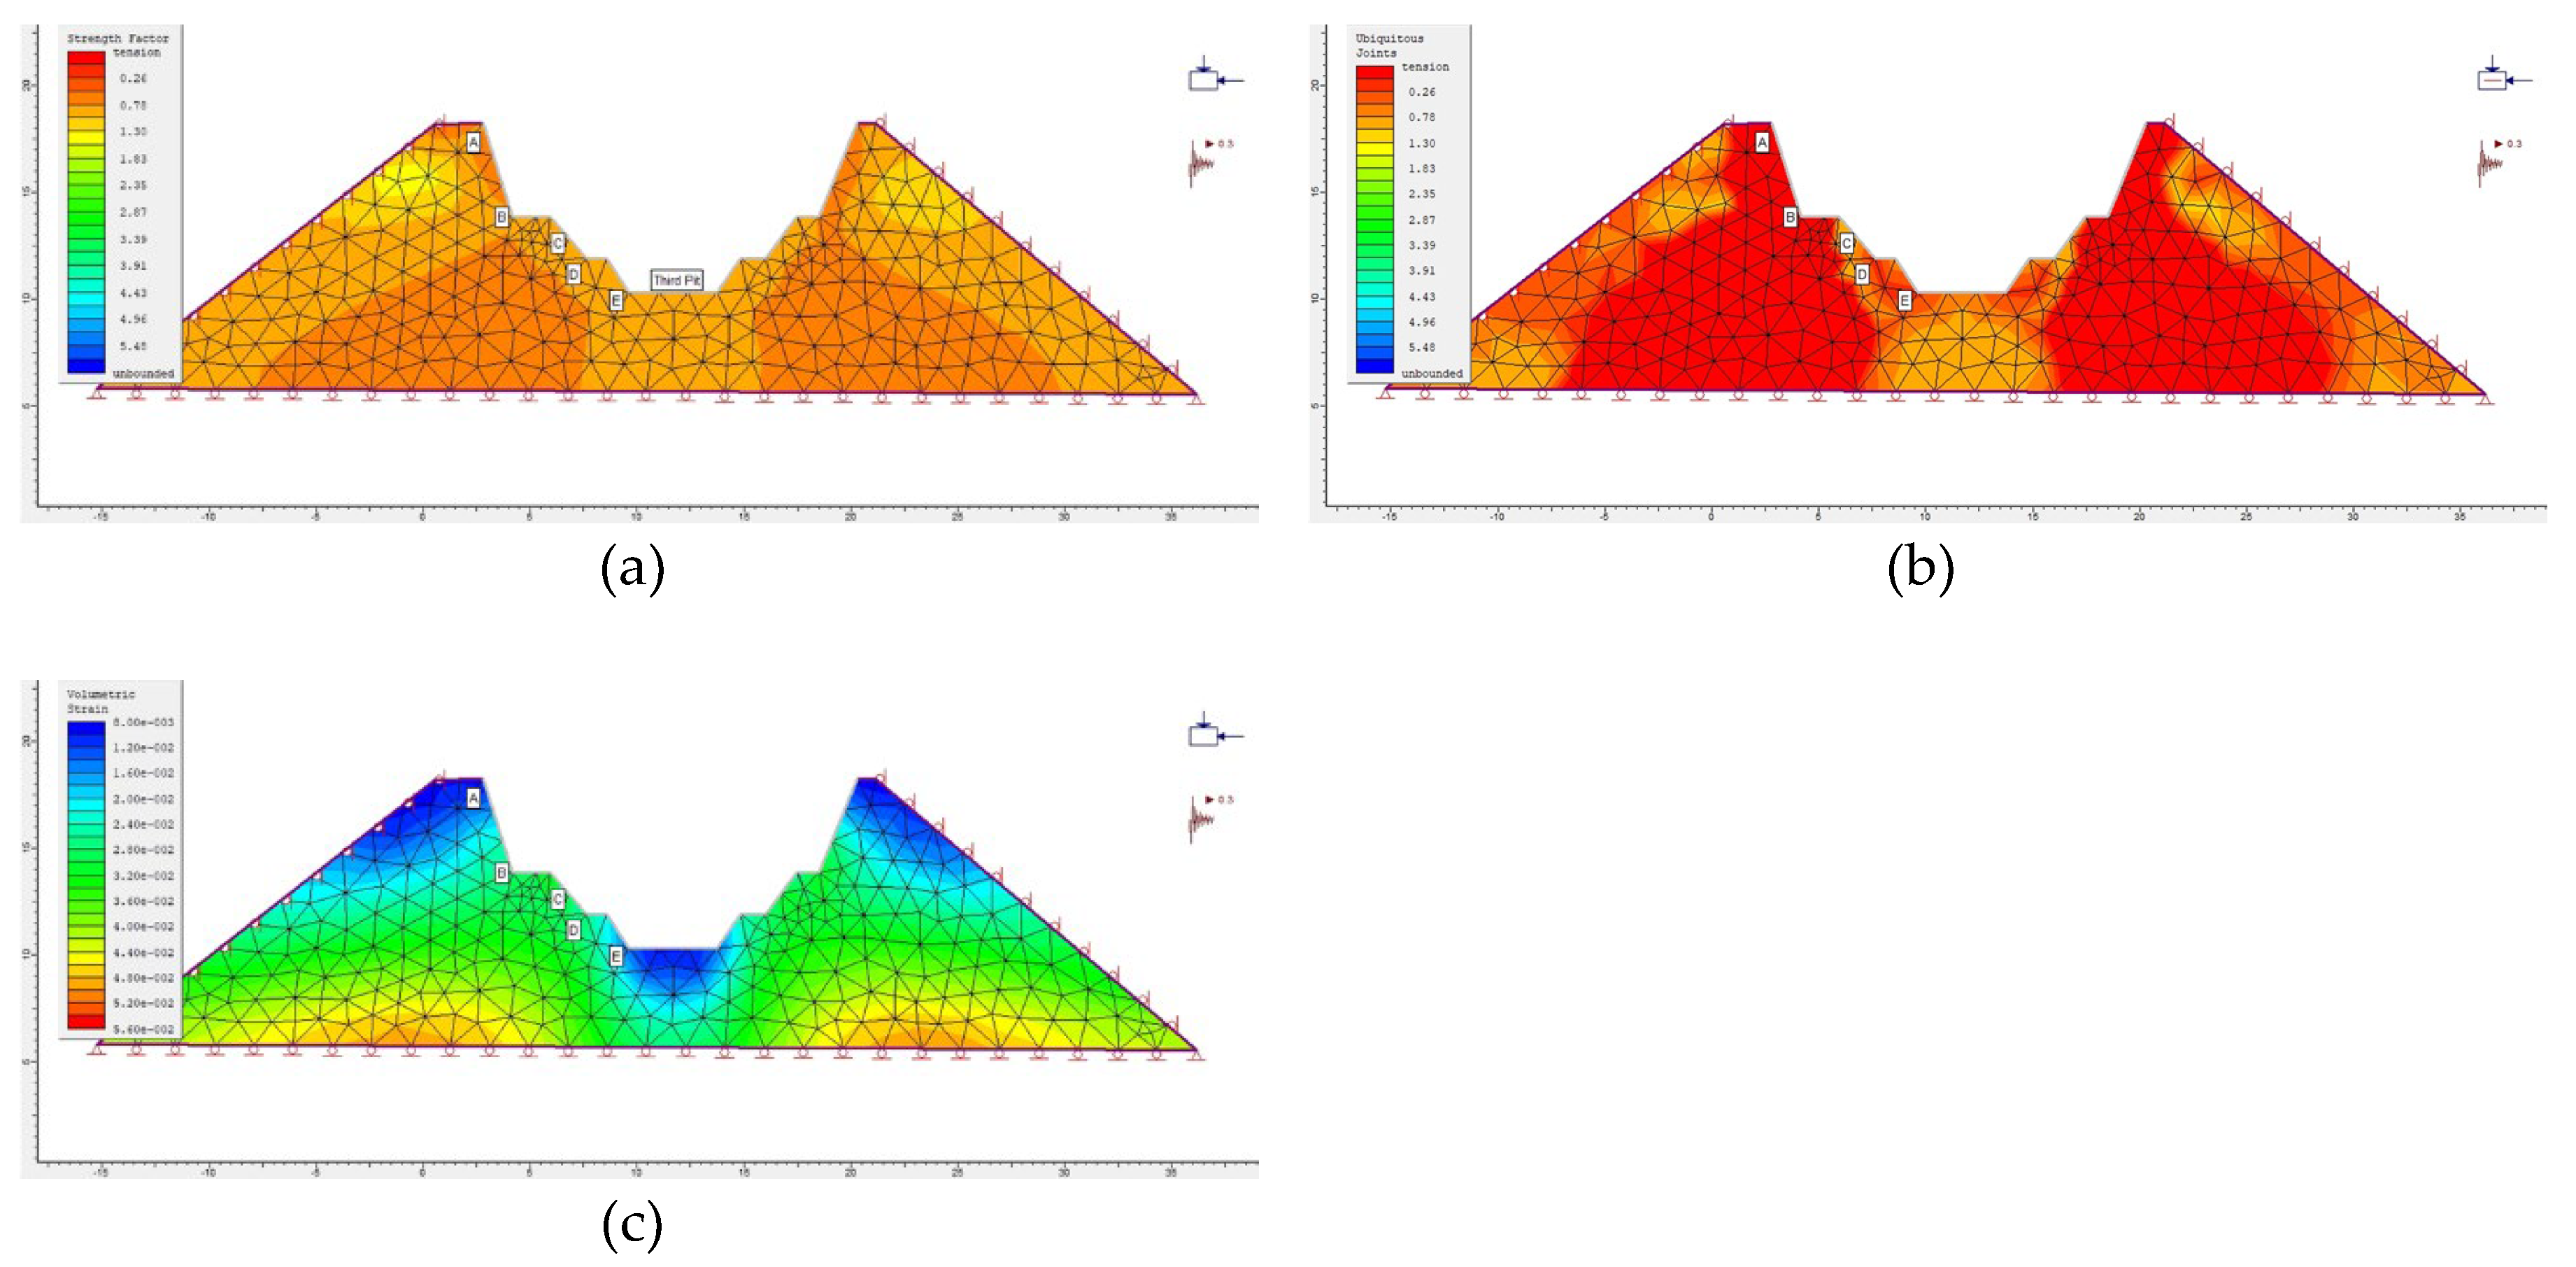
Figure 20.
Plots for surface excavations that are supported (Bolt 1) - (a) Strength Factor vs. Depth for supported excavation (Bolts 1–3). (b)Ubiquitous Joints vs. Depth for supported excavation (Bolts 1–3). (c)Volumetric Strain vs. Depth for supported excavation (Bolts 1–3).
Figure 20.
Plots for surface excavations that are supported (Bolt 1) - (a) Strength Factor vs. Depth for supported excavation (Bolts 1–3). (b)Ubiquitous Joints vs. Depth for supported excavation (Bolts 1–3). (c)Volumetric Strain vs. Depth for supported excavation (Bolts 1–3).
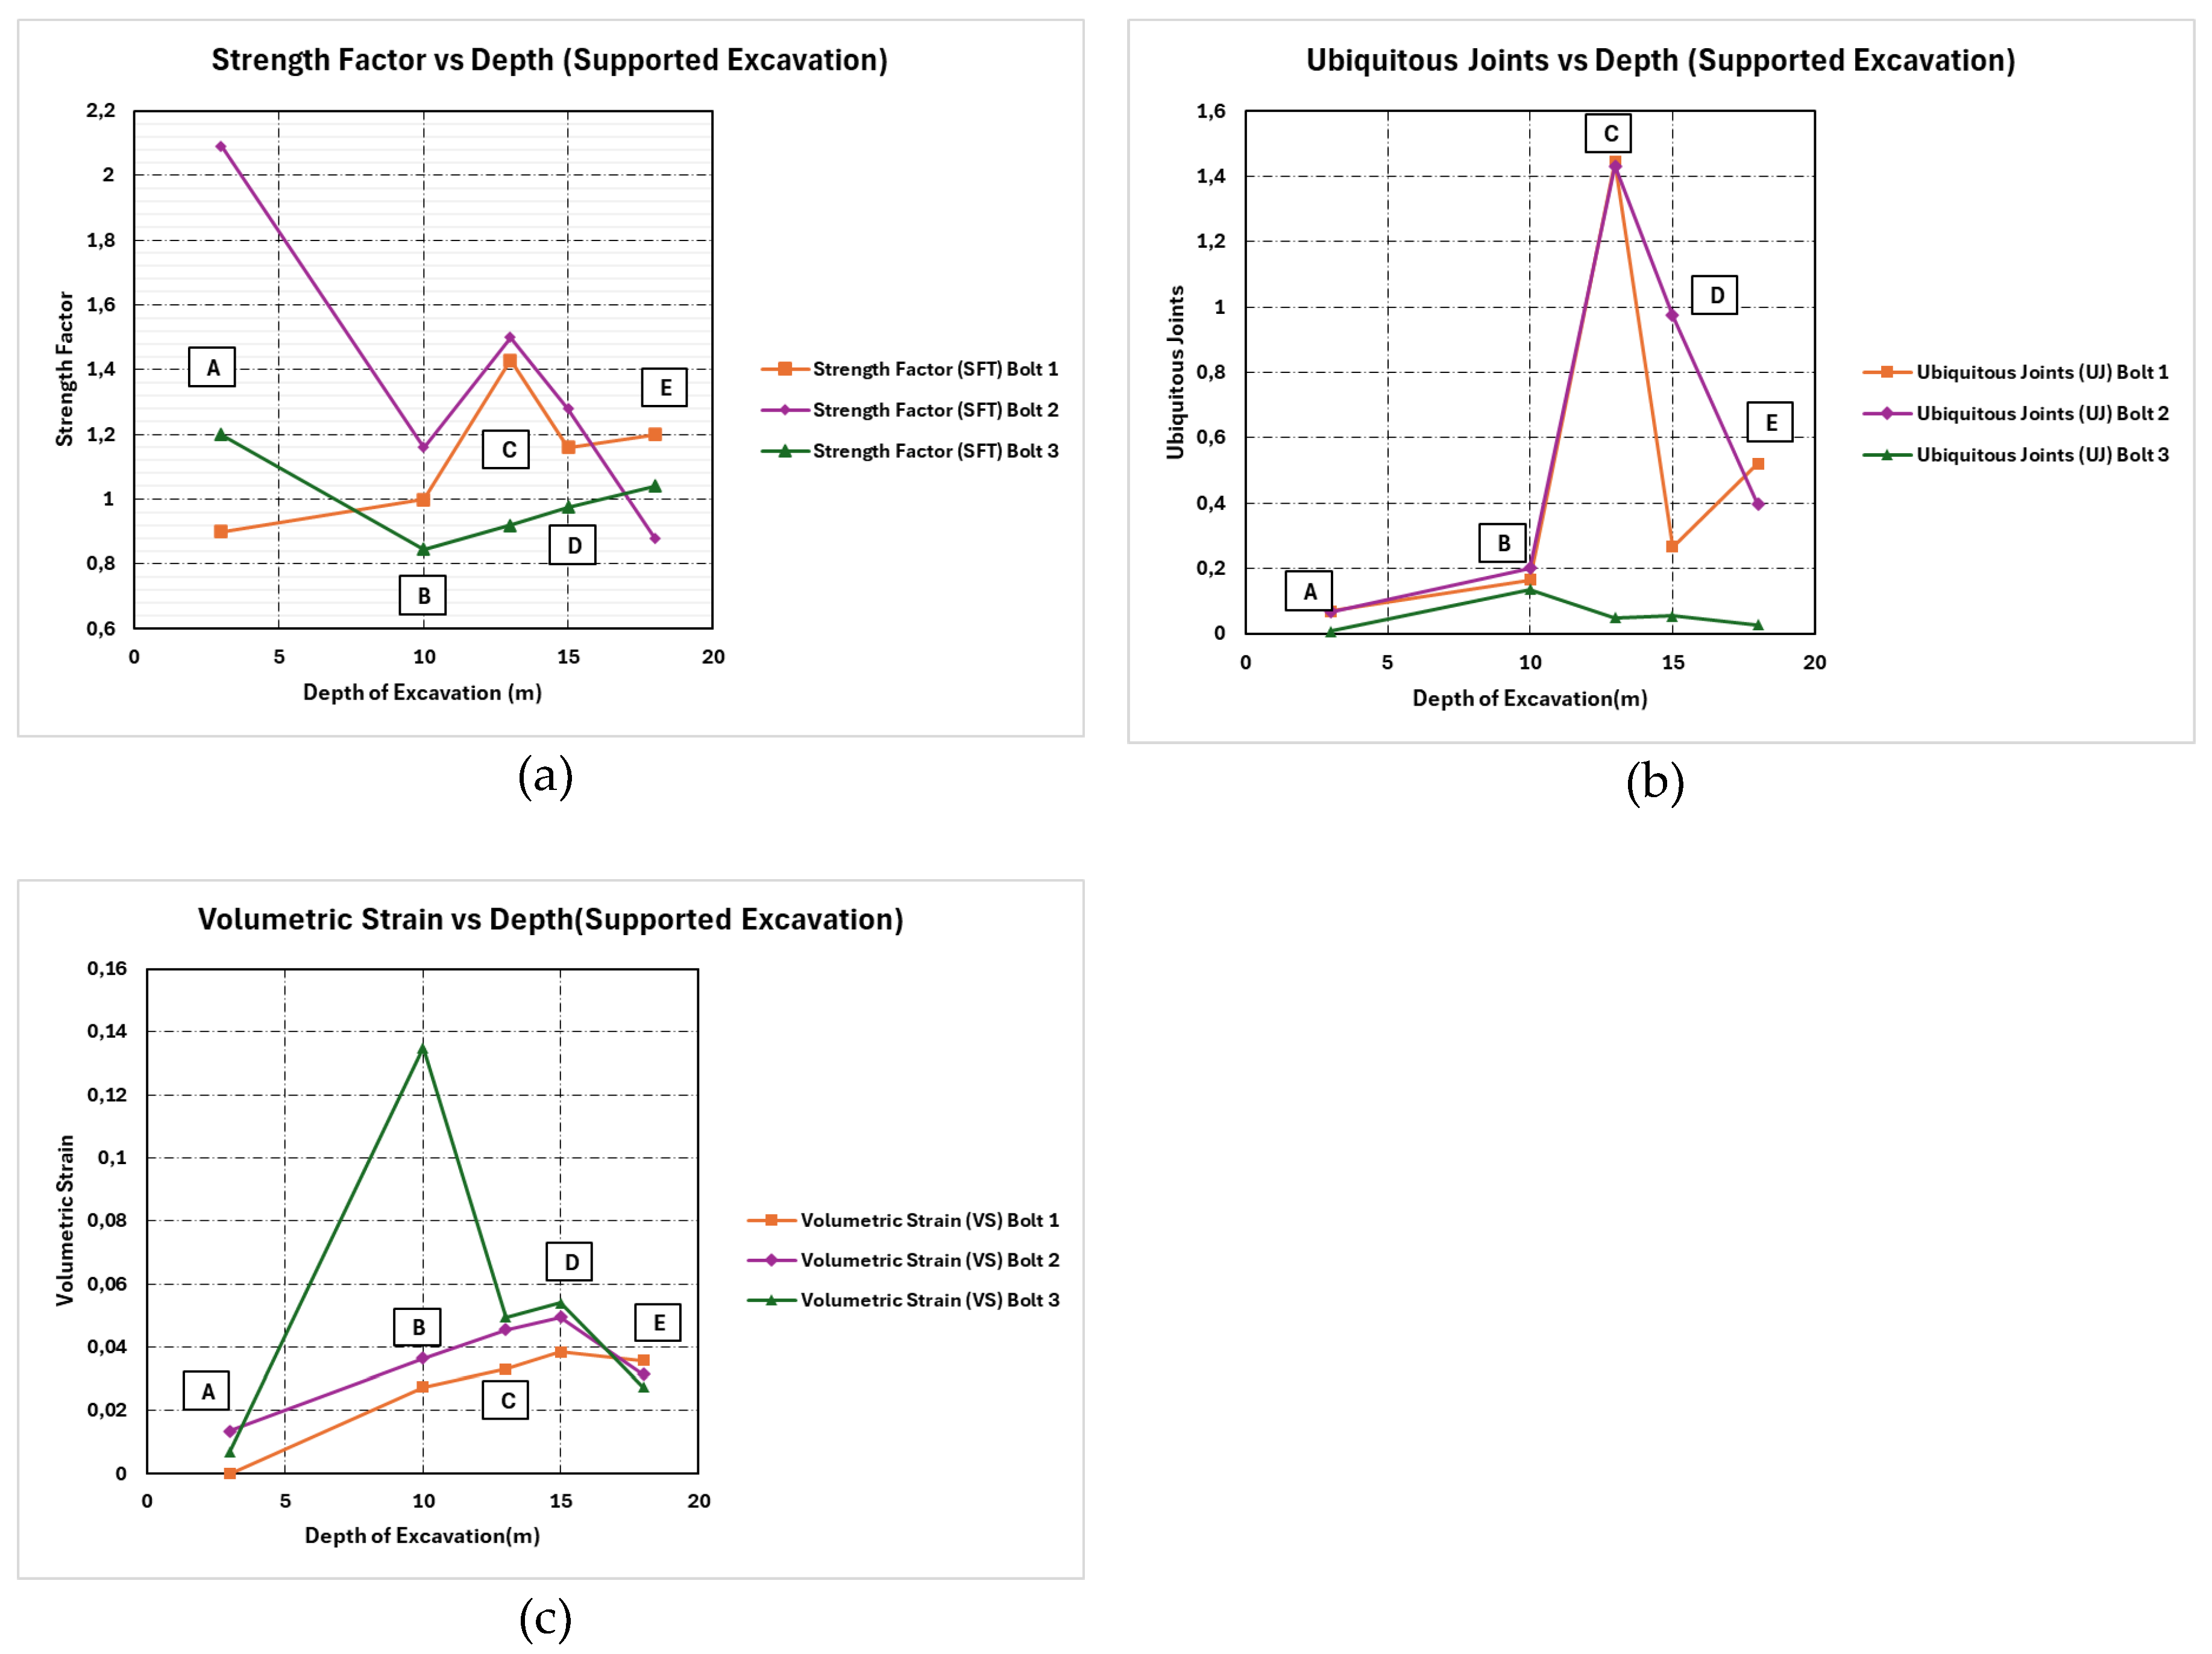
Figure 21.
Bolt 1 (a) Modelled strength factor distribution (supported excavation). (b) Modelled ubiquitous joint distribution (supported excavation). (c) Modelled volumetric strain distribution (supported excavation).
Figure 21.
Bolt 1 (a) Modelled strength factor distribution (supported excavation). (b) Modelled ubiquitous joint distribution (supported excavation). (c) Modelled volumetric strain distribution (supported excavation).
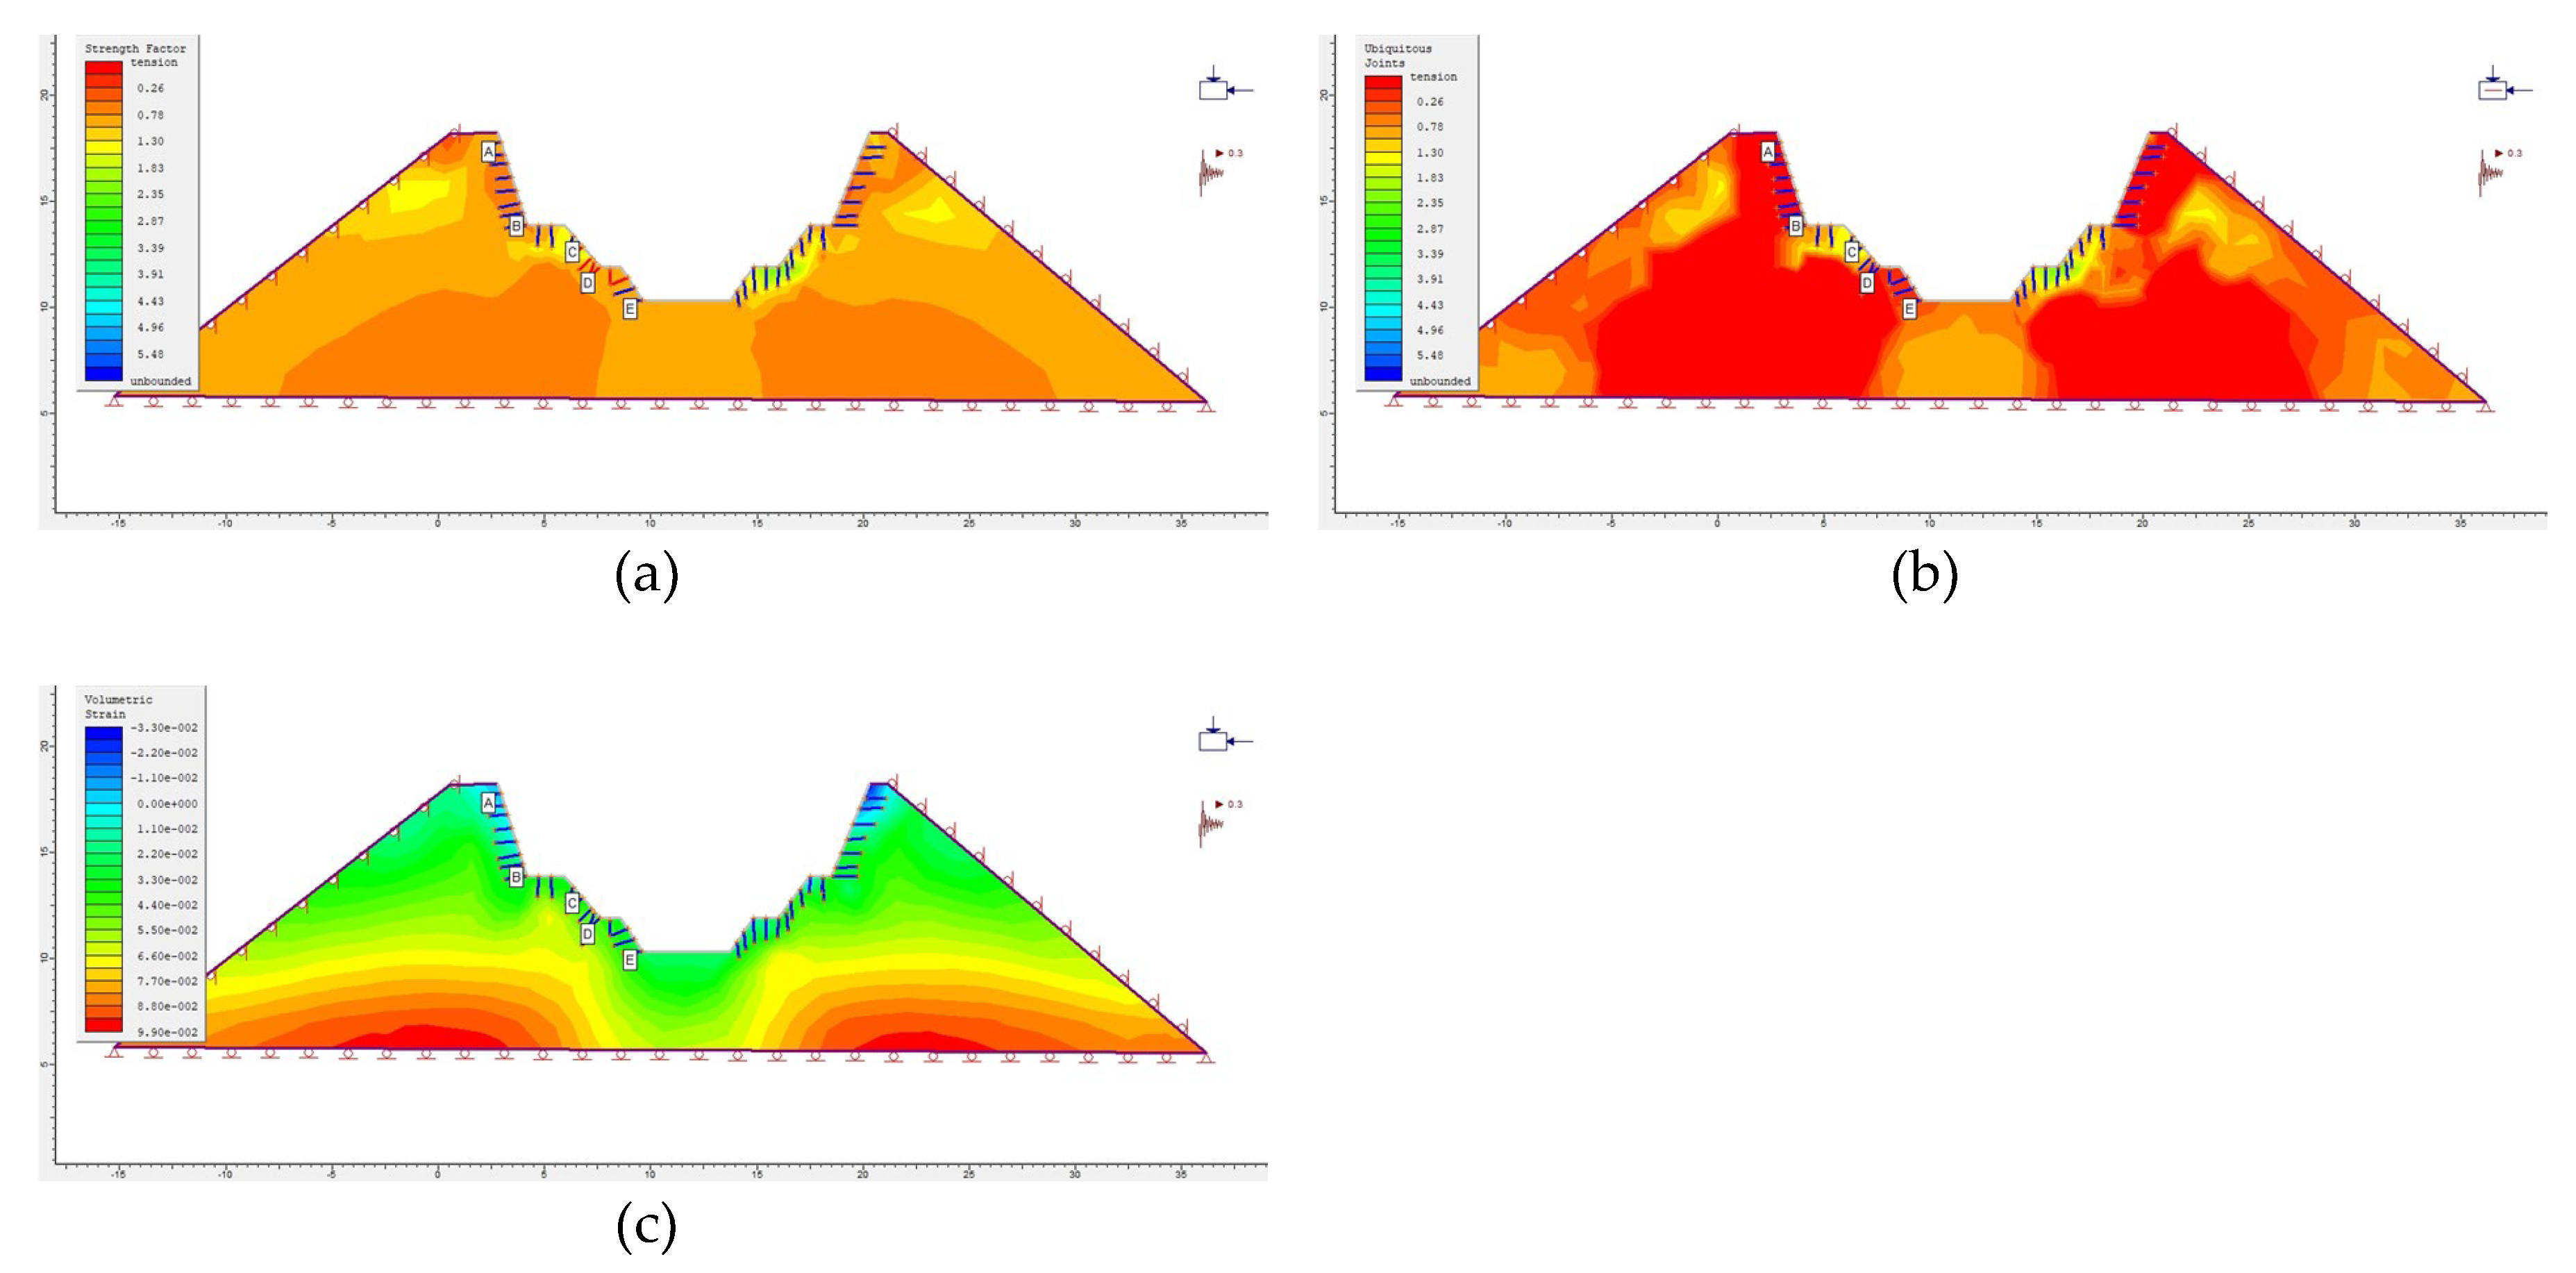
Figure 22.
Bolt 2 (a) Modelled strength factor distribution (supported excavation). (b) Modelled ubiquitous joint distribution (supported excavation). (c) Modelled volumetric strain distribution (supported excavation).
Figure 22.
Bolt 2 (a) Modelled strength factor distribution (supported excavation). (b) Modelled ubiquitous joint distribution (supported excavation). (c) Modelled volumetric strain distribution (supported excavation).
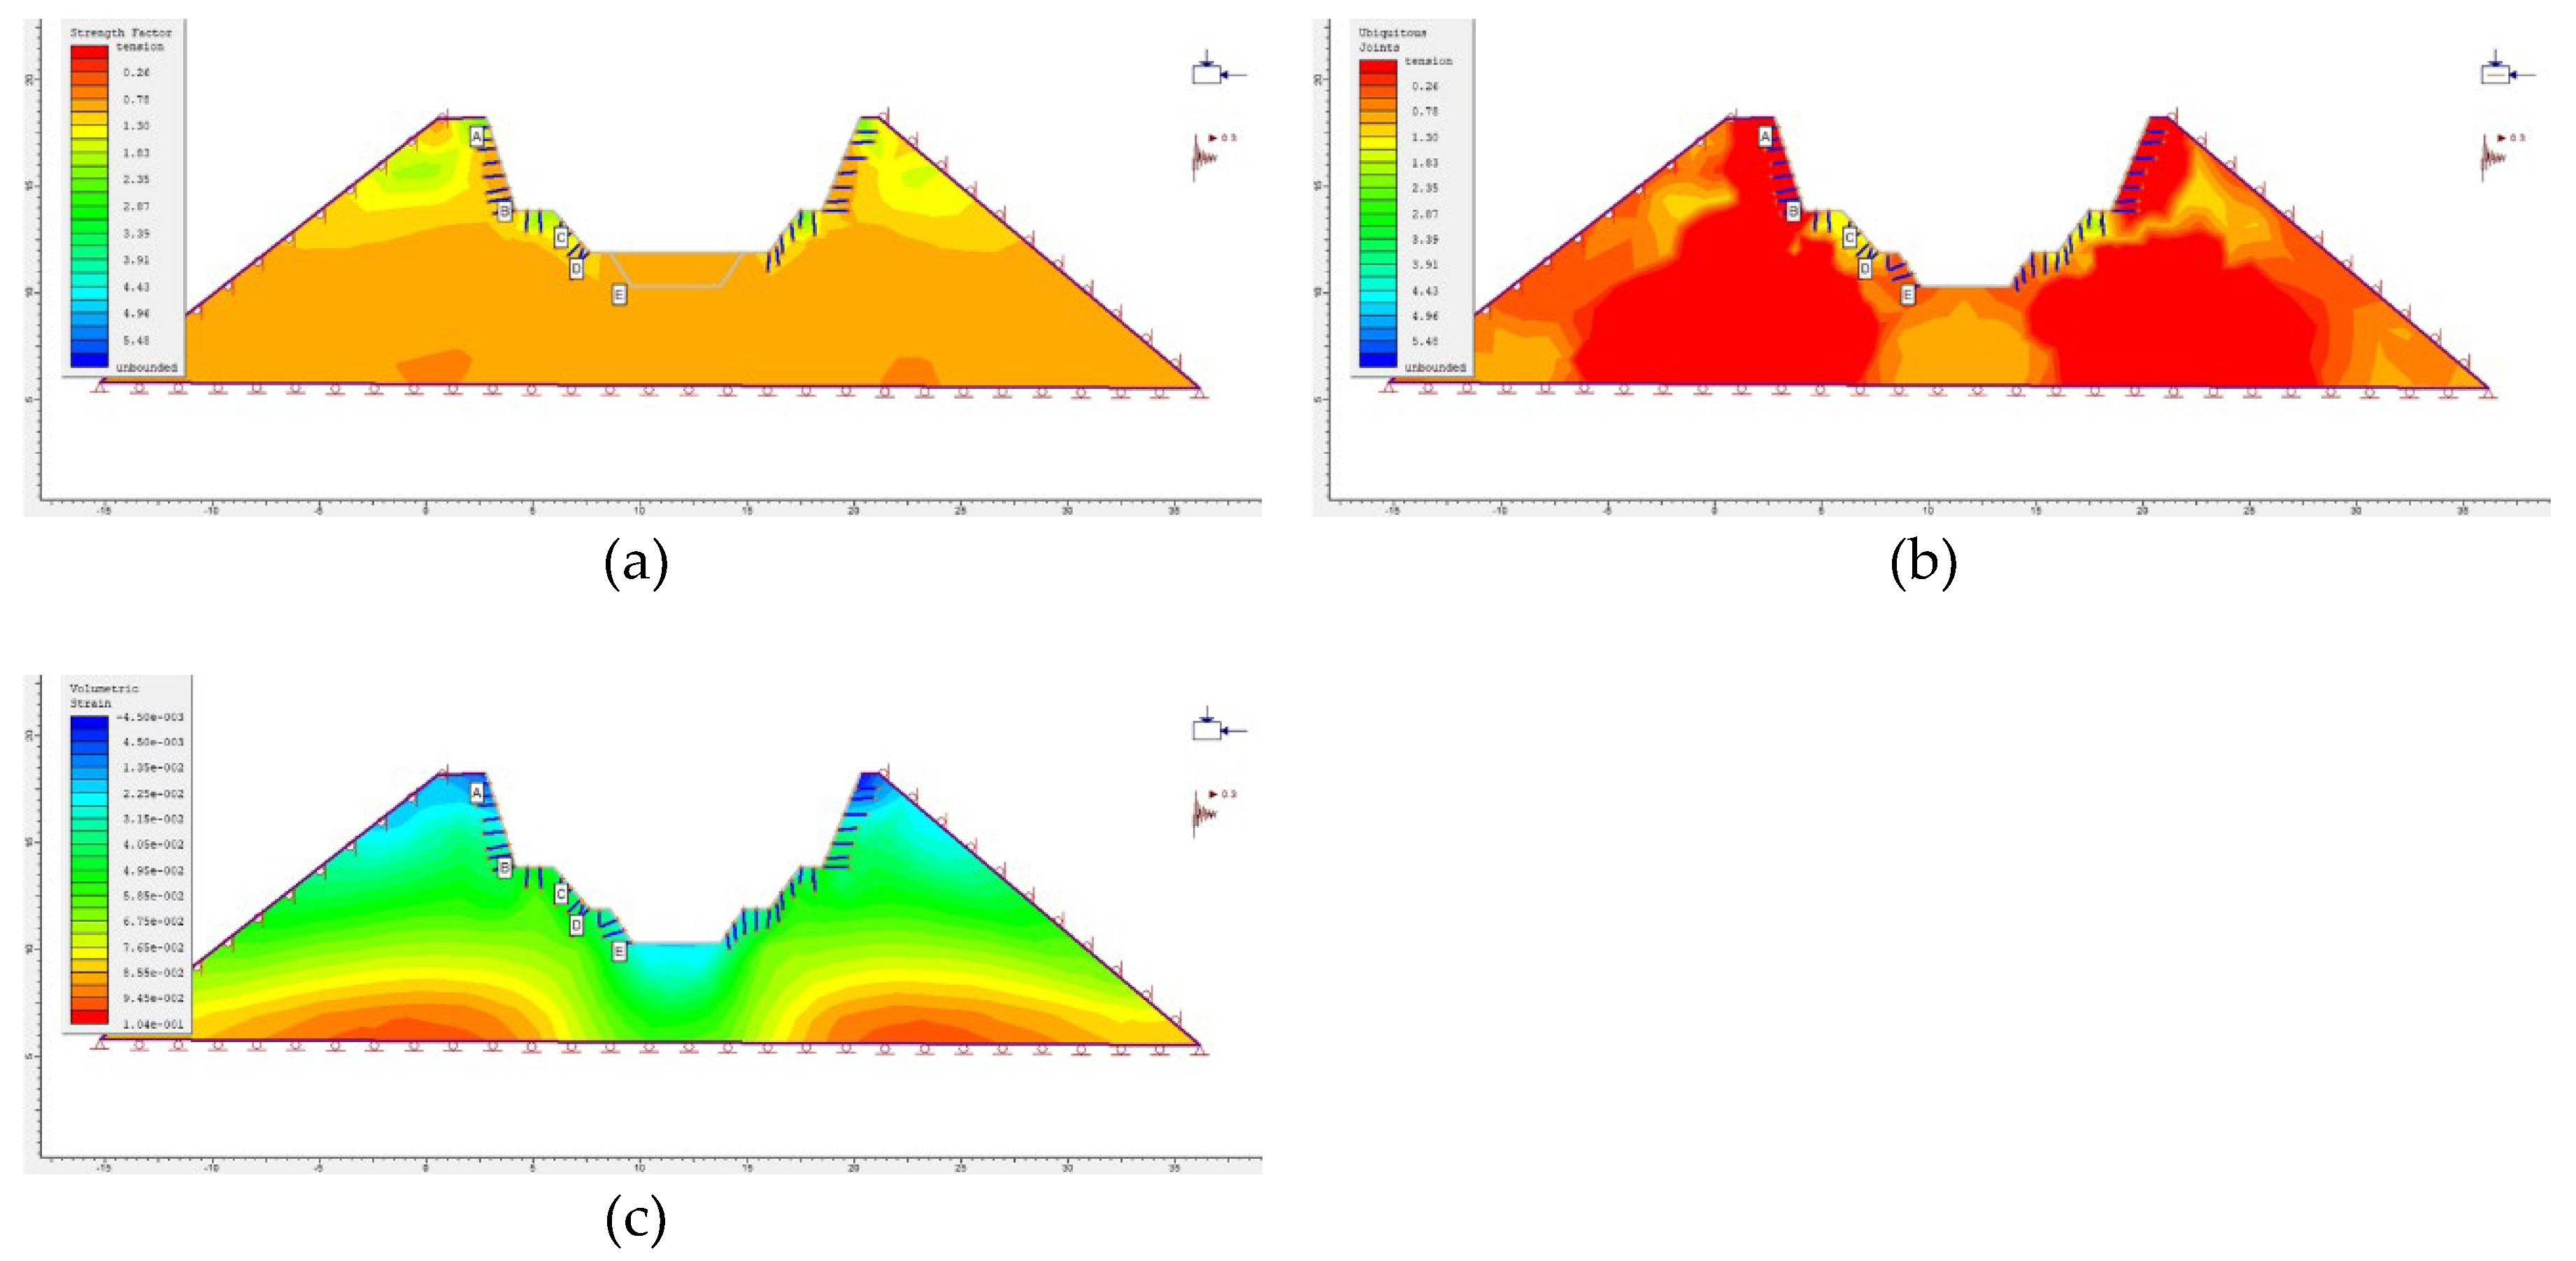
Figure 23.
Bolt 3 (a) Modelled strength factor distribution (supported excavation). (b) Modelled ubiquitous joint distribution (supported excavation). (c) Modelled volumetric strain distribution (supported excavation).
Figure 23.
Bolt 3 (a) Modelled strength factor distribution (supported excavation). (b) Modelled ubiquitous joint distribution (supported excavation). (c) Modelled volumetric strain distribution (supported excavation).
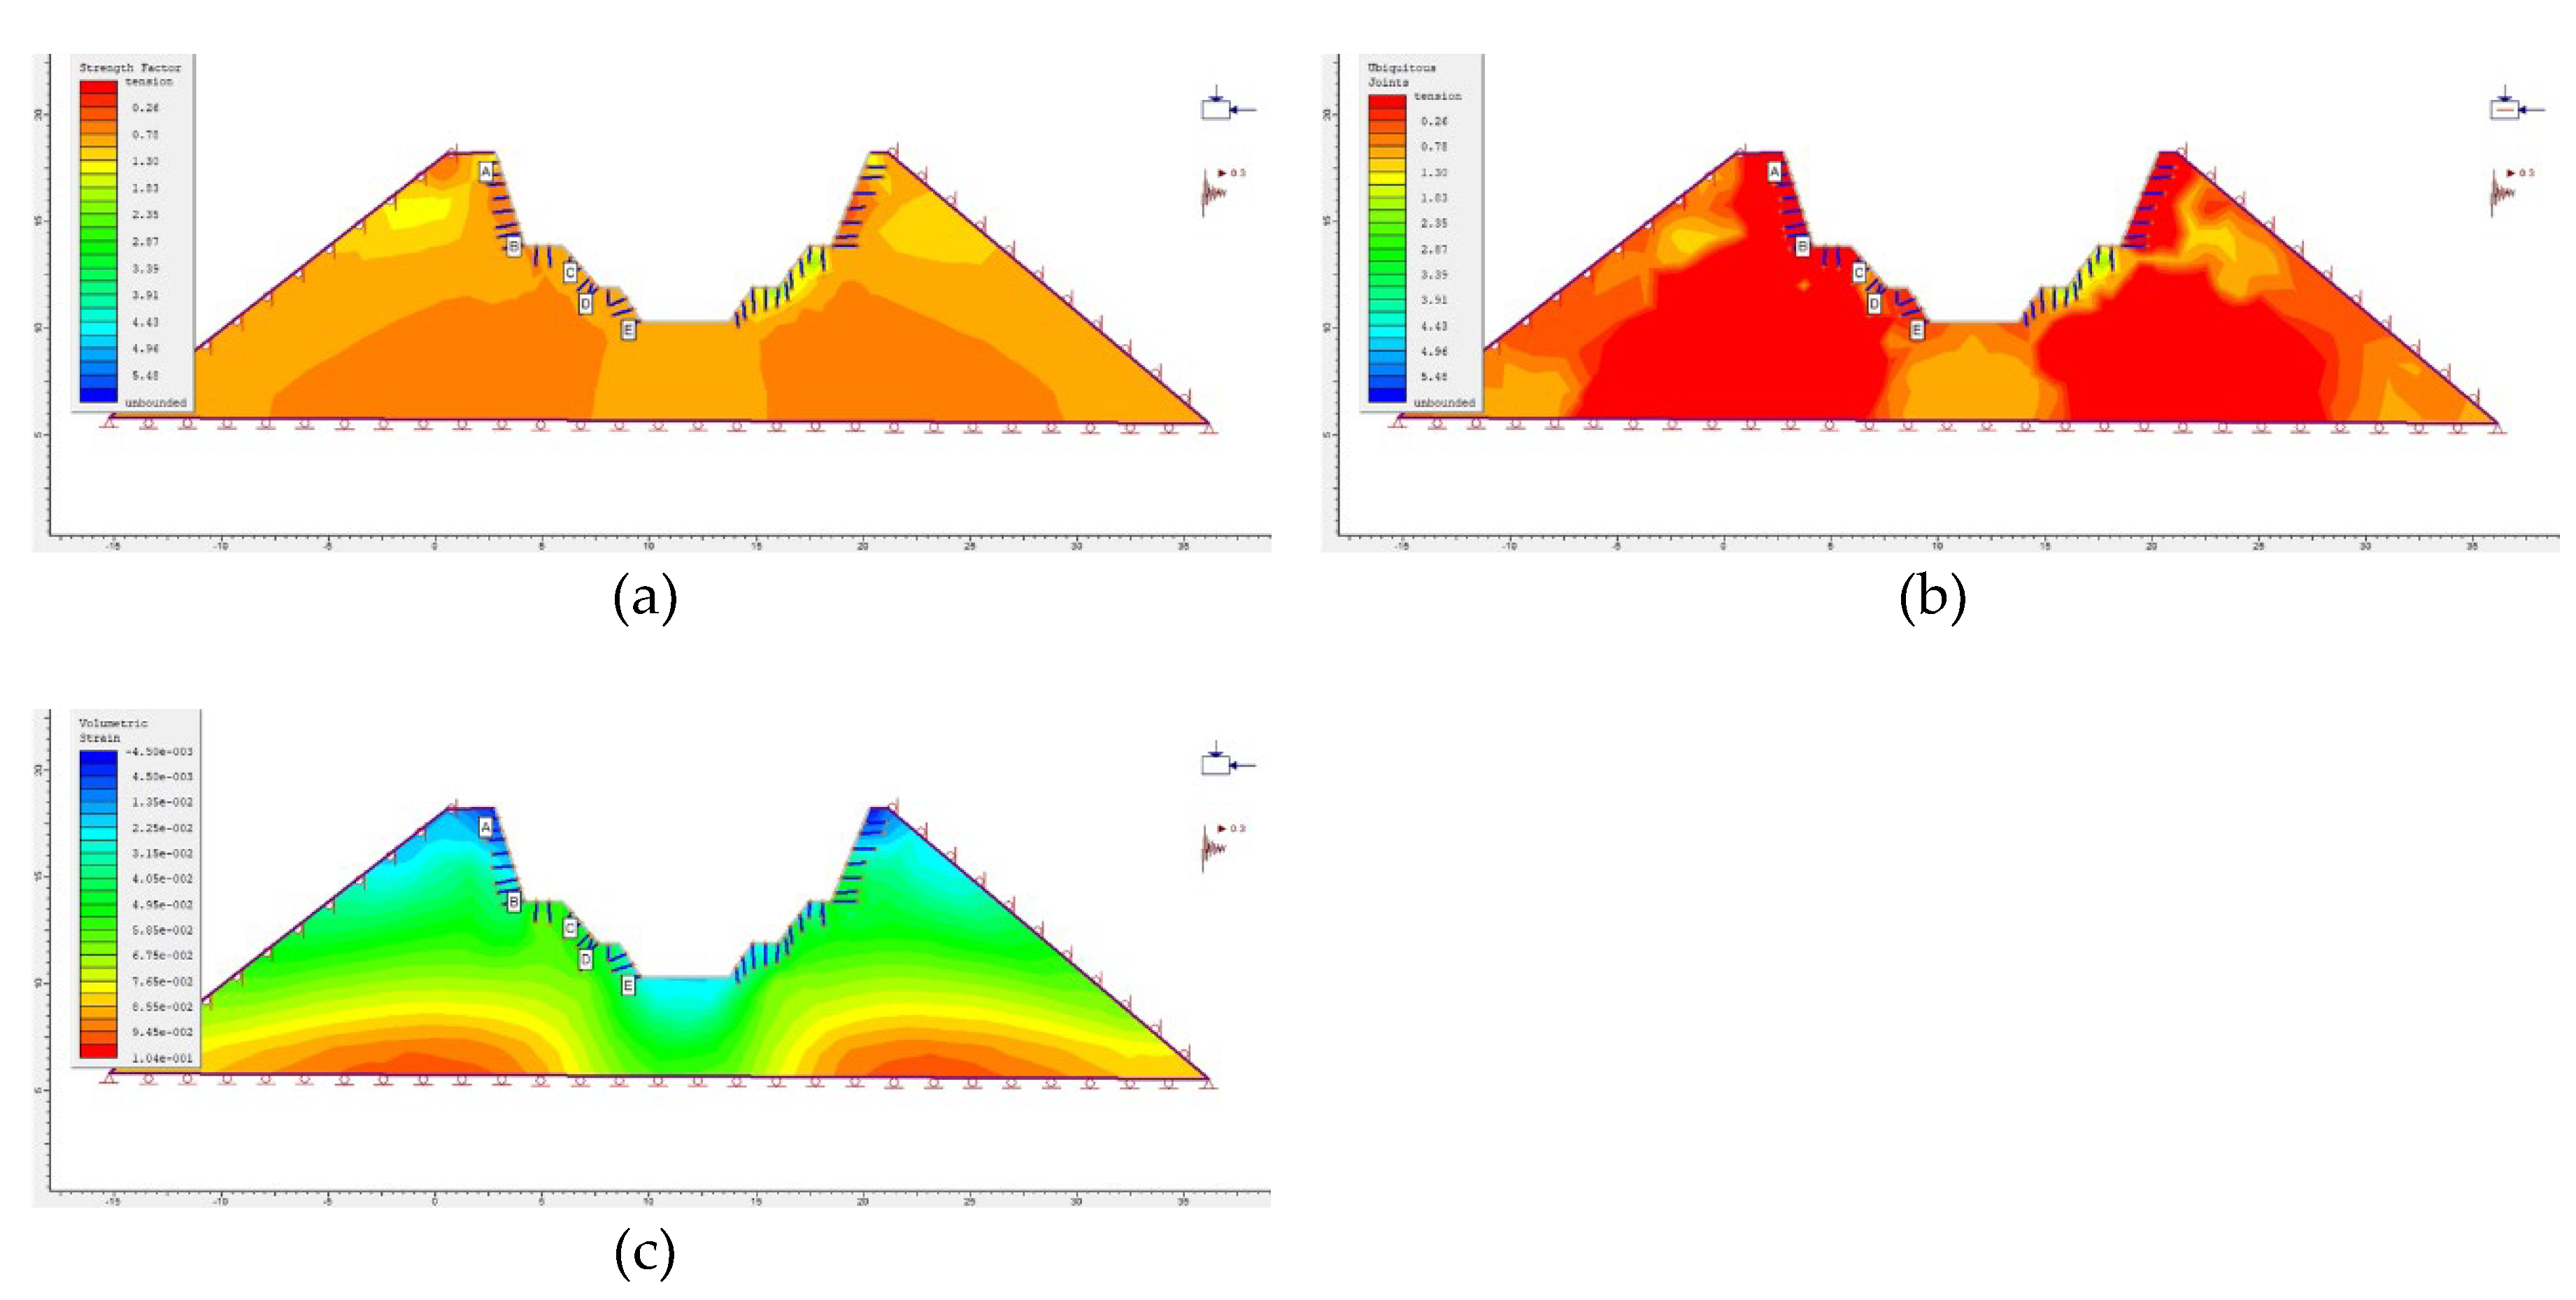
Figure 24.
Plots for surface excavations that are supported and unsupported. (a)Strength Factor vs Depth. (b) Ubiquitous Joints vs Depth. (c) Volumetric Strain vs Depth.
Figure 24.
Plots for surface excavations that are supported and unsupported. (a)Strength Factor vs Depth. (b) Ubiquitous Joints vs Depth. (c) Volumetric Strain vs Depth.
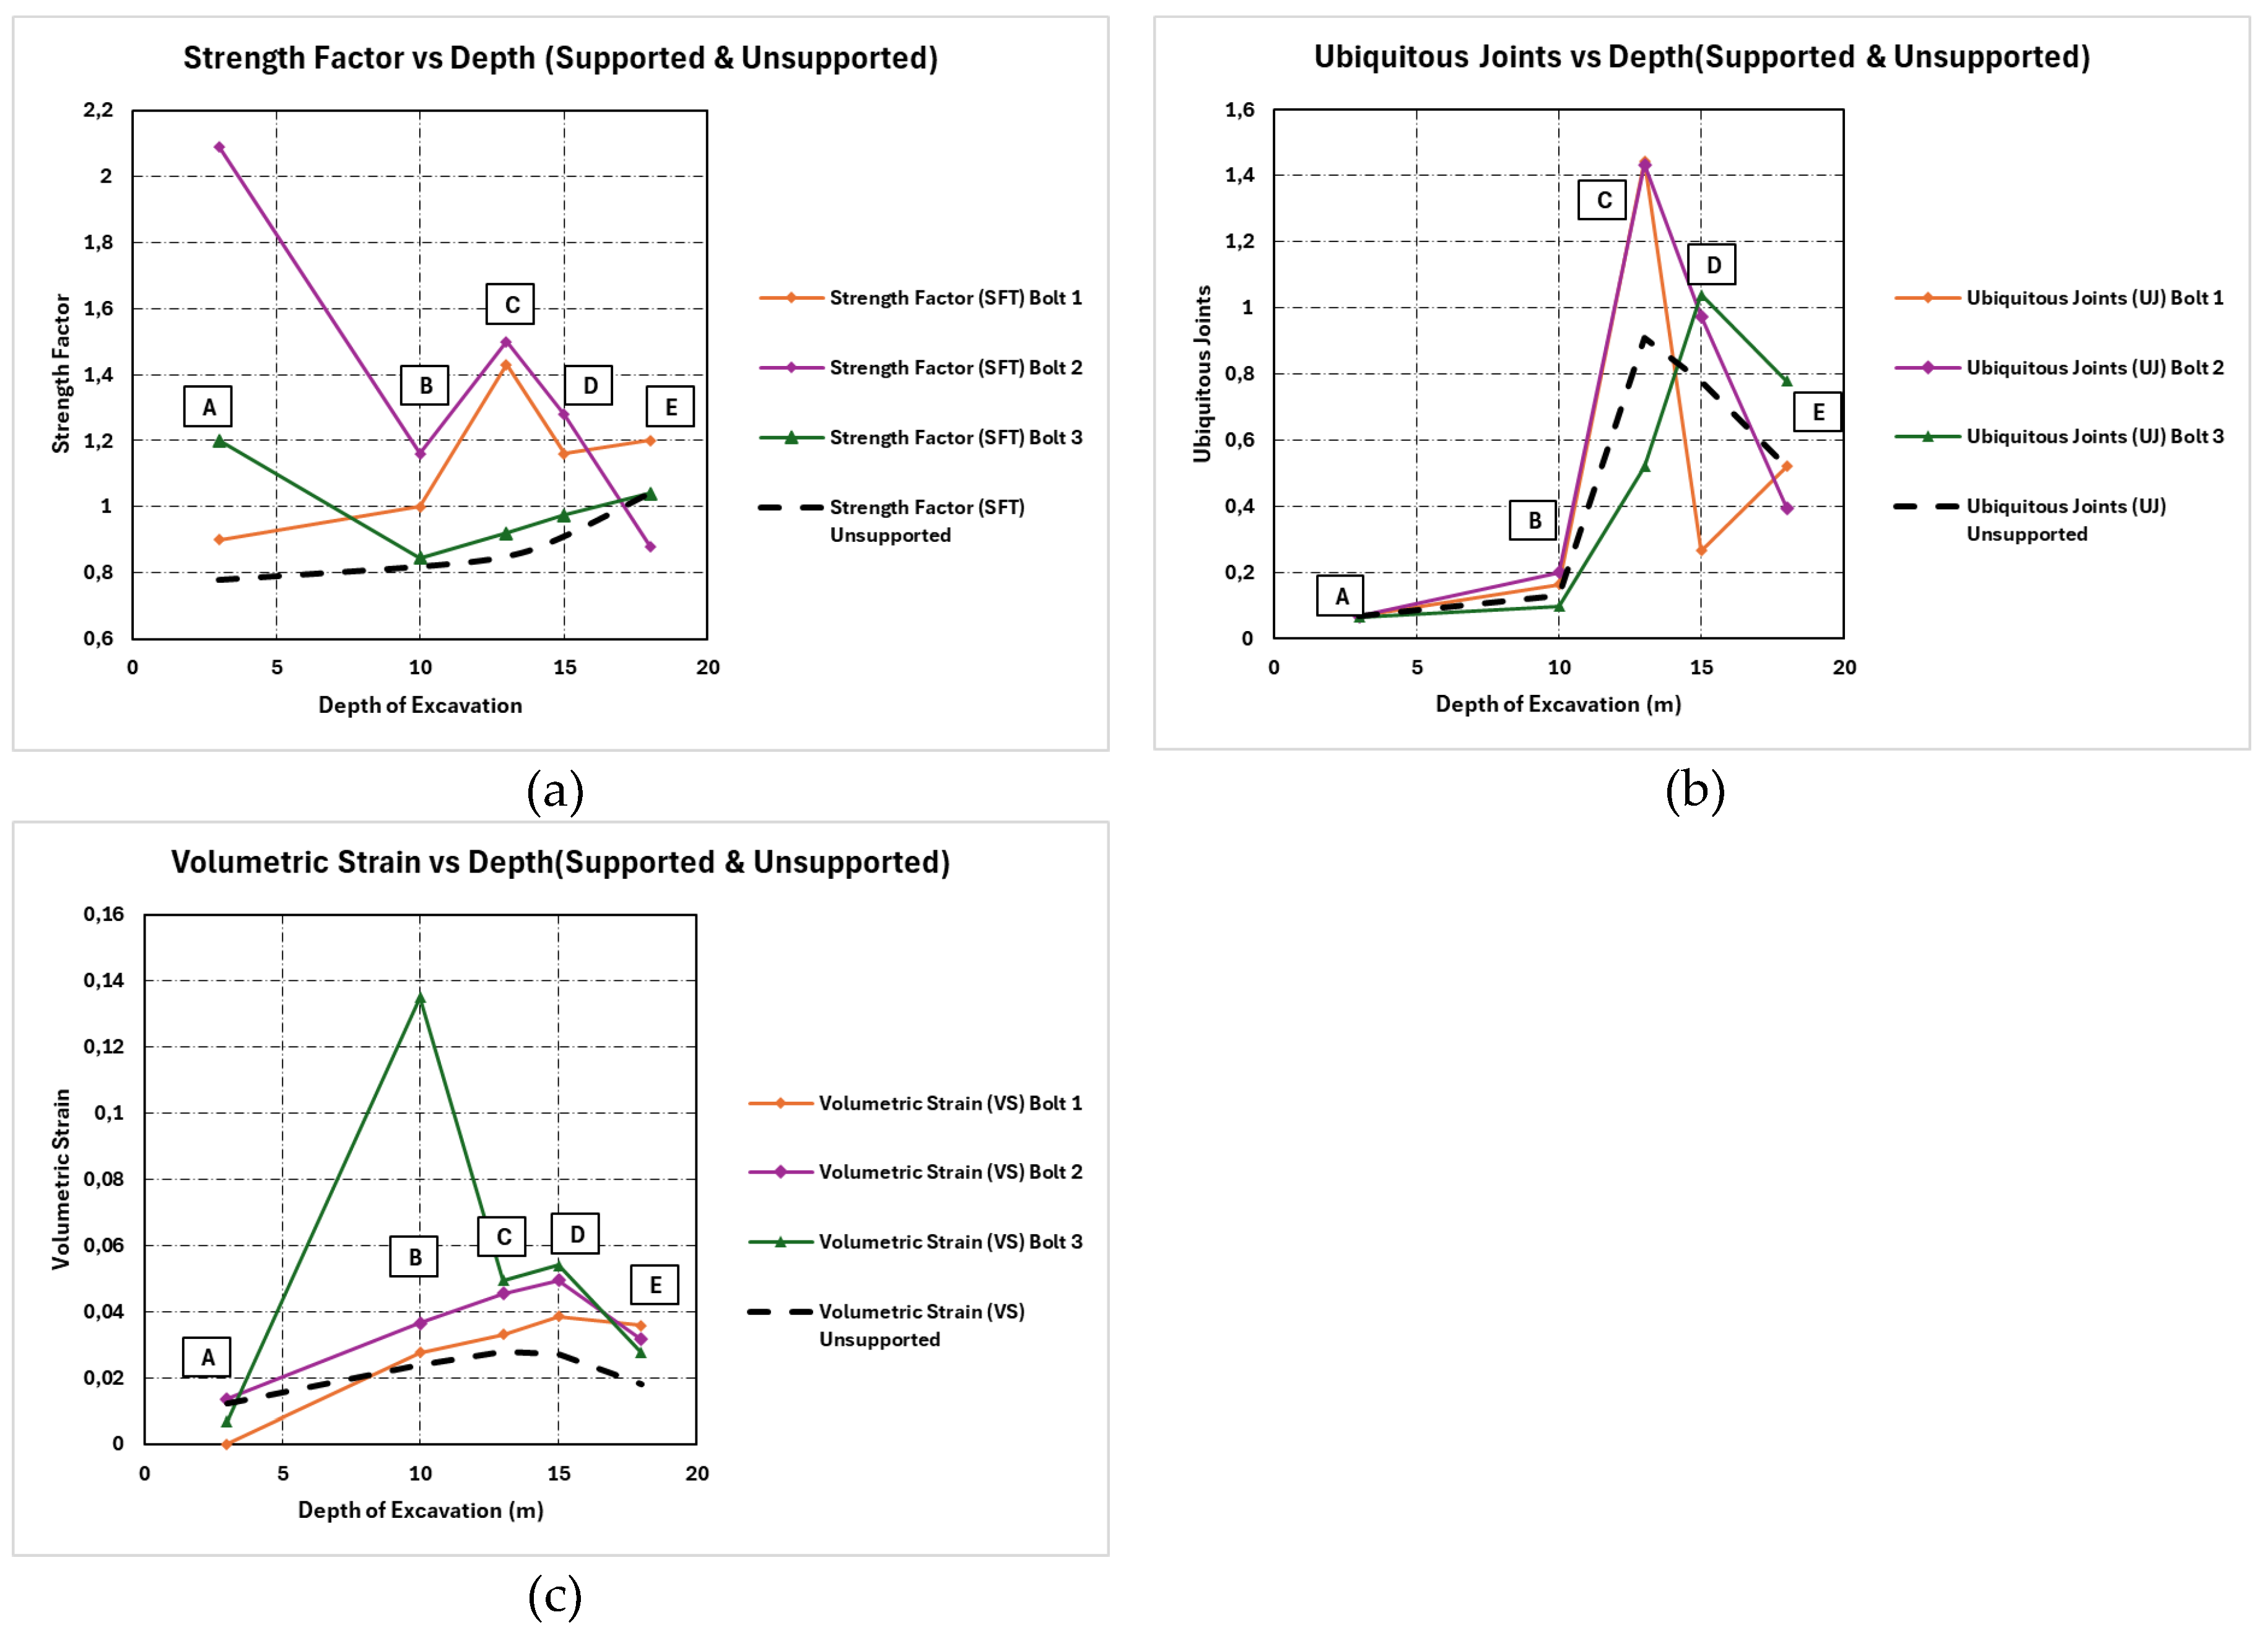
Figure 25.
Three-dimensional visualisation of wedge geometry in the unsupported tunnel scenario.
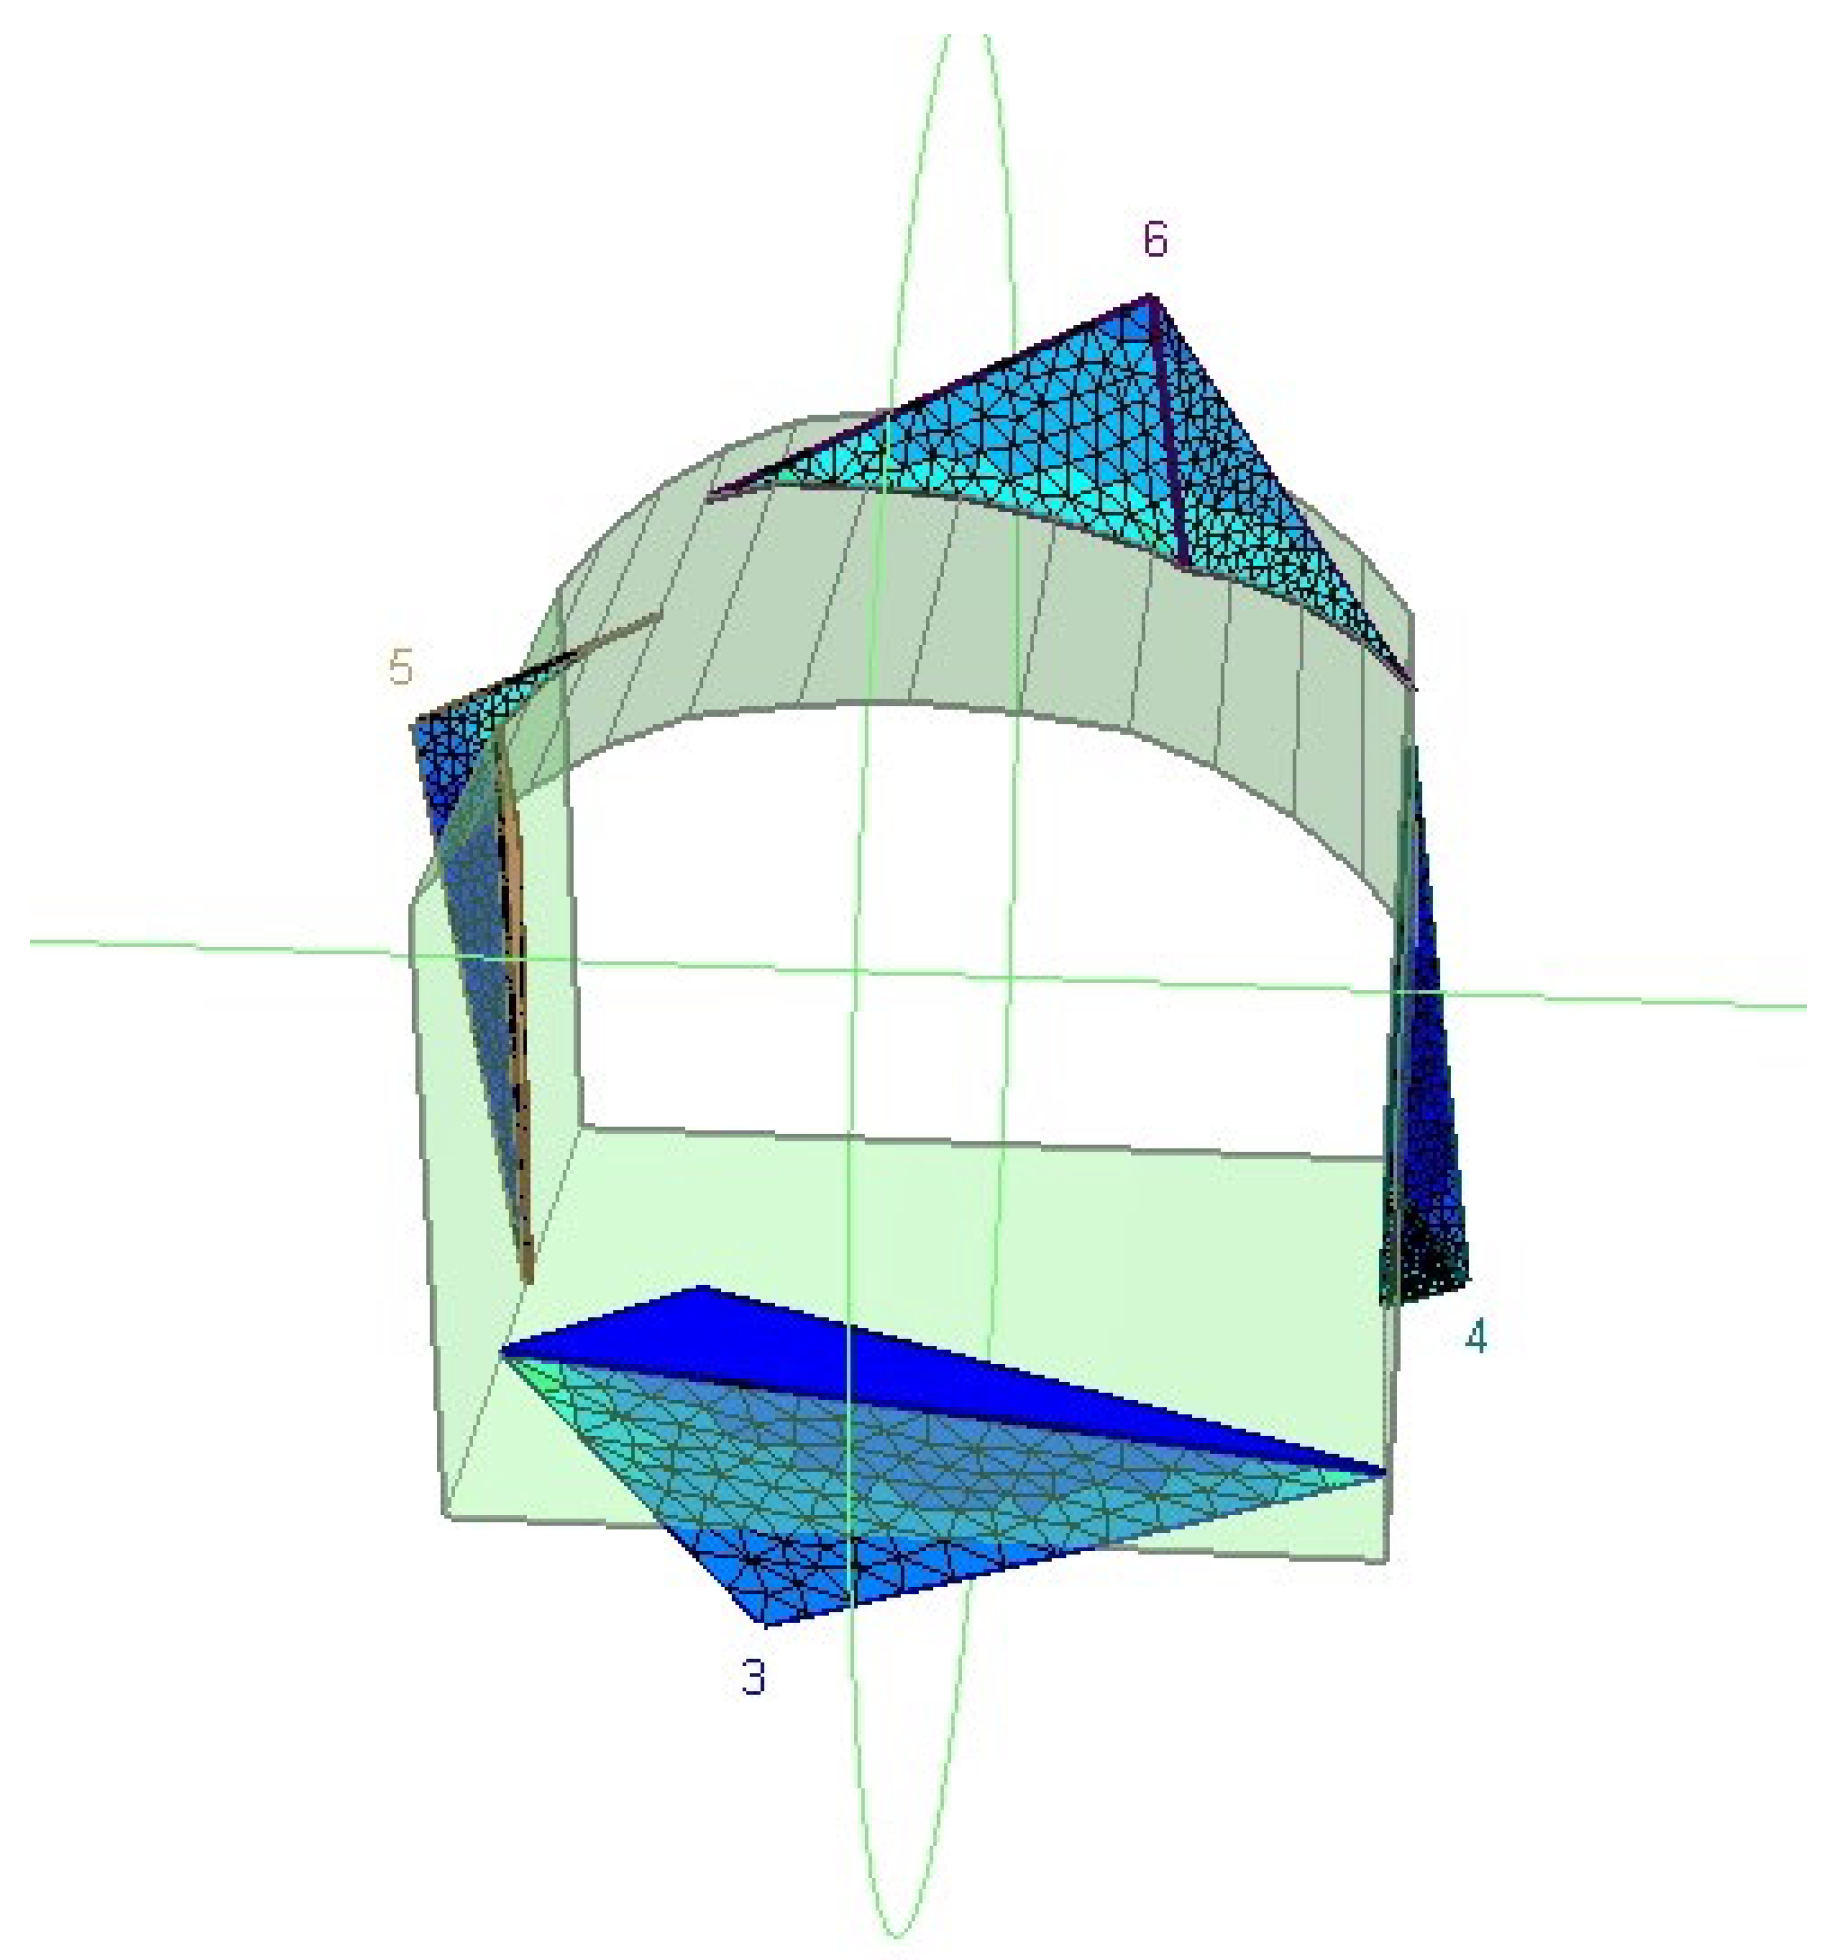
Figure 26.
Simulated tunnel response using 190 mm resin bolts at spacings of (a) 0.5 m, (b) 1.0 m, (c) 1.5 m, and (d) 2.0 m. Plots show major principal stress contours highlighting the evolution of support effectiveness and failure localisation under dynamic loading.
Figure 26.
Simulated tunnel response using 190 mm resin bolts at spacings of (a) 0.5 m, (b) 1.0 m, (c) 1.5 m, and (d) 2.0 m. Plots show major principal stress contours highlighting the evolution of support effectiveness and failure localisation under dynamic loading.
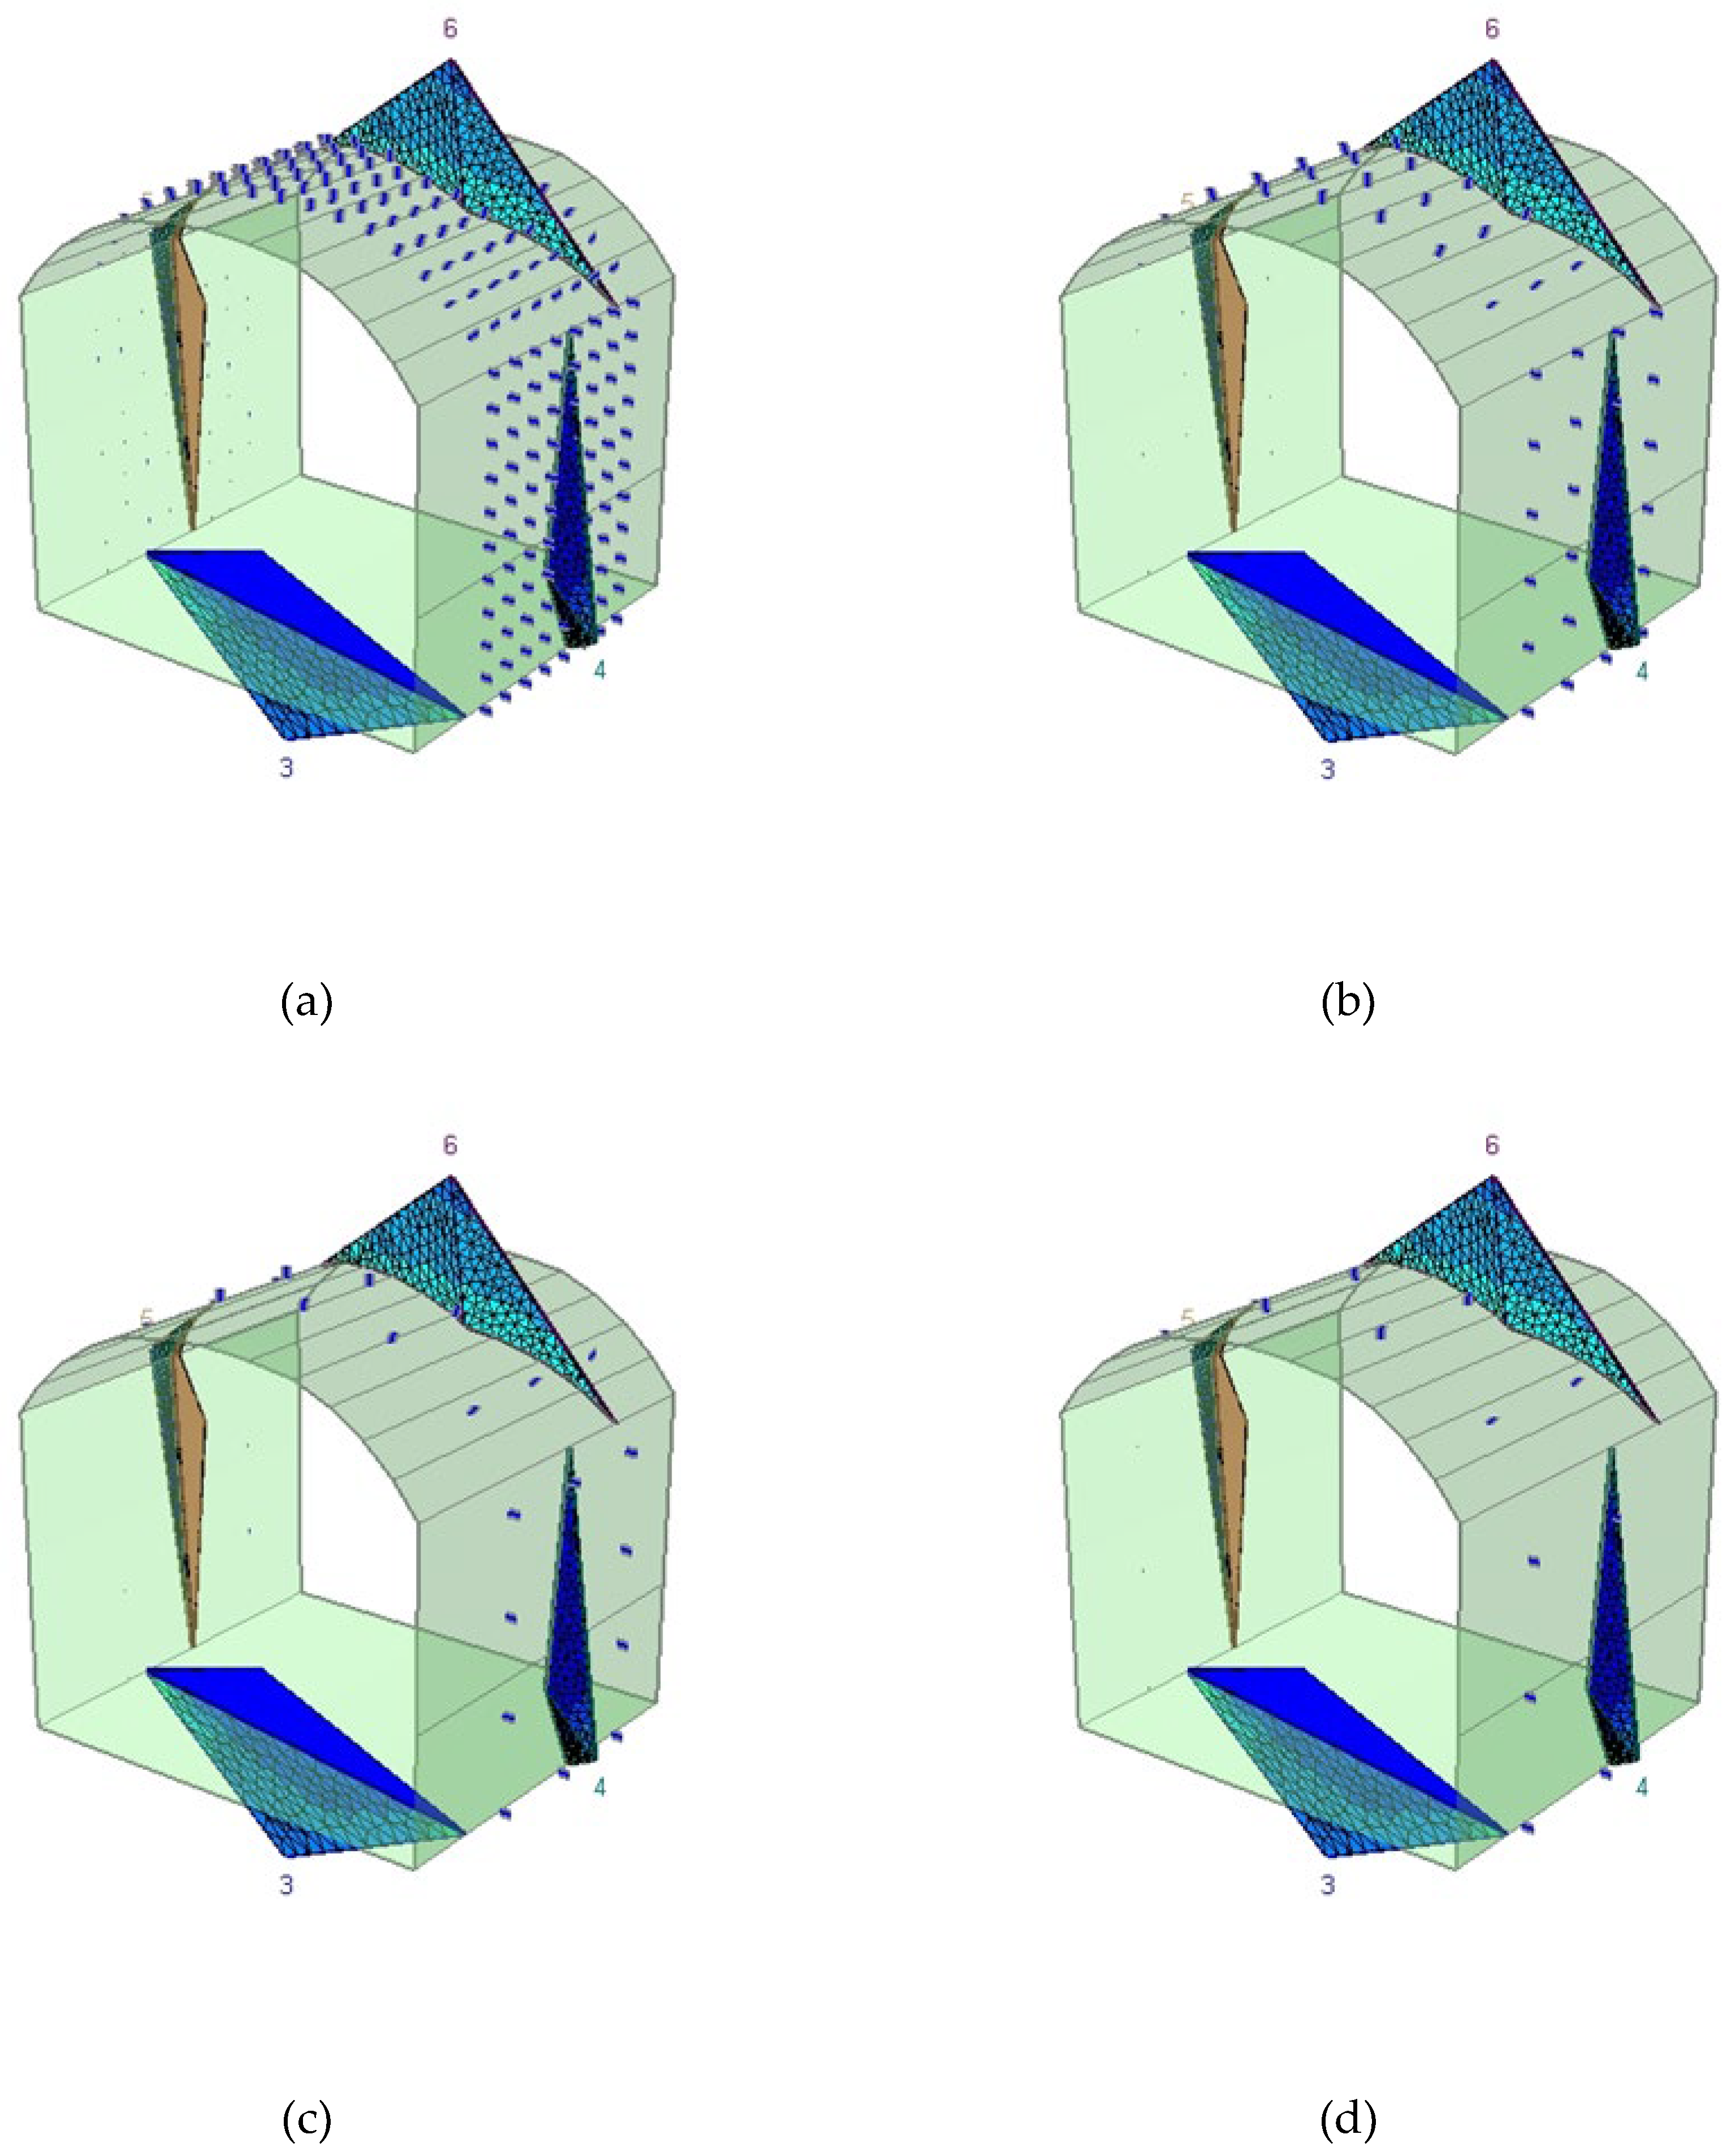
Figure 27.
Stress distribution and bolt interaction patterns for 200 mm bolts at varying spacings: (a) 0.5 m, (b) 1.0 m, (c) 1.5 m, and (d) 2.0 m. The figures illustrate progressive loss of confinement and increased stress localisation as spacing increases, particularly near the roof and wall wedges. Optimal load transfer and bolt engagement are observed at or below 1.0 m spacing.
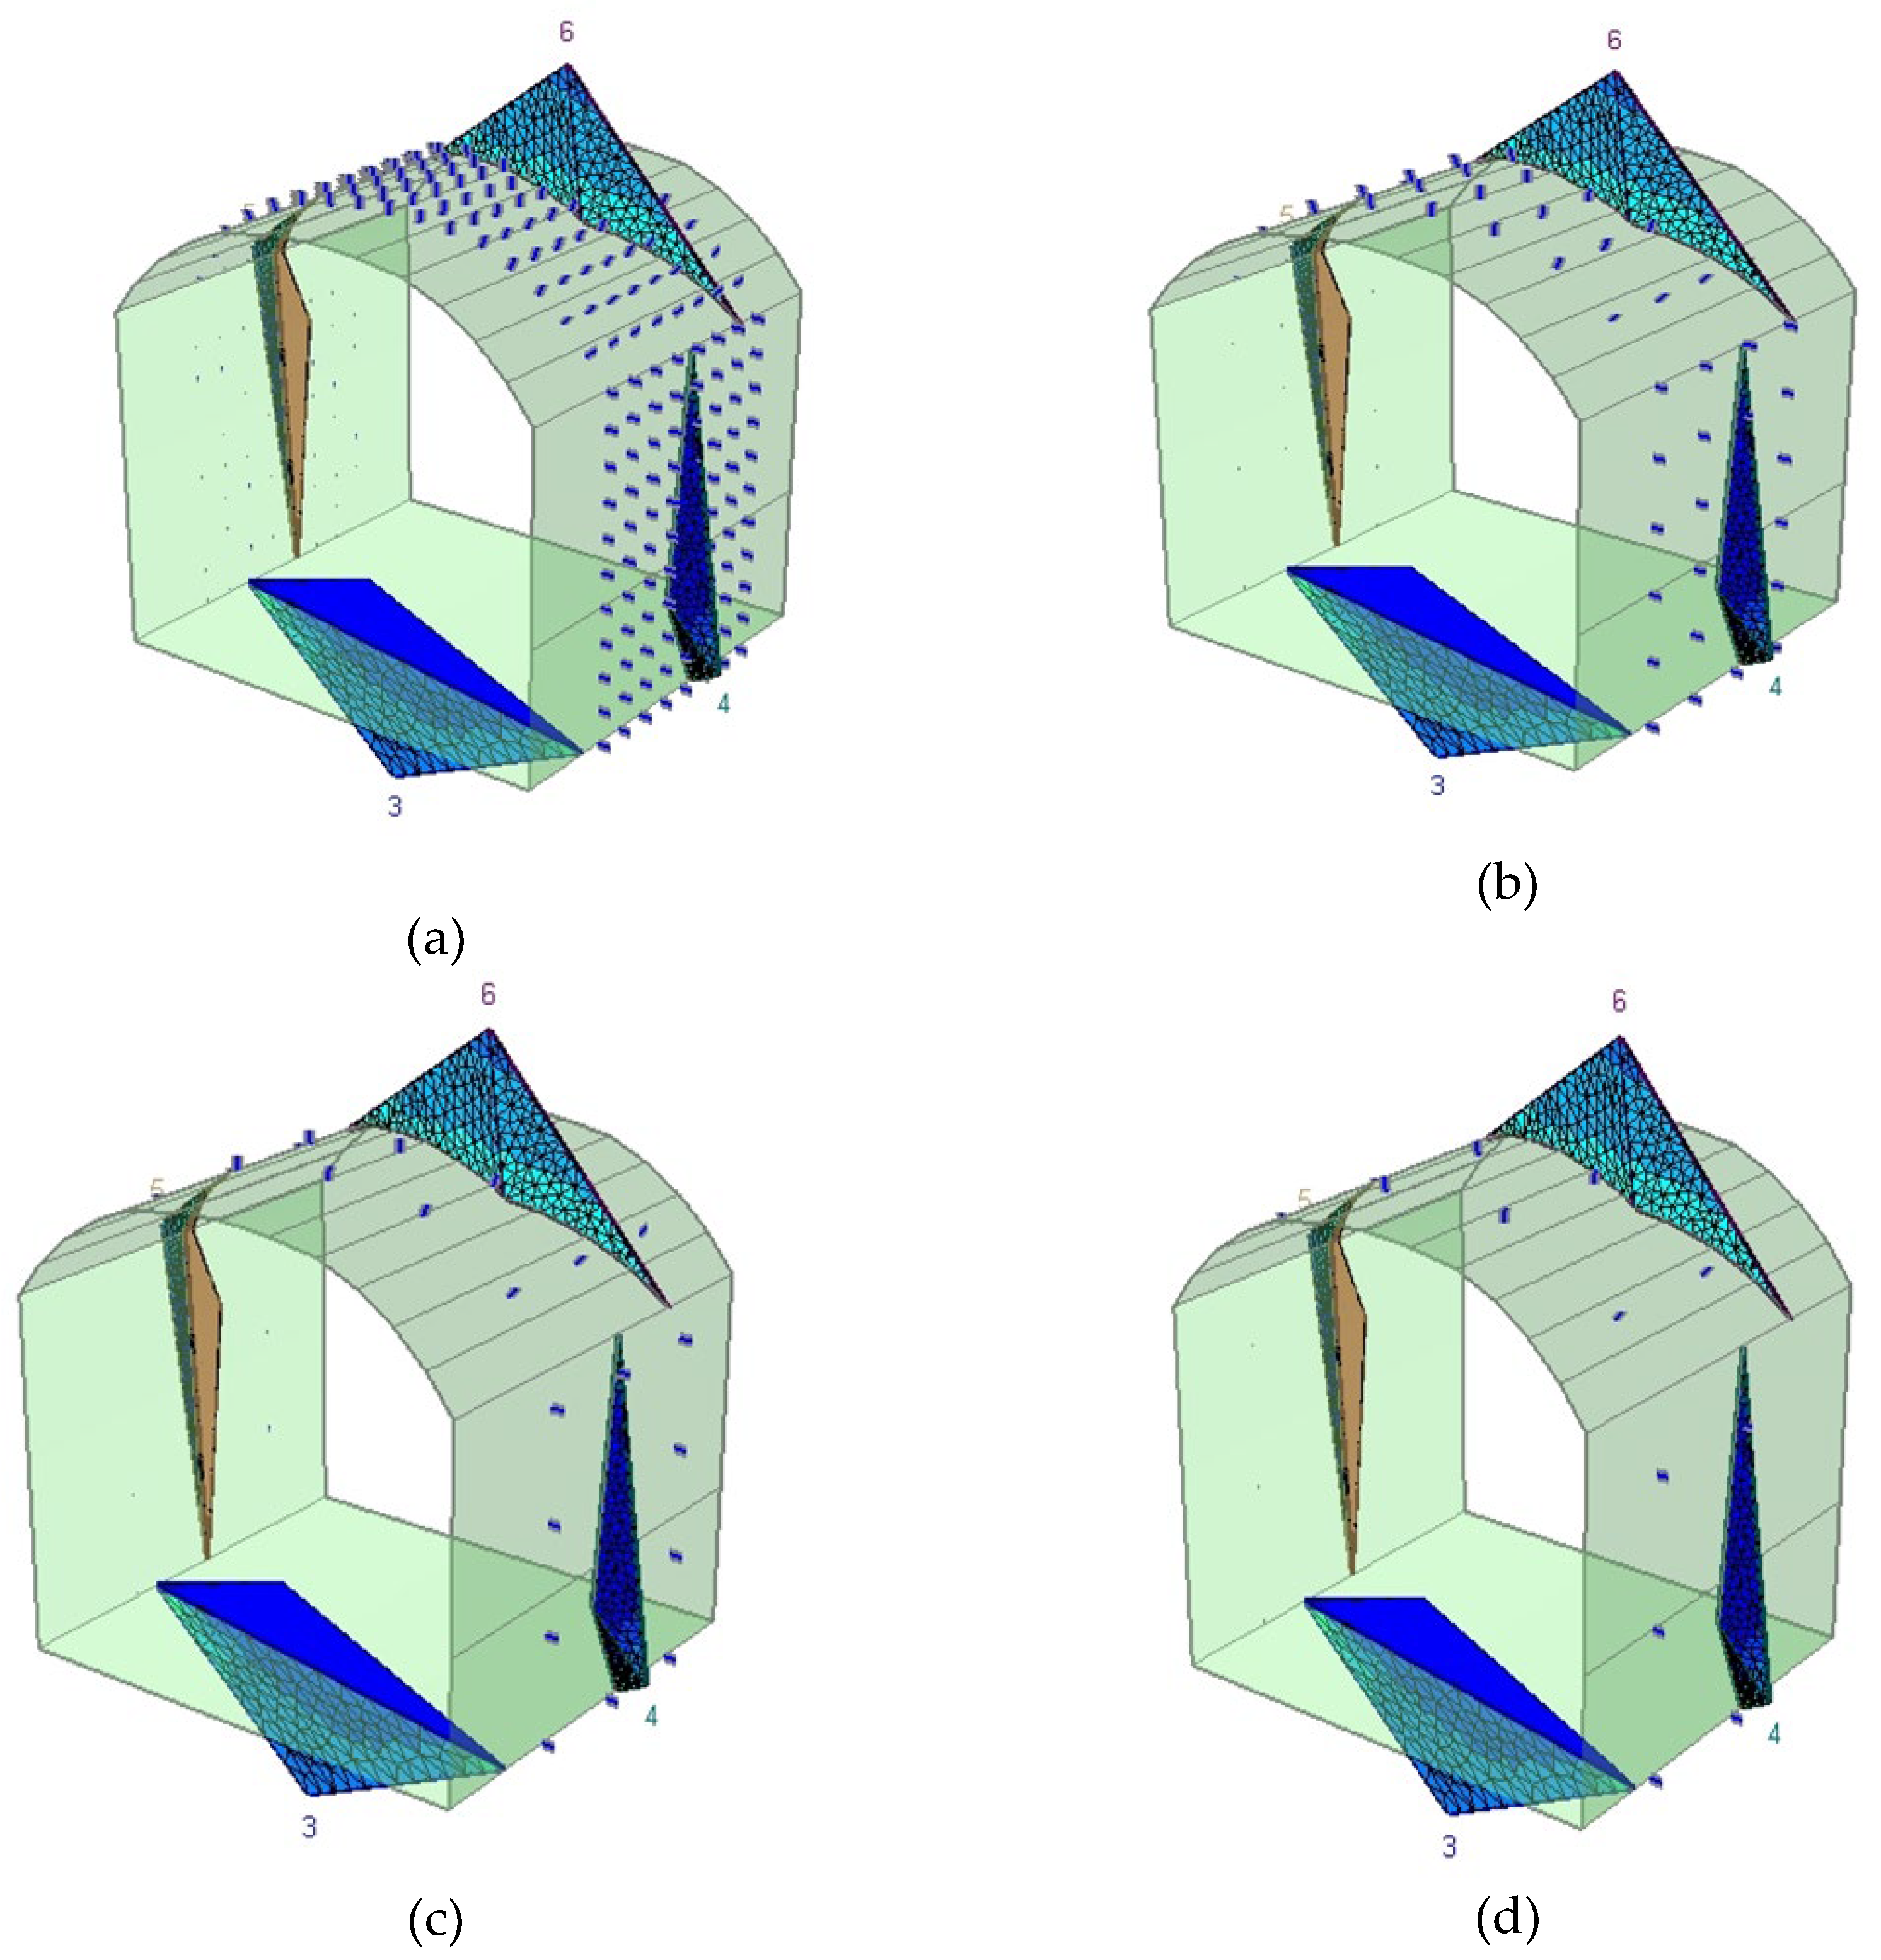
Figure 28.
Stress distribution and bolt engagement under dynamic loads for 250 mm bolts at varying spacing: (a) 0.5 m spacing, (b) 1.0 m spacing, (c) 1.5 m spacing. Increased spacing correlates with heightened stress localisation and reduced bolt efficacy, particularly near the roof and shoulder wedges.
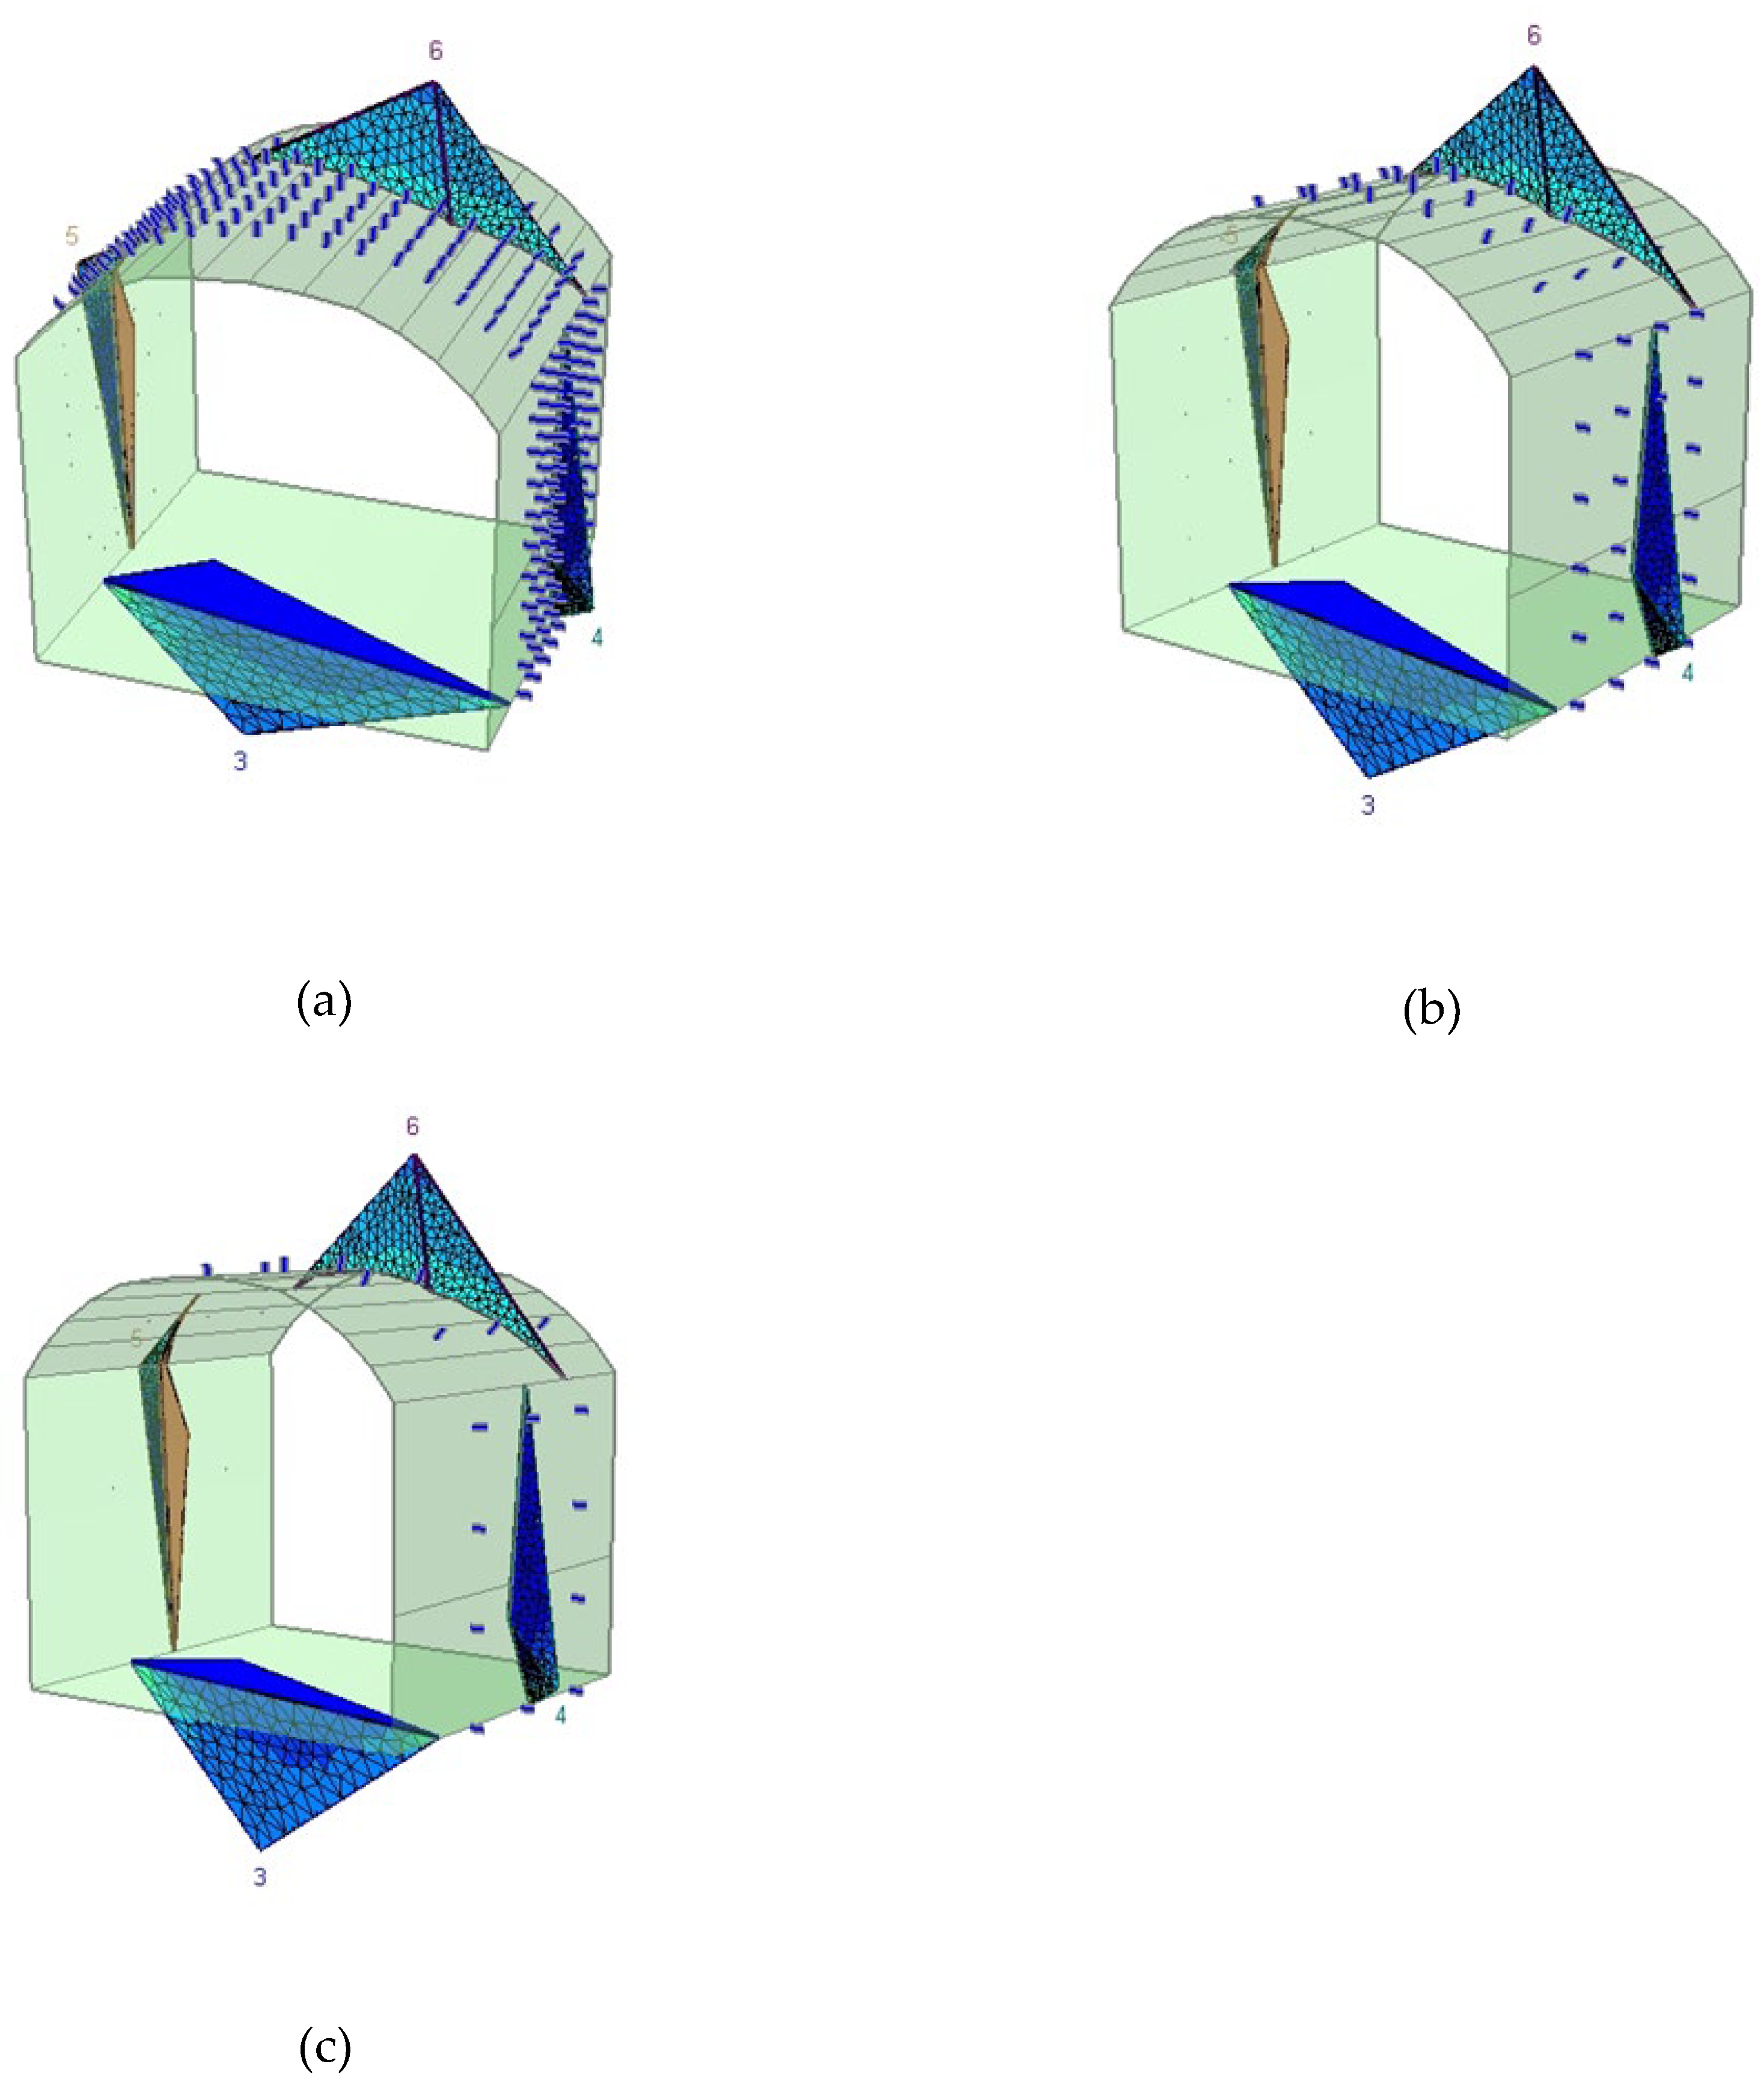
Figure 30.
Ground Reaction and Support Reaction Curves for Varying Bolt Spacings (a) 0.1 m and (b) 0.5 m.
Figure 30.
Ground Reaction and Support Reaction Curves for Varying Bolt Spacings (a) 0.1 m and (b) 0.5 m.
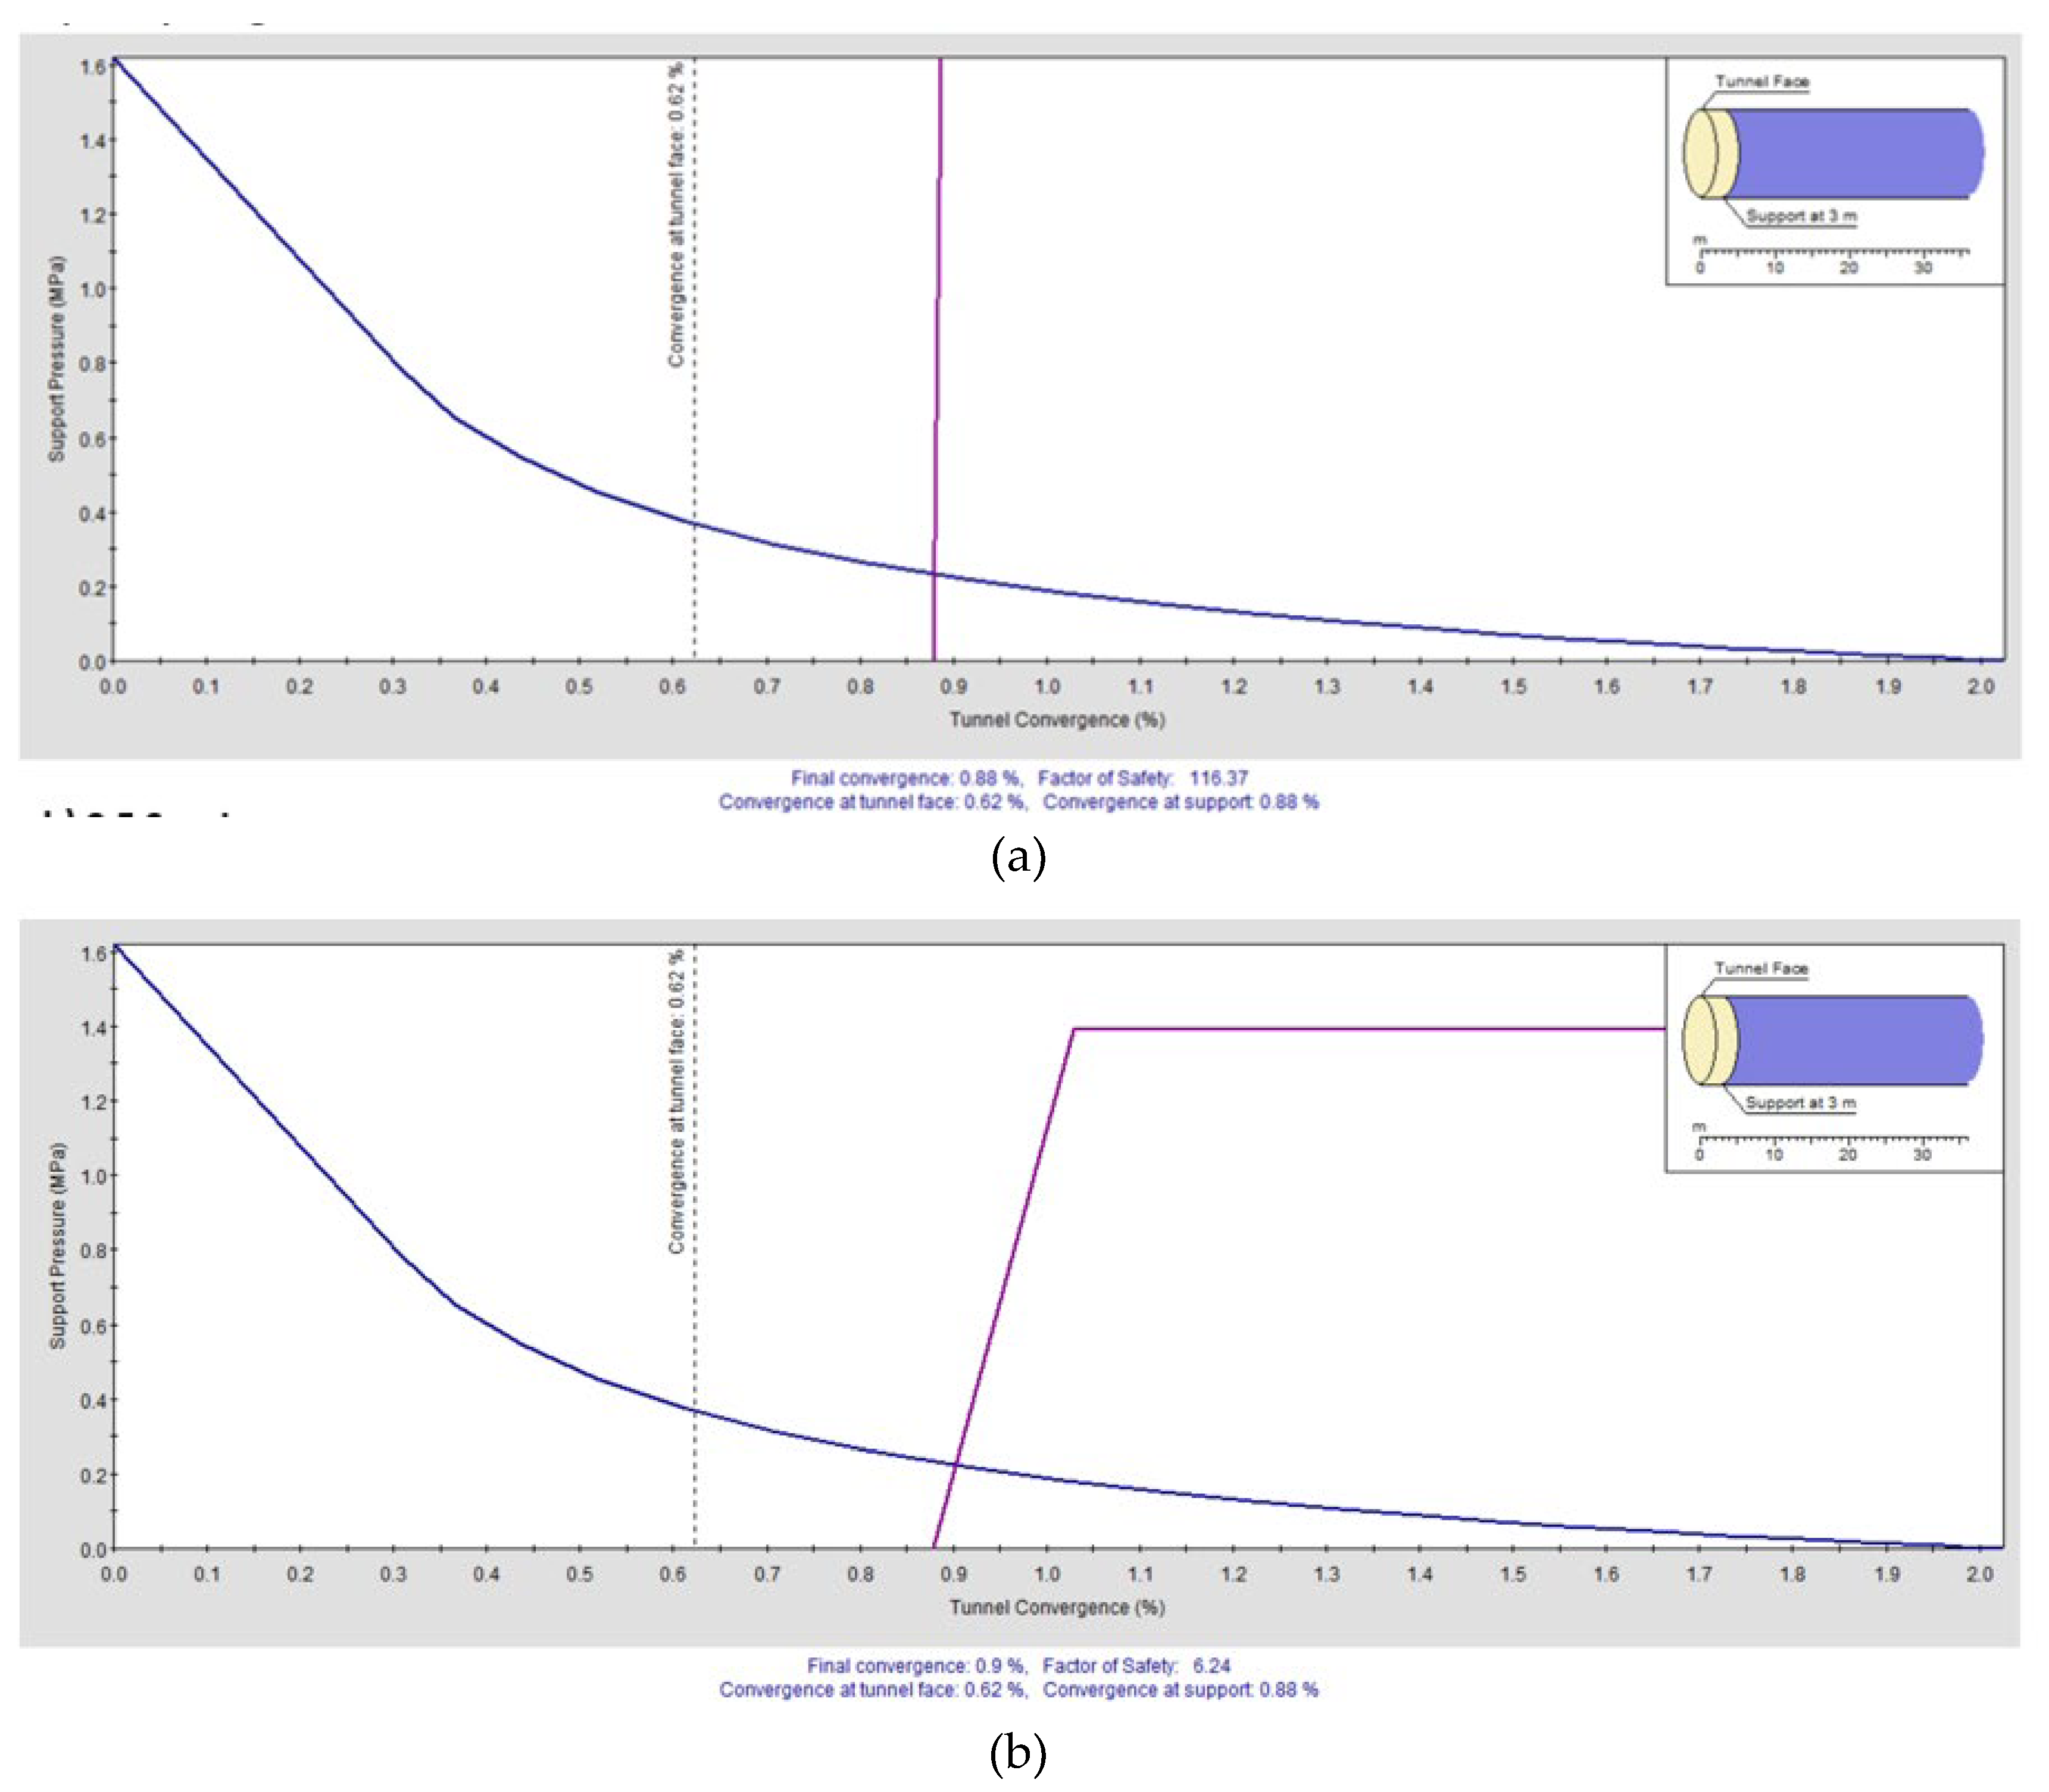
Figure 31.
Ground Reaction and Support Reaction Curves for Varying Bolt Spacings (a) 1.0 m and (b) 1.5 m.
Figure 31.
Ground Reaction and Support Reaction Curves for Varying Bolt Spacings (a) 1.0 m and (b) 1.5 m.
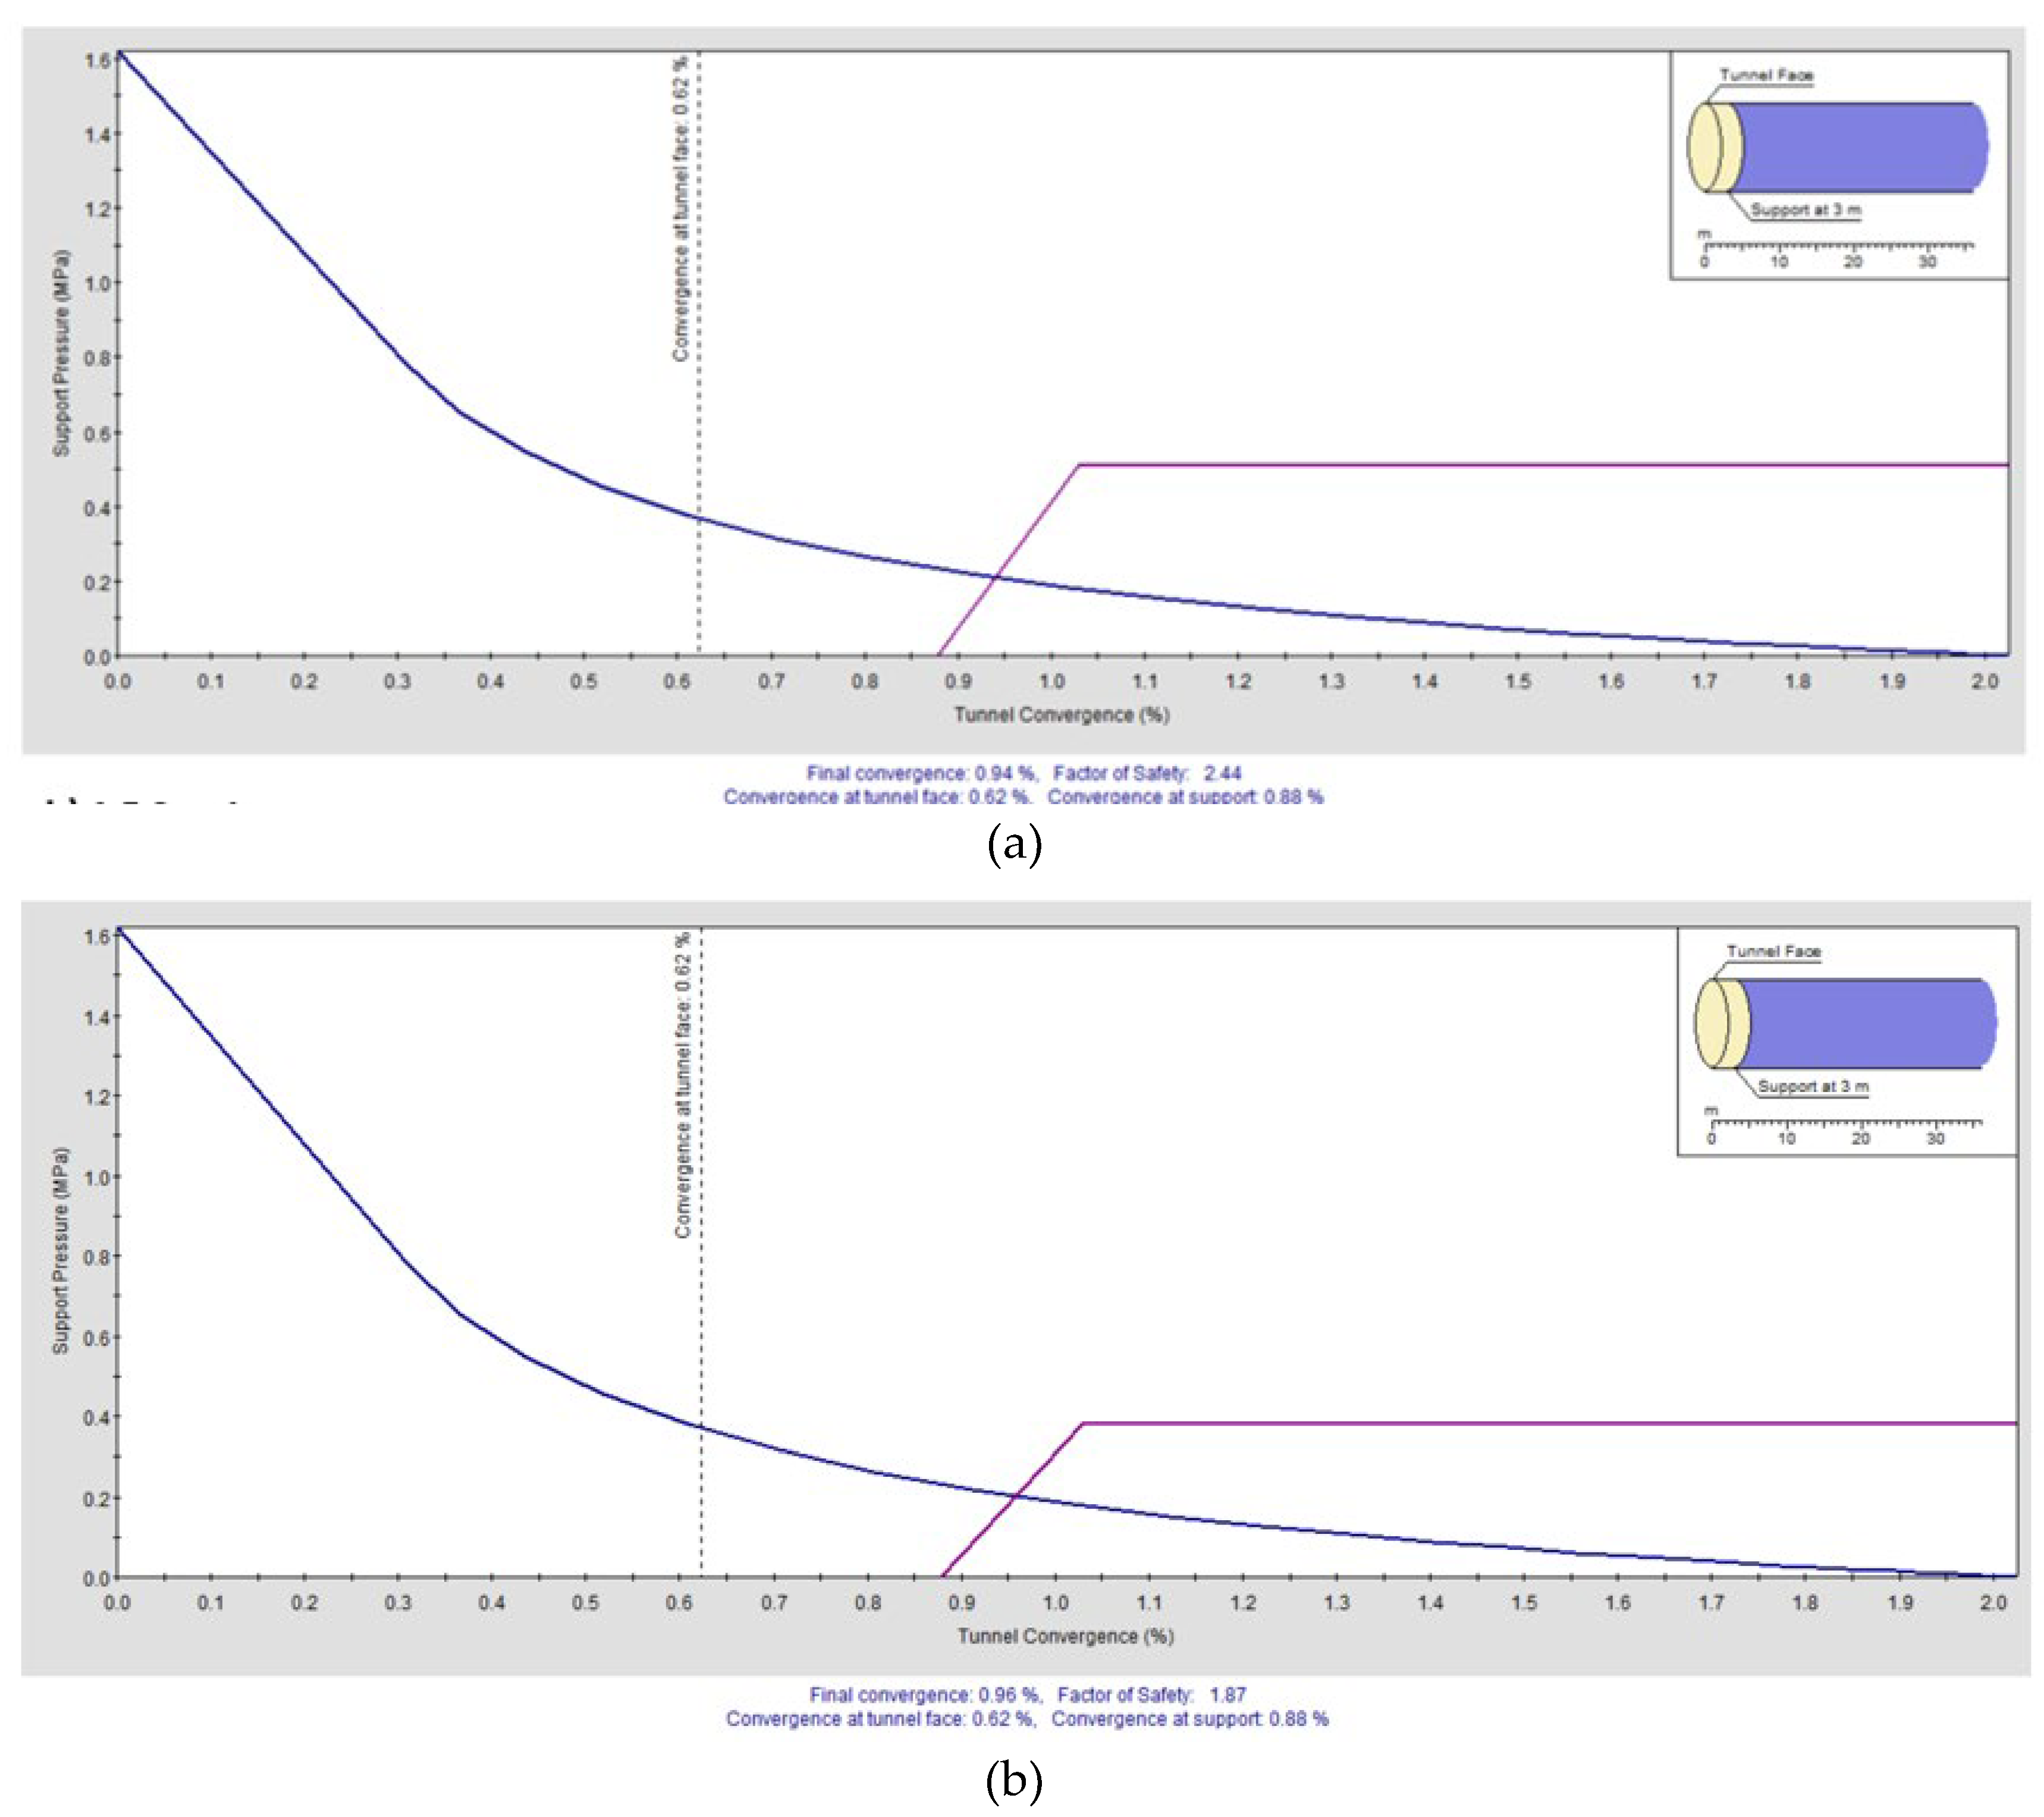
Figure 32.
Ground Reaction and Support Reaction Curves for Varying Bolt Spacings (a) 0.1 m and (b) 0.5 m.
Figure 32.
Ground Reaction and Support Reaction Curves for Varying Bolt Spacings (a) 0.1 m and (b) 0.5 m.
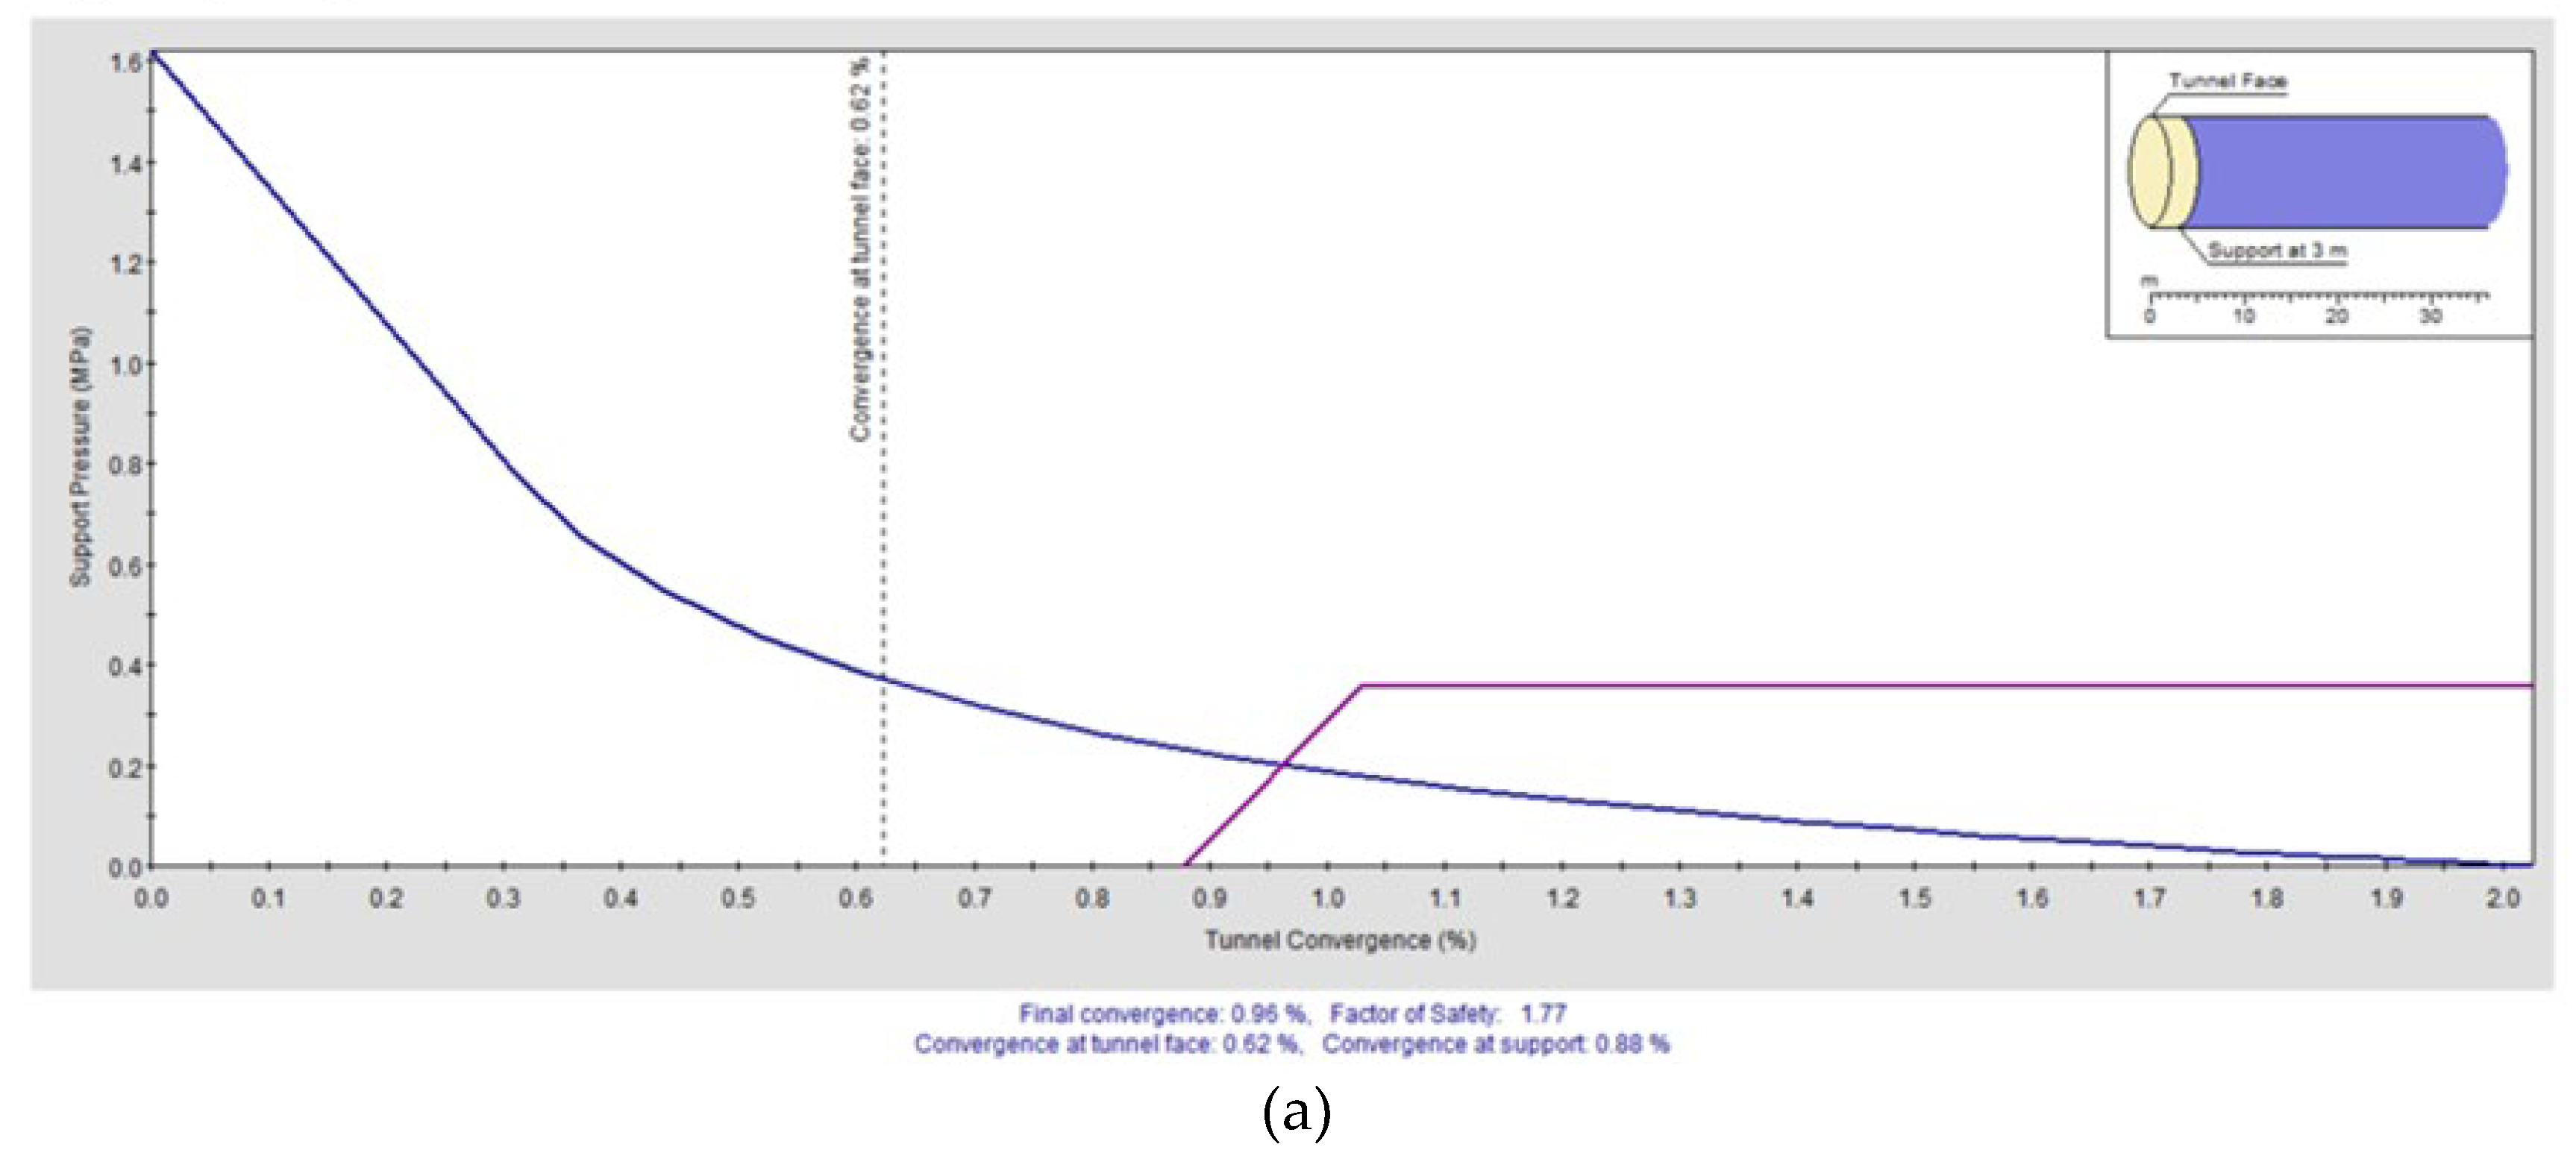
Table 1.
Key parameters for static field testing at Videx Mining Facility.
| Parameter | Value/Range |
|---|---|
| Rock condition | Fractured / Intact |
| Hole diameter | 18mm, 24mm |
| Bolt Diameters | 16mm, 20mm |
| Bolt Lengths | 160mm, 245mm |
| Number of bolts | 15 |
| Curing time | 12–24 hours |
| Loading rate | 2 mm/min |
| Resin type | Two-part (standard vinyl ester and epoxy) |
Table 2.
Input parameters for fully bonded adhesive bolts in Phase 2 modelling.
| Parameter | Value |
|---|---|
| Bolt Type | Fully bonded |
| Bolt Length (m) | 2.4 |
| Bolt Diameter (mm) | 20 |
| Young’s Modulus (GPa) | 210 |
| Bond Strength (MPa) | 1.3 |
| Bolt Spacing (m) | 2.0 |
Table 3.
Material properties used in Phase 2 simulation.
| Material | Young’s Modulus (GPa) | Poisson’s Ratio | UCS (MPa) | Bond Strength (MPa) | Density (kg/m³) |
|---|---|---|---|---|---|
| Intact Rock | 35 | 0.25 | 80 | — | 2700 |
| Fractured Rock | 18 | 0.28 | 20 | — | 2650 |
| Grout/Adhesive | 14 | 0.22 | 12 | 1.3 | 2000 |
| Steel (bolt) | 210 | 0.30 | — | — | 7850 |
Table 4.
Input parameters used for Unwedge simulation.
| Parameter | Value |
|---|---|
| Bench/Slope Height (m) | [e.g., 10.0] |
| Bench Width (m) | [e.g., 8.0] |
| Slope Angle (°) | [Field-measured] |
| Joint 1 Dip / Direction | 70° / 37° |
| Joint 2 Dip / Direction | 85° / 101° |
| Joint 3 Dip / Direction | 48° / 262° |
| Bolt Spacing (in/out plane) | 2.0 m × 2.0 m |
| Principal Stress σ₁ (MPa) | 89 |
| σ₂ / σ₃ (MPa) | 47 / 27 |
Table 5.
Summary of Peak Load Results.
| Resin Type | Bolt Size (mm) | Test Type | Mean Peak Load (kN) | Std. Dev. (kN) | COV (%) |
|---|---|---|---|---|---|
| Vinyl ester resin – 16 mm bolt – length 160mm | 16 | Lab | 26.39 | 12.69 | 48.08 |
| Vinyl ester resin – 20 mm bolt – length 245mm | 20 | Lab | 65.00 | 19.86 | 30.55 |
| Epoxy resin – 16 mm bolt – length 160mm | 16 | Lab | 56.43 | 19.18 | 33.99 |
| Epoxy resin – 20 mm bolt – length 245mm | 20 | Lab | 6.97 | 3.55 | 50.94 |
| Vinyl ester resin – 16 mm bolt – length 160mm | 20 | In-situ | 103.67 | 43.67 | 42.12 |
| Vinyl ester resin – 24 mm bolt – length 210mm | 24 | In-situ | 98.90 | 35.02 | 35.41 |
| Epoxy resin – 20 mm bolt – length – 350mm | 20 | In-situ | 118.17 | 37.63 | 31.84 |
| Vinyl ester resin – 10 mm bolt – length 90mm | 10 | In-situ | 8.12 | 5.40 | 66.51 |
Table 6.
Tensile and Shear Capacities for each anchor configuration.
| Anchor system | Diameter × embedment (mm) | Day 5 tensile (kN) | Day 10 tensile (kN) | Day 15 tensile (kN) | Day 5 shear (kN) | Day 10 shear (kN) | Day 15 shear (kN) |
|---|---|---|---|---|---|---|---|
| Epoxy | 16 × 160 | 43 | 61 | 72 | 36 | 51 | 60 |
| 20 × 245 | 65 | 92 | 108 | 54 | 77 | 90 | |
| Standard Vinyl-ester | 16 × 160 | 51 | 63 | 68 | 43 | 52 | 57 |
| 20 × 245 | 77 | 94 | 102 | 64 | 78 | 85 | |
| High-bond Vinyl-ester) | 16 × 125 | 44 | 57 | 62 | 36 | 47 | 52 |
| 20 × 210 | 69 | 88 | 97 | 57 | 73 | 81 |
Table 7.
Numerical outputs at selected points during Stage 3 (Unsupported Surface Excavation).
| Point | Strength Factor | Ubiquitous Joints | Volumetric Strain | Depth (m) |
|---|---|---|---|---|
| A | 0.78 | 0.068 | 0.012 | 3 |
| B | 0.82 | 0.13 | 0.024 | 10 |
| C | 0.85 | 0.91 | 0.028 | 13 |
| D | 0.91 | 0.78 | 0.027 | 15 |
| E | 1.04 | 0.52 | 0.018 | 18 |
Table 8.
Summary of numerical outputs for supported excavation at key control points.
| STAGE 3 | |||||||
|---|---|---|---|---|---|---|---|
| Bolt No. | Bolt Type & Size | Load Capacity | Point | Strength Factor | Ubiquitous Joints | Volumetric Strain | Depth (m) |
| BOLT 1 | Epoxy Resin, Length 245mm, Diameter 20mm | 55,000 kN | A | 0,9 | 0,0685 | 0 | 3 |
| B | 1 | 0,1637 | 0,0275 | 10 | |||
| C | 1,43 | 1,4436 | 0,033 | 13 | |||
| D | 1,16 | 0,265 | 0,0385 | 15 | |||
| E | 1,2 | 0,52 | 0,03575 | 18 | |||
| BOLT 2 | Epoxy Resin, Length 200mm, Diameter 20mm | 35,000 kN | Point | Strength Factor | Ubiquitous Joints | Volumetric Strain | Depth (m) |
| A | 2,09 | 0,0675 | 0,0135 | 3 | |||
| B | 1,16 | 0,2 | 0,0365 | 10 | |||
| C | 1,5 | 1,4325 | 0,0455 | 13 | |||
| D | 1,28 | 0,975 | 0,0495 | 15 | |||
| E | 0,88 | 0,395 | 0,0315 | 18 | |||
| BOLT 3 | Epoxy Resin, Length 190mm, Diameter 20mm | 25,000 kN | Point | Strength Factor | Ubiquitous Joints | Volumetric Strain | Depth (m) |
| A | 1,2 | 0,065 | 0,00675 | 3 | |||
| B | 0,845 | 0,0975 | 0,135 | 10 | |||
| C | 0,92 | 0,52 | 0,0495 | 13 | |||
| D | 0,975 | 1,04 | 0,054 | 15 | |||
| E | 1,04 | 0,78 | 0,0275 | 18 | |||
Table 9.
Calculated Factor of Safety and Weights for Identified Wedges (Unsupported Tunnel Case).
| Wedge ID | Location | Factor of Safety (FS) | Weight (tonnes) |
|---|---|---|---|
| 4 | Lower-Right wedge | 4.60 | 0.79 |
| 5 | Upper-Left wedge | 1.69 | 0.99 |
| 6 | Roof wedge | 2.64 | 3.10 |
Table 10.
Variation in Factor of Safety (FoS) and Wedge Weight for 190 mm Resin-Grouted Bolts at Different Spacings under Tunnel Support Conditions.
Table 10.
Variation in Factor of Safety (FoS) and Wedge Weight for 190 mm Resin-Grouted Bolts at Different Spacings under Tunnel Support Conditions.
| Bolt length | Bolt spacing | Wedge ID | Location | Factor-of-Safety (FS) | Weight (t) |
|---|---|---|---|---|---|
| 190 mm | 0.10 m | 4 | Lower-Right wedge | 1 258,48 | 0,787 |
| 5 | Upper-Left wedge | 74,787 | 0,985 | ||
| 6 | Roof wedge | 50,019 | 3,104 | ||
| 190 mm | 0.50 m | 4 | Lower-Right wedge | 35,783 | 0,787 |
| 5 | Upper-Left wedge | 1,741 | 0,985 | ||
| 6 | Roof wedge | 2,676 | 3,104 | ||
| 190 mm | 1.00 m | 4 | Lower-Right wedge | 14,446 | 0,787 |
| 5 | Upper-Left wedge | 1,705 | 0,985 | ||
| 6 | Roof wedge | 2,65 | 3,104 | ||
| 190 mm | 1.50 m | 4 | Lower-Right wedge | 25,936 | 0,787 |
| 5 | Upper-Left wedge | 1,691 | 0,985 | ||
| 6 | Roof wedge | 2,643 | 3,104 | ||
| 190 mm | 2.00 m | 4 | Lower-Right wedge | 14,446 | 0,787 |
| 5 | Upper-Left wedge | 1,691 | 0,985 | ||
| 6 | Roof wedge | 2,643 | 3,104 |
Table 11.
Variation in Factor of Safety (FoS) and Wedge Weight for 200 mm Resin-Grouted Bolts at Different Spacings under Tunnel Support Conditions.
Table 11.
Variation in Factor of Safety (FoS) and Wedge Weight for 200 mm Resin-Grouted Bolts at Different Spacings under Tunnel Support Conditions.
| Bolt length | Bolt spacing | Wedge ID | Location | Factor-of-Safety (FS) | Weight (t) |
|---|---|---|---|---|---|
| 200 mm | 0.10 m | 4 | Lower-Right wedge | 1 385,78 | 0,787 |
| 5 | Upper-Left wedge | 82,088 | 0,985 | ||
| 6 | Roof wedge | 55,613 | 3,104 | ||
| 200 mm | 0.50 m | 4 | Lower-Right wedge | 39,01 | 0,787 |
| 5 | Upper-Left wedge | 1,747 | 0,985 | ||
| 6 | Roof wedge | 2,679 | 3,104 | ||
| 200 mm | 1.00 m | 4 | Lower-Right wedge | 16,059 | 0,787 |
| 5 | Upper-Left wedge | 1,708 | 0,985 | ||
| 6 | Roof wedge | 2,652 | 3,104 | ||
| 200 mm | 1.50 m | 4 | Lower-Right wedge | 27,549 | 0,787 |
| 5 | Upper-Left wedge | 1,691 | 0,985 | ||
| 6 | Roof wedge | 2,643 | 3,104 | ||
| 200 mm | 2.00 m | 4 | Lower-Right wedge | 16,059 | 0,787 |
| 5 | Upper-Left wedge | 1,691 | 0,985 | ||
| 6 | Roof wedge | 2,643 | 3,104 |
Table 12.
Variation in Factor of Safety (FoS) and Wedge Weight for 250 mm Resin-Grouted Bolts at Different Spacings under Tunnel Support Conditions.
Table 12.
Variation in Factor of Safety (FoS) and Wedge Weight for 250 mm Resin-Grouted Bolts at Different Spacings under Tunnel Support Conditions.
| Bolt length | Bolt spacing | Wedge ID | Location | Factor-of-Safety (FS) | Weight (t) |
|---|---|---|---|---|---|
| 250 mm | 0.10 m | 4 | Lower-Right wedge | 2 095,00 | 0,787 |
| 5 | Upper-Left wedge | 124,336 | 0,985 | ||
| 6 | Roof wedge | 87,37 | 3,104 | ||
| 250 mm | 0.50 m | 4 | Lower-Right wedge | 39,01 | 0,787 |
| 5 | Upper-Left wedge | 1,747 | 0,985 | ||
| 6 | Roof wedge | 2,679 | 3,104 | ||
| 250 mm | 1.00 m | 4 | Lower-Right wedge | 24,13 | 0,787 |
| 5 | Upper-Left wedge | 1,723 | 0,985 | ||
| 6 | Roof wedge | 2,66 | 3,104 | ||
| 250 mm | 1.50 m | 4 | Lower-Right wedge | 27,549 | 0,787 |
| 5 | Upper-Left wedge | 1,691 | 0,985 | ||
| 6 | Roof wedge | 2,643 | 3,104 | ||
| 250 mm | 2.00 m | 4 | Lower-Right wedge | 17,059 | 0,787 |
| 5 | Upper-Left wedge | 2,691 | 0,985 | ||
| 6 | Roof wedge | 3,643 | 3,104 |
Disclaimer/Publisher’s Note: The statements, opinions and data contained in all publications are solely those of the individual author(s) and contributor(s) and not of MDPI and/or the editor(s). MDPI and/or the editor(s) disclaim responsibility for any injury to people or property resulting from any ideas, methods, instructions or products referred to in the content. |
© 2025 by the authors. Licensee MDPI, Basel, Switzerland. This article is an open access article distributed under the terms and conditions of the Creative Commons Attribution (CC BY) license (http://creativecommons.org/licenses/by/4.0/).
Copyright: This open access article is published under a Creative Commons CC BY 4.0 license, which permit the free download, distribution, and reuse, provided that the author and preprint are cited in any reuse.


