Submitted:
21 August 2025
Posted:
21 August 2025
You are already at the latest version
Abstract
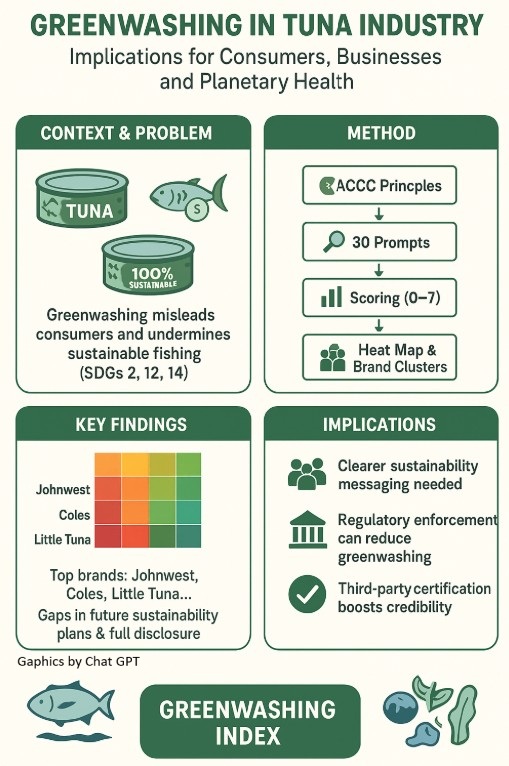
Greenwashing is a threat not only to consumer trust but also to the integrity of planetary health efforts, where transparency in sustainability claims is critical for promoting ecological wellbeing, food security, and equitable development in the Anthropocene. This paper investigates greenwashing by adapting Gomper’s Governance Index methodology to the context of sustainability claims. The focus of our greenwashing index in this case is the sustainability claims made by canned tuna brands in Australia. The index is created from a comprehensive set of criteria on environmental claims, based on the Australian Competition and Consumer Commission (ACCC)’s principles for trustworthy claims. We show that canned tuna brands formed two clusters: one at a very high level of achievement, and a second group with notable opportunities to improve on their sustainability communication and transparency. The results also highlight key issues, including an absence of information on future sustainability transition plans across most brands. A deeper analysis of the scoring scheme shows that the brands which attained third-party sustainability certification, generally achieved a better alignment with the ACCC principles than other brands. Future iterations of this analysis could incorporate online transparency and third-party verification to provide a more comprehensive assessment. Overall, this study underscores the need for clearer sustainability messaging, potentially greater regulatory enforcement, and improved accountability among brands to ensure consumers can make informed choices.
Keywords:
Planetary Health
; Greenwashing
; Sustainability disclosure
; Sustainability index
; ACCC Principles
; Sustainable Development Goals
1. Introduction
Greenwashing refers to the practice of businesses making misleading or false claims about the environmental benefits of their products, services, or operations. This deceptive marketing strategy exploits consumers' growing preference for sustainable and ethically produced goods, leading them to believe they are making environmentally responsible choices when, in reality, they may not be (Shanmugam et al., 2024). Greenwashing therefore leads to a deterioration of trust in brands (Seberíni et al., 2024). The issue is particularly significant in the food industry, including seafood products such as tinned tuna, where sustainability claims can significantly influence purchasing decisions. Common greenwashing practices include vague labelling, misleading certifications, and self-produced ecolabels that lack third-party verification (Czarnezki, 2014). By making misleading claims, they not only harm consumer trust but also disadvantage businesses that are genuinely investing in sustainable practices. It is important to recognise the implications for the broader planetary health context. In particular, there is a critical interdependence between human wellbeing and the health of the planet’s ecological systems (Fleming et al., 2015; Fleming et al., 2023). In marine food systems, such as tuna fishing, misinformation through greenwashing not only erodes public trust but also impedes sustainable fisheries management, undermining progress toward SDG 14 (life below water), food system resilience, and biodiversity conservation (Roberts, 2024).
Australian Competition and Consumer Commission (2023) identified greenwashing as a growing concern in the Australian market. In this report, the ACCC found that 57% of businesses surveyed were making environmental claims that raised concerns regarding their truthfulness, accuracy, or clarity. These concerns similarly ranged from vague and unqualified claims to misleading use of trust marks and third-party certifications. To address this issue, the ACCC is increasing its enforcement efforts under the Australian Consumer Law (ACL), aiming to hold businesses accountable for misleading or deceptive environmental claims. The commission has emphasised the need for businesses to provide clear, evidence-backed, and transparent sustainability claims that do not exaggerate environmental benefits or omit critical information.
The ACCC’s report therefore outlines eight principles for making trustworthy environmental claims, which can serve as a framework for assessing tuna brand labels:
- Make accurate and truthful claims—ensuring that sustainability statements are factually correct and not misleading.
- Have evidence to back up claims—requiring brands to provide verifiable proof of their sustainability credentials.
- Do not hide or omit important information—avoiding selective disclosure that creates an overly positive impression.
- Explain any conditions or qualifications on claims—clarifying any limitations or specific conditions under which claims apply.
- Avoid broad and unqualified claims—preventing misleading statements like ‘100% sustainable’ without context.
- Use clear and easy-to-understand language—making labels accessible and comprehensible to consumers.
- Ensure visual elements do not give the wrong impression—avoiding misleading use of colours, images, or logos that suggest greater sustainability than actually exists.
- Be direct and open about sustainability transitions – encouraging transparency about future goals and current limitations.
We adapt Gomper’s et al. (2003) scoring scheme to evaluate the extent to which tuna brands comply with seven of these eight Australian Competition and Consumer Commission’s (ACCC) principles for environmental marketing claims. While these principles offer a comprehensive framework for identifying greenwashing, their application to the seafood sector necessitates contextual refinement. The unique complexities of seafood supply chains, such as the variability in fishing practices and certification standards, require a tailored approach. For example, claims of sustainable fishing can be assessed against verifiable third-party certifications like the Marine Stewardship Council (MSC) or dolphin-safe programs. However, the effectiveness of such labels depends on their clarity and the extent to which they are understood by consumers, who may not be familiar with the scope or limitations of these certifications. This analysis excludes the fourth ACCC principle, which pertains primarily to recycling-related conditions and is less relevant to the assessment of sustainable sourcing. The findings underscore the limitations of a one-size-fits-all regulatory approach and highlight the need for ongoing refinement of these principles to better address sector-specific challenges. By applying the ACCC framework in this context, the study contributes to the development of more nuanced evaluative tools that enhance accountability and transparency in environmental marketing within the seafood industry.
Our paper reveals high-level differences in the sustainability claims of tuna brands. In terms of overall performance, our results show that canned tuna brands form two distinct groups: one at a very high level of achievement and a second group with notable opportunities to improve their sustainability communication and transparency. A heat map visualisation highlights the key patterns, including an absence of information on future sustainability transition plans (Principle 8) and lacking disclosure of some information (e.g., in relation to comprehensive views on environmental impacts and qualifications on environmental claims per Principle 3) across most brands. While some brands excel in making accurate claims, there are many instances where the provision of supporting evidence will help consumers, as well as potential improvements to be made with respect to the clarity of communication.
Analysis of scoring patterns show that the brands which attained third-party sustainability certification, generally achieved a better alignment with the ACCC principles than other brands. The requirements of the certifying agents appear to have been reflected in better communication of brand sustainability practices. However, there is scope for the ACCC principles to more explicitly reflect the influence and benefits of certification. In particularly, to recognise the way certification provides consumers with confidence that the issues around sustainability communications have been assessed and evaluated by a knowledgeable and well resourced, independent assurance body.
This paper makes a significant contribution to the sustainability disclosure literature in the following ways. First, it contributes to the anthology of academic studies on the development of sustainability indices.1 In creating an index that captures corporate sustainability, studies have utilized the Investor Responsibility Research Center (IRRC)’s corporate governance provisions and the OECD Principles of Corporate Governance to score sustainability claims in companies' annual reports, sustainability reports, annual general meeting minutes, company websites, and analyst reports (for example, Gompers et al. 2003, Cheung et al. 2010). Based on current literature, this paper is the first to construct a greenwashing index for the Tuna fishing industry using brands' on-pack (labeling) sustainability claims. Our index differs from previous studies as we use on-pack claims that influence how customers spend their money. This paper, to our knowledge, is the first study on the on-pack environmental claims on tuna products in Australia. Second, we create prompts that could be relevant in assessing sustainability claims in other industries, such as electronics and home appliances; textiles, garments, and shoes; household and cleaning products; food and beverages; and cosmetics and personal care. These contributions are important because inaccurate sustainability claims in tuna labelling risk masking unsustainable fishing practices that contribute to overfishing, bycatch, and ocean degradation — key threats to marine ecosystem health and, by extension, human nutritional security and coastal livelihoods. The findings and recommendations therefore hold direct implications for planetary health and SDGs 2 (zero hunger), 12 (responsible consumption and production), and 14 (life below water).
We organise the remainder of the paper as follows. Section 2 reviews the inventory of studies on sustainability claims and disclosures. In section 3, we briefly discuss our sampling method and the rationale behind the choice of our weighting scheme. Section 4 presents results and discussion of findings. In the last section, we conclude the study and documents the limitations.
2. Literature Review
The term “greenwashing” originated in the last decades of the 20th century and the early 2000s (Greer & Bruno, 1996; Laufer, 2003). Initially, greenwashing was primarily used to describe the contradictory behaviour of corporations that engaged in green marketing while simultaneously causing environmental harm (Laufer, 2003). However, over the years, the concept of greenwashing has evolved, and its meaning has been widely expanded. Research presents different views on whether greenwashing is related to environmental performance and whether it damages the environment. Despite this, a widely accepted definition of greenwashing has not yet been established Huang, Z., Shi, Y., & Jia, M. 2025).
One of the most recent and comprehensive literature review on greenwashing is by (Huang, Z., Shi, Y., & Jia, M. 2025). According to the authors the definition provided by Walker and Wan (2012) is the most comprehensive. According to this definition, greenwashing can be viewed as “a strategy that corporations adopt to engage in symbolic communications of environmental issues without substantially addressing them in actions (Walker and Wan, 2012, p. 3)”. In Australia, greenwashing has been defined by the courts as follows: ‘the misleading and deceptive disclosures employed by financial institutions to entice environmentally conscious investors into purchasing their financial products that, in reality, fall short of meeting the expected environmental, social, and governance (ESG) or green credentials’ (Nemes et.al. 2022).
Greenwashing has been measured using three different approaches i.e. empirical research, survey, and experiments. Some studies measured greenwashing as the difference between the Green Practice Index (GPI) and Green Communication Index (GCI), naming it greenwashing Index2. [Du et al. (2018), Kassinis et al. (2022), Li et al. (2023), Roulet and Touboul (2015), Testa et al. (2018), Walker and Wan (2012), Xing et al. (2021) and Zhang (2022a, 2022b)].
While others have adopted alternative methods, each with its own merits. (Kim and Lyon, 2015) identified the discrepancy between reported and actual emissions reductions, highlighting the importance of information sources in measuring greenwashing. (Marquis et al., 2016) assessed the extent to which corporations prioritise the disclosure of less significant information over more critical aspects, thus uncovering greenwashing behaviour that evades crucial issues. (Darendeli et al., 2022) argue that an improvement in environmental ratings without a corresponding increase in green cost constitutes greenwashing, suggesting that their application of growth rate is more dynamic compared to other studies.
Lastly, a third group of studies used surveys and experimental research, with a primary focus on the perceived greenwashing by customers (Chen & Chang, 2013; Gosselt et al., 2019; Guo et al., 2017; Nyilasy et al., 2014; Szabo & Webster, 2021). These studies indicate that greenwashing not only occurs in information disclosure but also involves suggestive communications, such as misleading visuals or graphics, vague claims, and even the interactive design of websites (Huang, Z., Shi, Y., & Jia, M. 2025).
The problem of greenwashing is multidimensional and includes unfair competition, violation of consumer rights, discredit of corporate social responsibility, restriction of intellectual property, underdevelopment of the market for environmentally friendly and organic products. (Voronina, 2023). Greenwashing not only misleads consumers into believing they are making environmentally responsible choices but also allows harmful practices to persist with no punishment. As a result, the potential for genuine progress in sustainability is undermined, leading to lasting impacts on ecosystems and public health (Chang et.al 2024). Greenwashing may not only undermine favourable perceptions (Darke and Ritchie 2007) and company profitability (Du 2015), but more importantly, can result in ethical harm (Nyilasy et al. 2014).
One of the potential solutions to the problem of greenwashing is increased government regulations. A study by (He et.al 2020) suggests that insufficient government regulation triggers greenwashing in terms of both environmental behaviours and communication. In addition, a high government regulation capacity effectively curbs poor environmental behaviours. (Liu C et.al 2024 and Steward Brandon 2020) suggest that governments can effectively prevent greenwashing behaviours by increasing punishment and penalties. Where (Li,R et.al. 2025) provide significant evidence that penalties for environmental violations prevent firms from engaging in greenwashing. Secondly, improving information transparency can also help in discouraging greenwashing behaviours. Governments should establish strict environmental disclosure standards and regulations to ensure that companies provide truthful and accurate information when communicating the environmental attributes of their products or services (Chang et.al 2024).
Environmental, social, and governance (ESG) factors. ESG factors are becoming increasingly important in corporate and investment decision-making. By incorporating ESG considerations, investors, asset managers, and companies can align their interests to build more responsible financial products and contribute to a more sustainable world (Chen 2024; Dorfletner et.al 2015). ESG scores and indexes are applied in a range of contexts such as disclosure, assessing firm performance, shaping investment decisions, and ensuring that companies adhere to sustainable and socially responsible practices (Li,D 2025; Clement et al. 2025). By offering a more comprehensive assessment than traditional financial disclosures, ESG evaluations provide better guidance for investment institutions in making informed decisions (Huang. J, 2023). Investors increasingly rely on ESG ratings to assess risk and identify sustainable investment opportunities, influencing capital allocation decisions (Rossi et al., 2023).
While ESG scores and indices are valuable tools for promoting sustainability, challenges remain in their application. The lack of standardization and transparency in ESG rating methodologies can lead to inconsistencies and misinterpretations. As evident from the study conducted by (Dorfleitner, G et al. 2015). Where the authors compare different rating approaches of corporate social performance using ESG scores of three different sustainability rating providers. The results indicate that the different ratings neither coincide in distribution nor in risk. Additionally, a study by (Tehrani et al., 2024) focuses specifically on the comparison between Dow Jones Sustainability Indices (DJSIs) and S&P Global ESG scores, particularly for German companies from 2018 to 2023. The paper highlights that these two sustainability measures do not align, indicating discrepancies in the sustainability practices of companies listed on the DJSIs versus those with high ESG scores. Thus, the inconsistencies in rating methodologies and data quality can hinder the effectiveness of ESG rating, raising questions about their reliability across different contexts (Hong & Rosli, 2024; Rossi et al., 2023).
One of the most widely used and a well-established ESG evaluation framework, to ensure systematic and unbiased assessment of sustainability claims is the Gomper’s Governance Index or the (G-Index) developed by (Gompers, Ishii, and Metrick 2003). It quantifies corporate governance quality through a composite score derived from 24 specific provisions, primarily focusing on anti-takeover measures. The index suggests that firms with more democratic governance structures tend to exhibit higher valuations, establishing a positive correlation between governance quality and firm performance. The index construction is such that a firm receive a score of one for every provision that reduces shareholder rights. The Governance Index ("G") is just the sum of one point for the existence (or absence) of each provision.
Some of the other sustainability indexes includes (i) Cheung et al. (2010) transparency index, where firms receive a 1 if they either omit or do not comply with a specific weighting criterion, the score of 2 if they meet the minimum compliance standard, and 3 (“higher” score) if companies exceed minimum disclosure requirements and/or meet international standard. (ii) Corporate governance ratings developed by Credit Lyonnais Securities Asia (CLSA, 2001) used by Durnev and Kim (2002), Khanna et al. (2002), Klapper and Love (2002), Chen et al. (2003), Friedman et al. (2003) and Mitton (2004). The ratings are such that each of the issues first receive a yes/no response and firms are then given a composite rating based on their scores in the areas of management discipline, transparency, independence, accountability, responsibility, fairness, and social responsibility. The first six areas have a 15% weighting in the composite, while social responsibility is weighted 10%.
3. Methods
Our sample consists of 14 major tuna brands in Australia. The selection is based on on-the-shelf canned tuna products in major supermarkets in Australia. The baseline objective of our study is to construct a greenwashing index, designed to measure the quality of on-pack disclosure practices of tuna brands in Australia. The scoring methodology evaluates on-pack sustainability claims of canned tuna products against the ACCC’s principles for making environmental claims (2023) by using a structured yes/no response system. The ACCC’s principles are relevant in this context because, in addition to providing consumer protection, the principles also indirectly contribute to planetary health by enforcing accountability in environmental claims, ensuring that branding aligns with practices that protect ecosystems and promote intergenerational equity.
Each principle is translated into a set of prompts, where a "yes" (positive attribute) receives a score of 1, while a "no" (negative attribute) or lack of sufficient information results in a 0. This polarity-based approach reduces subjectivity in assessment. The scores are then combined for each principle as described below with the individual scores leading to higher or lower overall values. This approach is an adaptation of the highly regarded “Gompers Governance Index” used for Governance evaluation in ESG metrics.3 Other weighting schemes in the sustainability disclosure literature, include (i) Cheung et al. (2010) 1 to 3 scoring system, where 1 goes to firms that either omit or do not comply with a specific weighting criterion, the score of 2 to ones that have a minimum compliance, and 3 to companies exceeding minimum disclosure requirements and/or meet international standard; (ii) 10%-15% weighting in Mitton (2004), where management discipline, transparency, independence, accountability, responsibility, and fairness get a 15% each composite weighting score, while social responsibility is weighted 10%. We could not adapt these other weighting: (i) to avoid subjectivity and (ii) since the on-pack sustainability claims, in our case, do not contain reports on management discipline, accountability, responsibility, and social responsibility.
To illustrate the implementation, consider the opposing contexts of exaggerations, and truthful environmental claims. Exaggerated claims are obviously a negative attribute, and truthful claims are obviously a positive attribute. The answer to the question “Is there exaggerated environmental benefits on the packaging?” can be yes or no. A yes answer is negative and receives a 0 value. In contrast, if the given product does not exaggerate the environmental benefit, a no response is a desirable attribute, and therefore receives a value of 1. As indicated earlier, a default value of 0 is assigned to a given prompt/question if there is not enough relevant information available to discern a response. Table 1 sets out the scores for answers to individual prompts in line with applications encountered in ESG literature (Morrison, 2014) and applied by practitioners (Refinitiv, 2022).
A standard score is produced for each principle by adding the scores and dividing by the number of questions/prompts identified for that principle. This helps reduce any bias attributed to the number of questions/prompts emanating from the descriptions of the principles contained in Australian Competition and Consumer Commission (2023). Note that Principle 4 of the ACCC’s eight principles was excluded from this exercise because that principle is structured to relate to recycling rather than fish sourcing. As a result, the individual scores for seven principles are added together for each brand. The range for scoring is a maximum of seven and minimum of zero. Tuna brands with low greenwashing practices have higher scores. It is worth noting that two-third of the authors rate the on-label sustainability claims of the brands, while one-third cross-checked the raters for consistency.
4. Findings
The analysis of tuna brand labels reveals significant variations in satisfying the essence of the ACCC principles. The overall performance of the brands forms two clusters – one at a high level of successfully reflecting the principles, and a second group with notable opportunities to improve on their sustainability communication and transparency. Based on total scores, the higher ranked cluster achieved scores between 3.7 and 4.7. John West leads the group with the highest score of 4.7, then Coles, Coles Simply, The Stock Merchant, and Little Tuna follow closely with scores of 4.2, and Walker’s Tuna and Safcol complete this highly ranked group with scores of 4 and 3.7 respectively. The second cluster has scores ranging from 1.6 to 2.95 with the bulk of this group tightly ranged between 2.1 and 2.3. There is therefore a notable gap between the top-performing brands and those that display potential to improve on how they reflect the sustainability communicating principles of the ACCC.
A deeper examination of individual sustainability principles shows mixed performance leading to the total scores. Brands generally performed well in making truthful claims and providing sufficient evidence to support these claims. However, there are issues with respect to omitting information, and communicating any qualifications associated with the stated claims. General communication clarity was also divided—while some brands effectively conveyed their sustainability claims, others used complex language. A high level of transparency in regard to future sustainability transitions was universally absent, as no brand outlines their future goals for improving environmental impact. The heat map visualisation highlights these discrepancies, with John West, Coles, Coles Simply, The Stock Merchant, Little Tuna and Walker’s Tuna emerging as the most sustainable brands. This form of analysis also helps pinpoint the principles where the other brands can potentially build on their current scores to lift their performance.
Figure 1 depicts the individual total sustainability score for each brand. This figure clearly shows the seven leading brands creating a cluster separate from the remaining brands. John West has the highest score of 4.7 and Coles, Coles Simply, The Stock Merchant and Little Tuna achieved the same score of 4.2, while Walker’s Tuna and Safcol sit slightly lower at 4 and 3.7. The majority of the remaining brands are closely ranged from Fish4Ever on 2.05 through to Woolworths on 2.3, with Community Co a little lower at 1.6, and Sirena at a reasonably higher step up of 2.95.
Figure 2 provides a detailed breakdown of the minimum, maximum, and average scores across the ACCC principles. In the figure, the bold line inside the boxes represents the median score, and the cross represents the mean score. The boxes span from Q1 (25th percentile) to Q3 (75th percentile) for each principle’s scores. A wider box indicates high variability, and a narrow box means a tighter pattern of scoring across brands. Finally, the “whiskers” capture a more complete range of the pattern of scores—e.g., where the maximum or minimum of the scoring pattern were outside of the highest and lowest quartiles. The individual dots show any outliers to the pattern of the majority of the scores. An example of an outlier is where almost all brands achieved a score of 0.5 for Principle 1, but John West was alone in scoring a higher result of 0.67 for this principle. This figure helps reveal key patterns of how the brands perform in specific areas. Overall, the data suggests that while brands tend to make claims that are likely to be accurate, they frequently lack sufficient evidence to support these claims and can omit some information. Additionally, the clarity of communication varies significantly, and there is a widespread practice across the brands of not including transparent information about future sustainability transition plans.
Regarding Principle 1 (Making accurate and truthful claims), most brands scored 0.5, with John West standing out as an exception at 0.67. This suggests that, in general, brands make sustainability claims that are likely to be factually correct. However, this principle also reveals an aspect of the aspirational standard setting which ACCC is applying, and that full success here will require brands to include robust scientific evidence for their claims (and potential to include aspects of future sustainability progress). Moving to Principle 2 (Having evidence to back up claims), the scores were widely ranging from 0.17 to 0.83, with a majority of brands scoring above 0.5. This indicates that, in general, brands provide sufficient supporting evidence ensuring the credibility of the claims they make. The wide range does suggest there is scope for some brands to improve in relation to this principle. Particularly with respect to providing independent scientific evidence, providing data on supply chains, and obtaining third-party certification.
Principle 3 (Not hiding important information) is a particularly challenging principle to score well in. This is illustrated by most brands scoring 0.2 and a few outliers on 0. This principle seeks to ensure consumers are fully aware of the context of a brand's sustainability actions and requires brands to provide a comprehensive overview of its environmental impact—including both positive and negative aspects. This principle therefore displays further aspirational standard setting by the ACCC and may require the industry to further invest in revealing more details on their labels (and potential additional monitoring systems to support this information). Nevertheless, most brands were careful in specifying the stages of their product lifecycle that their claims relate to, and thereby ensured the implied extent from their messaging was not misleading.
Regarding Principle 5 (Avoiding unqualified and broad claims), although most brands scored 0.67 and above, some of the brands stand at 0.33. This indicates that apart from a few brands (that consistently scored low across principles), the majority of brands performed well in terms of clearer and well-defined sustainability claims. Similarly, communication clarity was another area where the majority of brand performed well, as seen in Principle 6 (Using clear and easy-to-understand language). With few exceptions, brands were split between 0.5 and 1. While the majority of brands effectively communicate their claims in simple language, some employ technical jargon or overly complex wording, which therefore makes these claims more difficult to interpret by consumers.
Brands showed a wider range of performance on Principle 7 (Avoiding misleading visual elements), with scores varying from 0.4 to 1. While most brands avoided the potential for deceptive visuals, and explaining the details of labels, symbols, trust marks and certifications, some inconsistencies remain. In contrast, Principle 8 (Being direct and open about sustainability transition) is not a common feature, with all brands scoring 0 in relation to ACCC’s current expectations. This is the most aspirational of the principles and, not surprisingly, is where none of the brands are yet providing clear information about their long-term sustainability commitments, goals and steps for future improvements. However, the absence of clear sustainability transition pathways raises concerns about the ability of tuna brands to contribute meaningfully to long-term ecological resilience — an essential component of planetary health.
Overall, the findings indicate that an impressive number of brands, including John West, Coles, Coles Simply, The Stock Merchant, Little Tuna and Walker’s Tuna, demonstrate strong alignment with the ACCC principles. Sirena is also on its way to achieving stronger alignment. The other brands have specific elements they can improve upon to achieve a better reflection of these principles. Most brands have performed well in stating and presenting their environmental claims in an accurate and supported way. Further scope exists to improve and more fully align with the ACCC principles, including the potential to provide further information on their future sustainability plans.
Figure 3 is a heat map visualisation which provides a clear depiction of how well different tuna brands scored in relation to the individual ACCC principles. In this figure, green signifies strong alignment with the principles, orange indicates moderate alignment, and red represents weak adherence. The color-coded results reveal significant disparities between brands, with the leading brands identified earlier demonstrating a strong commitment to sustainability, while others have opportunities to improve in multiple areas.
It is no surprise that the top-performing brands, including John West, Coles, Coles Simply, The Stock Merchant, Little Tuna and Walker’s Tuna, show predominantly green values across multiple principles. These results are consistent with Figure 1 but the heat map helps shows greater detail on where these brands adhere to sustainability best practices, providing accurate claims, avoiding misleading statements, and ensuring transparency in their communications. Their strong alignment sets a benchmark for industry-wide practice. In contrast, other brands show frequent challenges in aligning with the ACCC principles, as reflected in their multiple red values and lower overall scores. These brands miss criteria, particularly in areas such as disclosing information. Their results therefore suggest potential to improve transparency and evidential support for their environmental claims.
A closer investigation of the specific principles highlights some areas for potential improvement for most brands. Principle 8 (Transparency in sustainability transition) and Principle 3 (Disclosure of important information) both showed opportunity for further improvement. In particular, most brands are not yet communicating their long-term sustainability plans and will often avoid disclosing details of qualifications and limitations in relation to their environmental claims. This in turn, can affect consumers' ability to make fully informed choices. In contrast, Principle 7 (Visual clarity) yielded distinctly mixed results, with scores ranging widely. While some brands excelled in ensuring that their sustainability messaging was visually clear and not misleading, others performed somewhat inconsistently. Despite this variation, the majority of brands generally adhered to best practice in this area, with green values outweighing orange. It is evident that most of the brands scored highly on Principles 5 (Avoiding vague claims) and 6 (Clear language) by making well-defined claims and using straightforward, accessible language. However, some of the lower scoring brands missed the mark through using broad, and unqualified statements or more technical jargon that made their claims difficult to interpret.
The details of the heat map also reveal the relative scoring benefits corresponding with brands attaining third-party certification. All the brands with predominantly green scoring are certified by external sustainability evaluating organisations (e.g., MSC, Dolphin Safe etc). While some specific elements of the ACCC principles relate to a brand achieving certification, other elements of the principles can also be explicitly supported by the requirements of third-party certification (e.g. verifying supply chains and providing online details to support claims etc). However, there is scope for the ACCC principles to recognise the thorough vetting of brands’ sustainability practices and the directions third-party certifiers provide on clear communication. The positive influence they bring is evident by the degree to which the certified brands achieve positive scores on issues not directly relating to certification. Further, where scoring was carried out on brands prior to and post the brand’s certification, a significant overall improvement was observed. It is also likely that third-party certification creates a solution to the problem that too much information is difficult for consumers to process (especially while shopping). The key benefit here is that certification enables consumers to be confident that the issues reflected in the ACCC principles have already been assessed and evaluated by a knowledgeable, well-resourced and independent source of assurance.
Overall, the heat map highlights a clear divide between brands that have succeeded in aligning with the ACCC principles and those that are yet to achieve significant alignment. The findings emphasise the need for improved disclosure, clearer sustainability messaging, and the potential of stronger commitments to long-term environmental goals across the industry.
5. Conclusions
Based on the ACCC’s principles for trustworthy environmental claims, our paper creates an index to access the environmental claims of tuna brands in Australia. We create a scoring scheme that breaks down seven of the eight principles into 30 prompts. The findings reveal that canned tuna brands can be categorized into two distinct clusters: one exhibiting a notably high level of achievement, and the other characterized by significant potential for improvement in sustainability communication and transparency. Furthermore, the analysis identifies critical trends, notably a pervasive inadequacy in disclosing future sustainability transition strategies across the majority of brands. A thorough examination of the scoring framework indicates that those brands which have obtained third-party sustainability certifications generally demonstrate a greater alignment with ACCC principles than their non-certified counterparts.
The ACCC’s framework is an important step toward reducing greenwashing. However, it has limitations. First, the lack of mandatory sustainability labelling regulations means businesses can still make vague claims without facing immediate penalties unless consumers or competitors challenge them. Additionally, the ACCC’s reliance on consumer complaints and investigations may not proactively prevent misleading claims from reaching the market.
The one-size-fits-all approach to different industries is also a challenge as it may not fully capture the nuances of environmental claims in complex supply chains (e.g. seafood). Clear labelling is important, but some sustainability claims rely on complex fisheries management practices that most consumers may not understand. This issue extends to the evolving capacity for consumers to follow up by accessing and evaluating information available on the internet (i.e. beyond what is on the packaging). This dimension is beyond the scope of the current research but may motivate and extend future studies. There are also related limitations around how the principles are scored (e.g. limited to widely known certifications, the potential consumer’s awareness of technical terms etc). The focus of the current study is necessarily limited to what the consumer sees on the grocery store shelf (i.e. in the brand packaging) and the range of technical knowledge assessed by what a preliminary internet search reveals. However, these dimensions may evolve and be extended in future studies. Future analyses should consider an ongoing collection of relevant data concerning the tuna industry to unravel the implications of this greenwashing index on market valuation, consumer purchasing behaviour, and the financial performance of tuna brands.
Our paper’s policy implications are as follows: (i) there is potential to achieve comprehensive alignment with the ACCC principles through increased enforcement measures. Greater enforcement and increased penalties (e.g. for repeated or severe violations) will ensure businesses take their responsibilities seriously but also likely to require an overall revision of the principles and their interpretation (ii) our results also provide useful insights for tuna brands to design and communicate environmental claims that are in compliance with the ACCC’s framework, thereby fostering compliance with governmental mandates designed to curtail greenwashing and ensure the accurate representation of sustainability claims to consumers (iii) more significantly, addressing greenwashing in marine food systems extends beyond consumer rights, and relates to planetary health governance. Effective responses should integrate food system resilience, marine biodiversity protection, and equitable access to sustainable seafood into regulatory frameworks and corporate accountability mechanisms.
Funding
This research was funded by the Marine Stewardship Council.
Data Availability Statement
Greenwashing Scoring Data is Available at: https://www.researchgate.net/publication/391345260_Greenwashing_in_the_Tuna_Industry_Scoring_ACCC_principles_Data_29_03_2025
Acknowledgments
The authors acknowledge the generous editing and style support of Michelle Daugaard. The authors have reviewed and edited the output and take full responsibility for the content of this publication.
Conflicts of Interest
The authors declare no conflicts of interest.
| 1 | The inexhaustible list of existing studies include: Gompers et al. 2003, Mitton 2004, Gjølberg 2009, Cheung et al. 2010, Folcalvez et al. 2024. |
| 2 | For detailed calculation of Greenwashing Index refer to (Huang, Z., Shi, Y., & Jia, M. 2025). |
| 3 | One of the limitations of sustainability disclosure index is that there is no unique methodology, but adapted methodology is a well-established ESG evaluation framework, used to ensure systematic and unbiased assessment of sustainability claims. |
References
- Australian Competition and Consumer Commission. 2023. Making environmental claims: A guide for business. Australian Competition and Consumer Commission. Available online: https://www.accc.gov.au/system/files/greenwashing-guidelines.pdf.
- Chang, Liang, Tang Min, Kuangxuan Xu, and Wenrui Zhao. 2024. Anatomy of Corporate Pseudo-Social Responsibility Behavior: Identification Mechanism and Preventive Countermeasures of Greenwashing Phenomenon. Highlights in Business, Economics and Management 45: 880–888. [Google Scholar] [CrossRef]
- Chen, K.C.W., Z. Chen, and K.C.J. Wei. 2003. Disclosure, corporate governance, and the cost of equity capital: evidence from Asia’s emerging markets. In Working paper. Hong Kong University of Science and Technology. [Google Scholar]
- Chen, Y.-S., and C.-H. Chang. 2013. Greenwash and green trust: the mediation effects of green consumer confusion and green perceived risk. Journal of Business Ethics 114: 489–500. [Google Scholar] [CrossRef]
- Chen, W. 2023. ESG Data and Scores. In Sustainable Finance. pp. 67–98. [Google Scholar] [CrossRef]
- Cheung, Y. L., P. Jiang, and W. Tan. 2010. A transparency disclosure index measuring disclosures: Chinese listed companies. Journal of Accounting and Public Policy 29, 3: 259–280. [Google Scholar] [CrossRef]
- Clément, A., É. Robinot, and L. Trespeuch. 2025. The use of ESG scores in academic literature: A systematic literature review. Journal of Enterprising Communities: People and Places in the Global Economy 19, 1: 92–110. [Google Scholar] [CrossRef]
- Czarnezki, J. J., A. Homant, and M. Jeans. 2014. Greenwashing and self-declared seafood ecolabels. Tulane environmental law journal, 37–52. [Google Scholar]
- Darke, P. R., and R. J. Ritchie. 2007. The defensive consumer: Advertising deception, defensive processing, and distrust. Journal of Marketing research 44, 1: 114–127. [Google Scholar] [CrossRef]
- Darendeli, A., K.K.F. Law, and M. Shen. 2022. Green new hiring. Review of Accounting Studies 27: 986–1037. [Google Scholar] [CrossRef]
- Dorfleitner, G., G. Halbritter, and M. Nguyen. 2015. Measuring the level and risk of corporate responsibility–An empirical comparison of different ESG rating approaches. Journal of asset management 16, 7: 450–466. [Google Scholar] [CrossRef]
- Durnev, A., and E.H. Kim. 2002. To steal or not to steal: firm attributes, legal environment, and valuation. In Working Paper. University of Michigan. [Google Scholar]
- Du, X. 2015. How the market values greenwashing? Evidence from China. Journal of Business Ethics 128, 3: 547–574. [Google Scholar] [CrossRef]
- Du, X., W. Jian, Q. Zeng, and Y. Chang. 2018. Do auditors applaud corporate environmental performance? Evidence from China. Journal of Business Ethics 151: 1049–1080. [Google Scholar] [CrossRef]
- Fleming, L., M. Depledge, N. McDonough, M. White, S. Pahl, M. Austen, A. Goksoyr, H. Solo-Gabriele, and J. Stegeman. 2015. The Oceans and Human Health. In Oxford Research Encyclopedia of Environmental Science. [Google Scholar]
- Fleming, L. E., L. Rabbottini, M. H. Depledge, L. Alcantara-Creencia, W. H. Gerwick, H. C. Goh, V. S. Gordon, M. O. Gribble, J. Keast, B. Maycock, H. M. Solo-Gabriele, B. Jahateh, D. O. Pratt, A. Davies, and B. Bennett. 2023. Overview of Oceans and Human Health.
- Friedman, E., S. Johnson, and T. Mitton. 2003. Propping and tunneling. Journal of Comparative Economics 31: 732–750. [Google Scholar] [CrossRef]
- Gjølberg, M. 2009. Measuring the immeasurable?: Constructing an index of CSR practices and CSR performance in 20 countries. Scandinavian journal of management 25, 1: 10–22. [Google Scholar] [CrossRef]
- Gompers, P., J. Ishii, and A. Metrick. 2003. Corporate governance and equity prices. The quarterly journal of economics 118, 1: 107–156. [Google Scholar] [CrossRef]
- Gosselt, J.F., T. Van Rompay, and L. Haske. 2019. Won't get fooled again: the effects of internal and external CSR ECO-labeling. Journal of Business Ethics 155: 413–424. [Google Scholar] [CrossRef]
- Greer, J., and K. Bruno. 1996. Greenwash: the reality behind corporate environmentalism. New York: Apex Press. [Google Scholar]
- Guo, R., L. Tao, C.B. Li, and T. Wang. 2017. A path analysis of greenwashing in a trust crisis among Chinese energy companies: the role of brand legitimacy and brand loyalty. Journal of Business Ethics 140: 523–536. [Google Scholar] [CrossRef]
- He, Q., Z. Wang, G. Wang, J. Zuo, G. Wu, and B. Liu. 2020. To be green or not to be: How environmental regulations shape contractor greenwashing behaviors in construction projects. Sustainable Cities and Society 63: 102462. [Google Scholar] [CrossRef]
- Huang, J. 2023. Assessing the effectiveness and limitations of ESG in portfolio investment. Highlights in Business Economics and Management 19: 177–182. [Google Scholar] [CrossRef]
- Huang, Z., Y. Shi, and M. Jia. 2025. Greenwashing: A systematic literature review. Accounting & Finance 65, 1: 857–882. [Google Scholar]
- Kassinis, G.I., A.A. Kay, G. Papagiannakis, and P.A. Vlachos. 2022. Stigma as moral insurance: how stigma buffers firms from the market consequences of greenwashing. Journal of Management Studies 59: 2154–2190. [Google Scholar] [CrossRef]
- Khanna, T., J. Kogan, and K. Palepu. 2002. Globalization and similarities in corporate governance: a cross-country analysis. In Working Paper. Harvard Business School. [Google Scholar]
- Kim, E.-H., and T.P. Lyon. 2015. Greenwash vs. brownwash: exaggeration and undue modesty in corporate sustainability disclosure. Organization Science 26: 705–723. [Google Scholar] [CrossRef]
- Klapper, L.F., and I. Love. 2002. Corporate governance, investor protection, and performance in emerging markets. World Bank Policy Research Working Paper 2818.
- Laufer, W.S. 2003. Social accountability and corporate greenwashing. Journal of Business Ethics 43: 253–261. [Google Scholar] [CrossRef]
- Le Folcalvez, X. N., S. Skeaff, and K. E. Bradbury. 2024. An overview of environmental labelling and claims on fish and seafood products in New Zealand supermarkets. In Journal of the Royal Society of New Zealand. pp. 1–15. [Google Scholar]
- Li, D. 2025. The Impact of ESG Ratings on Corporate Social Responsibility Across Regions and Industries. Advances in Economics, Management and Political Sciences 151: 161–167. [Google Scholar] [CrossRef]
- Li, R., M. Zhong, and Y. Shahab. 2025. Can penalties for environmental violations deter firms from engaging in greenwashing? Business Ethics, the Environment & Responsibility 34, 1: 189–214. [Google Scholar]
- Liu, C., J. Wang, Q. Ji, and D. Zhang. 2024. To be green or not to be: how governmental regulation shapes financial institutions' greenwashing behaviors in green finance. International Review of Financial Analysis 93: 103225. [Google Scholar] [CrossRef]
- Li, W., W. Li, V. Seppänen, and T. Koivumäki. 2023. Effects of greenwashing on financial performance: moderation through local environmental regulation and media coverage. Business Strategy and the Environment 32: 820–841. [Google Scholar] [CrossRef]
- Marquis, C., M.W. Toffel, and Y. Zhou. 2016. Scrutiny, norms, and selective disclosure: a global study of greenwashing. Organization Science 27: 483–504. [Google Scholar] [CrossRef]
- Mitton, T. 2004. Corporate governance and dividend policy in emerging markets. Emerging Markets Review 5, 4: 409–426. [Google Scholar] [CrossRef]
- Morrison, T. H. 2014. Developing a regional governance index: The institutional potential of rural regions. Journal of Rural Studies 35: 101–111. [Google Scholar] [CrossRef]
- Nemes, N., S. J. Scanlan, P. Smith, T. Smith, M. Aronczyk, S. Hill, and D. Stabinsky. 2022. An integrated framework to assess greenwashing. Sustainability 14, 8: 4431. [Google Scholar] [CrossRef]
- Nyilasy, G., H. Gangadharbatla, and A. Paladino. 2012. Greenwashing: A consumer perspective. Economics & Sociology 5, 2: 116. [Google Scholar]
- Nyilasy, G., H. Gangadharbatla, and A. Paladino. 2014. Perceived greenwashing: the interactive effects of green advertising and corporate environmental performance on consumer reactions. Journal of Business Ethics 125: 693–707. [Google Scholar] [CrossRef]
- Refinitiv. 2022. Environmental, social and governance scores from Refinitiv. Available online: https://www.refinitiv.com/content/dam/marketing/en_us/documents/methodology/refinitiv-esg-scores-methodology.pdf.
- Rossi, C., J. G. Byrne, and C. Christiaen. 2024. Breaking the ESG rating divergence: An open geospatial framework for environmental scores. Journal of environmental management 349: 119477. [Google Scholar] [CrossRef]
- Roberts, C., C. Béné, N. Bennett, J. S. Boon, W. W. Cheung, P. Cury, and B. C. O’leary. 2024. Rethinking sustainability of marine fisheries for a fast-changing planet. Ocean Sustainability 3, 1: 41. [Google Scholar] [CrossRef]
- Roulet, T.J., and S. Touboul. 2015. The intentions with which the road is paved: attitudes to liberalism as determinants of greenwashing. Journal of Business Ethics 128: 305–320. [Google Scholar] [CrossRef]
- Seberíni, A., K. Izáková, and M. Hronecc. 2024. Spotrebitelia v prostredí zeleného marketingu a greenwashingu: Consumers in the environment of green marketing and greenwashing. Journal of Economics and Social Research 25, 1. [Google Scholar]
- Shanmugam, J. K., I. M. Saidon, M. M. Noor, K. Lokanathan, and W. K. H. W. Ya. 2024. Unmasking Greenwashing: A Brief Note to Consumers. International Journal of Research and Innovation in Social Science 8, 10: 353–358. [Google Scholar] [CrossRef]
- Stewart, Brandon D. Business as Usual? The Limited Influence of Climate Change Disclosure and Fiduciary Duties on the Low-Carbon Investment Practices of Canada's Big 10 Public Pension Funds (2020). [CrossRef]
- Szabo, S., and J. Webster. 2021. Perceived greenwashing: the effects of green marketing on environmental and product perceptions. Journal of Business Ethics 171: 719–739. [Google Scholar] [CrossRef]
- Tehrani, M., A. Rathgeber, E. Dougherty, L. Fulton, and J. Fournier. 2024. Dow Jones Sustainability Indices and ESG Scores: Do They Tell the Same Story? Sustainability 16, 14: 6110. [Google Scholar] [CrossRef]
- Testa, F., O. Boiral, and F. Iraldo. 2018. Internalization of environmental practices and institutional complexity: can stakeholders pressures encourage greenwashing? Journal of Business Ethics 147: 287–307. [Google Scholar] [CrossRef]
- Voronina, N. P. 2023. Greenwashing: a legal mechanism to counteract. Vestnik Universiteta Imeni O. E. Kutafina 3: 28–36. [Google Scholar] [CrossRef]
- Walker, K., and F. Wan. 2012. The harm of symbolic actions and green washing: corporate actions and communications on environmental performance and their financial implications. Journal of Business Ethics 109: 227–242. [Google Scholar] [CrossRef]
- Xing, C., Y. Zhang, and D. Tripe. 2021. Green credit policy and corporate access to bank loans in China: the role of environmental disclosure and green innovation. International Review of Financial Analysis 77: 101838. [Google Scholar] [CrossRef]
- Zhang, D. 2022a. Environmental regulation and firm product quality improvement: how does the greenwashing response? International Review of Financial Analysis 80: 102058. [Google Scholar] [CrossRef]
- Zhang, D. 2022b. Environmental regulation, green innovation, and export product quality: what is the role of greenwashing? International Review of Financial Analysis 83: 102311. [Google Scholar] [CrossRef]
Figure 1.
Total sustainability scores across brands.
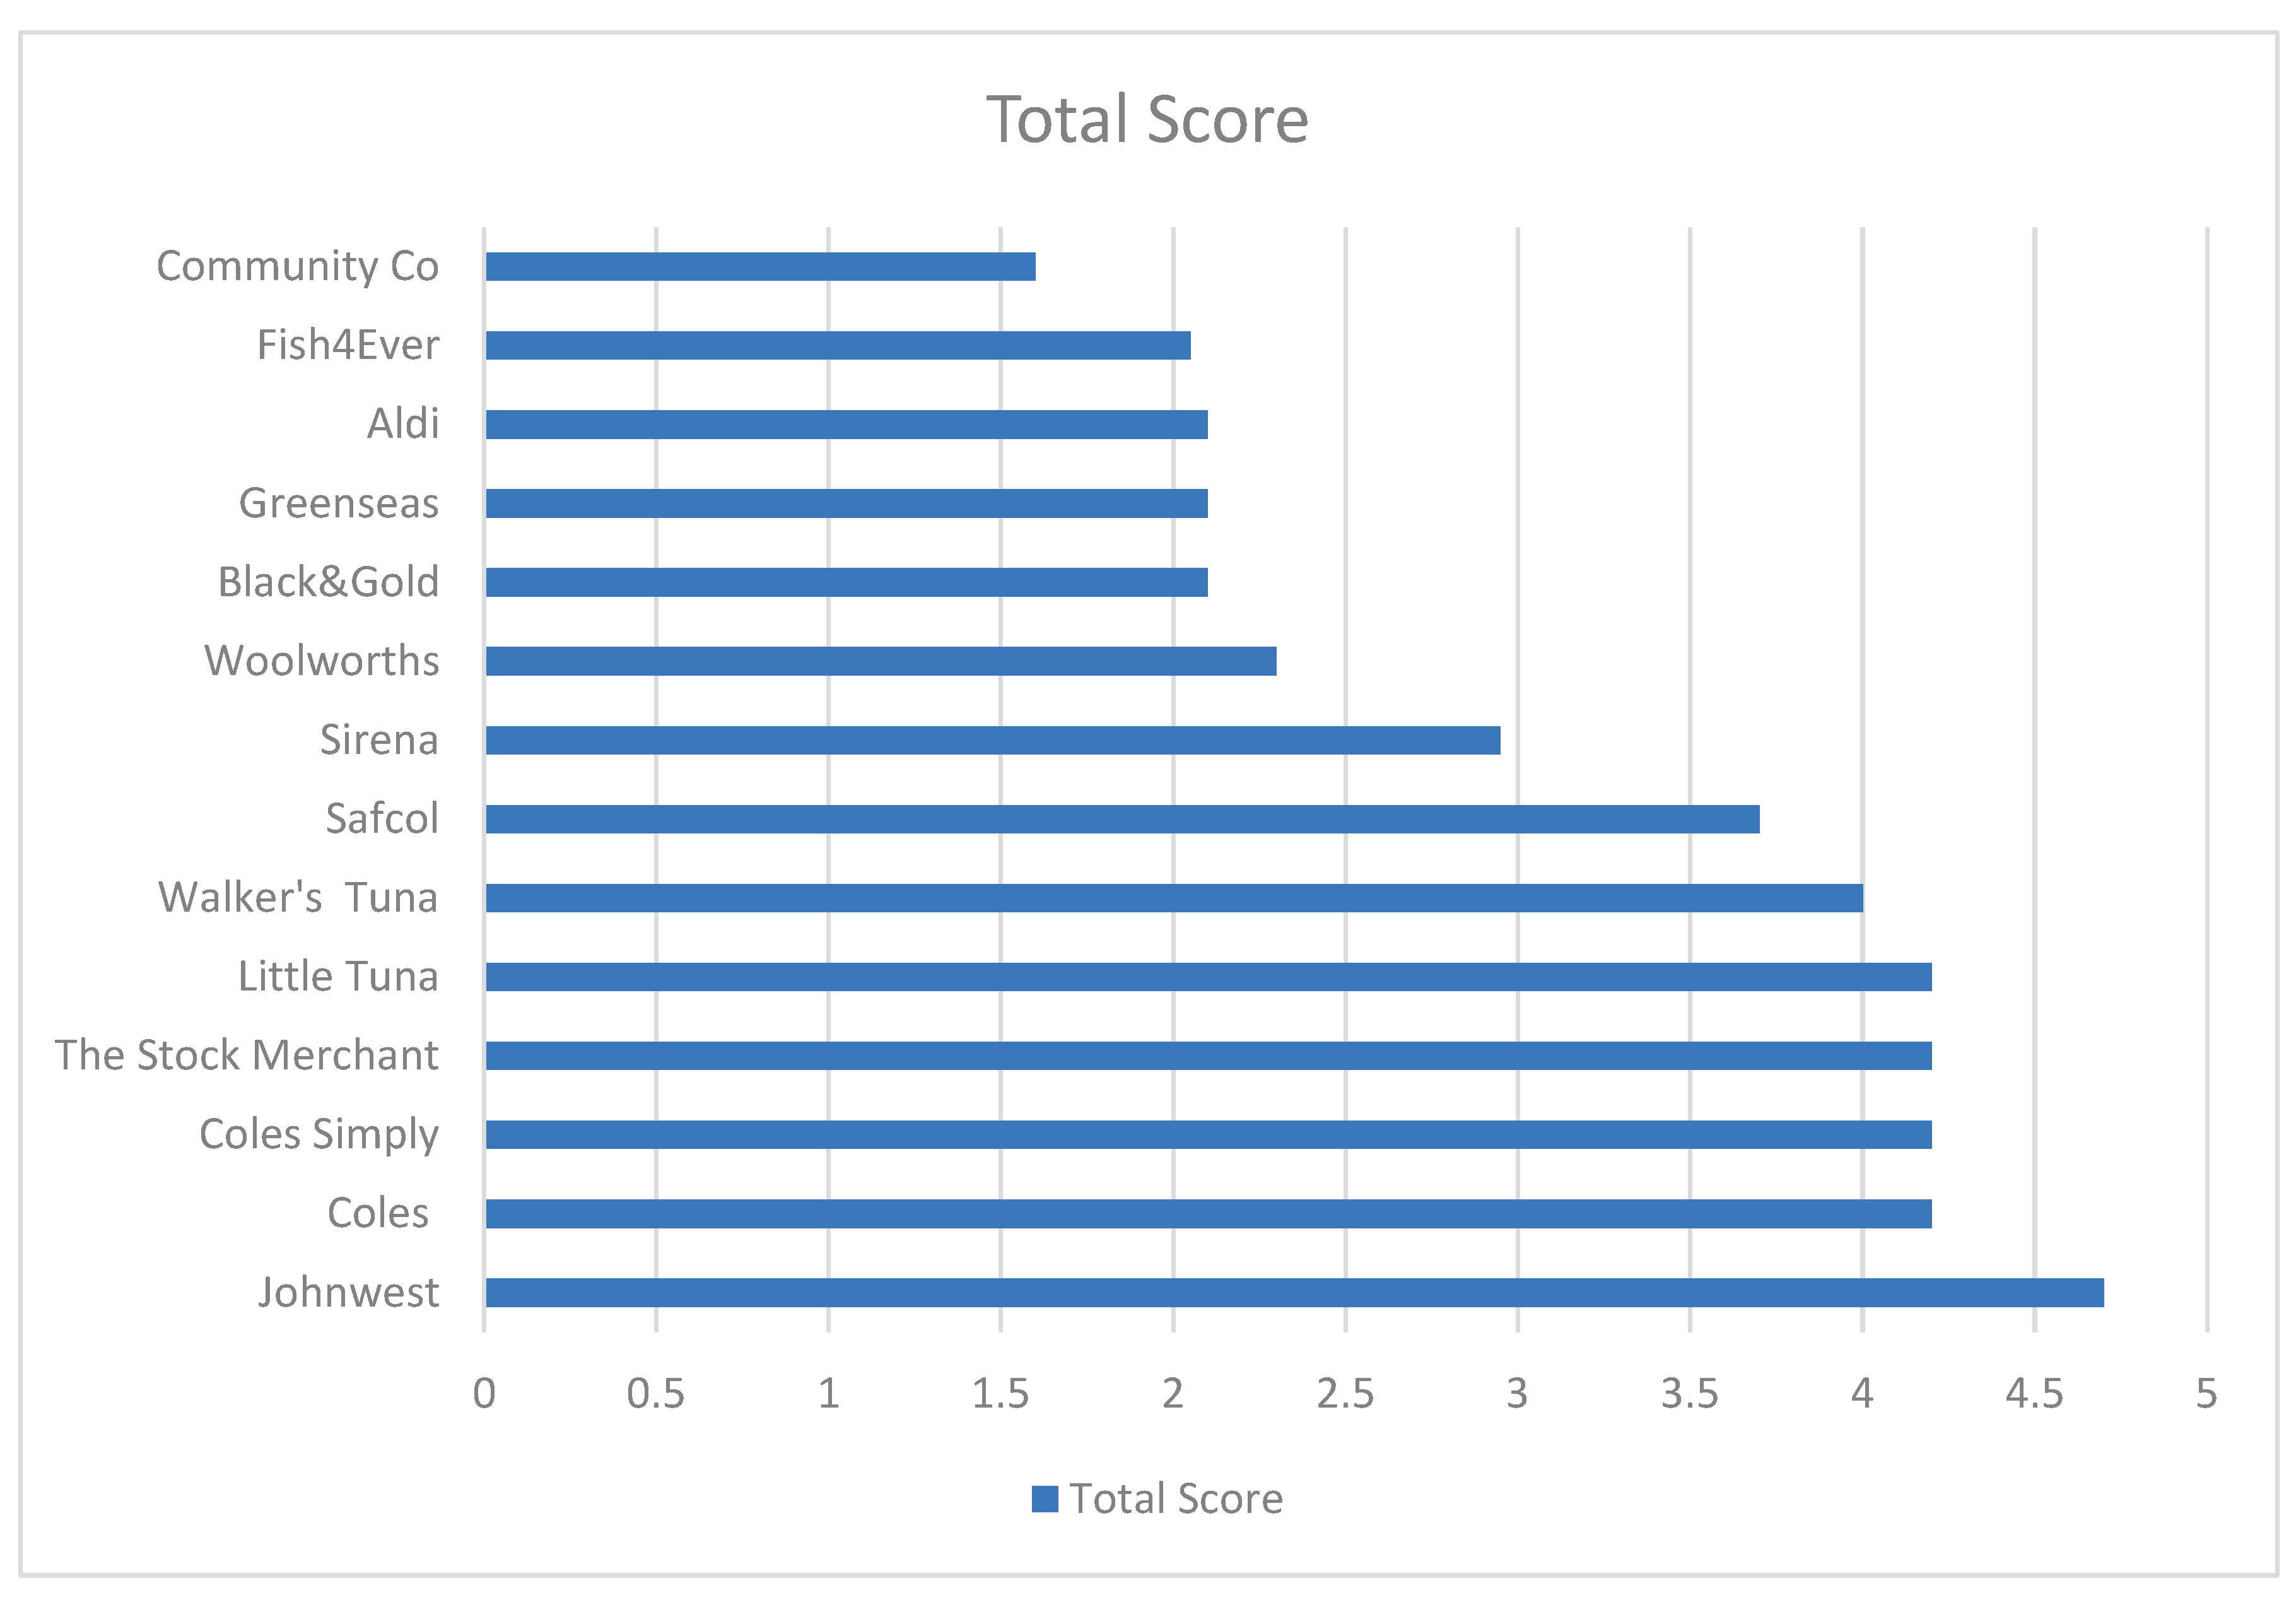
Figure 2.
Sustainability scores across ACCC principles.
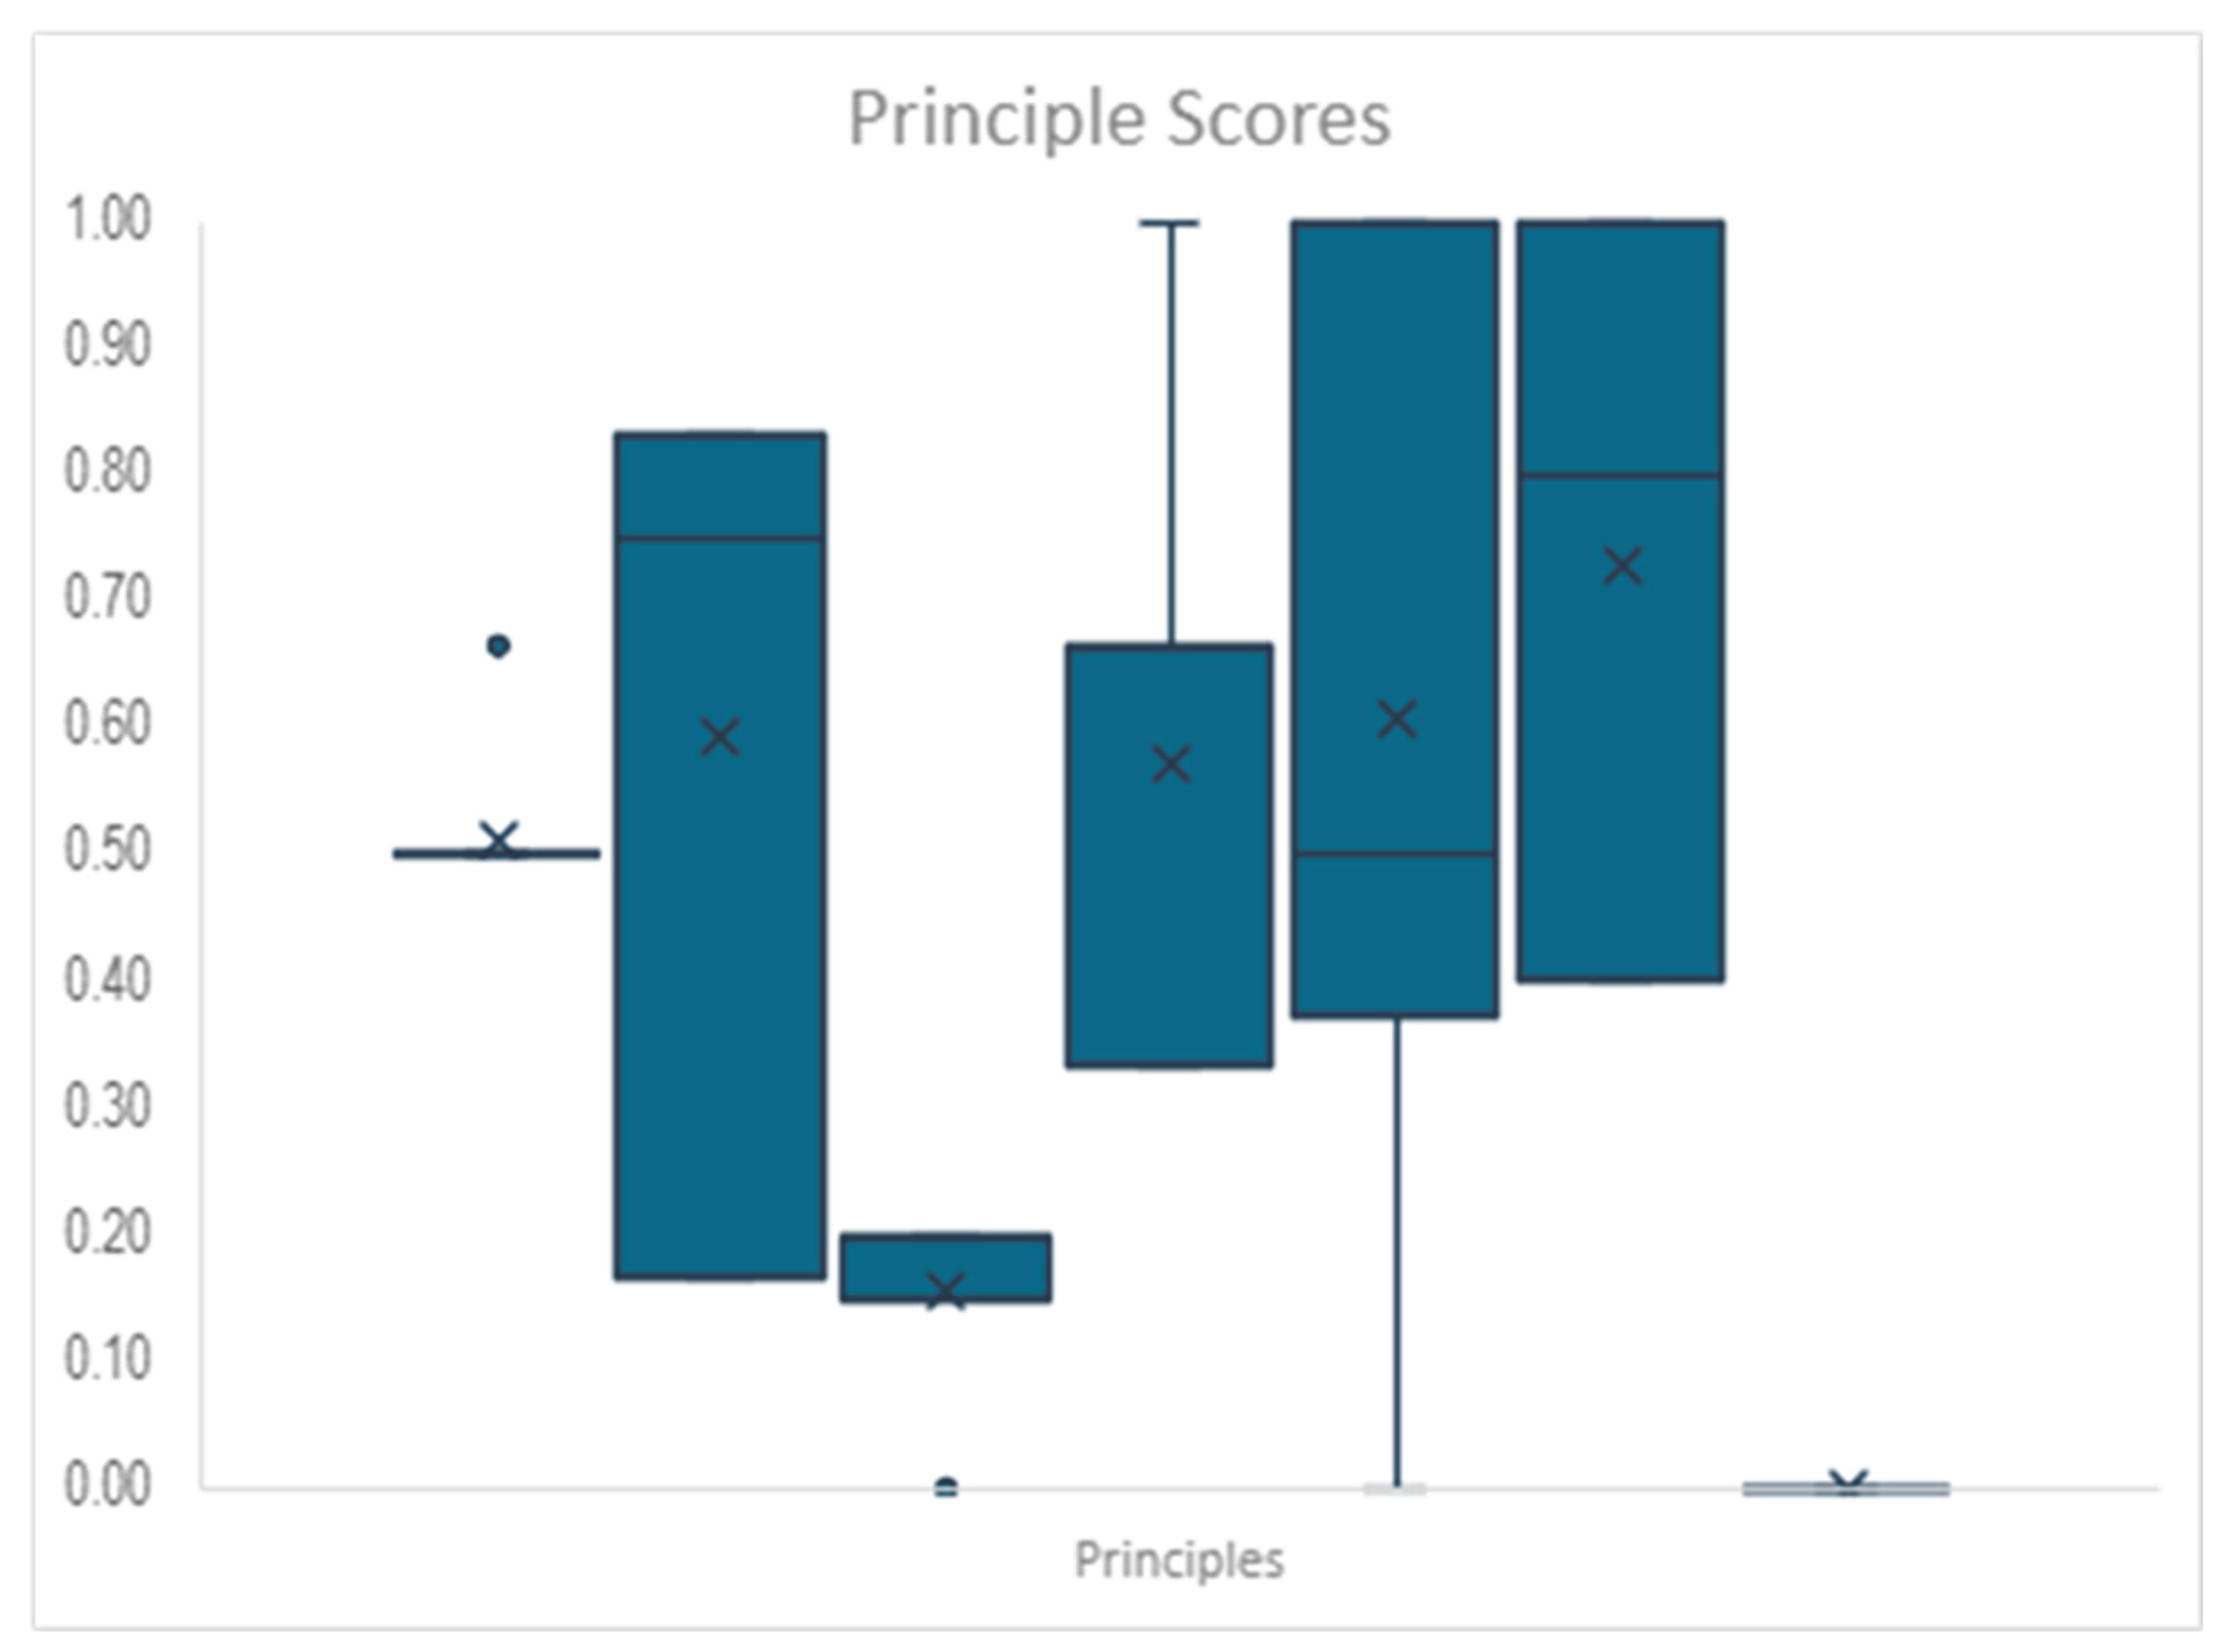
Figure 3.
Heat Map for scores across principles and brands.
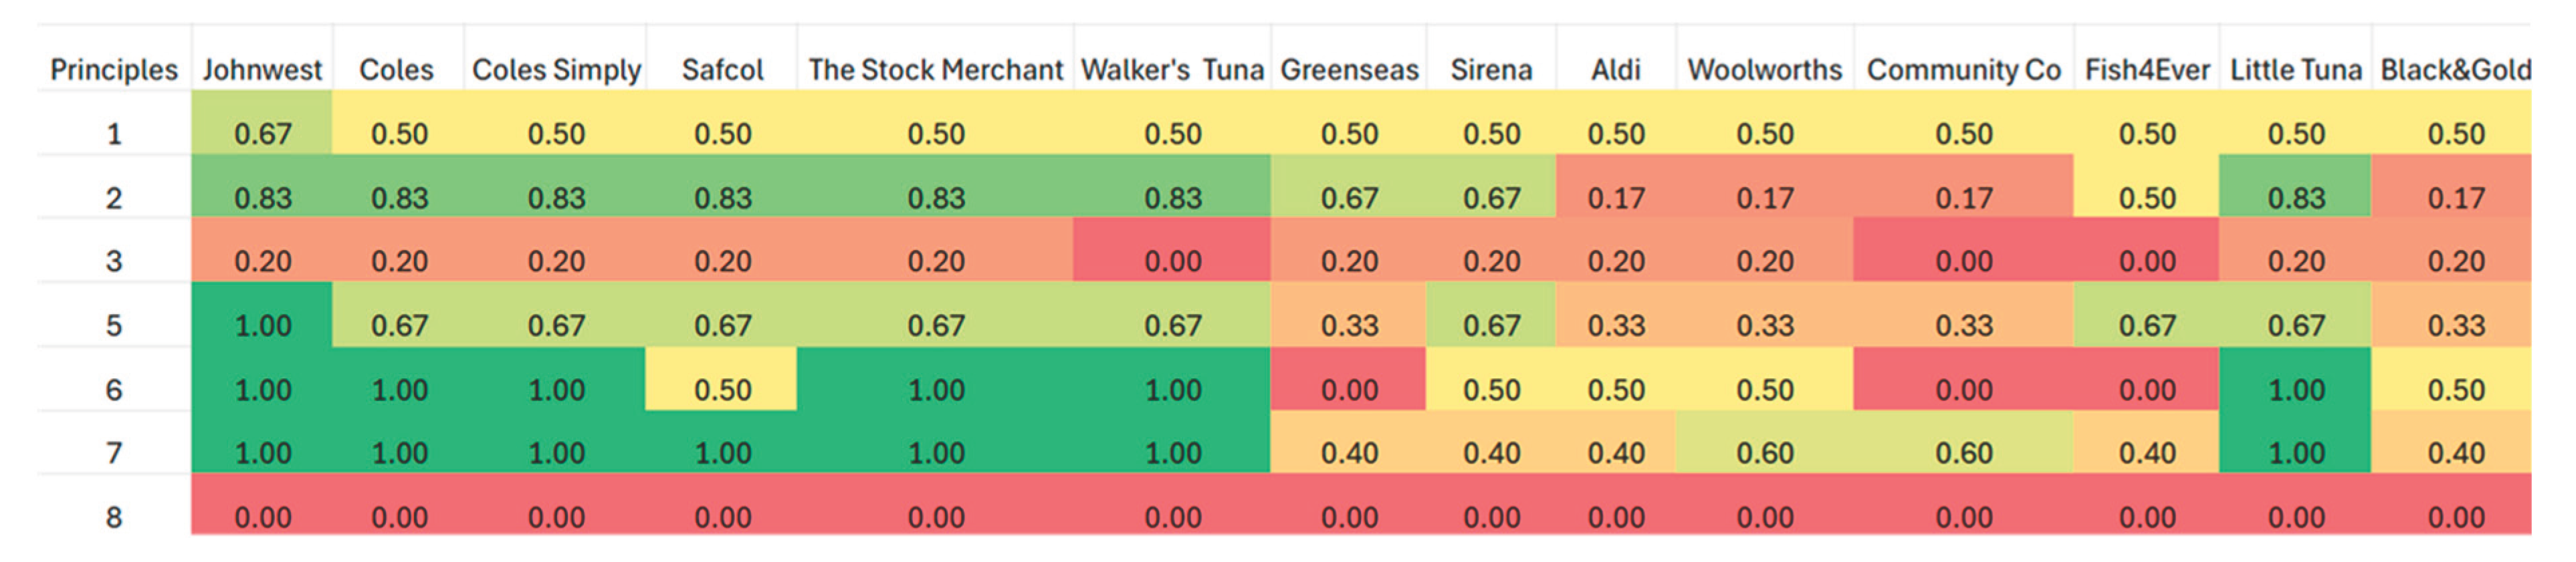

Table 1.
Determining scores for indexing attributes.
| Yes Answer | No Answer | Not enough information to provide an Answer | |
| Positive Attribute | 1 | 0 | 0 |
| Negative Attribute | 0 | 1 | 0 |
Disclaimer/Publisher’s Note: The statements, opinions and data contained in all publications are solely those of the individual author(s) and contributor(s) and not of MDPI and/or the editor(s). MDPI and/or the editor(s) disclaim responsibility for any injury to people or property resulting from any ideas, methods, instructions or products referred to in the content. |
© 2025 by the authors. Licensee MDPI, Basel, Switzerland. This article is an open access article distributed under the terms and conditions of the Creative Commons Attribution (CC BY) license (http://creativecommons.org/licenses/by/4.0/).
Copyright: This open access article is published under a Creative Commons CC BY 4.0 license, which permit the free download, distribution, and reuse, provided that the author and preprint are cited in any reuse.


