
Submitted:
20 August 2025
Posted:
21 August 2025
You are already at the latest version
Abstract
In the context of financial decision-making, Economic Value Added (EVA) is a relevant indicator for assessing firms’ financial efficiency. This research aimed to determine the impact of the Weighted Average Cost of Capital (WACC) and profitability on the EVA of industrial sector companies in Peru. The study employed a quantitative, correlational–causal, non-experimental design. The sample included four industrial sector companies listed on the Lima Stock Exchange (BVL). Data were collected through document review and analyzed using panel data regression models with a longitudinal approach. The results show that Return on Equity (ROE) is a statistically significant predictor of EVA in all companies, indicating a direct relationship. In contrast, WACC showed a weak relationship with the variables studied. It is concluded that profitability shows a stronger and more consistent influence on EVA than WACC, although the impact of WACC varies across companies. However, the relationship between WACC, ROE, and EVA differs among companies. The model explains a moderate share of EVA variability (14.39% to 50.52%), suggesting that factors beyond WACC and profitability also contribute to value creation. These results provide both theoretical insights into financial performance metrics and practical guidance for managers in emerging markets.
Keywords:
Economic Value Added
; profitability
; capital structure
; investment
; industrial sector
1. Introduction
Understanding the impact of financing structure and profitability on Economic Value Added (EVA) remains a major challenge in finance and business. Globally, innovation strategies within organizations are becoming increasingly relevant as the competitive environment evolves and market demands increase (García-Sánchez et al., 2019; Flores-Macha et al., 2024). In this context, financial management has been shown to have an impact on firm profitability (Mang'ana et al., 2023), thus analysis of financial strategies suggests that adopting a value-based approach through EVA can significantly contribute to improving firm profitability (Seddaoui et al., 2024; Yupanqui-Castillo et al., 2024). In addition, EVA allows identifying competitive advantages and developed financial strategies, thereby strengthening firms’ competitiveness and economic attractiveness (Gonçalves et al., 2023)
Williamson (1996) points out that equity finance contracts do not always require repayment of the amount invested by a specific date. In the case of equity, no specific payment is guaranteed as a return for the use of the money; instead, claims on profits and liquidation value are residual and depend on the financial situation and performance of the firms. This highlights the challenge of balancing debt and equity to finance operations in a dynamic market, where the goal is to generate value for the firm.
According to Climent and Haftor (2021), companies must focus on generating economic value to be competitive, which requires strategic planning and the evaluation of performance metrics. In this context, discussions on the Weighted Average Cost of Capital (WACC) arise from the need to adequately measure the cost of capital, a crucial aspect to ensure operational continuity. The WACC weights the cost of capital according to the proportion of debt and equity in the firm's financial structure, reflecting the average cost of raising new funds (Brealey et al., 2017). This makes it a factor that assesses the profitability of investments and calculates the present value of future cash flows (Kostruba, 2024).
Traditional measures of financial performance often emphasize lenders’ cost of capital, overlooking that shareholders also expect a return on their investment. EVA represents a contemporary measure of financial performance, reflecting the economic benefit available to owners (Zenzerović and Benazić, 2024).
In Latin America, understanding the factors that influence EVA is essential for assessing firms’ financial efficiency, particularly in industrial sectors where financial decisions are critical for long-term value creation (Oke and Ajeigbe, 2024). However, the evaluation of intangible resources—although crucial within the firm—still lacks precision, which limits their integration into value-based performance models (Lopes and Carvalho, 2021). Within this framework, Return on Equity (ROE) and the Weighted Average Cost of Capital (WACC) emerge as key indicators for evaluating industrial performance, as they provide firms with reliable information for making informed decisions about value creation (Mariño-Arevalo and Muñoz-Martínez, 2024).
Consequently, WACC and ROE should be considered as determinant variables in the creation or destruction of economic value within organizations, and it is necessary to know their impact on EVA, which is why the general objective is to determine the impact of the Weighted Average Cost of Capital and Return on Equity on the Economic Value Added of the industrial sector.
The literature discusses various theoretical approaches to WACC, EVA, and ROE. According to Damodaran (2023) the WACC is defined as the opportunity cost of all capital invested in a company and is expressed as follows: WACC=W_d [i*(1-t)]+W_s*ks, where Wd: is the proportion of debt in the capital structure of the firm; i: Interest rate on debt; T: Income tax rate; Ws: proportion of equity in the capital structure of the firm; ks: Cost of equity.
According to Fung et al. (2002), profitability measures the ability of a company to generate profits based on its sales, assets or invested capital; for Soto and Hiza (2021) it is an important variable in business growth and business sustainability, and there are different types of profitability. According to Peters (2024), ROE is a type of profitability that, being optimal, balances profits for shareholders and the company's ability to raise capital. Mafra et al. (2016) highlighted its relevance as a key indicator in economic decision-making, while Hernández et al. (2013) noted that it influences the mix of debt and equity financing within the financial system. Hoyle et al. (2020) indicated that it is important to implement corporate governance strategies to optimize profitability.
For Heryan and Gajdova (2024), DuPont analysis is recognized for its complexity in assessing the financial performance of companies. Ayaba et al (2023) mention that it is important in analyzing the financial health of the company, belonging to the category of economic profitability ratios, being useful in assessing the operational and economic performance of a company.
A widely used method for measuring profitability, particularly shareholders’ return on equity (ROE), is the DuPont analysis. This method breaks ROE down into three key components: net profit margin, asset turnover and financial leverage. These indicators allow assessing financial performance from different perspectives (Saus-Sala et al., 2021).
Net profit margin indicates what proportion of revenue is converted into net profit, asset turnover measures the efficiency of using assets to generate revenue, and financial leverage reflects the level of indebtedness and the firm's ability to manage its solvency (Mei et al., 2019). The DuPont analysis formula combines these three ratios: net income to sales (net profit margin), sales to assets (asset turnover) and assets to equity (financial leverage), providing a comprehensive view of the sources driving profitability (Saus-Sala et al., 2021). The DuPont analysis is useful to identify which component has the greatest impact on ROE (Jin, 2017).
EVA is a financial performance metric that measures the real economic profit of a company by considering the Net Operating Profit After Taxes (NOPAT) and the opportunity cost of capital (Tripathi, 2022). Introduced by G. Bennett Stewart and Joel M. Stern in 1989, EVA assesses whether a firm generates or destroys value by allowing capital costs to be deducted from profits earned (Sugeng, 2023). Similarly, Marshall et al. (1920) note that EVA reflects the profit remaining after deducting capital ratios, while Amat (2000) highlights its usefulness in assessing organizational wealth and operational risk.
EVA is calculated as the difference between Return on Invested Capital (ROIC) and WACC, multiplied by total invested capital.. This metric not only measures financial performance, but also guides strategic decision-making, aligning the interests of management and shareholders (Zhang et al., 2024). Moreover, its advantage over indicators such as Return on Assets (ROA) and ROE lies in its ability to balance operating costs, interest, taxes and expected economic returns, making it a tool for measuring value creation (Pasandi et al., 2024).
The scientific literature has addressed the relationship between WAC and EVA of companies. López et al. (2019) demonstrated the relevance of EVA in the stock valuation of four Colombian companies between 2015 and 2018, using a quantitative approach based on the results of the economic value-added macro inducer. They concluded that long-term value creation has a significant impact on the price of the market in which they operate, confirming their profitability.
Simultaneously, Leite and Silva (2019) conducted research on 127 firms in the industrial sector during the period 2009-2013, of which 82 were Brazilian and 45 Chilean. They found that a higher share of third-party equity in the capital structure of these firms was strongly negatively related to their economic performance, which compromised their profitability. Also, EVA showed a low relationship with the economic performance of Brazilian and Chilean firms.
The study by Tudose et al. (2022) explored the interrelationships between several financial performance metrics: profit margin (PM), profit growth rate, ROA, ROE and EVA. Analyses such as these revealed that factors such as leverage and firm size have a positive interdependence with respect to EVA.
Similarly, Roque et al. (2023) evaluated the relationship between EVA and its determinants. They examined 9,037 firms in nine Colombian economic sectors. The results of the statistical tests indicate a weak relationship between EVA and its determinants. They concluded that there is a weak linear association between EVA and its factors, suggesting that the generation of shareholder value does not depend on a single factor, but on the result of a synergy between them.
Furthermore, Tudose et al. (2021) conducted an exploratory case study and statistical analysis, demonstrating that a firm can improve its performance even during periods of growth, characterized by constant investments. The results of this study contradict previous research indicating that EVA is negatively affected by increasing invested capital. These findings open up new lines of research to explore whether, at the industry level, EVA-based performance evaluation can foster the development of a firm's economic capital.
Padilla-Ospina et al. (2019) conducted a study where they examined the financial performance of 21 Colombian firms considered the most innovative in 2016. During the period from 2012 to 2016, they analyzed indicators such as EVA and others, obtaining that only 4 companies presented a positive EVA. On the other hand, Chen and Dodd (1997) argue that EVA has proven to be an effective indicator of financial performance, as it adjusts accounting profits to more accurately reflect the value generated for shareholders by subtracting the cost of capital from operating performance, aligning the interests of managers and shareholders.
One of the variables involved in the calculation of EVA is WACC; for Kroll and Levy (1980) this reflects the overall cost of capital of a company, which includes both the cost of debt and the cost of equity, being a critical measure in the evaluation of investment projects and the valuation of companies. In this sense, research related to EVA and WACC has been conducted, such as Bueno et al. (2020), who calculated the cost of capital of B3-listed companies from 2012 to 2019, using WACC as the estimation method, associating the result of WACC with EVA, obtaining that some WACC are different, and only some companies had a positive EVA, concluding that the companies that have generated value are those that maintained a lower WACC.
Girardone et al. (2024) highlighted that the increase in FinTech lending has facilitated the reduction of WACC and optimized the corporate capital structure. This decrease in the cost of capital improves key indicators such as ROA and ROE, which, in turn, increases firms' EVA.
Soto (2021), in analyzing the relationship between financial management and profitability of Antamina S.A. during 2018-2019, used EVA and other traditional financial indicators, finding that ROIC higher than WACC was key to this result and highlighted a positive correlation between EVA and Antamina's strategic approaches. In addition, EVA enabled Antamina to anticipate and overcome business challenges through more effective financial management.
While there are multiple studies on EVA and its associated variables, there is still a lack of integrated analysis directly linking EVA to profitability and WACC. This highlights the importance for companies to structure adequate financing in order to operate efficiently and preserve strong indicators of profitability and value creation.
This study analyzes the relationship between WACC, profitability, and their influence on economic value creation in Peruvian industrial firms (2013–2022). It addresses a gap in the literature by directly linking these variables within the context of an emerging market.
The relevance of this analysis lies in understanding how WACC and profitability correlate with EVA, and in quantifying the changes in the latter as a result of fluctuations in the two aforementioned variables. In this sense, the main objective is to determine the impact of the Weighted Average Cost of Capital and profitability on the Economic Value Added of companies in the industrial sector in Peru.
2. Methodology
This study employed a quantitative and explanatory approach. Its main purpose is to generate fundamental knowledge that establishes the basis for future research of a more applied nature, focusing on the degree of cause-effect interrelationship between the variables studied.
The study employed a correlational-causal panel design, applying panel data regression models to analyze the relationship between WACC, profitability, and EVA, and to determine whether changes in one variable affect the others. A longitudinal approach was applied, examining industrial companies over a continuous ten-year period to identify potential trends and causality. This approach made it possible to observe changes and trends over time, which was crucial for understanding causality. The study is classified as a panel study, since data were obtained from industrial companies at multiple points in time (Groves et al., 2009). This provided a clearer picture of the causal relationships between WACC and profitability in EVA.
The population for this study consisted of 32 companies in the industrial sector, covering a range of industries representing the key components for the analysis. The selection criteria included: belonging to the industrial sector, being listed on the Lima Stock Exchange (BVL) and filing financial statements with the Superintendencia del Mercado de Valores (SMV), specifically in the food and beverage sector. These companies were evaluated on a quarterly basis over the last ten years.
In addition, strict requirements were set for the inclusion of companies, such as the need to show a clear debt structure in the notes to and audit of the FFs. This process ensured that only those companies that met these criteria were selected, improving the validity and reliability of the study.
The selected sample is composed of 4 companies: Agroindustrias Aib S.A.; Laive S.A; Leche Gloria S.A. and Unión de Cervecerías Peruanas Backus y Johnston S.A.A. The study employed a purposively selected sample, so no formulas were applied for its selection; instead, inclusion and exclusion criteria were established (Paitán et al., 2018)
The technique used in this study was the documentary review, which consisted of the collection and evaluation of both physical and digital documents. Quarterly audited financial statements of 40 documents per company were analyzed, in addition to other relevant documents. This analysis provided data on WACC, profitability and EVA, allowing for an in-depth understanding of the key variables of the study.
To assess the impact of WACC and profitability on the EVA of industrial firms in Peru, we used data processed with the statistical software STATA (version 16.0). A normality test was performed using the Shapiro–Wilk method. Once normality was confirmed, correlation and linear regression analyses were applied to assess the impact of WACC and ROE on EVA. In addition, to ensure the robustness of the regression models, diagnostic tests were performed to evaluate potential econometric problems. Specifically, heteroskedasticity was examined using the Breusch–Pagan test, while autocorrelation was assessed through the Durbin–Watson test. The results indicated no severe heteroskedasticity or autocorrelation problems, confirming the adequacy of the panel regression models employed. These diagnostic procedures enhance the reliability of the estimated coefficients and strengthen the validity of the conclusions drawn from the data analysis.
Confidentiality and responsible handling of any sensitive data has been guaranteed, respecting the privacy of the entities analyzed. Transparency was ensured by properly citing sources and clearly describing methods to allow reproducibility. Likewise, strict integrity has been maintained in the presentation of data, ensuring that it is objective and based solely on the information obtained; verifying that all information used is legally available and comes from reliable sources, guaranteeing its authenticity and freedom from adulteration.
3. Results
The results present the identification of the values of WACC, ROE and EVA, in order to subsequently determine the correlation of WACC and ROE with EVA, and the regression of these two variables with EVA.
3.1. Identification of Financial Indicators
Analysis of the forty quarterly financial statements allowed us to calculate average quarterly values of WACC, ROE, and EVA, which are interpreted as follows:
Figure 1 shows the average quarterly WACC for four companies in the industrial sector in Peru. Unión de Cervecerías Peruanas Backus y Johnston S.A.A. has the highest WACC, with 3.57%, followed by Laive S.A. with 3.06% and Leche Gloria S.A. with 2.79%. Agroindustrias Aib S.A. shows the lowest WACC, reaching only 0.27%. These values are essential to evaluate the cost of financing and the efficiency of the companies' financing structure.
Figure 2 presents the quarterly averages of the main financial indicators evaluated in the four companies selected. Unión de Cervecerías Peruanas Backus y Johnston S.A.A. has the highest ROE, with 2.298. Agroindustrias Aib S.A. has the lowest ROE, with 1.779.
In terms of profit margin, Unión de Cervecerías Peruanas Backus y Johnston S.A.A. leads with a value of 0.319, reflecting effective cost and expense management. Agroindustrias Aib S.A. has the lowest profit margin, with 0.002. Asset turnover, which indicates efficiency in sales management, is higher in Laive S.A. (0.363) and lower in Agroindustrias Aib S.A. (0.138).
Finally, the capital multiplier, or financial leverage, is higher in Unión de Cervecerías Peruanas Backus y Johnston S.A.A. (2.298), which reflects sound financial management, while Agroindustrias Aib S.A. has the lowest value (1.779). This financial component is decisive, as the observed profitability indicates efficient operational management and strategic use of resources to generate economic value (Brigham and Ehrhardt, 2013).
Figure 3 shows the average EVA for the four companies studied, highlighting improvements in profitability and value generation in some of them during the period analyzed. Unión de Cervecerías Peruanas Backus y Johnston S.A.A. leads with a high and stable EVA of 74,259.68, followed by Leche Gloria S.A. with 19,420.99. In contrast, Laive S.A. presents a negative EVA of -705.06, while Agroindustrias Aib S.A. registers the lowest EVA, with -178.17, which evidences difficulties in the creation of economic value by these companies.
Table 1 presents the average values of the EVA components. Leche Gloria S.A. and Unión de Cervecerías Peruanas Backus y Johnston S.A.A. show a ROIC higher than their WACC—4.10% vs. 2.79% and 6.18% vs. 3.57%, respectively—indicating value creation. However, Agroindustrias Aib S.A. reports a negative invested capital, which makes the ROIC calculation less reliable and compromises the interpretability of the ROIC-WACC comparison in this case. In contrast, Laive S.A. displays a ROIC of 2.69%, which is lower than its WACC of 3.06%, suggesting value destruction likely caused by high financing costs or inefficiencies in capital management.
3.2. Correlation
In the following, the degree of correlation of WACC and ROE with EVA is described, it is important to analyze how closely they are associated, and to be able to obtain whether their association is directly or inversely proportional.
3.2.1. Correlation Between EVA and WACC
Table 2 shows that Agroindustrias Aib S.A., Leche Gloria S.A., and Unión de Cervecerías Peruanas Backus y Johnston S.A.A. had negative correlations between EVA and WACC, suggesting that higher WACC is associated with lower EVA. suggesting that an increase in WACC is associated with a reduction in EVA. From a financial perspective, this inverse relationship is desirable, as it indicates a lower cost of capital with higher levels of economic value added. In contrast, Laive S.A. showed a positive correlation, suggesting that an increase in WACC is associated with an increase in EVA, which contradicts financial theory expectations.
3.2.2. Correlation Between EVA and ROE
Table 3 presents the correlation analysis between ROE and EVA. All companies showed a positive relationship between ROE and EVA, consistent with the expected theoretical relationship between the two metrics: an increase in ROE is usually linked to an increase in EVA, given its relationship with return on equity; thus it can be seen that Agroindustrias Aib S.A., Laive S.A., Leche Gloria S.A. have the strongest correlations, on the other hand, Unión de Cervecerías Peruanas Backus and Johnston S.A.A. presented the lowest correlation.
3.3. Linear Regression
The regression analysis evaluated the relationships among financial variables of industrial sector companies, specifically in food and beverages. Linear regression analyses how a dependent variable varies in relation to other independent variables.
3.3.1. Regression WACC, EVA
Table 4 shows that the regression coefficient reflects the impact of the WACC on each change in EVA. Agroindustrias Aib S.A. and Leche Gloria S.A. show a negative influence, indicating that increases in WACC are associated with decreases in EVA. Unión de Cervecerías Peruanas Backus y Johnston S.A.A. shows the most considerable negative impact, indicating a significant decrease in EVA with an increase in WACC. However, not all coefficients are statistically significant; for example, Agroindustrias Aib S.A. shows a p-value of 0.349, indicating a lack of statistical significance. The coefficient of determination R² shows that in Unión de Cervecerías Backus y Johnston S.A.A., the variability of EVA explained by the WACC is 7.8%.
3.3.2. Regression EVA, ROE
In Table 5, the regression coefficient shows the impact of ROE on EVA, showing a positive impact in all the companies studied, i.e. as ROE increases, so does EVA, an expected result in financial management. Moreover, since all p-values are less than 0.05, all coefficients are statistically significant. Finally, the R² factor reflects the proportion of EVA variability explained by changes in ROE, with Agroindustrias Aib S.A. being the company with the highest variability of 49.66% in EVA due to changes in its ROE.
3.3.3. Regression EVA, WACC, ROE
Table 6 presents the regression results for each of the companies studied. Agroindustrias Aib S.A. shows a decrease of 91,442.25 units in EVA for each unit increase in WACC, while, for each unit increase in ROE, an increase of 70,412.94 units in EVA is expected. Leche Gloria S.A. experiences a decrease of 1,565,041 units in EVA for each unit increase in WACC, and an increase of 721,722.4 units for each unit increase in ROE. Unión de Cervecerías Peruanas Backus y Johnston S.A.A. shows a significant decrease of 9,207,844 units in EVA with each additional unit increase in WACC, and an increase of 1,154,318 units for each unit increase in ROE. Finally, Laive S.A. presents a decrease of 117,882.8 units in EVA for each unit increase in WACC, and an increase of 126,554.2 units in EVA with each increase in ROE. In all models, ROE was confirmed as a statistically significant predictor of EVA. In contrast, WACC only shows significance in some companies, and its explanatory power is limited. The coefficient of determination (R²) ranges from 14.39% to 50.52%, indicating that other factors not included in the model also influence EVA.
Figure 4 presents a graphical summary showing the correlation and impact of the WACC and ROE variables on EVA. The two-way arrows represent the correlation with EVA, the more intense the less dotted the arrow. The one-way arrows to EVA reflect the impact of each variable; ROE has a stronger impact and a stronger relationship, especially in Agroindustrias Aib S.A., with the strongest impact and a stronger directly proportional relationship. The results highlight that ROE is a significant predictor of EVA, while WACC has a smaller impact. An increase in ROE generally raises EVA, while an increase in WACC can reduce it. The regression model explained between 14.39% and 50.52% of the variability in EVA, reflecting a moderate fit and providing valuable insight into these key financial relationships.
4. Discussion
The main objective of the study was to analyze the influence of WACC and profitability on the EVA of companies in the industrial sector in Peru. The results show that ROE is a significant predictor of EVA, while WACC has a lesser influence. Generally, an increase in ROE increases EVA, while an increase in WACC is usually associated with a reduction in EVA. These results indicate that ROE is a more reliable indicator of financial capacity than WACC, reinforcing its role as a key determinant of economic value added in industrial firms. These findings are consistent with the study by Leite and Silva (2019), who found a negative relationship between third-party financing and economic performance in Brazilian and Chilean firms. In addition, Roque et al. (2023) reported a weak linear association between the determinants of EVA and EVA itself, which could indicate the influence of other internal factors on performance. For firms in the industrial sector in Peru, improving ROE and decreasing WACC can be an effective strategy to increase EVA. Theoretically, this study contributes to the literature evaluating the relationship between profitability, weighted average cost of capital and EVA creation.
The description of WACC behavior in the selected companies, based on 40 values obtained from their financial statements, shows that Unión de Cervecerías Peruanas Backus y Johnston S.A.A. had the highest WACC with 3.57%, followed by Leche Gloria S.A. (2.79%), Laive S.A. (3.06%) and Agroindustrias Aib S.A., which recorded the lowest WACC of 0.27%. These results suggest that a higher WACC tends to be associated with lower EVA in most cases, although this relationship is not consistent across all firms. This highlights the limited role of WACC in explaining economic value creation. From a financial perspective, a high WACC increases the cost of capital and reduces EVA, whereas a low WACC favors higher EVA, emphasizing the need to maintain a low cost of capital to maximize value creation. These findings align with previous studies, such as Bueno et al. (2020), which reported that firms with lower WACC generated higher economic value added. Likewise, Soto (2021) presented similar results in his analysis of the Antamina mining company, highlighting the importance of efficient management of ROIC in relation to WACC to optimize financial management and improve EVA.
The DuPont profitability analysis revealed key aspects of the selected companies’ financial performance. Unión de Cervecerías Peruanas Backus y Johnston S.A.A. showed the highest profit margin (0.319), while Agroindustrias Aib S.A. recorded the lowest (0.002). Laive S.A. showed the highest asset turnover ratio at 0.363, while Unión de Cervecerías Peruanas Backus y Johnston S.A.A. recorded the highest capital multiplier at 2.298. However, this value remains below the 2022 industry average of 7.4%, as reported by Ready Ratios. Agroindustrias Aib S.A. had the lowest at 1.779%. These findings are consistent with the study by Tudose et al. (2022), which revealed positive relationships between profit margin, ROE and EVA as key indicators of financial performance. Furthermore, the study suggests that liquidity and sales growth do not significantly affect value creation, emphasizing that ROE components, together with efficient cost and expense management, are essential to improve EVA. Thus, industrial companies in Peru could benefit from optimizing ROE by improving sales management and maintaining rigorous control over profit margins and asset turnover. Theoretically, this study broadens the understanding of the relevance of ROE components in generating economic value, underlining the usefulness of DuPont analysis as an essential tool for assessing financial performance.
Finally, Agroindustrias Aib S.A., Leche Gloria S.A. and Unión de Cervecerías Peruanas Backus y Johnston S.A.A. generate economic value with a ROIC higher than their WACC, with values of 0.47% and 0.27%, 4.10% and 2.79%, and 6.18% and 3.57%, respectively. On the other hand, Laive S.A. presents a ROIC of 2.69%, lower than its WACC of 3.06%, suggesting value destruction. These results are in line with the theory that ROIC higher than WACC reflects good capital management, contributing to value creation.
Moreover, these findings are consistent with previous studies, such as those of López et al. (2019), who found that EVA positively affects the market price of firms in the long run. Padilla-Ospina et al. (2019) highlighted that only the most innovative firms achieve positive EVA, suggesting that not all firms, even those with good accounting indicators, generate economic value. Tudose et al. (2021) indicated that constant investments improve firm performance, in contrast to previous research that pointed to a negative impact of increased invested capital on EVA. Likewise, Mariño-Arévalo and Muñoz-Martínez (2024) highlighted the need to adapt the methods of calculating financial indicators according to the sector. Therefore, for companies in the industrial sector in Peru, maintaining a ROIC above the WACC is essential to generate economic value and strengthen long-term competitiveness. This study contributes to the existing literature, emphasizing the relationship between ROE, WACC and value creation, highlighting the importance of efficient management of invested capital to ensure business sustainability.
The main limitations for the elaboration of the article included the restricted access to Peruvian market-specific data, particularly on indicators such as WACC, EVA and profitability; the absence of an integrated methodological framework that unifies these variables in the local context; and a limited focus on the industrial sector, restricting the applicability of the findings to other sectors. In addition, reliance on previous studies reduced the possibility of proposing innovative approaches, while external factors such as macroeconomic fluctuations, government policies and technological innovations were not considered in the analysis. Finally, the limited availability of analytical tools and comprehensive data made it difficult to apply more detailed models and advanced simulations, limiting the methodological scope and analytical depth of the study.
5. Conclusions
The study analyzed the impact of WACC and profitability on the EVA of companies in the industrial sector in Peru. The results support the conclusion that ROE is a significant and consistent predictor of EVA, showing a directly proportional relationship across all firms analyzed. Conversely, WACC exhibited a weaker and more variable impact. Overall, these findings highlight the dominant role of profitability over capital cost in financial decision-making within the industrial sector; however, they should be interpreted with caution due to the study’s limited scope and data constraints.
The analysis of the Peruvian companies studied, such as Leche Gloria S.A., Agroindustrias Aib S.A. and Unión de Cervecerías Peruanas Backus y Johnston S.A.A., revealed significant differences in their WACC, suggesting that a higher WACC could result in lower EVA. Furthermore, the analysis concluded that Leche Gloria S.A. and Unión de Cervecerías Peruanas Backus y Johnston S.A.A. generate value by maintaining a ROIC higher than their WACC. By contrast, Laive S.A. shows value destruction, as its ROIC is lower than its WACC.
This analysis reinforces EVA as a key performance indicator linked to long-term market value. The findings emphasize the need for managers to optimize ROE and keep capital costs low, while providing scholars with insights to expand the theoretical discussion of value creation in emerging economies. It also underscores the need to adapt the EVA methodology to different business sectors to strengthen financial management and support strategic decision-making.
Author Contributions
Conceptualization, A.H. and P.C.; methodology, F.C.; formal analysis, J.C.; investigation, A.H. and P.C.; resources, J.C.; data curation, A.H.; writing—original draft preparation, A.H., and P.C.; writing—review and editing, F.C.; visualization, J.C.; supervision, F.C.; project administration, P.C. All authors have read and agreed to the published version of the manuscript.
Funding
This research received no external funding.
Informed Consent Statement
All authors have approved the manuscript and agree its submission to The Journal of Risk and Financial Management.
Data Availability Statement
We confirm that neither the manuscript nor any parts of its content are currently under consideration or published in another journal.
Conflicts of Interest
The authors declare no conflicts of interest.
References
- Amat, O. (2000). EVA valor económico agregado. Editorial Norma.
- Ayaba, M. M., Amo-Bediako, E., & Takawira, O. (2023). Evaluating the financial performance of listed REIT firms in South Africa: A 7-step DuPont model technique. International Journal of Applied Economics, Finance and Accounting, 17(2), 267-278. [CrossRef]
- Bolsa de Valores de Lima. (2023). Información financiera. Available online: https://www.bvl.com.pe/ (accessed on 25 March 2025).
- Brealey, R. A., Myers, S. C., & Allen, F. (2017). Principles of Corporate Finance (12th ed.). McGraw-Hill Education.
- Brigham, E. F., & Ehrhardt, M. C. (2013). Financial Management: Theory & Practice (14th ed.). Cengage Learning.
- Bueno, G., de Oriani, L., & Faria, J. (2020). Weighted average cost of capital and value creation of agribusiness companies listed on B3 between 2012 and 2019. http://www.custoseagronegocioonline.com.br/especialv16/OK%2016%20WAAC%20english.pdf (accessed on 20 July 2025).
- Chen, S., & Dodd, J. L. (1997). Economic Value Added (EVATM): An Empirical Examination of a new corporate performance measure. Journal of Managerial Issues, 9(3), 318–333. http://www.jstor.org/stable/40604150.
- Climent, R. C., & Haftor, D. M. (2021). Value creation through the evolution of business model themes. Journal of Business Research, 122, 353-361. [CrossRef]
- Damodaran, A. (2023). Data archives. Stern School of Business, New York University. https://pages.stern.nyu.edu/~adamodar/ (accessed on 22 July 2025).
- Flores-Macha, J.R., Pariona-Camyo, J.C., Cuyate-Reque, P.J., & Cordova-Buiza, F. (2024). Financial planning to minimize liquidity risk: a systematic review. In: El Khoury, R. (eds) Technology-Driven Business Innovation: Unleashing the Digital Advantage. Studies in Systems, Decision and Control, vol 540. Springer, Cham. [CrossRef]
- Fung, H., Xu, X. E., & Yau, J. (2002). Global hedge funds: risk, return, and market timing. Financial Analysts Journal, 58(6), 19-30. [CrossRef]
- García-Sánchez, I., Gallego-Álvarez, I., & Zafra-Gómez, J. (2019). Do the ecoinnovation and ecodesign strategies generate value added in munificent environments? Business Strategy and The Environment, 29(3), 1021-1033. [CrossRef]
- Girardone, C., Nieri, L., Piserà, S., & Santulli, R. (2024). Does FinTech credit affect firms’ cost of capital and capital structure? European Journal of Finance, 1-21. [CrossRef]
- Gonçalves, T. C., Louro, D., & Barros, V. (2023). Can corporate sustainability drive economic value added? Evidence from larger European firms. Journal of Risk and Financial Management, 16(4), 215. [CrossRef]
- Groves, R. M., Fowler Jr, F. J., Couper, M. P., Lepkowski, J. M., Singer, E., & Tourangeau, R. (2009). Survey methodology (2nd ed.). John Wiley & Sons.
- Hernández, G., & Ríos, H. (2013). Estructura financiera óptima, en la industria de los alimentos, que cotiza en la Bolsa Mexicana de Valores. Econoquantum, 10(2), 77–97. [CrossRef]
- Heryan, T., & Gajdova, K. (2024). DuPont analysis among European dentistry companies to measure the impact of the COVID-19 pandemic. E+M. Ekonomie A Management, 27(1), 161-174. [CrossRef]
- Hoyle, J. A., Dingus, R., & Wilson, J. H. (2020). An exploration of sales forecasting: sales manager and salesperson perspectives. Journal of Marketing Analytics, 8(3), 127-136. [CrossRef]
- Jin, Y. (2017). DuPont Analysis, Earnings persistence, and return on equity: evidence from mandatory IFRS adoption in Canada. Accounting Perspectives, 16(3), 205-235. [CrossRef]
- Kostruba, A. (2024). Comparative analysis of the squeeze-out procedure in Ukraine and the EU. Theoretical and Practical Research in Economic Fields, 15(2), 162. [CrossRef]
- Kroll, Y., & Levy, H. (1980b). Sampling errors and portfolio efficient analysis. Journal of Financial and Quantitative Analysis, 15(3), 655. [CrossRef]
- Leite, M., & Da Silva, T. P. (2018). Relação da estrutura de capital e do valor econômico agregado no desempenho econômico em empresas industriais brasileiras e chilenas. Revista Facultad de Ciencias Económicas, 27(1), 11-42. [CrossRef]
- Lopes, F. C., & Carvalho, L. (2021). Intangible assets and business performance in Latin America. RAUSP Management Journal, 56(4), 408-424. [CrossRef]
- Mafra, V., Gónzales, E., Ricardo, P., & Wahrlich, R. (2016). A cost-benefit analysis of three gillnet fisheries in Santa Catarina, Brazil: contributing to fisheries management decisions. Latin American Journal of Aquatic Research, 44(5), 1096–1115. [CrossRef]
- Mariño-Arevalo, A., & Muñoz-Martínez, I. T. (2024). Propuesta de adaptación de la metodología valor económico agregado (EVA) aplicada a diez instituciones de educación superior (IES) en Colombia. Revista Finanzas y Política Económica/Revista Finanzas y Política Económica, 16(1). [CrossRef]
- Marshall, A., & Marshall, M. P. (1920). The economics of industry. Macmillan and Company.
- Mang’ana, K, Ndyetabula, D, y Hokororo, S. (2023). Financial management practices and performance of agricultural small and medium enterprises in Tanzania. Social Sciences & Humanities Open, 7(1). [CrossRef]
- Mei, Z., Fei, F., Zhilong, Z., & Jinghua, W. (2019). Limitations of the dupont financial index system and its improvement. En Advances in intelligent systems and computing (pp. 985-993). [CrossRef]
- Oke, O. O., & Ajeigbe, K. B. (2024). Evaluating the Relationship between Accounting Variables, Value-Based Management Variables, and Shareholder Returns: An Empirical Approach. Journal of Risk and Financial Management, 17(8), 371. [CrossRef]
- Padilla-Ospina, A. M., Rivera-Godoy, J. A., & Ospina-Holguín, J. H. (2019). Desempeño financiero de las empresas más innovadoras del sector real de Colombia. Entramado, 15(1), 78–97. [CrossRef]
- Paitán, H. Ñ., Dueñas, M. R. V., Vilela, J. J. P., & Delgado, H. E. R. (2018). Metodología de la investigación: cuantitativa-cualitativa y redacción de la tesis.
- Pasandi, A. G., Botshekan, M., Jalilvand, A., Rastegar, M. A., & Noroozabad, M. R. (2024). Mapping capital ratios to bank lending spreads: the role of efficiency and asymmetry in performance indices. Journal of Risk and Financial Management, 17(7), 289. [CrossRef]
- Peters, L. L. (2024). FERC’s theory of anomalous capital markets. The Electricity Journal, 37(3), 107394. [CrossRef]
- Roque, D. I., Caicedo-Carrero, A., & De La Oliva De Con, F. (2023). Medición de los factores que determinan la creación de valor en los sectores económicos colombianos: periodo 2016-2020. Revista Finanzas y Política Económica, 15(1), 213-244. [CrossRef]
- Saus–Sala, E., Farreras–Noguer, À., Arimany–Serrat, N., & Coenders, G. (2021). Compositional Dupont analysis. a visual tool for strategic financial performance assessment. En Springer eBooks (pp. 189-206). [CrossRef]
- Seddaoui, N. R., Abdullah, N. S. S., Ahmad, N. S., & Gorundutse, N. A. H. (2024). Influence of marketing innovation and advanced technologies on firm performance: The Case of Algeria. Journal of Advanced Research in Applied Sciences and Engineering Technology, 48(2), 183-196. [CrossRef]
- Soto, P. E. P. (2021). Evaluación de la administración económica empresarial, usando el EVA, y su impacto en la rentabilidad de la compañía minera Antamina SA. Revista Jurídica del IPEF, (81)1, 1-11.
- Soto, V., & Hiza, O. (2021). The profitability-growth nexus in the Mexican manufacturing industry. Social Sciences & Humanities Open. 4(1). [CrossRef]
- Sugeng, N., & I. S. (2023). Analisis Kinerja Keuangan Dengan Menggunakan Metode Eva (Economic Value Added) Pada Perusahaan Konstruksi yang Terdaftar di Bursa Efek Indonesia. Zenodo (CERN European Organization for Nuclear Research). [CrossRef]
- Superintendencia del Mercado de Valores (2023). Estados financieros. Available online: https://www.smv.gob.pe/SMV/ (accessed on 12 July 2025).
- Tripathi, P. M., Chotia, V., Solanki, U., Meena, R., & Khandelwal, V. (2022). Economic value added research: Mapping thematic structure and research trends. Risks, 11(1), 9. [CrossRef]
- Tudose, M. B., Rusu, V. D., & Avasilcăi, S. (2021). Performance Management for Growth: a framework based on EVA. Journal of Risk and Financial management, 14(3), 102. [CrossRef]
- Tudose, M. B., Rusu, V. D., & Avasilcăi, S. (2022). financial performance – determinants and interdependencies between measurement indicators. Business. Management and Economics Engineering, 20(01), 119-138. [CrossRef]
- Williamson, O. (1996). The mechanisms of governance. Oxford: Oxford University Press.
- Yupanqui-Castillo, A. L., Werner-Masters, K., & Cordova-Buiza, F. (2024). Corporate tax collection in times of Covid-19 pandemic: an analysis of Peruvian economy. Public and Municipal Finance, 13(2), 98-109. [CrossRef]
- Zenzerović, R., & Benazić, M. (2024). The impact of selected financial ratios on economic value added: evidence from Croatia. Journal of Risk and Financial Management, 17(8), 338. [CrossRef]
- Zhang, R., Wang, J., & Kang, H. (2024). Effect of waste cooking oil on the performance of EVA modified asphalt and its mechanism analysis. Scientific Reports, 14(1). [CrossRef]
Figure 1.
Average quarterly Weighted Average Cost of Capital (WACC) of the selected industrial companies.
Figure 1.
Average quarterly Weighted Average Cost of Capital (WACC) of the selected industrial companies.
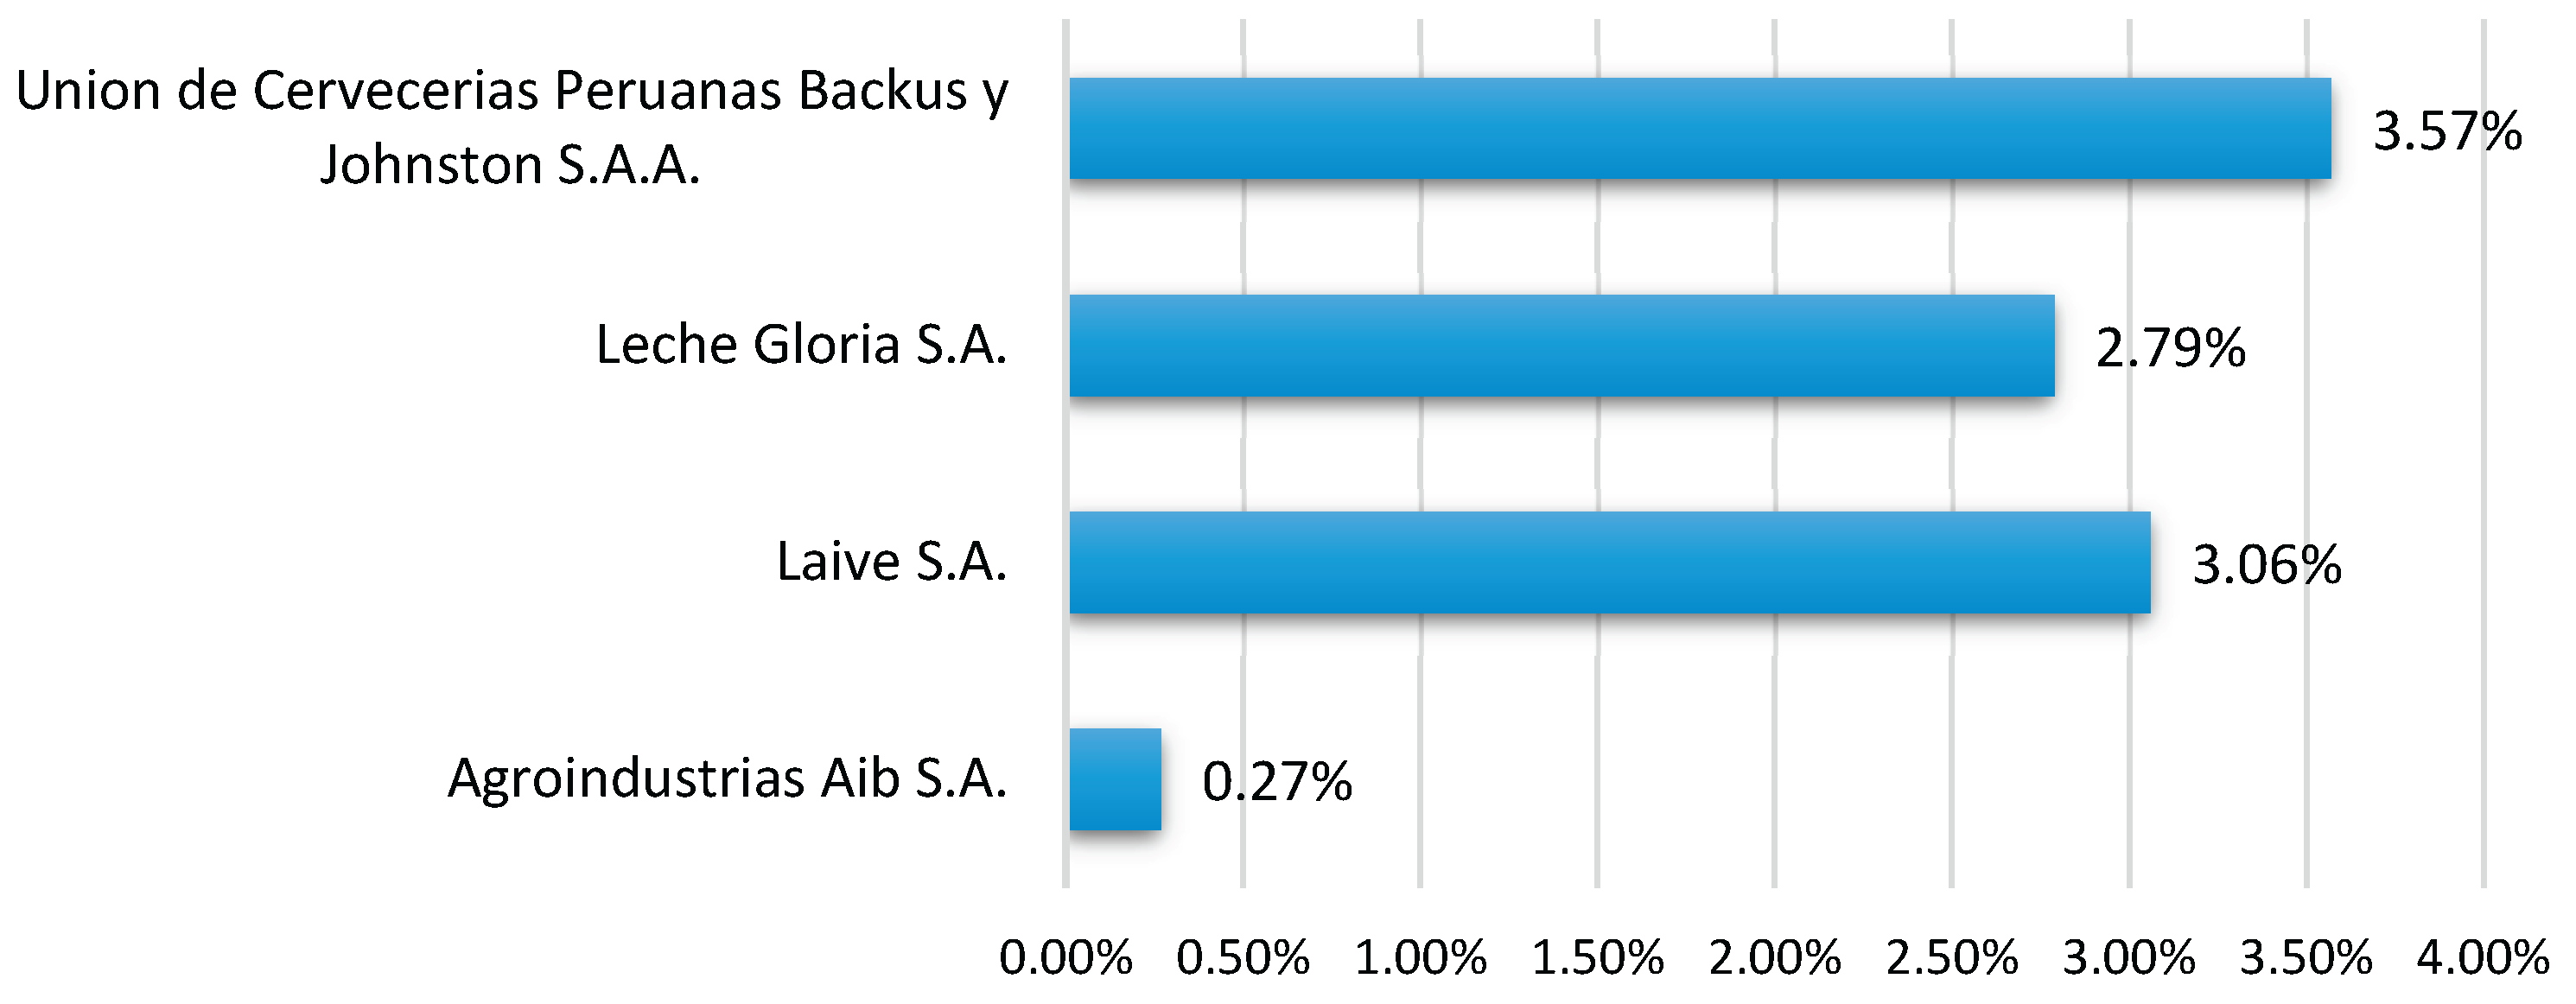
Figure 2.
Quarterly averages of Return on Equity (ROE) and its DuPont components for the selected companies.
Figure 2.
Quarterly averages of Return on Equity (ROE) and its DuPont components for the selected companies.
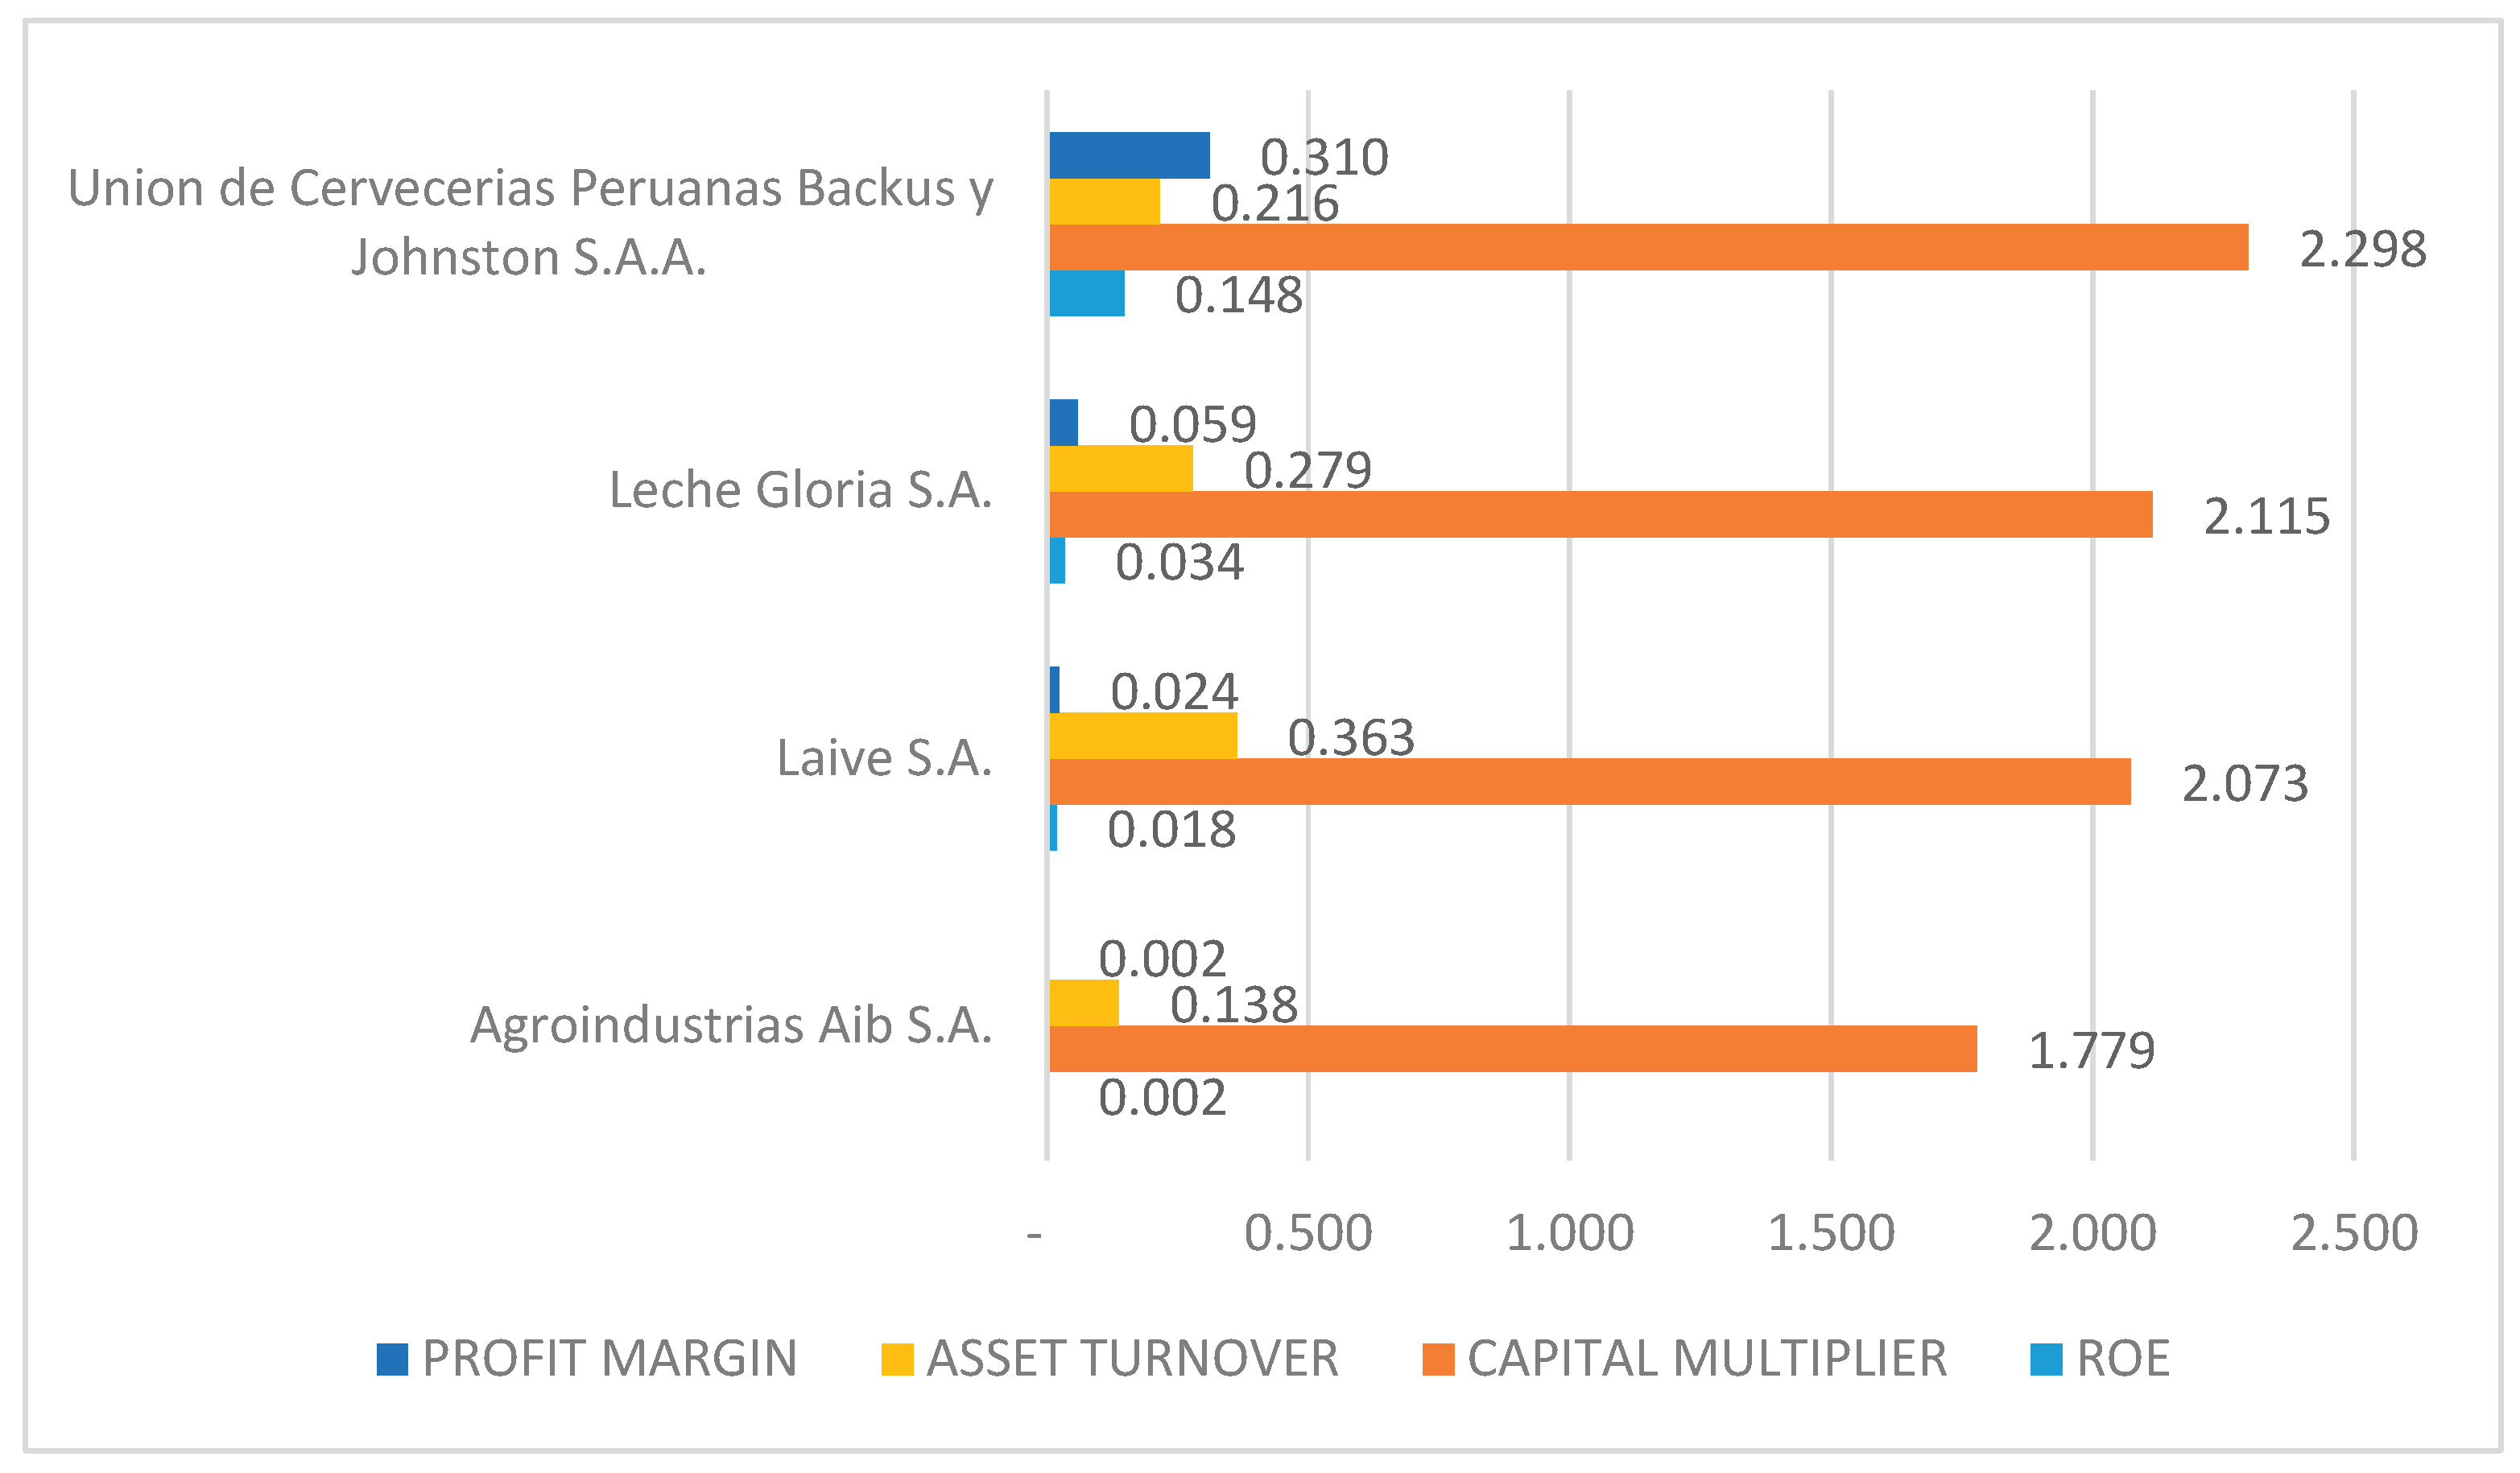
Figure 3.
Average Economic Value Added (EVA) of the selected industrial companies.
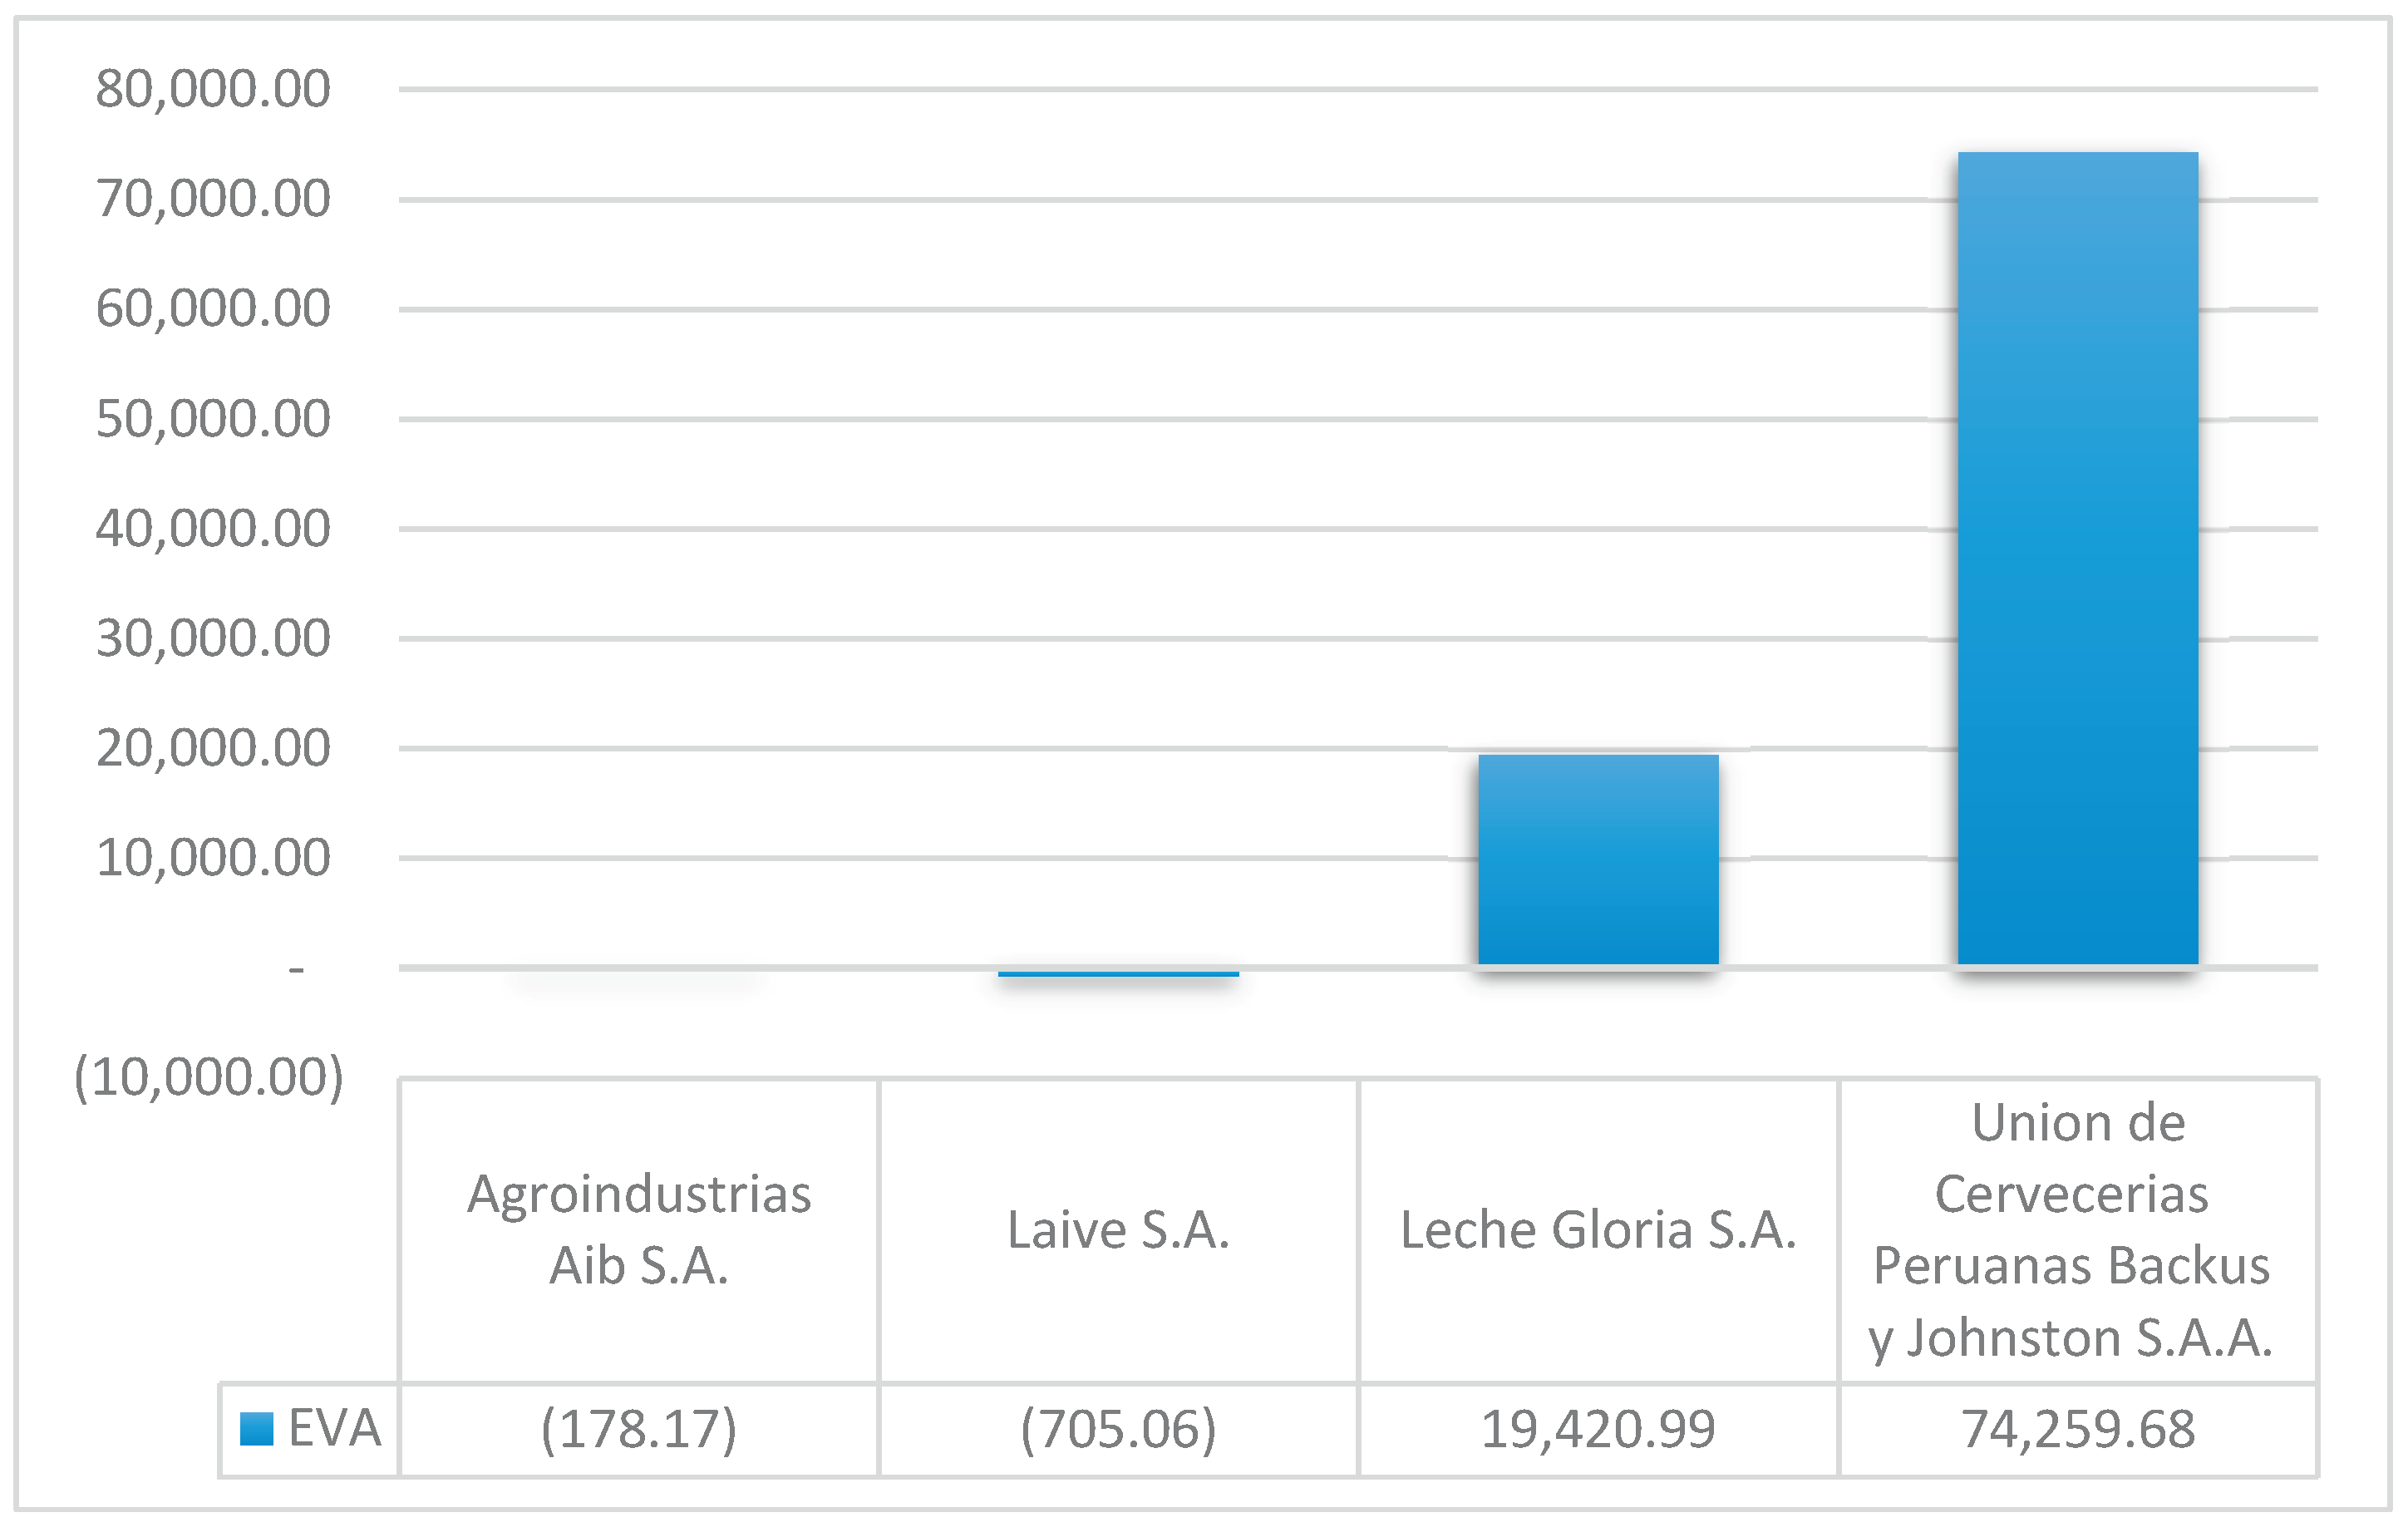
Figure 4.
Regression and correlation between WACC, ROE, and EVA in the selected companies.
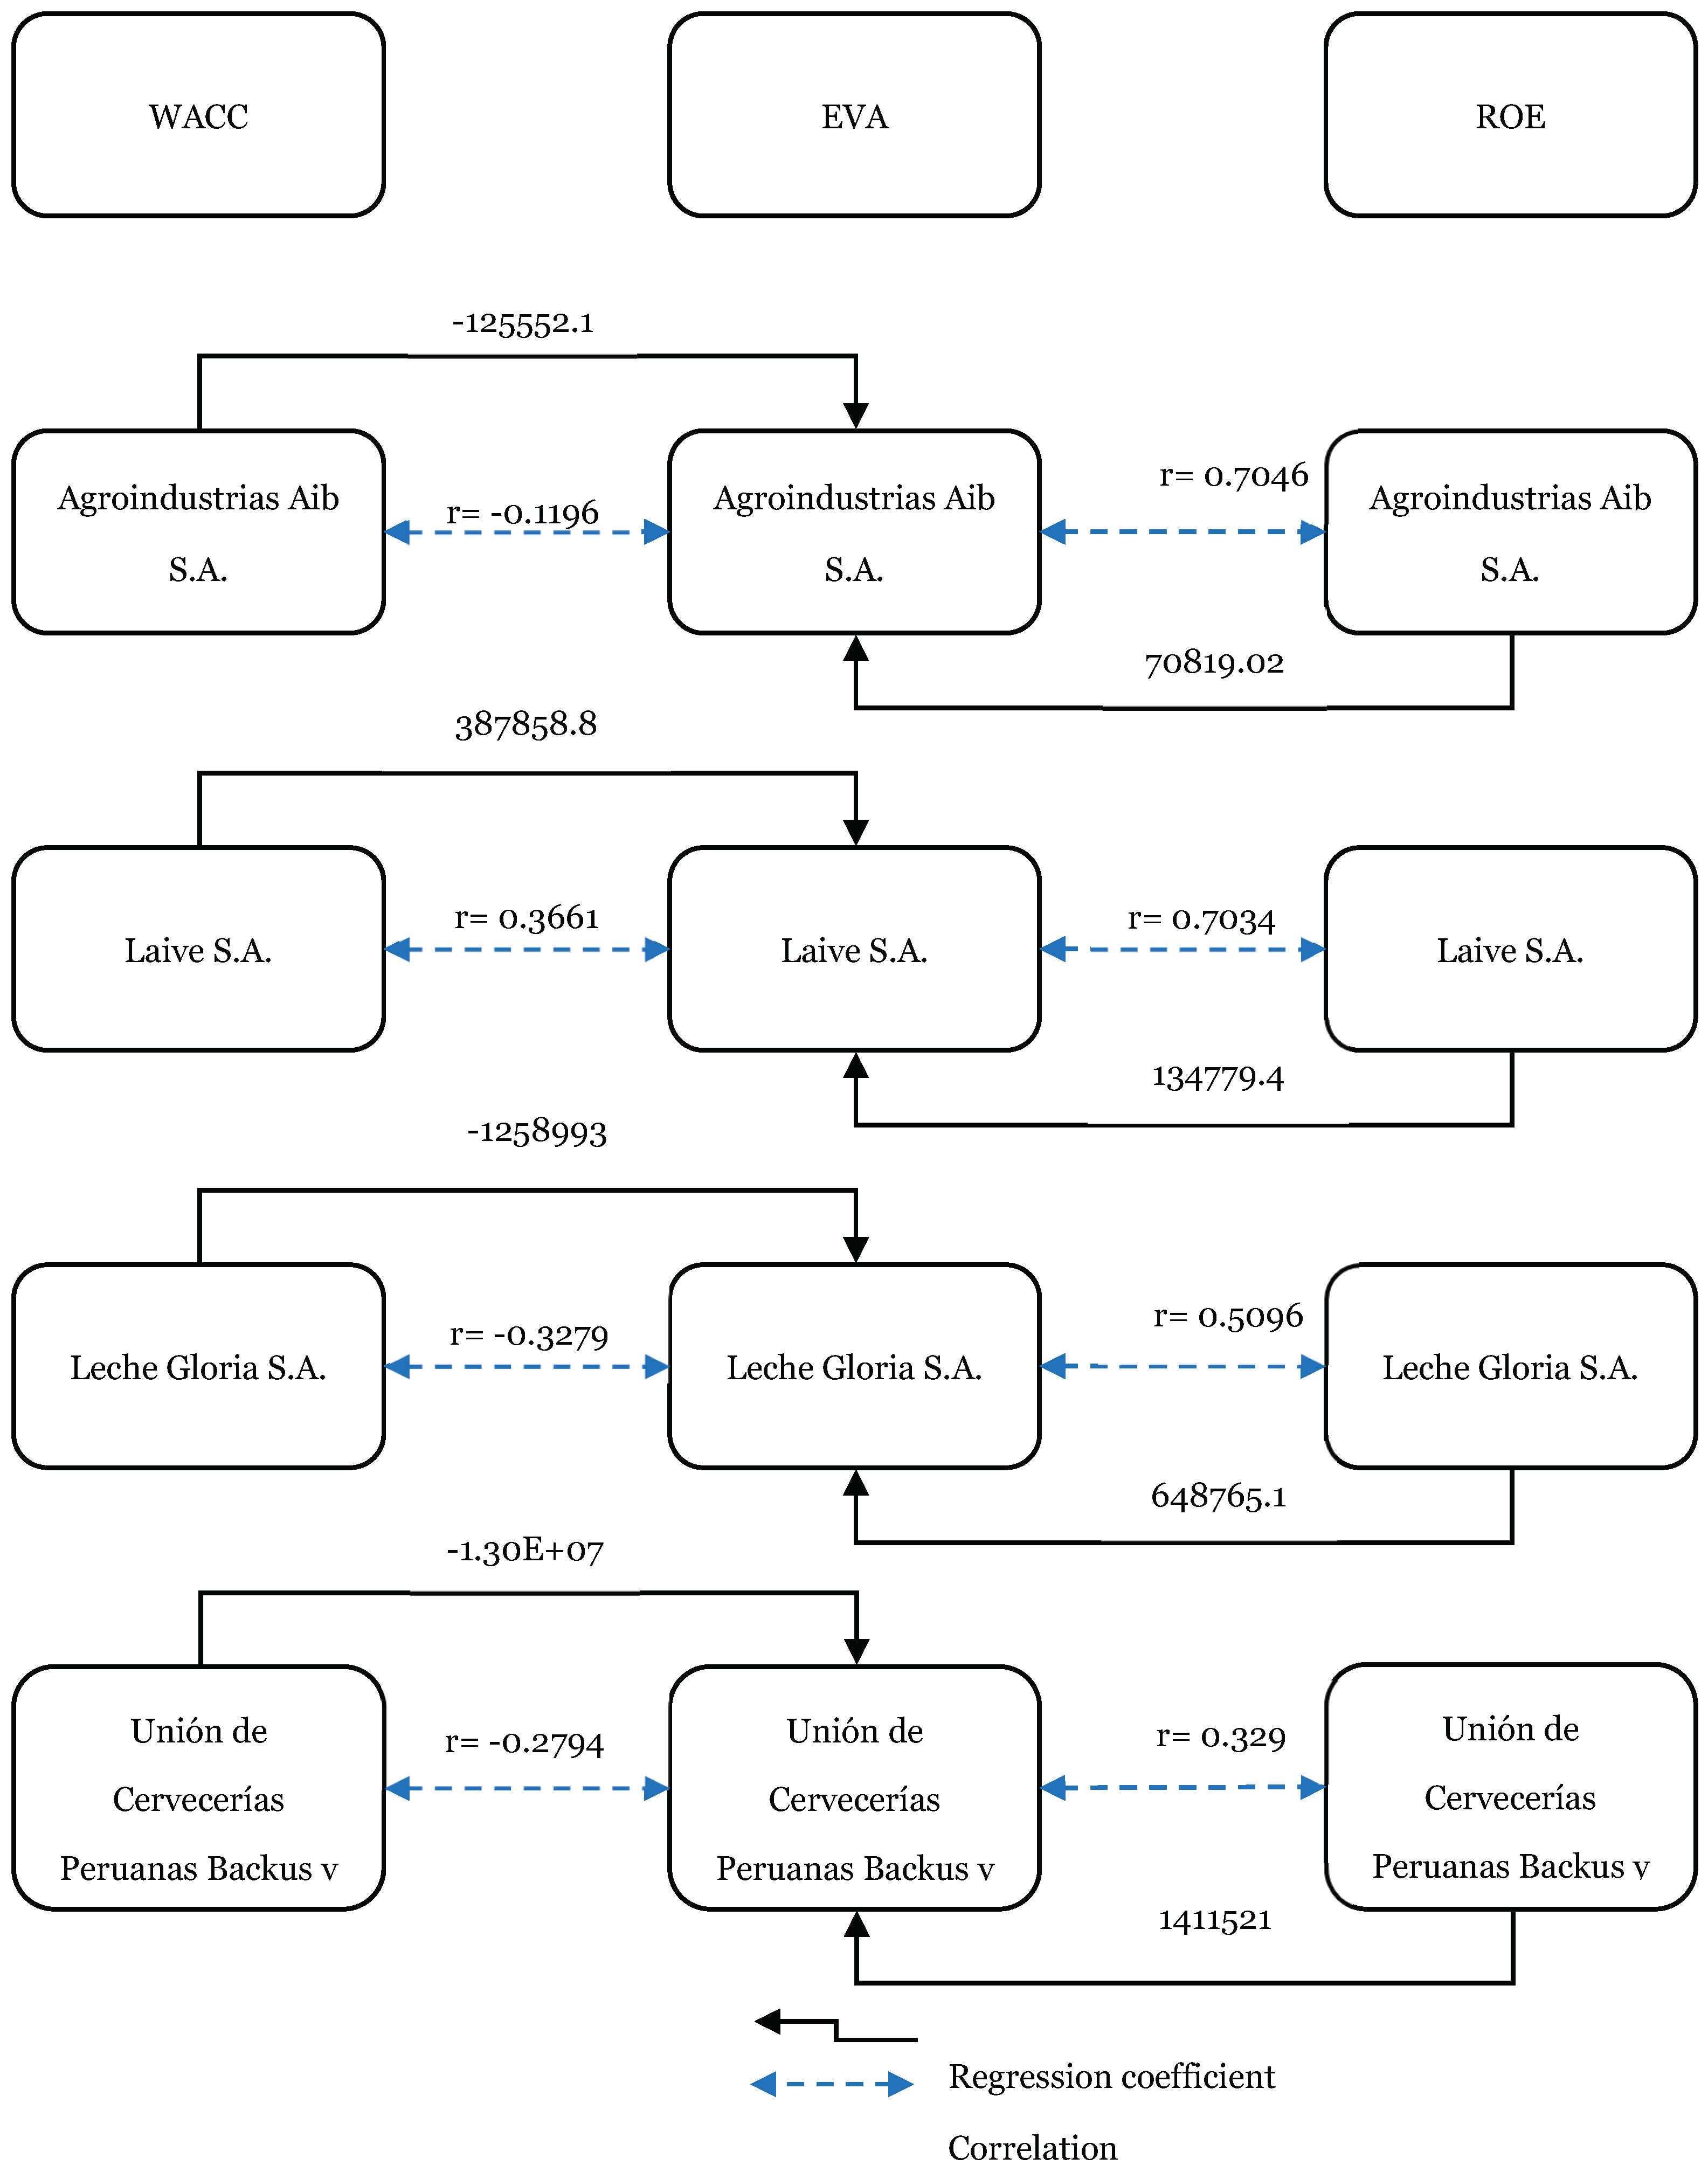

Table 1.
Components of Economic Value Added (EVA): ROIC, WACC, and invested capital.
| Agroindustrias Aib S.A. | Laive S.A. | Leche Gloria S.A. | Unión de Cervecerías Peruanas Backus y Johnston S.A.A. | |
|---|---|---|---|---|
| ROIC | 0.47% | 2.69% | 4.10% | 6.18% |
| WACC | 0.27% | 3.06% | 2.79% | 3.57% |
| INVESTED CAPITAL | -87,130.53 | 190,467.98 | 1,484,214.35 | 2,839,875.45 |
Source: Own elaboration with data obtained from the Superintendencia del Mercado de Valores (SMV, 2023), the Lima Stock Exchange (BVL, 2023) and Damodaran (2023).
Table 2.
Correlation coefficients between Economic Value Added (EVA) and Weighted Average Cost of Capital (WACC).
Table 2.
Correlation coefficients between Economic Value Added (EVA) and Weighted Average Cost of Capital (WACC).
| Company | Correlation EVA/WACC | P-value |
|---|---|---|
| Agroindustrias Aib S.A. | -0.1196 | 0.4623 |
| Laive S.A. | 0.3661 | 0.0202 |
| Leche Gloria S.A. | -0.3279 | 0.0389 |
| Unión de Cervecerías Peruanas Backus y Johnston S.A.A. | -0.2794 | 0.0809 |
Source: Own elaboration with data obtained from the Superintendencia del Mercado de Valores (SMV, 2023), the Lima Stock Exchange (BVL, 2023) and Damodaran (2023).
Table 3.
Correlation coefficients between Economic Value Added (EVA) and Return on Equity (ROE).
| Company | Correlation EVA/ROE | P-value |
|---|---|---|
| Agroindustrias Aib S.A. | 0.7046 | 0.000 |
| Laive S.A. | 0.7034 | 0.000 |
| Leche Gloria S.A. | 0.5096 | 0.001 |
| Unión de Cervecerías Peruanas Backus y Johnston S.A.A. | 0.329 | 0.038 |
Source: Own elaboration with data obtained from the Superintendencia del Mercado de Valores (SMV, 2023), the Lima Stock Exchange (BVL, 2023) and Damodaran (2023).
Table 4.
Linear regression results of Economic Value Added (EVA) on Weighted Average Cost of Capital (WACC).
Table 4.
Linear regression results of Economic Value Added (EVA) on Weighted Average Cost of Capital (WACC).
| Ítem | Agroindustrias Aib S.A. | Laive S.A. | Leche Gloria S.A. | Unión de Cervecerías Peruanas Backus y Johnston S.A.A. |
|---|---|---|---|---|
| Coefficient of | -125552.1 | 387858.8 | -1258993 | -1.30E+07 |
| P>|t| | 0.349 | 0.031 | 0.162 | 0.010 |
| R squared | 0.0143 | 0.134 | 0.1075 | 0.078 |
Souce: Own elaboration with data obtained from the Superintendencia del Mercado de Valores (SMV, 2023), the Lima Stock Exchange (BVL, 2023) and Damodaran (2023).
Table 5.
Linear regression results of Economic Value Added (EVA) on Return on Equity (ROE).
| Item | Agroindustrias Aib S.A. | Laive S.A. | Leche Gloria S.A. | Unión de Cervecerías Peruanas Backus y Johnston S.A.A. |
|---|---|---|---|---|
| Coefficient of | 70819.02 | 134779.4 | 648765.1 | 1411521 |
| P>|t| | 0.000 | 0.001 | 0.000 | 0.008 |
| R squared | 0.4965 | 0.4947 | 0.2597 | 0.1085 |
Source: Own elaboration with data obtained from the Superintendencia del Mercado de Valores (SMV, 2023), the Lima Stock Exchange (BVL, 2023) and Damodaran (2023).
Table 6.
Multiple regression results of Economic Value Added (EVA) on Weighted Average Cost of Capital (WACC) and Return on Equity (ROE).
Table 6.
Multiple regression results of Economic Value Added (EVA) on Weighted Average Cost of Capital (WACC) and Return on Equity (ROE).
| Agroindustrias Aib S.A. | Laive S.A. | Leche Gloria S.A. | Unión de Cervecerías Peruanas Backus y Johnston S.A.A. | |||||
|---|---|---|---|---|---|---|---|---|
| Coef | P | Coef | P | Coef | P | Coef | P | |
| WACC | -91442.25 | 0.373 | 117882.8 | 0.408 | -1565041 | 0.013 | -9207844 | 0.015 |
| ROE | 70412.94 | 0.000 | 126554.2 | 0.002 | 721722.4 | 0.000 | 1154318 | 0.041 |
| _cons | 1782.572 | 0.000 | -6762.19 | 0.114 | 38539.03 | 0.024 | 151981 | 0.441 |
| R square | 0.504 | 0.5052 | 0.4225 | 0.1439 | ||||
Source: Prepared by the authors with data obtained from the Superintendencia del Mercado de Valores (SMV, 2023), the Lima Stock Exchange (BVL, 2023) and Damodaran (2023).
Disclaimer/Publisher’s Note: The statements, opinions and data contained in all publications are solely those of the individual author(s) and contributor(s) and not of MDPI and/or the editor(s). MDPI and/or the editor(s) disclaim responsibility for any injury to people or property resulting from any ideas, methods, instructions or products referred to in the content. |
© 2025 by the authors. Licensee MDPI, Basel, Switzerland. This article is an open access article distributed under the terms and conditions of the Creative Commons Attribution (CC BY) license (http://creativecommons.org/licenses/by/4.0/).
Copyright: This open access article is published under a Creative Commons CC BY 4.0 license, which permit the free download, distribution, and reuse, provided that the author and preprint are cited in any reuse.


