
Submitted:
20 August 2025
Posted:
20 August 2025
You are already at the latest version
Abstract
Background: Traumatic brain injury (TBI) is a major public health concern. Hypomagnesemia in the brain following TBI has been shown to contribute to secondary injury via several mechanisms. We aimed to longitudinally evaluate the effect of magnesium on various clinical outcomes in patients with severe TBI. Methods: We conducted a retrospective review at a level 1 Trauma Center, investigating the relationship between magnesium levels at five clinical timepoints (Hospital Admission, ICU Admission, ICU Discharge, Hospital Discharge, and Patient Death) and a range of clinical variables (Hospital Length of Stay, ED Length of Stay, ICU Length of Stay, Vent Days) and injury severity scores (Abbreviated Injury Scale, Injury Severity Score, and Glasgow Coma Scale). Results: 826 patients were included in our study (25.1% female). Significant associations were noted at the Patient Death (PD) timepoint for Hospital LOS (p=0.000, DF=3), ED LOS (p=0.000, DF=3), and vent days (p=0.000, DF=3). All three injury severity scores were also significantly associated with magnesium levels at the PD timepoint (p=0.000, DF=3). Conclusion: We found significant associations between magnesium level and hospital length of stay, ED length of stay, number of days on mechanical ventilation, and injury severity scores at the Patient Death timepoint. No other significant associations were noted. This agrees with existing literature, though there is a relative dearth of research assessing the relationship of magnesium levels to these clinical outcomes.
Keywords:
Magnesium levels
; Traumatic Brain Injury
; Length of Stay
; Vent Days
; Injury Severity
; Mortality
Introduction
Magnesium is a Group 2 alkaline earth metal within the periodic table. In the human body, it is primarily found in its ionized state as Mg2+ and is bound to proteins and negatively charged molecules such as ATP [1]. Mg2+ is the second most abundant intracellular cation. However, since most of the intracellular Mg2+ is bound, the concentration of freely available Mg2+ is quite low [2]. ATP is considered in its active state when forming the ATP-Mg complex [1]. Magnesium is also responsible for acting as a co-enzyme in over 600 enzymatic reactions within the body. It plays an important role in the DNA repair pathway, glycolysis, as well as acting as a powerful Ca2+ antagonist [2]. Bone and liver are the major stores of Mg2+ within the body. In healthy individuals, about 30%–50% of ingested Mg2+ is absorbed in the intestines, and up to 80% in those with Mg2+ deficiency. Human kidneys filter approximately 2400mg of Mg2+ daily, of which about 95% is reabsorbed along the nephron [1].
In the brain, Mg2+ plays an important role in the regulation of N-methyl-d-aspartate (NMDA) receptor excitability by acting as an inhibitor. These receptors are essential for excitatory synaptic transmission, neuronal plasticity, and excitotoxicity. Mg2+ also regulates γ-aminobutyric acid (GABA) receptors. In states of hypomagnesemia, GABAA receptors are less stimulated. This in turn relieves the Mg2+ block of the NMDA receptor and contributes to neuronal hyperexcitability. Mg2+ also acts as an inhibitor of glutamate, an excitatory neurotransmitter in the CNS, potentially by the inhibition of voltage-gated Ca2+ channels. This further leads to neuronal excitability as well as neuroinflammation [2].
Normal serum magnesium levels typically range from 0.75 to 0.95 mmol/L while CSF magnesium levels range between 0.77 and 1.17 mmol/L. Decreased CSF magnesium levels correspond with reduced concentrations of extracellular brain magnesium and have been associated with epilepsy [3]. Animal model studies have suggested that magnesium deficiency may also trigger greater recruitment of phagocytic cells which leads to generation of reactive oxygen species. Chronic neuroinflammation results in neuronal damage, disrupted synaptic functionality, and cognitive impairment. When this inflammatory response is sustained, it results in the overproduction of proinflammatory cytokines. Prolonged inflammation also triggers oxidative stress, which leads to neurotoxicity and cellular damage and contributes to cognitive decline following traumatic brain injury (TBI) [3-6].
Decreased free Mg2+ in the brain following traumatic injury has been found to contribute to secondary injury via release of excitatory amino acids (e.g. glutamate), alterations in Ca2+ flux, edema formation, and impairment of glucose utilization and energy metabolism [7]. Low admission serum Mg2+ and paradoxically high CSF Mg2+ following TBI portend poor prognosis [8]. Studies assessing the use of magnesium as a therapy following TBI yield mixed results [9-11]. A 2008 analysis of four randomized control trials assessing the use of magnesium salt to treat patients following acute TBI concluded that there is currently no evidence to support the use of magnesium salts in patients with acute traumatic brain injury [9]. A 2016 animal study concluded that polyethylene glycol facilitates central penetration of Mg 2+ following TBI in rats, reducing the concentration of Mg2+ required to confer neuroprotection [10]. Another 2015 systemic review of 8 randomized control trials analyzing the use of magnesium sulfate in the treatment of TBI concluded that there is no significant beneficial effect in the mortality of TBI patients but magnesium sulfate shows a tendency to improve the Glasgow Outcome Scale and Glasgow Coma Scale scores [11]. Thus, magnesium may be neuroprotective in precilinical TBI, but routine therapeutic magnesium administration to improve outcomes in acute TBI is not strongly supported.
TBI is an injury to the brain that results from an external mechanical force, impact, rapid acceleration-deceleration, or penetrating injury to the head. Mild TBI, or concussion, is clinically defined as a loss of consciousness lasting less than 30 minutes, post-traumatic amnesia lasting under 24 hours, or any alteration of consciousness. It also corresponds with a Glasgow Coma Scale (GCS) of 13-15. Moderate or severe TBI is clinically defined as a loss of consciousness lasting 30 minutes or more to prolonged coma, post-traumatic amnesia lasting 24 hours up to permanently, or a GCS ≤8 [12]. As of 2021, the global incidence of TBI is estimated to be at approximately 20.8 million new cases per year [13,14]. Falls are the leading cause of TBI globally, and males have a higher incidence than females, particularly older adults [15]. As severe TBI can have a mortality rate of approximately 25-30% [16] and complications can vary from acute (e.g. neuroinflammation) to chronic (e.g. dementia), TBI is a major public health concern [12,16].
Current literature assessing magnesium levels following severe TBI usually involves smaller patient sample sizes with poor control of confounding factors such as age or injury mechanism [17]. Timing of measurement also varies, with few studies examining longitudinal changes in magnesium as patients move through the hospital system [18]. The primary aim of this study was to evaluate how Mg2+ levels are associated with severity (GCS, ISS, AIS), length of stay (ED, Hospital, ICU), ventilator days, and mortality in patients with severe TBI at different time points. Our secondary aim was to study the relationship between Mg2+ levels and the demographics of patients with severe TBI, hopefully addressing potential confounders in determining clinical outcomes.
Methods
We performed a single-center, retrospective review at Elmhurst Hospital Center, a Level 1 trauma center verified by the American College of Surgeons (ACS) in Queens, New York City. Patient data were obtained from the National Trauma Registry of the ACS (NTRACS) database for our center. All patients presenting to the hospital between January 1, 2020 and December 31, 2023 with severe TBI, which was defined as a Glasgow Coma Scale (GCS) score of 8 or less after resuscitation but prior to sedation and a head Abbreviated Injury Severity (AIS) score of 3 or higher, were included in our analysis.
For each patient, demographic data (age, sex, race, ethnicity), trauma severity scores (AIS-head, Injury Severity Score (ISS), and GCS), trauma type (blunt vs. penetrating injury) and vitals were collected. Clinical outcomes, including emergency department length of stay (ED LOS, hours), intensive care unit length of stay (ICU LOS, days), hospital length of stay (Hospital LOS, days), duration of mechanical ventilation (days), and in-hospital mortality, were collected, as well as total magnesium levels. Magnesium levels were then further classified as Extreme Hypomagnesemia (<1mg/dL), Hypomagnesemia (1-1.6 mg/dL), Normomagnesemia (1.7-2.2 mg/dL), Hypermagnesemia (2.3-4.9mg/dL), and Extreme Hypermagnesemia (>4.9mg/dL) [19-25].
Total magnesium levels were collected at five key time points: hospital admission (HA), ICU admission (RL1) , ICU discharge (RL2) , hospital discharge (HD), and patient death (PD), if applicable. Definitions were as follows:
- Hospital admission (HA): first measured magnesium level after admission to the trauma bay.
- ICU admission (RL1): first measured magnesium level after admission to the ICU.
- ICU discharge (RL2): last measured magnesium level before transfer to a step-down or floor unit.
- Hospital discharge (HD): last measured magnesium level prior to discharge.
- Patient death (PD): last measured magnesium level prior to death.
In cases of missing magnesium data, values were occasionally imputed using the most recent magnesium measurement from the preceding time point.
Pearson Chi-square tests were conducted to test the association between categorical variables. The Kruskal–Wallis test was used to test if various scores and lengths of stays differed between Mg2+ levels at different points of stay. The analyses were conducted in IBM SPSS Version 31.0.0.0. A significance level of 0.05 was used for all analyses.
Results
This study consisted of a cohort of 826 patients (Table 1; 25.1% female). Most patients were identified as “other” race (N=468, 56.7%), non-Hispanic origin (N=409, 49.5%), and age 24-64 years (N=490, 59.3%). Magnesium levels were collected at five time points (HA, RL1, RL2, HD, and PD) and further subdivided into Extreme Hypomagnesemia, Hypomagnesemia, Normomagnesemia, Hypermagnesemia, and Extreme Hypermagnesemia categories (Table 2).

Table 1.
Demographics.
| Sex | N (%) |
|---|---|
| Female | 207 (25.1%) |
| Male | 619 (74.9%) |
| Race | |
| Asian | 122 (14.8%) |
| Black | 69 (8.4%) |
| Native Hawaiian or Other Pacific Islander | 3 (0.4%) |
| Other | 468 (56.7%) |
| Unknown | 21 (2.5%) |
| White | 142 (17.2%) |
| Ethnicity | |
| Hispanic Origin | 371 (44.9%) |
| Non-Hispanic Origin | 409 (49.5%) |
| Unknown | 45 (5.4%) |
| Age Group | |
| 0 < age < 15 | 17 (2.1%) |
| 15 ≤ age < 24 | 55 (6.7%) |
| 24 ≤ age ≤ 64 | 490 (59.3%) |
| age ≥ 65 | 264 (32%) |
| Trauma Type | |
| Blunt | 808 (97.8%) |
| Penetrating | 18 (2.2%) |
| Mortality | |
| Non-survival | 119 (14.4%) |
| Survival | 705 (85.4%) |
Table 1: Demographics characteristics of the 826 patients included in analysis. The cohort was predominantly male (N=619), identified as “other” race (N=468), non-Hispanic (N=409), sustained blunt injuries (N=808), and survived (N=705).
Table 2.
Magnesium Levels at Different Timepoints.
| HA (mg/dL) | N (%) |
|---|---|
| (blank) | 383 (46.4%) |
| Extreme hypo: <1 | 2 (0.2%) |
| Hypo: 1-1.6 | 59 (7.1%) |
| Normal: 1.7-2.2 | 322 (39%) |
| Hyper: 2.3-4.9 | 60 (7.3%) |
| RL1 (mg/dL) | |
| (blank) | 216 (26.2%) |
| Extreme hypo: <1 | 1 (0.1%) |
| Hypo: 1-1.6 | 96 (11.6%) |
| Normal: 1.7-2.2 | 410 (49.6%) |
| Hyper: 2.3-4.9 | 103 (12.5%) |
| RL2 (mg/dL) | |
| (blank) | 304 (36.8%) |
| Hypo: 1-1.6 | 29 (3.5%) |
| Normal: 1.7-2.2 | 370 (44.8%) |
| Hyper: 2.3-4.9 | 123 (14.9%) |
| HD (mg/dL) | |
| (blank) | 106 (12.8%) |
| Hypo: 1-1.6 | 43 (5.2%) |
| Normal: 1.7-2.2 | 519 (62.8%) |
| Hyper: 2.3-4.9 | 158 (19.1%) |
| PD (mg/dL) | |
| (blank) | 707 (85.6%) |
| Hypo: 1-1.6 | 5 (0.6%) |
| Normal: 1.7-2.2 | 88 (10.7%) |
| Hyper: 2.3-4.9 | 26 (3.1%) |
Table 2: Magnesium levels at five timepoints (Hospital Admission, ICU Admission, ICU Discharge, Hospital Discharge, and Patient Death). Magnesium levels were categorized into Extreme Hypomagnesemia (<1mg/dL), Hypomagnesemia (1-1.6 mg/dL), Normomagnesemia (1.7-2.2 mg/dL), Hypermagnesemia (2.3-4.9mg/dL), and Extreme Hypermagnesemia (>4.9mg/dL). Rows marked “(blank)” signify missing data. Abbreviations: HA = Hospital Admission; RL1 = ICU Admission; RL2 = ICU Discharge; HD = Hospital Discharge; PD = Patient Death.
Each magnesium category was compared to Hospital LOS (Table 3), ED LOS (Table 4), ICU LOS (Table 5), and days on mechanical ventilation (Table 6) at each timepoints of interest. Significant associations were noted at the Patient Death timepoint for Hospital LOS (Table 3; p=0.000, DF=3), ED LOS (Table 4; p=0.000, DF=3), and vent days (Table 5; p=0.000, DF=3).
Table 3.
Comparison of Hospital LOS to Magnesium Levels at Different Timepoints.
| Magnesium Category | N | Mean | Median | SD | P-value | DF |
|---|---|---|---|---|---|---|
| HA | ||||||
| (blank) | 383 | 13.16 | 5.00 | 26.669 | ||
| Extreme hypo: <1 | 2 | 10.50 | 10.50 | 7.778 | ||
| Hypo: 1-1.6 | 59 | 14.97 | 5.00 | 28.031 |
0.653 |
4 |
| Normal: 1.7-2.2 | 321 | 10.07 | 4.00 | 15.716 | ||
| Hyper: 2.3-4.9 | 59 | 10.46 | 6.00 | 20.757 | ||
| Total | 824 | 11.89 | 5.00 | 22.690 | ||
| RL1 | ||||||
| (blank) | 215 | 11.20 | 5.00 | 19.410 | ||
| Extreme hypo: <1 | 1 | 7.00 | 7.00 | |||
| Hypo: 1-1.6 | 96 | 12.73 | 6.00 | 21.999 |
0.392 |
4 |
| Normal: 1.7-2.2 | 410 | 12.27 | 4.00 | 25.949 | ||
| Hyper: 2.3-4.9 | 102 | 11.07 | 6.00 | 14.551 | ||
| Total | 824 | 11.89 | 5.00 | 22.690 | ||
| RL2 | ||||||
| (blank) | 303 | 12.32 | 5.00 | 23.855 | ||
| Hypo: 1-1.6 | 29 | 11.76 | 6.00 | 20.012 | ||
| Normal: 1.7-2.2 | 369 | 12.07 | 5.00 | 23.311 |
0.494 |
3 |
| Hyper: 2.3-4.9 | 123 | 10.31 | 4.00 | 18.173 | ||
| Total | 824 | 11.89 | 5.00 | 22.690 | ||
| HD | ||||||
| (blank) | 105 | 14.68 | 6.00 | 24.984 | ||
| Hypo: 1-1.6 | 43 | 12.58 | 6.00 | 19.529 | ||
| Normal: 1.7-2.2 | 518 | 11.26 | 5.00 | 20.438 |
0.375 |
3 |
| Hyper: 2.3-4.9 | 158 | 11.89 | 4.00 | 28.304 | ||
| Total | 824 | 11.89 | 5.00 | 22.690 | ||
| PD | ||||||
| (blank) | 706 | 12.30 | 5.00 | 23.037 | ||
| Hypo: 1-1.6 | 5 | 27.20 | 9.00 | 45.653 | ||
| Normal: 1.7-2.2 | 87 | 9.90 | 1.00 | 20.714 |
0.000 |
3 |
| Hyper: 2.3-4.9 | 26 | 4.31 | 1.00 | 6.967 | ||
| Total | 824 | 11.89 | 5.00 | 22.690 | ||
Table 3: Hospital LOS at five timepoints (Hospital Admission, ICU Admission, ICU Discharge, Hospital Discharge, and Patient Death) compared to average magnesium levels. Magnesium levels were categorized into Extreme Hypomagnesemia (<1mg/dL), Hypomagnesemia (1-1.6 mg/dL), Normomagnesemia (1.7-2.2 mg/dL), Hypermagnesemia (2.3-4.9mg/dL), and Extreme Hypermagnesemia (>4.9mg/dL). Rows marked “(blank)” signify missing data. Significance was noted at the Patient Death timepoint only. Abbreviations: HA = Hospital Admission; RL1 = ICU Admission; RL2 = ICU Discharge; HD = Hospital Discharge; PD = Patient Death; SD = Standard Deviation; DF = Degrees of Freedom.
Table 4.
Comparison of ED LOS to Magnesium Levels at Different Timepoints.
| Magnesium Category | N | Mean | Median | SD | P-value | DF |
|---|---|---|---|---|---|---|
| HA | ||||||
| (blank) | 383 | 11.81 | 9.23 | 10.59 | ||
| Extreme hypo: <1 | 2 | 14.72 | 14.72 | 3.82 | ||
| Hypo: 1-1.6 | 59 | 12.66 | 8.65 | 14.76 |
0.274 |
4 |
| Normal: 1.7-2.2 | 322 | 12.87 | 9.75 | 11.89 | ||
| Hyper: 2.3-4.9 | 57 | 9.43 | 7.95 | 7.45 | ||
| Total | 823 | 12.13 | 9.23 | 11.28 | ||
| RL1 | ||||||
| (blank) | 214 | 13.09 | 9.43 | 13.63 | ||
| Extreme hypo: <1 | 1 | 14.17 | 14.17 | |||
| Hypo: 1-1.6 | 96 | 12.00 | 9.29 | 10.89 |
0.580 |
4 |
| Normal: 1.7-2.2 | 409 | 11.52 | 9.02 | 10.27 | ||
| Hyper: 2.3-4.9 | 103 | 12.62 | 9.70 | 10.09 | ||
| Total | 823 | 12.13 | 9.23 | 11.28 | ||
| RL2 | ||||||
| (blank) | 302 | 12.35 | 9.01 | 12.72 | ||
| Hypo: 1-1.6 | 29 | 12.31 | 7.95 | 12.02 | ||
| Normal: 1.7-2.2 | 370 | 11.59 | 9.21 | 9.92 |
0.603 |
3 |
| Hyper: 2.3-4.9 | 122 | 13.17 | 10.47 | 11.27 | ||
| Total | 823 | 12.13 | 9.23 | 11.28 | ||
| HD | ||||||
| (blank) | 104 | 10.89 | 8.47 | 9.52 | ||
| Hypo: 1-1.6 | 43 | 12.04 | 9.45 | 9.42 | ||
| Normal: 1.7-2.2 | 519 | 12.52 | 9.65 | 11.95 |
0.614 |
3 |
| Hyper: 2.3-4.9 | 157 | 11.67 | 9.02 | 10.52 | ||
| Total | 823 | 12.13 | 9.23 | 11.28 | ||
| PD | ||||||
| (blank) | 707 | 3.52 | 1.10 | 7.26 | ||
| Hypo: 1-1.6 | 5 | 8.08 | 8.90 | 8.19 | ||
| Normal: 1.7-2.2 | 88 | 4.69 | 0.79 | 8.41 |
0.000 |
3 |
| Hyper: 2.3-4.9 | 26 | 2.85 | 0.12 | 5.08 | ||
| Total | 826 | 3.65 | 1.03 | 7.34 | ||
Table 4: ED LOS at five timepoints (Hospital Admission, ICU Admission, ICU Discharge, Hospital Discharge, and Patient Death) compared to average magnesium levels. Magnesium levels were categorized into Extreme Hypomagnesemia (<1mg/dL), Hypomagnesemia (1-1.6 mg/dL), Normomagnesemia (1.7-2.2 mg/dL), Hypermagnesemia (2.3-4.9mg/dL), and Extreme Hypermagnesemia (>4.9mg/dL). Rows marked “(blank)” signify missing data. Significance was noted at the Patient Death timepoint only. Abbreviations: HA = Hospital Admission; RL1 = ICU Admission; RL2 = ICU Discharge; HD = Hospital Discharge; PD = Patient Death; SD = Standard Deviation; DF = Degrees of Freedom.
Table 5.
Comparison of ICU LOS to Magnesium Levels at Different Timepoints.
| Magnesium Category | N | Mean | Median | SD | P-value | DF |
| HA | ||||||
| (blank) | 383 | 3.85 | 1.04 | 7.66 |
0.468 |
4 |
| Extreme hypo: <1 | 2 | 3.88 | 3.88 | 1.32 | ||
| Hypo: 1-1.6 | 59 | 4.49 | 1.81 | 7.26 | ||
| Normal: 1.7-2.2 | 322 | 3.22 | 0.91 | 6.10 | ||
| Hyper: 2.3-4.9 | 60 | 3.89 | 1.57 | 10.84 | ||
| Total | 826 | 3.65 | 1.03 | 7.34 | ||
| RL1 | ||||||
| (blank) | 216 | 3.24 | 0.82 | 6.35 |
0.423 |
4 |
| Extreme hypo: <1 | 1 | 1.11 | 1.11 | |||
| Hypo: 1-1.6 | 96 | 4.16 | 1.26 | 8.53 | ||
| Normal: 1.7-2.2 | 410 | 3.69 | 0.97 | 7.58 | ||
| Hyper: 2.3-4.9 | 103 | 3.89 | 1.51 | 7.25 | ||
| Total | 826 | 3.65 | 1.03 | 7.34 | ||
| RL2 | ||||||
| (blank) | 304 | 3.79 | 1.03 | 7.52 |
0.948 |
3 |
| Hypo: 1-1.6 | 29 | 3.37 | 1.72 | 4.76 | ||
| Normal: 1.7-2.2 | 370 | 3.50 | 1.12 | 6.78 | ||
| Hyper: 2.3-4.9 | 123 | 3.81 | 0.91 | 8.94 | ||
| Total | 826 | 3.65 | 1.03 | 7.34 | ||
| HD | ||||||
| (blank) | 106 | 4.43 | 1.67 | 7.45 |
0.300 |
3 |
| Hypo: 1-1.6 | 43 | 4.95 | 2.02 | 8.94 | ||
| Normal: 1.7-2.2 | 519 | 3.47 | 0.96 | 6.83 | ||
| Hyper: 2.3-4.9 | 158 | 3.35 | 0.98 | 8.36 | ||
| Total | 826 | 3.65 | 1.03 | 7.34 | ||
| PD | ||||||
| (blank) | 704 | 13.35 | 10.43 | 11.38 |
0.481 |
3 |
| Hypo: 1-1.6 | 5 | 1.96 | 1.47 | 2.18 | ||
| Normal: 1.7-2.2 | 88 | 5.16 | 2.16 | 8.01 | ||
| Hyper: 2.3-4.9 | 26 | 4.65 | 2.53 | 4.90 | ||
| Total | 823 | 12.13 | 9.23 | 11.28 | ||
Table 5: ICU LOS at five timepoints (Hospital Admission, ICU Admission, ICU Discharge, Hospital Discharge, and Patient Death) compared to average magnesium levels. Magnesium levels were categorized into Extreme Hypomagnesemia (<1mg/dL), Hypomagnesemia (1-1.6 mg/dL), Normomagnesemia (1.7-2.2 mg/dL), Hypermagnesemia (2.3-4.9mg/dL), and Extreme Hypermagnesemia (>4.9mg/dL). Rows marked “(blank)” signify missing data. No significant associations were noted. Abbreviations: HA = Hospital Admission; RL1 = ICU Admission; RL2 = ICU Discharge; HD = Hospital Discharge; PD = Patient Death; SD = Standard Deviation; DF = Degrees of Freedom.
Table 6.
Comparison of Ventilator Days to Magnesium Levels at Different Timepoints.
| Magnesium Category | N | Mean | Median | SD | P-value | DF |
|---|---|---|---|---|---|---|
| HA | ||||||
| (blank) | 383 | 1.95 | 0.00 | 5.40 |
0.179 |
4 |
| Extreme hypo: <1 | 2 | 0.00 | 0.00 | 0.00 | ||
| Hypo: 1-1.6 | 59 | 3.00 | 0.00 | 14.25 | ||
| Normal: 1.7-2.2 | 322 | 1.17 | 0.00 | 3.55 | ||
| Hyper: 2.3-4.9 | 60 | 1.23 | 0.00 | 4.03 | ||
| Total | 826 | 1.66 | 0.00 | 5.84 | ||
| RL1 | ||||||
| (blank) | 216 | 1.11 | 0.00 | 3.37 |
0.113 |
4 |
| Extreme hypo: <1 | 1 | 0.00 | 0.00 | |||
| Hypo: 1-1.6 | 96 | 2.94 | 0.00 | 11.73 | ||
| Normal: 1.7-2.2 | 410 | 1.84 | 0.00 | 5.30 | ||
| Hyper: 2.3-4.9 | 103 | 0.95 | 0.00 | 2.92 | ||
| Total | 826 | 1.66 | 0.00 | 5.84 | ||
| RL2 | ||||||
| (blank) | 304 | 1.35 | 0.00 | 3.62 |
0.503 |
3 |
| Hypo: 1-1.6 | 29 | 4.66 | 0.00 | 20.07 | ||
| Normal: 1.7-2.2 | 370 | 1.47 | 0.00 | 4.77 | ||
| Hyper: 2.3-4.9 | 123 | 2.31 | 0.00 | 5.82 | ||
| Total | 826 | 1.66 | 0.00 | 5.84 | ||
| HD | ||||||
| (blank) | 106 | 1.47 | 0.00 | 3.49 |
0.119 |
3 |
| Hypo: 1-1.6 | 43 | 4.33 | 0.00 | 16.92 | ||
| Normal: 1.7-2.2 | 519 | 1.38 | 0.00 | 4.29 | ||
| Hyper: 2.3-4.9 | 158 | 1.99 | 0.00 | 5.60 | ||
| Total | 826 | 1.66 | 0.00 | 5.84 | ||
| PD | ||||||
| (blank) | 707 | 1.34 | 0.00 | 4.45 |
0.000 |
3 |
| Hypo: 1-1.6 | 5 | 25.00 | 7.00 | 46.60 | ||
| Normal: 1.7-2.2 | 88 | 2.56 | 0.00 | 4.76 | ||
| Hyper: 2.3-4.9 | 26 | 2.92 | 1.00 | 4.88 | ||
| Total | 826 | 1.66 | 0.00 | 5.84 | ||
Table 6: Ventilator days at five timepoints (Hospital Admission, ICU Admission, ICU Discharge, Hospital Discharge, and Patient Death) compared to average magnesium levels. Magnesium levels were categorized into Extreme Hypomagnesemia (<1mg/dL), Hypomagnesemia (1-1.6 mg/dL), Normomagnesemia (1.7-2.2 mg/dL), Hypermagnesemia (2.3-4.9mg/dL), and Extreme Hypermagnesemia (>4.9mg/dL). Rows marked “(blank)” signify missing data. Significance was noted at the Patient Death timepoint only. Abbreviations: HA = Hospital Admission; RL1 = ICU Admission; RL2 = ICU Discharge; HD = Hospital Discharge; PD = Patient Death; SD = Standard Deviation; DF = Degrees of Freedom.
Injury Severity was also compared to magnesium categories at all five timepoints of interest (Table 7). Three injury severity scores were used: Abbreviated Injury Scale (AIS) Head score, Injury Severity Score (ISS), and Glasgow Coma Scale (GCS). Significant associations were only noted at the Patient Death timepoint, with p=0.000 and DF=3 for all three severity scores. No other significant associations were noted.
Table 7.
Comparison of Injury Severity to Magnesium Levels at Different Timepoints.
| Magnesium Category | AIS HEAD | ISS | GCS | |
|---|---|---|---|---|
| HA | ||||
| N | 383 | 383 | 383 | |
| (blank) | Mean | 3.66 | 17.92 | 12.27 |
| Median | 3.00 | 16.00 | 15.00 | |
| SD | 0.80 | 9.35 | 4.34 | |
| N | 2 | 2 | 2 | |
| Extreme hypo: <1 | Mean | 4.00 | 18.00 | 15.00 |
| Median | 4.00 | 18.00 | 15.00 | |
| SD | 1.41 | 11.31 | 0.00 | |
| N | 60 | 60 | 60 | |
| Hyper: 2.3-4.9 | Mean | 3.62 | 17.50 | 12.38 |
| Median | 3.00 | 17.00 | 15.00 | |
| SD | 0.78 | 6.68 | 4.15 | |
| N | 59 | 59 | 59 | |
| Hypo: 1-1.6 | Mean | 3.59 | 18.29 | 12.78 |
| Median | 3.00 | 14.00 | 15.00 | |
| SD | 0.81 | 10.50 | 3.97 | |
| N | 322 | 322 | 322 | |
| Normal: 1.7-2.2 | Mean | 3.66 | 18.63 | 12.60 |
| Median | 3.00 | 16.00 | 15.00 | |
| SD | 0.80 | 11.87 | 4.13 | |
| N | 826 | 826 | 826 | |
| Total | Mean | 3.65 | 18.20 | 12.45 |
| Median | 3.00 | 16.00 | 15.00 | |
| SD | 0.80 | 10.32 | 4.22 | |
| P-value | 0.929 | 0.979 | 0.535 | |
| DF | 4 | 4 | 4 | |
| RL1 | ||||
| N | 216 | 216 | 216 | |
| (blank) | Mean | 3.66 | 18.24 | 12.66 |
| Median | 3.00 | 16.00 | 15.00 | |
| SD | 0.78 | 10.832 | 4.086 | |
| N | 1 | 1 | 1 | |
| Extreme hypo: <1 | Mean | 3.00 | 10.00 | 14.00 |
| Median | 3.00 | 10.00 | 14.00 | |
| SD | - | - | - | |
| N | 103 | 103 | 103 | |
| Hyper: 2.3-4.9 | Mean | 3.51 | 16.45 | 12.77 |
| Median | 3.00 | 16.00 | 15.00 | |
| SD | 0.68 | 6.78 | 3.77 | |
| N | 96 | 96 | 96 | |
| Hypo: 1-1.6 | Mean | 3.74 | 18.20 | 12.35 |
| Median | 3.00 | 17.00 | 15.00 | |
| SD | 0.84 | 8.49 | 4.33 | |
| N | 410 | 410 | 410 | |
| Normal: 1.7-2.2 | Mean | 3.66 | 18.63 | 12.27 |
| Median | 3.00 | 16.00 | 15.00 | |
| SD | 0.82 | 11.13 | 4.37 | |
| N | 826 | 826 | 826 | |
| Total | Mean | 3.65 | 18.20 | 12.45 |
| Median | 3.00 | 16.00 | 15.00 | |
| SD | 0.80 | 10.32 | 4.22 | |
| P-value | 0.391 | 0.695 | 0.879 | |
| DF | 4 | 4 | 4 | |
| RL2 | ||||
| N | 304 | 304 | 304 | |
| (blank) | Mean | 3.65 | 18.04 | 12.42 |
| Median | 3.00 | 16.00 | 15.00 | |
| SD | 0.77 | 10.30 | 4.19 | |
| N | 123 | 123 | 123 | |
| Hyper: 2.3-4.9 | Mean | 3.62 | 17.24 | 12.25 |
| Median | 3.00 | 14.00 | 15.00 | |
| SD | 0.78 | 8.92 | 4.43 | |
| N | 29 | 29 | 29 | |
| Hypo: 1-1.6 | Mean | 3.72 | 18.00 | 12.41 |
| Median | 3.00 | 17.00 | 15.00 | |
| SD | 0.84 | 8.50 | 4.26 | |
| N | 370 | 370 | 370 | |
| Normal: 1.7-2.2 | Mean | 3.65 | 18.66 | 12.54 |
| Median | 3.00 | 16.00 | 15.00 | |
| SD | 0.82 | 10.90 | 4.17 | |
| N | 826 | 826 | 826 | |
| Total | Mean | 3.65 | 18.20 | 12.45 |
| Median | 3.00 | 16.00 | 15.00 | |
| SD | 0.80 | 10.32 | 4.22 | |
| P-value | 0.907 | 0.841 | 0.920 | |
| DF | 3 | 3 | 3 | |
| HD | ||||
| N | 106 | 106 | 106 | |
| (blank) | Mean | 3.81 | 19.87 | 12.05 |
| Median | 4.00 | 17.00 | 15.00 | |
| SD | 0.83 | 11.51 | 4.42 | |
| N | 158 | 158 | 158 | |
| Hyper: 2.3-4.9 | Mean | 3.60 | 17.46 | 12.18 |
| Median | 3.00 | 16.00 | 15.00 | |
| SD | 0.78 | 9.87 | 4.45 | |
| N | 43 | 43 | 43 | |
| Hypo: 1-1.6 | Mean | 3.67 | 18.30 | 12.51 |
| Median | 3.00 | 17.00 | 15.00 | |
| SD | 0.81 | 8.11 | 4.30 | |
| N | 519 | 519 | 519 | |
| Normal: 1.7-2.2 | Mean | 3.63 | 18.07 | 12.61 |
| Median | 3.00 | 16.00 | 15.00 | |
| SD | 0.79 | 10.35 | 4.09 | |
| N | 826 | 826 | 826 | |
| Total | Mean | 3.65 | 18.20 | 12.45 |
| Median | 3.00 | 16.00 | 15.00 | |
| SD | 0.80 | 10.32 | 4.22 | |
| P-value | 0.140 | 0.222 | 0.586 | |
| DF | 3 | 3 | 3 | |
| PD | ||||
| N | 707 | 707 | 707 | |
| (blank) | Mean | 3.55 | 16.16 | 13.42 |
| Median | 3.00 | 14.00 | 15.00 | |
| SD | 0.73 | 7.13 | 3.19 | |
| N | 26 | 26 | 26 | |
| Hyper: 2.3-4.9 | Mean | 4.42 | 28.35 | 7.38 |
| Median | 5.00 | 25.50 | 4.50 | |
| SD | 0.90 | 16.63 | 5.31 | |
| N | 5 | 5 | 5 | |
| Hypo: 1-1.6 | Mean | 4.20 | 24.60 | 4.00 |
| Median | 5.00 | 30.00 | 3.00 | |
| SD | 1.10 | 14.78 | 2.24 | |
| N | 88 | 88 | 88 | |
| Normal: 1.7-2.2 | Mean | 4.23 | 31.17 | 6.64 |
| Median | 4.50 | 26.00 | 3.00 | |
| SD | 0.91 | 16.47 | 4.88 | |
| N | 826 | 826 | 826 | |
| Total | Mean | 3.65 | 18.20 | 12.45 |
| Median | 3.00 | 16.00 | 15.00 | |
| SD | 0.80 | 10.32 | 4.22 | |
| P-value | 0.000 | 0.000 | 0.000 | |
| DF | 3 | 3 | 3 | |
Table 7: Injury Severity (AIS head, ISS, and GCS) at five timepoints (Hospital Admission, ICU Admission, ICU Discharge, Hospital Discharge, and Patient Death) compared to average magnesium levels. Magnesium levels were categorized into Extreme Hypomagnesemia (<1mg/dL), Hypomagnesemia (1-1.6 mg/dL), Normomagnesemia (1.7-2.2 mg/dL), Hypermagnesemia (2.3-4.9mg/dL), and Extreme Hypermagnesemia (>4.9mg/dL). Rows marked “(blank)” signify missing data. Significance was noted at the Patient Death timepoint only for all three injury severity scales. Abbreviations: HA = Hospital Admission; RL1 = ICU Admission; RL2 = ICU Discharge; HD = Hospital Discharge; PD = Patient Death; AIS = Abbreviated Injury Scale; ISS = Injury Severity Score; GCS = Glasgow Coma Scale; SD = Standard Deviation; DF = Degrees of Freedom. (Note: No standard deviation for RL1 extreme hypomagnesemia due to only one N).
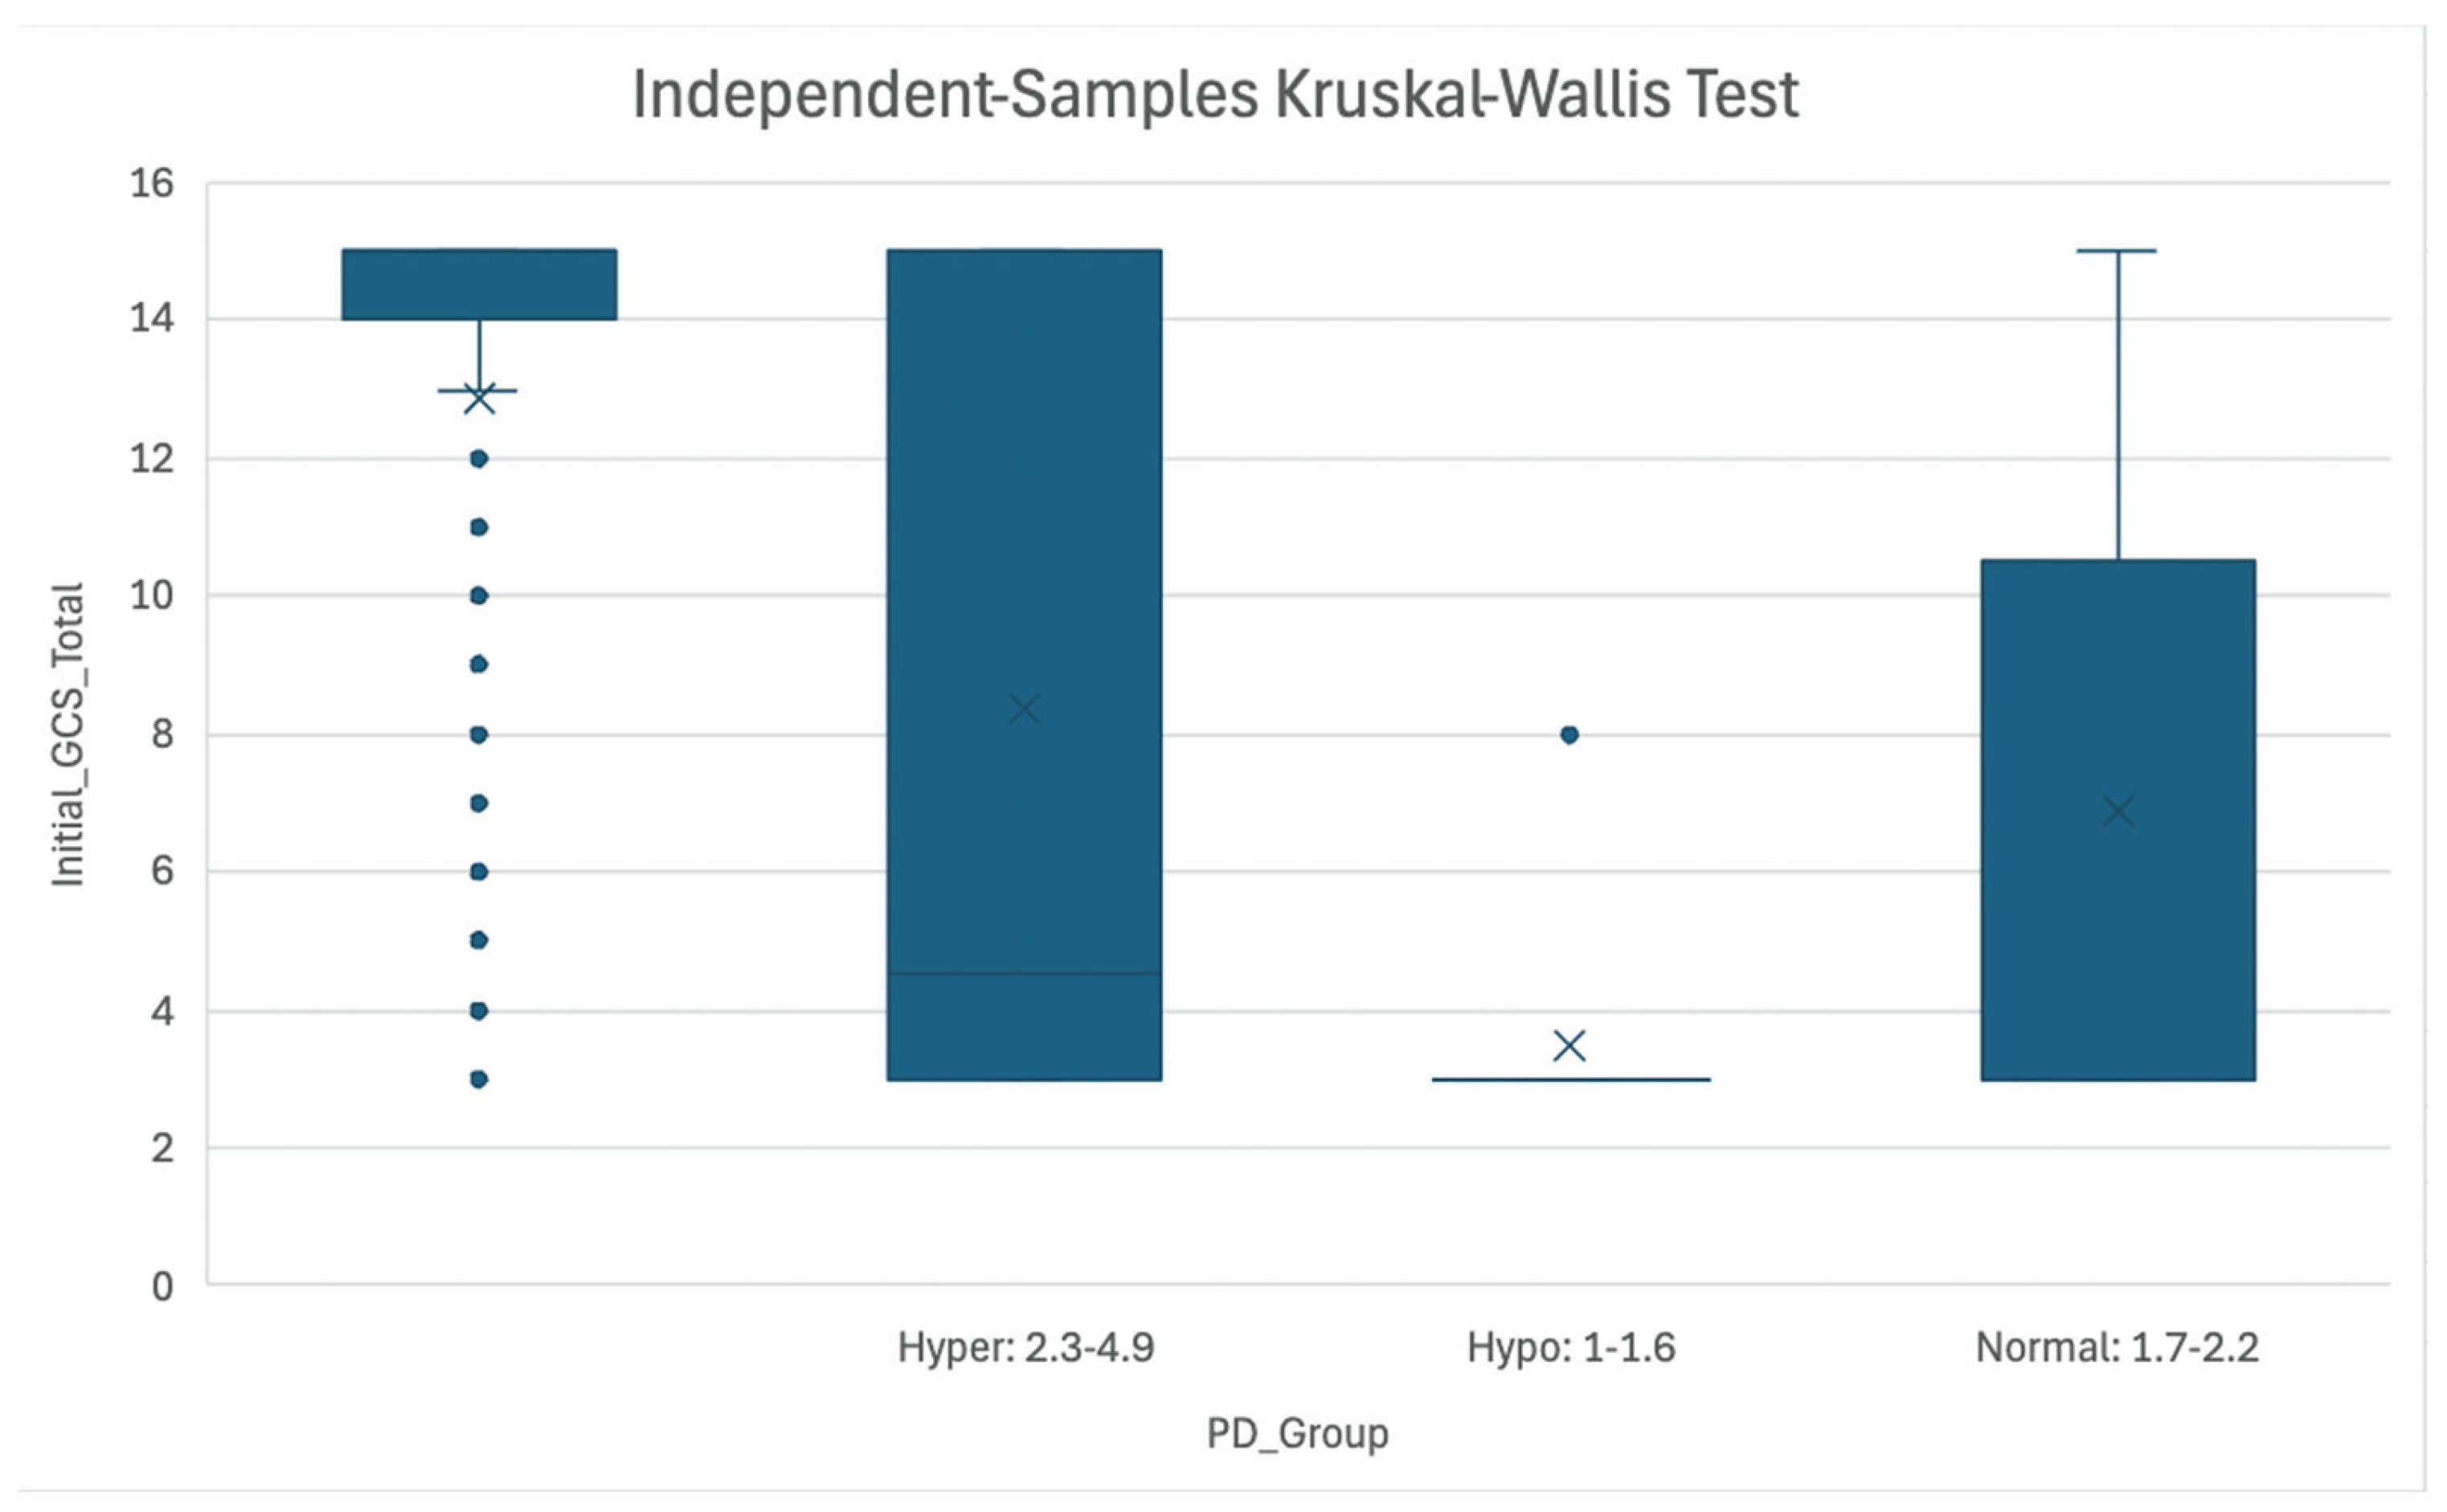
Figure 1, Figure 2 and Figure 3 are boxplots representing the significant associations between magnesemia levels and AIS Head (Figure 1), ISS (Figure 2), and initial GCS scores (Figure 3).
Figure 1.
Association of AIS Head Score and Magnesemia Level at PD Timepoint. Figure 1: Boxplot representing association between AIS Head score and Magnesemia categories (Hypermagnesemia: 2.3-4.9 mg/dL, Normomagnesemia: 1.7-2.2 mg/dL, Hypomagnesemia: 1.0-1.6 mg/dL) at the Patient Death timepoint. Abbreviations: AIS = Abbreviated Injury Scale; PD = Patient Death.
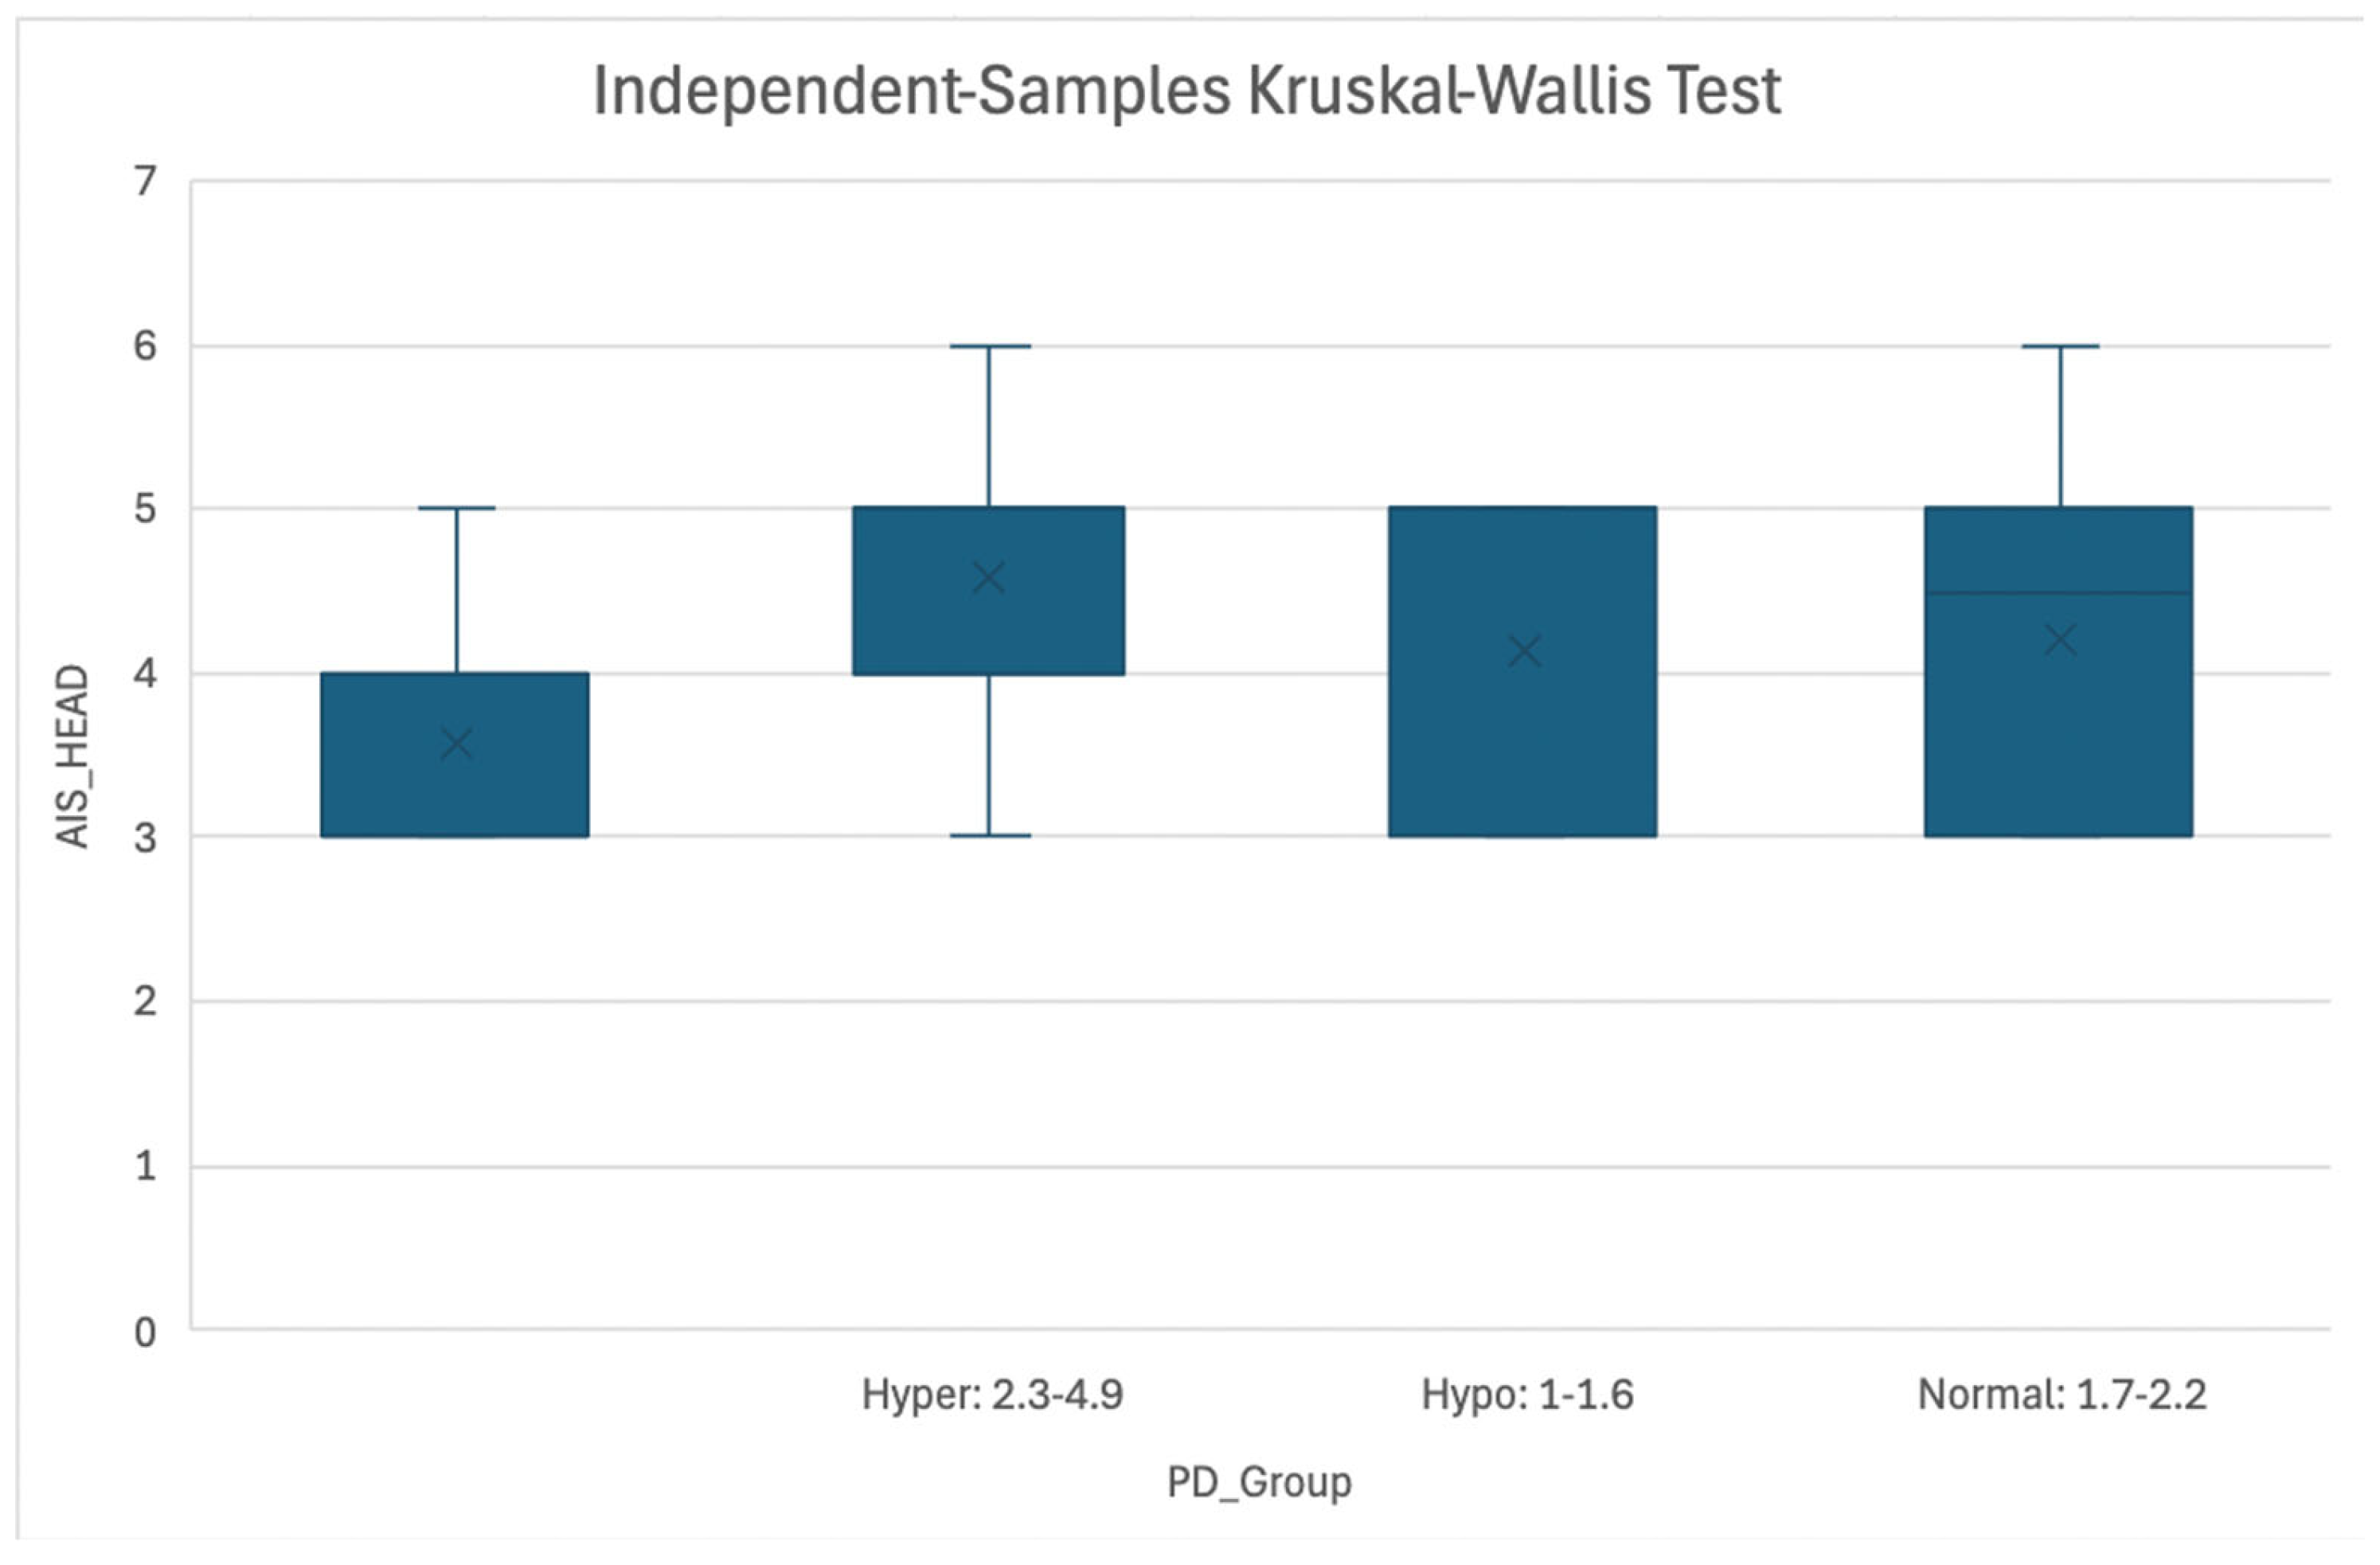
Figure 2.
Association of ISS Score and Magnesemia Level at PD Timepoint. Figure 2: Boxplot representing association between ISS and Magnesemia categories (Hypermagnesemia: 2.3-4.9 mg/dL, Normomagnesemia: 1.7-2.2 mg/dL, Hypomagnesemia: 1.0-1.6 mg/dL) at the Patient Death timepoint. Abbreviations: ISS = Injury Severity Score; PD = Patient Death.
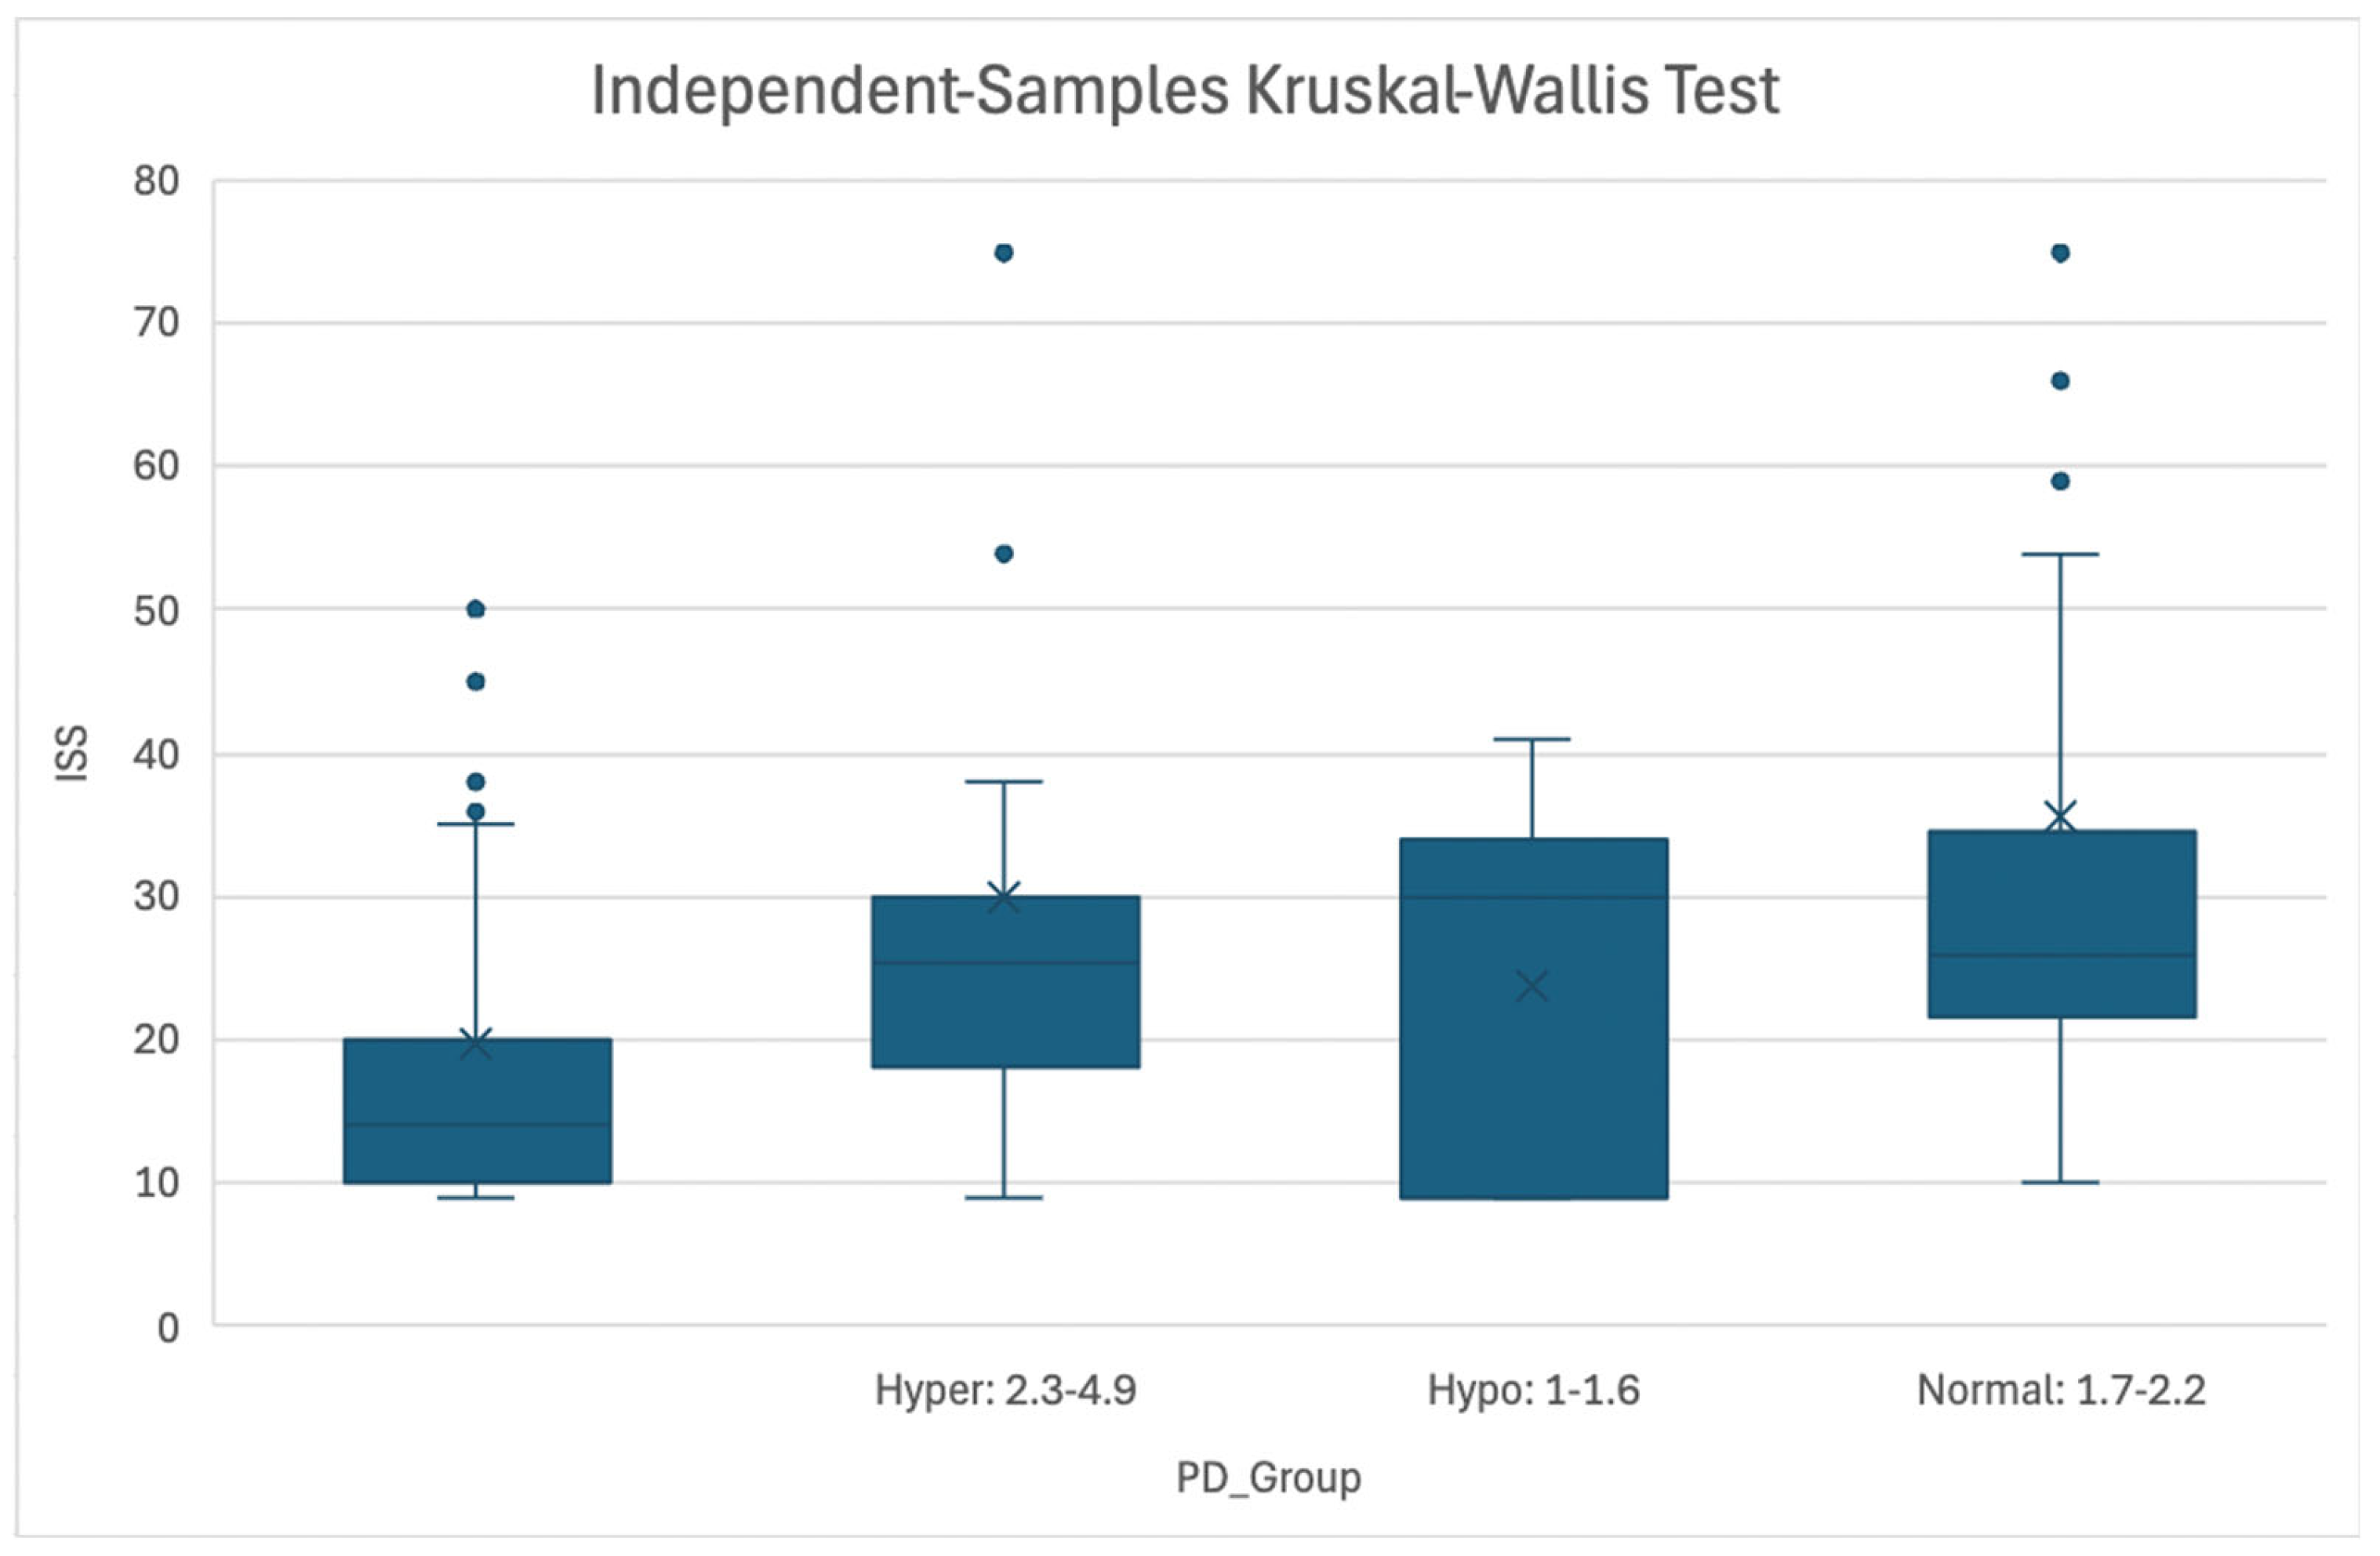
Figure 3.
Association of Initial GCS Score and Magnesemia Level at PD Timepoint. Figure 3: Boxplot representing association between GCS score and Magnesemia categories (Hypermagnesemia: 2.3-4.9 mg/dL, Normomagnesemia: 1.7-2.2 mg/dL, Hypomagnesemia: 1.0-1.6 mg/dL) at the Patient Death timepoint. Abbreviations: GCS = Glasgow Coma Scale; PD = Patient Death.
Discussion
Key Findings
In this large, retrospective cohort study of 826 patients with severe traumatic brain injury (TBI), we identified a significant association between magnesium levels and in-hospital mortality, which was recorded as the Patient Death (PD) timepoint. Significant associations were noted when accounting for Hospital Length of Stay (LOS), ED LOS, number of days on mechanical ventilation, and all three measured injury severity scales: Abbreviated Injury Scale (AIS) Head score, Injury Severity Scale (ISS) score, and Glasgow Coma Scale (GCS) score. No significant relationships were observed at the other timepoints of interest.
Comparison to Existing Literature
There is limited evidence regarding the direct association between magnesium levels and Hospital, ED, or ICU length of stay. Smaller cohort studies have found that hypomagnesemia is significantly associated with an increased risk of long-term disability and mortality, especially among younger patients [8,26-27]. Hypermagnesemia has also been observed to be independently associated with mortality in TBI [27]. Ngatuvai et al. conducted a systematic review including 14 studies to assess the impact of sodium, potassium, calcium, and magnesium abnormalities on outcomes in patients with TBI, specifically looking at ICU LOS and Glasgow Outcome Scale (GOS) at six months [17]. They concluded that hypomagnesemia was associated with worse GOS at six months but ICU LOS was only significantly associated with hypo- and hyper-natremia [17].
Existing literature also does not specifically address the association between magnesium levels and number of days on mechanical ventilation among patients with severe TBI. However, a large meta-analysis including 6 studies by Upala et al. concluded that among critically ill patients admitted to the ICU, not limited to patients with severe TBI, hypomagnesemia is associated with higher mortality, the need for mechanical ventilation, and increased length of ICU stay [28].
Lower serum magnesium levels have also been found to be associated with greater injury severity, as demonstrated by GCS scores of 4-6. Patients presenting with more severe TBI, as shown by lower GCS scores, exhibit significant and persistent declines in plasma magnesium during the acute post-injury period [29]. There does not appear to be direct evidence linking magnesium levels to AIS or ISS scores.
Both hypo- and hypermagnesemia are associated with increased mortality in patients with severe TBI. Hypomagnesemia on admission is independently associated with higher risk of poor neurological outcome and death at 6 months, even when corrected rapidly after injury [8,26]. While these associations have been observed for magnesium, most robust evidence points towards significant associations between other electrolyte imbalances and patient mortality in severe TBI [17,30-33]. Thus, there exists a meaningful gap in information regarding magnesium levels and clinical variables such as LOS and vent data following TBI.
Implications of Study Findings
Due to the relative paucity of literature regarding the impact of magnesium level on clinical outcomes such as length of stay, number of days on mechanical ventilation, and injury severity, this study addresses an important gap in understanding the impact of magnesium fluctuations following TBI. Most notably, significance was noted at the Patient Death timepoint, suggesting magnesium levels following trauma have appreciable implications on mortality. While other significant associations were not noted in our study, investigators should continue to explore these relationships.
Strengths, Limitations, and Future Perspectives
Our study’s large sample size provides substantial statistical power. The collection of a range of magnesium levels (Extreme Hypomagnesemia: <1mg/dL, Hypomagnesemia: 1-1.6 mg/dL, Normomagnesemia: 1.7-2.2 mg/dL, Hypermagnesemia: 2.3-4.9mg/dL, and Extreme Hypermagnesemia: >4.9mg/dL) at five distinct timepoints (Hospital Admission, ICU Admission, ICU Discharge, Hospital Discharge, and Patient Death) offers a comprehensive view of magnesium kinetics throughout the course of hospitalization. Such collection of data provides a dynamic longitudinal perspective on how magnesium levels fluctuate in response to injury progression and clinical interventions. Additionally, multivariable regression models adjust for a broad spectrum of relevant confounders, including trauma severity (AIS-head, ISS, and GCS), demographic factors (sex, age, race, ethnicity), and trauma type (blunt vs. penetrating), which strengthens the validity of observed associations by minimizing potential confounding biases.
Limitations of this study include those commonly associated with retrospective study designs. These include decreased generalizability, which is also influenced by the fact that data was collected at a single study center, as well as information bias and missing or incomplete data. Another important limitation of this study is the lack of data collection of other important electrolyte abnormalities that often co-occur with magnesium changes following trauma, including potassium, calcium, and phosphate levels. Hypomagnesemia is especially frequently associated with hypokalemia and hypocalcemia, and correction of magnesium deficiency is often necessary to resolve these other abnormalities [34]. Future studies should aim to take these co-occurring electrolyte abnormalities into consideration. Additionally, future research should continue to explore relationships between magnesium level and various important clinical outcomes that could significantly affect patient morbidity and mortality.
Conclusions
In conclusion, our study addresses an important gap in literature regarding the relationship between magnesium levels and important clinical variables such as Hospital, ED, and ICU LOS, as well as number of days on mechanical ventilation. We found significant associations between magnesium level and hospital LOS, ED LOS, vent days, and injury severity (AIS, ISS, and GCS) scores at the Patient Death (PD) timepoint. However, no other significant associations were noted. This agrees with current literature, although a paucity of evidence exists linking these clinical variables to magnesium levels. Future studies should aim to further explore these relationships, as well as take into consideration the impact of other electrolyte abnormalities that likely co-occur with magnesium fluctuations following severe TBI.
Author Contributions
Conceptualization—B.S.; Resources: B.S., G.A.; Investigation: B.S., K.T., N.D.B.; Methodology: B.S., L.S; Formal analysis: B.S., L.S.; writing—original draft preparation—B.S., and S.D.M; writing—review and editing—B.S., J.W., Z.P..; figures and table- B.S.; supervision—B.S.; project administration—B.S. All authors have read and agreed to the published version of the manuscript.
Funding
There is no grant support or financial relationship for this manuscript.
Institutional Review Board Statement
This retrospective study was approved by the IRB at Elmhurst Facility on 5 July 2024, with IRB number 24-12-092-05G.
Informed Consent Statement
Retrospective analysis was performed on anonymized data, and informed consent was not applicable.
Data Availability Statement
Data for this study was requested from the Elmhurst Trauma registry and extracted using electronic medical records after receiving approval from the Institutional Review Board at our facility (Elmhurst Hospital Center).
Conflicts of Interest
The authors have no competing interests to declare
References
- Kröse, J.L.; de Baaij, J.H.F. Magnesium biology. Nephrol Dial Transplant 2025, 40, 1261. [Google Scholar] [CrossRef] [PubMed] [PubMed Central]
- de Baaij, J.H.; Hoenderop, J.G.; BindelsRJ. Magnesium in man: implications for health and disease. Physiol Rev 2015, 95, 1–46. [Google Scholar] [CrossRef] [PubMed]
- Patel, V.; Akimbekov, N.S.; Grant, W.B.; Dean, C.; Fang, X.; Razzaque, M.S. Neuroprotective effects of magnesium: implications for neuroinflammation and cognitive decline. Front Endocrinol (Lausanne) 2024, 15, 1406455. [Google Scholar] [CrossRef] [PubMed] [PubMed Central]
- Maier, J.A.M.; Locatelli, L.; Fedele, G.; Cazzaniga, A.; Mazur, A. Magnesium and the Brain: A Focus on Neuroinflammation and Neurodegeneration. Int J Mol Sci 2022, 24, 223. [Google Scholar] [CrossRef] [PubMed] [PubMed Central]
- Ścibior, A.; Llopis, J.; Dobrakowski, P.P.; Męcik-Kronenberg, T. Magnesium (Mg) and Neurodegeneration: A Comprehensive Overview of Studies on Mg Levels in Biological Specimens in Humans Affected Some Neurodegenerative Disorders with an Update on Therapy and Clinical Trials Supplemented with Selected Animal Studies. Int J Mol Sci 2024, 25, 12595. [Google Scholar] [CrossRef] [PubMed] [PubMed Central]
- Mathew, A.A.; Panonnummal, R. A Mini Review on the Various Facets Effecting Brain Delivery of Magnesium and Its Role in Neurological Disorders. Biol Trace Elem Res 2023, 201, 4238–4253. [Google Scholar] [CrossRef] [PubMed]
- Vink, R.; McIntosh, T.K.; Demediuk, P.; Weiner, M.W.; Faden, A.I. Decline in intracellular free Mg2+ is associated with irreversible tissue injury after brain trauma. J Biol Chem 1988, 263, 757–61. [Google Scholar] [CrossRef] [PubMed]
- Stippler, M.; Fischer, M.R.; Puccio, A.M.; Wisniewski, S.R.; Carson-Walter, E.B.; Dixon, C.E.; Walter, K.A. Serum and cerebrospinal fluid magnesium in severe traumatic brain injury outcome. J Neurotrauma 2007, 24, 1347–54. [Google Scholar] [CrossRef] [PubMed]
- Arango, M.F.; Bainbridge, D. Magnesium for acute traumatic brain injury. Cochrane Database Syst Rev. 2008, CD005400. [Google Scholar] [CrossRef] [PubMed]
- Busingye, D.S.; Turner, R.J.; Vink, R. Combined Magnesium/Polyethylene Glycol Facilitates the Neuroprotective Effects of Magnesium in Traumatic Brain Injury at a Reduced Magnesium Dose. CNS Neurosci Ther 2016, 22, 854–9. [Google Scholar] [CrossRef] [PubMed] [PubMed Central]
- Li, W.; Bai, Y.A.; Li, Y.J.; Liu, K.G.; Wang, M.D.; Xu, G.Z.; Shang, H.L.; Li, Y.F. Magnesium sulfate for acute traumatic brain injury. J Craniofac Surg 2015, 26, 393–8. [Google Scholar] [CrossRef] [PubMed]
- Ginsburg, J.; Smith, T. Traumatic Brain Injury. [Updated 2025 Feb 17]. In: StatPearls [Internet]. Treasure Island (FL): StatPearls Publishing; 2025 Jan-. Available online: https://www.ncbi.nlm.nih.gov/books/NBK557861/.
- Zhong, H.; Feng, Y.; Shen, J.; Rao, T.; Dai, H.; Zhong, W.; Zhao, G. Global Burden of Traumatic Brain Injury in 204 Countries and Territories From 1990 to 2021. Am J Prev Med 2025, 68, 754–763. [Google Scholar] [CrossRef] [PubMed]
- Yan, J.; Wang, C.; Sun, B. Global, regional, and national burdens of traumatic brain injury from 1990 to 2021. Front Public Health 2025, 13, 1556147. [Google Scholar] [CrossRef] [PubMed] [PubMed Central]
- Liu, J.; Xu, A.; Zhao, Z.; Fang, D.; Lv, W.; Li, Y.; Wang, P.; Wang, Y.; Dai, Y.; Zheng, X.; Yang, F.; Cheng, G.; Zhang, J. The Burden of traumatic brain injury,its causes and future trend predictions in 204 countries and territories,1990-2021: results from the Global Burden of Disease Study 2021. Neuroepidemiology Epub ahead of print.. 2025, 1–24. [Google Scholar] [CrossRef] [PubMed]
- Dobson, G.P.; Morris, J.L.; Letson, H.L. Traumatic brain injury: Symptoms to systems in the 21st century. Brain Res. 2024, 1845, 149271. [Google Scholar] [CrossRef] [PubMed]
- Ngatuvai, M.; Martinez, B.; Sauder, M.; Beeton, G.; Andrade, R.; Maka, P.; Smith, C.P.; Kornblith, L.; Elkbuli, A. Traumatic Brain Injury, Electrolyte Levels, and Associated Outcomes: A Systematic Review. J Surg Res. 2023, 289, 106–115. [Google Scholar] [CrossRef] [PubMed]
- Banoei MM, Hutchison J, Panenka W, Wong A, Wishart DS, Winston BW; Canadian Biobank and Database for Traumatic Brain Injury (CanTBI) study investigators; Canadian Critical Care Translational Biology Group (CCCTBG); Canadian Traumatic Brain Injury Research Consortium (CTRC). Metabolomic in severe traumatic brain injury: exploring primary, secondary injuries, diagnosis, and severity. Crit Care 2025, 29, 26. [Google Scholar] [CrossRef] [PubMed] [PubMed Central]
- Aal-Hamad, A.H.; Al-Alawi, A.M.; Kashoub, M.S.; Falhammar, H. Hypermagnesemia in Clinical Practice. Medicina (Kaunas) 2023, 59, 1190. [Google Scholar] [CrossRef] [PubMed] [PubMed Central]
- Cascella, M.; Vaqar, S. Hypermagnesemia. [Updated 2023 Jun 4]. In: StatPearls [Internet]. Treasure Island (FL): StatPearls Publishing; 2025 Jan-. Available online: https://www.ncbi.nlm.nih.gov/books/NBK549811/.
- Chan, M.J.; Chen, J.J.; Lee, C.C.; Fan, P.C.; Su, Y.J.; Cheng, Y.L.; Chen, C.Y.; Wu, V.; Chen, Y.C.; Chang, C.H. Clinical impact of hypermagnesemia in acute kidney injury patients undergoing continuous kidney replacement therapy: A propensity score analysis utilizing real-world data. J Crit Care. 2025, 85, 154947. [Google Scholar] [CrossRef] [PubMed]
- Kocaşaban, D.Ü.; Güler, S. Is magnesium level significant in prognosis of geriatric patients admitted to the emergency department? Am J Emerg Med. 2025, 90, 88–92. [Google Scholar] [CrossRef] [PubMed]
- Malinowska, J.; Małecka, M.; Ciepiela, O. Variations in Magnesium Concentration Are Associated with Increased Mortality: Study in an Unselected Population of Hospitalized Patients. Nutrients 2020, 12, 1836. [Google Scholar] [CrossRef] [PubMed] [PubMed Central]
- Mohamed, A.O. Hyper- and hypomagnesemia as an initial predictor of outcomes in septic pediatric patients in Egypt. Acute Crit Care 2025, 40, 105–112. [Google Scholar] [CrossRef] [PubMed] [PubMed Central]
- Whittaker Striker, C.; Reagor, J.A. Evaluating the need for magnesium administration following cardioplegic arrest with del Nido cardioplegia solution. J Extra Corpor Technol 2025, 57, 9–13. [Google Scholar] [CrossRef] [PubMed] [PubMed Central]
- Jung, E.; Lee, J.H.; Park, H.K. Association between serum magnesium level and long-term prognosis of traumatic brain injury. Brain Inj. Epub ahead of print.. 2025, 1–8. [Google Scholar] [CrossRef] [PubMed]
- Wang, R.; He, M.; Xu, J. Initial Serum Magnesium Level Is Associated with Mortality Risk in Traumatic Brain Injury Patients. Nutrients 2022, 14, 4174. [Google Scholar] [CrossRef] [PubMed] [PubMed Central]
- Upala, S.; Jaruvongvanich, V.; Wijarnpreecha, K.; Sanguankeo, A. Hypomagnesemia and mortality in patients admitted to intensive care unit: a systematic review and meta-analysis. QJM 2016, 109, 453–459. [Google Scholar] [CrossRef] [PubMed]
- Cernak, I.; Savic, V.J.; Kotur, J.; Prokic, V.; Veljovic, M.; Grbovic, D. Characterization of plasma magnesium concentration and oxidative stress following graded traumatic brain injury in humans. J Neurotrauma 2000, 17, 53–68. [Google Scholar] [CrossRef] [PubMed]
- Mekkodathil, A.; El-Menyar, A.; Chughtai, T.; Abdel-Aziz Bahey, A.; Labib Shehatta, A.; Ayyad, A.; Alyafai, A.; Al-Thani, H. Initial serum electrolyte imbalances and mortality in patients with traumatic brain injury: a retrospective study. World J Emerg Med 2025, 16, 331–339. [Google Scholar] [CrossRef] [PubMed] [PubMed Central]
- Wu, X.; Lu, X.; Lu, X.; Yu, J.; Sun, Y.; Du, Z.; Wu, X.; Mao, Y.; Zhou, L.; Wu, S.; Hu, J. Prevalence of severe hypokalaemia in patients with traumatic brain injury. Injury 2015, 46, 35–41. [Google Scholar] [CrossRef] [PubMed]
- Helsloot D, Fitzgerald M, Lefering R, Verelst S, Missant, C. ; TraumaRegister, D.G.U. Trauma-induced disturbances in ionized calcium levels correlate parabolically with coagulopathy, transfusion, and mortality: a multicentre cohort analysis from the TraumaRegister DGU®. Crit Care 2023, 27, 267. [Google Scholar] [CrossRef] [PubMed] [PubMed Central]
- Tomkins, M.; Green, D.; O'Reilly, M.W.; Sherlock, M. Fluid and electrolyte disorders following traumatic brain injury. Best Pract Res Clin Endocrinol Metab 2025, 39, 102014. [Google Scholar] [CrossRef] [PubMed]
- Touyz, R.M.; de Baaij, J.H.F.; Hoenderop, J.G.J. Magnesium Disorders. N Engl J Med 2024, 390, 1998–2009. [Google Scholar] [CrossRef] [PubMed]
Disclaimer/Publisher’s Note: The statements, opinions and data contained in all publications are solely those of the individual author(s) and contributor(s) and not of MDPI and/or the editor(s). MDPI and/or the editor(s) disclaim responsibility for any injury to people or property resulting from any ideas, methods, instructions or products referred to in the content. |
© 2025 by the authors. Licensee MDPI, Basel, Switzerland. This article is an open access article distributed under the terms and conditions of the Creative Commons Attribution (CC BY) license (https://creativecommons.org/licenses/by/4.0/).
Copyright: This open access article is published under a Creative Commons CC BY 4.0 license, which permit the free download, distribution, and reuse, provided that the author and preprint are cited in any reuse.


