
Submitted:
19 August 2025
Posted:
20 August 2025
You are already at the latest version
Abstract
Microbe activity in soil can be estimated whereby a soil is air-dried, rewetted to a level favorable to microbes, and determination made of the CO2 subsequently released. Previous studies indicate this so-called burst respiration has a positive linear response to soil organic carbon (SOC). Investigation was made here of the consistency of this relationship, both regionally for pastures, and among crops fields on a single farm. The three pasture sites were separated from each other by about 100 km across Manitoba, Canada. Sample depths to 100 cm were used to provide a range of values of SOC within a pasture site. Samples were collected from 72 ha at an experimental pasture, as well as from commercial pastures of 3 ha and 16 ha. For all pastures, burst respiration was greater for soils collected at shallow depth. Burst respiration across depths had a linear positive relationship to SOC over the range investigated from 5–80 g C kg-1 at the experimental pasture. Corresponding relationships were found at both commercial pastures, but the regressions were distinct at each pasture. Background variability in SOC at 0–5 cm depth was evaluated among three cropped fields over two years at a single farm near Portage la Prairie, Manitoba. Each field had a different phase of the rotation soybean-corn- canola. Once again, significant but unique positive regressions between burst respiration and SOC were found for each field, despite differences in crop-year combinations among soil samples for a given field, and with SOC across years and fields ranging from 35–60 g C kg-1. Burst respiration was not related (P=0.65) to natural variation in clay from 14–38% across the crop fields, indicating that the quality of organic matter from historic management likely dictates the nature of the relationship between burst respiration and SOC at a site locally, and by extension, regionally. The consistency and linearity of the relationship between burst respiration and SOC at a location with consistent management history suggests that SOC can be taken as an index of soil health for a given field. Yet, to compare among sites, or even among fields on the same farm, measurement of burst respiration retains greater utility to estimate soil health.
Keywords:
soil carbon
; soil health
; soil quality
; soil depth
; loss on ignition
; soil respiration
1. Introduction
When a 2-mm sieved soil is air-dried and rewetted, a pulse of CO2 is released. Stimulation of respiration in this way has been called the Birch effect [1,2] in recognition of the original report of this phenomenon [3]. Following common practice when referring to commercial laboratory analysis of the Birch effect (e.g., https://agcrops.osu.edu/newsletter/corn-newsletter/2019-08/solvita-%C2%AE-co2-respiration-soil-health-test), we refer here to the CO2 released after rewetting of air-dried soil as burst respiration. Compared to full air-drying, partial drying of soil reduces burst respiration [1]. Sequential determinations for a single cycle of drying and wetting reveal this pulse of respiration is most intense over the first 72 hours following rewetting, with 90% of the flush completed within 4–10 days [4]. Measurement of burst respiration to compare soils has monitored CO2 released only during the first 24 hours after rewetting [5], although a four-day period has also been used [6]. In a comparison of field-moist soils to paired samples that were air-dried and rewetted, the stimulation of respiration in the latter was sustained through days 6–7 following rewetting [7].
Soil health, or soil quality, is defined in terms of productivity [8]. The search for indicators of soil health has considered various properties, including soil organic carbon (SOC) [9], microbial biomass carbon [10], and burst respiration [11]. These indicators interrelate. Burst respiration is correlated with soil microbial biomass [4]. Microbial biomass carbon has a positive linear relationship to SOC, but site management must also be considered; grasslands give a steeper response to increasing SOC when compared to croplands [12].
In the original study presenting the Birch effect [3], CO2-C mineralized over four days following rewetting was correlated with SOC across a selection of sites, yet data for other soils fell outside of this relationship. Despite the fundamental importance of SOC for our understanding of the Birch effect, systematic investigation of the relationship between respiration and SOC has been limited. Differences in the response of burst respiration to SOC among regions of North America have been considered in terms of broader climatic effects on the quality of SOC; colder and dryer climates were associated with less burst respiration, likely caused by a greater part of the organic matter being more resistant to breakdown [13]. Differences also arise within a region. For 47 corn fields across Georgia and Virginia, burst respiration was related linearly to SOC for the majority of sites, whereas other sites showed a pronounced difference in this relationship [14]. For 30 Australian soils ranging from 3–76% clay, burst respiration was not related to clay content over 7 days after rewetting of air-dried soil, but a negative impact of clay on respiration was noted for the following 7–17 days of incubation; the study concluded that clay does not restrict respiration of labile substrates, but that it can restrict breakdown of more recalcitrant organic matter [15].
The aim of the present study was to better understand the relationship between burst respiration and SOC. In turn, the hope was to gain insight into the value of measurement of CO2 released after rewetting air-dried soil as a tool to evaluate soil microbial activity and as an indicator of soil health. To investigate the consistency among sites for the relationship between burst respiration and SOC within a defined region, studies were undertaken at two scales: regionally, at three well-separated pasture sites; and locally, at three crop fields on a single farm. To obtain a wide range of values for SOC within each pasture, cores were taken across 100 cm depth and divided into depth intervals. Sufficient spatial variation in SOC was used to evaluate the crop fields, restricting the crop field samples to a 0–5 cm depth interval, and noting soil clay content for each sample.
2. Materials and Methods
For the pasture study, soil samples were collected from June to August of 2020 from the Brookdale Research Pasture (BRP) of Manitoba Beef and Forage Initiatives (https://www.mbfi.ca/farm-station), located 20 km north of Brandon, Manitoba, Canada. BRP has been described previously [16]. In brief, the 72 ha site was maintained as pasture in a grazing trial running from 2016 to 2021, inclusive. Seven replicates designated A to G varied in size from 4.4 ha to 16.6 ha, and each had approximately equal portions managed as season-long grazing or rotational grazing. However, the portion of D with season-long grazing was not accessible in 2020, and so it was omitted from the study. Three 100-cm deep soil cores of 50-mm diameter were collected from each of the available 13 experimental units across the site, giving 39 cores in total. The location for the three cores within each of the 13 experimental units was determined using coordinates generated with random numbers. Each core was collected using a truck-mounted hydraulic coring system. Compaction of cores was monitored by measuring the length of core recovered and the depth of the hole formed. Cores with compaction exceeding 10% were discarded, with a replacement core taken at fresh coordinates. Mean compaction for accepted cores was 4%. Cores were divided in the field into the following depth intervals: 0–15 cm, 15–30 cm, 30–60 cm, and 60–100 cm. The 39 cores thereby generated 156 soil samples, which were returned to the laboratory in separate bags. Soil samples were air-dried and passed through a 2-mm screen. Cores were similar among grazing treatments for SOC and burst respiration, and so evaluation of grazing systems is not considered further in this study.
Six identical 100-cm cores were also taken similarly over the same period in 2020 from each of two commercial pastures, generating an additional 24 soil samples for each. Pasture A was located near Lauder, Manitoba, Canada (https://en.wikipedia.org/wiki/Lauder,_Manitoba). Pasture B was located near Hargrave, Manitoba, Canada (https://en.wikipedia.org/wiki/Hargrave,_Manitoba). Together with BRP, the two commercial pastures formed a triangle of side length approximately 100 km. The field areas sampled were 3 ha at Pasture A and 16 ha at Pasture B, and each had been maintained long-term under rotational grazing.
For the pasture study, a subsample from each 2-mm sieved soil was ground by pestle and mortar to pass a 0.5-mm screen, before determination of SOC by loss on ignition for 16 hours at 400ºC [17]. For determination of respiration, a separate subsample of air-dried soil that had passed the 2-mm screen was used. A mass of air-dried soil equivalent to 20 g oven-dry mass was transferred to a 125-ml Erlenmeyer flask and brought to 25 g moist mass, corresponding to 0.25 g H2O g-1 oven-dry mass. Measurement of CO2 evolved used the titration method [18], as follows. An incubation period of one week was selected following rewetting, so that both the pulse of respiration could be characterized and an estimate made of the quantity of organic carbon mineralized over a week following rewetting. The rewetted soil was incubated in the dark for seven days in the sealed flask, along with an inserted tube containing 10 ml 0.2M NaOH. Following incubation, remaining NaOH was titrated against 0.2M HCl using phenolphthalein indicator. Blank flasks without soil were subtracted from experimental determinations. Particle-size analysis was undertaken for each pasture site using additional soil samples collected with a 0–15 cm soil probe, followed by determination using the hydrometer method [19].
For the study in crop fields, soil samples were taken from 0–5 cm as part of a previously described experiment on tillage [20]. Briefly, four tillage systems were imposed in a randomized complete block with four replicates, the experiment repeated in each of three fields at the same farm in Portage la Prairie, Manitoba. Fields were coded by number in relation to respective rotations, for 2021 and 2022, as follows: Field 2, corn-canola; Field 5, canola-soybean; and Field 7, soybean-corn. Three sample dates were spring 2021, fall 2021, and spring 2022. Thereby, for the data presented here, n = 48 for each field. Tillage effects were previously evaluated for a number of response variables, with focus on soil nitrate [20], and they are not further discussed here. The present analysis of the crop fields at Portage la Prairie considers responses of burst respiration to both SOC and soil clay on a field-by-field basis across replicates, tillage treatments, and times. Analytical methods for the crop field were similar-or-different to those of the pastures described above, as follows: soil clay used the identical hydrometer method [19], SOC was determined by an equivalent protocol for loss on ignition [21], but burst respiration in this case used the Solvita method [5], with CO2 release over the initial incubation period of 24 hours, as provided commercially by Agivse Laboratories, North Dakota, USA. The use of NaOH titration to determine CO2 release for the pasture sites and the use of Solvita gel to determine CO2 release for the crop fields resulted from the combining of two originally separate studies to generate a larger body of data and allow comparisons among varied field systems.
The responses of burst respiration to both SOC and clay content was determined in all cases by linear regression. Slopes and intercepts were compared by analysis of covariance [22] for the three pastures and separately for the three crop fields.
3. Results
Burst respiration at each pasture site was greatest for soil in the top 15 cm, with values decreasing in order for each incremental interval of depth (Figure 1). Visual inspection of core samples prior to sieving indicated that root occurrence was sparse below 30 cm depth. However, soils collected from 30–60 cm and 60–100 cm released an average of 7–21 mg CO2-C kg-1 d-1 (Figure 1). As expected, shallow depths had more SOC: 25–80 g kg-1 was recorded in the top 15 cm, whereas 5–17 g kg-1 was recovered from 60-100 cm in the profile (Figure 2). Taking a weighted average for the presented data (Figure 1) over pastures, burst respiration was 45 mg CO2–C kg-1 day-1 for 0–30 cm but only 19 mg CO2–C kg-1 day-1 for 30–100 cm, so that approximately twice the respiration per unit soil was found in the upper layer. The relationship between burst respiration and SOC across depths at BRP was linear (Figure 2) and significant at the level of P <0.001 (Table 1a), with respiration ranging from 2–40 mg CO2-C kg-1 d-1 (Figure 2). Using the slope of 0.495 mg C g-1 C day-1 from the regression for BRP (Figure 2), the proportion of SOC respired of 7 days was (0.495 x 7) / 1000 = 0.0035, or 0.4%. Thereby, 0.4% of SOC was released by burst respiration over a week at BRP. Corresponding regressions were also significant at Pasture A (Table 1b) and Pasture B (Table 1c), but the linear equations were distinct by site (Figure 3); to compare slopes, F2,198 = 5.53 with P = 0.0046; to compare elevations, F2,200 = 145. 65 with P<0.001. Pasture A was decidedly sandier than the other two pastures (Table 2), with both BRP and Pasture B falling under the designation sandy loam (Table 2).
For the crop fields study, burst respiration was proportional to SOC (Figure 4), with correlations significant (Table 3) yet distinct for each field in terms of slope elevation: to compare slopes, F2,138 = 2.94 with P = 0.056; to compare elevations, F2,140 = 12. 96 with P<0.001. Clay percentage varied from 14% to 38%, but burst respiration was not related to clay percentage across the three fields; F1,142 = 0.2 with P = 0.65.
4. Discussion
The range of SOC from 0–80 g C kg-1 across depths in the pasture systems (Figure 2 and Figure 3) was greater than for the crop fields, which had from 34–58 g C kg-1 (Figure 4), doubtless caused by the shallow depth of 0–5 cm for sampling in the crop fields. Nonetheless, this range in SOC for the crop fields was sufficient to explore the relationship between SOC and burst respiration.
Consistency of the linear response of burst respiration to SOC across pasture depths (Figure 2) suggests that the form of SOC is similar from the surface to 100 cm for the prairie-derived pasture systems here studied. Considering the depth interval 0–40 cm for a temperate forest soil, deeper layers within this interval had organic matter that was both of greater density and was associated with mineral surfaces, the shallow layers having organic matter that was less dense and not associated with mineral surfaces [23]. Foliage inputs to the soil surface of temperate forests doubtless contribute to this effect. In contrast, below-ground inputs from roots are of greater importance for prairie soils [24], possibly explaining the consistency in soil organic matter across depths in the present study.
Values for burst respiration averaged over seven days (Figure 2 and Figure 3), as found here in the range 2–45 mg CO2-C kg-1 d-1, were in keeping with those previously reported: from 4–18 mg CO2-C kg-1 d-1 over 25 days [25], and from 7–43 mg CO2-C kg-1 d-1 over six days [7]. Respiration rates are typically higher over the initial 24 hours following rewetting: from 5–80 mg CO2-C kg-1 d-1 [5], and from 20–100 mg CO2-C kg-1 d-1 [26]. Rates for the commercial method uses here (Figure 4) in some cases exceeded 200 mg CO2-C kg-1 d-1, in keeping with the 24-hour monitoring period used.
The amounts of CO2 released in the present study by soil samples from depth intervals below 30 cm stand in contrast to greatly reduced respiration from samples below similar depths reported in North Carolina [27]. Averaged over pastures (data from Figure 1), respiration in the present study from 30–100 cm was close to 50% of that seen for 0–30 cm. However, respiration for shallow depth in the North Carolina study was several-fold greater than the CO2 released from below 30 cm [28]. The prairie origin of the Manitoba pastures studied here, with concomitant depth enrichment of soil organic matter by root inputs [28], likely explains this difference.
Using the slope of the regression obtained for the BRP site (Figure 2), calculation indicated 0.4% of SOC was respired over seven days following rewetting. Similar values were reported for soils of Alberta and British Columbia, with mean annual temperature 2ºC, where 0.5% and 0.8% of SOC was respired over 72 hours after rewetting of air-dried soil [28]. In contrast, soils from the considerably warmer climates of Texas and Georgia, with mean annual temperature of 17–18ºC, had corresponding values of 1.0% and 1.5%, respectively [28]. Estimates of microbial biomass carbon range from 0.5% to 2.7% of soil organic carbon [12,29]. Expiration of soil microbes caused by soil drying [2], along with concomitant release of water-soluble carbon upon rewetting [1], likely contribute to the respiration pulse. The decrease in respiration seen when repeated cycles are applied for air-drying and rewetting [25] can thus be attributed to substrate exhaustion. The 0.4% of SOC found here to be released as burst respiration aligns with a part of soil microbial biomass, recorded as 2.5–2.8% for BRF [16]. Our data are consistent with the broader interpretation of accumulation of amino acids and monosaccharides, both extracellularly in soil [30] and within microbe cells [31], which fuel respiration on rewetting. Indeed, the appearance in burst CO2 of label from 13C-glucose added at rewetting was delayed compared to native C [32], showing that the substrate for the initial burst response is labile C present before the water is added.
The linear relationship between burst respiration and SOC varied considerably among pasture sites within the same climate region here studied. A negative effect of increasing soil clay content on soil respiration following rewetting of air-dried soil was found for five Georgia soils varying from 30–350 mg clay g-1 in the Ap horizon [33]. However, for the present study, soil texture was not related consistently to the slope of the response of burst respiration to SOC among pasture sites. Both BRP and Pasture B had similar textural classification as sandy loam, yet the slope of the response of burst respiration to SOC was greater for Pasture B than for BRP. Also, burst respiration was not related to soil texture for the crops field studied here. Thereby, it seems that the quality of the soil organic matter, and not soil texture, is the most likely cause of the site-specific relationship of burst respiration and SOC as found here among regions and among fields on a single farm. Such factors are likely to include the form of organic inputs to soil, as affected by management history for crops, forages, and cattle. To illustrate, organic input from wheat management gave a stronger burst respiration than organic input from pasture [34]. The large number of potential variables precludes any attempt to discern among features of management for the present study.
Consideration of management practices to promote soil health is normally focused on yield, but outcomes of management can vary regionally [35]. Measurement of burst respiration to quantify soil health is well established [36], but SOC might instead be used as an indicator at particular sites. The linear relationship between SOC and burst respiration might be taken as an index of soil health for a given location. SOC is related to productivity both globally [37] and regionally [38], although considerable variation exists from the impact of many factors on yield. For example, crop rotation may not change SOC in the short term. Yet, that rotation can act to sustain yields under pressure from pests, pathogens, and weeds [39]. Where SOC is taken as an indicator for soil health at a site, the present data suggest that soil depths to 100 cm might be considered for a prairie location, although sampling within the depth of the plow layer would be not just acceptable but also more practical and of wider applicability to many systems. However, to compare among sites regionally, and even among fields on the same farm, the measurement of burst respiration appears to be a more sensitive measure of microbial activity than SOC. Thereby, CO2 evolved after rewetting of air-dried soil seems to provide broader utility to estimate soil health, rather than just measuring SOC.
Funding
This research was funded by the Canadian Agricultural Partnership with Project Task Number 1000219884, Study 227247 of the Canadian Agricultural Partnership, and funds from both the Manitoba Pulse and Soybean Growers and the Manitoba Corn Growers Association.
Data Availability Statement
Data supporting reported results presented herein are held by TPM and SJC.
Acknowledgments
Thank you to all staff at BRP, which is operated by Manitoba Beef and Forage Initiatives. Gratitude is also extended to the producers at Pasture A and Pasture B.
Conflicts of Interest
The authors declare no conflict of interest.
References
- Guo, Z.; Drury, C.F.; Yang, X.; Reynolds, W.D. Water-soluble carbon and the carbon dioxide pulse are regulated by the extent of soil drying and rewetting. Soil Sci. Soc. Am. J. 2014, 78, 1267–1278. [Google Scholar] [CrossRef]
- Barnard, R.L.; Blazewicz, S.J.; Firestone, M.K. Rewetting of soil: revisiting the origin of CO2 emissions. Soil Biol. Biochem. 2020, 147, 107819. [Google Scholar] [CrossRef]
- Birch, H.F. The effect of soil drying on humus decomposition and nitrogen availability. Plant Soil 1958, 10, 9–31. [Google Scholar] [CrossRef]
- Franzluebbers, A.J.; Haney, R.L.; Hons, F.M.; Zuberer, D.A. Determination of microbial biomass and nitrogen mineralization following rewetting of dried soil. Soil Sci. Soc. Am. J. 1996, 60, 1133–1139. [Google Scholar] [CrossRef]
- Haney, R.L.; Brinton, W.F.; Evans, E. Soil CO2 respiration: comparison of chemical titration, CO2 IRGA analysis and the Solvita gel system. Renew. Ag. Food Syst. 2008, 23, 171–176. [Google Scholar] [CrossRef]
- Bean, G.M.; Kitchen, N.R.; Veum, K.S.; Camberato, J.J.; Ferguson, R. B.; Fernandez, F.G.; Franzen, D.W.; Laboski, C.A.M.; Nafziger, E.D.; Sawyer, J.E.; Yost, M. Relating four-day soil respiration to corn nitrogen fertilizer needs across 49 U.S. Midwest fields. Soil Sci. Soc. Am. J. 2020, 84, 1195–1208. [Google Scholar] [CrossRef]
- Marando, G.; Jimenez, P.; Rosa, R.; Julia, M.; Ginovart, M.; Bonmati, M. Effects of air-drying and rewetting on extractable organic carbon, microbial biomass, soil respiration, and β-glucosidase and β-galactosidase activities of minimally disturbed soils under Mediterranean conditions. In Soil enzymology in the recycling of organic wastes and environmental restoration; Trasar-Cepeda, C., Ed.; Springer-Verlag: Berlin, Germany, 2012. [Google Scholar]
- Karlen, D.L.; Mausbach, M.J.; Doran, J.W.; Cline, R.G.; Harris, R.F.; Schuman, G.E. Soil quality: a concept, definition, and framework for evaluation (a guest editorial). Soil Sci. Soc. of Am. J. 1997, 61, 4–10. [Google Scholar] [CrossRef]
- Zornoza, R.; Acosta, J.A.; Bastida, F.; Domínguez, S.G.; Toledo, D.M.; Faz, A. Identification of sensitive indicators to assess the interrelationship between soil quality, management practices and human health. Soil 2015, 1, 173. [Google Scholar] [CrossRef]
- Gonzalez-Quinones, V.; Stockdale, E.A.; Banning, N.C.; Hoyle, F.C.; Sawada, Y.; Wherrett, A.D.; Jones, D.L.; Murphy, D.V. Soil microbial biomass—interpretation and consideration for soil monitoring. Soil Res. 2011, 49, 287–304. [Google Scholar] [CrossRef]
- Franzluebbers, A.J. Short-term C mineralization (aka the flush of CO2) as an indicator of soil biological health. CABI Reviews: perspectives in agriculture, veterinary science, nutrition, and natural resources. 2018, 13, 17. [Google Scholar]
- McGonigle, T.P.; Turner, W.G. Grasslands and croplands have different microbial biomass carbon levels per unit of soil organic carbon. Agriculture 2017, 7, 57. [Google Scholar] [CrossRef]
- Franzluebbers, A.J.; Haney, R.L.; Honeycutt, C.W.; Schomberg, H.H.; Hons, F.M. Flush of carbon dioxide following rewetting of dried soil relates to active organic pools. Soil Sci. Soc. Am. J. 2000, 64, 613–623. [Google Scholar] [CrossRef]
- Franzluebbers, A.J.; Pershing, M.R.; Crozier, C.; Osmond, D.; Schroeder-Moreno, M. Soil-test biological activity with the flush of CO2: I. C and N characteristics of soils in corn production. Soil Sci. Soc. Am. J. 2018, 82, 685–695. [Google Scholar] [CrossRef]
- Wang, W.J.; Dalal, R.C.; Moody, P.W.; Smith, C.J. Relationships of soil respiration to microbial biomass, substrate availability and clay content. Soil Biol. Biochem. 2003, 35, 273–284. [Google Scholar] [CrossRef]
- Liddle, K.; McGonigle, T.; Koiter, A. Microbe biomass in relation to organic carbon and clay in soil. Soil Syst. 2020, 4, 41. [Google Scholar] [CrossRef]
- Nelson, D.W.; Sommers, L.E. Total carbon, organic carbon, and organic matter. In Methods of Soil Analysis. Part 3. Chemical Methods; Sparks, D.L., Ed.; Soil Science Society of America: Madison, WI, USA, 1996. [Google Scholar]
- Zibilske, L.M. Carbon mineralization. In Methods of Soil Analysis. Part 2. Microbiological and biochemical properties; Weaver, R.W., Ed.; Soil Science Society of America: Madison, WI, USA, 1994. [Google Scholar]
- Gee, G.W.; Or, D. Particle-size analysis. In Methods of soil analysis. Part 4. Physical methods, Dane, G.H., Topp, G.C., Eds.; Soil Science Society of America, Madison, WI, USA, 2002; pp. 255–293.
- Crittenden, S.; Cavers, C.; Xing, Z. The effect of four tillage systems on agronomic properties and soil health indicators in southern Manitoba. Can. J. Soil Sci. 2024, 104, 273–282. [Google Scholar] [CrossRef]
- Combs, S.M.; Nathan, M.V. Soil organic matter. In Recommended chemical soil test procedures for the North Central Region; North Central Regional Research Publication, Missouri Agricultural Experimental Station SB1001, 2015.
- Zar, J.H. Statistical methods, 5th ed.; Pearson: Upper Saddle River, New Jersey, USA, 2010. [Google Scholar]
- Trumbore, S. Age of soil organic matter and soil respiration: radiocarbon constraints on belowground C dynamics. Ecol. Appl. 2000, 10, 399–411. [Google Scholar] [CrossRef]
- Pennock, D.; Bedard-Haughn, A.; Viaud, V. Chernozemic soils of Canada: genesis, distribution, and classification. Can. J. Soil Sci. 2011, 91, 710–747. [Google Scholar] [CrossRef]
- Mikha, M.M.; Rice, C.W.; Milliken, G.A. Carbon and nitrogen mineralization as affected by drying and wetting cycles. Soil Biol. Biochem. 2005, 339–347. [Google Scholar] [CrossRef]
- Brinton, W.F. Laboratory soil handling affects CO2 respiration, amino-N and water stable aggregate results. Agri. Res. and Tech. 2020, 24, 53–61. [Google Scholar] [CrossRef]
- Franzluebbers, A.J. Probing deep to express root-zone enrichment of soil-test biological activity on southeastern U.S. farms. Agric. Environ. Lett. 2022, 7, e20087. [Google Scholar] [CrossRef]
- Franzluebbers, A.J.; Haney, R.L.; Honeycutt, C.W.; Arshad, M.A.; Schomberg, H.H.; Hons, F.M. Climatic influences on active fractions of soil organic matter. Soil Biol. Biochem. 2001, 33, 1103–1111. [Google Scholar] [CrossRef]
- Zagal, E. Measurement of microbial biomass in rewetted air-dried soil by fumigation-incubation and fumigation-extraction techniques. Soil Bio. Biochem. 1993, 25, 553–559. [Google Scholar] [CrossRef]
- Warren, C.R. Response of osmolytes in soil to drying and rewetting. Soil Biol. Biochem. 2014, 70, 22–32. [Google Scholar] [CrossRef]
- Warren, C.R. Do microbial osmolytes or extracellular depolymerization products accumulate as soil dries. Soil Biol. Biochem. 2016, 98, 54–63. [Google Scholar] [CrossRef]
- Smith, M.L.; Weitz, K.K.; Thompson, A.M.; Jansson, J.K.; Hofmockel, K.L.; Lipton, M.S. Real-time and rapid respiratory response of the soil microbiome to moisture shifts. Microorganisms 2023, 11, 2630. [Google Scholar] [CrossRef] [PubMed]
- Franzluebbers, A.J. Potential C and N mineralization and microbial biomass from intact and increasingly disturbed cores of varying texture. Soil Biol. Biochem. 1999, 31, 1083–1090. [Google Scholar] [CrossRef]
- Shi, A.; Marschner, P. Drying and rewetting frequency influences cumulative respiration and its distribution over time in two soils with contrasting management. Soil Biol. Biochem. 2014, 72, 172–179. [Google Scholar] [CrossRef]
- Miner, G.L.; Delgado, J.A.; Ippolito, J.A.; Stewart, C.E. Soil health management practices and crop productivity. Agric. Environ. Lett. 2020, 5, e20023. [Google Scholar] [CrossRef]
- Sparda, A.; Miller, R.O.; Anderson, G.; Hsieh, Y.-P. Real-time soil CO2 respiration rate determination and the comparison between the infrared gas analyzer and microrespirometer (MicroRes®) methods. Comm. Soil Sci. Plant Anal. 2017, 48, 2. [Google Scholar] [CrossRef]
- Oldfield, E.E.; Bradford, M.A.; Wood, S.A. Global meta-analysis of the relationship between soil organic matter and crop yields. Soil 2019, 5, 15–32. [Google Scholar] [CrossRef]
- Oldfield, E.E.; Bradford, M.A.; Augarten, A.J.; Cooley, E.T.; Radatz, A.M.; Radatz, T.; Ruark, M.D. Positive associations of soil organic matter and crop yields across a regional network of working farms. Soil Sci. Soc. Am. J. 2022, 86, 384–397. [Google Scholar] [CrossRef]
- Bowles, T.M.; Mooshammer, M.; Socolar, Y.; Calderon, F.; Cavigelli, M.A.; Culman, S.W.; Deen, W.; Drury, C.F.; Garcia y Garcia, A.; Gaudin, A.C.M.; Harkcom, W.S.; Lehman, R.M.; Osborne, S.L.; Robertson, G.P.; Salerno, J.; Schmer, M.R.; Strock, J.; Grandy, A.S. Long-term evidence shows that crop-rotation diversification increases agricultural resilience to adverse growing conditions in North America. One Earth 2020, 2, 284–293. [Google Scholar] [CrossRef]
Figure 1.
Mean respiration after rewetting of air-dried soil, in relation to depth interval and site. For BRP, n = 39; for Pasture A and Pasture B, n = 6.
Figure 1.
Mean respiration after rewetting of air-dried soil, in relation to depth interval and site. For BRP, n = 39; for Pasture A and Pasture B, n = 6.
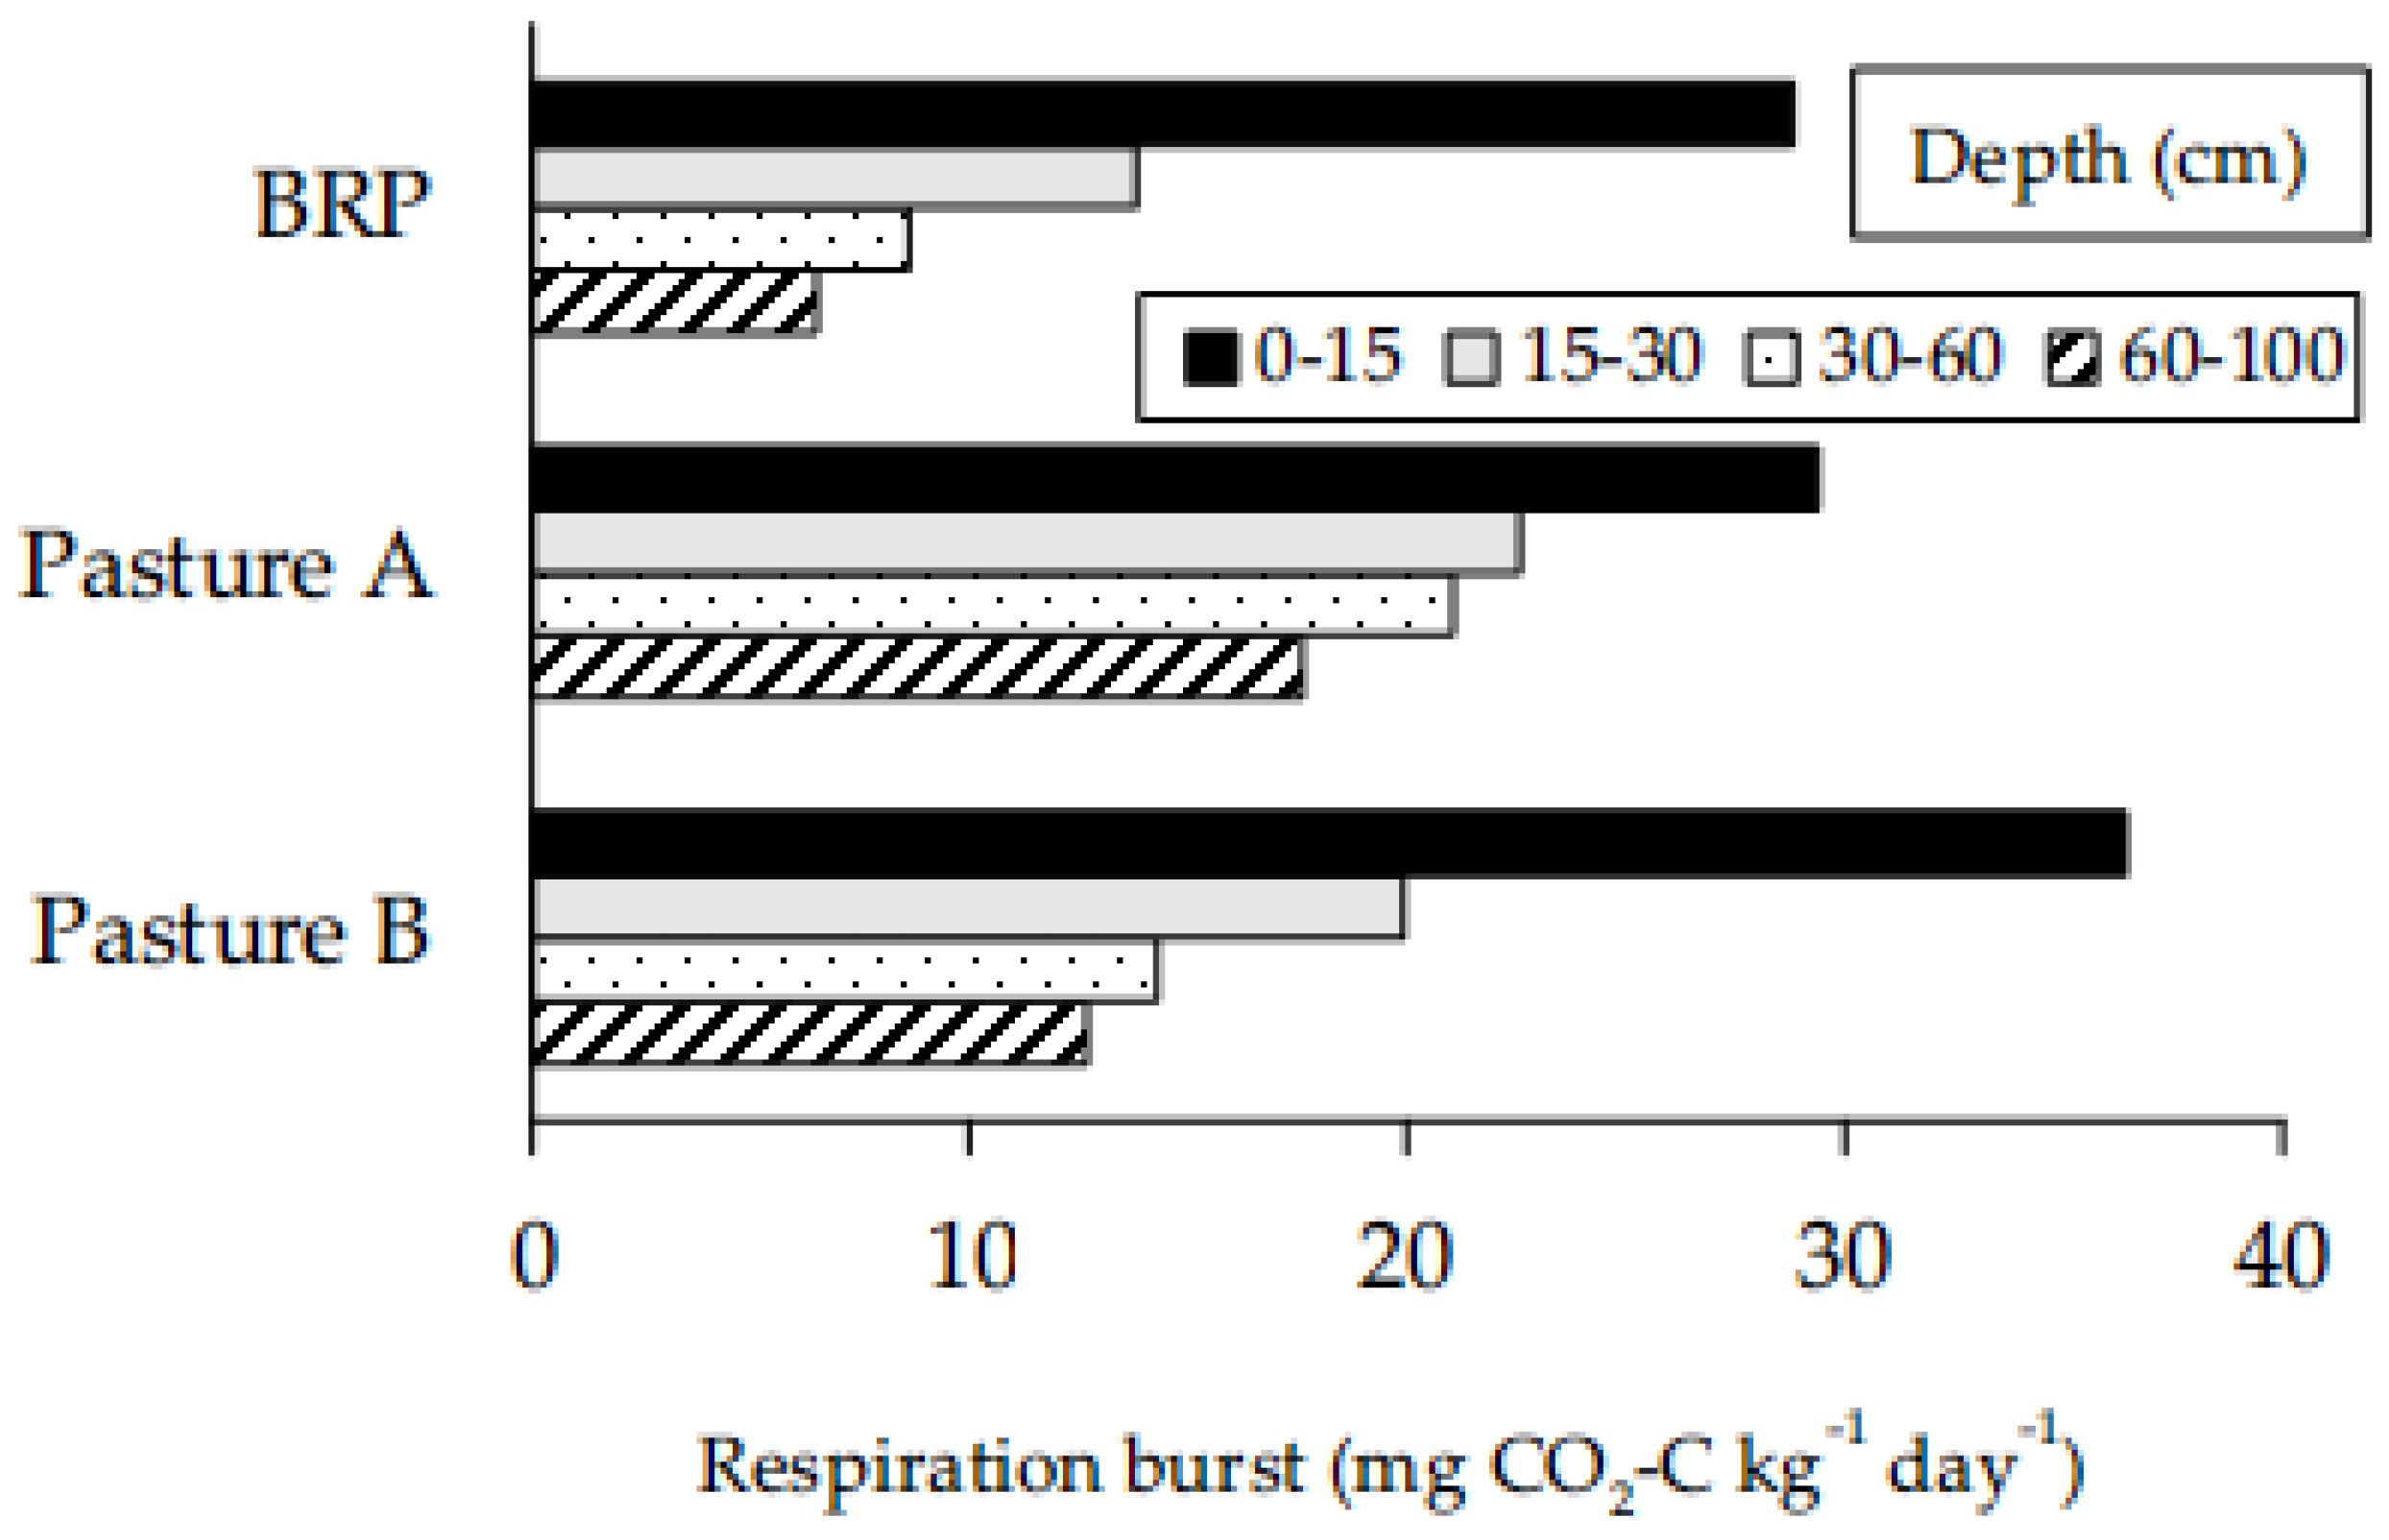
Figure 2.
Respiration following rewetting of air-dried soil in relation to SOC for 39 cores taken to 100 cm at BRP and divided into the depth intervals as shown. The regression line is given for y = 2.2 + 0.495x, with r2 = 0.81 and n = 156.
Figure 2.
Respiration following rewetting of air-dried soil in relation to SOC for 39 cores taken to 100 cm at BRP and divided into the depth intervals as shown. The regression line is given for y = 2.2 + 0.495x, with r2 = 0.81 and n = 156.
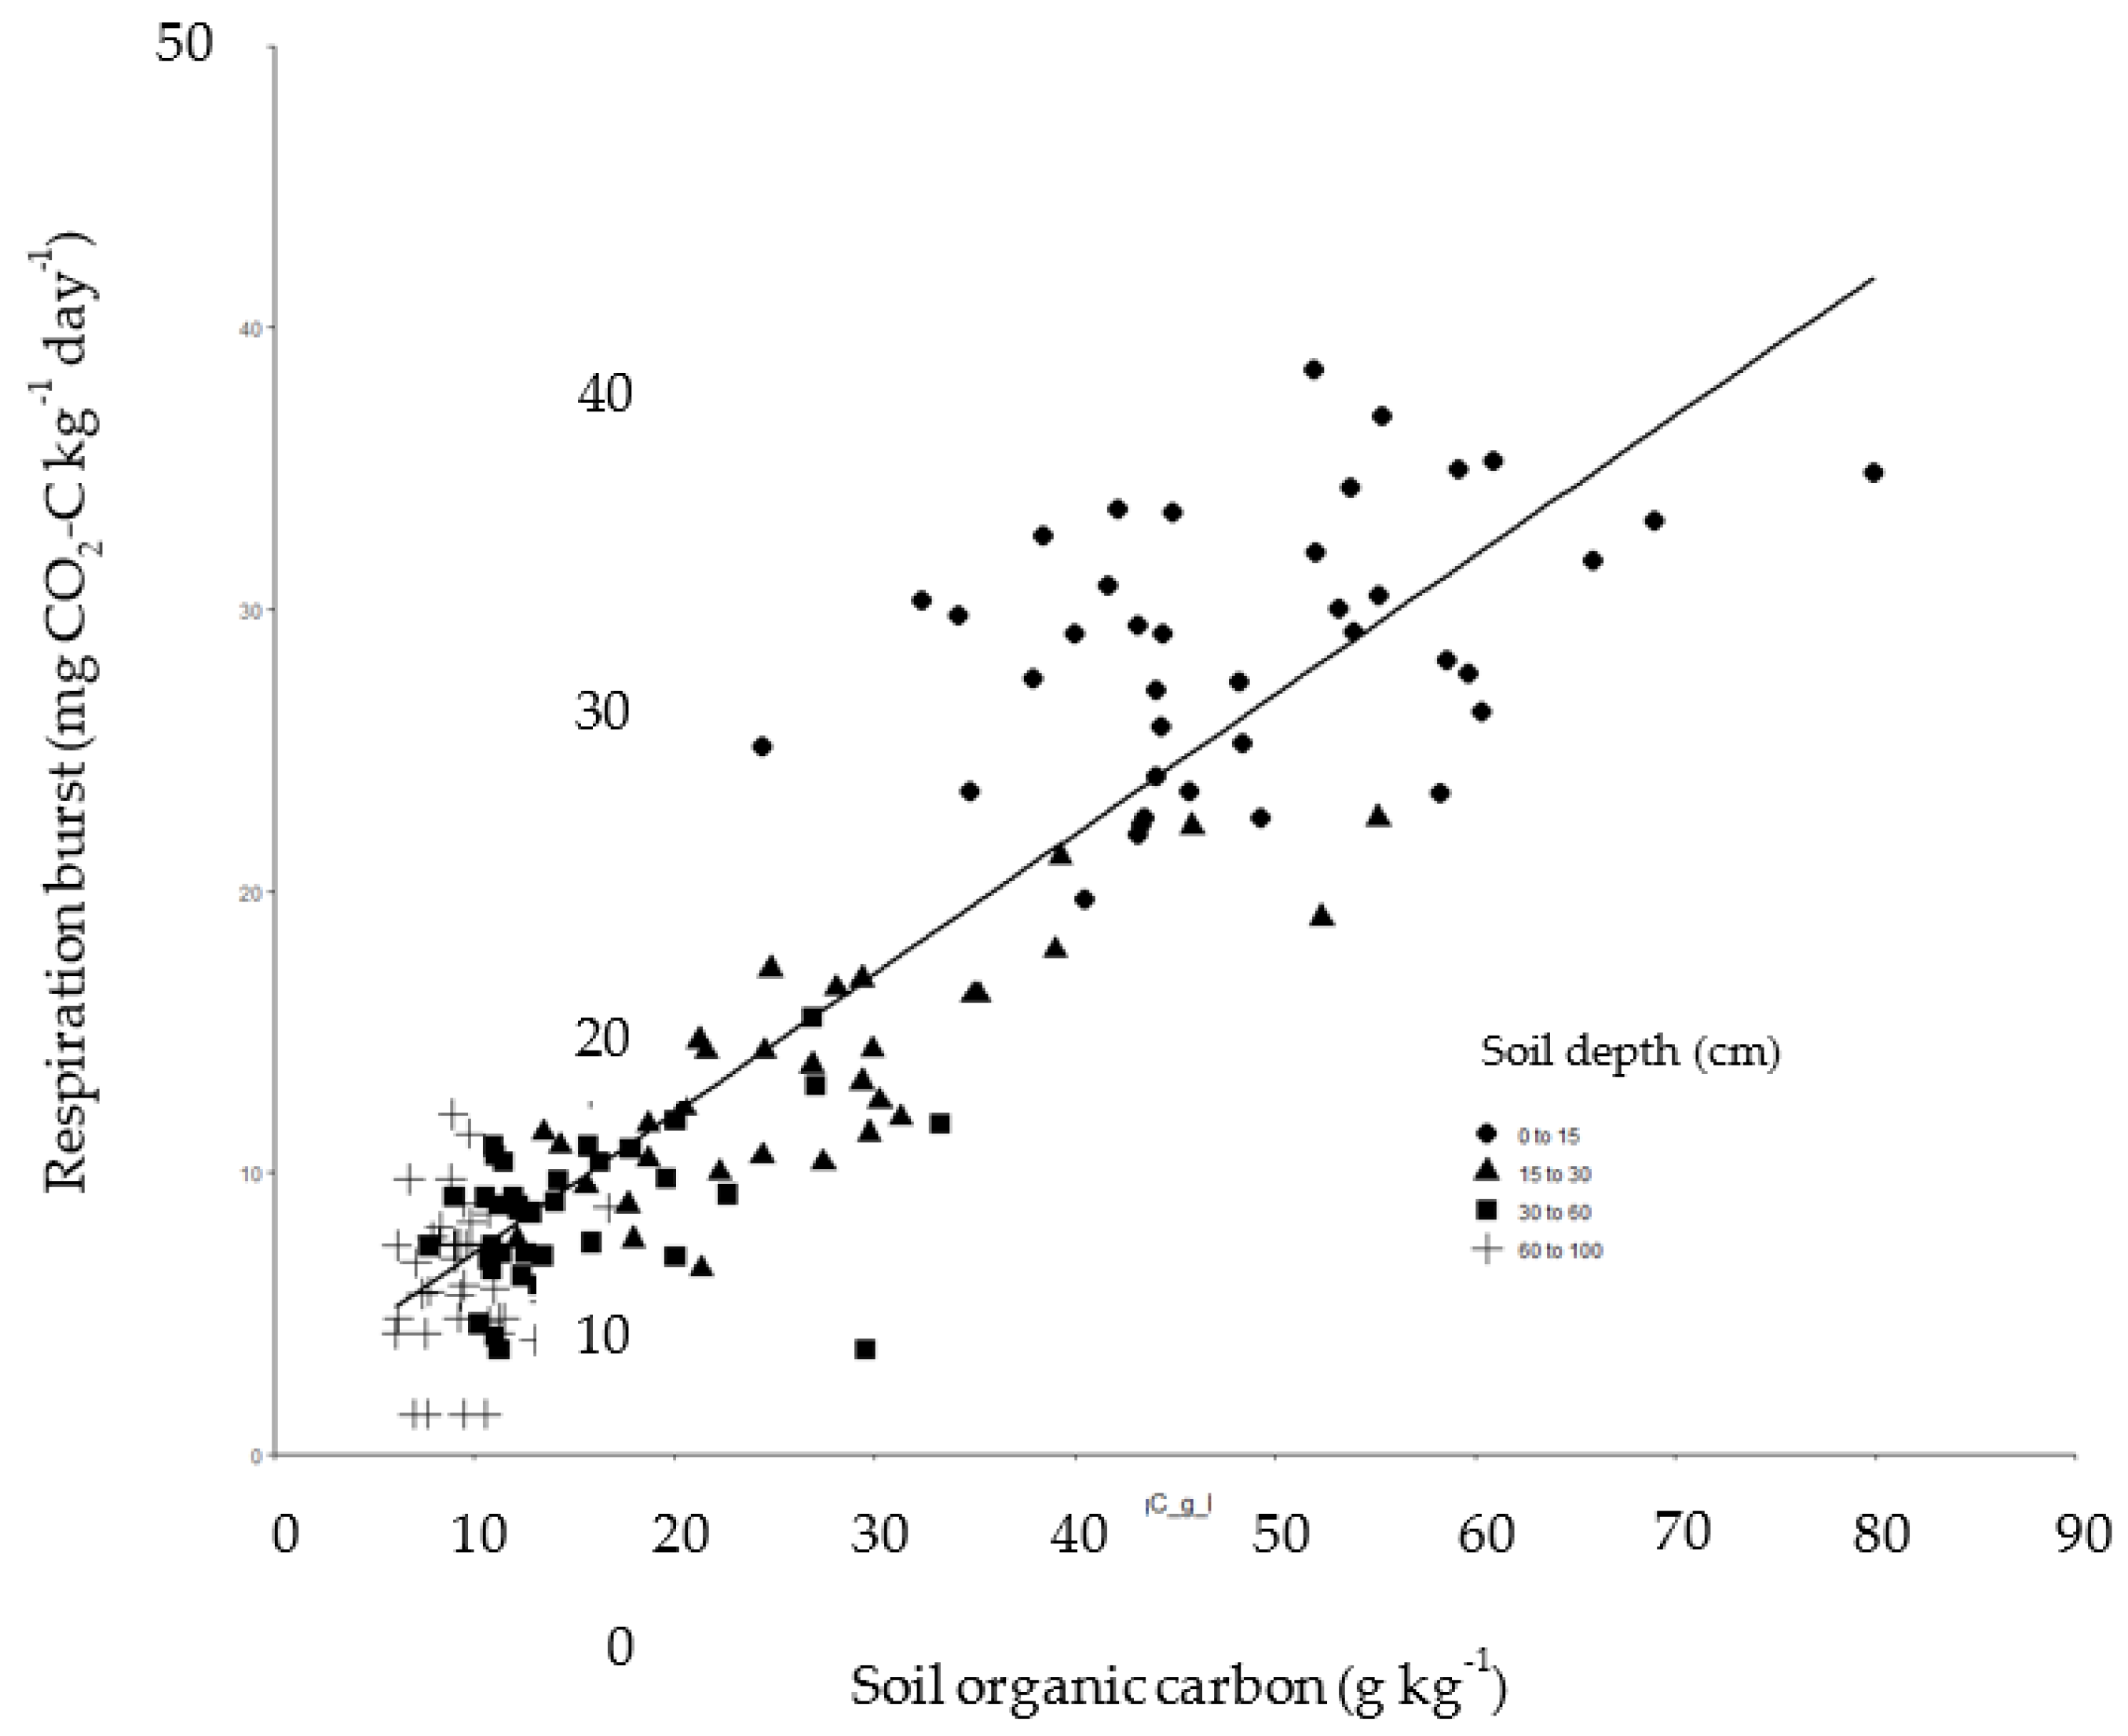
Figure 3.
Respiration following rewetting of air-dried soil in relation to SOC for six cores taken to 100 cm at each of Pasture A and Pasture B and divided into the same depth intervals as used for BRP. To simplify, depth intervals are not noted by legend. The regression lines are as follows: for Pasture A with solid line and solid-circle symbols, y = 13.0 + 0.941x, with r2 = 0.75 and n = 24; for Pasture B with dotted line and X symbols, y = 8.2 + 0.640x, with r2 = 0.71 and n = 24. For comparison, the regression line for BRP is shown as a dashed line, but with the data points for BRP as previously given in Figure 2 omitted here to provide clarity.
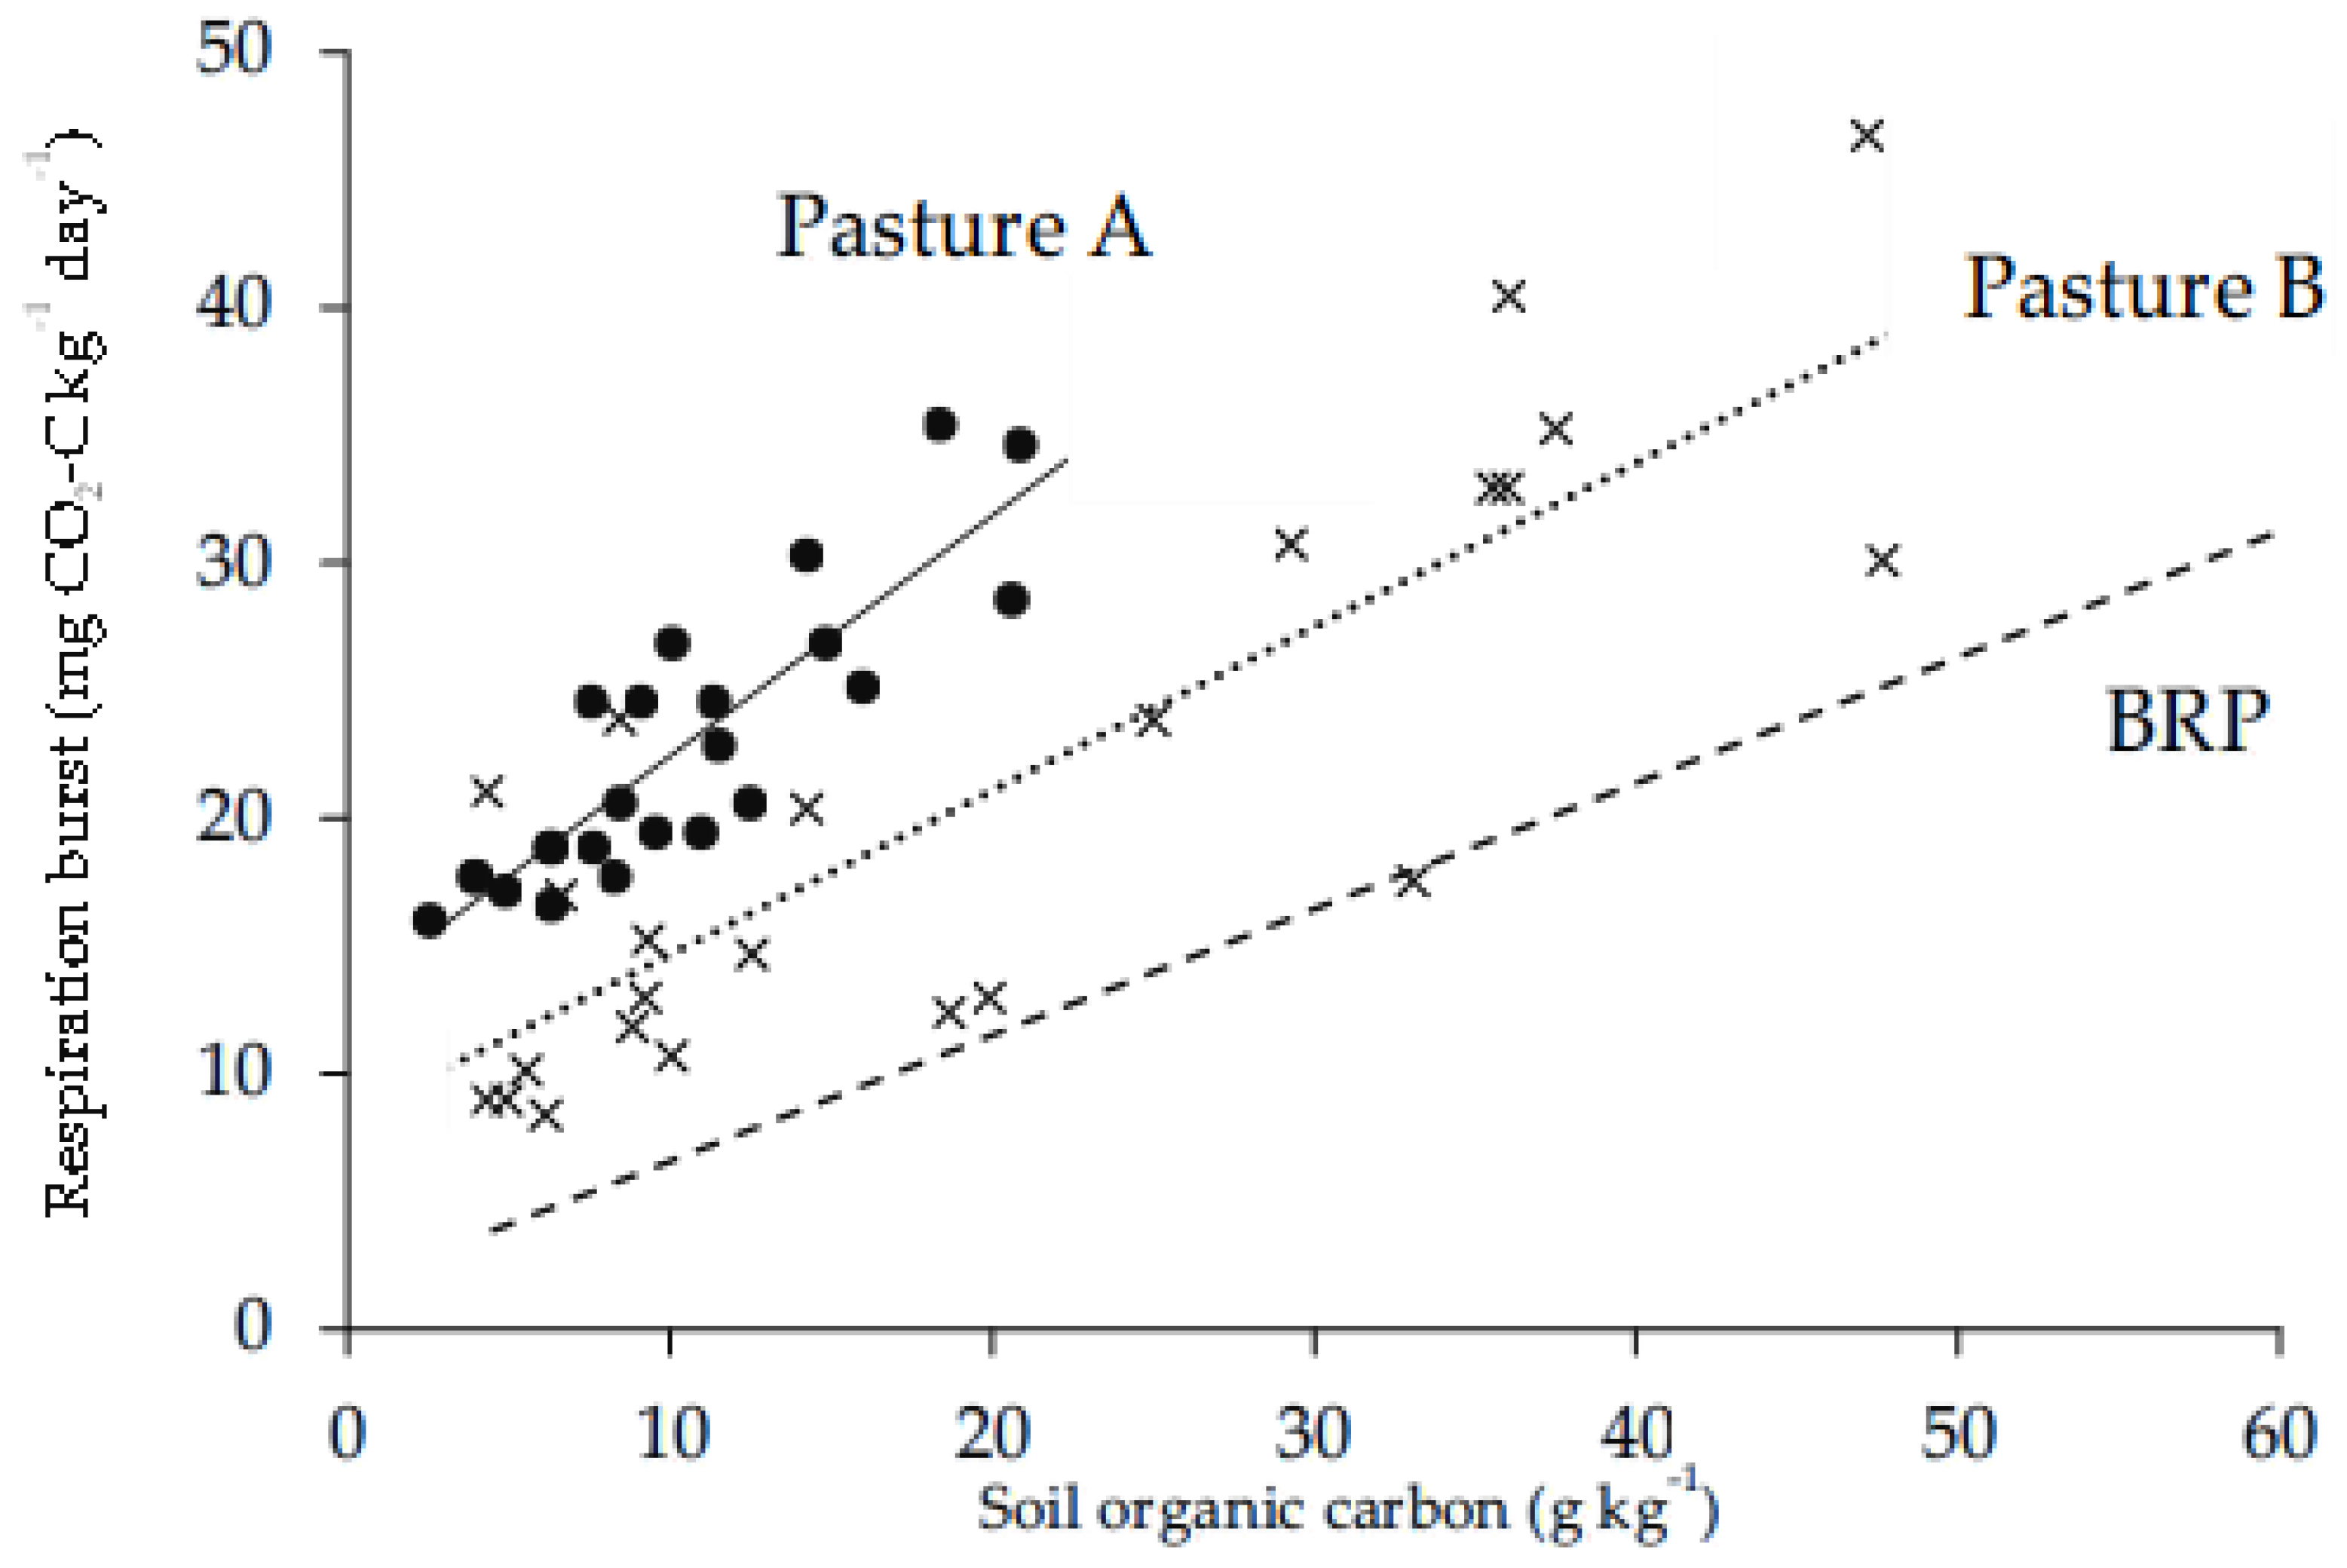
Figure 4.
Respiration following rewetting of air-dried soil in relation to SOC for 48 cores taken 0–5 cm at each of three crop fields on a single farm. The r2 values are (a) 0.25 for Field 2, 0.33 for Field 5, and 0.28 for Field 7.
Figure 4.
Respiration following rewetting of air-dried soil in relation to SOC for 48 cores taken 0–5 cm at each of three crop fields on a single farm. The r2 values are (a) 0.25 for Field 2, 0.33 for Field 5, and 0.28 for Field 7.
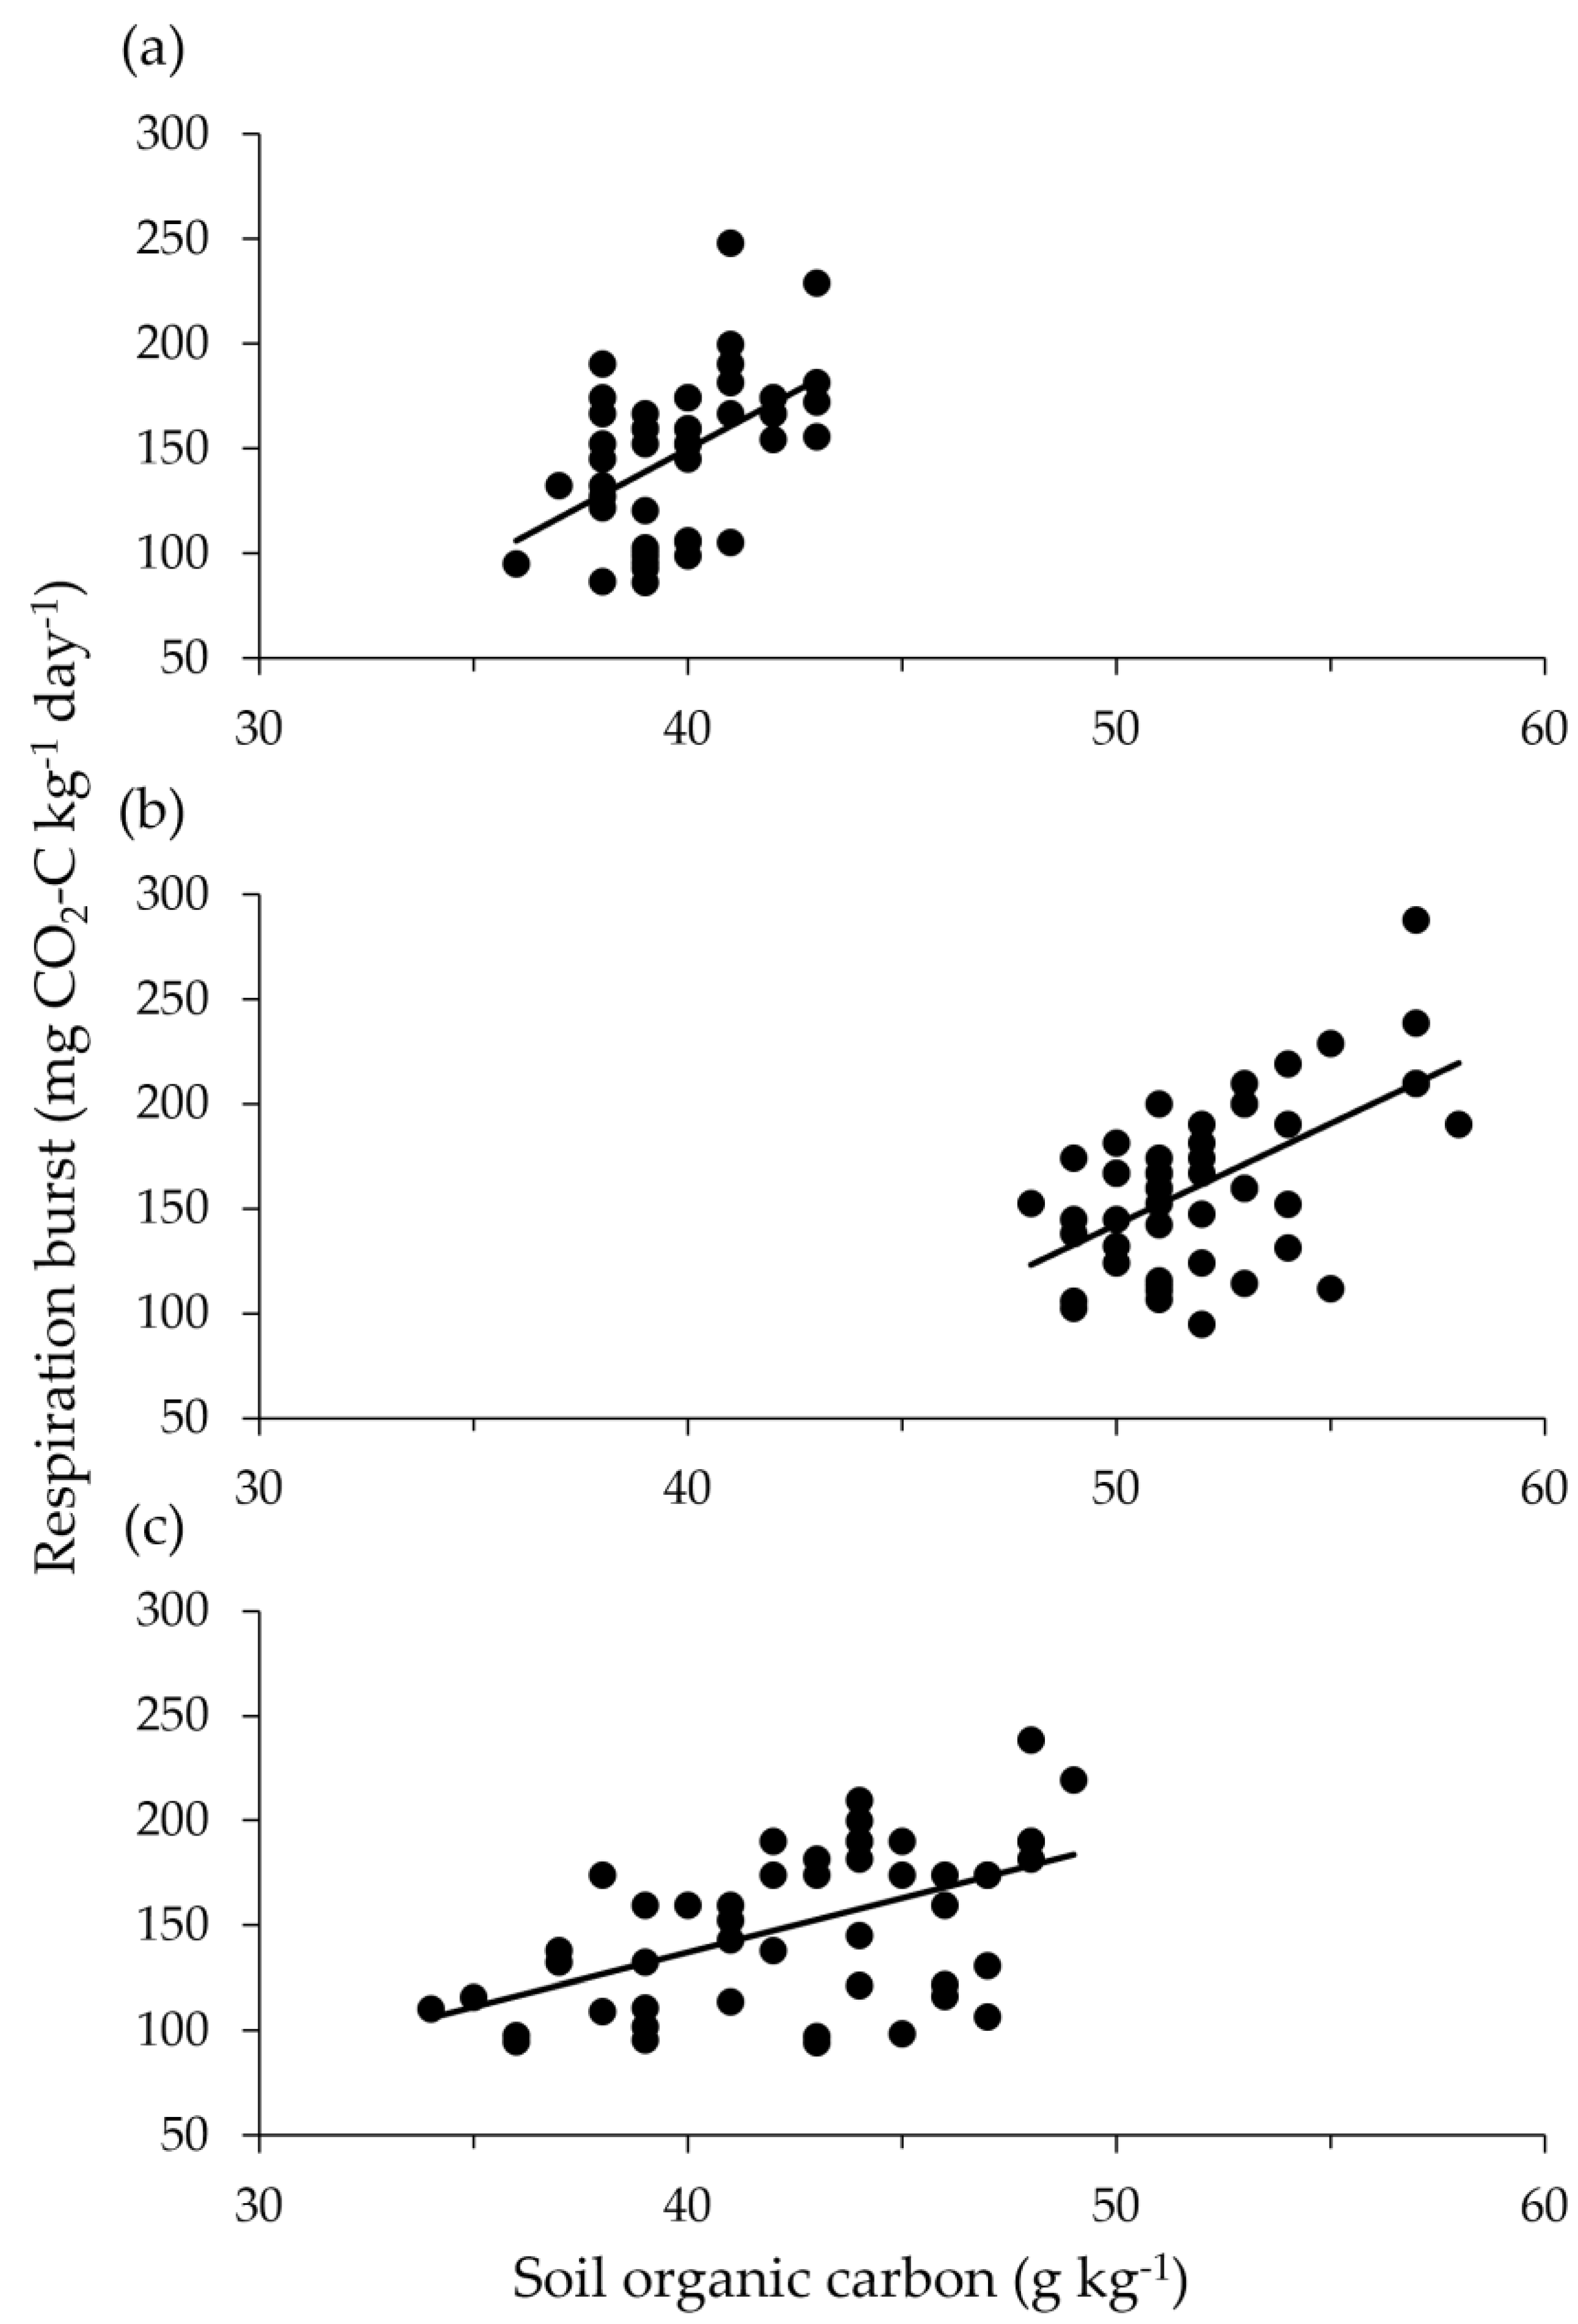

Table 1.
Linear regression analyses of variance for the plot of respiration after-rewetting of air-dried soil as a dependent variable against SOC for (a) BRP, (b) Pasture A, and (c) Pasture B.
Table 1.
Linear regression analyses of variance for the plot of respiration after-rewetting of air-dried soil as a dependent variable against SOC for (a) BRP, (b) Pasture A, and (c) Pasture B.
| (a) | |||||
| Source | DF | SS | MS | F | P |
| Regression | 1 | 11116.6 | 11116.6 | 642.5 | <0.001 |
| Residual | 154 | 2664.7 | 17.3 | ||
| Total | 155 | 13781.3 | |||
| (b) | |||||
| Source | DF | SS | MS | F | P |
| Regression | 1 | 535.9 | 535.9 | 67.6 | <0.001 |
| Residual | 22 | 174.4 | 7.9 | ||
| Total | 23 | 710.3 | |||
| (c) | |||||
| Source | DF | SS | MS | F | P |
| Regression | 1 | 1973.6 | 1973.6 | 53.3 | <0.001 |
| Residual | 22 | 814.9 | 37.0 | ||
| Total | 23 | 2788.5 | |||
Table 2.
Particle-size analysis for each pasture.
| Site | % sand | % silt | % clay | Texture |
| BRP | 54.7 | 29.6 | 15.7 | sandy loam |
| Pasture A | 90.0 | 4.2 | 5.8 | sand |
| Pasture B | 53.3 | 37.5 | 9.2 | sandy loam |
Table 3.
Linear regression analyses of variance for the plot of respiration after-rewetting of air-dried soil as a dependent variable against SOC for three crop fields: (a) Field 2, (b) Field 5, and (c) Field 7.
Table 3.
Linear regression analyses of variance for the plot of respiration after-rewetting of air-dried soil as a dependent variable against SOC for three crop fields: (a) Field 2, (b) Field 5, and (c) Field 7.
| (a) | |||||
| Source | DF | SS | MS | F | P |
| Regression | 1 | 15999.5 | 15999.5 | 15.1 | <0.001 |
| Residual | 46 | 48630.2 | 1057.2 | ||
| Total | 47 | 64629.7 | |||
| (b) | |||||
| Source | DF | SS | MS | F | P |
| Regression | 1 | 25268.2 | 25268.2 | 22.4 | <0.001 |
| Residual | 46 | 51937.3 | 1129.1 | ||
| Total | 47 | 77205.5 | |||
| (c) | |||||
| Source | DF | SS | MS | F | P |
| Regression | 1 | 19234.7 | 19234.7 | 17.9 | <0.001 |
| Residual | 46 | 49369.8 | 1073.3 | ||
| Total | 47 | 68604.5 | |||
Disclaimer/Publisher’s Note: The statements, opinions and data contained in all publications are solely those of the individual author(s) and contributor(s) and not of MDPI and/or the editor(s). MDPI and/or the editor(s) disclaim responsibility for any injury to people or property resulting from any ideas, methods, instructions or products referred to in the content. |
© 2025 by the authors. Licensee MDPI, Basel, Switzerland. This article is an open access article distributed under the terms and conditions of the Creative Commons Attribution (CC BY) license (http://creativecommons.org/licenses/by/4.0/).
Copyright: This open access article is published under a Creative Commons CC BY 4.0 license, which permit the free download, distribution, and reuse, provided that the author and preprint are cited in any reuse.


