
Submitted:
12 August 2025
Posted:
19 August 2025
You are already at the latest version
Abstract
Background: Living kidney donor (LKD) transplantation contributes to mitigate the organ shortage and some programs now accept donors with borderline criteria, such as obesity. However, the long-term impact of these criteria extension remains unclear. Methods: This study retrospectively analyzed 306 LKD from 1998 to 2020 to examine obesity trends, predictors, and impact on cardiovascular risk and kidney function. Results: Before donation, 49% of donors were normal weight, 41% were overweight, and 10% were obese. Obese donors were older (50.8 ± 8.8 years, p = 0.009) and had higher rates of dyslipidemia and hypertension (41%, p < 0.001 for both). Over 15 years, obesity rates were stable (8.8-17.4%). A mixed logistic regression model showed that dyslipidemia (OR 6.1, p = 0.042), age (OR 0.9, p=0.005) and body mass index (OR 5.3, p < 0.001) were strong predictors of post-donation obesity. Overweight donors showed an increase in obesity rates over time in the McNemar’s paired analysis [14% obesity by year 3 (p = 0.001); 12.5% at year 10 (p = 0.014)]. Post-donation hypertension was more prevalent in obese donors’ (61.1% vs. 30.4%, p = 0.011), though proteinuria and esti-mated glomerular filtration rate (eGFR) did not differ significantly. Conclusions: These findings show that pre-donation overweight, younger age and dyslipidemia predict post-donation obesity, with hypertension posing added risk for obese donors. There was no impact concerning proteinuria and eGFR. The study un-derscores the importance of careful donor selection and risk informed counseling.
Keywords:
living kidney donor
; obesity
; cardiovascular risk
1. Introduction
Chronic kidney disease (CKD) is a growing global health issue, affecting millions of people and posing challenges for healthcare systems worldwide [1]. For patients with end-stage kidney disease (ESKD), kidney transplantation remains the most effective treatment, significantly improving survival and quality of life compared to dialysis [2,3,4]. The demand for kidney transplants far exceeds the supply, leaving many patients on the waiting list for extended periods. In Portugal, the median wait time for a kidney transplant is approximately five years, with an annual mortality rate on waiting list of over 5% [4].
This disparity between organ supply and demand has led to an expansion of transplants with living donors and, in this setting, an increasing acceptance of donors with borderline medical criteria, including those who are overweight or obese if otherwise healthy [3,5,6]. This category of “medically complex living donors” now comprises around 25% of living donor’s kidney transplant (LDKT) programs, with data from the Organ Procurement and Transplantation Network [7] showing a 12% increase in overweight and a 20% increase in obese donors from 1999 to 2011. This trend is expected to continue as obesity is an escalating global pandemic. For example, according to Global Obesity Observatory [8], in 2019 18% of the adult population in Portugal was obese and 38% was categorized as overweight.
Obesity poses unique challenges in kidney transplantation since it implies an increased risk of hypertension, impaired glucose tolerance, type 2 diabetes mellitus, stroke, coronary heart disease, and overall cardiovascular and general mortality [9,10]. It is also known to cause specific kidney alterations, including effacement of podocyte foot processes, focal segmental glomerulosclerosis, and glomerular hypertrophy, referred to as obesity-related glomerulopathy [11,12]. Furthermore, obesity leads to the progression of CKD irrespective of the underlying etiology [10] through different mechanisms like hyperfiltration, renin-angiotensin-aldosterone system activation and oxidative stress [11,13,14,15,16,17,18,19].
The long-term safety data regarding living kidney donation among individuals with excessive weight is limited [20]. Existing studies raise concerns about potential risks, including an increased incidence of ESKD [21,22,23,24], cardiovascular complications [25] and overall mortality [25] for obese donors. Despite methodological limitations in those studies [26], these findings have highlighted the importance of informed consent [27] and the need for clear guidelines to protect this higher-risk donor population.
The impact of donor’s obesity on post-donation outcomes remains poorly understood in the existing literature, and even less is known about weight changes after kidney donation. As more transplant programs accept overweight and obese individuals as LKD, understanding the long-term health implications for this group has become essential.
Hence, our study aims to address this knowledge gap by investigating the prevalence and predictors of obesity among LKD over a 15-year follow-up period; assessing changes in obesity status over time in relation to pre-donation body mass index (BMI); identifying risk factors for post-donation obesity; and examining how obesity influences long-term outcomes, particularly in terms of estimated glomerular filtration rate (eGFR) evolution and cardiovascular health.
2. Materials and Methods
2.1. Patients
We retrospectively reviewed the clinical data of all adult LKDs submitted to nephrectomy at our center between January 1998 and January 2020 (n=365). Inclusion criteria were LKDs with documented BMI at the time of donation and at one-year post-donation. A total of 59 LKDs with missing weight measurements in the medical records were excluded, leaving a final cohort of 306 LKDs for analysis.
This retrospective observational study was approved by the Institutional Review Board of Unidade Local de Saúde de Santo António, under protocol Ref.: 147-21 (119-DEFI/122-CE). The study was conducted in compliance with the Declaration of Helsinki and is reported following the Strengthening the Reporting of Observational Studies in Epidemiology guidelines.
2.2. Donor Variables
Following international guidelines [28,29], all donors were subjected to a standard evaluation protocol. Baseline demographic, anthropomorphic, analytical, and clinical data were collected. Detailed evaluation and exclusion criteria have already been published [30,31]. Upon urinary analysis, proteinuria was defined by a random urine protein measurement between 0.15 and 0.5 g/g [28], confirmed by a 24-hour urine sample. Donors with confirmed proteinuria exceeding 300 mg/day were excluded from donation. Additionally, candidates with diabetes or pre-diabetes were excluded. eGFR was calculated using the Chronic Kidney Disease- Epidemiology Collaboration equation [32] based on serum creatinine. BMI was evaluated pre-donation and at follow-up consultation. A BMI of ≤ 30kg/m2 is strongly encouraged, but some donors were accepted with BMI>30 and < 35Kg/m2 if they were otherwise healthy or after exclusion of comorbidities. BMI status was assessed prior to kidney donation to highlight the notable prevalence and characteristics of overweight and obese individuals within our cohort. For the classification we considered normal weight a BMI lower than 25 kg/m2, overweight a BMI between 25 and 29.9 kg/m2 and obese a BMI higher than 30 kg/m2. Hypertension during follow-up was defined as blood pressure ≥ 140/90 mmHg or the initiation of antihypertensive therapy; de novo diabetes mellitus was defined as fasting glucose > 126 mg/dL [33]or by the prescription of antidiabetic agents; and dyslipidemia was defined as low-density lipoprotein cholesterol ≥ 115 mg/dL and/or triglycerides ≥ 150 mg/dL, or the use of lipid-lowering medication to manage these levels.
The earliest date of problem onset was considered in the analysis. The date of nephrectomy was considered the start of follow-up, and all donors were offered lifetime annual follow-up appointments. The median follow up was 6.59 (3.7–10.2) years.
2.3. Outcomes
The primary outcome was the occurrence of obesity until 15 years post-donation, using all available weight measurements from donation evaluation onward. Donors were followed from the nephrectomy date until the first of either death, development of end-stage kidney disease (defined as the need of chronic dialysis or a kidney transplant), last follow-up, or end of study period (December 31, 2022).
Additional analyses were limited to a 10-year period due to the smaller number of patients with follow-up beyond 10 years post-donation. These analyses evaluated the influence of demographic and clinical factors at the time of donation on the development of obesity. Furthermore, the association between obesity and other cardiovascular risk factors—such as hypertension, diabetes mellitus, and dyslipidemia—was assessed. The impact of obesity on eGFR trajectories and the occurrence of proteinuria was also examined.
2.4. Statistical Analysis
Continuous data were described using mean and standard deviation (SD) or median and interquartile range (IQR), and categorical data were expressed as numbers and percentages. Categorical data were compared using Pearson chi-square test or Fisher exact test, and continuous variables were compared with Student’s t-test or Mann–Whitney U-test.
In order to handle the high number of missing weight data in different time points, we first approached the analysis using a multivariate mixed logistic regression, which imputed subject-specific random effects (slope defined as time in years) on an unstructured covariance matrix. The dependent variable was all obesity prevalence time-point data, and the independent variables were those considered to have a potential clinical correlation with changes in obesity status over time.
Matched pair analysis using McNemar’s test was performed to compare obesity prevalence in donors at defined time points: at donation, 1-, 3-, 5 and 10-years post-donation. Significance was sought comparing post-donation time points with pre-donation status. This type of analysis is more powerful than commonly utilized unpaired or independent tests; in that it eliminates variation between samples that could be attributed to extraneous factors, given its intra-patient longitudinal comparison design. Cases with missing data were pairwise excluded. We then stratified this statistical approach considering relevant clinical factors: BMI, sex and age. Moreover, cardiovascular risk factors prevalence (hypertension, proteinuria, dyslipidemia) was again compared at different time points, in a pairwise fashion, stratified by obesity status, and compared by McNemar’s test within each group (obese and non-obese) and by unpaired proportion test between each group (obese vs non-obese). Similarly, mean eGFR longitudinal trends were analyzed and significance was sought by paired and unpaired t-test.
Statistical calculations were performed using STATA/MP, version 15.1 (Stata Corp, College Station, TX, USA). A 2-sided P-value < 0.05 was considered statistically significant.
3. Results
3.1. Population Characteristics
The baseline characteristics of this cohort are summarized in Table 1.
Most donors (49%) had normal weight, 41% were overweight and 10% were obese. The mean age of the cohort was 47.2 ± 10.7 years, with obese donors being significantly older (50.8 ± 8.8 years, p = 0.009). Female donors represented 71% of the total sample.
The prevalence of dyslipidemia and hypertension increased with higher BMI, with both conditions being significantly more common in the obese group (41%, p < 0.001 for both). Overweight donors also had higher rates of dyslipidemia (15%, p < 0.001) and hypertension (19%, p < 0.001) compared to the normal weight group. Smoking habits varied across BMI categories, with the highest prevalence in the normal weight group (21%, p = 0.045).
There were no significant differences between the groups regarding serum creatinine levels or urine protein-creatinine ratios. However, the pre-donation eGFR was higher in normal-weight donors (102.4 ± 15.0 ml/min/1.73 m2) compared to obese donors (96.3 ± 14.5 ml/min/1.73 m2, p = 0.038).
3.2. Evaluation of Obesity Prevalence and Predictors
We conducted a longitudinal analysis over a 15-year follow-up period after kidney donation to evaluate obesity prevalence. Our findings indicate that during the first 10 years, the prevalence of obesity remained relatively stable (8.8-17.4%), with only minor fluctuation, as we can observe in Figure 1 and Supplementary Table S1. After the 10 years of follow-up there is a rise in the prevalence, but the number of donors in analysis is progressively inferior. For precise percentages according to the year of follow up the Supplementary Table S1 can be consulted.
A mixed logistic regression model identified several significant predictors of post donation obesity over the 15-year period, as demonstrated in Table 2. Age at the time of donation was inversely associated with the risk of post-donation obesity (OR 0.882, 95% CI 0.808–0.963, p = 0.005), suggesting that younger donors are more likely to develop obesity post-donation. As anticipated, a higher pre-donation BMI was a strong independent predictor of post-donation obesity (OR 5.324, 95% CI 3.471–8.168, p < 0.001), such as dyslipidemia at the time of donation (OR 6.048, 95% CI 1.065–34.348, p = 0.042).
3.3. Trends in BMI Categories
Figure 2 and Supplementary Table S2 represent McNemar’s paired analysis, which evaluates obesity evolution according with three different categories: pre donation BMI category, donor sex and pre-donation age.
Over a 10-year follow-up period, kidney donors exhibited varying weight trajectories depending on their initial weight status (Figure 2A). Patients classified as normal weight pre-donation demonstrated minimal progression toward obesity, with only 6.8% becoming obese by year 10 (p = 0.083), suggesting a relatively low risk of obesity development for those starting in a normal weight range. In contrast, overweight donors showed a steady increase in obesity rates over time, with 11.3% classified as obese by year 1 (p < 0.001), 14% by year 3 (p = 0.001), and 12.5% at year 10 (p = 0.014), indicating a higher risk of long-term weight gain for this group. Interestingly, donors who were initially obese experienced an early decline in obesity prevalence, dropping to 65.6% by year 1 (p = 0.001) and further to 56.3% by year 3 (p = 0.008). However, by year 10, the obesity rate had rebounded to 83.3% (p = 0.317), indicating some weight regain in later years.
The difference between sexes (Figure 2B) did not appear to be clinically relevant in relation to obesity trends across most time points. However, a statistically significant difference was observed in females at the 10-year mark, with 14.9% (p = 0.003) being obese, an increase from 9.2% at donation.
The data on Figure 2C suggests that younger patients, particularly those under 40, are at an increased risk of becoming obese over time, an observation that confirms the result from the mixed logistic regression analysis. At 1 year, the obesity rate raised significantly to 11.5% (p = 0.014), indicating an early and notable increase in this age group. This trend continued, with further significant increases at 5 years (15.8%, p = 0.046) and 10 years (21.7%, p = 0.046).
3.3. Cardiovascular Risk Factors and Kidney Function Trends According to BMI
Hypertension prevalence increased across all groups following kidney donation (Figure 3A and Supplementary Table S3). However, a significant disparity is observed between obese and non-obese patients. At 1-year post-donation, hypertension was significantly more prevalent among obese patients (42.9%) compared to non-obese patients (21.9%, p = 0.010). This trend persisted at 5 years, where hypertension affected 61% of obese patients, in contrast to 30.4% of non-obese patients (p = 0.011).
No significant differences were observed between groups regarding proteinuria, dyslipidemia, or eGFR changes post-donation (Figure 3B–D and Supplementary Tables S4–S6).
The cohort consisted of a highly selected group of donors believed to be healthy, resulting in only 4 cases of diabetes, 3 in the non-obese cohort and 1 in the obese cohort. This limited the statistical power to detect significant differences for this variable. This information can be consulted in Table 7 of the Supplementary Materials.
4. Discussion
In this study, most kidney donors (49%) had a normal weight, while 10% were classified as obese. Obese donors were generally older and more likely to have dyslipidemia and hypertension compared to those with normal weight. Before donation, normal-weight donors had better kidney function than obese donors (102.4 ± 15.0 vs. 96.3 ± 14.5 ml/min/1.73 m2, p = 0.038).
The prevalence of obesity among donors was relatively stable (8.8–17.4%) over the first decade after donation, with a slight increase later.
The mixed logistic regression model identified three key predictors of post-donation obesity: younger age, higher BMI before donation, and dyslipidemia. These findings were reinforced by McNemar’s paired analysis, which showed that overweight donors were the group most likely to become obese after donation, particularly those under 40 years old. Normal-weight donors generally maintained their weight, while obese donors initially reduced their obesity prevalence post-donation, but this trend reversed in later years.
McNemar’s paired analysis also showed no significant difference between sexes regarding obesity development. Among comorbidities, hypertension was significantly more common in obese donors compared to non-obese donors. However, dyslipidemia, proteinuria and eGFR changes did not differ significantly between groups. Diabetes prevalence was low, with only a few cases in both groups.
The stability in obesity prevalence during the first 10 years suggests that kidney donation may not significantly contribute to the development of obesity. A hypothesis further supported by the non-significance of time after donation in the multivariable mixed logistic regression. The slight increase noted toward the end of the follow-up period may be explained by follow-up loss or surveillance bias, where obese donors were more closely monitored, resulting in higher detection of obesity-related complications.
The association between post-donation obesity and younger age (particularly under 40 years old) is a novel finding, supported by both the mixed logistic regression model and McNemar’s paired analysis. Although this relationship is not extensively explored in the literature, it may be linked to older donors tending to have greater sarcopenia, more comorbidities or being more compliant with dietary counseling. However, this correlation may not fully reflect the health status of older donors, as lower weight in this group could be associated with reduced muscle mass, a common occurrence in older age [34].
The influence of pre-existing higher BMI, particularly in previously overweight patients, is consistent with the findings of Bugeja et al. [35], who conducted a single-center study involving 151 LKD who donated between 2009 and 2017, with a median follow-up of 392 days post-donation. Among overweight and obese donors (BMI > 25 kg/m2), weight increased significantly after donation, from 86.0 ± 2.1 kg to 88.8 ± 2.7 kg (mean difference 2.3 ± 0.9 kg, p < 0.0001). Similarly, Punjala et al. [36] performed a retrospective analysis of 303 donors who proceeded to donate between 2012 and 2016. They reported that while some obese donors lost weight before donation (mean BMI difference of -1.32 kg/m2, p < 0.001), their weight returned to baseline levels one year after donation, with weight gain persisting at the two-year follow-up (mean BMI difference of +1.47 kg/m2, p < 0.001). Those findings highlight the need for enhanced weight control efforts among obese and overweight kidney donors. Punjala et al.’s [36] work emphasizes that these efforts must be sustained, as weight regaining following donation is common, as occurred in our study obese donors on the long-term.
Pre-donation dyslipidemia, which may indicate poor health or nutritional habits, also emerged as a significant predictor, highlighting the importance of addressing metabolic health in the pre-donation period to prevent post-donation weight gain. After donation there was no difference between dyslipidemia prevalence in obese vs non obese groups.
We recommend that younger individuals who are overweight and have dyslipidemia—representing the primary at-risk group—undergo targeted pre-donation counseling focused on lifestyle modification and weight reduction. Furthermore, they should be encouraged to lose weight prior to donation and to engage in more frequent post-donation follow-up, including annual or bi-annual check-ups and ongoing nutritional counseling.
Concerning the comorbidities, obese donors had significantly higher rates of hypertension compared to non-obese donors, indicating that obesity was strongly associated with hypertension following donation. This aligns with Issa et al. [37], who reported an increased risk of hypertension (RR 1.93, 95% CI 1.51-2.46, p < 0.001) associated with post-donation weight gain. Given the well-established link between obesity and hypertension, this relationship is likely exacerbated in LKDs, where the prevalence of hypertension is elevated due to reduced kidney mass [38]. It is important though to recognize that the studies that addressed the blood pressure changes post-donation showed that the differences in quantitative value are low, for example Kim et al. [39] found that there was a statistically significant increase in BP post-donation, however the increase in BP was from 113/75 to 116/77 mm Hg. Thiel et al. [40] suggested that donor’s that develop hypertension post donation were already pre-hypertensive before donation, which we know can be the case for obese patients. Preventive measures for blood pressure control should be established, including more frequent follow-up appointments to initiate treatment as needed, as well as a low-sodium diet.
There were very few cases of diabetes, which limited the ability to detect significant differences in that variable. In Issa et al. [37], post-donation weight gain was linked to a significantly higher risk of developing diabetes (RR 4.18, 95% CI 2.05-8.5, p < 0.0001).
Our cohort did not have any significant differences between obese and non-obese groups in terms of proteinuria or post-donation eGFR changes, however excessive weight is strongly associated with eGFR decline and ESKD in the literature. Our group’s previous research [41] examined long-term eGFR trajectories over 15 years post-donation and found that normal-weight donors showed significantly better eGFR recovery (+0.59 ml/min/1.73 m2, 95% CI: +0.37 to +0.80) compared to overweight (+0.35, 95% CI: -0.14 to +0.56) and obese donors (-0.18, 95% CI: -0.68 to +0.31, p=0.020). Noteworthy, these significantly different recovery trajectories only hold for the first five years, possibly reflecting a blunting adaptative capacity to the hyperfiltration status in overweight and obese living kidney donors. Grams et al. [42,43] developed a risk model showing a 16% increase in ESKD risk for every 5 kg/m2 increase in BMI above 30 kg/m2. Similarly, Locke et al. [21] found that obese donors had more than double the ESKD risk of non-obese donors (94 vs. 40 per 10,000) over 20 years. Praga et al. [44] found that donors with higher BMIs (31.6 ± 5.6 kg/m2) were at greater risk for proteinuria and kidney insufficiency, with proteinuria appearing 10.1 ± 6.1 years after donation and kidney insufficiency appearing 4.1 ± 4.3 years later. Serrano et al. [45], however, observed no increased ESKD risk in obese donors over 20 years, though they experienced faster eGFR decline, higher diabetes, and hypertension rates. In concordance, Issa et al. [37] found no differences in eGFR or proteinuria, in 20 years follow up time, between donors with significant post-donation weight gain and those without, attributing this to careful patient selection, which may also explain the results in our cohort.
The limitations of this study must be acknowledged. Although the follow-up period of 15 years is considerable, it may still be insufficient to fully capture long-term complications such as end-stage kidney disease (ESKD). Additionally, a substantial number of patients had follow-up periods shorter than 10 years, with the median follow-up duration being 6.6 years. This suggests that the cohort size may be too small to draw definitive conclusions regarding outcomes beyond 10 years. Nonetheless, given the scarcity of long-term safety data on this subject, the 10-year follow-up in this study represents a significant contribution to the field. Additionally, the study did not evaluate BMI trends prior to donation, so we cannot determine whether donors intentionally lost or gained weight in preparation for the procedure. Furthermore, selection bias is a potential issue, as the cohort comprised only healthy living donors, which limits the generalizability of these findings to less healthy or more diverse populations.
The acceptance of overweight and or obese donors is not consensual among transplant centers, and there is variability between guidelines [43,46,47,48,49]. The 2015 European Renal Best Practice guidelines recommend that individuals with a body mass index (BMI) greater than 35 kg/m2 should not be considered for living kidney donation [50]. However, the British Transplantation Society and Kidney Disease: Improving Global Outcomes (KDIGO) guidelines suggest that each case should be evaluated individually for donors with a BMI greater than 30 kg/m2, without specifying an absolute cut-off value [43,46].
Given the scarcity of organs and the findings from our study, which did not show increased risks of proteinuria or eGFR changes post-donation in LKD that become obese, we still think obese and overweight donors should be considered for donation under a careful selection and a specific protocol of obesity management.
Locke et al. [21] suggested that BMI is the only donor factor that can be modified pre-donation to reduce long-term ESRD risk. Further research with intervention studies should assess whether proactive weight management strategies, both before and after donation, can mitigate post-donation obesity and its associated complications. As new therapeutic options, such as glucagon-like peptide-1 analogs and sodium-glucose cotransporter-2 inhibitors, emerge, we should explore their potential to mitigate post-donation weight gain and related comorbidities. Larger, multi-center studies with more diverse populations are needed to improve the generalizability of the findings. Establishing a structured follow-up protocol that includes multidisciplinary care with medical follow-up, nutritional support, tailored physical exercise, and psychological care is essential to ensuring the long-term health and safety of kidney donors.
In conclusion, post-donation obesity trends remain stable up to 10 years after kidney donation. This study highlights the significant impact of pre-donation BMI on post-donation obesity and related health outcomes, with overweight donors being at greater risk. Younger age and pre-existing dyslipidemia also emerged as key predictors. Post-donation obesity is strongly linked to higher rates of hypertension. Although no significant differences were found in proteinuria or eGFR decline, the findings underscore the importance of proactive weight management and metabolic health optimization in kidney donors.
Supplementary Materials
The following supporting information can be downloaded at the website of this paper posted on Preprints.org, Table S1: Longitudinal Obesity Prevalence During 15 Years of Follow-up of Living Kidney Donors Post-Donation; Table S2: Evaluation of body mass index evolution according with three different aspects: pre donation BMI category, donor sex and pre-donation age (McNemar’s paired analysis); Tabel S3: Hypertension Trends For a 15 Years Follow-up According to Obese and Non-Obese Status; Table S4: Proteinuria Trends For a 15 Years Follow-up According to Obese and Non-Obese Status; Table S5: Dyslipidemia Trends For a 15 Years Follow-up According to Obese and Non-Obese Status; Table S6: Estimated Glomerular Filtration Rate (eGFR) Trends For a 15 Years Follow-up According to Obese and Non-Obese Status; Table S7: Diabetes Mellitus (DM) Trends For a 15 Years Follow-up According to Obese and Non-Obese Status.
Author Contributions
All authors have contributed significantly to the work and meet the criteria for authorship. AC, MA, and JM: Research design, data acquisition, data analysis, and paper writing. BB, SS, JS, CR and SF were engaged in the data acquisition and analysis. LSM and JM were involved in research design and data analysis. All the authors approved the submitted version.
Funding
This research received no external funding.
Institutional Review Board Statement
This retrospective observational study was approved by the Institutional Review Board of Unidade Local de Saúde de Santo António, under protocol Ref.: 147-21 (119-DEFI/122-CE). The study was conducted in compliance with the Declaration of Helsinki and is reported following the Strengthening the Reporting of Observational Studies in Epidemiology guidelines.
Informed Consent Statement
Patient consent was waived because participants could not be identified.
Data Availability Statement
Data is unavailable due to privacy restrictions.
Conflicts of Interest
The authors declare no conflicts of interest.
Abbreviations
The following abbreviations are used in this manuscript:
| BMI | Body Mass Index |
| BP | Blood Pressure |
| CI | Confidence Interval |
| CKD | Chronic Kidney Disease |
| eGFR | Estimated Glomerular Filtration Rate |
| ESKD | End Stage Kidney Disease |
| HR | Hazard Ratio |
| IQR | Interquartile Range |
| KDIGO | Kidney Disease: Improving Global Outcomes |
| LKD | Living Kidney Donor |
| LKDT | Living Kidney Donor Transplantation |
| OR | Odds Ratio |
| SD | Standard Deviation |
References
- Kovesdy, C.P. Epidemiology of Chronic Kidney Disease: An Update 2022. Kidney Int Suppl (2011) 2022, 12, 7–11. [Google Scholar] [CrossRef] [PubMed]
- Wolfe, R.A.; Ashby, V.B.; Milford, E.L.; Ojo, A.O.; Ettenger, R.E.; Agodoa, L.Y.C.; Held, P.J.; Port, F.K. Comparison of Mortality in All Patients on Dialysis, Patients on Dialysis Awaiting Transplantation, and Recipients of a First Cadaveric Transplant. New England Journal of Medicine 1999, 341, 1725–1730. [Google Scholar] [CrossRef] [PubMed]
- Ahmadi, A.R.; Lafranca, J.A.; Claessens, L.A.; Imamdi, R.M.S.; Ijzermans, J.N.M.; Betjes, M.G.H.; Dor, F.J.M.F. Shifting Paradigms in Eligibility Criteria for Live Kidney Donation: A Systematic Review. Kidney Int 2015, 87, 31–45. [Google Scholar] [CrossRef] [PubMed]
- Atividade Nacional Anual; 2021.
- McCormick, F.; Held, P.J.; Chertow, G.M. The Terrible Toll of the Kidney Shortage. Journal of the American Society of Nephrology 2018, 29, 2775–2776. [Google Scholar] [CrossRef]
- Rodrigues, S.; Escoli, R.; Eusébio, C.; Dias, L.; Almeida, M.; Martins, L.S.; Pedroso, S.; Henriques, A.C.; Cabrita, A. A Survival Analysis of Living Donor Kidney Transplant. Transplant Proc 2019, 51, 1575–1578. [Google Scholar] [CrossRef]
- Sachdeva, M. Weight Trends in United States Living Kidney Donors: Analysis of the UNOS Database. World J Transplant 2015, 5, 137. [Google Scholar] [CrossRef]
- Sardinha, L.B.; Santos, D.A.; Silva, A.M.; Coelho-e-Silva, M.J.; Raimundo, A.M.; Moreira, H.; Santos, R.; Vale, S.; Baptista, F.; Mota, J. Prevalence of Overweight, Obesity, and Abdominal Obesity in a Representative Sample of Portuguese Adults. PLoS One 2012, 7. [Google Scholar] [CrossRef]
- Yau, K.; Kuah, R.; Cherney, D.Z.I.; Lam, T.K.T. Obesity and the Kidney: Mechanistic Links and Therapeutic Advances. Nat Rev Endocrinol 2024, 20, 321–335. [Google Scholar] [CrossRef]
- Nam, K.H.; Chang, T.I.; Joo, Y.S.; Kim, J.; Lee, S.; Lee, C.; Yun, H.; Park, J.T.; Yoo, T.; Sung, S.A.; et al. Association Between Serum High-Density Lipoprotein Cholesterol Levels and Progression of Chronic Kidney Disease: Results From the KNOW-CKD. J Am Heart Assoc 2019, 8. [Google Scholar] [CrossRef]
- D’Agati, V.D.; Chagnac, A.; de Vries, A.P.J.; Levi, M.; Porrini, E.; Herman-Edelstein, M.; Praga, M. Obesity-Related Glomerulopathy: Clinical and Pathologic Characteristics and Pathogenesis. Nat Rev Nephrol 2016, 12, 453–471. [Google Scholar] [CrossRef]
- Bonnet, F.; Deprele, C.; Sassolas, A.; Moulin, P.; alamartine, E.; Berthezène, F.; Berthoux, F. Excessive Body Weight as a New Independent Risk Factor for Clinical and Pathological Progression in Primary IgA Nephritis. American Journal of Kidney Diseases 2001, 37, 720–727. [Google Scholar] [CrossRef]
- Griffin, K.A.; Kramer, H.; Bidani, A.K. Adverse Renal Consequences of Obesity. American Journal of Physiology-Renal Physiology 2008, 294, F685–F696. [Google Scholar] [CrossRef]
- Strazzullo, P.; Barba, G.; Cappuccio, F.P.; Siani, A.; Trevisan, M.; Farinaro, E.; Pagano, E.; Barbato, A.; Iacone, R.; Galletti, F. Altered Renal Sodium Handling in Men with Abdominal Adiposity: A Link to Hypertension. J Hypertens 2001, 19, 2157–2164. [Google Scholar] [CrossRef]
- Engeli, S.; Böhnke, J.; Gorzelniak, K.; Janke, J.; Schling, P.; Bader, M.; Luft, F.C.; Sharma, A.M. Weight Loss and the Renin-Angiotensin-Aldosterone System. Hypertension 2005, 45, 356–362. [Google Scholar] [CrossRef] [PubMed]
- Tsuboi, N.; Okabayashi, Y.; Shimizu, A.; Yokoo, T. The Renal Pathology of Obesity. Kidney Int Rep 2017, 2, 251–260. [Google Scholar] [CrossRef] [PubMed]
- de Vries, A.P.J.; Ruggenenti, P.; Ruan, X.Z.; Praga, M.; Cruzado, J.M.; Bajema, I.M.; D’Agati, V.D.; Lamb, H.J.; Barlovic, D.P.; Hojs, R.; et al. Fatty Kidney: Emerging Role of Ectopic Lipid in Obesity-Related Renal Disease. Lancet Diabetes Endocrinol 2014, 2, 417–426. [Google Scholar] [CrossRef] [PubMed]
- Kanbay, M.; Copur, S.; Ucku, D.; Zoccali, C. Donor Obesity and Weight Gain after Transplantation: Two Still Overlooked Threats to Long-Term Graft Survival. Clin Kidney J 2023, 16, 254–261. [Google Scholar] [CrossRef]
- Sachdeva, M. Should Obesity Affect Suitability for Kidney Donation? Semin Dial 2018, 31, 353–356. [Google Scholar] [CrossRef]
- Ahmadi, A.R.; Lafranca, J.A.; Claessens, L.A.; Imamdi, R.M.S.; Ijzermans, J.N.M.; Betjes, M.G.H.; Dor, F.J.M.F. Shifting Paradigms in Eligibility Criteria for Live Kidney Donation: A Systematic Review. Kidney Int 2015, 87, 31–45. [Google Scholar] [CrossRef]
- Locke, J.E.; Reed, R.D.; Massie, A.; MacLennan, P.A.; Sawinski, D.; Kumar, V.; Mehta, S.; Mannon, R.B.; Gaston, R.; Lewis, C.E.; et al. Obesity Increases the Risk of End-Stage Renal Disease among Living Kidney Donors. Kidney Int 2017, 91, 699–703. [Google Scholar] [CrossRef]
- Ibrahim, H.N.; Foley, R.N.; Reule, S.A.; Spong, R.; Kukla, A.; Issa, N.; Berglund, D.M.; Sieger, G.K.; Matas, A.J. Renal Function Profile in White Kidney Donors: The First 4 Decades. Journal of the American Society of Nephrology 2016, 27, 2885–2893. [Google Scholar] [CrossRef]
- Massie, A.B.; Muzaale, A.D.; Luo, X.; Chow, E.K.H.; Locke, J.E.; Nguyen, A.Q.; Henderson, M.L.; Snyder, J.J.; Segev, D.L. Quantifying Postdonation Risk of ESRD in Living Kidney Donors. Journal of the American Society of Nephrology 2017, 28, 2749–2755. [Google Scholar] [CrossRef]
- Muzaale, A.D.; Massie, A.B.; Wang, M.-C.; Montgomery, R.A.; McBride, M.A.; Wainright, J.L.; Segev, D.L. Risk of End-Stage Renal Disease Following Live Kidney Donation. JAMA 2014, 311, 579. [Google Scholar] [CrossRef] [PubMed]
- Mjøen, G.; Hallan, S.; Hartmann, A.; Foss, A.; Midtvedt, K.; Øyen, O.; Reisæter, A.; Pfeffer, P.; Jenssen, T.; Leivestad, T.; et al. Long-Term Risks for Kidney Donors. Kidney Int 2014, 86, 162–167. [Google Scholar] [CrossRef] [PubMed]
- Lam, N.N.; Lentine, K.L.; Garg, A.X. End-Stage Renal Disease Risk in Live Kidney Donors. Curr Opin Nephrol Hypertens 2014, 23, 592–596. [Google Scholar] [CrossRef] [PubMed]
- Reese, P.P.; Boudville, N.; Garg, A.X. Living Kidney Donation: Outcomes, Ethics, and Uncertainty. The Lancet 2015, 385, 2003–2013. [Google Scholar] [CrossRef]
- Lentine, K.L.; Kasiske, B.L.; Levey, A.S.; Adams, P.L.; Alberú, J.; Bakr, M.A.; Gallon, L.; Garvey, C.A.; Guleria, S.; Li, P.K.-T.; et al. Summary of Kidney Disease: Improving Global Outcomes (KDIGO) Clinical Practice Guideline on the Evaluation and Care of Living Kidney Donors. Transplantation 2017, 101, 1783–1792. [Google Scholar] [CrossRef]
- Andrews, P.A.; Burnapp, L. British Transplantation Society / Renal Association UK Guidelines for Living Donor Kidney Transplantation 2018: Summary of Updated Guidance. Transplantation 2018, 102, e307. [Google Scholar] [CrossRef]
- Almeida, M.; Calheiros Cruz, G.; Sousa, C.; Figueiredo, C.; Ventura, S.; Silvano, J.; Pedroso, S.; Martins, L.S.; Ramos, M.; Malheiro, J. External Validation of the Toulouse-Rangueil Predictive Model to Estimate Donor Renal Function After Living Donor Nephrectomy. Transpl Int 2023, 36, 11151. [Google Scholar] [CrossRef]
- Almeida, M.; Ribeiro, C.; Silvano, J.; Pedroso, S.; Tafulo, S.; Martins, L.S.; Ramos, M.; Malheiro, J. Living Donors’ Age Modifies the Impact of Pre-Donation Estimated Glomerular Filtration Rate on Graft Survival. J Clin Med 2023, 12. [Google Scholar] [CrossRef]
- Levey, A.S.; Stevens, L.A.; Schmid, C.H.; Zhang, Y.L.; Castro, A.F.; Feldman, H.I.; Kusek, J.W.; Eggers, P.; Van Lente, F.; Greene, T.; et al. A New Equation to Estimate Glomerular Filtration Rate. Ann Intern Med 2009, 150, 604–612. [Google Scholar] [CrossRef]
- Sacks, D.B.; Arnold, M.; Bakris, G.L.; Bruns, D.E.; Horvath, A.R.; Kirkman, M.S.; Lernmark, A.; Metzger, B.E.; Nathan, D.M. Position Statement Executive Summary: Guidelines and Recommendations for Laboratory Analysis in the Diagnosis and Management of Diabetes Mellitus. Diabetes Care 2011, 34, 1419–1423. [Google Scholar] [CrossRef]
- Ge, Y.; Liu, T.; Deng, L.; Zhang, Q.; Liu, C.; Ruan, G.; Xie, H.; Song, M.; Lin, S.; Yao, Q.; et al. The Age-related Obesity Paradigm: Results from Two Large Prospective Cohort Studies. J Cachexia Sarcopenia Muscle 2024, 15, 442–452. [Google Scholar] [CrossRef] [PubMed]
- Bugeja, A.; Harris, S.; Ernst, J.; Burns, K.D.; Knoll, G.; Clark, E.G. Changes in Body Weight Before and After Kidney Donation. Can J Kidney Health Dis 2019, 6. [Google Scholar] [CrossRef] [PubMed]
- Punjala, S.R.; Adamjee, Q.; Silas, L.; Gökmen, R.; Karydis, N. Weight Trends in Living Kidney Donors Suggest Predonation Counselling Alone Lacks a Sustainable Effect on Weight Loss: A Single Centre Cohort Study. Transplant International 2021, 34, 514–524. [Google Scholar] [CrossRef] [PubMed]
- Issa, N.; Sánchez, O.A.; Kukla, A.; Riad, S.M.; Berglund, D.M.; Ibrahim, H.N.; Matas, A.J. Weight Gain after Kidney Donation: Association with Increased Risks of Type 2 Diabetes and Hypertension. Clin Transplant 2018, 32. [Google Scholar] [CrossRef]
- Sanchez, O.A.; Ferrara, L.K.; Rein, S.; Berglund, D.; Matas, A.J.; Ibrahim, H.N. Hypertension after Kidney Donation: Incidence, Predictors, and Correlates. American Journal of Transplantation 2018, 18, 2534–2543. [Google Scholar] [CrossRef]
- Kim, S.H.; Hwang, H.S.; Yoon, H.E.; Kim, Y.K.; Choi, B.S.; Moon, I.S.; Kim, J.C.; Hwang, T.K.; Kim, Y.S.; Yang, C.W. Long-Term Risk of Hypertension and Chronic Kidney Disease in Living Kidney Donors. Transplant Proc 2012, 44, 632–634. [Google Scholar] [CrossRef]
- Thiel, G.T.; Nolte, C.; Tsinalis, D.; Steiger, J.; Bachmann, L.M. Investigating Kidney Donation as a Risk Factor for Hypertension and Microalbuminuria: Findings from the Swiss Prospective Follow-up of Living Kidney Donors. BMJ Open 2016, 6, e010869. [Google Scholar] [CrossRef]
- Almeida, M.; Reis Pereira, P.; Silvano, J.; Ribeiro, C.; Pedroso, S.; Tafulo, S.; Martins, L.S.; Silva Ramos, M.; Malheiro, J. Longitudinal Trajectories of Estimated Glomerular Filtration Rate in a European Population of Living Kidney Donors. Transplant International 2024, 37. [Google Scholar] [CrossRef]
- Grams, M.E.; Sang, Y.; Levey, A.S.; Matsushita, K.; Ballew, S.; Chang, A.R.; Chow, E.K.H.; Kasiske, B.L.; Kovesdy, C.P.; Nadkarni, G.N.; et al. Kidney-Failure Risk Projection for the Living Kidney-Donor Candidate. New England Journal of Medicine 2016, 374, 411–421. [Google Scholar] [CrossRef]
- Lentine, K.L.; Kasiske, B.L.; Levey, A.S.; Adams, P.L.; Alberú, J.; Bakr, M.A.; Gallon, L.; Garvey, C.A.; Guleria, S.; Li, P.K.-T.; et al. KDIGO Clinical Practice Guideline on the Evaluation and Care of Living Kidney Donors. Transplantation 2017, 101, S7–S105. [Google Scholar] [CrossRef]
- Praga, M.; Hernández, E.; Herrero, J.C.; Morales, E.; Revilla, Y.; Díaz-González, R.; Rodicio, J.L. Influence of Obesity on the Appearance of Proteinuria and Renal Insufficiency after Unilateral Nephrectomy. Kidney Int 2000, 58, 2111–2118. [Google Scholar] [CrossRef]
- Serrano, O.K.; Sengupta, B.; Bangdiwala, A.; Vock, D.M.; Dunn, T.B.; Finger, E.B.; Pruett, T.L.; Matas, A.J.; Kandaswamy, R. Implications of Excess Weight on Kidney Donation: Long-Term Consequences of Donor Nephrectomy in Obese Donors. Surgery 2018, 164, 1071–1076. [Google Scholar] [CrossRef] [PubMed]
- Andrews, P.A.; Burnapp, L. British Transplantation Society / Renal Association UK Guidelines for Living Donor Kidney Transplantation 2018. Transplantation 2018, 102, e307. [Google Scholar] [CrossRef] [PubMed]
- Frutos, M.Á.; Crespo, M.; de la Oliva Valentín, M.; Hernández, D.; de Sequera, P.; Domínguez-Gil, B.; Pascual, J. Living-Donor Kidney Transplant: Guidelines with Updated Evidence. Nefrología (English Edition) 2022, 42, 1–4. [Google Scholar] [CrossRef] [PubMed]
- Pascual, J.; Cruzado, J.M.; Alonso, Á.; Diekman, F.; Gallego, R.J.; Gutiérrez-Dalmau, Á.; Hernández, D.; Morales, J.M.; Rodrigo, E.; Zárraga, S. Kidney Transplantation Group of the Spanish Society of Nephrology. Nefrología (English Edition) 2013, 33, 160–163. [Google Scholar] [CrossRef]
- Lafranca, J.A.; Spoon, E.Q.W.; van de Wetering, J.; IJzermans, J.N.M.; Dor, F.J.M.F. Attitudes among Transplant Professionals Regarding Shifting Paradigms in Eligibility Criteria for Live Kidney Donation. PLoS One 2017, 12, e0181846. [Google Scholar] [CrossRef]
- Abramowicz, D.; Cochat, P.; Claas, F.H.J.; Heemann, U.; Pascual, J.; Dudley, C.; Harden, P.; Hourmant, M.; Maggiore, U.; Salvadori, M.; et al. European Renal Best Practice Guideline on Kidney Donor and Recipient Evaluation and Perioperative Care: FIGURE 1. Nephrology Dialysis Transplantation 2015, 30, 1790–1797. [Google Scholar] [CrossRef]
Figure 1.
Longitudinal Obesity Prevalence in Percentage During 15 Years of Follow-up Post-Donation. Number of patients in analysis in parenthesis.
Figure 1.
Longitudinal Obesity Prevalence in Percentage During 15 Years of Follow-up Post-Donation. Number of patients in analysis in parenthesis.
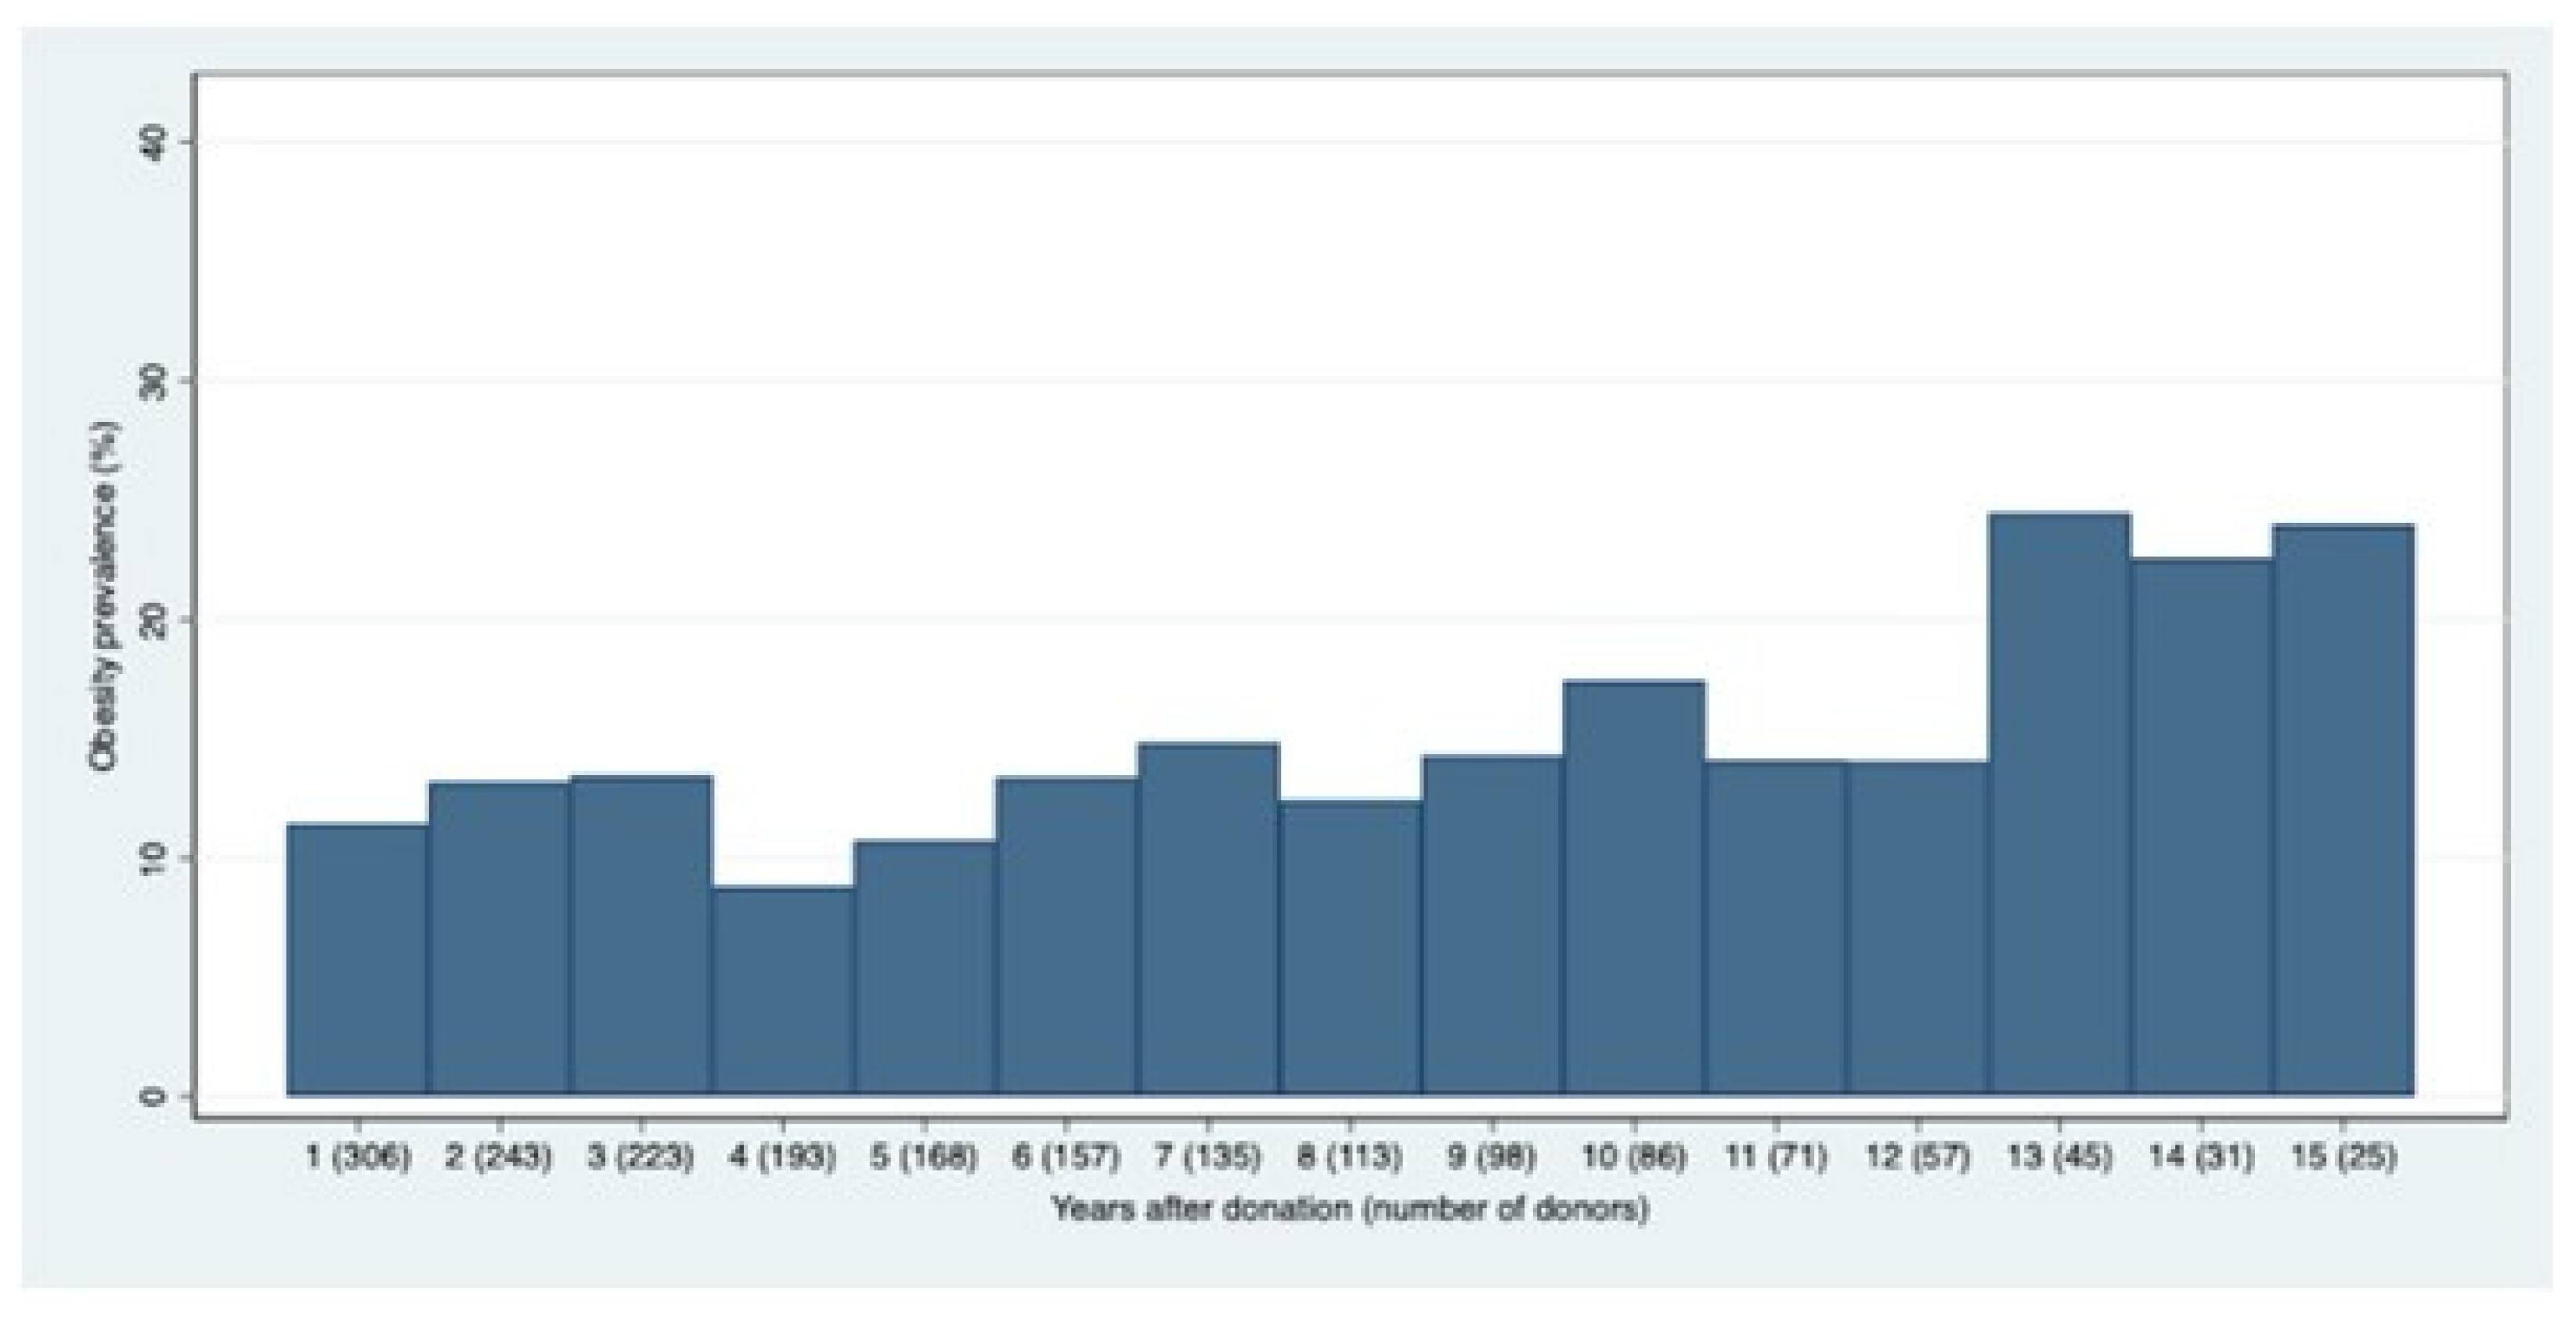
Figure 2.
Evaluation of obesity percentage according with three different aspects: pre donation BMI category (A), donor sex (B) and pre-donation age (C) using McNemar’s paired analysis.
Figure 2.
Evaluation of obesity percentage according with three different aspects: pre donation BMI category (A), donor sex (B) and pre-donation age (C) using McNemar’s paired analysis.
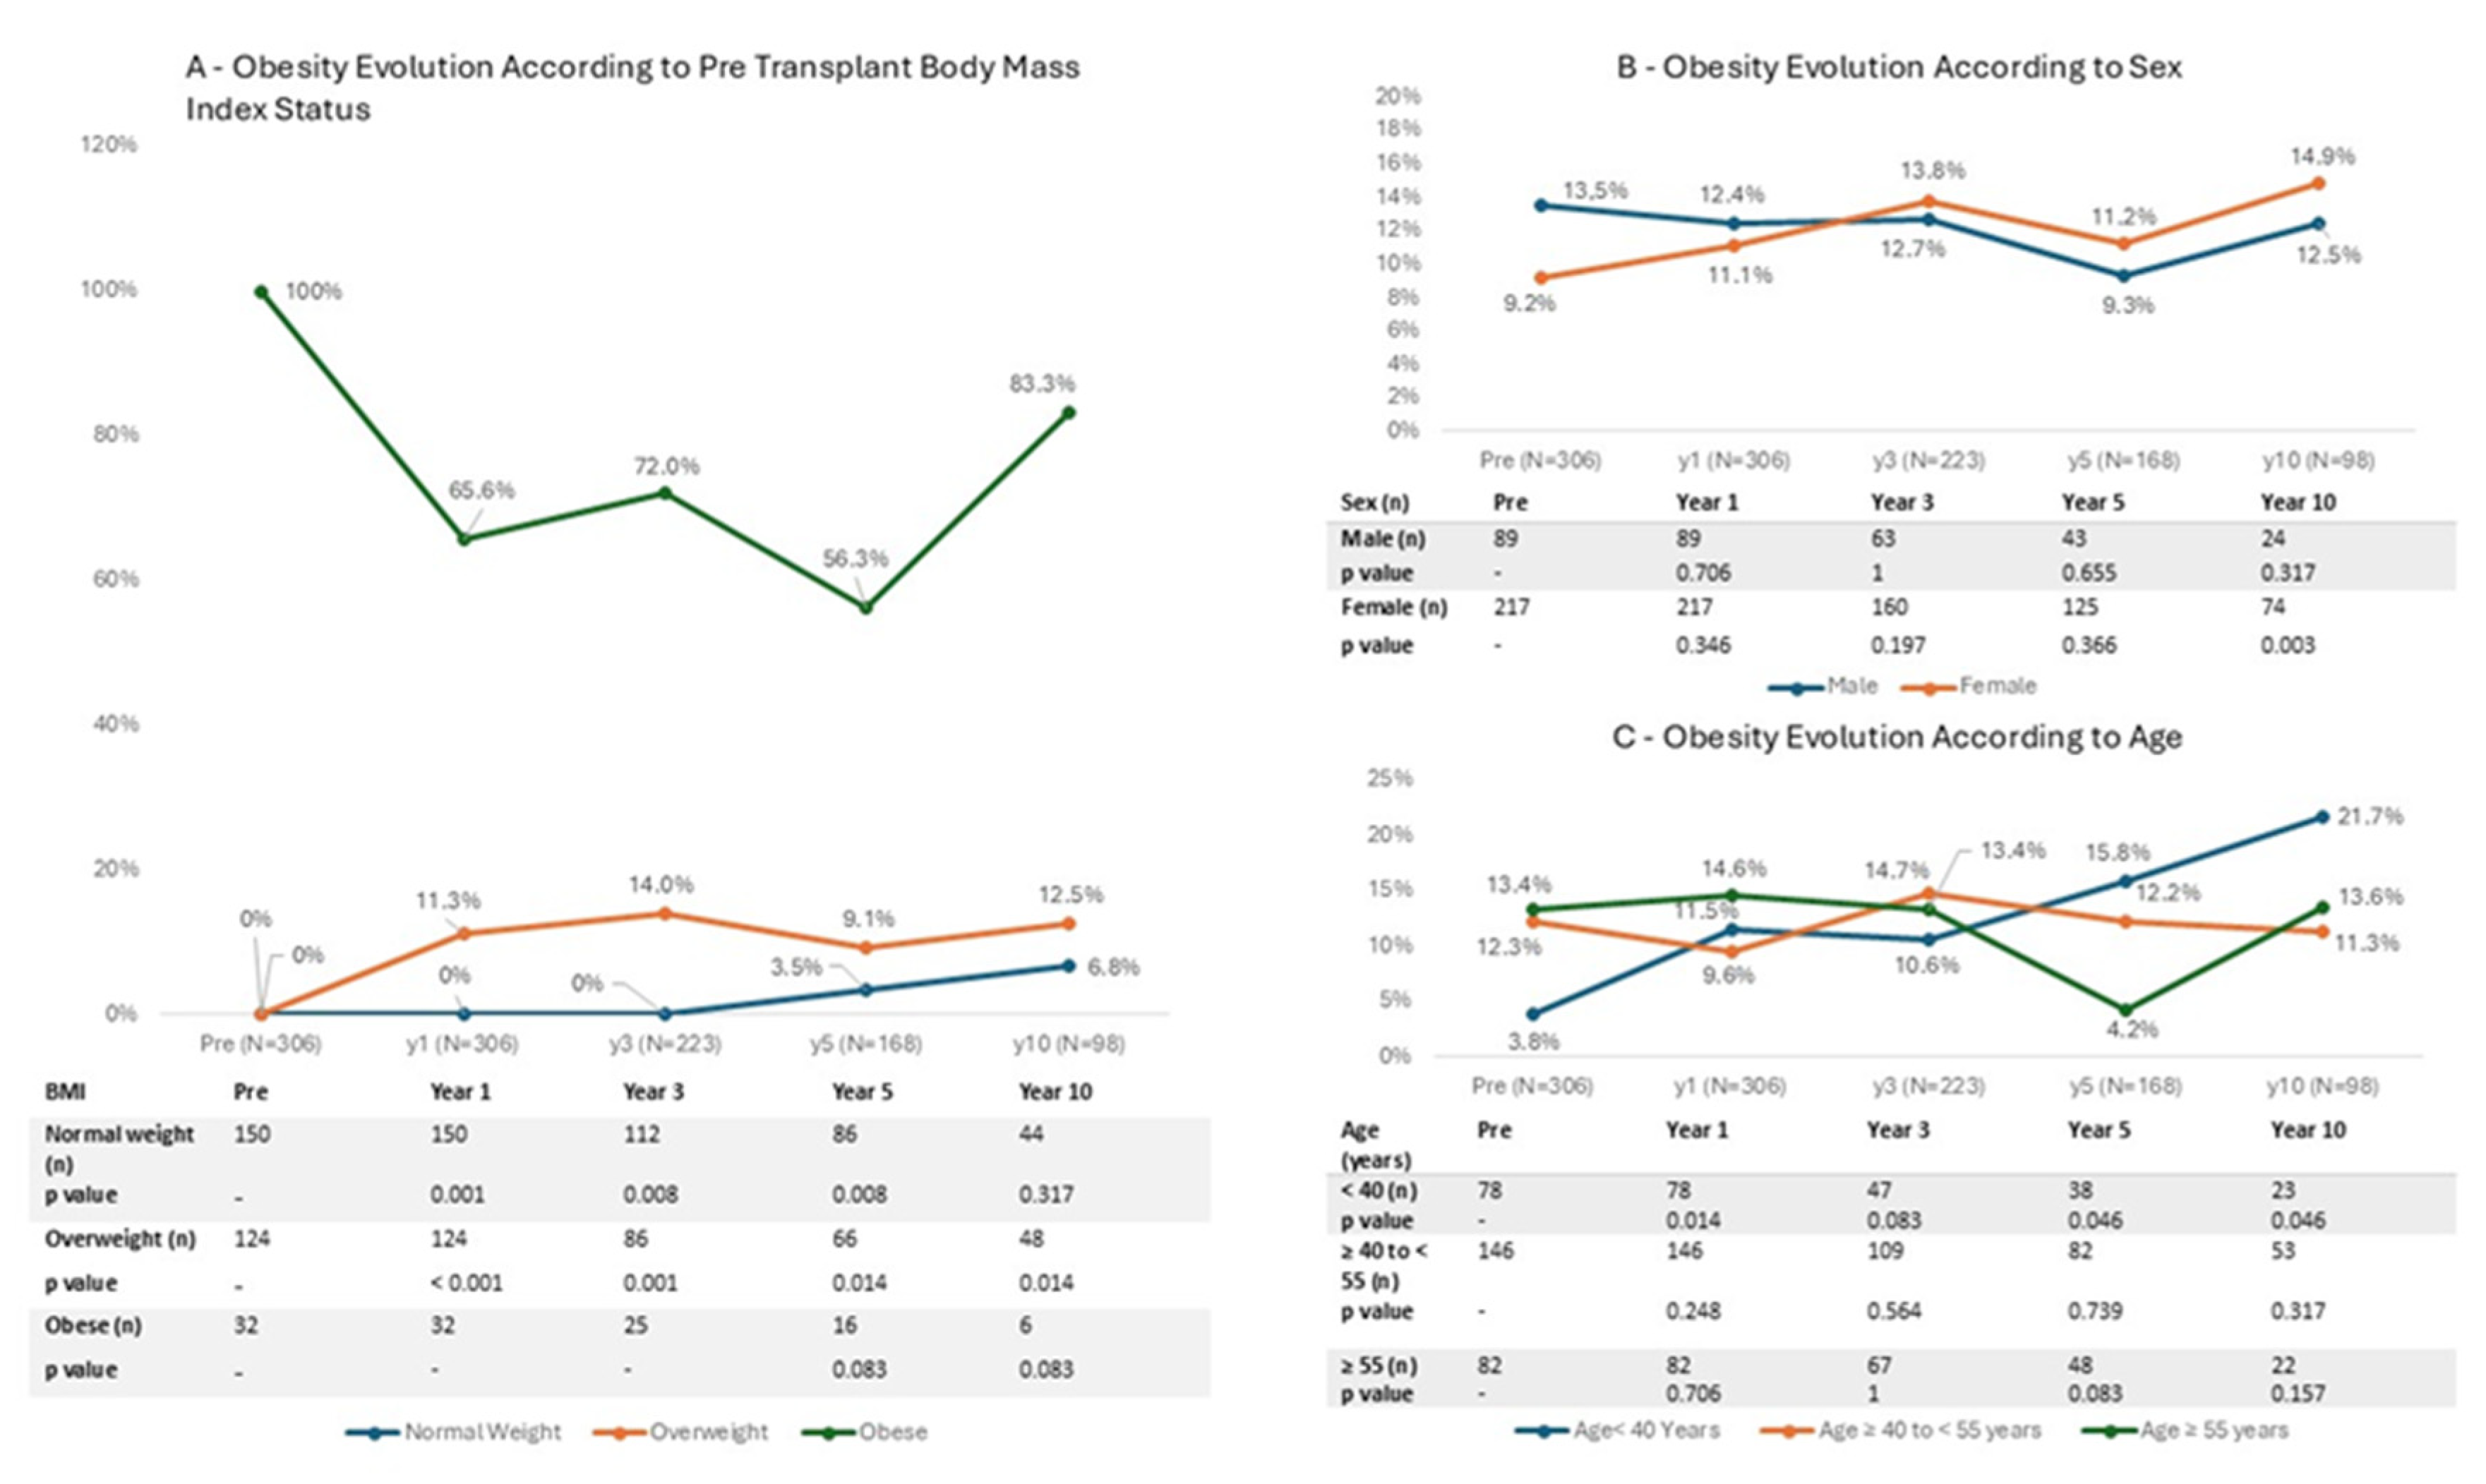
Figure 3.
Evaluation of Hypertension (%) (3A), Proteinuria (%) (3B), Dyslipidemia (%) (3C) and Mean estimated glomerular filtration rate (3D) Trends according to Obese vs Non-Obese Status.
Figure 3.
Evaluation of Hypertension (%) (3A), Proteinuria (%) (3B), Dyslipidemia (%) (3C) and Mean estimated glomerular filtration rate (3D) Trends according to Obese vs Non-Obese Status.
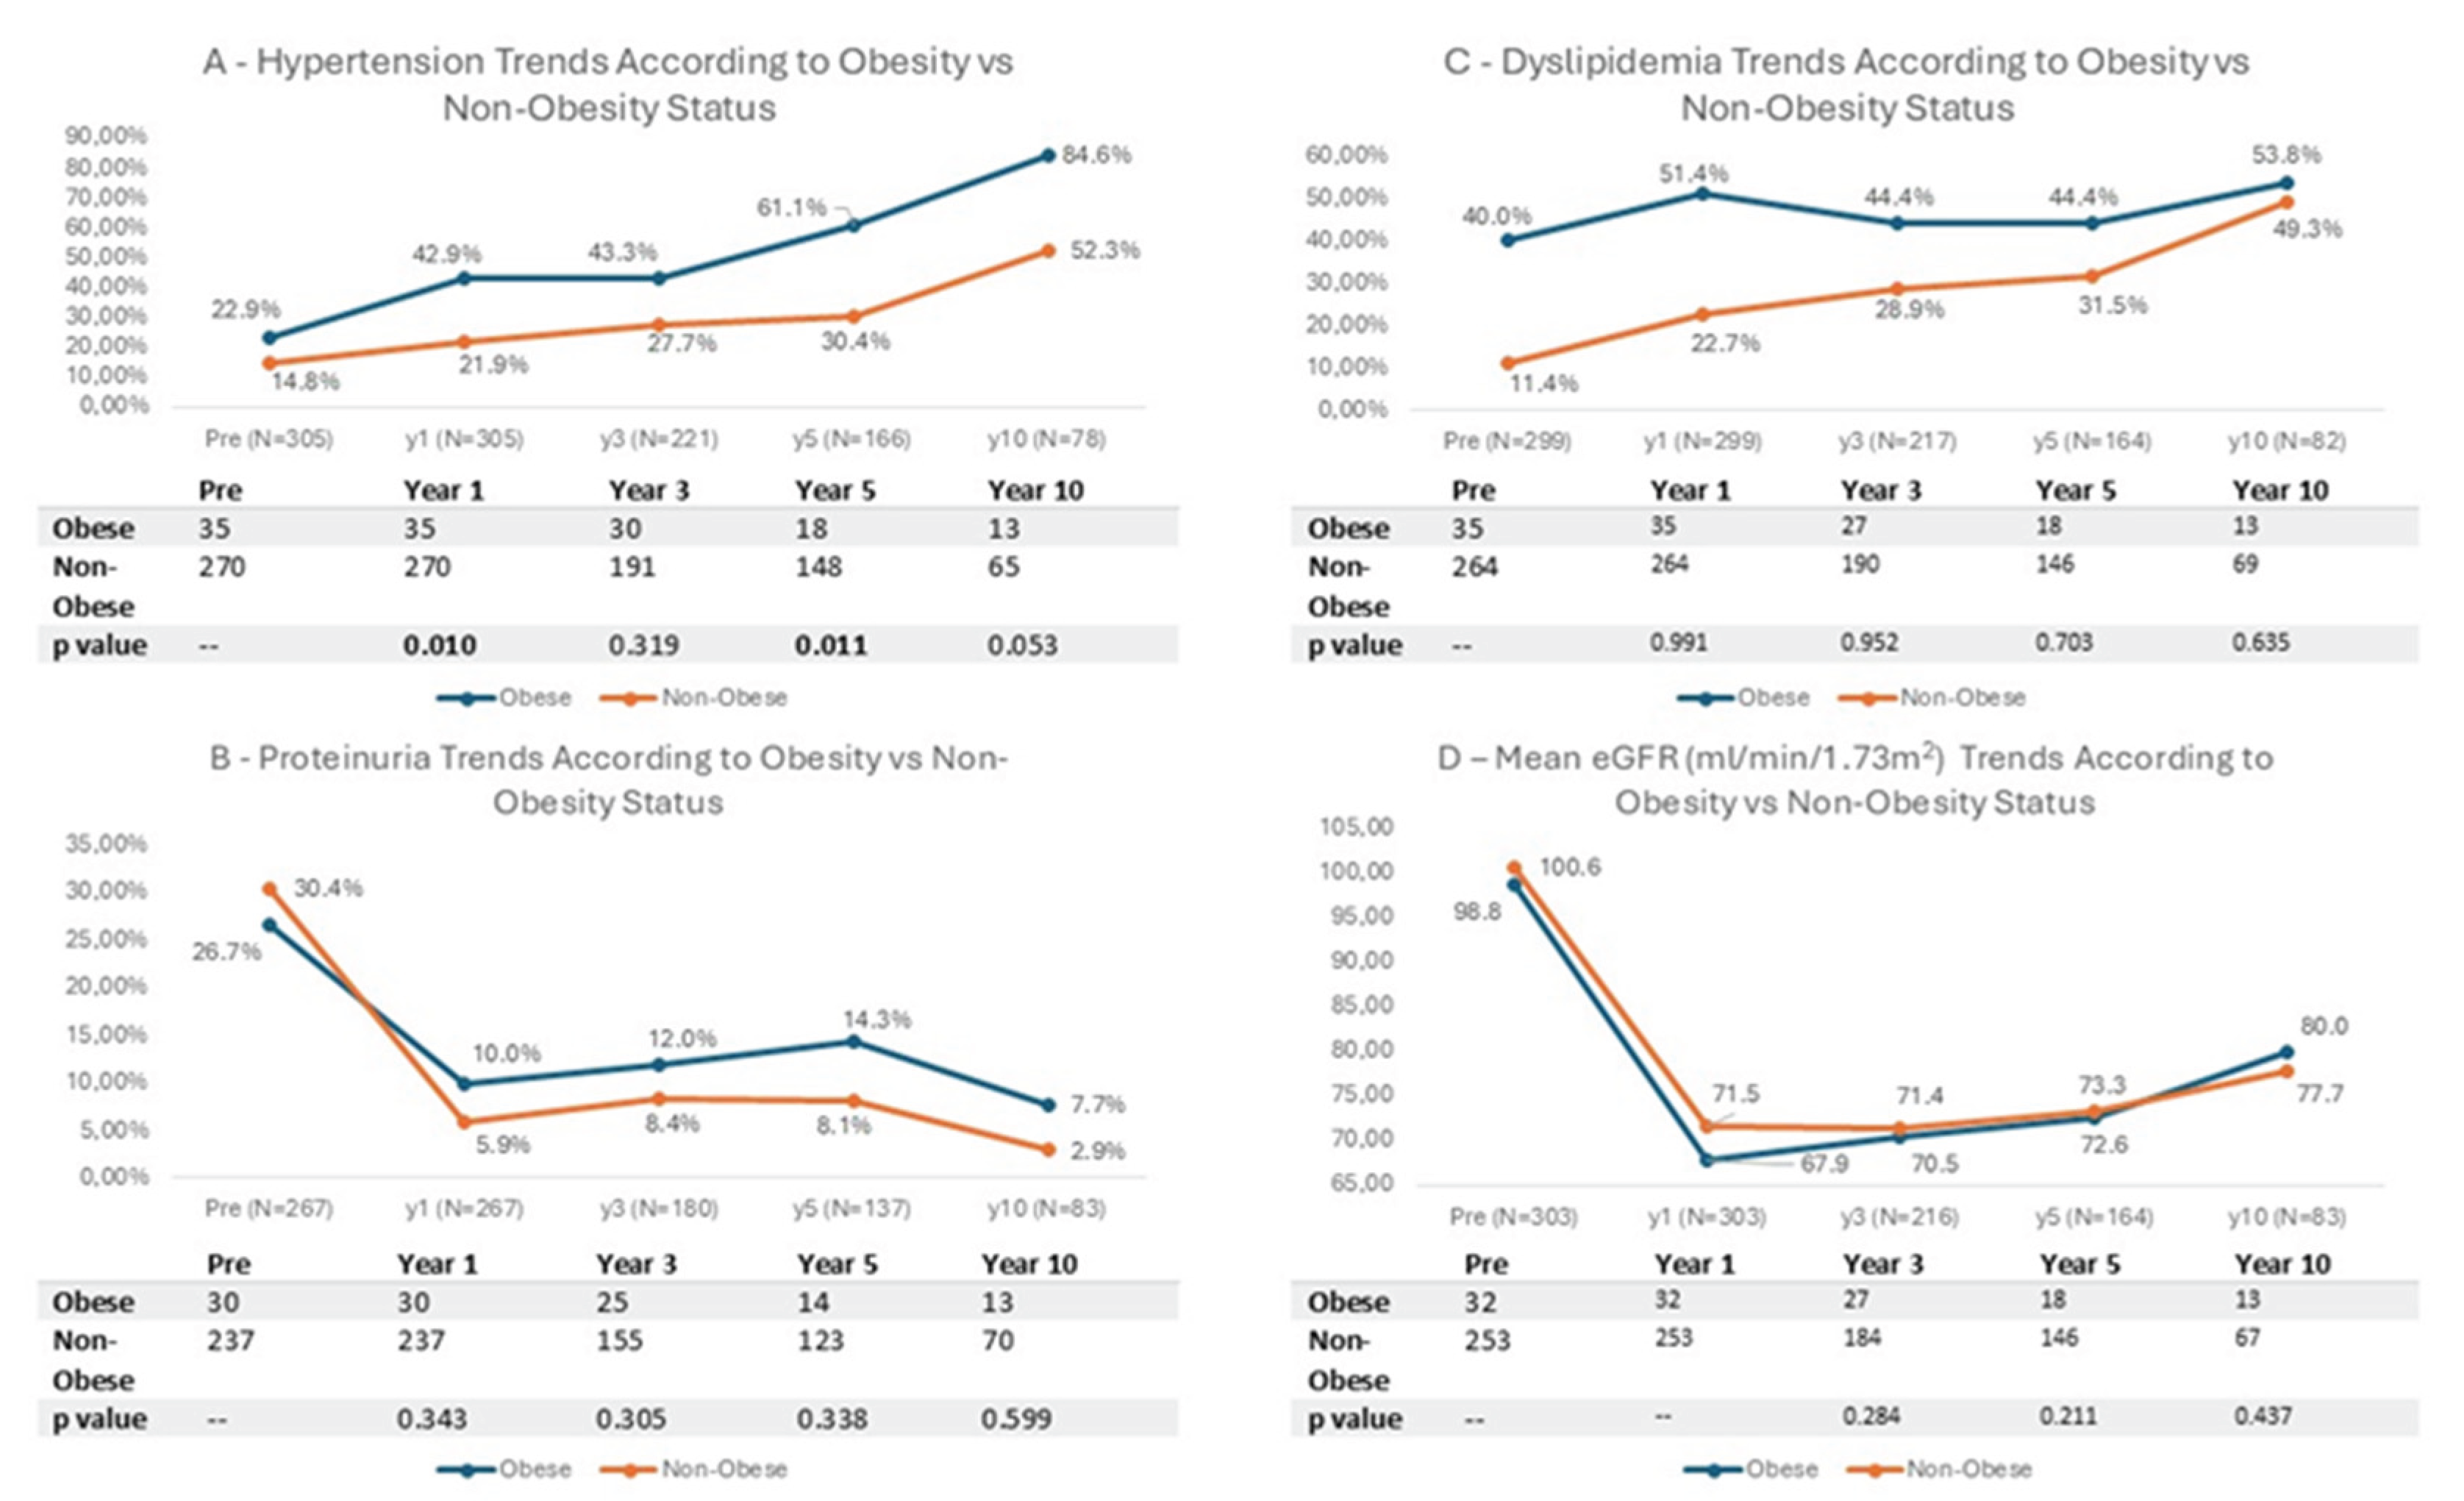

Table 1.
Baseline Characteristics of Kidney Donors Stratified by Pre-Donation Body Mass Index Status.
Table 1.
Baseline Characteristics of Kidney Donors Stratified by Pre-Donation Body Mass Index Status.
| Total | Normal weight (BMI < 25 kg/m2) |
Overweight (BMI 25-29,9 kg/m2) |
Obese (BMI ≥ 30 kg/m2) |
p | |
|---|---|---|---|---|---|
| N (%) | 306 (100%) | 150 (49%) | 124 (41%) | 32 (10%) | - |
| Age, mean±SD | 47.2±10.7 | 45.4±11.3 | 48.4±10.2 | 50.8±8.8 | 0.009 |
|
Age, n (%) < 40 40-55 >= 55 |
78 (25) 146 (48) 82 (27) |
50 (33) 65 (43) 35 (23) |
25 (20) 63 (51) 36 (29) |
3 (9) 18 (56) 11 (34) |
0.021 |
| Sex F, n (%) | 217 (71) | 114 (76) | 83 (67) | 20 (63) | 0.140 |
| BMI Kg/m2, mean ± SD | 25.3±3.4 | 22.5±1.7 | 27.3±1.4 | 31.2±1.1 | - |
| Smoking habits, n (%) | 49 (16) | 32 (21) | 13 (10) | 4 (13) | 0.045 |
| Dyslipidemia, n (%) | 44 (14) | 13 (9) | 18 (15) | 13 (41) | <0.001 |
| Total cholesterol, mean±SD | 194.3±37.2 | 188.2±36.0 | 196.5±36.2 | 214.3±40.2 | 0.001 |
| HT, n (%) | 48 (16) | 11 (7) | 24 (19) | 13 (41) | <0.001 |
| TAS, mean±SD | 122.5±13.4 | 118.8±12.0 | 125.0±13.3 | 130.0±14.3 | <0.001 |
| TAD, mean±SD | 73.2±8.7 | 71.6±8.2 | 74.2±8.9 | 76.8±8.8 | 0.002 |
| ProtU 0.15-0.5 g/g, n (%) | 87 (28) | 43 (29) | 33 (27) | 11 (34) | 0.683 |
| Serum creatinine, mean±SD | 0.75±0.16 | 0.73±0.15 | 0.76±0.17 | 0.78±0.15 | 0.115 |
| Pre- donation eGFR ml/min/1.73m2, mean ± SD | 100.3±14.6 | 102.4±15.0 | 98.9±13.9 | 96.3±14.5 | 0.038 |
|
Pre- donation eGFR ml/min/1.73m2, n (%) <80 80-90 >=90 |
27 (9) 47 (15) 232 (76) |
14 (9) 17 (11) 119 (79) |
10 (8) 22 (18) 92 (74) |
3 (9) 8 (25) 21 (66) |
0.278 |
| Related donor, n (%) | 104 (34) | 52 (35) | 40 (32) | 12 (38) | 0.830 |
BMI: Body Mass Index; SD: standard deviation; F: female; HT: Hypertension; TAS: Systolic Blood Pressure; TAD: Diastolic Blood Pressure; ProtU: Proteinuria; eGFR: Estimated Glomerular Filtration Rate.
Table 2.
Risk Factors at Donation for Post-Donation Obesity (Mixed Logistic Model).
| Multivariable OR (95% CI) |
P | |
|---|---|---|
| Time post-donation | 0.985 (0.844-1.150) | 0.848 |
| Age | 0.882 (0.808-0.963) | 0.005 |
| Female Sex | 3.250 (0.731-14.453) | 0.122 |
| BMI Kg/m2 | 5.324 (3.471-8.168) | <0.001 |
| Smoking habits | 0.450 (0.055-3.647 | 0.454 |
| HT | 0.182 (0.030-1.094 | 0.063 |
| Dyslipidemia | 6.048 (1.065-34.348) | 0.042 |
| ProtU 0.15-0.5 g/g | 0.361 (0.083-1.560) | 0.172 |
| Pre- donation eGFR ml/min/1.73m2 | 0.951 (0.899-1.006) | 0.080 |
| Related donor | 0.745 (0.194-2.831) | 0.668 |
OR: Odds Ratio; CI: Confidence Interval; BMI: Body Mass Index; HT: Hypertension; ProtU: Proteinuria (Protein-Creatinine Ratio); eGFR: Estimated Glomerular Filtration Rate.
Disclaimer/Publisher’s Note: The statements, opinions and data contained in all publications are solely those of the individual author(s) and contributor(s) and not of MDPI and/or the editor(s). MDPI and/or the editor(s) disclaim responsibility for any injury to people or property resulting from any ideas, methods, instructions or products referred to in the content. |
© 2025 by the authors. Licensee MDPI, Basel, Switzerland. This article is an open access article distributed under the terms and conditions of the Creative Commons Attribution (CC BY) license (http://creativecommons.org/licenses/by/4.0/).
Copyright: This open access article is published under a Creative Commons CC BY 4.0 license, which permit the free download, distribution, and reuse, provided that the author and preprint are cited in any reuse.


