
Submitted:
15 August 2025
Posted:
19 August 2025
You are already at the latest version
Abstract
Decision support systems are designed to help decision makers get a view of the present and the future under alternative scenarios. A decision support system is different from a typical dashboard application designed to represent current conditions and trends using a range of indicators and descriptive statistics. The paper is focused on decision support systems with three case studies. The first case study is about the integration of mobility data of populations available from Google with hospitalization data related to COVID 19. This data is from the pandemic era, and with Bayesian networks, provides an impact assessment of possible non-pharmaceutical interventions such as closure of airports. A second case study is from a usability assessment platform with data based on web surfing characteristics. A third application is a conflict resolution politography application where economic and other types of data are analysed to create a data driven narrative. These three different examples show how Bayesian networks can be used, in different contexts, to support decision support systems. The paper makes the link between decision support systems and Bayesian networks and provides examples of implementation. Section 1 is an introduction to decision support systems, sections 2, 3, and 4 cover the case studies. Section 5 is a concluding section sketching future research pathways.
Keywords:
decision support system
; Bayesian networks
; Corona pandemic
; web usability
; conflict resolution
; politography
1. Introduction to Decision Support Systems
Decision support systems combine data with visualization methods and analytics to support decision making. A related platform is known as a situation room or war room. These are dedicated spaces designed to enable teams to collaborate in order to solve complex problems and make critical decisions. It is an environment often used during emergencies and crisis management. Decision support systems are used more routinely than situation rooms, for example in managing industrial processes, customer service centers and health care systems.
Keen [1], Sprague [2] and Bonczek et al. [3] generally define decision support systems as data driven systems for use by managers. There is however a range of specific definitions determined by strategies for usage and implementation. The development and operation of decision support system can involve the management information system (MIS) manager who manages the process of developing and installing it, the information or data science specialists who build and develop it and the system designers who creates and assembles the technology on which these systems are based. Decision support systems are designed with the ability to integrate data from different sources and decision-making models.
Here, we consider decision support systems as data driven systems designed to reflect a current view of contextual conditions and provide the ability to evaluate the impact of alternative scenarios. This combination of data and analytic capabilities aim to support decision makers in the design and implementation of policies and decisions.
The case studies provided in the next three sections cover the management of the COVID 19 pandemic, the operations of a web site through usability indicators and studies of conflict resolution situations by decision makers and think tanks designing policies and strategies. In all three case studies, the decision support system we describe provides a report of current conditions. The system includes what if evaluations to enable the evaluation of alternative scenarios. These decision support system implementations, promote the use of prototypes followed by continued incremental development and responses to users' changing demands. A management approach that matches this approach is agile development consisting of relatively short cycles of development driven by the delivery of specific functionality. The cycles are called “sprints”, evaluations at the end of each cycle are called “scrums”, like in rugby. For more on agile development see Kenett [4] and Kenett et al. [5]. In this paper we focus on the functionality of decision support systems with special emphasis on applications of Bayesian networks.
Here, we do not introduce Bayesian networks theory, only show their application. References with details providing more in-depth background to this paper are Pearl [6], Salini and Kenett [7], Kenett [8,9,10], Pearl and Mackenzie [11] and Zhang and Kim [12]. The next three sections are self-contained case studies of decision support systems applications. We start with a decision support system used in managing pandemic outbursts.
2. The COVID 19 Case Study
The COVID-19 pandemic had far reaching consequences on global, national and local scales. Managing the pandemic was based on national policies which include movement restrictions (such as lockdowns) and massive testing to detect outbreaks. An important factor in handling pandemic outbreaks is population behavior and its cooperation with health authorities’ instructions. Public’s adherence to ministry of health instructions – e.g., wearing face masks, keeping physical distance and washing hands – is affected by psycho-social aspects such as trust in policy makers, fear and anxiety and quality of risk communication.
With the ongoing waves of the pandemic around the world, efforts to model population’s behavior were instigated to shed light on social processes that impact compliance with such instructions, as well as reveal social patterns and trends over time. The decision support system described below was part of this effort which included an integration of health related data from hospitals and population mobility data captured by Google mobility indicators.
COVID 19 pandemic management policies were based on national and local lockdowns including closures of air traffic hubs, education institutions, and most economic sectors. Citizens were called to adhere to protection measures, such as keeping physical distance, practicing hygiene measures and using face masks.
Governments applied policies of lockdowns and re-openings were decided according to the perceived "acceptable loss". Such decisions were based on identifying a balance between running the economy while minimizing economic and social damage versus the need to save lives. As expected, easing of lockdowns frequently led to an increase in morbidity. At the same time, lockdowns and quarantines caused severe damage in terms of social and economic considerations as reflected by increasing rates of domestic violence, unemployment, depression, non-normative behavior (alcohol drinking and drugs) among others. The decision support system presented in Kenett et al. [13], and introduced here, was designed to answer specific questions answered by an assessment of the impact of lockdowns on hospital admissions and COVID 19 related deaths.
Research has shown that citizens compliance with stay-at-home policies is predicted by perceived risks and trust in science and scientists, trust in the authorities Bargain and Aminjonov [14] and social capital, Borgonovi and Andrieu [15]. Moreover, restricted mobility directives (such as closures of air traffic, shopping malls, sport events and education institutions), were found to effectively prevent outbreaks and reduce the number of death cases. Furthermore, research has also found that citizens voluntarily decreased their mobility, even without official instructions to stay at home, Yilmazkuday [16]. This theoretical understanding needs to be quantified with modeling of relevant data.
The pandemic management decision support system in Kenett et al. [13] was designed and implemented in Israel and Italy by integrating hospital data from ministries of health with Google mobility data covering 130 countries that was available during the pandemic (https://www.google.com/covid19/mobility/). To set up the decision support system, a linked data base of health and mobility data was organized separately for each country with appropriate time lags. Data driven learning of Bayesian networks is possible with various algorithms (He et al., [17]. A Hill-climbing algorithm was then applied to these data sets in order to derive a Bayesian network structure. The learning algorithm was applied to the number of hospitalised COVID patients, the number of COVID19 related deaths and mobility data in various set ups such as workplaces, shopping centres and public transportation utilities. A structural equation models of the learned network was used to test the significance of links between variables. Structural equation models, also called path analysis, are often used in social sciences to represent links between observed and latent variables. As a next step, a Bayesian network of the significant effects was constructed. By conditioning on this Bayesian network, one can assess alternative scenarios corresponding to non-pharmaceutical interventions (NPI) such as restricting access to parks or airports. Figure 1 is a scenario from the COVID study based on data from Israel when all the NPI restrictions are set to state=1 (close) and Figure 2 is a scenario from the COVID study when all the NPI restrictions are set to state=2 (open). The figures are adapted from Kenett et al. [13]. The analysis shows the impact of non-pharmaceutical interventions in Israel on the number of patients admitted to hospital intensive care units (ICUs) and COVID related deaths.
Figure 1 and Figure 2 show distributions of discretized data representing mobility and COVID 19 health related data. The discretization was done separately for Israel and Italy to reflect the different country specific decision threshold guidelines. The arrows in the figures correspond to links between these discretized variables. Comparing Figure 1, with full restrictions, to Figure 2, with no restrictions, we see by how much the distribution of hosp and death changes. In particular, the percentage of level 3 (high number) increases in hosp from 19% to 39% and of death from 30% to 36%. The Bayesian network provides an analysis of scenarios with and without enforcing (or lifting) mobility restrictions, thus supporting decisions made by decision makers.
Kenett et al. [13] shows how combining structural equation models and Bayesian networks sets up a decision support system for pandemic management. Conditioning on this network enables a quantitative analysis of alternative scenarios. Figure 1 and Figure 2 are examples from a decision support system screen with interactive functionality. This case study demonstrates the ability of Bayesian networks to integrate data from different sources and to conduct evaluations of alternative scenarios. Bayesian networks also provide an effective visual rendering as implemented, for example in the bnlearn R application Scutari [18] or the GeNIe software (https://www.bayesfusion.com/genie/). The next case study is about a decision support system used in managing usability of websites.
3. The Web Site Usability Case Study
This section presents an overview of a decision support system used in managing usability of a website, the Decision Support system for User Interface Design (DSUID). For more details see Harel et al. [19] and Kenett et al. [20]. The DSUID includes analytic method based on the integration of models for estimating and analyzing website visitors' activities. DSUID consists of a seven-layer model described below, with an example of a Bayesian network applied to clickstream data.
The goal of usability design diagnostics is to identify, for each website page, design deficiencies that hamper the positive navigation experience. To understand the user experience, we need to know the user activity, compared to the user expectation. The diagnosis of design deficiency involves measurements of the site navigation, statistical calculations and statistical decision.
How can we tell whether website visitors encounter difficulties in exploring a particular page, and if so, what kind of difficulty do they experience. Website visitors are usually task driven, but we do not know if the visitors’ goals are related to a specific web page. Also, we usually cannot tell if visitors know anything a priori about the site, if they believe that the site is relevant to their goals, or if they have visited it before. It may be that the visitors are simply exploring the site, or that they follow a procedure to accomplish a task. Yet, their behaviors reflect their perceptions of the site contents. Server logs provide time stamps for all hits, including those of page html text files, but also of image files and scripts used for the page display. The time stamps of the additional files enable us to estimate three important time intervals:
- The time the visitors wait until the beginning of the file download, is used as a measure of page responsiveness;
- The download time used as a measure of page performance;
- The time from download completion to the visitor's request for the next page. This is a time stamp of when the visitor reads the page content, but also does other things, some of them unrelated to the page content.
The DSUID needs to decide, based on statistics of these time intervals, whether the visitors feel comfortable during the web site navigation; if they feel that they wait too much for the page download and how they feel about what they see on webpage screen.
We want to determine if a time interval is acceptable by page visitors, is too short, or is too long. For example, consider an average page download time of 5 seconds. If they expect the page to load fast, site visitors may regard it as too lengthy. For example, in response to a search request. However, 5 seconds may be acceptable if the user’s goal is to learn or explore specific information.
The diagnostic-oriented time analysis is observing the correlation between the page download time and the page exits. If the visitors are indifferent about the download time, then the page exit rate will be invariant with respect to the page download time. However, if the download time matters, then the page exit rate depends on the page download time. When the page download time is acceptable, most visitors may stay on the site, looking for additional information. When the download time is too long, more visitors might abandon the site, and go to other websites. The longer the download time, the higher is the exit rate. In operating a DSUID one distinguishes between three status conditions:
- Design - At this state, data is collected and analyzed. System architects and designers develop guidelines and operating procedures representing accumulated knowledge and experience on preventing operational failures. A prototype DSUID is then developed
- Testing – the prototype DSUID is subjected to beta testing. This is repeated when new website versions are launched for evaluating the way they are actually being used.
- Tracking - ongoing DSUID tracking systems are required to handle changing operational patterns. Statistical process control (SPC) is employed to monitor the user experience by comparing actual results to expected results, acting on the gaps.
In setting up a DSUID we identify several layers of data collection and data analytics:
The first and lowest layer – user activity. This layer records correspond to significant user actions (involving screen changes or server-side processing).
The second layer – page hit attributes. This layer consists of download time, processing time and user response time.
The third layer – transition analysis. The third layer data are about transitions and repeated form submission (indicative of visitors' difficulties in form filling)
The fourth layer – User problem indicator identification. Indicators of possible navigational difficulty, including: a) Predicted estimates for site exit by the time elapsed until the next user action (as no exit indication is recorded on the server log file), b) Backward navigation and c) Transitions to main pages, interpreted as escaping current sub task.
The fifth layer – usage data. It consists of usage statistics, such as:
- Average entry time
- Average download time
- Average time between repeated form submission
- Average time on website (indicating content related behavior)
- Average time on a previous screen (indicating ease of link finding).
The sixth layer – statistical decision. For each of the page attributes, DSUID compares the data over the exceptional page views to those over all the page views. The null hypothesis is that (for each attribute) the statistics of both samples are the same. A simple two-tailed t test can be used to reject it, and therefore to conclude that certain page attributes are potentially problematic. A typical error level is set to 5%.
The seventh and top layer – interpretation. For each of the page attributes DSUID provides a list of possible reasons for the difference between the statistics over the exceptional navigation patterns and that over all the page hits. Typically the usability analyst decides which of the potential source of visitors' difficulties is applicable to the particular deficiency.
Bayesian networks are used in the 4-7th layers of a DSUID system. Figure 3 and Figure 4, prepared with GeNIe 2.0, present Bayesian Networks derived from analysis of web log analyzers. The networks indicate associations between page size, text size, download time, reading time, seek time, reading time, back activations and exits.
With low seek time we see 49% of high (s4) and very high exit rates (s5). With high seek time these numbers jump to 96%. Clearly seek time affects the behavior of the users.
This case study introduces a seven layer architecture used to design a decision support system aimed at tracking usability of web sites. The characteristics of DSUID can be generalized to other applications such as industrial process management where online data from sensors is used to manage processes.
4. The Conflict Resolution Case Study
Politography refers to an analysis of how nations, states, or any political entities interact in relation to each other. In specific research projects it consists of a data-driven tool describing, measuring, and evaluating the level of control between political entities over particular territories or domains. This context is primarily empirical and analytic, aiming to inform political decision-making about current and project changes in loci of control. A more general perspective applies politography to regional conflicts and is classified as a conflict resolution or conflict management tool. Here we consider politography as a decision support system.
Below, we describe the design and construction of a politography decision support system for policy makers related to intergroup conflict management, focused on the Israeli-Palestinian conflict. It provides a case study that can be generalized to other applications. The decision support system integrates over 9000 indicators pertaining to geographical areas labeled A, B, and C. The designated areas have distinct legal status specified in the 1993 Oslo Accords. A second level of the decision support system hierarchy consists of three domains that characterize levels of control, in each one of the geographic areas: security, geo-spatial, and economic. In addition, the system contains contextual data from different sources such as political, diplomatic, social, and legal domains. For more details on this case study see Arieli et al. [21].
In developing a Politography decision support system the main methodological challenges include:
- i)
- Integrating data from different sources and in different update timings and units
- ii)
- Defining composite indicators that provide unified views
- iii)
- Tracking and modeling trends at various levels of the system hierarchy
- iv)
- Analyzing alternative scenarios for supporting decision makers
The methodology applied in designing and implementing the Politography decision support system involved four parts: i) Map, ii) Construct, iii) Identify and iv) Analyze.
I. Map control factors into economic, security and geo-spatial (demographic) domains. In this phase, experts determine indicators reflecting domains of control by geographical area such as: economic, security and geo-spatial domains. A methodology for supporting this part is the Goals-Question-Metrics (GQM) approach presented in Van Solingen et al. [22]. The GQM steps are: 1) Generate a set of goals, 2) Derive a set of questions relating to the goals and 3) Develop a set of metrics needed to answer the questions. Data can be viewed using dynamic graphs with an ability of zooming on any individual indicator and by navigating the data hierarchy.
II. Construct an integrated database combining indicators from different domains, by year or by quarter. In this phase research teams load data into a database and compute indices relative to a common annual baseline. The Politography decision support system updates a configuration file with indicator names and identifies missing values and outliers. We determine data subsets for use in integration (by year or quarter), conduct linkage analysis to get integrated data.
III. Identify trends in individual indicators and composite indicators and compute relative control level by year by entity over one of the predetermined territories listed above. For trend analysis, we compute composite indicators by domain using the median. Bar charts, trend charts and variable cluster analysis is used to identify the most representative cluster indicator. In addition, domains are combined to compute an overall trend with a composite indicator. The method applied to define composite indicators is by computing individual indicators relative to a base year and then use the yearly median across indicators. To derive the combined composite indicators for each indicator, Yi(x), we define a desirability function di(Yi) which assigns numbers between 0 and 1 to the values of Yi. The value di(Yi)=0 represents an undesirable value of Yi and di(Yi)=1 represents a desirable or ideal value. The individual desirabilities are then combined to an overall desirability index using the geometric mean of the individual desirabilities:
where k denotes the number of indicators. Notice that if any response Yi is completely undesirable (di(Yi) = 0), then the overall desirability is zero. To account for this “zero control” we apply an additional step that mitigates such cases and the desirability function is used as a composite Indicator based on individual indicators. The final composite indicators are plotted on a Y by X graph, with four triangular quadrants. Each triangle represents a different combination of Israeli and PA control level. For more on desirability functions see Derringer and Suich [23].
Overall Desirability Function = [(d1(Y1) x d2(Y2))x … dk(Yk))]1/k
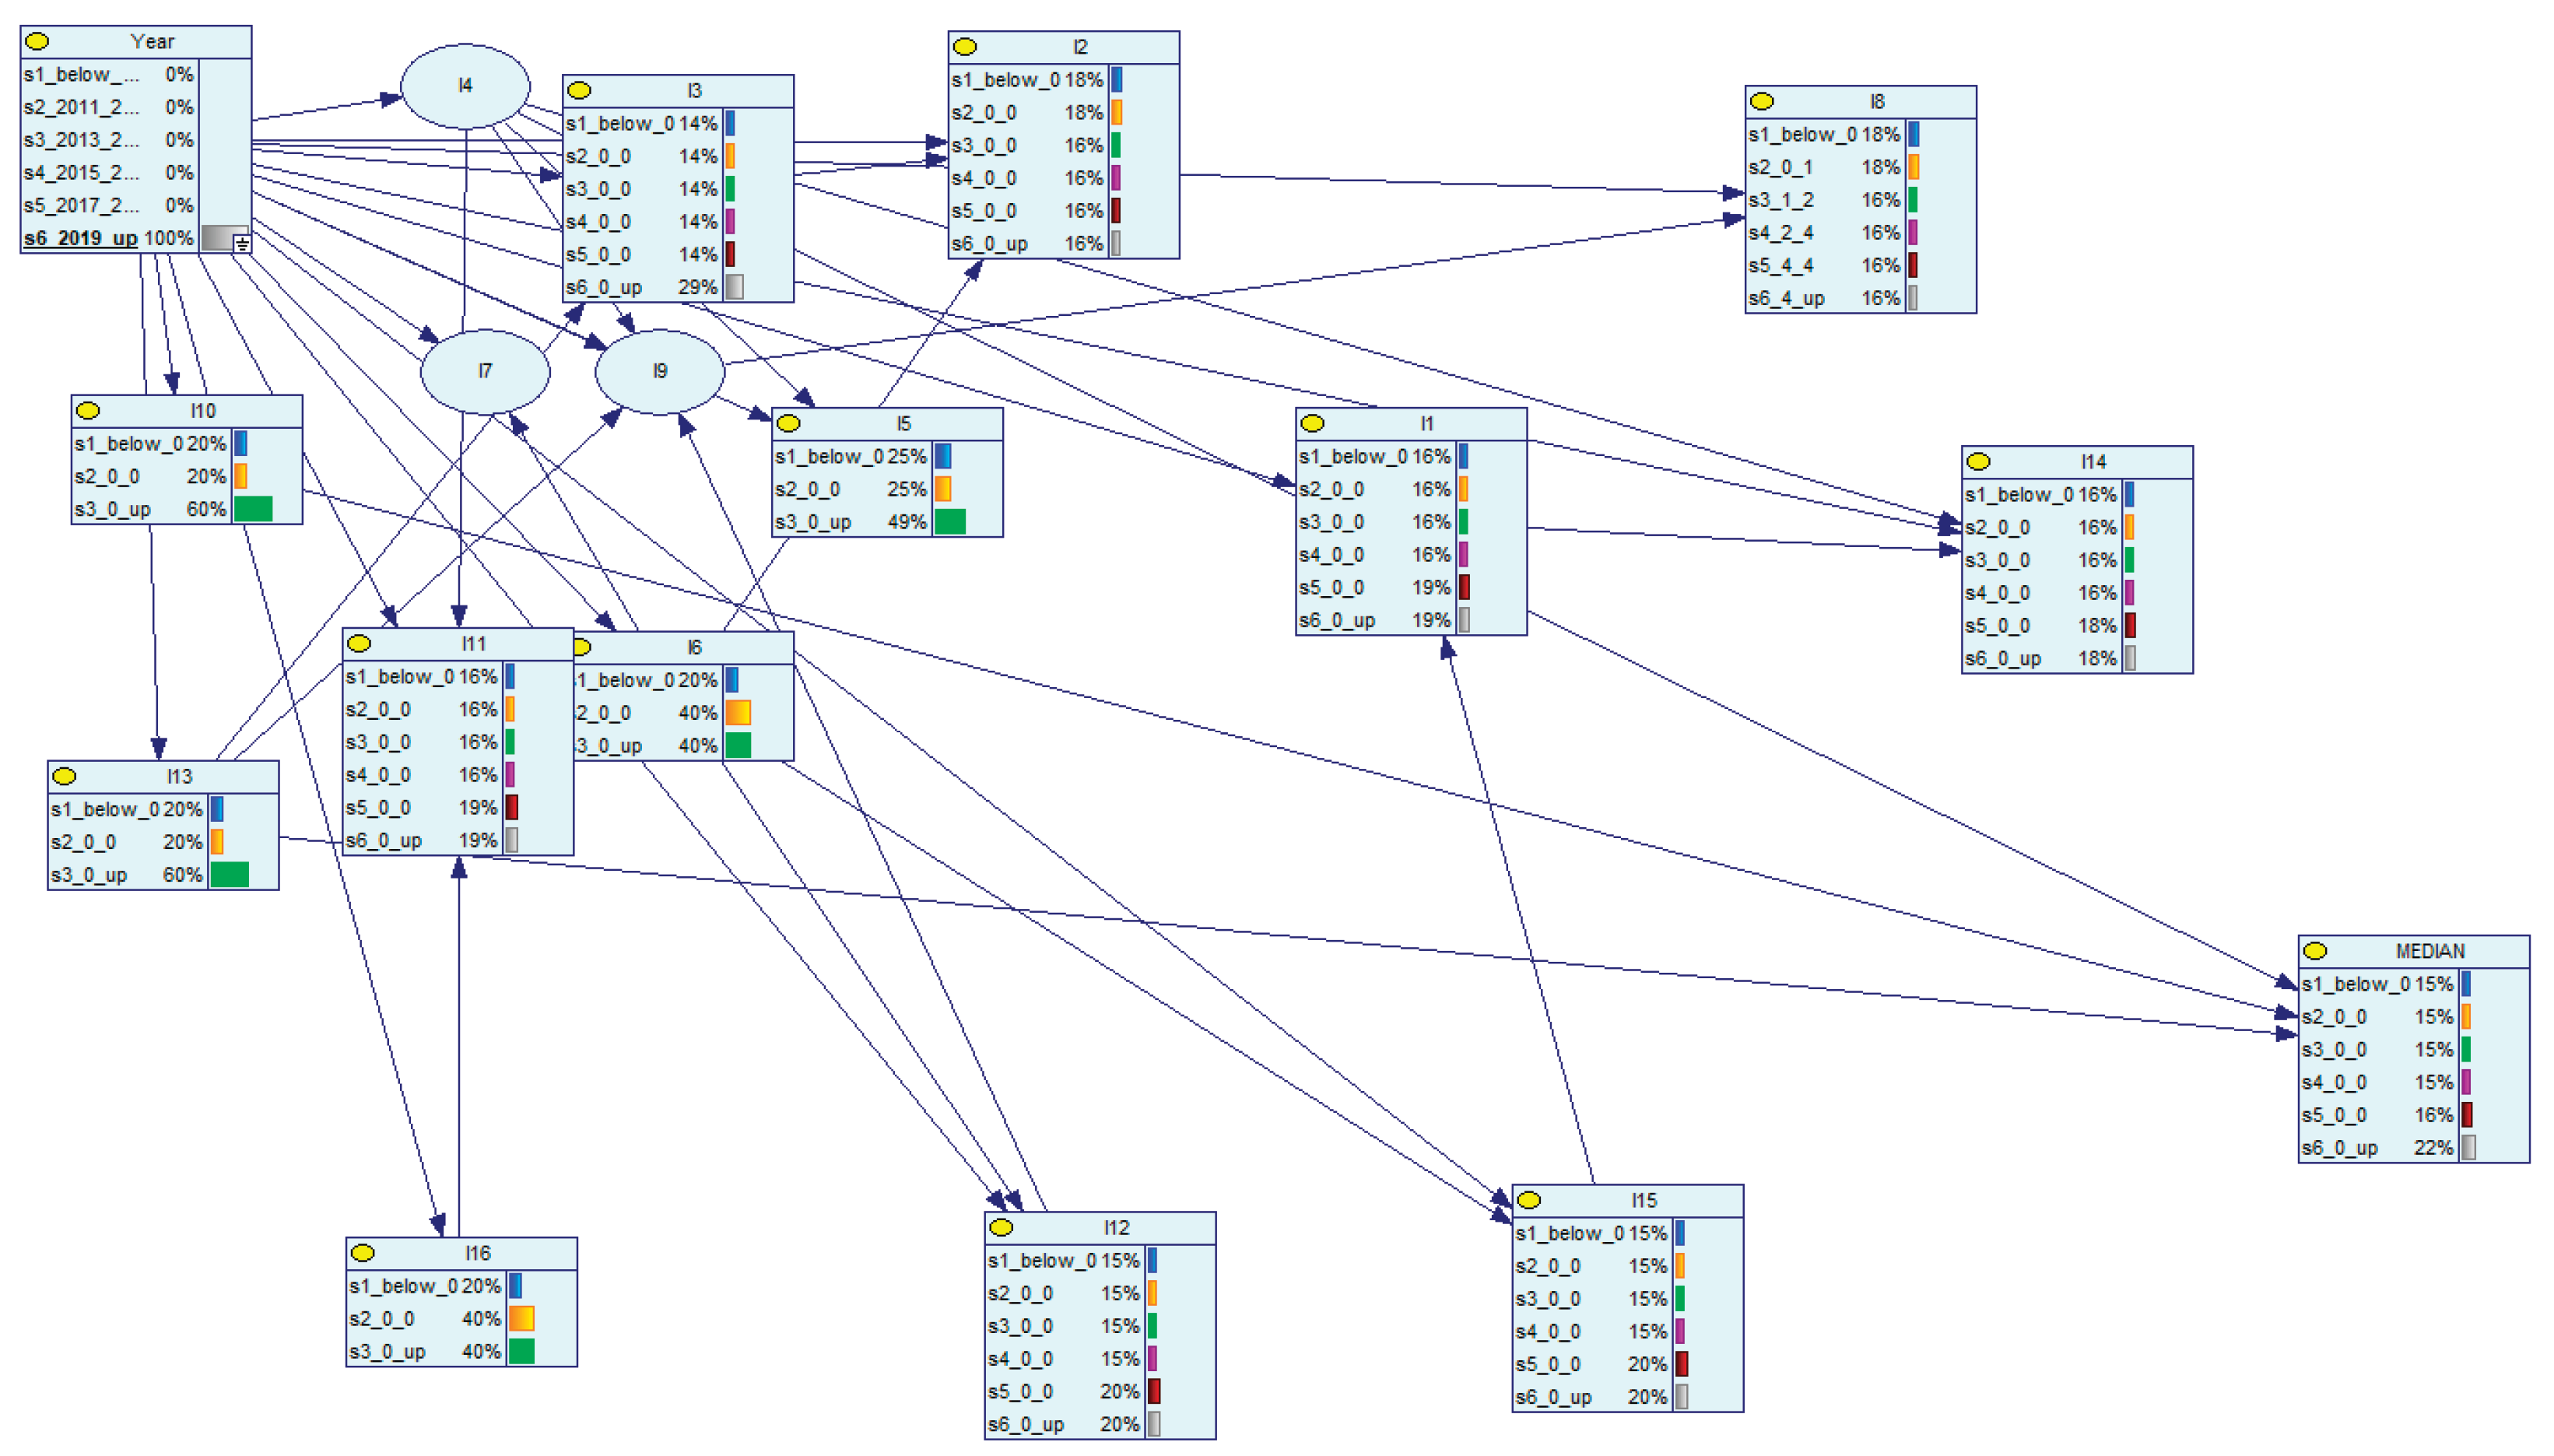
IV. Analyze scenarios by determining list and contribution of indicators affecting target indicators. Here we apply Bayesian network analysis in order to understand links between indicators from the same or different domains, and how changes in the level of one indicator influences the other indicators. This provides the ability to run what-if scenarios to assist policymakers in making informed decisions that account for consequences of policy decisions. We demonstrate below an application of Bayesian networks to a subset of 18 indicators labeled I1-I16 over 12 years (2010-2021). The data analyzed is calibrated to the year 2022 as base line. The last column, labeled MEDIAN, is the median of the row used as a composite indicator representing the specific year. We first discretize the data and the indicator data were classified into 3 groups of equal width.
From this data we can derive a directed acyclic graph as shown in Figure 5.
In Figure 6 we show the network, conditioned on the year 2010 and, in Figure 7, the data is conditioned on years above 2019. In Figure 6 we see that indicator I10 is, with a probability of 60%, in the lowest category and in Figure 7, 9 years later, this probability drops to 20%.
These model driven estimates provide probabilistic statements to changes over time. This Bayesian network analysis provides the decision support system with an ability to consider future looking alternative scenarios.
5. Discussion and Future Research Pathways
As mentioned in the introduction, decision support systems are fed with multivariate data in order to provide a status report in specific contexts. Bayesian networks can then be used to link variables and then, by conditioning the network, evaluate the impact of specific decisions. Situation rooms and war rooms also mentioned in the introduction were initially designed to provide a reflection of reality such as in a combat zone.
With modern sensor technology, powerful computing, advanced analytics and flexible systems, one is seeing a world wide development of digital twins that consist of digital assets in parallel to physical assets, Kenett et al. [24]. Digital assets are designed and implemented to provide monitoring, diagnostic, prognostic and prescriptive capabilities supporting the performance of systems. Digital twins have been implemented in a wide range of domains including health care, energy management and social ecosystems, see Elkefi and Asan, [25], and Yossef Ravid and Aharon-Gutman, [26].
Decision support systems can be integrated in a digital twin to provide diagnostic and predictive capabilities, Kenett et al. [27]. Diagnostics can be achieved with Bayesian networks by conditioning on target variables at the end of the directed acyclic graph. Conditioning on parent variables enables prognostic capabilities.
In the future we see decision support systems integrate within digital twins,
A more general perspective is to consider developments in analytics, in the context of decision support systems. The exponential growth of artificial intelligence and data science has forced some rethinking on the role of statistics and analytics, especially with big or massive data sets, see Kenett [28] and Ruggeri et al. [29]. An additional direction with significant impact is the exponential interest in large language model (LLM) applications, Kenett [24], and related prompt engineering methodologies. These LLM can operate on data scrapped from open media and publications or specific corpora of documents like Google notebookLM (https://notebooklm.google/).
The paper covers three case studies where Bayesian networks were applied in the context of a decision support system. The case studies are from epidemiology, website engineering and political science. They cover completely different domains and show different methodologies of designing and implementing decision support systems. A comprehensive approach to such initiatives is needed and this provides opportunities for future research covering both applied and theoretical developments. This can impact the future of civic societies as envisaged over 120 years ago (Geddes [30]).
References
- Keen, P. G. (1980). Decision support systems: a research perspective. In Decision support systems: Issues and challenges: Proceedings of an international task force meeting (pp. 23-44).
- Sprague Jr, R. H. (1980). A framework for the development of decision support systems. MIS quarterly, 1-26.
- Bonczek, R. H., Holsapple, C. W., & Whinston, A. B. (2014). Foundations of decision support systems. Academic Press.
- Kenett, R. S. (2013). Implementing SCRUM using business process management and pattern analysis methodologies. Dynamic Relationships Management Journal, 2(2), 29-48. [CrossRef]
- Kenett, R. S., Harel, A., & Ruggeri, F. (2018). Agile Testing with User Data in Cloud and Edge Computing Environments. Analytic Methods in Systems and Software Testing, 353-371, John Wiley and Sons.
- Pearl, J. (1995). Causal diagrams for empirical research. Biometrika, 82(4), 669-688.
- Salini, S., & Kenett, R. S. (2009). Bayesian networks of customer satisfaction survey data. Journal of Applied Statistics, 36(11), 1177-1189. [CrossRef]
- Kenett, R. S. (2016). On generating high InfoQ with Bayesian networks. Quality Technology & Quantitative Management, 13(3), 309-332. [CrossRef]
- Kenett, R. S. (2017). Bayesian networks: Theory, applications and sensitivity issues. Encyclopedia with Semantic Computing and Robotic Intelligence, 1(01), 1630014. [CrossRef]
- Kenett, R. S, (2021) Introduction aux réseaux Bayésiens et leurs applications in Statistique et causalité, Bertrand, F., Saporta, G., & Thomas-Agnan, C. (editeurs), Editions Technip.
- Pearl, J., & Mackenzie, D. (2018). The book of why: the new science of cause and effect. Basic books.
- Zhang, Y., & Kim, S. (2024). Gaussian Graphical Model Estimation and Selection for High-Dimensional Incomplete Data Using Multiple Imputation and Horseshoe Estimators. Mathematics, 12(12), 1837. [CrossRef]
- Kenett, R. S., Manzi, G., Rapaport, C., & Salini, S. (2022). Integrated analysis of behavioural and health COVID-19 data combining Bayesian networks and structural equation models. International Journal of Environmental Research and Public Health, 19(8), 4859. [CrossRef]
- Bargain, O., & Aminjonov, U. (2020). Trust and compliance to public health policies in times of COVID-19. Journal of public economics, 192, 104316. [CrossRef]
- Borgonovi, F., & Andrieu, E. (2020). Bowling together by bowling alone: Social capital and Covid-19. Social science & medicine, 265, 113501. [CrossRef]
- Yilmazkuday, H. (2021). Stay-at-home works to fight against COVID-19: International evidence from Google mobility data. Journal of Human Behavior in the Social Environment, 31(1-4), 210-220. [CrossRef]
- He, C., Di, R., & Tan, X. (2023). Bayesian Network Structure Learning Using Improved A* with Constraints from Potential Optimal Parent Sets. Mathematics, 11(15), 3344. [CrossRef]
- Scutari, M. (2010). Learning Bayesian networks with the bnlearn R package. Journal of statistical software, 35, 1-22.
- Harel, A., Kenett, R. S., & Ruggeri, F. (2008). Modeling web usability diagnostics on the basis of usage statistics. Statistical Methods in e-Commerce Research, 131-172.
- Kenett, R. S., Harel, A., & Ruggeri, F. (2009). Controlling the usability of web services. International Journal of Software Engineering and Knowledge Engineering, 19(05), 627-651. [CrossRef]
- Arieli, S., Jacob, R. B., Hirschberger, G., Hirsch-Hoefler, S., Kenett, A., & Kenett, R. S. (2024). A Decision Support Tool Integrating Data and Advanced Modeling. https://www.preprints.org/frontend/manuscript/2ca01bfd9883060d7dc9f200b43b2a46/download_pub.
- Van Solingen, R., Basili, V., Caldiera, G., & Rombach, H. D. (2002). Goal Question Metric approach. Encyclopedia of software engineering. John Wiley and Sons.
- Derringer, G., & Suich, R. (1980). Simultaneous optimization of several response variables. Journal of quality technology, 12(4), 214-219. [CrossRef]
- Kenett, R.S. (2025) Experiments with prompt engineering, https://papers.ssrn.com/sol3/papers.cfm?abstract_id=5361981.
- Elkefi, S., & Asan, O. (2022). Digital twins for managing health care systems: rapid literature review. Journal of medical Internet research, 24(8), e37641. [CrossRef]
- Yossef Ravid, B., & Aharon-Gutman, M. (2023). The social digital twin: The social turn in the field of smart cities. Environment and Planning B: Urban Analytics and City Science, 50(6), 1455-1470. [CrossRef]
- Kenett, R.S., Davidyan, G. & Bortman, J. (2025) Digital Twins: Strategic and Methodological Aspects, https://papers.ssrn.com/sol3/papers.cfm?abstract_id=5213512.
- Kenett, R.S. (2020) Statistics at a crossroad, University of Milan statistics seminar, https://ceeds.unimi.it/wp-content/uploads/2020/02/Kenett_Seminar_2020.pdf.
- Ruggeri, F., Banks, D., Cleveland, W. S., Fisher, N. I., Escobar-Anel, M., Giudici, P., ... & Zhang, Z. (2025). Is There a Future for Stochastic Modeling in Business and Industry in the Era of Machine Learning and Artificial Intelligence? Applied Stochastic Models in Business and Industry, 41(2), e70004. [CrossRef]
- Geddes. (1904). Civics: as applied sociology. The Sociological Review, (1), 100-118.
Figure 1.
Bayesian network with the scenario when all the NPI restrictions are enforced, i.e., set to state=1 (close).
Figure 1.
Bayesian network with the scenario when all the NPI restrictions are enforced, i.e., set to state=1 (close).
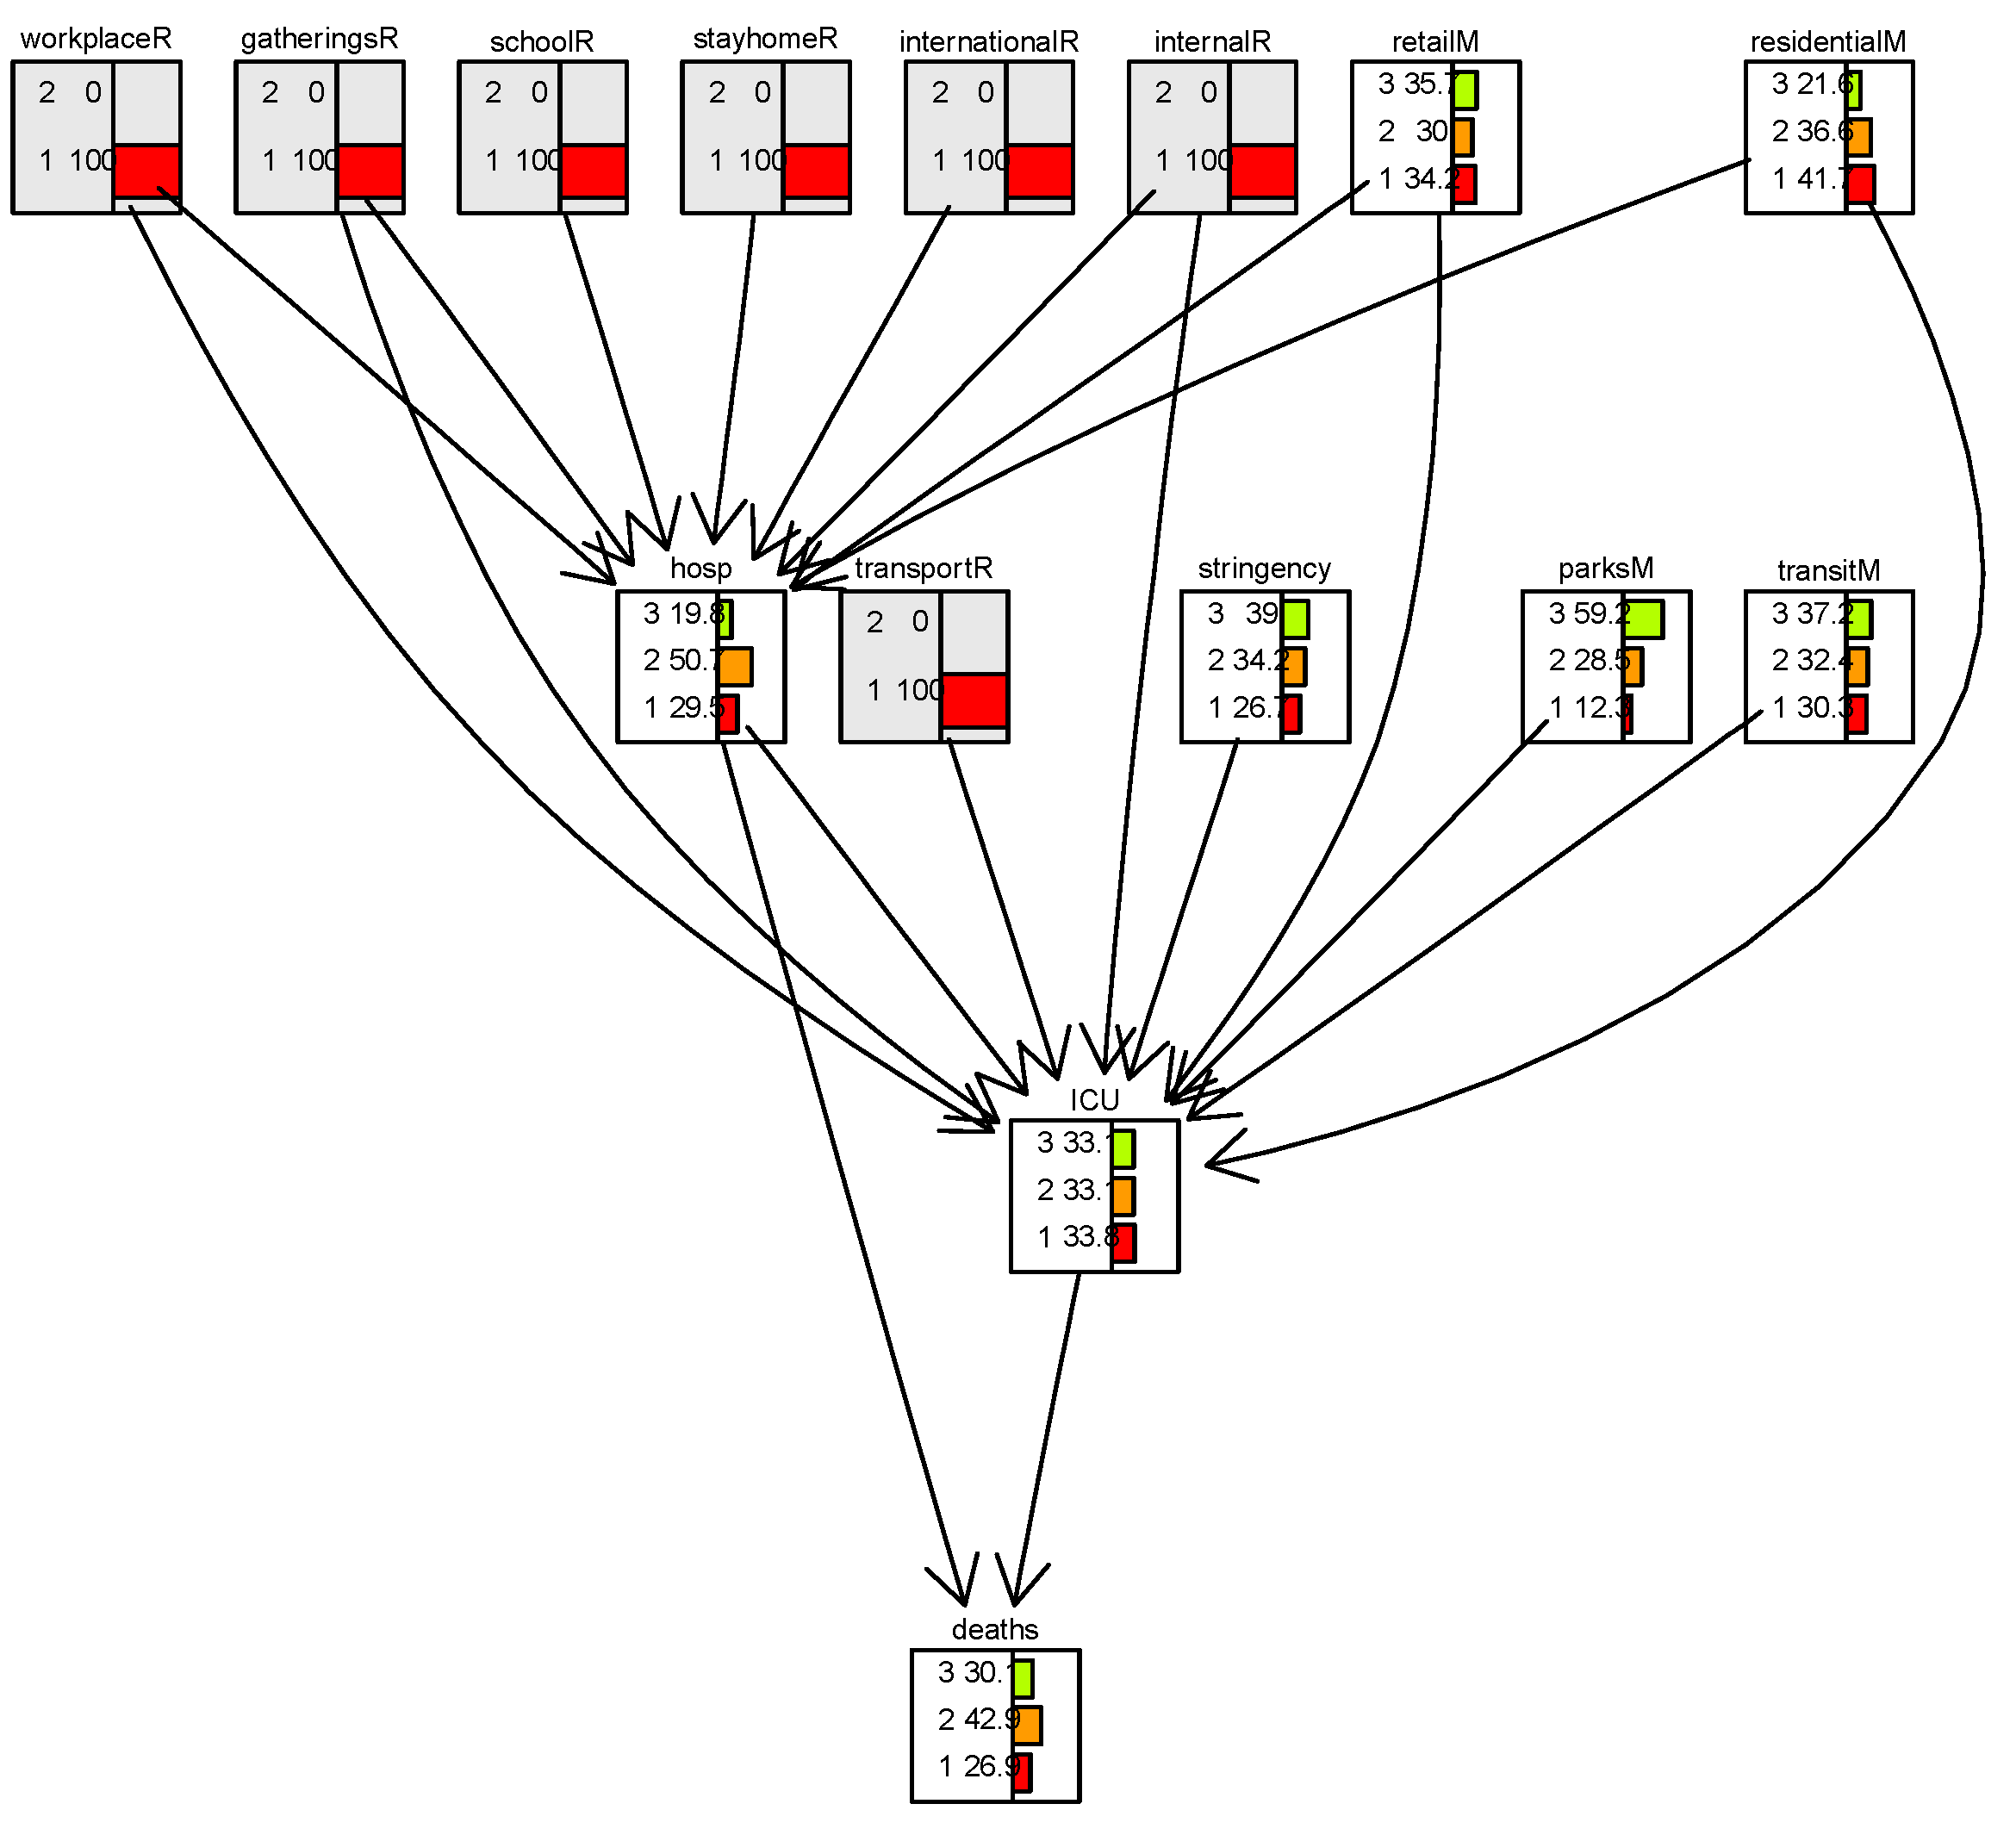
Figure 2.
Bayesian network with the scenario when all the NPI restrictions are lifted, i.e., set to state=2 (open).
Figure 2.
Bayesian network with the scenario when all the NPI restrictions are lifted, i.e., set to state=2 (open).
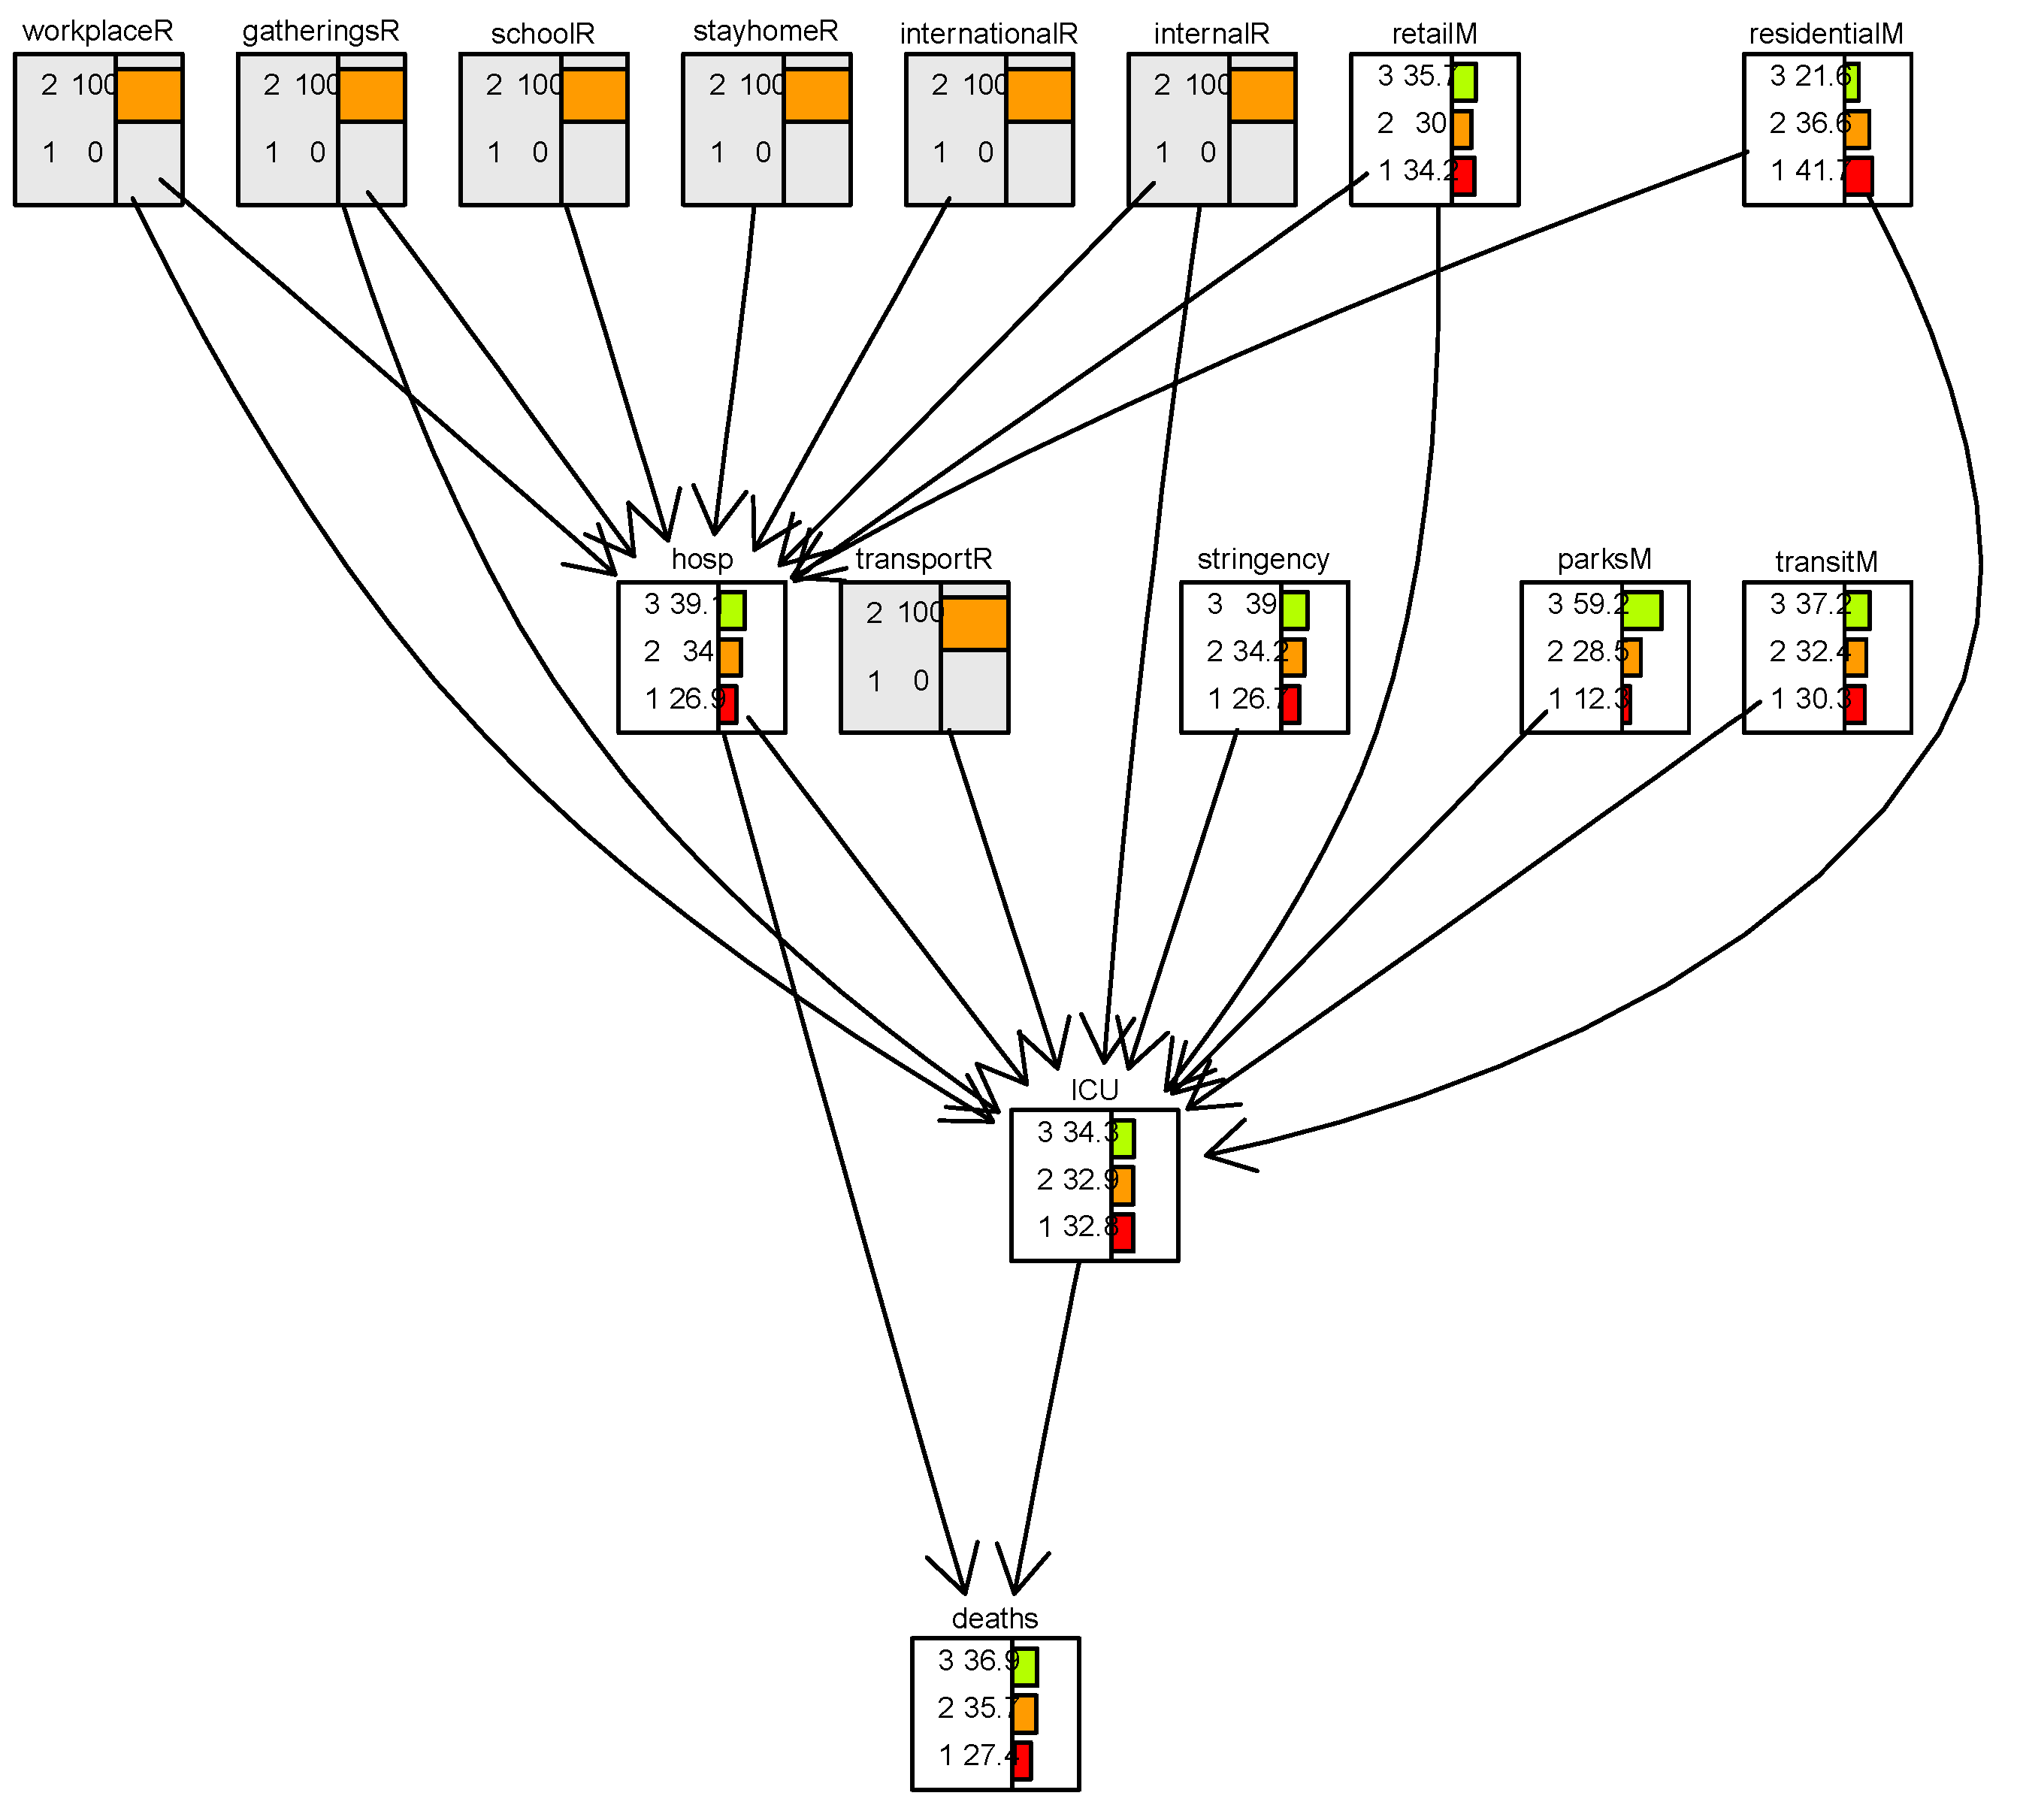
Figure 3.
a Bayesian network of web log data, conditioned on low seek time (at level s2).
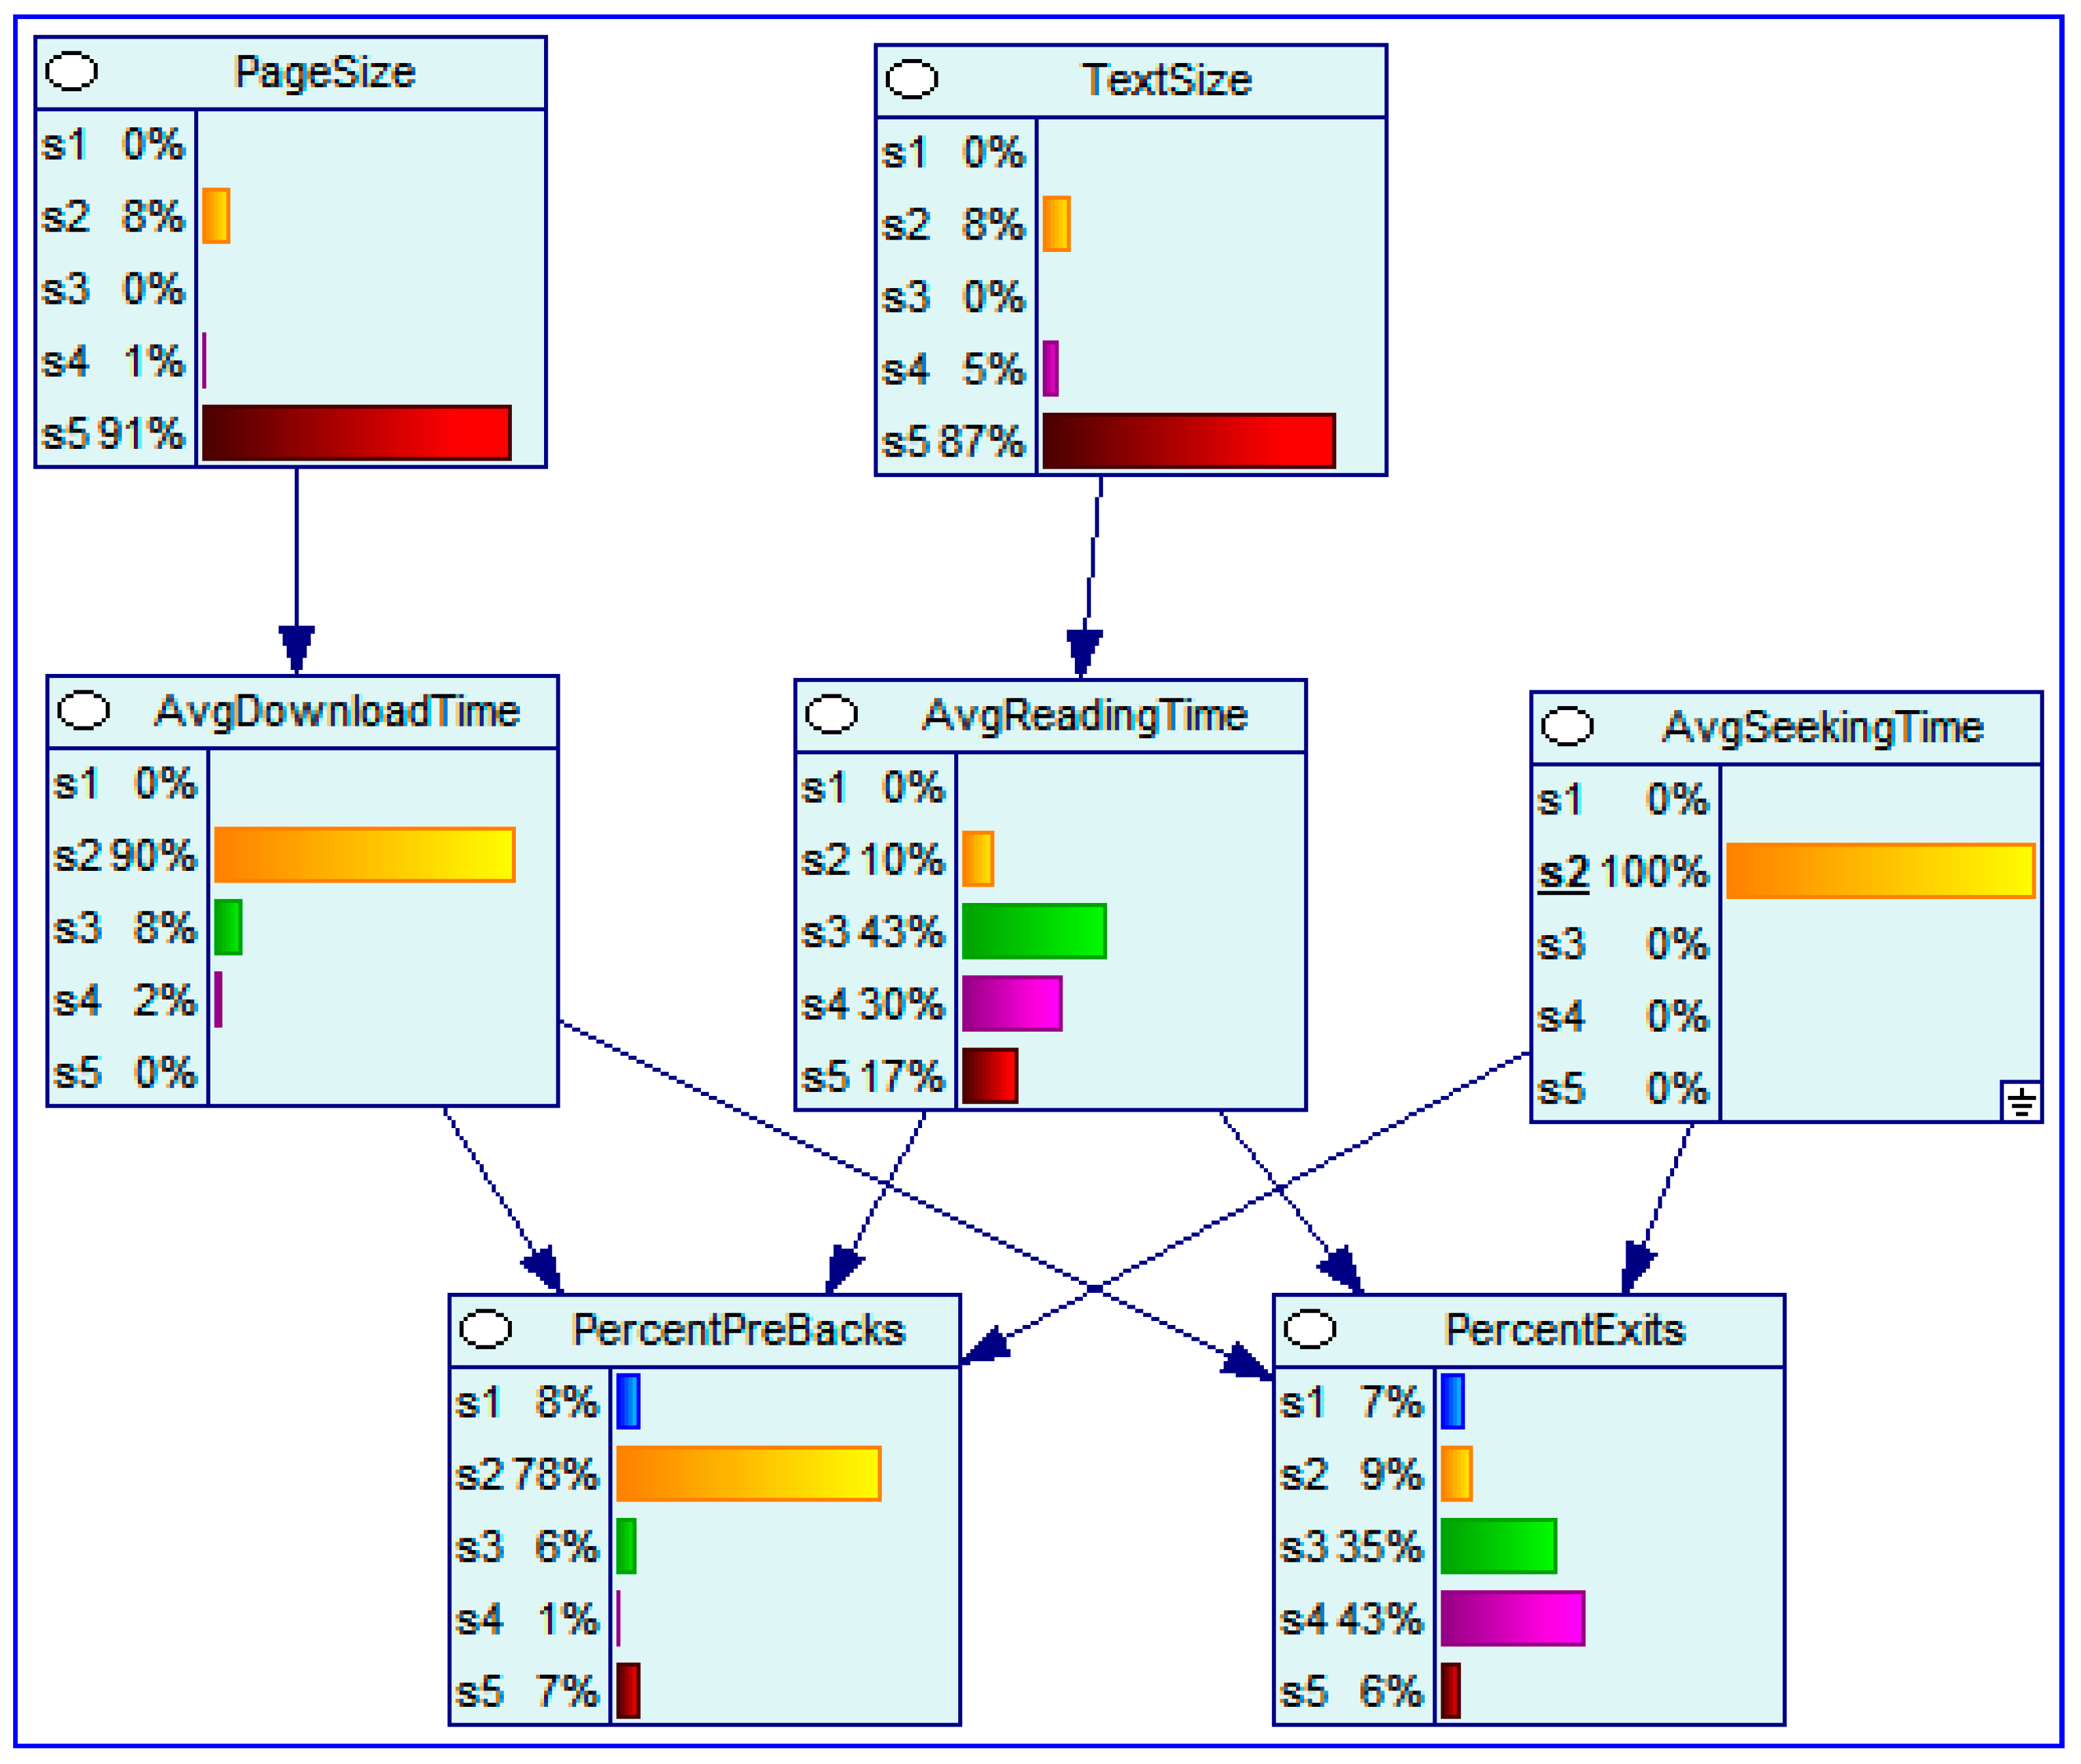
Figure 4.
a Bayesian network of web log data, conditioned on high seek time (at level s5).
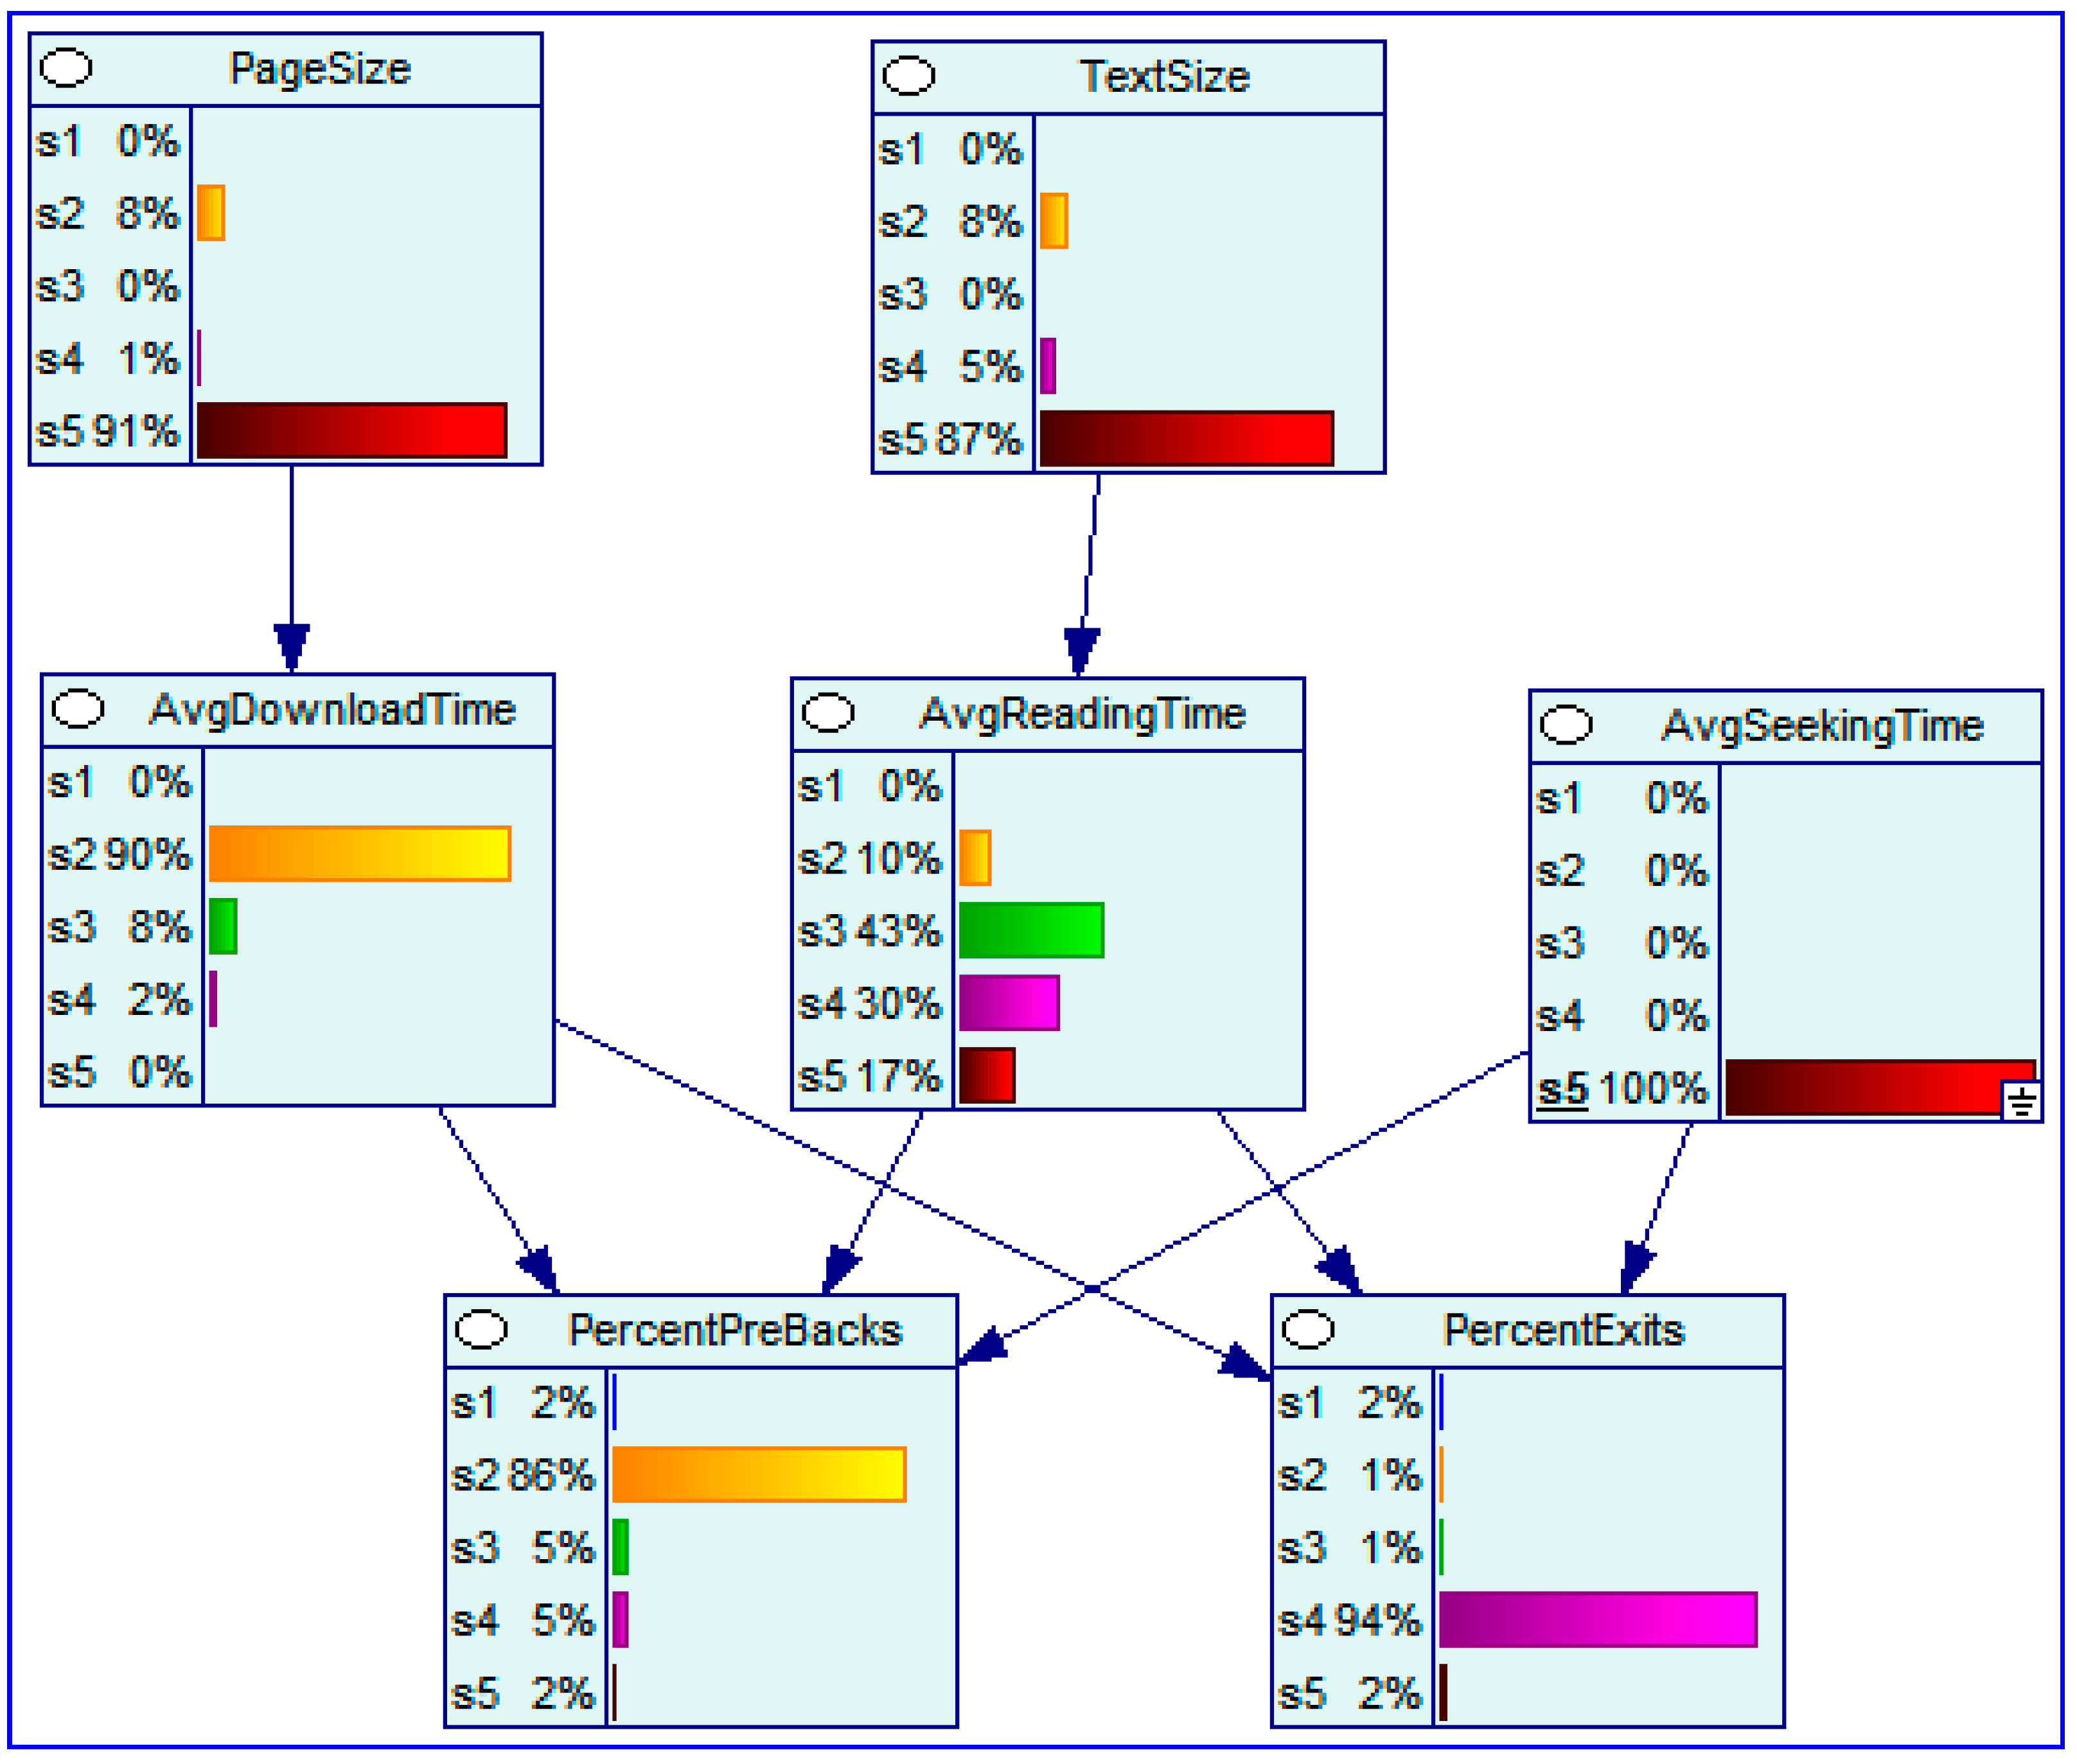
Figure 5.
Bayesian network of discretized data from 18 indicators.
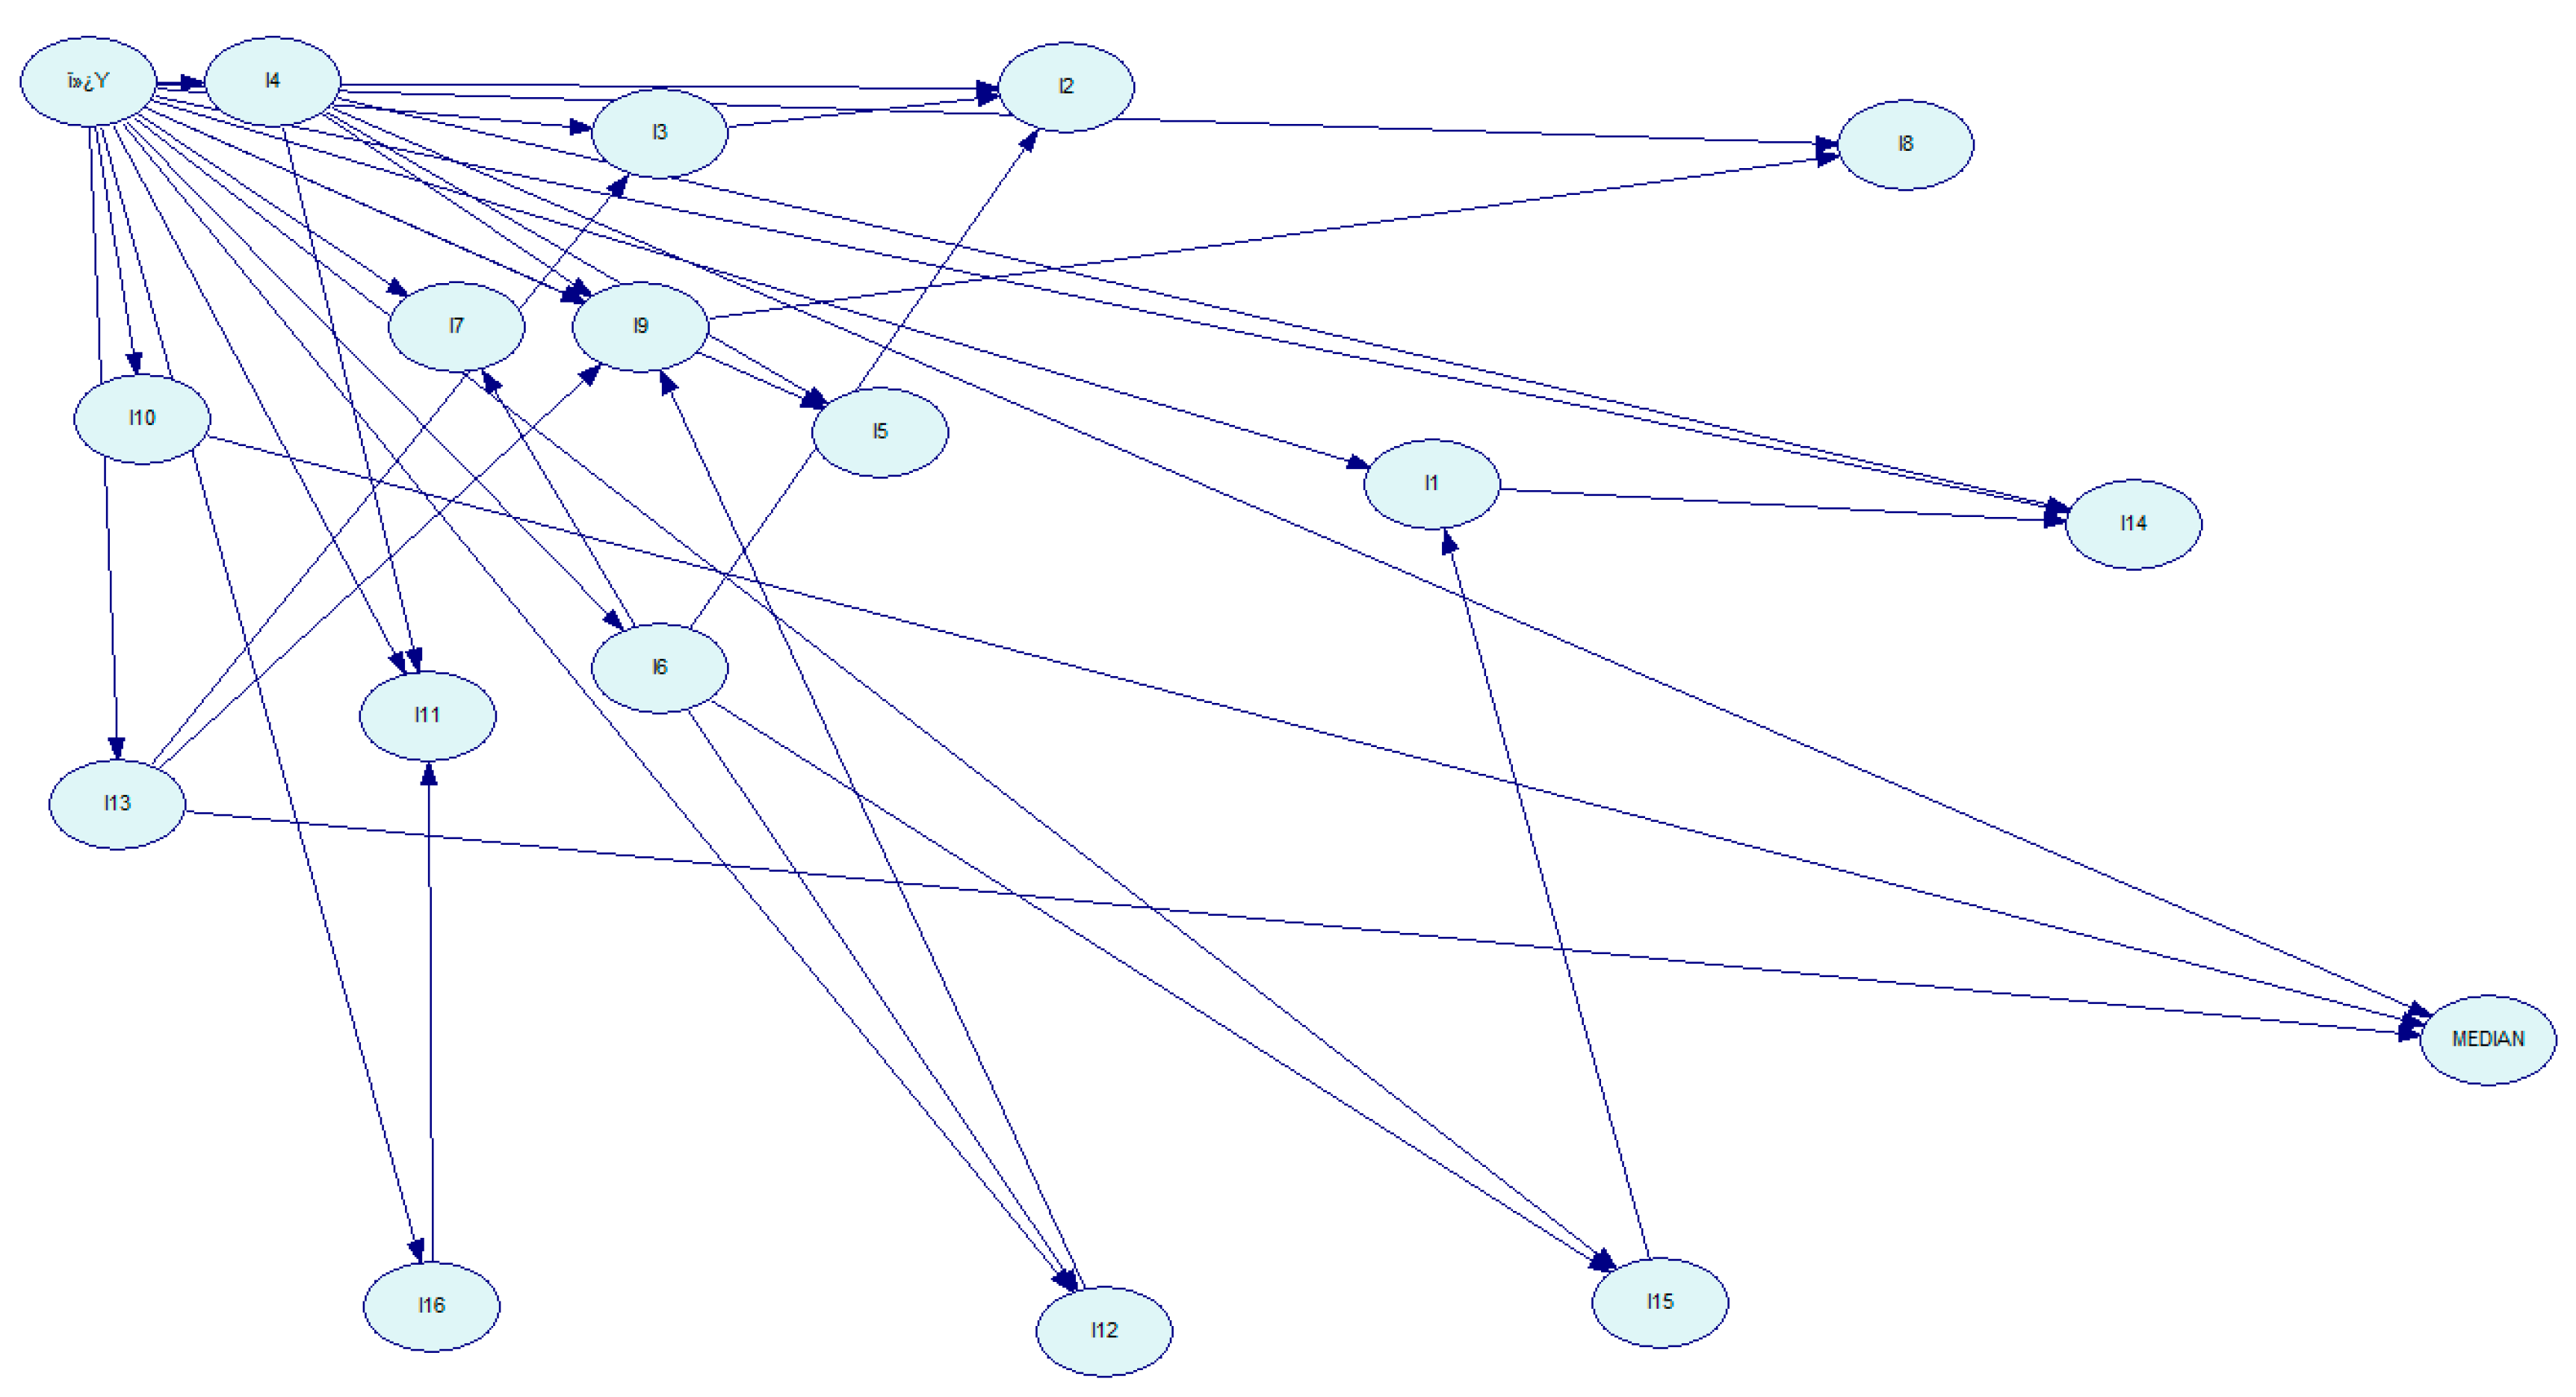
Figure 6.
Bayesian network, conditioned on year 2010.
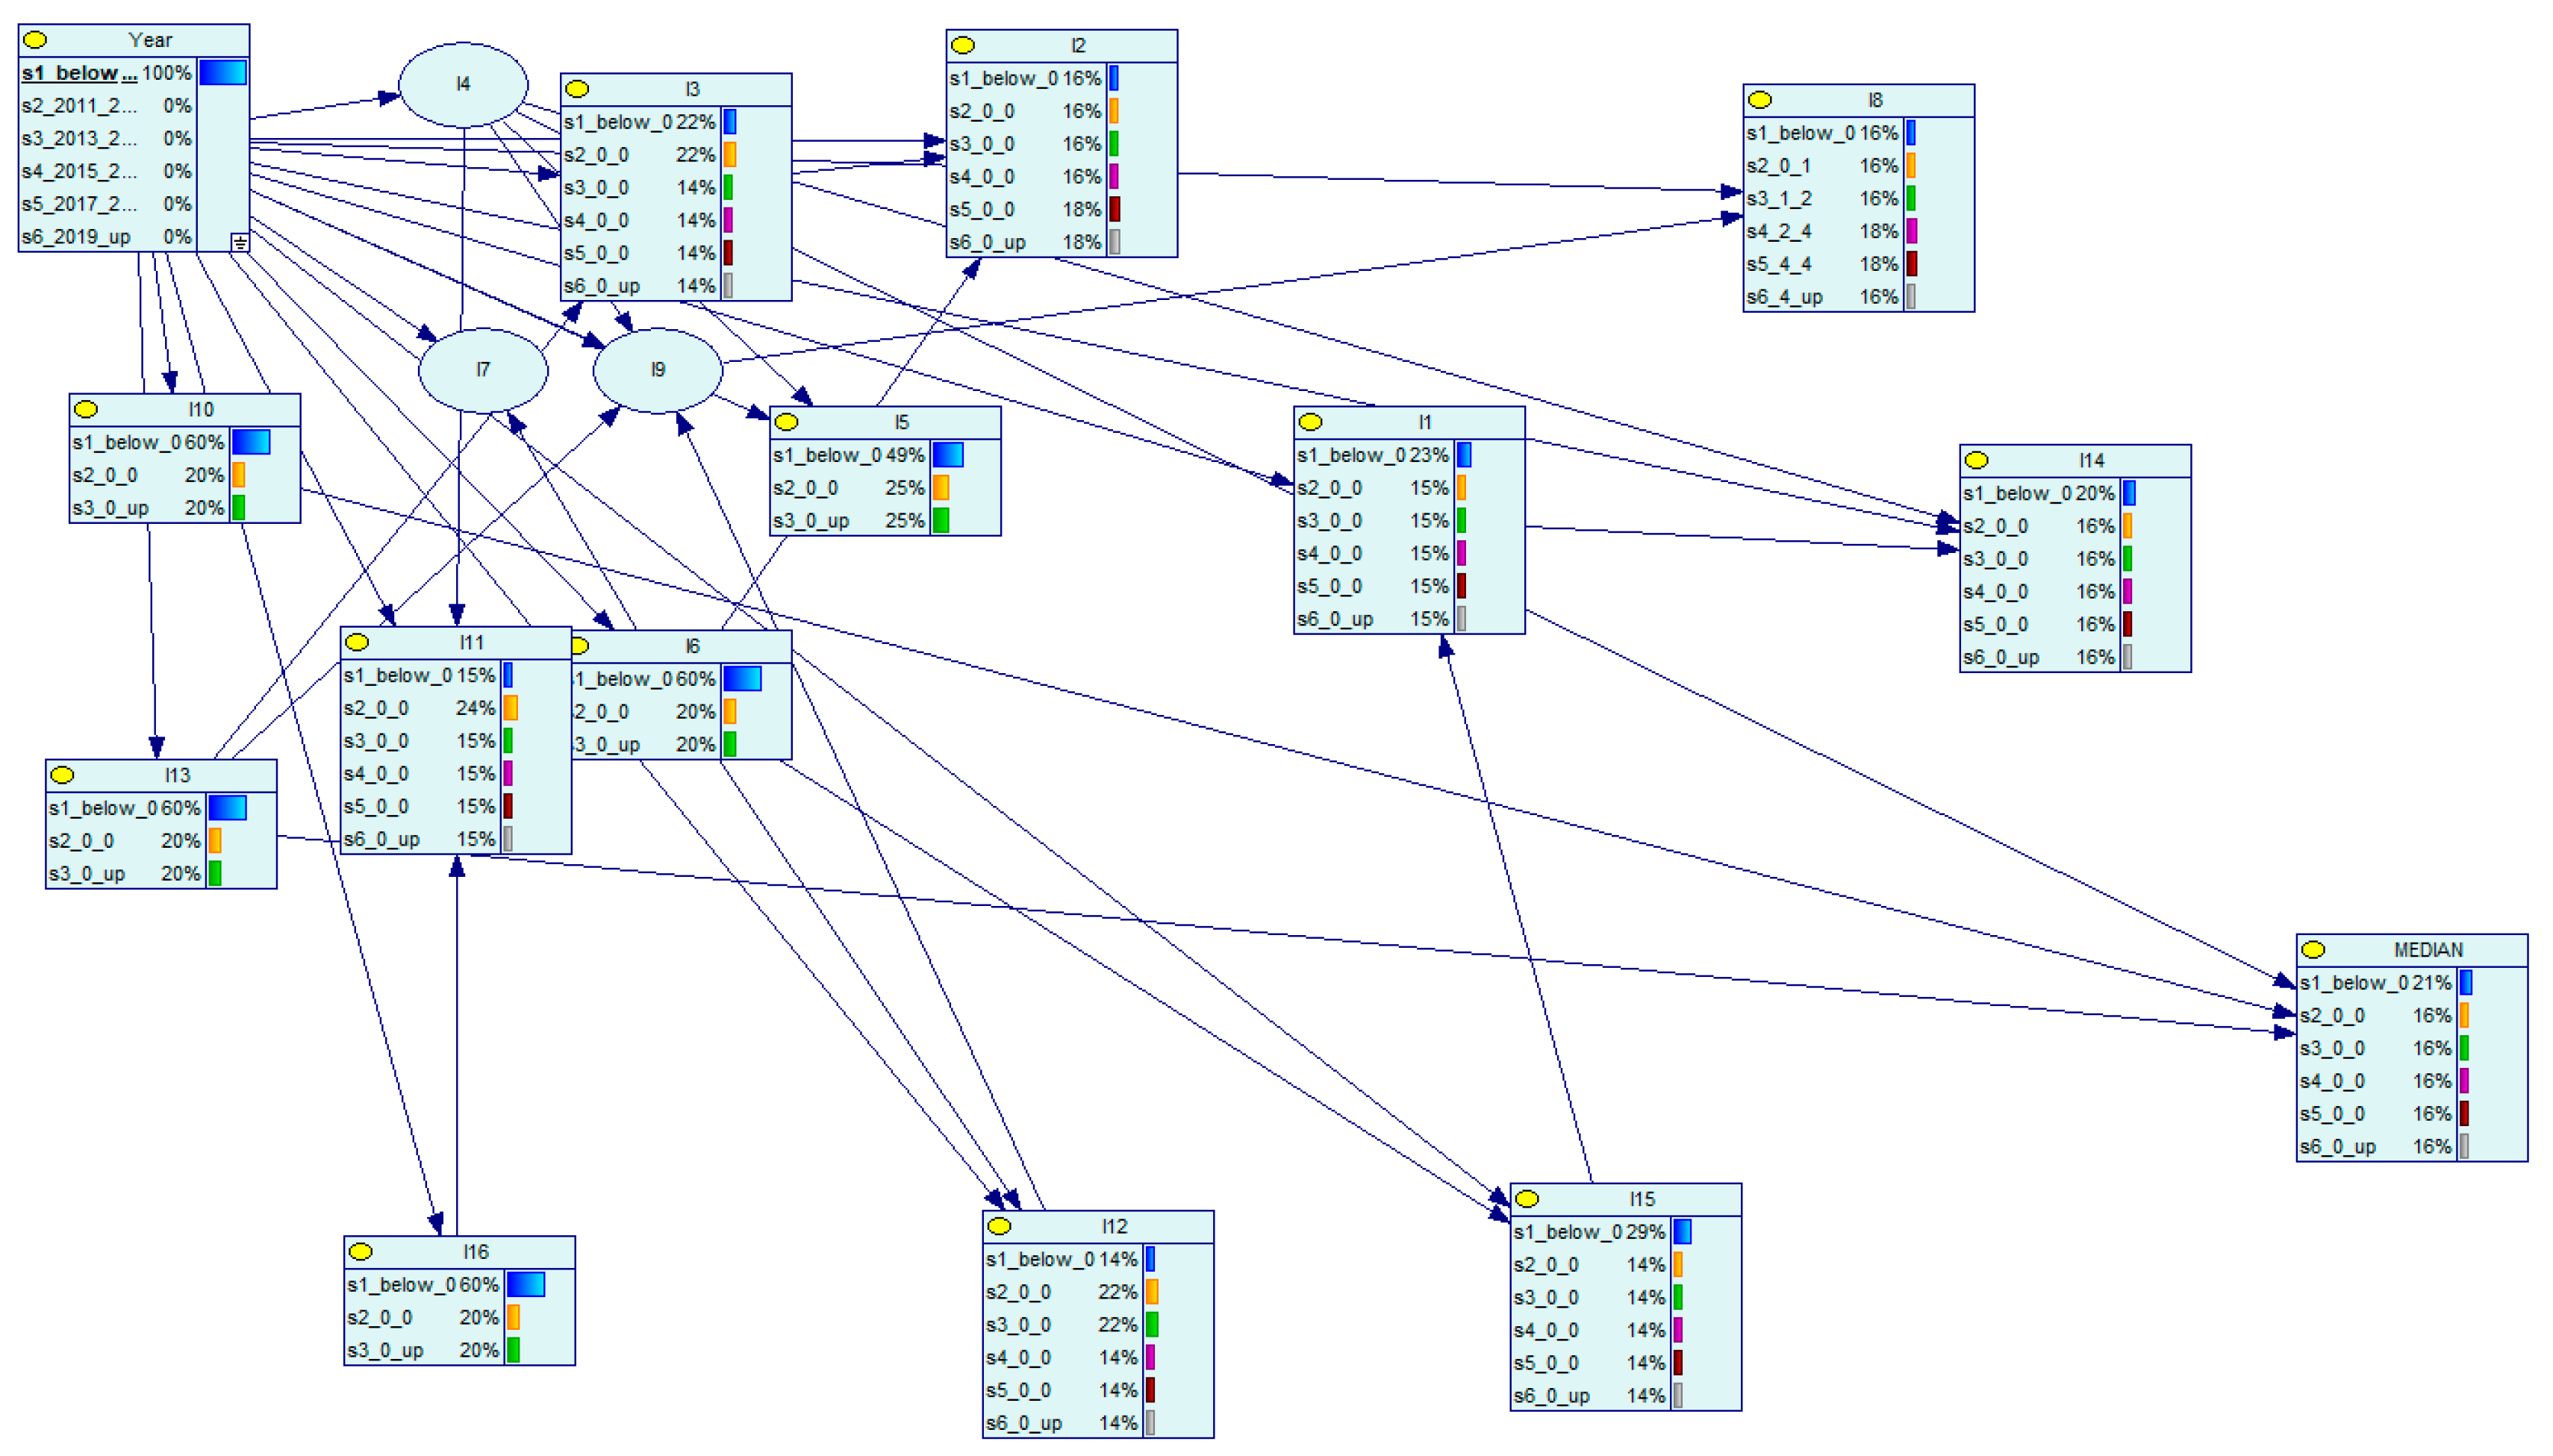
Figure 7.
Bayesian network, conditioned on years above 2019.
Disclaimer/Publisher’s Note: The statements, opinions and data contained in all publications are solely those of the individual author(s) and contributor(s) and not of MDPI and/or the editor(s). MDPI and/or the editor(s) disclaim responsibility for any injury to people or property resulting from any ideas, methods, instructions or products referred to in the content. |
© 2025 by the authors. Licensee MDPI, Basel, Switzerland. This article is an open access article distributed under the terms and conditions of the Creative Commons Attribution (CC BY) license (http://creativecommons.org/licenses/by/4.0/).
Copyright: This open access article is published under a Creative Commons CC BY 4.0 license, which permit the free download, distribution, and reuse, provided that the author and preprint are cited in any reuse.


