Preprint
Article

This version is not peer-reviewed.

L-Tryptophan Adsorbed on Au and Ag Nanostructured Substrates: A SERS Study

A peer-reviewed article of this preprint also exists.

Submitted:

14 August 2025

Posted:

15 August 2025

You are already at the latest version

Abstract

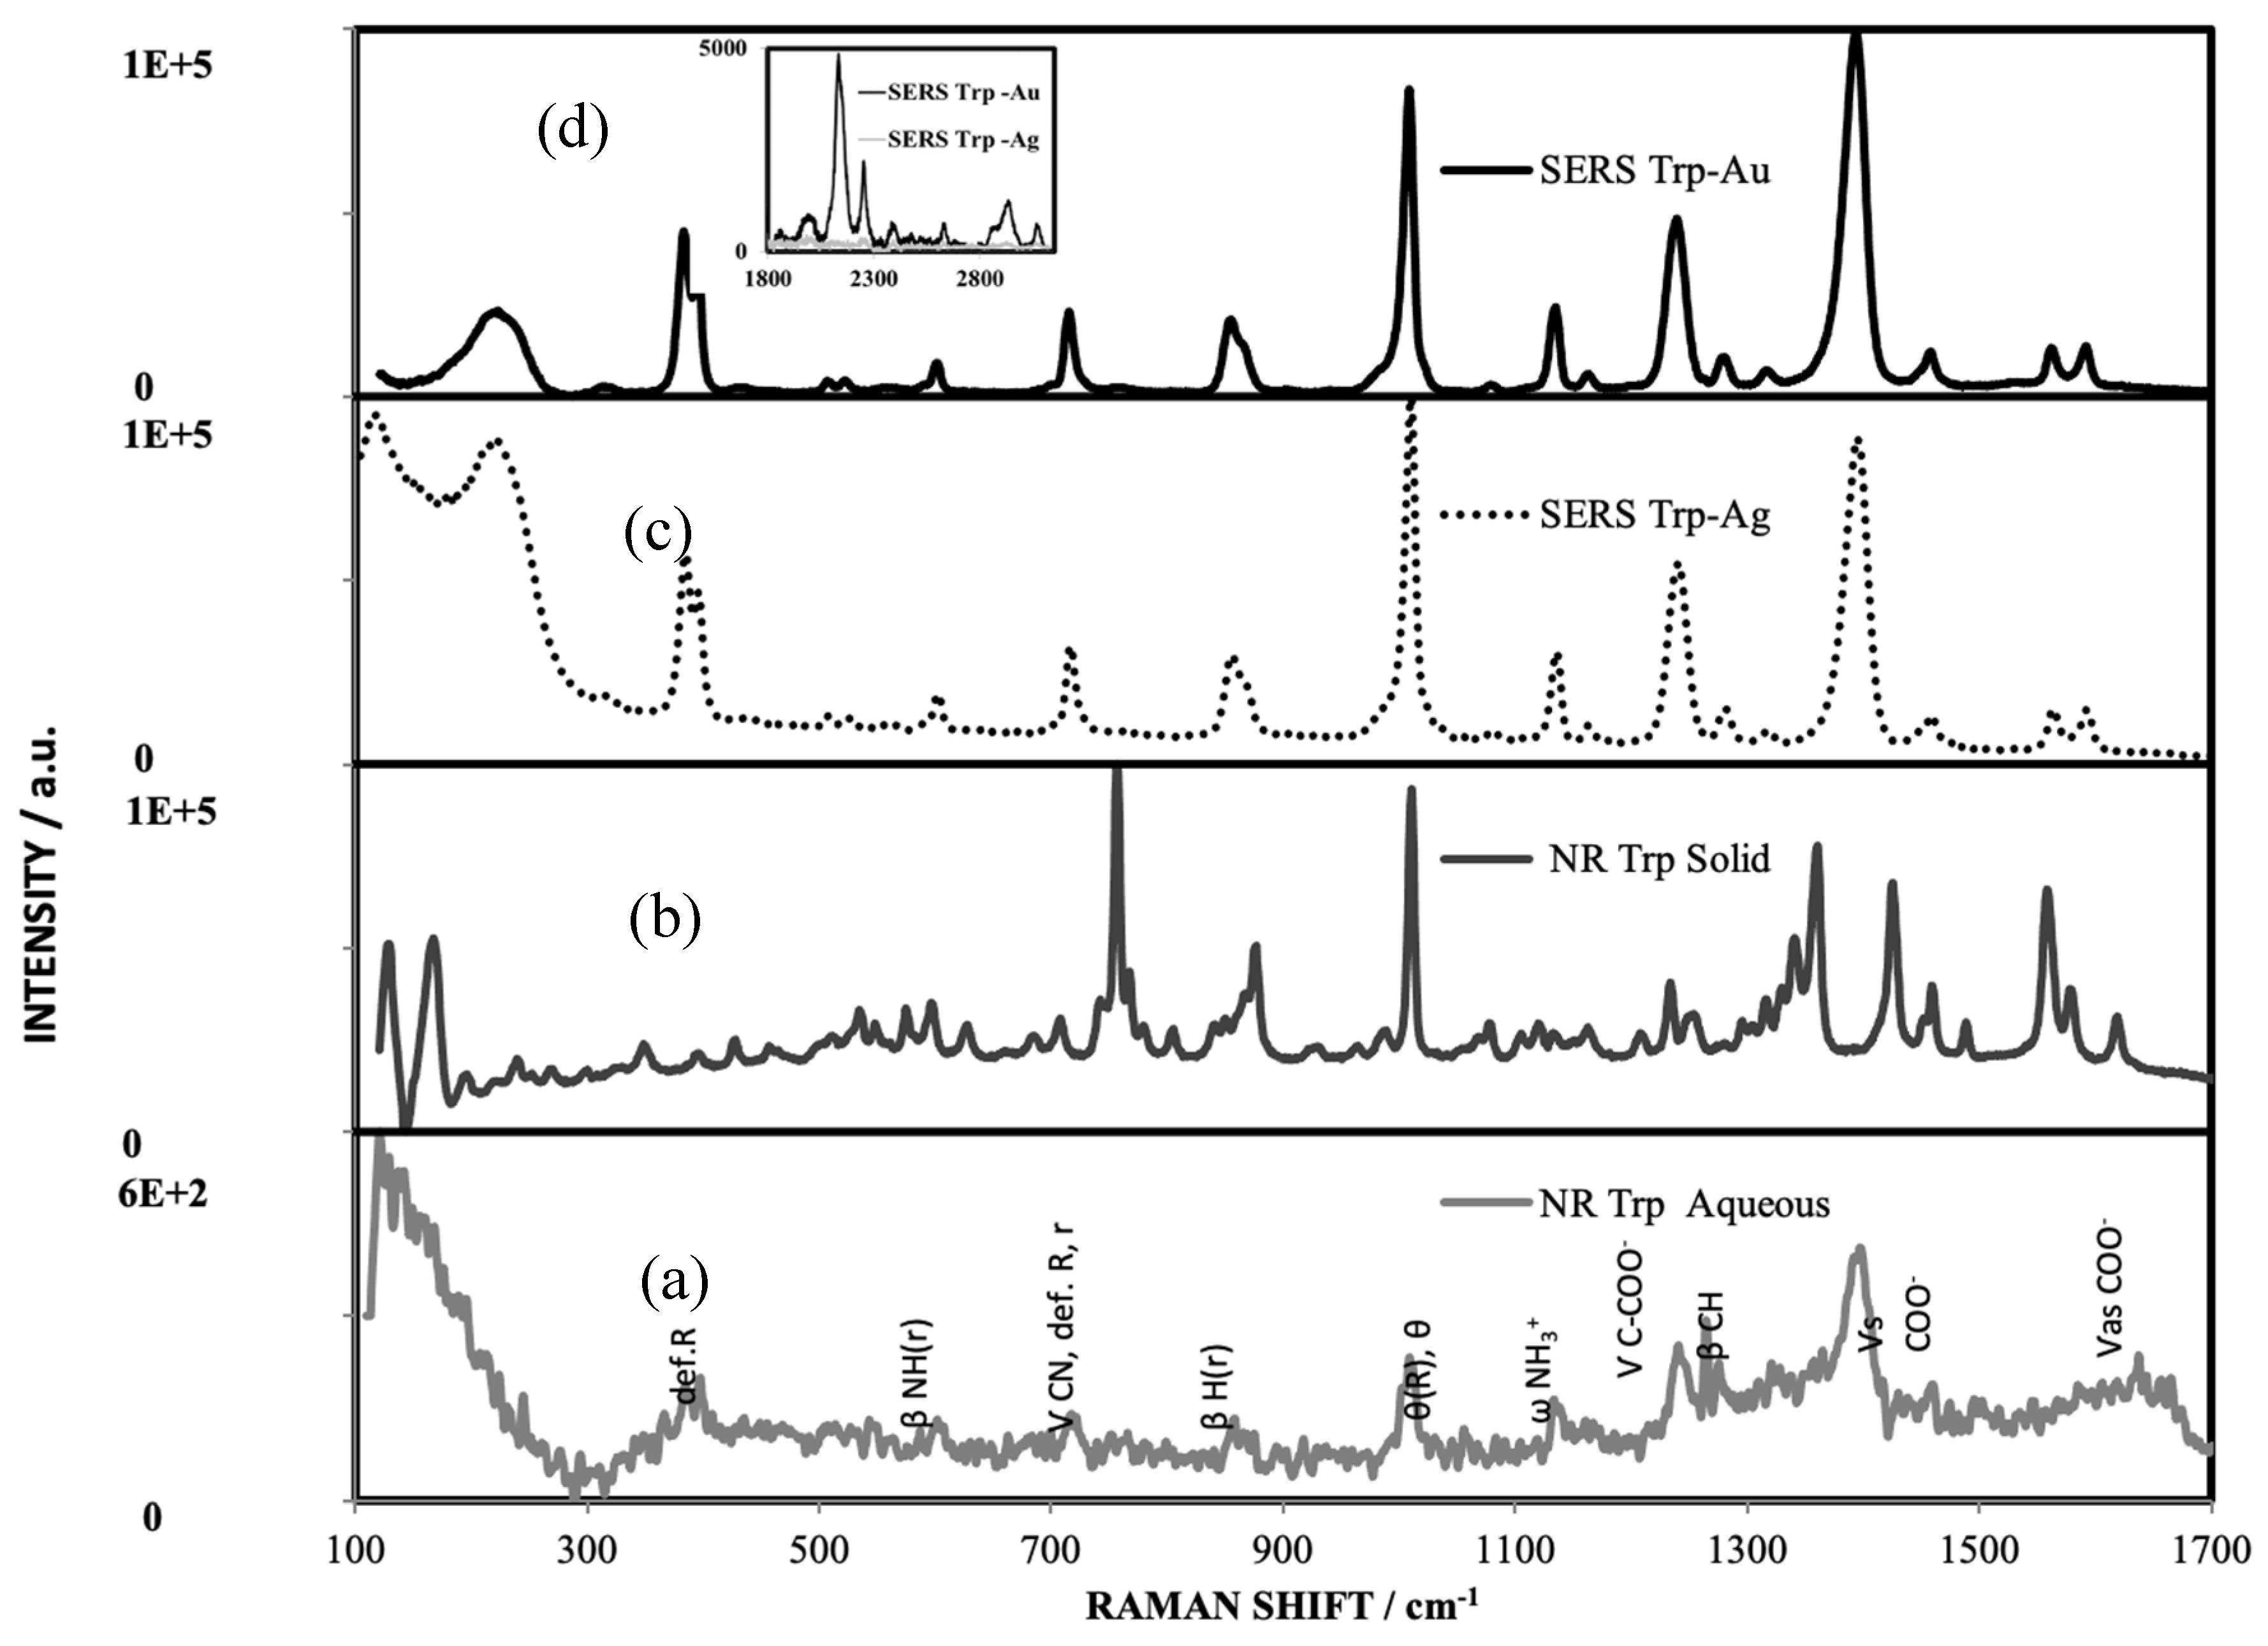
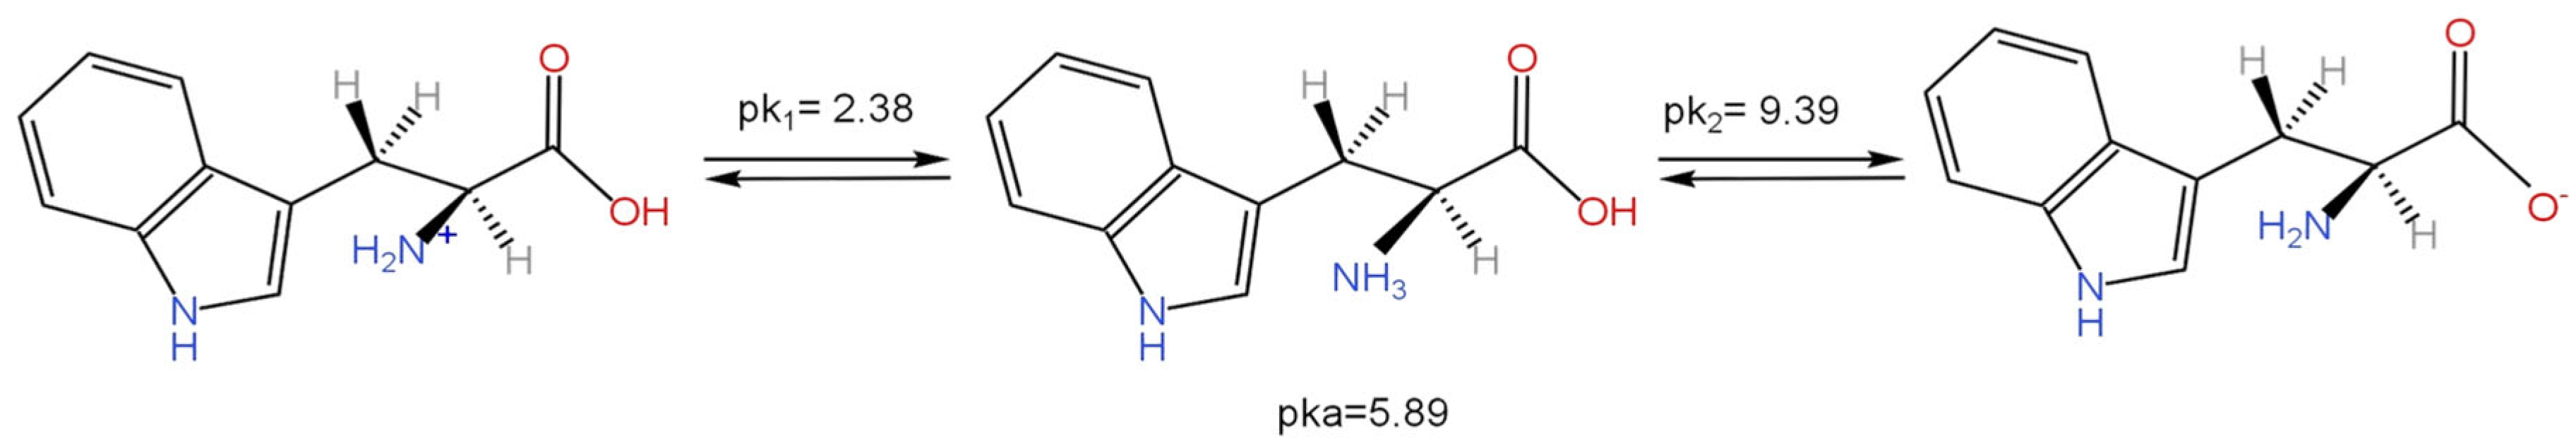
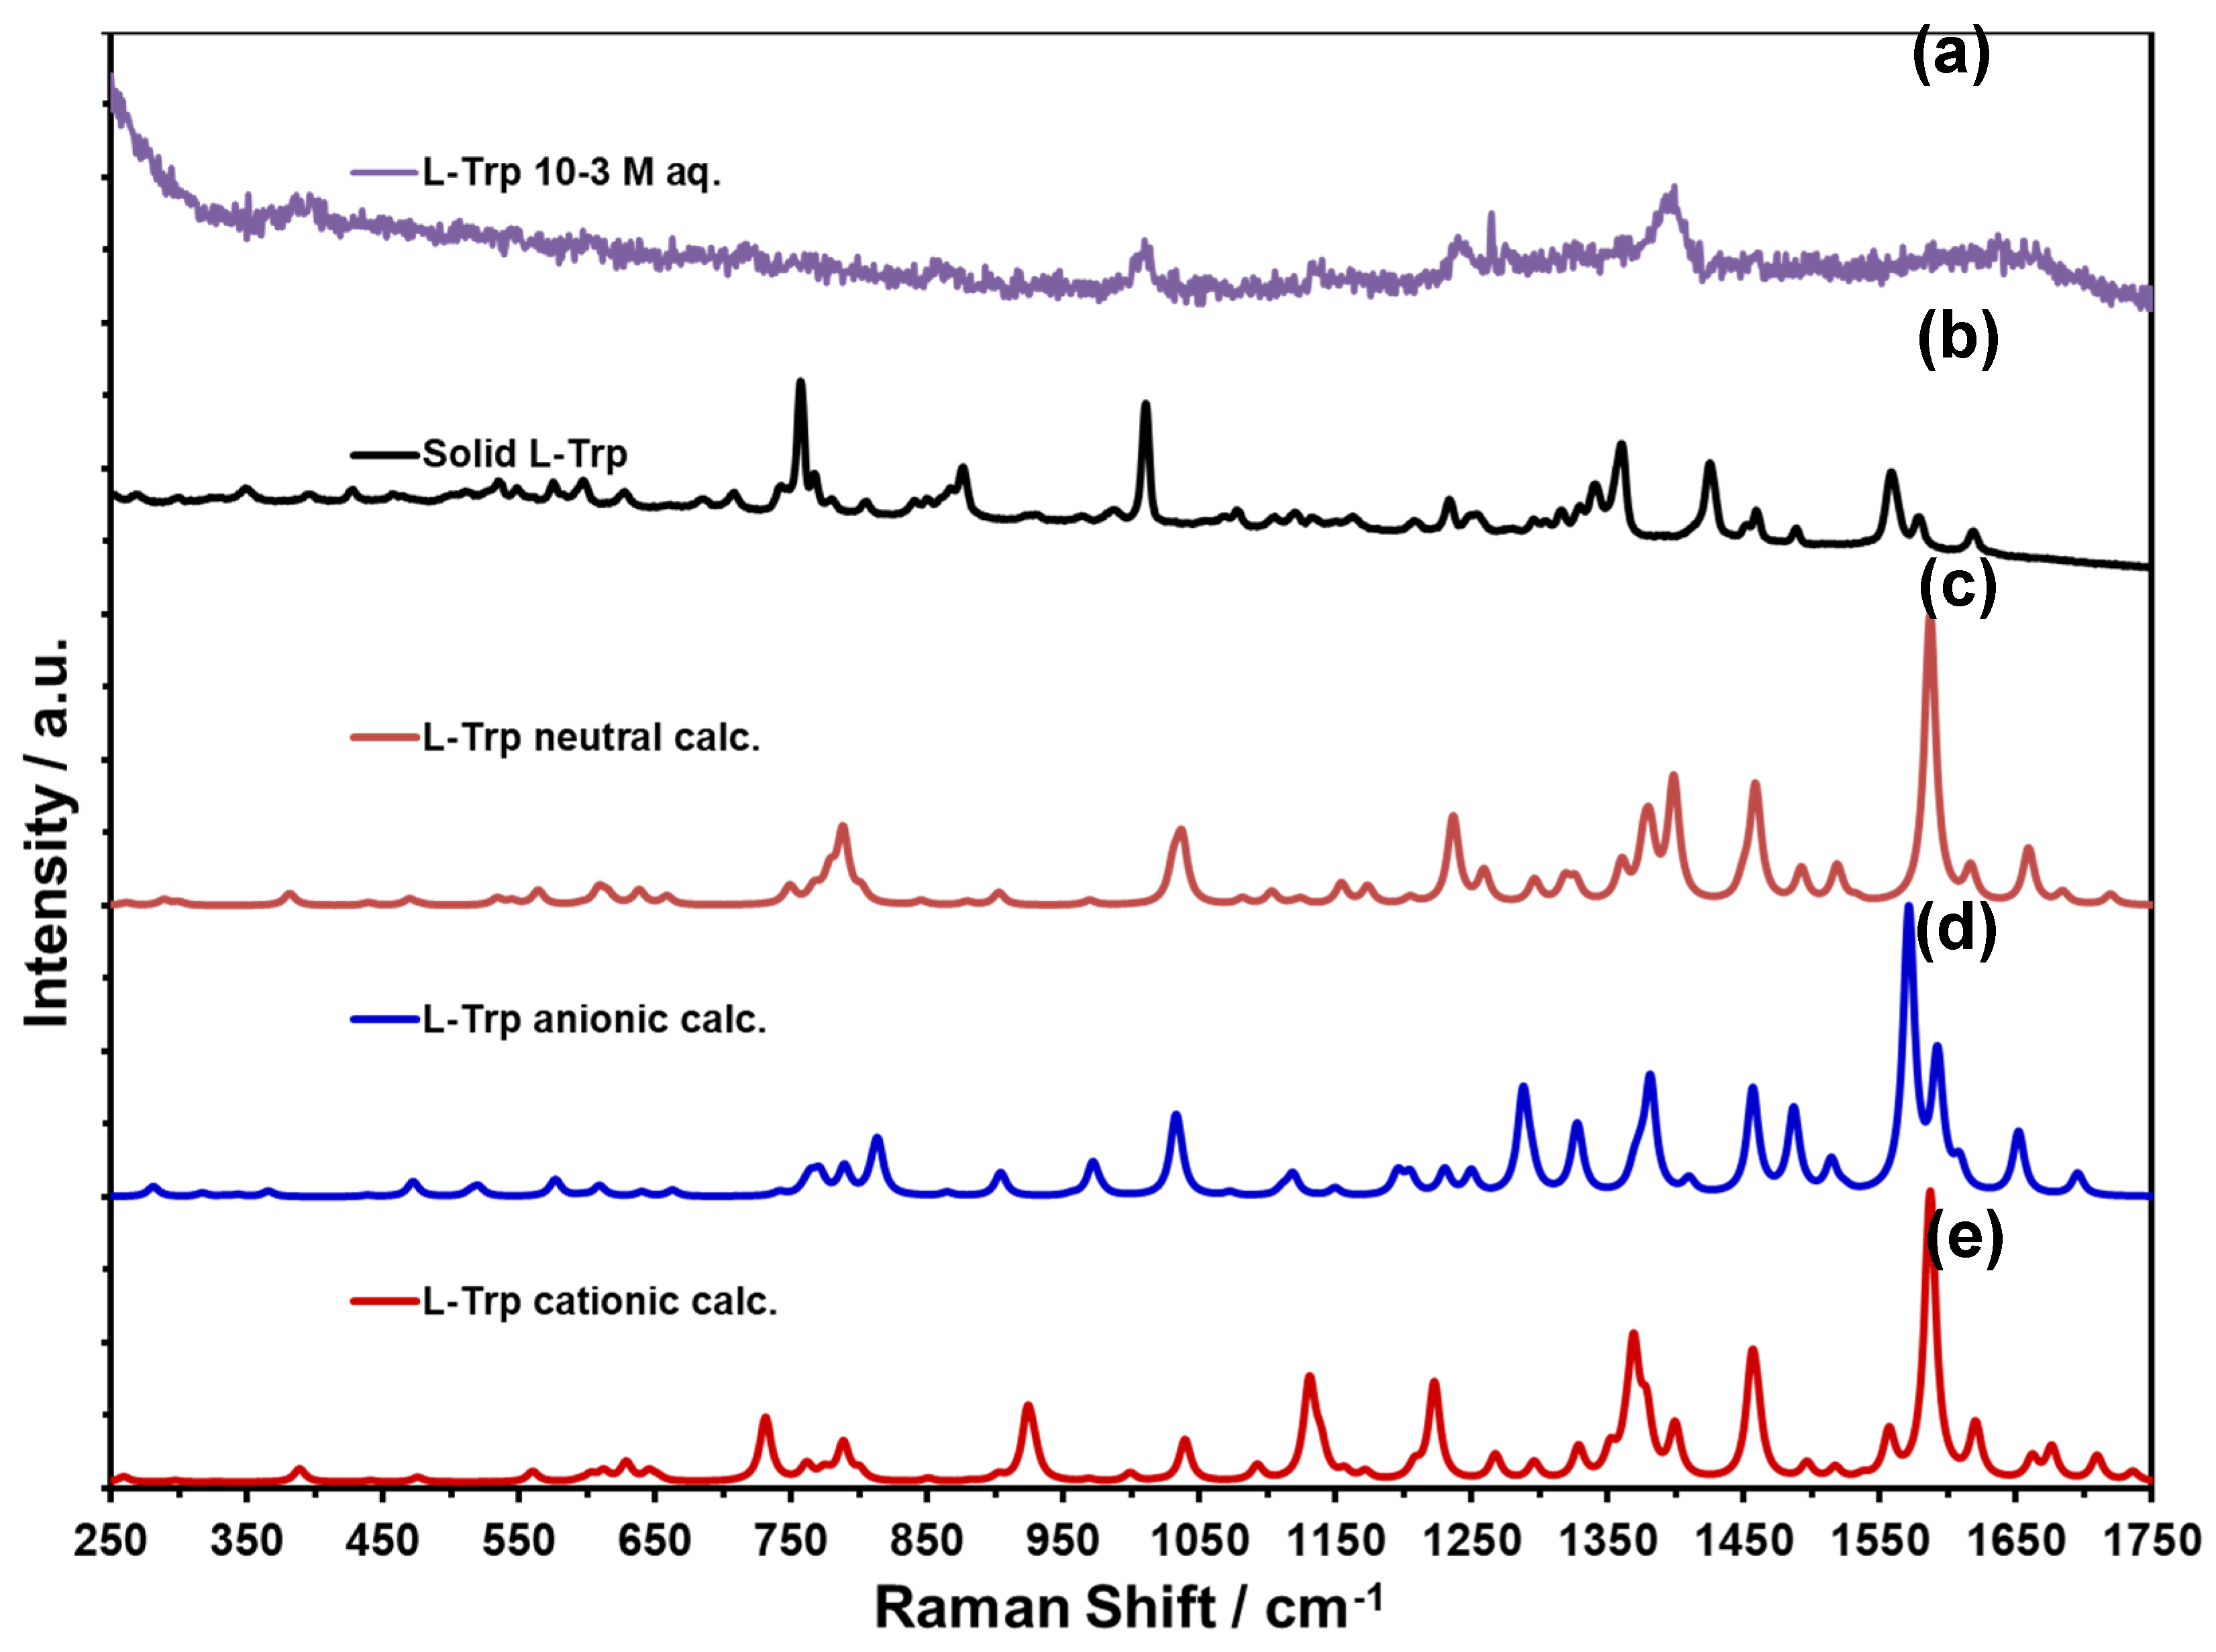
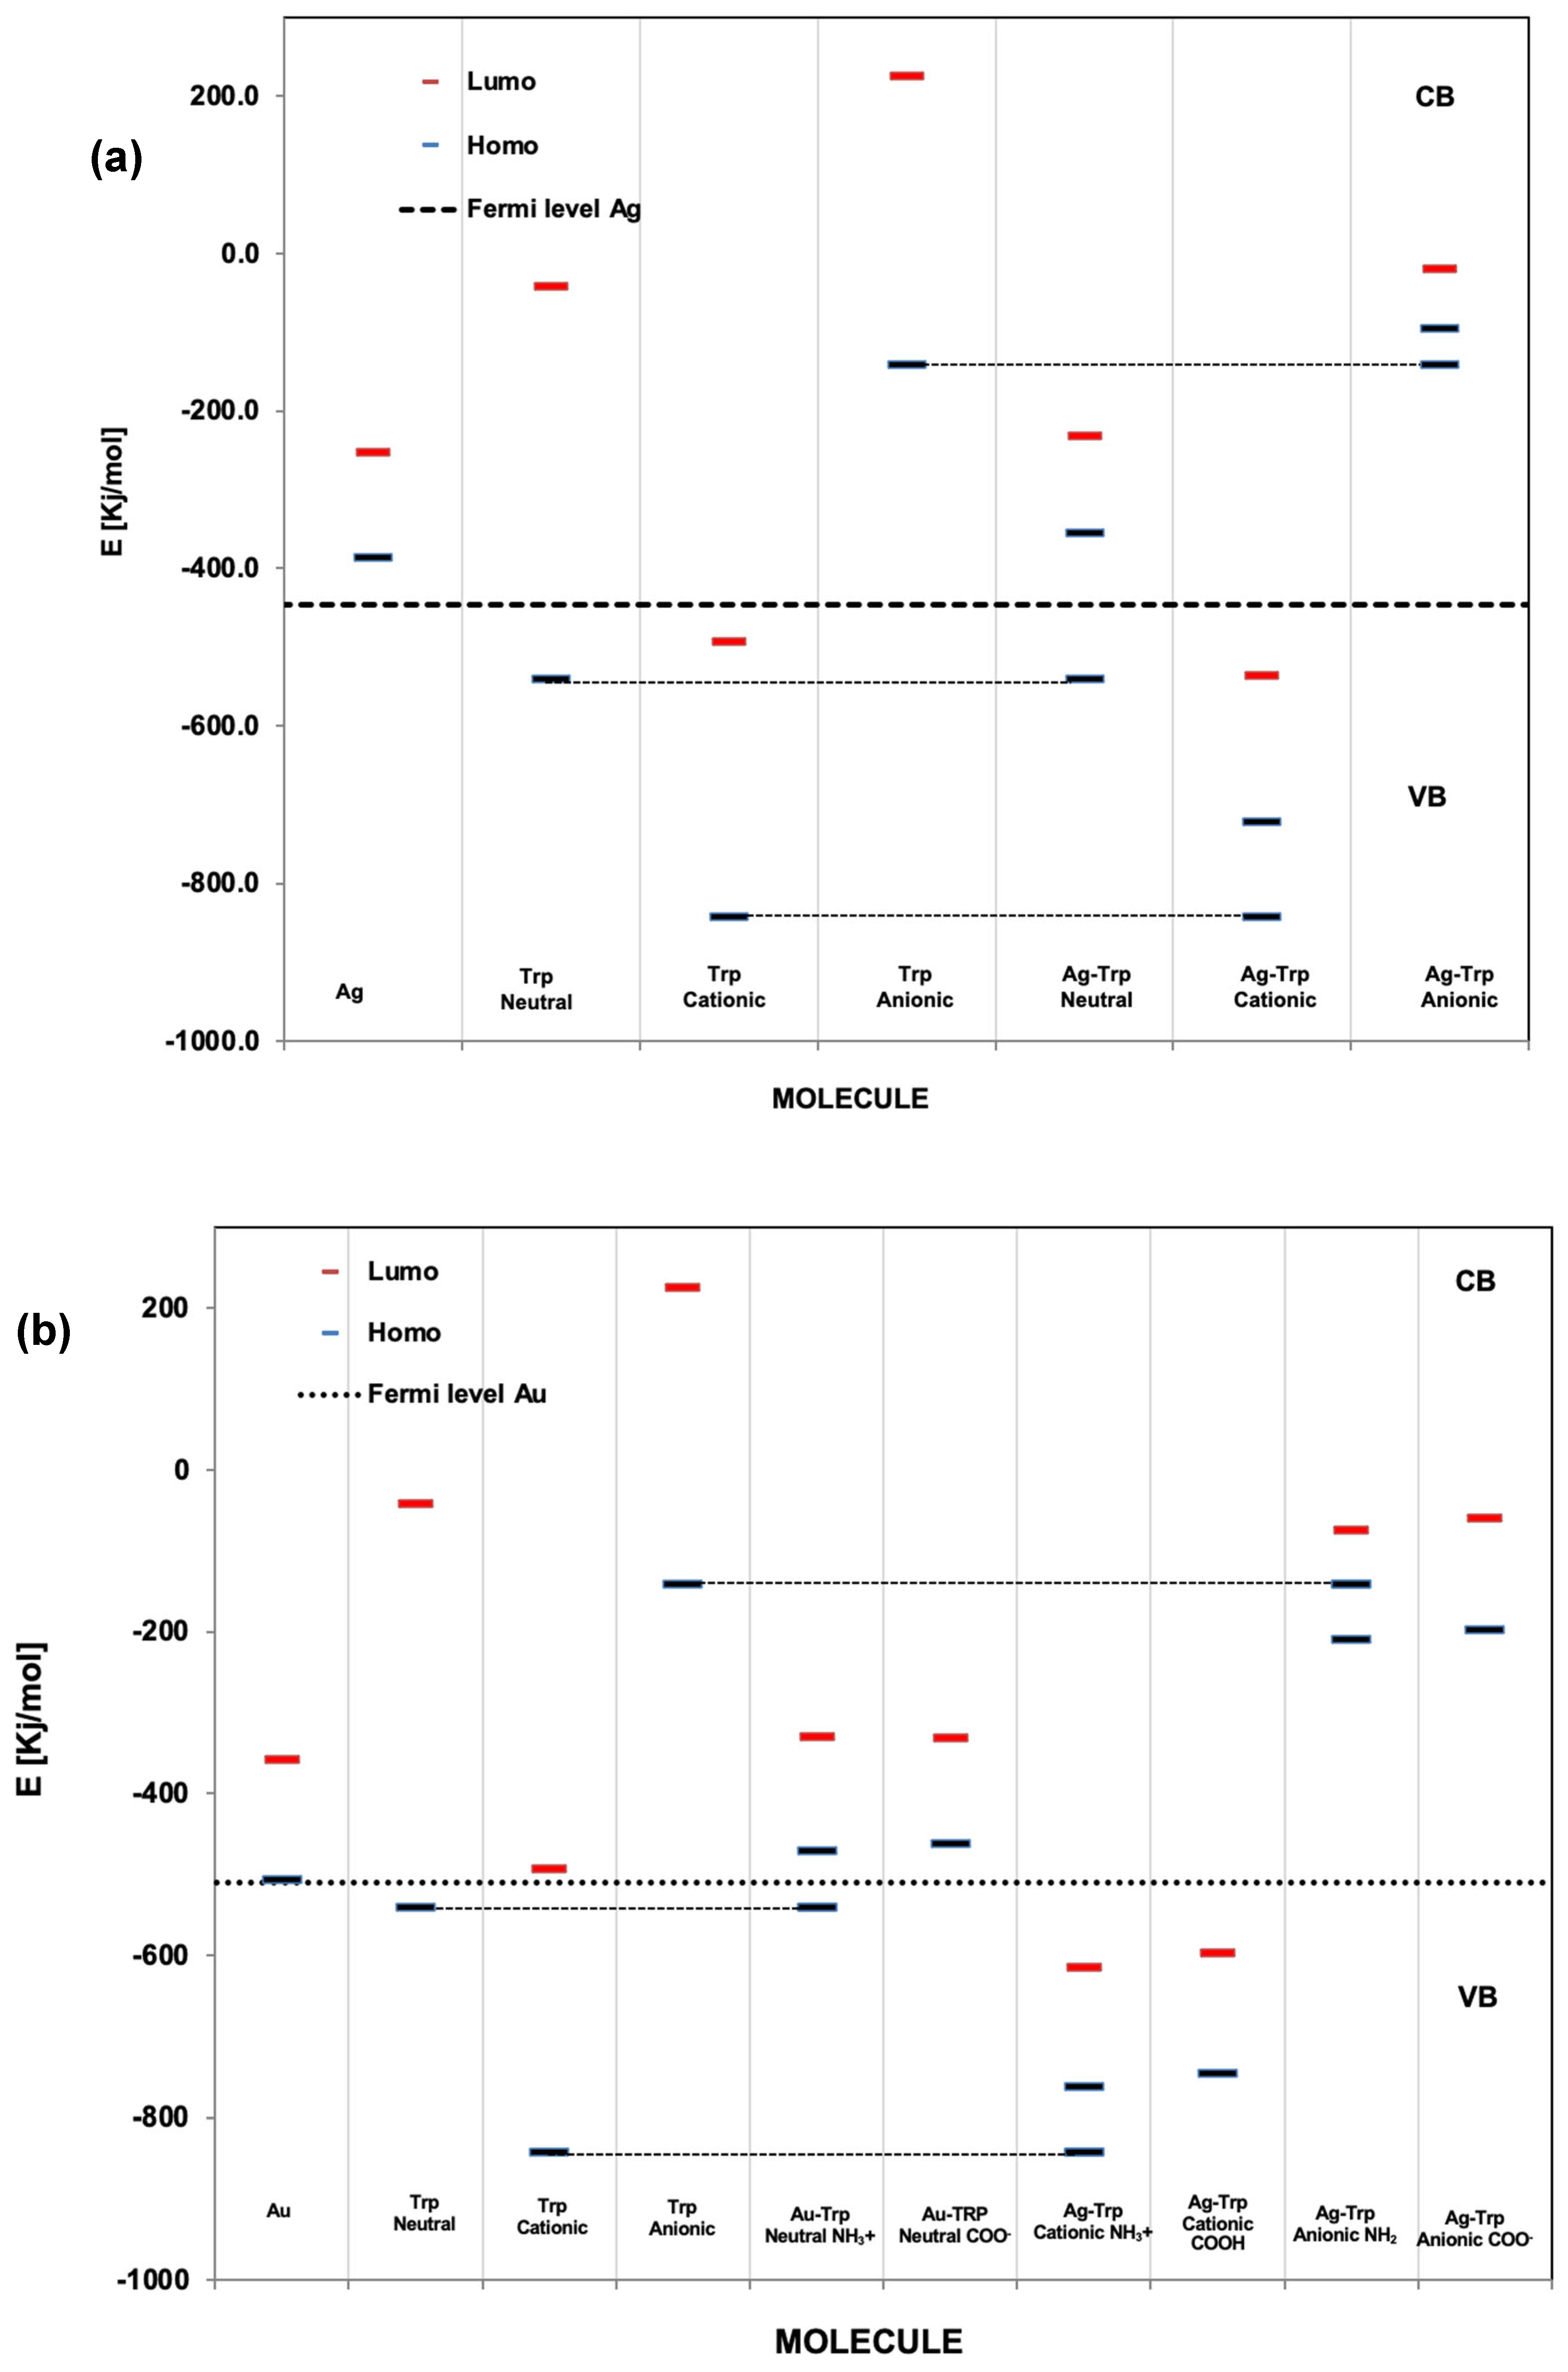
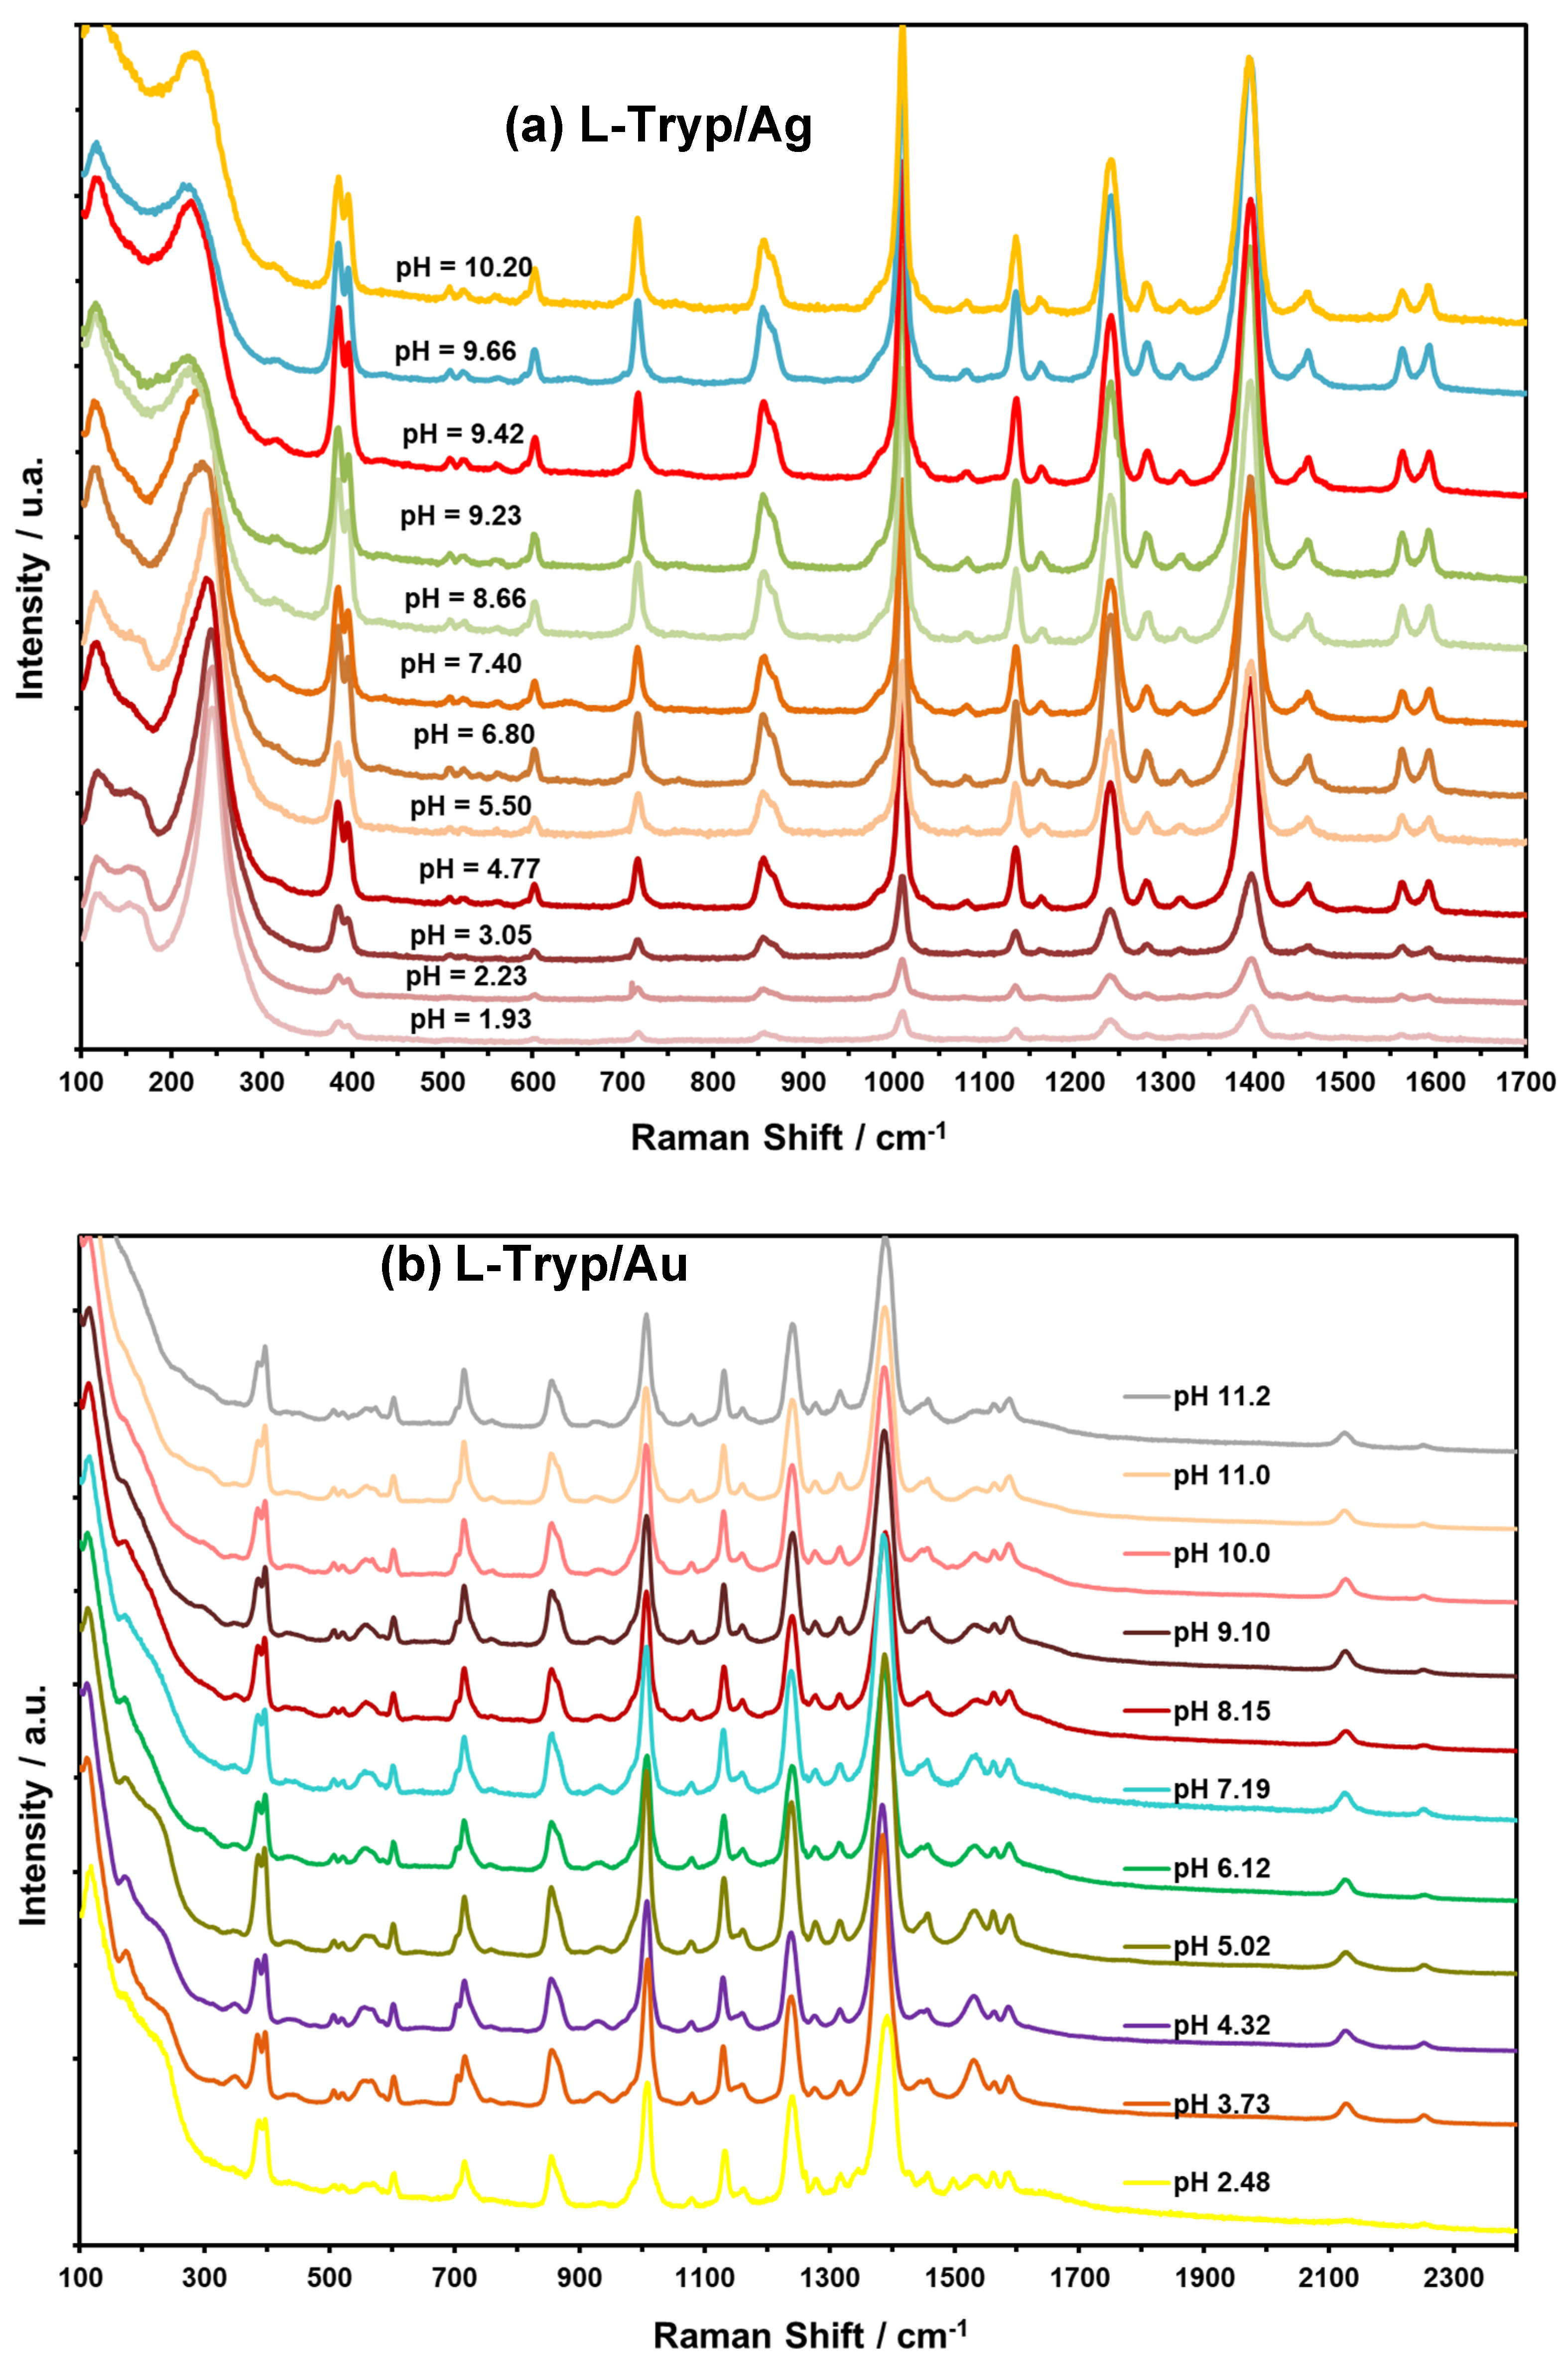
The objective of this study was to determine the most stable conformation of L-tryptophan (L-Tryp) on gold and silver nanoparticles. In addition, this work explored how these parameters were affected by analyte concentration, nanoparticle size, and pH. The purpose was to establish whether L-Tryp molecules interact with the nanoparticles through the carboxylate end, the amino group end, or both. This research has brought diverse applications in biophysics and medical diagnostics, potentially opening new avenues in these fields. Moreover, it may enrich the disciplines of chemistry and nanotechnology by offering innovative approaches for future research. These findings represent a significant advancement in understanding the interactions between L-Tryp and nanoparticles, making a meaningful contribution to biophysics and medical diagnostics. Surface-Enhanced Raman Scattering (SERS) spectra of L-Tryp in the 200–3500 cm⁻¹ spectral range were obtained using a 785 nm laser for excitation. Gold and silver nanoparticles were synthesized using the citrate reduction method. The experimental procedure involved the use of electrolytes (such as NaCl) for colloid activation, which resulted in very high SERS signals. Modification of nanoparticle surface charge was achieved by adjusting the pH of Au and Ag colloidal suspensions between 2 and 11. The SERS spectra indicate that small-sized nanoparticles require high concentrations of L-Tryp to achieve high sensitivity, whereas larger nanoparticles perform effectively at lower concentrations. The pronounced enhancement of stretching vibrations in the COO⁻ group in the SERS spectra strongly suggests that the carboxylate group attaches to silver nanoparticles (AgNPs). Conversely, for gold nanoparticle (AuNP), a new band at approximately 2136 cm⁻¹ was observed, indicating that the amino group of L-Tryp interacts with Au in its neutral form. These analyses were complemented with theoretical modeling, employing the Density Functional Theory (DFT) running under Gaussian™ to study molecular models in which L-Tryp interacted with the AgNPs and AuNPs substrates in neutral, cationic, and anionic forms.

Keywords: 
;  ;  ;  

1. Introduction

L-Tryptophan (L-Tryp) is a large neutral amino acid notable for its unique 3-methyl indole side chain, which makes it an important subject of study [1,2,3,4]. This side chain, despite its high hydrophobicity, can be found on the surface and within protein molecules [5]. The aromatic π electrons in L-Tryp facilitate strong interactions with other molecules that also contain π electrons. While L-Tryp lacks ionizable side chain groups, its relatively unreactive indole N-H bond (with a pKa of 9.5) can function as a hydrogen bond donor. L-Tryp is significant for its role as a precursor to serotonin, which is subsequently converted into melatonin. It plays a crucial role in regulating mood and sleep patterns and is involved in the synthesis of various neurotransmitters in the brain, as well as the production of the niacin [6,7].
Studies on human subjects suggest that L-Tryp may have potential benefits in treating conditions such as Down syndrome and aggressive behavior [5,6,7,8,9,10]. However, challenges arise when L-Tryp levels are altered in cancer patients, leading to significantly reduced serotonin levels, which are associated with depressed mood and lower survival rates [11]. Despite these challenges, the potential applications of L-Tryp in medicine remain promising, highlighting opportunities for further research and development [12].
Recent advancements in nanoscale science have led to the development of novel nanomaterials with exceptional physical, chemical, and biological properties. This progress has led to the development of sensitive and selective detection methods that address some limitations of conventional technologies [13]. Within this context, gold (Au) and silver (Ag) nanoparticles (NP) have emerged as powerful tools in sensing and imaging applications due to their unique optical properties [14,15,16]. The distinct characteristics of gold and silver nanoparticles, such as their high extinction coefficients, sharp extinction bands, and significant field enhancements, have made them prominent in nanotechnology [14,15,16]. Although Ag presents many advantages over Au, including higher extinction coefficients, sharper extinction bands, and a greater ratio of scattering to extinction, it is used less frequently in sensor development, aside from applications involving Surface Enhanced Raman Scattering (SERS) [17]. This limited use is primarily due to the lower chemical stability of AgNPs compared to AuNPs [17]. While there is considerable excitement surrounding the potential applications of gold nanoparticles in medical diagnostics and other biological functions, researchers are becoming increasingly aware of the need to investigate potential nanoparticle toxicity before advancing to in vivo applications [18].
AgNPs and AuNPs absorb visible light in the 400 to 700 nm range, making them ideal substrates for SERS, a light-scattering phenomenon [19]. SERS has been utilized to determine the orientation of molecules adsorbed on specific surfaces, which holds significant potential for biophysical studies [20]. Moreover, SERS can enhance Raman intensity by as much as 106-fold, enabling the acquisition of vibrational spectra at very low sample concentrations [19]. A previous SERS study of L-Tryp concluded that the amino acid binds to the silver surface through both the carboxylate (-COO-) and amino (-NH2) groups [20]. The aliphatic moiety was found to be close to the nanoparticle surface, while the nitrogen atom of the indole ring only binds when L-Tryp is the C-terminal residue of a peptide [20,21,22]. Additionally, research by Kim and colleagues [23] revealed strong vibrational enhancements of the (-COO-) symmetric stretching mode and the -C-COO- stretching mode, leading to the conclusion that the adsorption of L-Tryp carboxylate and amino groups on the silver surface was responsible for these enhancements [24]. However, our research presents a more detailed SERS investigation of L-Tryp, requiring consideration of nanoparticle size and colloidal pH. It is anticipated that the surface charges of nanoparticles influence both the observed SERS phenomenon and the interaction between the analyte and the metal surface [25]. Furthermore, calculations were optimized using Density Functional Theory (DFT) on a molecular model, using Gaussian™ v-16, in which L-Tryp interacts with large gold and silver surfaces in its neutral, cationic, and anionic forms.

2. Materials and Methods

2.1. Reagents

The highest purity of chemicals available for NP preparations was used. Hydrogen tetrachloroaurate (III) hydrate (HAuCl4.3H2O, 99.9985% Au; 49% Au, Puratrem™) and silver nitrate (AgNO3, 99.9995%-Ag, Puratrem™) were purchased from STREM Chemicals (Newburyport, MA, USA). Sodium citrate dihydrate (C6H5Na3O7.2H2O, ≥ 99%, FG), sodium hydroxide (NaOH, reagent grade, ≥ 98%, pellets, anhydrous) and L-Tryp (C11H12N2O2, 99%) were acquired from Sigma-Aldrich Chemical Co. (Milwaukee, WI, USA) and were used as received without further purification. L-Tryp (pKa1 = 2.4 and pKa2 = 9.4) should have the zwitterionic form in which the amino group is protonated as -NH31+ in the solid and in aqueous solutions (pH < 9.0). Hydrochloric acid (HCl, 36-38%) was obtained from VWR International (Suwanee, GA, USA). Nitrogen gas (N2, ultra-high purity, UHP) was purchased from Linde Gas Co. (Guayanilla, PR, USA). All sample solutions were prepared with Milli-Q water. Glass containers for the preparation of AgNP and AuNP were thoroughly cleaned using aqua regia and rinsed with UHP water (18.2 MΩ) before using. Aluminum and gold slide substrates (1cm × 1cm) were first washed with Alconox™ lab detergent (White Plains, NY, USA) and with Micro-90 Cleaning Solution (Cole-Parmer, Vernon Hills, IL, USA). The substrates were then rinsed with absolute ethanol and further rinsed with distilled and deionized UHP water.

2.2. Preparation of Ag and Au Colloids

The colloidal AgNP were prepared with a modification of the method reported by Lee and Meisel [26]. After preparation, colloids were stored at 8 °C for future use. The obtained AgNP suspensions were characterized by using UV-Vis spectrophotometry to ensure that the reaction was complete for redox synthesis with absorption maximum λ ≈ 410 nm. The prepared AgNP had an average size of 68 nm, Zeta potential of -43.6 mV, and pH of 7.35. AuNP were synthesized using the citrate reduction method. 200 mL of chloroauric acid 1.0 mM solution per 50 mL of HAuCl4·3H2O (0.01%) dilution was prepared in UHP water. A reducing agent solution of 1% sodium citrate was also prepared. The metal ion and reducing agent solutions were mixed after they had been previously degasified with N2, and both solutions were placed in the incubator for 15 min to produce the growth solution for aqueous Au ions required to synthesize the desired NP. A typical synthesis consisted of dissolving 50.0 mL HAuCl4·3H2O (0.01%), and 300 µL to 500 µL of 1% sodium citrate was added to the flask. The solutions were put in a Barnstead Lab-Line General Incubator and left undisturbed for 12 h until the color changed from colorless to violet and had a pH of 4.10. Obtained colloids were also stored at 8 °C for future use.

2.3. Instrumentation

Electronic absorption spectra of AgNP and AuNP colloids were obtained using a UV-Vis spectrophotometer Agilent model 8453. Spectra were recorded in the range of 200 to 800 nm. Quartz cells, 1.0 cm path length, were used for the experiments, and data were collected in absorbance mode. Average hydrodynamic radius and zeta potential measurements at 25 °C of colloidal suspensions at different pH values were performed in a Zetasizer™ Nano Series (Malvern Instruments Ltd., Worcestershire, UK). The images SEM analyses for AgNP and AuNP morphology were obtained on a JEOL-JSM 6500 instrument and a Philips/FEI, XL30s, FEG SEM/Phoenix EDX. These samples for Scanning Electron Microscope (SEM) analysis were prepared by depositing 5 μL of the metallic NPs suspensions on ultrathin carbon film/holey carbon 400 mesh copper grids (01824, Ted Pella, Inc., Redding, CA, USA).
Normal Raman (NR) of solid and aqueous L-Tryp solutions and SERS experiments were performed with 785 nm laser excitation line (Excelsior Newport-Spectra Physics, Irvine, CA, USA) in a Raman Micro spectrometer model RM-2000 (Renishaw, Inc., Hoffman Estates, IL, USA) equipped with CCD camera. Acquisition parameters were 30 s integration time and 10 accumulations for bulk analyte, 30 s integration, 1 accumulation for SERS samples with Ag. For Au SERS samples, 10 s integration and 3 accumulations. Spectra were recorded in the Raman shift range of 100-3500 cm-1 for NR and SERS.

2.4. RS Experiments

Small amounts of the solid compounds were transferred to a stainless-steel microscope slide, and the CRS spectra were collected in the Raman Shift range of 100 to 3800 cm-1. Laser power at the sample was kept at 11 mW with the beam 100% setting on the neutral density filter wheel of the Wire™ spectral acquisition and analysis software (v.4.0, Renishaw). Stock solutions of L-Tryp at concentrations range of 4.9 x 10⁻³ to 4.9 x 10⁻¹³ M were prepared using UHP water. A droplet of 10 µL L-Tryp 4.9 x 10⁻³ M solution was transferred onto the surface of the aluminum slide substrate, and the Raman signal for this sample with optimum pH was recorded.
For the SERS measurements, 200 µL of Ag and Au colloids, 100 µL of stock solution of L-Tryp, and 70 µL 0.1 M NaCl for colloid activation were transferred to a microcentrifuge vial and mixed by vigorous manual agitation, with an ending pH 7.35 (Ag) and 4.52 (Au). SERS spectra were acquired immediately and 10, 20, and 30 min after mixing until 24 h to ensure that the analyte was adsorbed on the CRS surface [27]. A small volume of 10 µL this sample was transferred onto an aluminum microscope slide for Ag and gold coated slide for Au, and spectra were acquired at laser powers of 11.2, 15.6, and 20.0 mW. To confirm the results, Raman and SERS measurements were repeated several times for each sample.
Since changes in dispersant media such as pH, ionic strength, and even analytes can promote nanoparticle aggregation [28], NaOH and HCl solutions 0.10 M and 0.01 M, respectfully, were prepared and used for adjusting the pH of silver and gold colloidal suspensions from 2.0 to 11.0. An aliquot of 1.0 mL of the original Ag and Au colloid was manipulated by adding very small aliquots of NaOH or HCl solutions until the desired pH was obtained. Samples of 200 µL of the colloid at the desired pH were mixed with 100 µL of L-Tryp solutions at concentrations of 4.9 x 10⁻¹² M for Ag NPs and 4.9 x 10⁻⁸ M for AuNP. SERS spectra for each sample were collected every 20 min after mixing with the nanoparticles at a specified pH. An aliquot of 10 µL L-Tryp solution and AgNP and AuNP colloid was transferred onto aluminum or gold slides, and the Raman signal for each mixture was recorded and acquired. Fixed laser powers of 15.6 and 20.0 mW range were used to acquire the SERS spectra for L-Tryp solutions in contact with AgNP and AuNP, respectively.

2.5. Computational Method

In this study, the neutral or zwitterion (+H3NCH(R)COO-), the cationic species (+H3NCH(R)COOH), and the anionic species (NH2CH(R)COO-) of the molecular structure L-Tryp were optimized using DFT at the B3LYP (Becke, three-parameters, Lee-Yang-Parr) level of theory with 6-311G basis set, using Gaussian™ v.-16 program [29]. For the optimized structures of L-Tryp, vibrational Raman frequencies were computed at the same level of theory and compared with experimental spectra. To have an insight into the interaction of L-Tryp with the metal NP surface, a calculation with a surface of ten (10) Ag and Au atoms was performed. Initially, the energy and vibrational Raman frequencies calculation was done for the surface using DFT at B3LYP level with LANL2DZ (Los Alamos effective core potential with double zeta function). To evaluate the interaction of the different forms of L-Tryp with the Ag or Au surfaces, two methods for optimization and frequency calculations were computed. First, calculations were performed with the possible molecular forms of L-Tryp (neutral, cationic, and anionic) and the Ag and Au surfaces. These calculations were done using pseudo potentials for Ag and Au with LANL2DZ basis set and for L-Tryp structures with 6-31G basis set. This combination was used in order to save computational costs. The second method of calculation was accomplished using the LANL2DZ basis set for both Ag and Au atoms and L-Tryp structures. These methods were done by freezing the Ag and Au atoms.

3. Results and Discussion

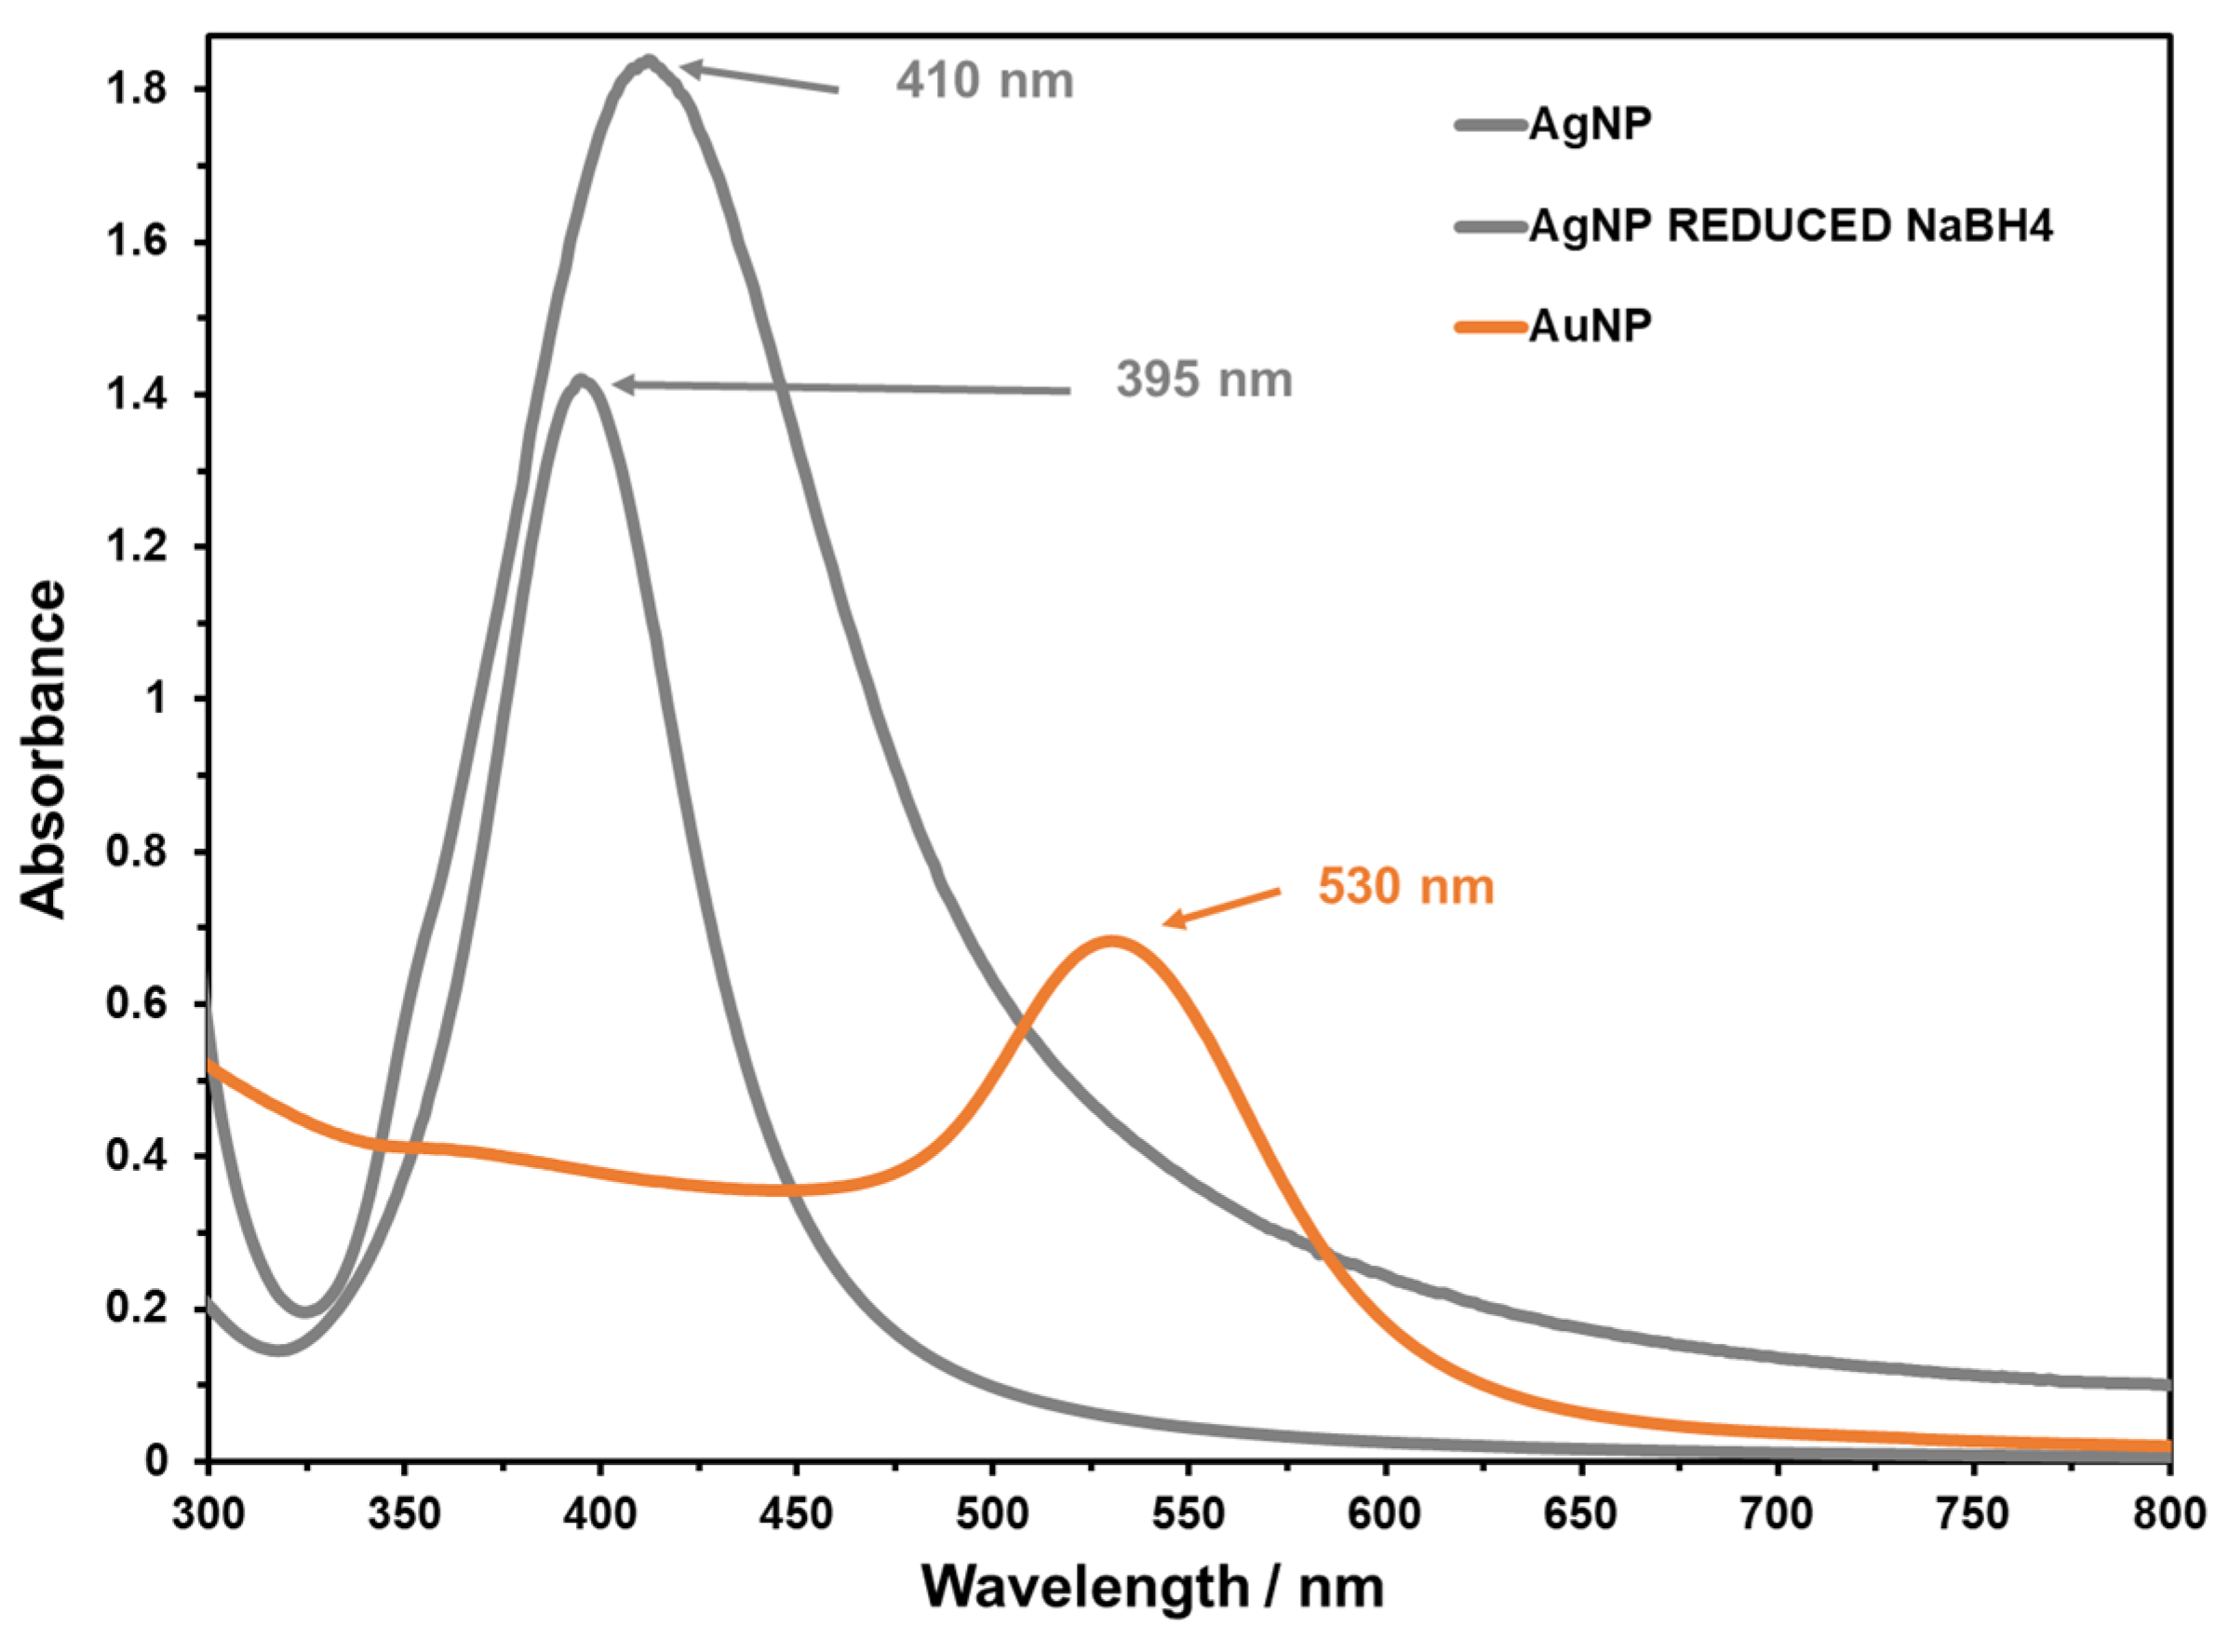
3.1. Nanoparticles Characterization

AgNPs and AuNPs were synthesized as described in the experimental section. Briefly, AgNPs were also reduced chemically using sodium borohydride [26]. However, the NPs obtained did not perform as well as citrate-reduced NP at low L-Tryp concentrations. This has been attributed to the optical properties of metallic nanostructures that depend more markedly on shape than on size [30]. Ultraviolet-visible (UV-Vis) absorption spectroscopy is one of the most widely used simple and sensitive techniques for the confirmation of nanoparticle synthesis. It was used to characterize the wavelength max and the width of the absorption band of the electronic surface plasmon. The presence of only one plasmon component (transverse) indicates that the colloids consist primarily of nanospheres for both AgNPs and AuNPs [31]. The absorption max was located at 410 nm for Ag and 530 nm for Au. Figure 1 shows the results of the characterization of the colloidal suspensions of AgNPs and AuNPs. Scanning Electron Microscope (SEM) was used further to confirm the nearly spherical nature of the NP (Figure 2).

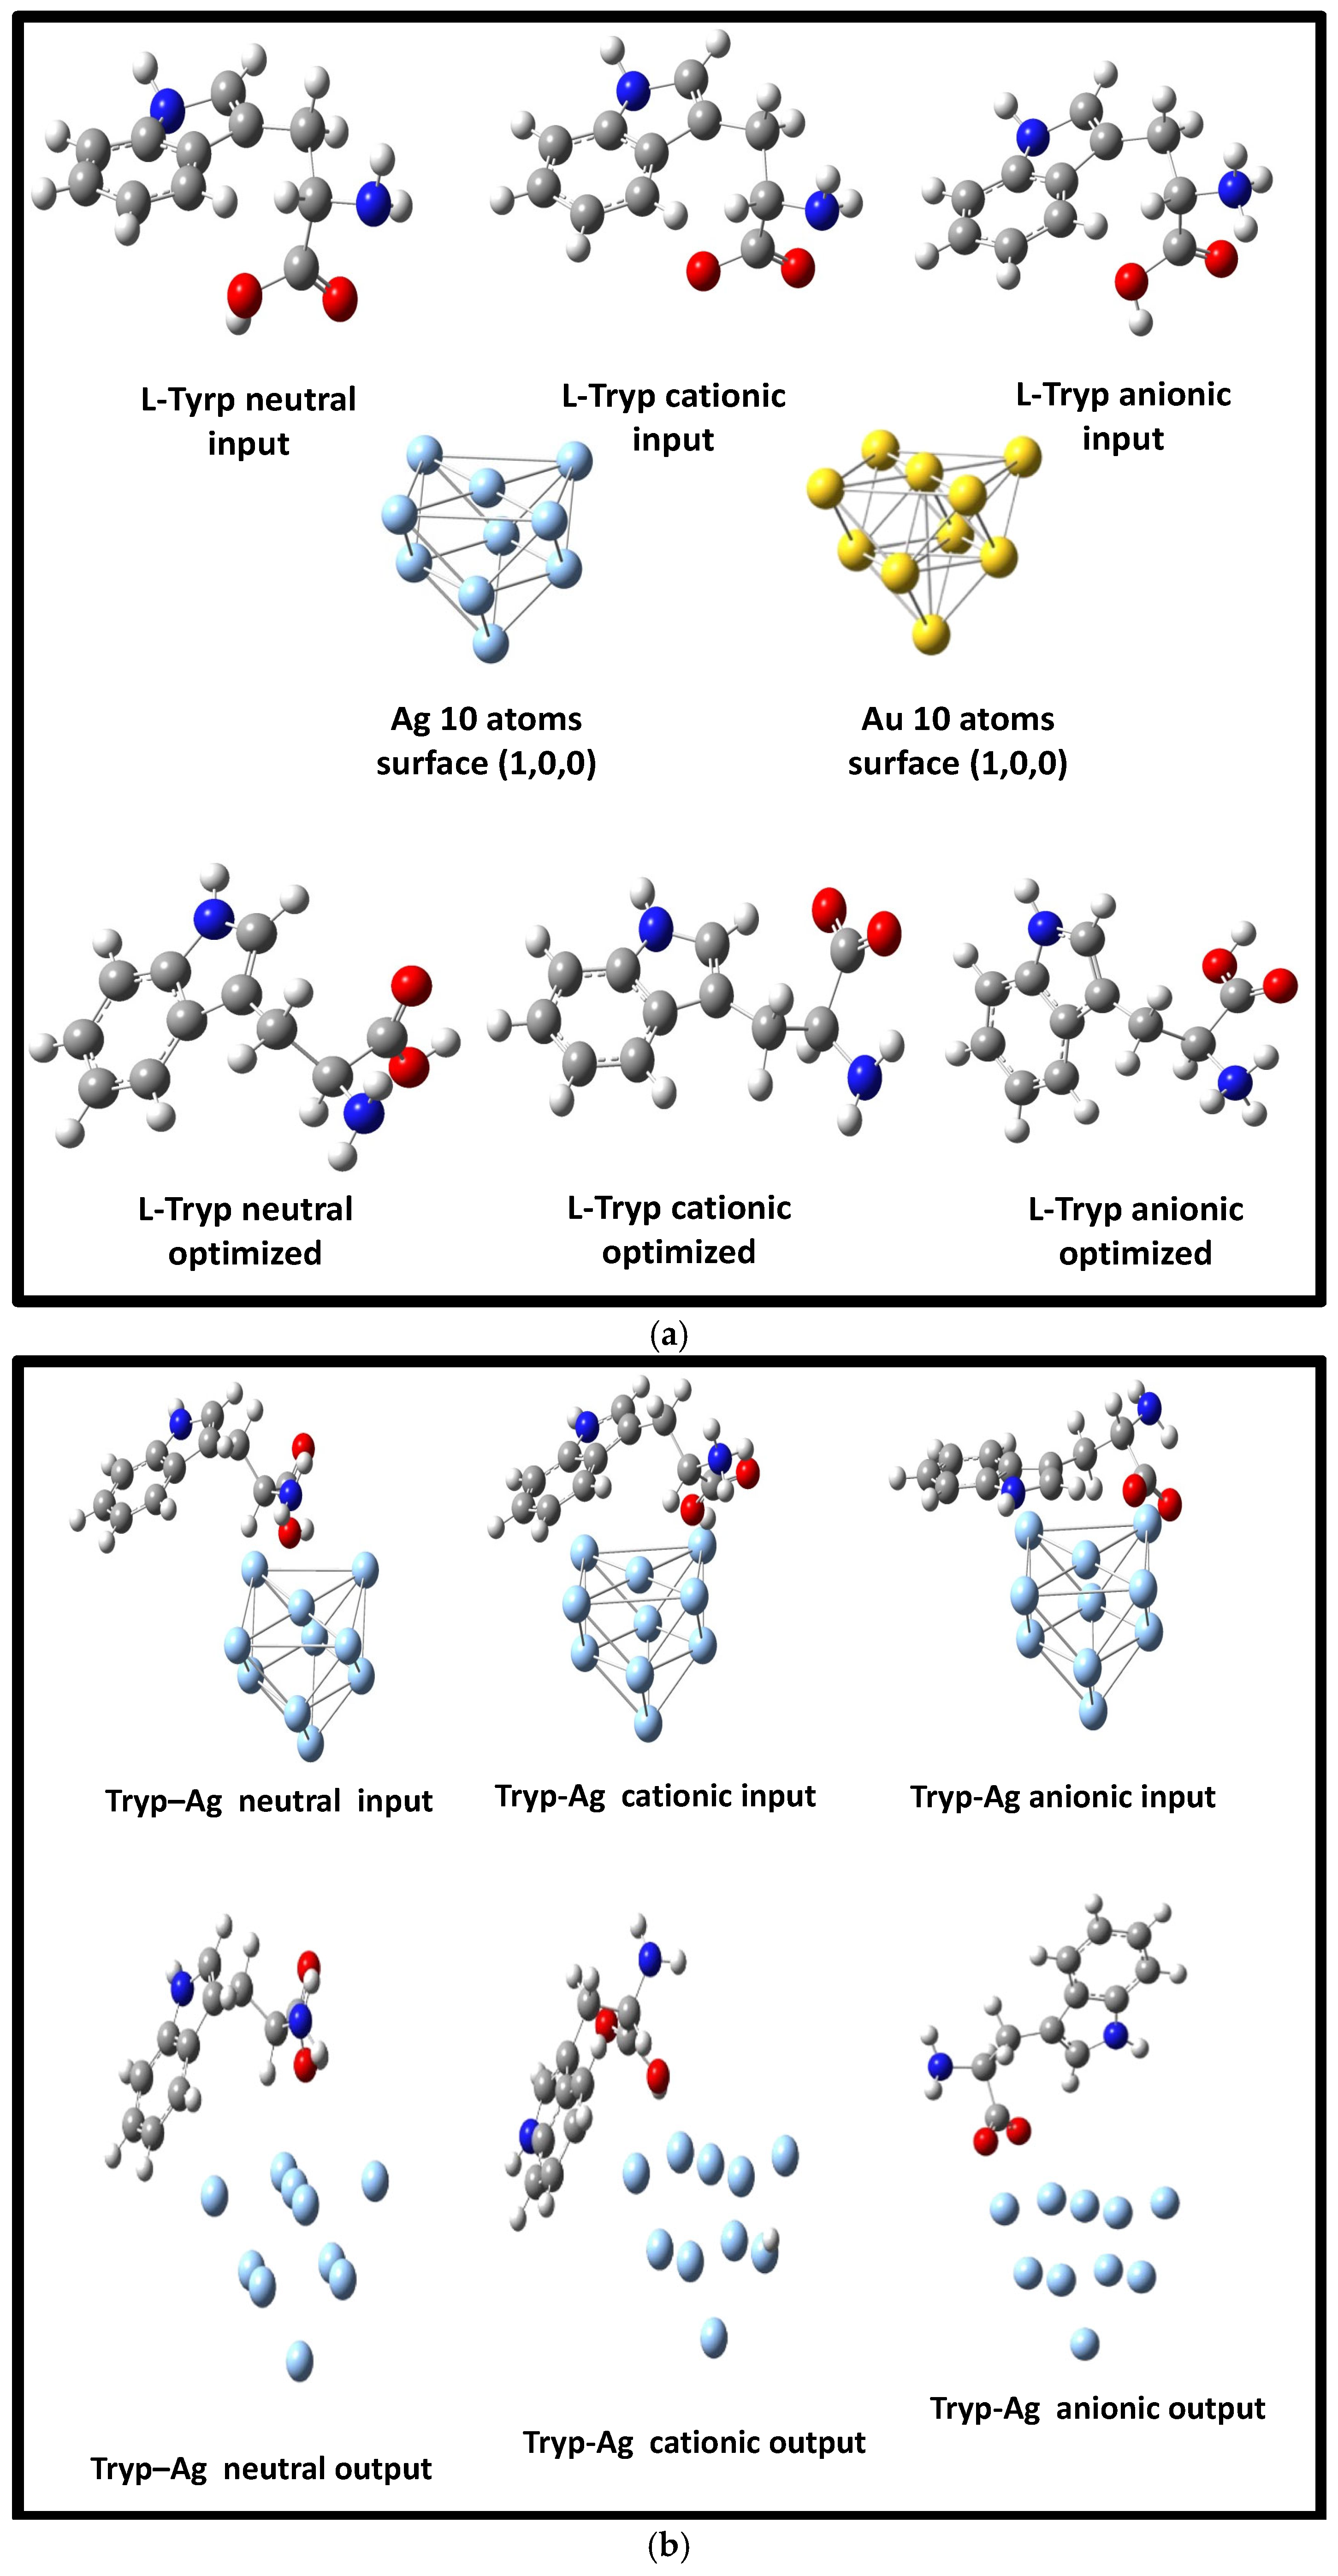
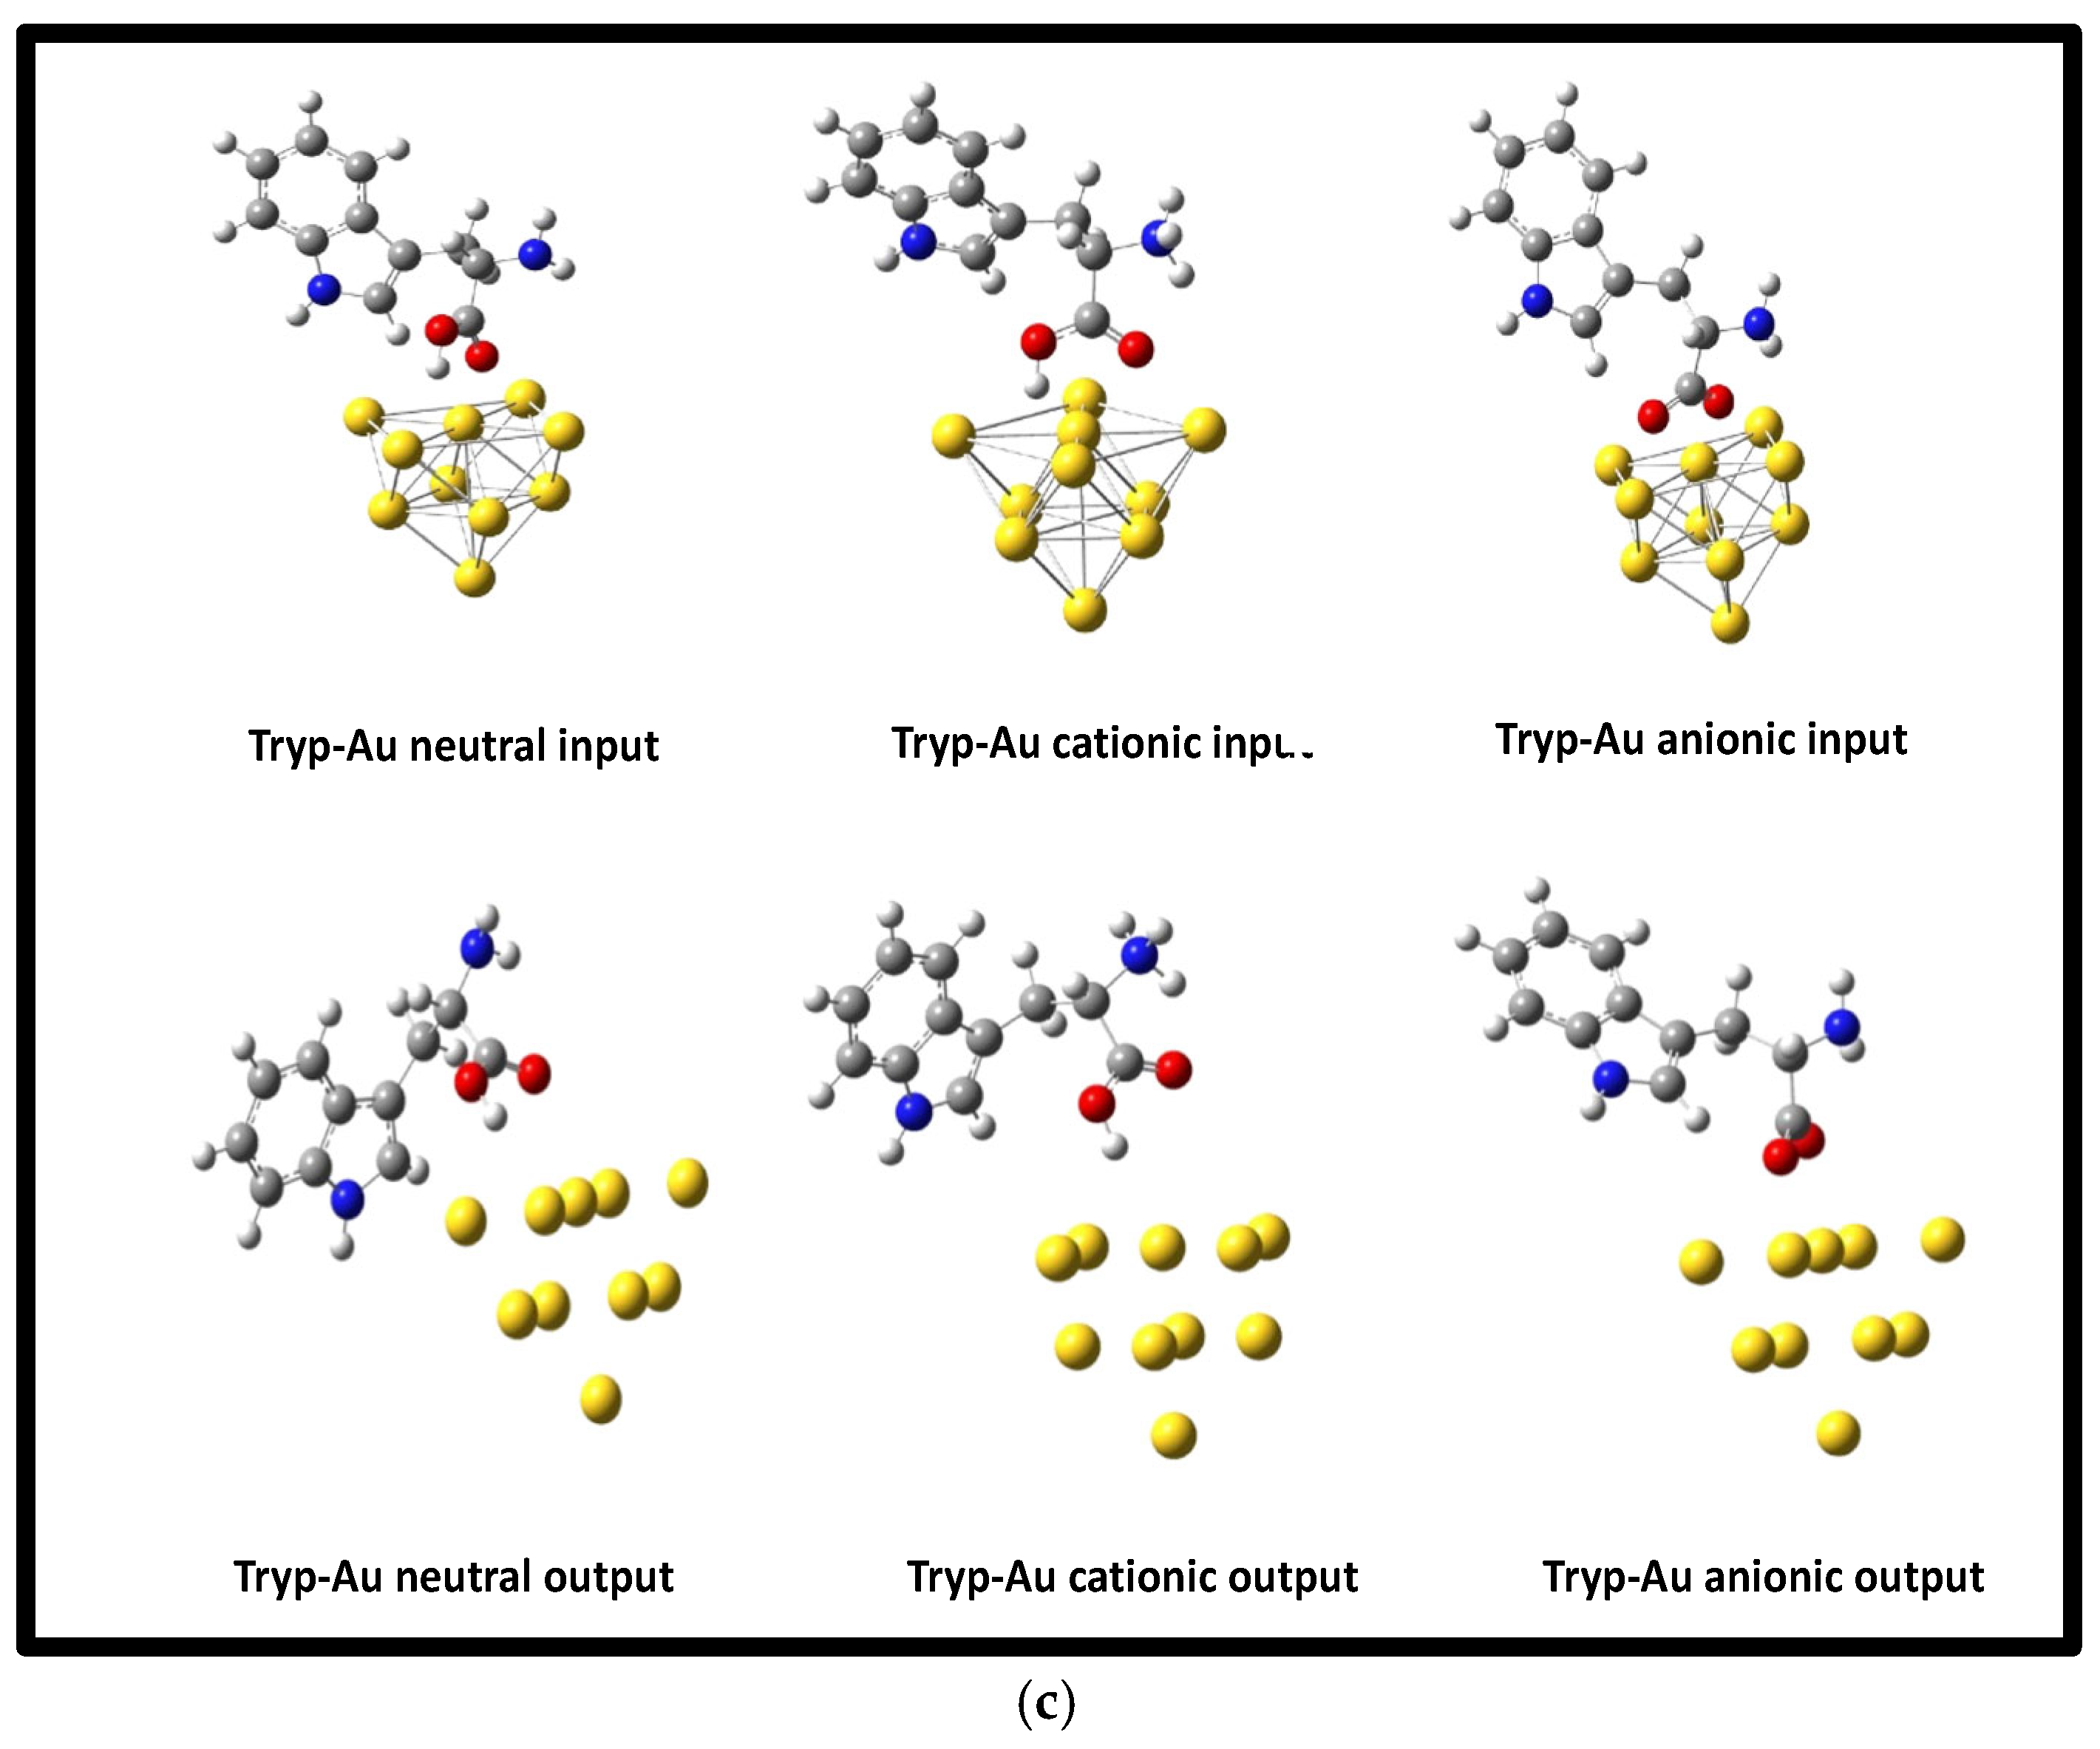
3.2. Optimization of Geometries of L-Tryp on NP substrates models

Figure 3a–c shows the geometries of inputs for the calculations of L-Tryp with the AgNP and AuNP surfaces. These were based on optimized structures of the neutral, cationic, and anionic forms of L-Tryp. All optimized structures were confirmed to be minimum energy conformations. The optimized structure of the L-Tryp molecule and the model NP surfaces consisting of 10 Ag (1, 0, 0) and 10 Au (1, 0, 0) are shown in Figure 3(a) Ag/L-Tryp and Figure 3(b) Au/L-Tryp.

3.3. RS Spectra

Raman spectra of dilute solutions of L-Tryp were measured to determine the SERS activity of the NP for the desired application. NR of solid L-Tryp and SERS spectra at a low concentration (10-13 M for Ag and 10-8 M for Au) compared with L-Tryp in aqueous solution (10-3 M) are shown in Figure 4. Peak positions are listed in Table 1, together with the appropriate tentative assignment of vibrational modes. Based on the position of the peaks and their relative intensities an estimate can be made on how the molecules are attached to the NP surface. This assignment was compared to previously published data on L-Tryp [32,33,34].
Similarly, the calculated Raman shift spectra using DFT at B3LYP level with LANL2DZ, measured SERS, and Raman band position and tentative assignments are shown in Table 1. SERS spectra are different than those from NR spectra. Although similar peaks are present in these spectra, there are also significant differences, including peaks that have different relative heights, different shapes, and new peaks are present. L-Tryp has three different ionic forms depending on the pH of the solution: cationic (+1H3NRCOOH), anionic (NH2RCOO1-), and zwitterion (+1H3NRCOO1-) [35]. The structures are shown in Figure 5 [35,36]. The results strongly show a notable improvement in the strengths of Raman signals. This fact not only highlights the efficacy of SERS colloidal suspensions but also underscores their ability to enhance interactions in the carboxylate and amine groups of amino acid structure. The enhancement of the Raman signals suggests a greater accessibility and resonance of molecular vibrations, implying that SERS colloidal suspensions are enhancing the spectroscopic properties of these functional groups. SERS spectra of L-Tryp on Ag and Au were found to appear quite similar (Figure 4). notably, new bands were observed in the ~2130 – 2254 cm-1 range for AuNP SERS spectra, showing in each case a weaker absorption at 2254 cm-1, assigned as overlapping asymmetric stretches. A medium intensity at 2130 cm-1, assigned as the approximately symmetric stretch, but disappearing at pH close to the pKa of L-Tryp, whereas it was absent for the Ag SERS spectrum, as shown in Figure 4.
L-Tryp has a (–COO-) group, an amino group (-NH2/-NH3+), and a side group consisting of 3-methyl indole. These are the possible active sites for binding to NP surfaces. For (–COO1-), group stretching modes are observed at 1427 and 1628 cm-1. The band at 1560 cm-1 corresponds to a deformation of the NH3+ species. For the (-NH2/-NH3+) group, stretching modes were observed at 3065 and 3246 cm-1, respectively, in the NR spectra for the solid and for aqueous solutions of L-Tryp [37]. However, the SERS spectra do not present enhancements of these signals (-NH2/-NH3+) with Ag but were observed on Au colloids. Hence, the orientation of the molecule on the silver and gold surface can be inferred from aromatic C–H stretching vibrations, ring stretching vibrations, the ring breathing mode, in-plane and out-of-plane vibrations, and the SERS surface selection rules [38,39]. Also, the C–H stretching vibrations were observed in SERS on the Au surface at 2942 cm-1.
The theoretical vibrational wavenumbers predicted from DFT at B3LYP level with LANL2DZ calculation, the observed experimental of L-Tryp on Ag and Au surfaces are tabulated in Table 1, and the direct view of these vibrational animations from Gaussian View™. Also, Cao and Fisher compared the vibrational modes of L-Tryp with the DSD infrared spectrum [32].
The -C-C- ring breathing mode and -C-C-C- trigonal bending are tentatively assigned to the bands at 748- 757 cm-1 and 1001-1010 cm-1 for L-Tryp. The modes were observed as a strong band at 1011 cm-1 for Ag and 1009 cm-1 for Au in SERS spectra, respectively. A corresponding Raman band has been observed in the same region [34,40]. Neither a considerable red shift nor significant band broadening related to this vibration mode was identified in the SERS spectra of L-Tryp, indicating a low probability of a direct ring π-orbital to metal interaction. The spectral intensities in the NR solid L-Tryp, NR aqueous L-Tryp solution observed at 1318, 1326, 1337, 1342, 1360-1361, 1380, 1416-1427, 1441-1457, 1479-1492, 1557-1560, 1578-1587, 1616-1618 cm-1 are assigned to carbon vibration in indole ring stretching. The degenerate frequency associated with in-plane carbon bending vibrations has been identified at 529 and 536 cm⁻¹ in the SERS spectra of Ag and Au, as well as at 574 cm⁻¹. A split into two non-symmetric components is observed at 380 and 395 cm-1, assigned by degenerate carbon out-to-plane bending vibrations. The C-H stretching vibrations are associated with the presence of bands at 2950-2952 and 3059-3065 cm-1. The presence of the ring C-H stretching band in a SERS spectrum is indicative of a tilted orientation of the aromatic ring moiety on a metal substrate, and it has also been well documented in the literature [38,39]. In this work, the aromatic ring C-H stretching band was not observed in SERS spectra on Ag, indicating that the indole ring adsorbed flat on the Ag surface. The orientation of L-Tryp on the AuNP surface suggests that there is a certain angle between the ring plane and the Au surface for the appearances of both in-plane modes and out-of-plane modes, and that is not shown in the SERS spectra. The frequencies in the NR solid L-Tryp, NR aqueous L-Tryp solution at 1079, 1167, 1235-1243, and 1276 cm-1 are assigned to -C-H in-plane bending vibration. This frequency was observed at 1090/1083, 1170/1168, 1242/1243, and 1284/1289 cm-1 in the SERS spectra of L-Tryp on Ag and Au colloidal suspension, respectively. The C-H out-of-plane bending vibrations in the NR solid L-Tryp and NR aqueous L-Tryp solution have been assigned at 845, 933-929, and 974cm-1. The weak bands at 1463 and 1457 cm-1 in SERS spectra for Ag and Au, respectively, correspond to the CH2 scissoring mode. In L-Tryp, the wagging vibrations of CH2 are found at 1318 cm-1, which is justified by the DFT calculation but does not appear in the SERS spectra.
The carbonyl asymmetric stretching appears as a very, very weak band at 1618 cm-1 in the SERS spectrum for Ag and Au colloids calculated. The weakening of this carbonyl stretching vibration indicates that the C=O is not in direct interaction with the AgNP and AuNP surfaces. It is also revealing to observe the νs (COO1–) bands at 1396 cm-1 for Ag. This indicates that the Ag-COO1- and Au-COO1- bonds formed by the adsorption of L-Tryp on Ag and Au are not ionic. The bonds would then have a covalent character. This carboxylate (-COO1-) group binds to the metal surface via either the oxygen lone pair electrons or the carboxylate π system [41]. The geometry of the (-COO1-) on the surface, which is stated by steric hindrance between the carboxylate ion and other adjacent substituents, determines the nature of binding of these molecules on the surface.
The -N-H out-of-plane bending deformation is assigned to 604/607 cm-1 in the SERS by Ag and Au. Another important vibrational mode of L-Tryp at located at 1137 cm-1 for Ag and 1132 cm-1 for Au, corresponding to the wagging vibration of -NH31+ and indicating that the amino acids have the NH2 form twisted when lying on the Ag/Au surface as determined by a pH-dependent measurement. The -NH2 form, rather than -NH31+, is regarded as a preferential structure when amino acids attach to the Ag surface in the SERS measurements, according to SERS studies carried out previously [42,43]. This blue shift in its frequency of approximately ± 15 cm-1 has been previously reported for other amino acids [37]. The band at 1066 and 1060 cm-1 observed in the NR solid L-Tryp and NR aqueous L-Tryp solution that correspond to the ν(CN) vibration was not observed in SERS spectra on AgNP and AuNP. It is probably overlapped with the band at 1011 cm-1 for Ag and 1009 cm-1 for Au, having suffered a larger red shift on the AuNP surface because the SERS frequencies of these modes are usually very close to those observed in Raman solid of amino acids. The NH2 scissoring modes show up between 1590 and 1670 cm-1 in primary aromatic amines. The bands at 1598-1603 cm-1 and 1666-1661 cm-1 were assigned to -NH2 scissoring mode in NR solid L-Tryp and NR aqueous L-Tryp solution.

3.4. Theoretical Discussion

Raman Shift calculations of optimized neutral or zwitterion (+H3NRCOO-), cationic (+1H3NRCOOH), and anionic (NH2RCOO1-) forms of L-Tryp structure were compared with the experimental Raman spectra of solid L-Tryp and with spectra of aqueous solutions of L-Tryp. The geometries of these optimizations are shown in Figure 3. For these structures the comparison with experimental vs. calculated Raman spectra is shown in Figure 6. It is possible to observe similarities between the NR spectrum of solid L-Tryp spectrum and the calculated neutral form of this molecule. Still, there are differences because the calculations were done without anharmonic corrections in order to save computational cost. The optimization of L-Tryp with the AgNP and AuNP surfaces was completed with the convergence criterion accepted for the neutral form. Still, the calculation with pseudopotential produced a deformation of the L-Tryp structure. For the optimization with the LANL2DZ basis set for all the atoms, it was possible to see an orientation of the carboxylate group of the L-Tryp structure. This was oriented in the same form as the calculation with pseudopotential (Figure 3).
Generally, on an AgNP and AuNP surface, chemisorption can take place through the formation of a bond between the Ag and Au surface and an adsorbed molecule, e.g., Ag–N, Ag–O, Ag–S, or Ag–X (X = halogen) bond [43,44,45]. In order to analyze the influence of chemical enhancement on the SERS spectra, one needs to consider two possible interactions between the adsorbate and the metal surface. Physical adsorption is the result of relatively weak interactions between the solid surface and the adsorbate with an enthalpy of adsorption higher than −25 kJ mol-1. On the other hand, in Chemical adsorption, the adsorbed molecules are strongly bound to the surface with an enthalpy of adsorption lower than −40 kJ mol-1 [39,46]. In the process of chemisorption, the adsorbed molecule changes its chemical structure and symmetry because of bond formation with the surface. This mechanism usually introduces wavenumber shifts [45] between vibrations of adsorbed molecules in comparison to the normal Raman spectrum of these molecules, as shown in SERS Au/L-Tryp spectra in Figure 5.
The energy gaps between the highest occupied molecular orbital (HOMO) and the lowest unoccupied molecular orbital (LUMO) for L-Tryp on AgNP and AuNP surfaces were calculated at the B3LYP/6- 311G level of theory. These are represented in Figure 7. The energy gap reflects the chemical activity of the molecule. The lower the HOMO-LUMO energy gap explains the eventual charge transfer (CT) interactions taking place within the molecule. In Figure 7, it can be observed that the Fermi levels of the AgNP and AuNP surfaces are located at -446.7 kJ mol-1 and -509.9 kJ mol-1 (Figure 7a and Figure 7b), respectively. The two main binding sites of the carboxylate group and the amino group were considered for the present calculation. In L-Tryp, the highest occupied molecular orbital (HOMO) is located at −141.8 kJ mol-1, thus precluding a CT from L-Tryp to the conduction band of the Ag and Au surface. It is important to note that the energies of the first empty MOs (LUMO) of L-Tryp acid (cationic form) are within the energy range of the valence band of the Ag surface but close to level Fermi of the Au surface. This fact explains the CT from the Ag and Au surface to L-Tryp and the LUMO (225.8 kJ mol-1) is localized on the -COO1- moiety, explaining the fact that part of this moiety is directly facing the Ag surface [37]. The adsorption energies of L-Tryp on Ag and Au via the cationic form of the amino group were estimated as 107.7 and -12.4 kJ mol-1, respectively, and the adsorption energies of L-Tryp on Ag and Au through the carboxylate group anionic form were estimated as -611.7 and -731.8 kJmol-1, respectively, on Ag and Au. These results were in good agreement with the interpretation that L-Tryp adsorbs via the carboxylate group and the amino group (-NH2) form on Ag and for Au surface adsorbs via the amino group in its protonated NH31+ form and the ionized carboxyl group (–COO-).
It is also informative that the difference in adsorption energy between the carboxylate and the amino group is quite less for Au than for Ag. This may explain why the carboxylate group was weakly observed on Au but more strongly observed on Ag.

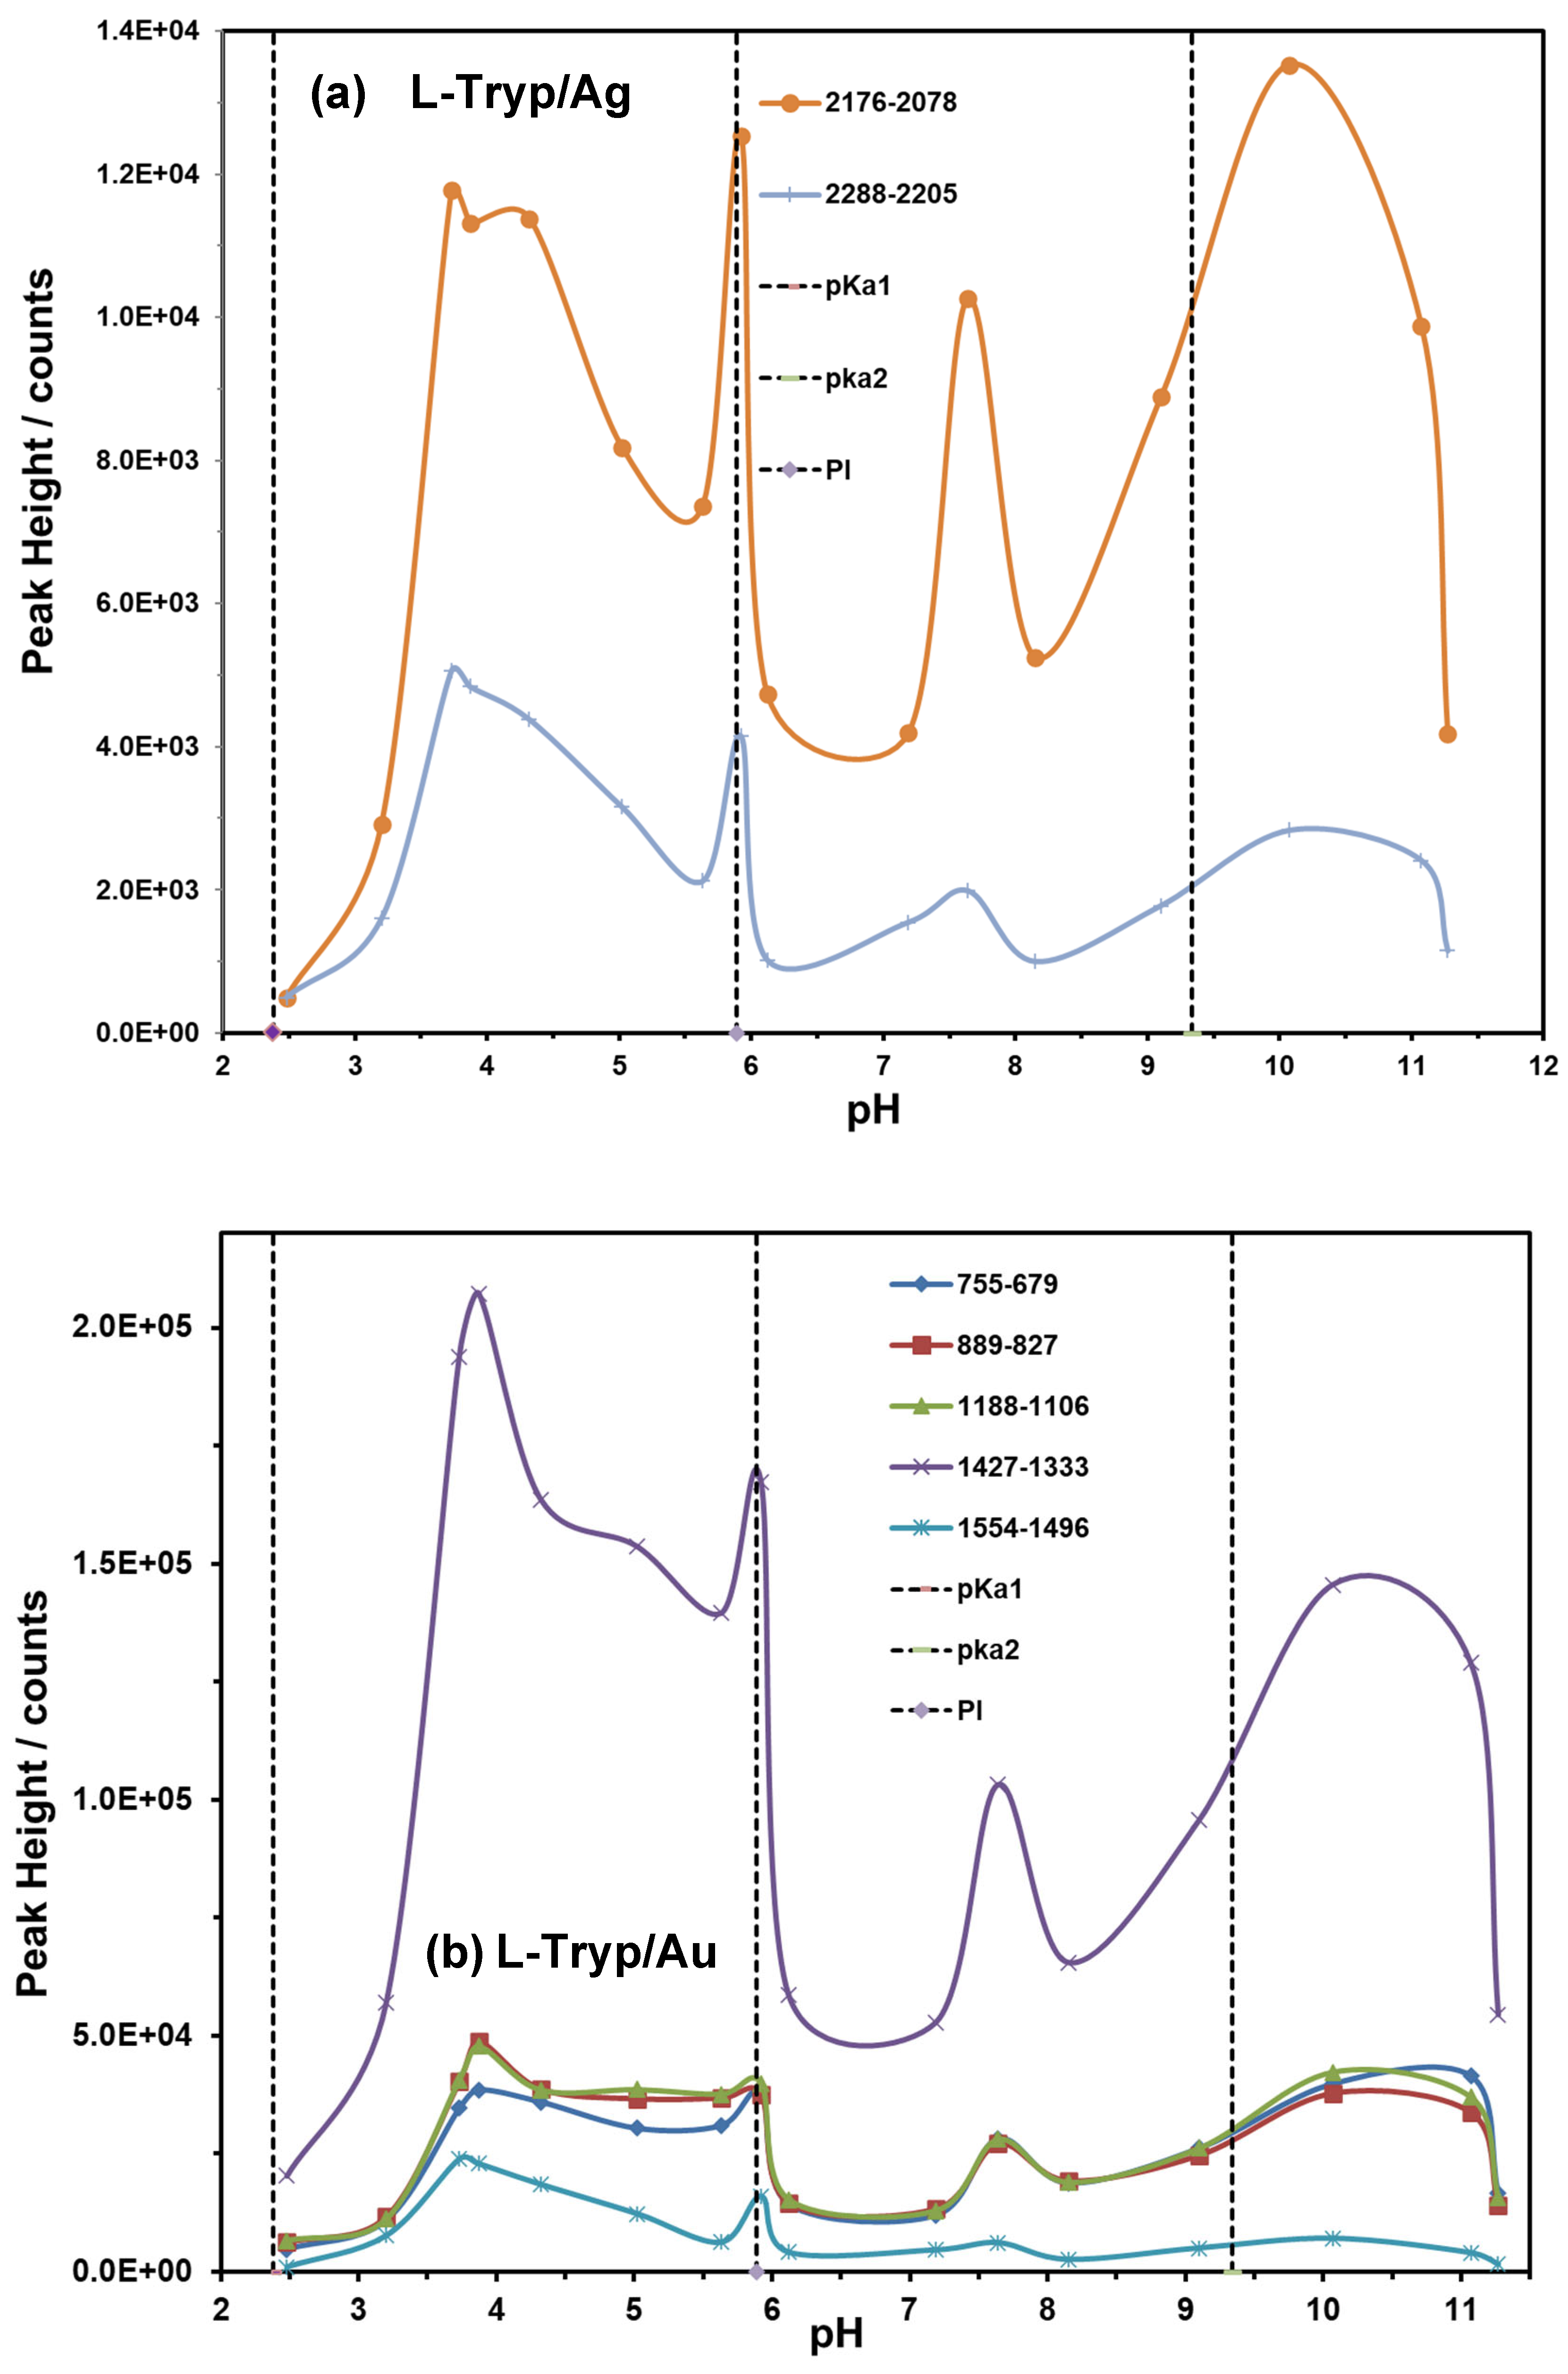
3.5. Effect of pH on Vibrational Bands of L-Tryp on Ag and Au Colloids

The pH can affect the way a molecule orients itself on the surface of a substrate. In particular, it affects the state of protonation and, hence, the number and nature of binding sites of molecules colloidal particles [27]. Numerous reports are available in the literature focusing on interactions of L-Tryp with Ag colloids [2,27], and a systematic study on the effect of gradual changes in net atomic charge distributions at different terminals of L-Tryp on Ag metal interaction was also reported recently [27]. However, in this work, the most probable conformation of L-Tryp on Ag and Au colloidal solution was assessed by varying the pH of AgNP and AuNP in the pH range from 2.0 to 11.0. It was important to determine if there were differences in the spectral profiles of the biomolecule studied. The AgNP and AuNP colloidal suspensions then there were prepared and pelleted at pH 3.00 and 8.00, respectively. Zeta potentials were measured for each sample to identify the main forces that mediate interparticle interactions and to understand dispersion and aggregation processes with regard to the stability of metal colloids. The measurements of “as-prepared” colloids to generate average values of −37.4 mV at pH 7.35 for AgNP and −34.9 mV at pH 4.10 for AuNP confirm the moderate stability of Ag and Au nanoparticles. The larger the zeta potential, the more likely the suspension is to be stable because the charged particles repel one another and thus overcome the natural tendency to aggregate. As expected, when the acid solution was added to the NP’s suspension, the surface charge turned to more positive values, resulting in a decrease in the magnitude of the zeta potential (less negative). High zeta potential values were obtained at pH 2 and 11, therefore correlating with the decrease of SERS signal enhancement as a result of aggregation and flocculation of the Ag and Au colloids.
Contrary to information contained in most SERS reports on AgNP a 532 nm laser excitation line did not produce highly enhanced SERS spectra or the typical highly resolved traces when exciting the SERS spectra of L-Tryp. This situation is illustrated in Figure 8a. These results also demonstrate that for different diameters of spherical AgNP and AuNP, higher SERS intensities were obtained for average NP sizes of 40-60 nm. This is shown for AuNP in Figure 8b.
AgNP and AuNP were mixed with L-Tryp at different concentrations and pH measurements were done prior to measuring Raman spectra. To ensure adsorption equilibrium and pH stabilization spectral measurements were obtained 20 min after preparing the mixtures. A detailed analysis of the relative variation in intensities of different vibrational bands in Figure 8 and Figure 9 for Ag and Au, along with the results obtained from DFT calculations, reveal an interesting increase of the metal–molecule interaction with the change in pH of Ag/L-Tryp and Au/L-Tryp. Peak areas of spectra obtained at different pH were calculated using OPUS™ software (V. 3.0; Bruker Optics, Billerica, MA). The integration was performed in the regions that showed the most intense bands in the SERS spectra assigned to the bond vibration of the biomolecule.
According to the figures shown, there is a close dependence between SERS peak areas and the pH for L-Tryp species under study. At pH values below pKa and above pKb, the spectral profile decayed markedly compared to neutral or basic pH values for Ag surfaces and neutral or acid pH values for Au surfaces, where is evidently observed a high-intensity enhancement of the vibrational modes until reaching maximum intensity at pH ~ 9.42 and pH ~ 3.73. Therefore, parameters such as analyte concentration, nanoparticle size, and colloidal pH values have a huge effect on establishing the most stable conformation and orientation of L-Tryp on silver and AuNP surfaces since, according to results, L-Tryp molecules interact with the Ag surface through the carboxylate group nearest at its pKb = 9.40, at ~10-12 M concentration, with approximate 60 nm particle size, and with Au surface L-Tryp molecules interacts through the amino group on neutral form close to its pKa at pH 3.73, at a concentration of ~10-8 M and ~ 40 nm particle size. Good results were also observed at values near its isoelectric point (IP).

4. Conclusions

The AgNPs and AuNPs colloidal suspensions, with an average particle size ranging from approximately 40 to 60 nm, serve as effective sensing platforms for developing SERS methodologies. These methodologies help establish the most stable orientations of amino acids, such as L-Tryp. Limit of detection for L-Tryp is around 10-13 M for AgNP and about 10-8 M for AuNP. Raman intensities signals were considerably modified by the pH of the colloidal suspensions, which induces changes in the electrostatic charge on the nanoparticle surfaces. The binding of L-Tryp molecules to the colloids is influenced by the preparation and surface conditions of the nanoparticles, as well as the combination of electrolytes used to promote the attachment of the molecules to the surface. Position and relative intensities of the peaks in the SERS spectrum of L-Tryp depend on several factors: the excitation laser line, the type of metal substrate, the pH of the medium, ionic strength, the concentration of the solution, the aggregation of the colloid, and the potential chemical interactions between the amino acid and the metal substrate. Specifically, the vibrations υs (COO) and υs (NH2) observed in SERS on the Ag surface, and the detection of the ns (NH3+) at approximately 3030 – 3130 cm-1 on the Au surface, confirm that L-Tryp was adsorbed in its anionic form on AgNPs substrates. The L-Tryp molecule interacts with AgNPs through the – COO- and –NH2 groups, while the indole ring fragment is near the surface and interacts with the Au surface via NH3+, depending on the pH of the colloidal suspension. The pyrrole moiety is located further from the surface than the benzene ring. Therefore, L-Tryp molecules are likely tilted on the AgNPs and AuNPs surfaces due to the ionized carboxyl group, creating an angle between the indole rings and the AuNP surfaces. Experiments reveal that the SERS spectra vary according to the different formulations of Ag colloids [2]. The theoretical data closely align with the experimental results.
SERS studies of amino acids and peptides are crucial, as they provide insight into the interactions between proteins and metal substrates. Additionally, they can yield valuable data for subsequent studies of larger peptides and proteins. L-Tryp and its derivatives are widely distributed and can be converted into several biologically important compounds. Consequently, the results obtained are of significant interest to physicists, neurobiologists, electrochemists, bioengineers, and others.

Author Contributions

Conceptualization, methodology, formal analysis, supervision T.F.M., A.C.P.J., and S.P.H.R.; investigation, T.F.M., A.C.P.J., T.P.V.R., F.M.C.G., L.C.P.L, N.J.G.F., C.A.O.Z., E.G.A., J.R.C.S, E.S.L.R., J.A.C.O., and S.P.H.R.; writing original draft preparation, T.F.M., A.C.P.J.; validation and software: E.S.L,R., L.C.P.L., N.J.G.F., C.A.O.Z., and J.R.C.S.; writing, reviewing, and editing, E.G.A., T.P.V.R., J.A.C.O., and S.P.H.R.; visualization, data curation, project administration, F.M.C.G.; resources, funding acquisition, J.A.C.O. and S.P.H.R.

Funding

This material is based upon work supported by the US Department of Homeland Security (DHS), Office of University Programs (OUP) under Grant Award # 22STESE00001-02-00 and the DHS Counter Weapons of Mass Destruction (CWMD), Academic Research Initiative (ARI), Grant Award # 21-CWDARI 00042-01-00. Additional support from the US Department of Agriculture (USDA), National Institute of Food and Agriculture (NIFA) award # 2022-77040-37623 is also acknowledged. The views and conclusions contained in this document are those of the authors. They should not be interpreted as necessarily representing the official policies, either expressed or implied, of the US-DHS or the USDA-NIFA.

Acknowledgments

The authors wish to thank the members of the Center for Chemical Sensors (CCS) and Chemical Imaging and Surface Analysis Center (CISAC).

Conflicts of Interest

The authors declare no conflict of interest.

Code: Data: and Materials Availability

If interested, don’t hesitate to get in touch with us for specific access information. The data will be placed in the research group’s Data Repository at https://www.uprm.edu/ccs-cicsa/.

Abbreviations

The following abbreviations are used in this manuscript:
L-tryptophan - L-Tryp
RS – Raman Scattering and Normal Raman Scattering - NR
Surface-Enhanced Raman Scattering - SERS
Ag – silver
Nanoparticles - NPs
silver nanoparticles - AgNPs
Au - gold
Gold nanoparticles - AuNPs
Density Functional Theory - DFT
Ultraviolet-visible - UV-Vis

References

  1. Aliaga, A.E.; Osorio, I.; Leyton, P.; Garrido, C.; Caniulefa, C.; Diaz, G.; Celis, F.; Diaz, G.; Clavijo, E.; Gomez, S.; Campos, M. J. Raman Spectrosc. 2009, 40, 164–169.
  2. Kandakkathara, A.; Utkin, I.; Fedosejevs, R.; App. Spec. 65, 5, 2011, 507 – 513.
  3. Dechan, M.F.; Lu, D.; You, R.; Chem, C.; Lu, Y.; Wu, Y.; Huiying, S.; Feng, S. Anal. Chim. Acta., 2020, 1 – 30.
  4. Zaheer, Z.; Ahmad-Malika, M.; Al-Nowaiser, F.M.; Khana, Z. Colloids and Surfaces B: Biointerfaces, 2010, 81, 587–592.
  5. Berg, J.M.; Tymoczko, J.L.; Stryer, L. Biochemistry. 5th ed., New York: W.H. Freeman; (2002). Section 3.1, Proteins Are Built from a Repertoire of 20 Amino Acids. Available from: http://www.ncbi.nlm.nih.gov/books/NBK22379/.
  6. Dehghan, M.; Fouladi, J.; Mousavinezhad, S. J. Paramedical Sciences (JPS), 2010, 1, 2, 19 – 25.
  7. Badawy, A.; Inter. J. Tryp Research, 10, 1 – 20, 2017 . [CrossRef]
  8. Fernstrom, J.D. J. of Nutr. 142, 2236S 0 224S, 2012. Available from: . [CrossRef]
  9. Contreiras, I. B.; Toscano, A.E.; Cabral, D.; Barreta, M.S.; Manhaes, R.; Bonfim, T. C.; Barreto, J. M. Euro. J. Pharma., 836, 2018, 129 – 135.
  10. Powers, R.; Cilp-Hill, R.; Ludwig, M.; Smith, K.; Waugh, K.; Minter, R.; Tuttle, K.; Lewis, H.; Rachbinki, A.; Gransrath, R.; Carmona-Iragui, M.; Wilkerson, R.; Kahn, D.; Joshi, M.; Lleo, A.; Blesa, R.; Fortea, J.; Alessaandro, A.; Costello, J.; Sullivan, K.; Espinosa, J.; Nature Commu, 10:4766, 2019, 1 – 11.
  11. Floc’h, N.; Otten, W.; Merlot, E. Amino Acid, 2011, 41, 5, 195 – 205.
  12. Chung, K.T.; Gadupudi. G.S. Environ. Mol. Mutagen., 2011, 52: 81–104.
  13. Oliveira, M.M.; Ugarte, D.; Zanchet, D.; Zarbin, A.J.G. J. Colloid Interf Sci., 2005, 292, 429- 435.
  14. Hugh, C.; Chena, Y.; J. Raman Spectrosc. 2009, 40, 150–156.
  15. Guiherme, B.; Sodre, L. Sant’Ana, Spectroquim. Acta P A: Molecular and Biomolecular Spectroscopy 190, 2017, 383–391.
  16. Ramanauskaite, L.; Snitka, V. Chemical Physics Letters 623, 2015, 46–50.
  17. Alvarez, R.; Arceo, E.; Goulet, P.; Garrido, J.; Aroca, R. J. Phys. Chem. B., 2005, 109, 3787 – 3792.
  18. Murphy, C.J.; Gole, A.M.; Stone, J.W.; Sisco, P.N.; Alkilany, A.M.; Goldsmith E.C.; Baxter, S.C. Acc. Chem. Res., (2008), 41 (12), 1721–1730.
  19. Fleger, Y.; Mastai, Y.; Rosenbluha, M.; Dressler, D.H. J. Raman Spectrosc., 2009, 40, 1572–1577.
  20. Ahern, M.; Garrell, R.L. J. Am. Chem. Soc., 1991, 113, 846.
  21. Lee, H.I.; Suh, S.W.; Kim, M.S. J. Raman Spectrosc., 1988, 19, 491- 495.
  22. Aliaga, A.E.; Osorio, I.; Leyton, P.; Garrido, C.; Carcamo, J.; Caniulef, C.; Celis, F.; Diaz, G.; Clavijo, E.; Gomez, J.; Campos, M, J. Raman Spec., 2008, 76, 164-169.
  23. Kim, S.K.; Kim, M.S.; Suh, S.W. J. Raman Spectrosc. (1987), 18, 171.
  24. M. Kazanci, J.P. Schulte, C. Douglas, P. Fratzl, D. Pink, T. Smith-Palmer, Appl. Spec., (2008) 63 214-223.
  25. Lee P.C.; Meisel, D. J. Physical Chemistry, 1982, 88, 3391.
  26. Lisiecki, I.; Billoudet, F.; Pileni, M.P. J. Phys. Chem. 100, 1996, 4160–4166.
  27. Chamoun-Emanuelli, A.M.; Primera-Pedrozo, O.M.; Barreto-Caban, M.I.; Jerez-Rozo, J.; Hernandez-Rivera, S.P. Nanoscience and Nanotechnology for Chemical and Biological Defense, American Chemical Society, 2009, 217-232.
  28. Primera-Pedrozo, O.M.; Rodríguez, G.D.M.; Castellanos, J.; Felix-Rivera, H.; Resto, O.; Hernández-Rivera, S.P. Spectrochimica Acta Part A: Molecular and Biomolecular Spectroscopy, 2012, 87, 77-85.
  29. Frisch, M.J., Trucks, G.W., Schlegel, H.B., Scuseria, G.E., Robb, M.A., Cheeseman, J.R.; Scalmani, G.; Barone, V.; Petersson, G.A.; Nakatsuji, H.; Li, X.; Caricato, M.; Marenich, A.V.; Bloino, J., Janesko, B.G., Gomperts, R., Mennucci, B., Hratchian, H.P., Ortiz, J.V., Izmaylov, A.F., Sonnenberg, J.L., Williams-Young, D., Ding, F., Lipparini, F., Egidi, F., Goings, J., Peng, B., Petrone, A., Henderson, T., Ranasinghe, D., Zakrzewski, V.G., Gao, J., Rega, N., Zheng, G., Liang, W., Hada, M., Ehara, M., Toyota, K., Fukuda, R., Hasegawa, J., Ishida, M., Nakajima, T., Honda, Y., Kitao, O., Nakai, H., Vreven, T., Throssell, K., Montgomery Jr., J.A., Peralta, J.E., Ogliaro, F., Bearpark, M.J., Heyd, J.J., Brothers, E.N., Kudin, K.N., Staroverov, V.N., Keith, T.A., Kobayashi, R., Normand, J., Raghavachari, K., Rendell, A.P., Burant, J.C., Iyengar, S.S., Tomasi, J., Cossi, M., Millam, J.M., Klene, M., Adamo, C., Cammi, R., Ochterski, J.W., Martin, R.L., Morokuma, K., Farkas, O., Foresman, J.B., Fox, D.J. Gaussian™ 16.0 and GaussView™ 5.0, Gaussian, Inc., Wallingford CT (2016) Wallingford, E.U.A.
  30. Kelly, K.L.; Coronado, E.; Zhao, L.L.; Schatz, G.C. J. Phys. Chem. B.; 2003, 107, 668–677.
  31. Suh, J.S.; Moskovits, M. J. Am. Chem. Soc., 1986, 108, 4711.
  32. Cao, X.; Fisher, G. J. Phys. Chem. B, 1999, 103, 9995- 10003.
  33. Kandakkathara, A.; Utkin, I.; Fedosejevs, R.; App. Spec., 2011, 65, 506 – 513.
  34. Madzharova, F.; Heiner, Z.; Kneipp, J.; J. Phys. Chem. C., 2016, 1 – 31.
  35. Ruthven, D.M. Principles of Adsorption and Adsorption Processes, John Wiley: New York, 1984.
  36. Takigawa, T.; Ashida, T.; Sasada, Y.; Kakudo, M.; Chem. Soc. Japan, 1966, 39, 2369 – 2378.
  37. Chuang, C.H.; Chen, Y.T. J. Raman Spectrosc. (2009) 40, 150-156.
  38. Markovits, A.; Garcia-Hernandez, M.; Ricart, J.M.; Illas. F. J. Phys. Chem. B, 1999, 103, 509.
  39. Suh J.S.; Kim. J. J. Raman Spectrosc, 1998, 29, 143.
  40. Bae, S.J.; Lee, C.; Choi, I.S.; Hwang, C.S.; Gong, M.S.; Kim, K.; Joo, S.W. J. Phys. Chem. B, 2002, 106, 7076.
  41. T. Nibbering, T. Elsaesser, Chem. Rev., 2004, 104, 10.
  42. Herne, T.M.; Ahern, A. M.; Garrell, R.L. J. Am. Chem. Soc. 1991, 113, 846.
  43. Allen, C.S.; Van Duyne, R.P. J. Am. Chem. Soc., 1981, 103, 7497.
  44. Roy, D.; Furtak, T.E. J. Chem. Phys.,1984, 81, 4168.
  45. Adamson, A.W. Physical Chemistry of surfaces, John Wiley and Sons: New York, 1990.
  46. Bhattacharya, S.; Vyas, N.; Ojha, A.K.; Dasgupta, S.; Roya, A. J. Raman Spectrosc.,2012, 43, 718–723.
Figure 1. UV–Vis spectra of prepared AgNP and AuNP.
Preprints 172502 g001
Figure 2. SEM micrographs were obtained for (a) AgNPs and (b) AuNPs.
Preprints 172502 g002
Figure 3. Optimized geometries of inputs and outputs for calculations of L-Tryp with AgNP and AuNP: (a) L-Tryp zwitterion, cationic and anionic form of L-Tryp and 10-atom surface representations for Ag (1,0,0) and Au (1,0,0); (b) AgNP surface interacting with L-Tryp molecular forms; (c) AuNP surface representations interacting with L-Tryp molecular forms.
Preprints 172502 g003aPreprints 172502 g003b
Figure 4. Comparison of Raman spectra of L-Tryp: (a) NR spectrum aqueous; (b) NR spectrum of solid; (c) SERS spectrum on AgNPs; and (d) SERS spectrum on AuNP.
Preprints 172502 g004
Figure 5. Three ionic molecular forms of L-Tryp.
Preprints 172502 g005
Figure 6. Comparison of Raman spectra of L-Tryp experimental: (a) NR spectrum of L-Tryp aqueous solution; (b) NR spectrum of solid; (c) calculated Raman spectrum zwitterion; (d) calculated Raman spectrum of anionic form; (e) calculated RS spectrum of cationic form.
Preprints 172502 g006
Figure 7. Diagram of the HOMO-LUMO energy gap of L-Tryp in its three forms calculated at the B3LYP/6-311G level on (a) 10 atoms Ag (1,0,0) surface; (b) 10 atoms Au(1,0,0) surface.
Preprints 172502 g007
Figure 8. SERS spectra of L-Tryp at different pH values at 785 nm with (a) AgNP and (b) AuNP.
Preprints 172502 g008
Figure 9. (a) Dependence of SERS signal of L-Tryp with AgNPs; (b) AuNPs.
Preprints 172502 g009
Table 1. L-Tryp adsorbed on AgNPs and AuNPs.
NR Trp
Neutral DFT
Calculations
NR L-Tryp Solid NR L-Tryp Aqueous Solution SERS DFT Calculations CCSDE
SERS
Experimental CCSDE
Assignment (cm-1) DFT Calculations LANL2DZ CCSDE, and Compared from Ref. [32,33]
Ag Au Ag Au Ag Au
260 243 245 232 νAg-O
359 352 380 323 329 359 ω -NH2
408 395 385 385 386 def. R.
430 412 396 398 def. R, r
476 472 467 β -CC- R, r, γ -CH2
526 514 579 523 520 β -N-H (r) ν R, r
537 533 590 529 536 δ(r), β i.p.
595 598 551 599 574 574 β (R)oop; γ -CH2 (high intensities in SERS)
630 607 620 640 604 607 γ -CH2; α -NH2;
β C-O
689 679 ν R, r
710 722 718 711 Def. R, r,ν -CN
748 748 749 724 744 740 721 ω -H(R); γ -CH2;
β -COO1-
771 757 759 771 758 θ (R), θ (r)
778 778 768 793 775 Def. R, r, α -COO-
787 788 789 790 β (R) -CC-; β (r)
808 γ-CH2, β -COO1-
845 845 846 869 843 824 β -CH(r),
858 859 858 864 δ-H(R),β-CH(-NH) (r)
878 878 877 891 889 868 β -H(R), α -H(r)
902 902 933 929 893 942 ν-CC- (r);ν-CNC-, (r)
959 974 975 980 δ-CH(r); γ-CH2; β-CH; γ-NH2
969 969 993 976 984 δ -CH2; ν -CN
1001 1010 1011 1010 1015 1011 1009 θ(R), θ (r); β H(R)
1031 1031 1028 1024 γ -NH3+, β H(C)
1037 1066 1060 1036 α(R)s in plane,
β-H (R)
1081 1079 1065 1085 1090 1083 αH(r)
1103 1103 1112 1125 1100 ω -NH3 +, β -H(C)
1124 1109 1137 1132 ω NH3 +, β H(C)
1154 1154 1143 1140 1148 1153 α -H(R), ω -NH3 +,
β -CH
1174 1174 1167 1170 1169 1174 1170 1168 γ -CH2, α -H(R);
1204 1213 1206 υ -(r), υ -C-COO -
1236 1236 1235 1243 1237 1241 1242 1243 α-H(R), γ-H(r)
1259 1264 1264 1267 1250 1251 γ -H(R), γ -H(r),
β -CH
1296 1296 1300 1276 1277 1284 1289 β -H(-CH2)
1318 1318 1318 1319 1291 1296 υ (R), υ (r)
1326 1326 1337 1324 1316 1331 1334 ν -CN, β -CH; ω -CH2
1342 1345 1343 β -CH, β -H (-CH2)
1360 1360 1361 1361 1365 ω -CH2, β -CH
1376 1376 1374 1375 1374 υ (r), υ (R)
1380 1380 1391 1398 γ -CH(R); ν (r);
β -CH (-NH); δ -CH2
1398 1398 1427 1399 1404 1405 1396 1387 υs -COO1-
1450 1450 1457 1416 1416 1463 1457 α -CH2, δ -NH2
1459 1459 1461 1461 1453 1441 1464 υ (r), υ (R),νs -NH3 +
1492 1492 1490 1489 1479 β -CH(R)
1517 1517 1504 1513 1506 δ -CH2; SERS:
ν(R) -CC-, β -CH,
β -CH (r) (-NH)
1560 1557 1541 1560 1541 ν(r),ν(R)
1587 1587 1581 1603 1598 1595 1578 α -NH3+
1616 1616 1628 1638 1618 1618 1594 Φ (ringst) -CC-st, β -CC-bend, β -CHalk; β -CH (r) (-NH), δ -CH2
1653 νas -COO -, α -CCO
1659 1659 1666 1661 1667 ν(R)-CC-, β-CC-, βCHalk; β-CH (r) (-NH), α-NH3+
2136 νas -CN
2254 νs -CN
2952 2950 2942 νas -H(R)
3065 3059 3083 νs -NH3+
Disclaimer/Publisher’s Note: The statements, opinions and data contained in all publications are solely those of the individual author(s) and contributor(s) and not of MDPI and/or the editor(s). MDPI and/or the editor(s) disclaim responsibility for any injury to people or property resulting from any ideas, methods, instructions or products referred to in the content.
Copyright: This open access article is published under a Creative Commons CC BY 4.0 license, which permit the free download, distribution, and reuse, provided that the author and preprint are cited in any reuse.
Prerpints.org logo

Preprints.org is a free preprint server supported by MDPI in Basel, Switzerland.

Subscribe

Disclaimer

Terms of Use

Privacy Policy

Privacy Settings

© 2025 MDPI (Basel, Switzerland) unless otherwise stated