
Submitted:
14 August 2025
Posted:
17 August 2025
You are already at the latest version
Abstract
The use of intelligent clinical decision support systems (CDSS) has the potential to improve the accuracy and speed of diagnoses significantly. These systems can analyze a patient's medical data and generate comprehensive reports that enable specialists to better understand and evaluate the current clinical scenario. It is essential when dealing with medical images, as the high workload on healthcare professionals can hinder their ability to notice critical biomarkers, which may be difficult to detect with the naked eye due to stress and fatigue. Implementing a CDSS that uses computer vision (CV) techniques can alleviate this challenge. However, one of the main obstacles to the widespread use of CV and intelligent analysis methods in medical diagnostics is the lack of a clear understanding of how these systems operate among diagnosticians. A better understanding of how these systems work and the reliability of the identified biomarkers will enable medical professionals to more effectively grasp clinical problems. Additionally, it is essential to tailor the training process of machine learning models to fit medical data, which is often imbalanced due to varying probabilities of disease detection. If this factor is neglected, the quality of the developed CDSS may suffer. This article discusses the development of the CDSS module, which focuses on diagnosing age-related macular degeneration. Unlike traditional methods that classify diseases or their stages based on optical coherence tomography (OCT) images, the CDSS provides a more sophisticated and accurate analysis of biomarkers detected through a deep neural network. This approach combines an interpretative reasoning process with highly accurate models, although these models can be complex to describe. To address the issue of class imbalance, an algorithm has been developed to optimally select biomarkers, taking into account both their statistical and clinical significance. As a result, the algorithm prioritizes selecting classes that ensure high model accuracy while maintaining a sufficient level of clinical relevance in the responses generated by the CDSS module. The results obtained from this algorithm indicate that the overall accuracy of staging age-related macular degeneration increased by 63.3\% compared to traditional methods of direct stage classification using a similar machine learning model. This improvement suggests that the CDSS module can significantly enhance the diagnosis of this disease, especially in situations where there is class imbalance in the original dataset. To improve interpretability, the process of determining the most likely stage of the disease was organized into two stages. At each stage, the diagnostician could visually access information that explained the reasoning behind the intelligent diagnosis, aiding the expert in understanding how to make clinical decisions.
Keywords:
decision support systems
; computer vision
; deep learning
; age-related macular degeneration
; optical coherence tomography
; imaging biomarkers
; interpretable AI
; fuzzy logic
; biomarkeroptimization
; NSGA-II algorithm
1. Introduction
The advancement of modern medical services has led to improved professional assistance for the prevention and treatment of eye conditions, with the demand for ophthalmologic services increasing at a rate that exceeds population growth. This growth is primarily driven by an aging population and greater public awareness of the importance of monitoring eye health [1,2,3]. However, the significant rise in patients seeking ophthalmological care has created an increased workload for diagnosticians without a corresponding rapid growth in the number of available specialists. This imbalance between supply and demand can negatively affect diagnostic quality, as physicians processing medical data for increasing numbers of patients face higher risks of decreased productivity and medical errors due to fatigue, mental exhaustion, and heightened stress.
Medical imaging analysis represents a particularly complex area of diagnostic tasks requiring significant attention and expertise from specialists . In ophthalmology, optical coherence tomography (OCT) plays a crucial role as one of the most widely used imaging methods . This highly informative and contactless technique allows for real-time assessment of retinal structures [4,5,6,7], yet analyzing retinal images often leads to information overload for diagnosticians, negatively impacting treatment outcomes [8,9,10,11].
Research demonstrates that the speed at which diagnosticians make decisions is inversely related to accuracy. To address this challenge, Clinical Decision Support Systems (CDSS) have emerged as valuable tools for healthcare professionals, enabling efficient management of repetitive tasks and reducing routine workload [12,13,14]. Modern CDSS can incorporate both basic algorithms for organizing medical information and advanced automated cognitive processes, including computer vision (CV) methods for image analysis [15,16,17,18,19,20].
However, one of the main obstacles to integrating intelligent systems into medicine is the lack of clarity surrounding machine learning algorithms. The "black box" nature of these models, particularly in medical diagnosis, can lead to skepticism about their reliability and introduce bias among healthcare professionals, while making it challenging to verify the clinical relevance of software solutions.
To enhance transparency, various Explainable AI (XAI) methods are currently employed, categorized into post-hoc explanation methods and CV systems with built-in explanations [21]. Surrogate model techniques, such as Gradient-weighted Class Activation Mapping (Grad-CAM), highlight significant image regions for analysis [22]. While Grad-CAM has been successfully applied in medical imaging for pneumonia diagnosis in chest X-rays and tumor identification in MRI, the interpretation remains limited to visual demonstration of detected predictors without comprehensive analysis of underlying decision logic.
Feature importance methods, including SHapley Additive exPlanations (SHAP), provide insights into each input element’s contribution to model output [23,24,25]. However, these approaches often fail to account for spatial information related to patient condition predictors. Rule-based systems offer another approach, where intelligent algorithm outcomes are evaluated against predefined rules, yet increasing interpretability may negatively affect machine learning model performance, as simpler models may struggle to capture complex patterns effectively.
An effective approach for presenting medical images for precise analysis involves utilizing information on imaging biomarkers (IB), which indicate specific disease signs. These IBs can characterize diseases and their severity or stages, encompassing anatomical structures, functional parameters, and molecular signatures [26,27,28,29]. For CDSS, IB provides valuable insights for developing evidence-based patient care recommendations and treatment strategies [30,31,32,33,34,35,33,35].
Age-related macular degeneration (AMD) exemplifies the growing clinical challenge that accompanies population ageing and the associated surge in retinal imaging. Globally, AMD already affects roughly 196 million people and is projected to reach almost 290 million by 2040, making it the leading cause of irreversible central-vision loss in older adults [36]. Clinically, the disease progresses from early drusen formation to intermediate structural disruption and culminates in late-stage geographic atrophy or neovascularisation, each characterised by distinct OCT signatures [37]. Timely differentiation of these stages is critical because anti-vascular endothelial growth-factor therapy can stabilise or improve vision in up to 95% of patients with exudative AMD, whereas geographic atrophy still lacks an approved disease-modifying treatment [38].
From an informatics standpoint, AMD thus emerges as an ideal yet demanding use-case for developing CDSS that transform complex retinal imagery into clinically actionable stage assessments. Its multifactorial aetiology—over forty risk alleles interacting with lifestyle factors such as smoking, diet, and systemic metabolism—requires algorithms capable of fusing heterogeneous evidence sources [39]. Prognosis also hinges on recognising subtle OCT-based biomarkers—drusen morphology, pigment-epithelium alterations, and nascent neovascular complexes—that may elude human graders yet are amenable to machine detection. Compounding this challenge is severe class imbalance: the sight-threatening late stages most critical to patient outcomes remain under-represented in typical OCT datasets, demanding architectures that explicitly address skewed class distributions. Collectively, these constraints position AMD as both a proving ground and a catalyst for the interpretable, imbalance-aware CDSS advanced in the present study.
This study investigates the significant limitations found in previous research. Although the hybrid hierarchical approaches we presented in [40] showed high accuracy, they functioned as "black boxes," which could hinder their use in clinical practice. Our new approach includes the precise identification of IBs, enabling clinicians to follow the diagnostic process from image characteristics to disease classification.
This paper aims to develop an interpreted classification method that identifies patterns within each class using deep learning models, achieving high accuracy in pattern detection even with imbalanced target classes and desired patterns. The implemented approach addresses the challenge of imbalanced IBs using a multi-objective evolutionary optimization algorithm that selects the most relevant IBs considering both statistical and clinical significance.
The paper demonstrates a two-stage CDSS architecture that separates IB detection from diagnostic reasoning, enhancing both accuracy and interpretability while addressing the critical "black box" problem in medical AI systems. Through the systematic selection of IBs, this approach ensures transparent decision-making processes consistent with clinical thinking patterns, potentially contributing to the introduction of intelligent diagnostic systems into ophthalmic practice.
2. Modeling the Cognitive Processes of Experts in Staging Age-Related Macular Degeneration Based On Imaging Biomarkers
The development of an interpretable clinical decision support system for AMD staging requires a rigorous mathematical framework that explicitly separates IB detection from diagnostic reasoning. This separation addresses the fundamental challenge of maintaining both high accuracy and clinical interpretability in medical AI systems. The proposed methodology introduces a two-stage architecture where the first stage focuses on reliable IB identification using deep learning, while the second stage employs fuzzy logic to model expert diagnostic reasoning patterns.
2.1. Presentation of OCT Data as an Image and a Set of Imaging Biomarkers
Consider an OCT image dataset where each image represents a retinal scan that must be classified into one of n AMD stages . The classification process relies on the identification of m imaging IBs that serve as intermediate diagnostic indicators. The fundamental objective is to determine the conditional probability for each AMD stage given an input image .
Traditional direct classification approaches attempt to learn the mapping directly, which creates a "black box" system that lacks clinical interpretability. The proposed two-stage approach decomposes this problem into two sequential mappings: first, a IB detection function that maps images to IB confidence scores, and second, a diagnostic reasoning function that maps IB patterns to AMD stages.
The IB detection module implements a deep neural network encoder that transforms input OCT images into IB confidence vectors. For each image , the encoder produces a confidence vector with denoting the confidence that IB is present in .
To ensure an accurate search for IBs while maintaining the clarity and transparency of the AMD staging algorithm’s logic, a deep neural network (DNN) was used. The choice of this model, which operates in a way that may not be immediately understandable to users, is based on its potential for higher accuracy in image analysis compared to traditional machine learning methods. Our primary focus is on the expected accuracy level of the DNN in detecting IBs. It is important to note that relying solely on machine learning methods in medical diagnostic algorithms, without incorporating expert rules, can lead to misleading results. These models may identify false trends that stem from a limited data sample and do not accurately represent the entire dataset [41].
A potential compromise solution that offers both visual interpretability and the capability to accommodate diagnostic uncertainty, as reflected in vague definitions, is the use of a fuzzy inference algorithm. In this algorithm, for each , the IB membership function is determined based on the value . For each stage of S, the probability of the stage is calculated by summing the contributions from all the outputs of the membership functions:
where represents the conclusion of the membership functions. Consequently, this algorithm for staging AMD, which is based on the identified IBs, operates as a fuzzy solver. It effectively handles both the numerical values of the DNN confidence in detecting IBs and the fuzzy terms that indicate the probability of having IBs at each stage of AMD.
It is also worth considering that the IBs analysis component in the CDSS module can be more easily replaced, fixed, or retrained, as well as scaled by simplifying the task using encoded OCT data.
The objective of this project is to develop a CDSS module that synthesizes an IB set for identifying AMD using OCT image data. Additionally, the module will assist in staging AMD based on the identified IB set. The structure of this module is illustrated in Figure 1.
To determine the probability of accurately detecting a specific informational IB , we used the temperature scaling method [42,43]. This approach allowed us to assess the reliability of predictions more effectively, without necessitating additional modifications to the deep neural network architecture.
The output data of the encoder is represented as a vector of IBs , which contains the probability values for detecting each IB. This data is then used as input for the fuzzy solver, , which utilizes fuzzy terms to determine the probabilities of all stages of in the OCT image .
Next, we will examine the proposed structure of the CDSS module in detail. It includes a description of the input and transformed data, as well as the specifics of encoding and the IB set analysis model.
2.2. Analysis of the Primary OCT Data Set
The AMD staging method being developed requires a structured dataset including OCT images with appropriate IBs and a classification of AMD stages. The dataset should include diverse AMD stages with appropriate clinical annotations. Each IB’s presence or absence must be marked by qualified diagnosticians, and expert assessments of clinical significance for each biomarker-stage combination should be established using linguistic variables (e.g., "Absent," "Rare," "Present," "Common," "Defining Feature").
The structure of the dataset used in this study as an example of the implementation of the proposed staging method included a set of OCT images, each of which was accompanied by a list of detected IBS, marked by diagnosticians, as well as the corresponding stage of AMD. The dataset consisted of 2,624 images from OCT. Each OCT image was classified according to the Age-Related Eye Disease Study [44], which is used in both clinical trials and clinical practice.
The distinction between stages of AMD is crucial due to significant differences in treatment strategies for patients at these stages. The following cases with corresponding code designations were included in the list of classes under consideration:
- Examples of retinal OCT without AMD disease (N) (25% of the total data set),
- Early stage AMD (S) (8% of the total data set),
- Intermediate stage of AMD between dry and wet stage (P) (34% of the total data set).
- Late stage of dry (atrophic) AMD (SI) (7% of the total data set),
- Late stage of wet (neovascular) AMD (V) (17% of the total data set),
- Late stage of AMD is presence of subretinal fibrosis SF (VI) (9% of the total data set).
In medical practice, there are specific diagnostic patterns for each stage of AMD. However, it is important to note that statistical data drawn from a limited dataset do not always align with the expert opinions of specialists. These discrepancies must be taken into account when developing deterministic rules for interpreting various clinical manifestations. In this context, we primarily relied on the experience of diagnostic specialists to understand the general principles of diagnosis when selecting our IBs. Only after this foundational understanding did we begin to identify specific rules based on the limited data available. This approach was necessary to prevent our algorithm from overfitting to the existing dataset, as models can identify local trends that do not necessarily generalize to other data samples.
A common sign of early-stage AMD in fundus images is druses (td), which are less than 125 microns [45,46]. OCT scans show localized elevations of the pigmented epithelial layer with medium reflectivity.
The intermediate stage of AMD serves as a transitional phase between the more distinctly defined early and late stages of the disease. It makes diagnosing the intermediate stage more challenging and complicates the identification of clear IB of the disease. The presence of at least one large druse (md) (more than 125 microns) determines the transition of the disease to an intermediate stage [47]. The increase of druses can lead to drusenoid detachment of the pigment epithelium (sd) [45,46]. At this stage, a wide range of IB can be observed. This stage is also characterized by hyperreflective inclusions (gv), which are small bright spots in the retina that may indicate inflammatory or degenerative changes, and local atrophy (la), which are localized areas of thinning or loss of retinal layers, especially retinal pigment epithelium and photoreceptors [48].
Progressive loss of pigment epithelium in the central parts of the macula (ga) combined with degenerative changes in the choriocapillaries leads to degenerative changes in the neuroepithelium and the development of the late-stage dry (atrophic) AMD [49].
For the late stage of wet (neovascular) AMD, the most characteristic IB include the neovascular membrane (nvm), fibrovascular pigment epithelial detachment (fopes), subretinal and intraretinal fluid (srzh or irzh), and hyperreflective inclusions. Without treatment, this condition can lead to the development of subretinal fibrosis (sr) [50,51].
Although the above IB are the main indicators for each stage of AMD, other IB also contribute to a comprehensive diagnosis [51]:
- Migration of pigment epithelium (mpes) indicates changes in the retinal pigment epithelium and potential progression towards atrophy.
- External retinal tubulation formations (nrt) indicate reorganization of the outer layers of the retina, and progression develops in the late stages of AMD.
- Nonexudative fluid (nezh) occurs at an intermediate stage of AMD.
The statistical distribution of IBs across AMD stages and expert clinical significance assessments form the foundation for subsequent optimization processes. A comprehensive example of such dataset structure and biomarker-stage relationships is provided in Supplementary Materials (Table SI and Table SII). Obtaining data on the clinical significance of each IB was achieved thanks to the findings of diagnostic specialists and relevant scientific literature [45,46,50,52,53,54,55,56,57,58,59].
Given the pronounced imbalance of classes in the dataset, it becomes clear that certain IBs are less likely to be detected at different stages of AMD than others. This observation is confirmed not only by expert assessments, but also by the statistical data presented in the dataset. To test this assumption, we evaluated the results of implementing a direct classification of AMD stages, as well as a comprehensive search across the entire available set of IBs. The selected IBs, equipped with appropriate code designations, were designed as markers to train the encoder in solving the problem of multiclass classification.
2.3. Assessing the Efficiency of Direct Classification and Pattern Detection in OCT Images
To establish the need for the proposed two-stage approach, we evaluate the performance of direct AMD stage classification using a deep neural network without biomarker-based preprocessing. The core of this model is a modified ResNet-18 neural network. We have replaced the last fully connected layer with a configurable classifier that outputs a vector of probabilities, indicating the presence of all classes or IB under consideration. ResNet-18 is a relatively simple variant in the ResNet family, consisting of 18 levels, which provides a balance between presentation capabilities and computational efficiency. For tasks such as image analysis using OCT, where datasets are often limited in size, more complex models such as ResNet-50 or ResNet-101 may not be suitable due to their excessive capacity [60,61]. ResNet-18 mitigates this risk by maintaining sufficient depth to capture complex patterns while being less susceptible to overfitting. ResNet-18 has also demonstrated outstanding results in extracting highly discriminatory features from medical images, while maintaining reliability in conditions of limited data volume or the presence of noise in labels:
To carry out a direct classification of the stages of AMD, the target labels included markers for six stages, while information about IB lesions was excluded. The training and testing samples were divided in a ratio of 80% for training and 20% for testing, consistent with all subsequent DNN training procedures. This baseline assessment demonstrates the challenges associated with class imbalance in medical imaging datasets.
The evaluation process utilized the following metrics:
- Accuracy: Reflects the DNN’s overall correctness in identifying IBs across all AMD stages.
- Precision: Indicates the reliability of the DNN’s positive IB detections.
- F1-score: Balances precision and recall, which is crucial for handling rare or imbalanced IBs.
- Specificity: Measures the correct identification of an IB’s absence, reducing false positives.
- Sensitivity (Recall): Ensures that critical IBs are not overlooked, which is vital for detecting early signs of AMD progression
The evaluation employs standard performance metrics including accuracy, precision, recall, F1-score, and specificity. The baseline results reveal significant performance variations across different AMD stages, with particular difficulties in detecting early-stage manifestations due to subtle visual differences and class imbalance issues.
The detailed baseline performance analysis, including confusion matrices, is presented in Supplementary Materials (Figure S1). These results motivate the development of the proposed biomarker-based approach for improved classification accuracy and interpretability.
The results of the DNN tests demonstrate significant unevenness in the classification of AMD stages. The late (neovascular) AMD and late (fibrosis) AMD are perfectly recognized with F1-scores exceeding 90% (91.5% and 91.%, respectively). AMD’s average score is 67.6% on the F1-score. However, the model has significant difficulties with the early detection of AMD, achieving only 8.9% accuracy on the F1-score. The late (atrophic) AMD stage falls within the intermediate range, with a score of 42.6% on the F1-score.
The classification of early AMD reveals a significant flaw in the performance of the DNN. The model correctly identifies only 7 out of 99 early cases of early AMD (7.1% of cases), demonstrating extremely low accuracy (12.1%). Most cases of early-stage AMD are mistakenly classified either as an intermediate stage (37 cases) or as late stage (atrophic) (34 cases). This pattern indicates fundamental difficulties in identifying the distinctive features of the early manifestations of the disease. Identifying cases without AMD disease also presents significant difficulties in classification, as only 48% of cases have been identified correctly (49 out of 102 cases). The model often mistakenly classifies cases of AMD absence as early stage AMD (27 cases) or late stage (atrophic) (15 cases). This tendency to yield false positive results leads to overdiagnosis and may result in unnecessary treatment recommendations in a clinical setting.
Geographical atrophy presents a complex misclassification issue, particularly characterized by significant bidirectional confusion with the intermediate stage of AMD. Specifically, 31 cases of true intermediate AMD have been incorrectly classified as late (atrophic) AMD, while 3 cases of true late stage (atrophic) have been misidentified as intermediate AMD. Additionally, there are classification errors in the late (atrophic) AMD stage: 23 cases were mistakenly attributed to the early stage of AMD, and 11 cases were without AMD. Despite its distinct clinical features, late (atrophic) AMD is only detected in 53% of cases, highlighting the challenges in accurately recognizing this condition. The uneven performance of DNN across different stages of AMD can be attributed to an imbalance in the dataset’s class distribution. As a result, directly classifying the stages of AMD without first adjusting the input and/or output data for DNN operation may not yield satisfactory results.
Next, we implemented a direct IBs search, which acts as a conversion of the output data for DNN. The target labels were the vectors . Once the encoder training was completed, we conducted stratified K-fold cross-validation on the entire dataset to evaluate its effectiveness. The results compared the vectors of the target values of IBs and the predicted values with a 95% confidence interval. The analysis included calculating the error matrix for each IB and the DNN output vector. The results of the metric calculations were then averaged across all IBs. These findings are presented in Figure 2.
The model’s sensitivity is 55.25%, but it comes with a broad confidence interval of 20.71% to 89.79%. It raises two important concerns. First, the model struggles to accurately identify positive cases, missing nearly half of them. Second, the wide confidence interval indicates significant variation in sensitivity estimates, which may result from either a limited number of positive samples in the dataset or inconsistencies in the model’s performance across different positive categories or validation folds. In contrast, the model demonstrates a specificity of 91.22%, with a narrower confidence interval ranging from 83.77% to 98.67%. It indicates that it is effective at correctly identifying negative cases. The substantial difference between sensitivity and specificity suggests a strong class imbalance in the training data, likely with negative instances significantly outnumbering positive examples. As a result, the model seems to have developed a bias towards predicting the majority class (negative cases) while underperforming for the minority class (positive cases). The overall accuracy of the model is 47.60%, which means that it can correctly predict a positive outcome less than half the time. It, combined with moderate sensitivity, leads to a relatively low F1-score of 43.87%, indicating suboptimal performance in accurately identifying positive cases. Additionally, the wide confidence interval for the F1-score, ranging from 17.17% to 70.58%, further highlights the model’s instability in correctly identifying positive instances.
All these indicators combined indicate that an unbalanced set of IBs hinders successful DNN training. The model adapted to the imbalance of the original dataset, becoming conservative in assigning positive ratings, which resulted in high specificity but low sensitivity and accuracy.
Selecting IBs for the encoder’s training set requires a careful approach to enhance prediction accuracy, denoted as . This involves classifying IBs based on their clinical and statistical significance, leading to four possible scenarios:
- High Clinical + High Statistical Significance: The IB is highly relevant for diagnosing AMD stages and is supported by sufficient data to train an effective classifier. These are ideal candidates for inclusion.
- Low Clinical + High Statistical Significance: The IB is statistically sound but has low clinical relevance for AMD staging, making its inclusion potentially redundant.
- High Clinical + Low Statistical Significance: The IB is clinically critical but rare in the dataset. This low statistical representation hinders the development of an effective classifier without techniques like data augmentation.
- Low Clinical + Low Statistical Significance: The IB lacks both clinical and statistical relevance, suggesting it should be excluded from the dataset.
In this regard, before finalizing the data set for encoder training, it is essential to identify a group of IBs that are both statistically and clinically significant for the subsequent staging of AMD. Further studies should also be conducted to assess the redundancy of IBs that hold lesser clinical significance.
3. Creation of a Dataset and a Classification Algorithm Based On the Patterns of the Target Class
Creating an effective dataset for training an encoder to identify IBs for AMD requires addressing the challenges associated with the uneven distribution of IB occurrences across different stages of the disease. Research in machine learning has introduced several specialized methods to tackle class imbalance in medical imaging. These methods include few-shot learning, one-shot learning, and zero-shot learning techniques [64,65,66,67]. Typically, these approaches utilize advanced methodologies such as meta-learning frameworks, synthetic data generation, metric learning systems, and semantic attribute modeling applied to the target variables.
However, these advanced learning approaches encounter significant challenges when explicitly applied to OCT-based IB detection for AMD. A primary limitation is the high variability of disease IBs in retinal imaging [68,69,70]. This variability hampers the ability to generate reliable patterns from a limited number of examples, ultimately leading to reduced classification accuracy for the rarer IB classes [71,72].
A more effective approach involves the strategic selection of IBs, particularly by systematically excluding categories of IBs that show poor detection efficacy. However, this selection process should not rely solely on statistical performance metrics. It must also incorporate expert clinical knowledge to avoid inadvertently removing IBs that, while statistically difficult to detect, hold significant diagnostic value for specific stages or subtypes of AMD.This perspective highlights the critical need for a dual-criteria optimization strategy in IB selection. The IB selection process must explicitly evaluate both statistical reliability and clinical significance, ensuring comprehensive diagnostic coverage across all stages of AMD under consideration.
3.1. Calculating the Statistical and Clinical Significance of IBs
The optimal selection of IBs requires a dual evaluation framework that considers both statistical performance and clinical relevance. Statistical significance is assessed through One-vs-Rest (OvR) decomposition, where each IB is evaluated using binary classification performance metrics [73,74,75].
For each IB bi ∈ B, a binary classifier is trained to distinguish between the presence and absence of that specific IB across all OCT images. The statistical significance is quantified using the Youden J-index [76], which combines sensitivity (SN) and specificity (SP) [77]:
Clinical significance is determined by expert assessments of each IB’s diagnostic value for different AMD stages, converted to numerical scales for computational processing.
The comprehensive performance metrics for all IBs, including accuracy, sensitivity, specificity, and area under the ROC curve (AUC) [78], are presented in Supplementary Materials (Table SIII).
Essentially, this method transforms a general multiclass (and multidimensional) problem into separate binary tasks, allowing each IB to be evaluated independently using the performance indicators of the corresponding binary classifiers. By training a separate classifier to detect the presence or absence of a specific IB, OvR yields results that are easy to interpret and understand. It enables us to establish a direct correlation between the IBs and the most significant parameters of the DNN model.These metrics form the foundation for the multi-objective optimization process.
In this study, the encoder structure serves as the primary architecture for the binary classifiers. The encoder is designed to classify a complete set of relevant IBs, with the final layer modified to perform binary classification for each IB.
Binary classifier testing revealed distinct performance patterns among imaging IBs, with six markers demonstrating strong clinical potential: td showed exceptional sensitivity (0.96) and high AUC (0.97) with substantial dataset representation (0.46), positioning it as a primary candidate for clinical application; md exhibited well-balanced metrics across all parameters (AUC 0.98, accuracy 0.93) with significant share (0.36); ga achieved the highest AUC (0.99) and near-perfect specificity (0.99) despite lower prevalence (0.07), making it valuable for confirmatory testing; sr, gv, and fopes also demonstrated strong overall performance with AUCs ranging from 0.93-0.97 and varying clinical applicability based on their dataset shares. In contrast, eight IBs (sd, la, nvm, irzh, srzh, nrt, mpes, nezh) exhibited a problematic pattern of high specificity but significantly compromised sensitivity (0.08-0.42), limiting their effectiveness as primary discriminators and suggesting their optimal use in confirmatory roles or as components of multi-biomarker diagnostic panels rather than standalone indicators.
3.2. Optimal Selection of IBs Based On Their Statistical and Clinical Significance
The IB selection process employs the Non-dominated Sorting Genetic Algorithm II (NSGA-II) to optimize two competing objectives: statistical performance and clinical significance [79]. This approach ensures that the selected IBs provide both reliable classification performance and meaningful clinical interpretation.
To implement the NSGA-II algorithm, we needed to establish optimizable competing goal functions and constraints for the optimization process. The objectives of implementing an optimal selection algorithm are articulated as follows:
- Ensuring maximum classifier performance: High performance characteristics of binary classifiers are preferred.
- Ensuring maximum clinical value: Preference should be given to IBs that are assessed as "Present," "Common," or "Defining features" for at least one stage of AMD.
The optimization problem is formulated with two objective functions:
-
Statistical Performance:where is a transformation function that enhances the impact of high-performing IBs:where refers to the steepness parameter and threshold , and M is the maximum penalty parameter. To assess the statistical significance of IB, , we use the Juden J-index.In the context of diagnostics, a minimum acceptable level of sensitivity and specificity is considered to be 80% [80,81]. The threshold value for statistical performance was determined to be . The steepness parameter is defined as because a steeper sigmoid results in a larger derivative near the threshold. It ensures that slight deviations in performance are represented as significant changes in the transformed output. Such an approach provides meaningful gradients for optimization, which is essential for robust parameter estimation and model convergence [82]. From the equation , it follows that in order to penalize a low value of the Judens index, it is required that . Since statistical efficiency is a more critical factor for enabling the training of the Information Bottleneck search classifier on OCT images, the penalty value was chosen to be greater than the corresponding element of the equation used for calculating clinical significance: .
- Clinical Significance:where is the average clinical significance of IB across all stages, is the clinical significance of IB for disease stage j, n is the number of disease stages, is a bonus factor for balanced coverage, and is a transformation function for clinical significance:where M is the maximum boost parameter and is the mid-point parameter. The parameter M is determined according to the same principle as when evaluating Statistical Performance, but with a lower value: . This is due to the fact that Clinical Significance has a slightly lower priority. If the Statistical Performance value is low, the classifier’s performance may be insufficient, and the IBs allocation algorithm will not be able to perform its functions effectively. The midpoint parameter was set to "Present" to encourage those who determine the stage of IBs. The coefficient 5 in a transformation function for clinical significance 5 controls the steepness of the arctangent function around . The 0.5 addition serves to normalize the arctangent output.
The optimization is subject to the following constraints:
- Performance Threshold. Ensures the cumulative statistical performance exceeds a minimum threshold:
- Stage Coverage. Ensures adequate clinical coverage across all disease stages:
The complete mathematical formulation of the IB selection problem is:
The optimization process yields a Pareto front of solutions representing different trade-offs between statistical performance and clinical relevance. The final IB selection represents the most balanced solution on this Pareto front.
Thus, after DNN training on a limited set of the most statistically and clinically significant IBS and refining the algorithm for analyzing DNN results using a fuzzy logic approach, AMD’s staging algorithm was retested.
The detailed optimization results, including the Pareto front visualization, IB selection patterns, and hypervolume analysis, are presented in Supplementary Materials (Figures S2, S3, S4, and S5).
The optimization results reveal a clear hierarchical structure in IB selection for AMD staging, where core IBs (td, md, gv, ga, fopes, sr) consistently demonstrate essential diagnostic value across all solutions regardless of optimization focus, while conditional IBs (sd, la, srzh) show variable selection patterns, with irzh preferred over srzh due to superior classification accuracy (0.901 vs 0.885) and model stability. Excluded IBs (nvm, nrt, mpes, nezh) are systematically avoided due to insufficient representation in the dataset, leading to poor classifier specificity and high false-negative rates that compromise clinical utility. The exclusion of clinically significant IBs such as srzh and nvm, despite their importance as indicators of neovascular activity and exudative AMD stages respectively, represents a necessary compromise between clinical relevance and statistical reliability given their limited dataset representation (9% and 5% respectively), though future work with balanced datasets or data augmentation techniques could potentially enable their inclusion to enhance diagnostic accuracy, particularly for distinguishing late-stage AMD subtypes. The following solution was chosen based on the analysis of the Pareto front:
Best Clinical Significance (Solution 3):
- Selection: [td, md, gv, ga, fopes, irzh, srzh, sr];
- Aggregated Transformed Performance: 0.0000;
- Aggregated Clinical Significance: 1.0000.
This solution highlights IBs that hold significant clinical importance at various stages of disease. By incorporating both irzh and srzh, it enhances clinical relevance, although this might come at the cost of statistical performance. This approach is most suitable when prioritizing clinical interpretability and its relevance to disease mechanisms over purely focusing on classification accuracy.
The Pareto front visualization indicates a relatively uniform distribution of solutions, though there is some clustering at the extremes. Solutions 1, 2, and 4 emphasize statistical performance, while Solutions 3, 6, and 7 focus on clinical significance. Ultimately, the final set of IBs was derived from Solution 5, as it represents the best balance between statistical and clinical significance.
3.3. Fuzzy Logic-Based Interpretable AMD Stage Classification
Having established the optimal IB selection through multi-objective optimization, the final component of our two-stage CDSS architecture implements an interpretable classification system that transforms IB detection outputs into probabilistic AMD stage assessments. This stage addresses the critical interpretability requirement by modeling expert diagnostic reasoning through fuzzy logic, enabling clinicians to understand and validate the system’s decision-making process.
3.3.1. Architecture Integration and Confidence Calibration
The interpreted classification module operates based on the output of a IB detection network trained using an optimally selected subset of IBs, in this case, = td, md, gv, ga, fopes, irzh, sr, determined using NSGA-II optimization. This integration ensures that the logical component processes only the most statistically reliable and clinically relevant IBs, thereby maintaining accuracy and interpretability.
The DNN IB detection module generates logits for each of the seven selected IBs. However, deep neural networks often produce miscalibrated confidence scores when using standard softmax activation, leading to overconfident predictions that do not accurately reflect true classification uncertainty. To address this limitation, we implement temperature scaling calibration to improve prediction reliability without compromising classification accuracy[83,84].
The calibration process introduces a temperature parameter T > 0 that modifies the softmax function:
The optimal temperature T* is determined by minimizing negative log-likelihood on a validation set:
where is the true class label for the i-th sample in the validation set [85]. Through empirical validation, we established as the optimal temperature parameter, which effectively softens the prediction distribution while preserving the relative ordering of IB confidences.
3.3.2. Fuzzy Logic Implementation for Expert Rule Modeling
An important innovation of our approach to interpreted classification is the explicit modeling of expert diagnostic conclusions using fuzzy logic. This component converts calibrated IB confidence scores into AMD stage probabilities using expert-defined relationships encoded as fuzzy rules.
The fuzzy classification system uses five linguistic variables corresponding to the levels of clinical significance: "Absent" (0), "Rare" (0.25), "Present" (0.5), "Common" (0.75) and "Defining feature" (1.0). These encodings reflect expert assessments, and reflect the subtle relationships between the presence of IBs and the stages of the disease.
To accommodate the complexity of medical diagnostic reasoning, we implement a hyperbolic tangent-based membership function that provides superior flexibility compared to traditional linear fuzzy systems:
where x represents the calibrated confidence score, controls the steepness of the sigmoidal response, and denotes the fuzzy center value for the specific linguistic category. The multiplication factor of 3 for "Defining Features" emphasizes the diagnostic importance of high-confidence IB detections.
The fuzzy classification algorithm computes the probability of each AMD stage by aggregating the contributions from all IBs according to their clinical significance patterns:
where represents the probability of AMD stage j, is the calibrated confidence score for IB i, and is the membership function value for IB i in the context of stage j.
This formulation enables the system to handle the inherent uncertainty in medical diagnosis while maintaining traceability of the decision-making process. Each IB’s contribution to the final stage probability is explicitly quantified, allowing clinicians to understand which image features drive specific diagnostic conclusions.
To evaluate the statistical reliability of the AMD stage prediction algorithm, we constructed a heat map as shown in Supplementary Materials (Figure S4). It reflects the relationship between the probability levels for each stage of AMD and the probability of detecting IBs (disease indicators). We also conducted a sensitivity analysis, the results of which are shown in Supplementary Materials (Figure S5). During this analysis, we adjusted the confidence level of one IB while maintaining the other indicators at a baseline of 0.5.
Correlation analysis confirms that each IB aligns with specific AMD stages: td is highly indicative of early AMD (r = 0.79) and becomes negatively associated with late fibrosis, ga is the strongest marker for late atrophic AMD (r = 0.83) while inversely related to earlier stages, sr almost exclusively signals late fibrosis AMD (r = 0.90) and is strongly negative for early and intermediate disease, and fopes best characterizes late neovascular AMD (r = 0.54) with diminishing relevance in earlier stages; collectively, these gradients, alongside moderate links such as md and irzh, depict a coherent progression from early to advanced pathology and allow clear differentiation between healthy retina, transitional intermediate AMD, and the distinct late subtypes.
Sensitivity analysis shows a universal 0.5-confidence threshold at which IB influence on AMD staging becomes pronounced: ga triggers a sharp rise in late (atrophic) AMD likelihood, sr follows a sigmoid increase for late (fibrosis) AMD, and td causes an abrupt jump in early AMD probability. These patterns, captured by the hyperbolic-tangent membership functions in the fuzzy classifier, confirm the model’s ability to separate stages: td is highly discriminative for early disease but offers little diagnostic value in advanced stages, whereas ga and sr become decisive indicators for late atrophic and fibrotic forms, respectively, while having minimal impact below the threshold.
The analysis shows that td, ga, and sr act as stage-defining biomarkers—td reliably marks early AMD, ga distinguishes late atrophic AMD, and sr pinpoints late fibrotic AMD—each displaying a clear probability surge once confidence exceeds 0.5, whereas md, gv, fopes, and irzh have milder, supplementary effects on stage prediction. In particular, sr follows a textbook sigmoid curve, steadily elevating late-fibrosis probability while leaving other stages flat, underscoring its diagnostic precision. A combined bar-and-radar visualization links IB confidence scores to stage probabilities, enabling clinicians to trace how input features translate into diagnostic output and thereby illuminating the system’s previously opaque reasoning process.
4. Results
To facilitate clinical adoption and enable expert validation of algorithmic decisions, we implement a dual visualization strategy that presents both input IB confidences and output stage probabilities in an intuitive format.
The visualization interface combines:
- Bar chart representation of IB confidence scores, enabling clinicians to quickly assess which image features were detected with high reliability
- Radar chart visualization of AMD stage probabilities, providing a unique "diagnostic fingerprint" for each case that facilitates comparison across different stages
This dual representation addresses the interpretability challenge by creating a transparent pathway from image analysis to diagnostic conclusion. Clinicians can trace the reasoning process from detected IBs to stage probabilities, enabling critical evaluation of the system’s recommendations within established clinical frameworks. A visualization of the IBs analysis algorithm is shown in Figure 3.
To evaluate the effectiveness of our approach, we conducted additional testing. It involved assessing how well the IBs’ search process performed and measuring the accuracy of predicting the likelihood of various stages of AMD. We evaluated the performance of the DNN model as a multiclass classifier for identifying IBs, following the method outlined in Section 2.3. The results of this evaluation are presented in Figure 4.
The performance improvements are important, but an even more significant factor is the substantial reduction in the width of confidence intervals. The previous model displayed vast confidence intervals, particularly for sensitivity (0.6908) and F1 score (0.5341), indicating highly inconsistent performance across different IBs. In contrast, the improved model exhibits much tighter confidence intervals, with the width of the sensitivity CI reduced to 0.1390 and the F1 score CI reduced to 0.0696. This dramatic decrease in confidence interval width signifies that the improved model provides much more consistent performance across all IBs, which is essential for clinical reliability.
The sensitivity increased from 0.5525 to 0.8258, representing a substantial reduction in false negatives, indicating that the improved model is significantly less likely to miss IBs present in OCT images. The improvement in precision, from 0.4760 to 0.8380, signifies that when the model identifies a IB, there is a significantly higher likelihood that the IB is indeed present. The previous model’s precision of 47.6% may have resulted in numerous false alarms, potentially leading to unnecessary follow-up examinations or treatments. Additionally, the increase in the F1 score from 0.4387 to 0.8296 indicates that the enhanced model achieves a much better balance between recall and precision. This balance is crucial for clinical applications, where both failing to identify IBs and making false identifications can result in suboptimal patient outcomes.
Thus, reducing the number of IBs allowed us to achieve a more accurate and stable DNN classification. It, in turn, made it possible to conduct a statistically and clinically sound analysis of the probabilities of AMD stages based on the detected IBs.
To analyze the effectiveness of the procedure for determining the probabilities of the stages of AMD, the output vectors DNN were fed into the input of the expert system , which operates based on fuzzy rules. As a result, the most probable stage was selected from the entire spectrum of stages S: . The comprehensive test results, including the detailed error matrix for classifying stages of AMD using the DNN + expert system based on fuzzy rules, are presented in Supplementary Materials (Figure S6).
A comparative analysis of the confusion matrix with the direct classification of AMD stages, as described in Section 2.3, showed a significant improvement in the results of direct classification using the improved DNN model. Overall accuracy increased from 55.1% to 90.0%, representing a relative improvement of 63.3%. The detailed performance metrics and confusion matrix analysis demonstrating these improvements are available in the Supplementary Materials for comprehensive evaluation.
Particularly notable progress has been made in AMD’s early stage classification, where accuracy has increased from a critically low 7.1% to 84.8%. This significantly enhances the model’s ability to detect this clinically important early stage of the disease, representing a significant step forward in the field of diagnosis.
In the previous model, early AMD was severely misclassified, with only 7 out of 99 cases correctly identified. Most cases were erroneously classified as intermediate AMD (37 cases) or late (atrophic) AMD (34 cases). The improved model now correctly identifies 84 out of 99 early AMD cases, with minimal misclassification to other categories. This enhancement is particularly significant as early detection influences treatment decisions and patient outcomes.
The previous model demonstrated poor performance in identifying normal cases (48% accuracy), frequently misclassifying them as early AMD (27 cases) or late (atrophic) AMD (15 cases). The enhanced model achieves 95.1% accuracy for normal cases, virtually eliminating the risk of false positives that could lead to unnecessary interventions. The classification of late (atrophic) AMD improved from 53.0% to 86.7% accuracy. Previously, this condition was frequently misclassified as early AMD (23 cases). The current model has effectively resolved this confusion, with only minor misclassifications across other categories.
The accuracy for intermediate AMD increased from 70.1% to 92.7%. The previous model frequently misclassified intermediate AMD as late (atrophic) AMD (31 cases), a problem that has been largely resolved in the improved model, which now shows only 4 such misclassifications.
Despite the overall improvements, two categories showed slight decreases in performance. Accuracy decreased from 96.7% to 88.3%. The current model occasionally misclassifies this condition as early AMD (3 cases) or late (neovascular) AMD (2 cases), suggesting that some discriminative features between these stages may require further refinement. A minor decrease in accuracy from 93.1% to 89.7% was observed. The current model sometimes confuses late (neovascular) AMD with late (fibrosis) AMD (2 cases), indicating potential overlapping features between these advanced disease stages.
Thus, the proposed two-step approach, which separates the identification of IBs from the diagnostic justification, has demonstrated a significant increase in classification accuracy while ensuring interpretability necessary for clinical use.
5. Discussion
The development and evaluation of the CDSS module for AMD staging based on imaging IBs revealed significant improvements in diagnostic accuracy while maintaining interpretability. By implementing a two-stage approach that separates IB detection from diagnostic reasoning, we have successfully addressed both the technical challenge of imbalanced medical datasets and the practical challenge of creating transparent intelligent systems for clinical adoption. The study achieved a remarkable increase in overall AMD staging accuracy, with relative improvement compared to direct classification methods. This enhancement was particularly pronounced in the detection of early AMD. Research by [38] demonstrated that the transition between early and intermediate AMD represents a critical intervention window, yet this distinction has proven challenging for both human experts and automated systems. Our research suggests that utilizing IBs for diagnosis significantly enhances the ability to distinguish between these crucial early stages, potentially allowing for more timely therapeutic interventions.
The implementation of the NSGA-II algorithm for multi-objective optimization in IB selection offers a solution to the inherent imbalances found in medical imaging datasets. By optimizing for both statistical performance and clinical significance simultaneously, we have developed an approach that addresses the limitations of purely data-driven methods, which often struggle with rare but clinically important findings. This optimization strategy differs from previous methods that relied exclusively on statistical metrics or predetermined expert selections. For instance, [48] identified hyperreflective inclusions (gv) as significant IBs for AMD progression but lacked a systematic methodology for weighing their statistical versus clinical importance. Similarly, [51] emphasized the importance of subretinal fibrosis (sr) in the late (neovascular) stage of AMD but did not address the challenges of its reliable detection in imbalanced datasets. Our optimization framework provides a more robust foundation for IB selection. Moreover, it can be extended to other medical imaging applications that face comparable challenges, such as data imbalance and the need for clinical relevance.
The incorporation of fuzzy logic for IB analysis represents a significant advancement in addressing the "black box" problem that has hindered clinical adoption of intelligence systems. Recent work by [86] proposed categorizing explanations in healthcare AI based on model reliability, expert variability, and disease dimensionality. Our approach complements this framework by providing explicit visualization of both IB confidence and staging probabilities, allowing clinicians to trace diagnostic reasoning from image features to disease classification. The correlation analysis, which shows strong positive associations between specific IBs and their corresponding AMD stages, supports the clinical validity of our interpretability approach. However, the visualization strategy implemented in the module—combining bar charts for IB confidence with radar charts for staging probabilities—creates an intuitive interface that aligns with clinical reasoning patterns. This transparency may lower the barrier to adoption by ophthalmologists who remain skeptical of opaque intelligence systems. As noted by [87], transparent healthcare systems that illuminate decision processes are more likely to gain clinician trust and integration into clinical workflows.
Despite the promising results, several limitations need to be addressed. First, although our dataset of 2624 OCT images is substantial, the low prevalence of certain stages of AMD, particularly early AMD at just 8% of the dataset, presents a challenge. The effectiveness of our approach on even rarer cases or edge presentations requires further validation.
Second, the expert-defined fuzzy rules, although intended to mirror clinical reasoning, inherently contain some degree of subjectivity. The discrepancies between the statistical findings in our dataset and the expert clinical assessments underscore the ongoing challenge of integrating data-driven and expert-based knowledge within medical intelligence systems.
In addition, the temperature scaling method used to calibrate the DNN output (with T=1.3) was chosen based on empirical evidence rather than rigorous theoretical justification. Although effective in our implementation, the potential application of this calibration method in other datasets or clinical settings warrants further investigation.
In conclusion, while our system shows impressive effectiveness when working with retrospective data, a comprehensive evaluation of its practical significance and integration into the daily practice of ophthalmologists necessitates conducting a prospective study in real clinical settings. It will be the focus of our future research.
In addition to verifying the effectiveness of the developed CDSS model in clinical settings, this study aims to enhance the detection of IBs through quantitative measurements, such as druse volume and fluid size. This approach goes beyond merely determining the presence or absence of IBs and can significantly improve diagnostic accuracy and predictive capabilities. Additionally, we plan to enhance the two-stage architecture of the CDSS by integrating components related to treatment and monitoring recommendations. It will enable us to create a comprehensive system that addresses the entire treatment cycle and aligns with the latest research on personalized therapy for AMD based on specific IBs.
6. Conclusions
In this paper, we propose a novel approach for developing a CDSS module that models the cognitive processes of experts in staging AMD using OCT images. Our approach features a two-stage architecture that separates IB detection from diagnostic reasoning. First, we identify IBs using a DNN. Next, we analyze these IBs using fuzzy logic, which incorporates rules defined by experts. This separation of the diagnostic process enhances both accuracy and interpretability, effectively addressing the critical "black box" problem.
The results demonstrate substantial improvements in diagnostic accuracy across all AMD stages. Overall staging accuracy increased from 55.1% to 90.0%, representing a 63.3% relative improvement compared to direct classification methods. This enhancement was particularly pronounced in the detection of early AMD, where accuracy increased dramatically from a critically low 7.1% to 84.8%. Similarly, the identification of normal cases improved from 48% to 95.1%, effectively reducing the risk of false positive diagnoses that could lead to unnecessary interventions.
The visualization strategy implemented in the module—combining bar charts for IB confidence with radar charts for staging probabilities—created an intuitive interface that illuminates the decision-making process for clinicians. This transparency represents a significant advancement in addressing the interpretability challenge that has hindered clinical adoption of AI systems, allowing ophthalmologists to critically evaluate algorithmic recommendations within established diagnostic frameworks.
Despite these achievements, we observed minor decreases in performance for specific AMD stages, notably late (atrophic) AMD (from 96.7% to 88.3%) and late (fibrosis) AMD (from 93.1% to 89.7%). These slight regressions suggest areas for future refinement, particularly in fully capturing the discriminative features between certain advanced disease stages. Future work should focus on prospective validation in clinical settings, expansion to include quantitative IB measurements, and integration with other imaging modalities to provide a more comprehensive assessment of retinal pathology.
In conclusion, our CDSS module represents a significant advancement in both technical performance and clinical applicability. By integrating the pattern recognition capabilities of deep learning with the interpretability of fuzzy logic and expert rules, we have created a system that not only achieves high diagnostic accuracy but also offers transparent reasoning that aligns with clinical decision-making processes. This approach effectively addresses a key challenge in the clinical adoption of artificial intelligence in ophthalmology.
Supplementary Materials
The following supporting information can be downloaded at the website of this paper posted on Preprints.org.
Author Contributions
Conceptualization, E.A.L.; methodology, E.A.L. and E.S.Y.; software, E.A.L. and E.S.Y.; validation, R.R.I. and G.M.I.; formal analysis, G.M.I.; investigation, E.A.L., E.S.Y., R.R.I. and G.M.I.; resources, T.R.M., R.R.I. and G.M.I.; data curation, R.R.I. and G.M.I.; writing—original draft preparation, E.A.L.; writing—review and editing, E.A.L., E.P.G. and R.V.K.; visualization, E.A.L. and E.S.Y.; supervision, E.P.G. and G.M.I.; project administration, T.R.M. and R.V.K.; funding acquisition, E.P.G. and R.V.K. All authors have read and agreed to the published version of the manuscript.
Funding
This work was supported by the Ministry of Science and Higher Education of the Russian Federation within the state assignment for UUST (agreement № 075-03-2024-123/1 dated 15.02.2024) and conducted in the research laboratory "Sensor systems based on integrated photonics devices" of the Eurasian Scientific and Educational Center.
Institutional Review Board Statement
Not applicable.
Informed Consent Statement
Not applicable.
References
- Stalhammar, G.; Lardner, E.; Georgsson, M.; Seregard, S. Increasing demand for ophthalmic pathology: time trends in a laboratory with nationwide coverage. BMC Ophthalmol. 2023, 23, 88. [CrossRef]
- V, S. To Study the Morbidity Pattern of Patients Attending the Ophthalmology OPD of Tertiary Eye Care Centre with Reference to Age. Open Access Journal of Ophthalmology 2023, 8, 1–5. [CrossRef]
- Madi, H.A.; Keller, J. Increasing frequency of hospital admissions for retinal detachment and vitreo-retinal surgery in England 2000-2018 2020. [Online; accessed 2024-08-30], . [CrossRef]
- Victor, A.A. The Role of Imaging in Age-Related Macular Degeneration.
- Hu, Y.; Gao, Y.; Gao, W.; Luo, W.; Yang, Z.; Xiong, F.; Chen, Z.; Lin, Y.; Xia, X.; Yin, X.; et al. AMD-SD: An Optical Coherence Tomography Image Dataset for Wet AMD Lesions Segmentation. Sci. Data 2024, 11, 1014. [CrossRef]
- Lopukhova, E.A.; Ibragimova, R.R.; Idrisova, G.M.; Lakman, I.A.; Mukhamadeev, T.R.; Grakhova, E.P.; Bilyalov, A.R.; Kutluyarov, R.V. Machine Learning Algorithms for the Analysis of Age-Related Macular Degeneration Based on Optical Coherence Tomography: A Systematic Review. J. Biomed. Photonics Eng. 2023, 9, 020202.
- Aznabaev, B.M.; Mukhamadeev, T.R.; Dibaev, T.I. Optical coherence tomography+ angiography in the diagnosis, therapy and surgery of eye diseases; August, 2019.
- ErgünŞahin, B.; Güneş, E.D.; Kocabıyıkoğlu, A.; Keskin, A. How does workload affect test ordering behavior of physicians? An empirical investigation. Prod. Oper. Manag. 2022, 31, 2664–2680. [CrossRef]
- Winder, M.; Owczarek, A.J.; Chudek, J.; Pilch-Kowalczyk, J.; Baron, J. Are We Overdoing It? Changes in Diagnostic Imaging Workload during the Years 2010–2020 including the Impact of the SARS-CoV-2 Pandemic. Healthcare 2021, 9, 1557. [CrossRef]
- Duncan, J.R. Information overload: when less is more in medical imaging. Diagnosis 2017, 4, 179–183. [CrossRef]
- Chen, J.Y.; Vedantham, S.; Lexa, F.J. Burnout and work-work imbalance in radiology- wicked problems on a global scale. A baseline pre-COVID-19 survey of US neuroradiologists compared to international radiologists and adjacent staff. Eur. J. Radiol. 2022, 155, 110153. [CrossRef]
- Jain (Deemed-To-Be-University), Bangalore, India.; Choudhury, T.K. Enhancing Diagnostic: Machine Learning in Medical Image Analysis. Int. J. Sci. Res. Eng. Manag. 2024, 08, 1–5. [CrossRef]
- Lukmanov, A.; Agaev, V.; Tsypkin, D. Automation in Healthcare: Advantages, Prospects, Perceptual Barriers. City Healthc. 2024, 5, 181–188. [CrossRef]
- Li, J. Reliability and Efficiency of Human - Automation Interaction in Automated Decision Support Systems. Highlights Sci. Eng. Technol. 2024, 106, 431–435. [CrossRef]
- Sindhu, P.; Sivakumar, M., Healthcare Integrating Automation and Robotics-Based Industry 5.0 Advancement:. In Advances in Medical Technologies and Clinical Practice; Murugan, T.; W., J.; P., V., Eds.; IGI Global, 2024; pp. 254–264. [CrossRef]
- A, S.; Shanmugapriya, D.P.; J, S.; K, M., A Roadmap to Smart Healthcare Automation Sensors and Technologies. In Futuristic Trends in IOT Volume 2 Book 15; Godihal, D.J.H.; Sharma, D.S.K.; Mudgil, S.; J, S.; Allam, D.V.; Mishra, D.P.; Dhanalakshmi, D.; Srikanth, B.; Chaware, D.S.M.; Karthik, D.G.; et al., Eds.; Iterative International Publishers, Selfypage Developers Pvt Ltd, 2023; pp. 43–51. [CrossRef]
- At the crossroads of technology and medicine: prospects of automation in medical practice with the use of neural networks. Infokommunikacionnye Tehnol. 2024, pp. 89–93. [CrossRef]
- Amaral, A.C.K.B.; Cuthbertson, B.H. The efficiency of computerised clinical decision support systems. Lancet 2024, 403, 410–411. [CrossRef]
- Umare Thool, K.B.; Wankhede, P.A.; Yella, V.R.; Tamijeselvan, S.; Suganthi, D.; Rastogi, R. Artificial Intelligence in Medical Imaging Data Analytics using CT Images. In Proceedings of the 2023 4th International Conference on Electronics and Sustainable Communication Systems (ICESC), IEEE, Coimbatore, India, jul 6 2023; pp. 1619–1625. [Online; accessed 2024-09-02], . [CrossRef]
- Przystalski, K.; Thanki, R.M., Computer Vision for Medical Data Analysis. In Explainable Machine Learning in Medicine; Springer International Publishing: Cham, 2024; pp. 53–66. collection-title: Synthesis Lectures on Engineering, Science, and Technology. [CrossRef]
- Sarvakar, K.; Yadav, R.; Patel, A.; Patel, C.D.; Rana, K.; Borisagar, V., Advanced Analytics and Machine Learning Algorithms for Healthcare Decision Support Systems: A Study. In Advances in Healthcare Information Systems and Administration; Murugan, T.; W., J.; P., V., Eds.; IGI Global, 2024; pp. 16–50. [CrossRef]
- Chaddad, A.; Peng, J.; Xu, J.; Bouridane, A. Survey of Explainable AI Techniques in Healthcare. Sensors 2023, 23, 634. [CrossRef]
- Nazmul Alam, M.; Kabir, M.S. Explainable AI in Healthcare: Enhancing Transparency and Trust upon Legal and Ethical Consideration 2023.
- Badhoutiya, A.; Verma, R.P.; Shrivastava, A.; Laxminarayanamma, K.; Rao, A.L.N.; Khan, A.K. Random Forest Classification in Healthcare Decision Support for Disease Diagnosis. In Proceedings of the 2023 International Conference on Artificial Intelligence for Innovations in Healthcare Industries (ICAIIHI), IEEE, Raipur, India, dec 29 2023; pp. 1–7. [Online; accessed 2024-09-16], . [CrossRef]
- Choi, H.W.; Abdirayimov, S. Demonstrating the Power of SHAP Values in AI-Driven Classification of Marvel Characters. J. Multimed. Inf. Syst. 2024, 11, 167–172. [CrossRef]
- Chauvie, S.; Mazzoni, L.N.; O’Doherty, J. A Review on the Use of Imaging Biomarkers in Oncology Clinical Trials: Quality Assurance Strategies for Technical Validation. Tomography 2023, 9, 1876–1902. [CrossRef]
- Cho, W.C.; Zhou, F.; Li, J.; Hua, L.; Liu, F. Editorial: Biomarker Detection Algorithms and Tools for Medical Imaging or Omics Data. Front. Genet. 2022, 13. [CrossRef]
- Chiu, F.Y.; Yen, Y. Imaging Biomarkers for Clinical Applications in Neuro-Oncology: Current Status and Future Perspectives. Biomark. Res. 2023, 11, 35. [CrossRef]
- Pai, S.; Bontempi, D.; Hadzic, I.; Prudente, V.; Sokač, M.; Chaunzwa, T.L.; Bernatz, S.; Hosny, A.; Mak, R.H.; Birkbak, N.J.; et al. Foundation Model for Cancer Imaging Biomarkers. Nat. Mach. Intell. 2024, 6, 354–367. [CrossRef]
- Reeja, S.R.; Mounika, S.; Mohanty, S.N. Biomarkers Classification for Various Brain Disease using Artificial Intelligence Approach-A Study 2023. [Online; accessed 2024-08-30], . [CrossRef]
- Trueblood, J.S.; Holmes, W.R.; Seegmiller, A.C.; Douds, J.; Compton, M.; Szentirmai, E.; Woodruff, M.; Huang, W.; Stratton, C.; Eichbaum, Q. The impact of speed and bias on the cognitive processes of experts and novices in medical image decision-making. Cogn. Res. Princ. Implic. 2018, 3, 28. [CrossRef]
- Rasouli, S.; Alkurdi, D.; Jia, B. The Role of Artificial Intelligence in Modern Medical Education and Practice: A Systematic Literature Review 2024. [Online; accessed 2024-08-30], . [CrossRef]
- Deshmukh, A. Artificial Intelligence in Medical Imaging: Applications of Deep Learning for Disease Detection and Diagnosis. Univers. Res. Rep. 2024, 11, 31–36. [CrossRef]
- Zhou, X.; Zhang, J.; Deng, X.M.; Fu, F.M.; Wang, J.M.; Zhang, Z.Y.; Zhang, X.Q.; Luo, Y.X.; Zhang, S.Y. Precision diagnostics of COVID-19 and Mycoplasma pneumoniae through random forest and biomarkers integration 2024. [Online; accessed 2024-09-16], . [CrossRef]
- Ltifi, H.; Benmohamed, E.; Kolski, C.; Ben Ayed, M. Adapted Visual Analytics Process for Intelligent Decision-Making: Application in a Medical Context. Int. J. Inf. Technol. Decis. Mak. 2020, 19, 241–282. [CrossRef]
- Stahl, A. The Diagnosis and Treatment of Age-Related Macular Degeneration. Deutsches Ärzteblatt international 2020. [CrossRef]
- Wong, T.Y.; Lanzetta, P.; Bandello, F.; Eldem, B.; Navarro, R.; Lövestam-Adrian, M.; Loewenstein, A. Current Concepts and Modalities for Monitoring the Fellow Eye in Neovascular Age-Related Macular Degeneration: An Expert Panel Consensus. Retina 2020, 40, 599–611. [CrossRef]
- Ferris, F.L.; Wilkinson, C.; Bird, A.; Chakravarthy, U.; Chew, E.; Csaky, K.; Sadda, S.R. Clinical Classification of Age-related Macular Degeneration. Ophthalmology 2013, 120, 844–851. [CrossRef]
- Handa, J.T.; Bowes Rickman, C.; Dick, A.D.; Gorin, M.B.; Miller, J.W.; Toth, C.A.; Ueffing, M.; Zarbin, M.; Farrer, L.A. A Systems Biology Approach towards Understanding and Treating Non-Neovascular Age-Related Macular Degeneration. 10. [CrossRef]
- Lopukhova, E.A.; Yusupov, E.S.; Ibragimova, R.R.; Idrisova, G.M.; Mukhamadeev, T.R.; Grakhova, E.P.; Kutluyarov, R.V. Hybrid Integent Staging of Age-Related Macular Degeneration for Decision-Making on Patient Management Tactics. 15, 1945. [CrossRef]
- Sirocchi, C.; Bogliolo, A.; Montagna, S. Medical-Informed Machine Learning: Integrating Prior Knowledge into Medical Decision Systems. BMC Med. Inform. Decis. Mak. 2024, 24, 186. [CrossRef]
- Guo, C.; Pleiss, G.; Sun, Y.; Weinberger, K.Q. On Calibration of Modern Neural Networks. In Proceedings of the International Conference on Machine Learning. PMLR, pp. 1321–1330.
- Liang, S.; Li, Y.; Srikant, R. Enhancing The Reliability of Out-of-distribution Image Detection in Neural Networks.
- Age-Related Eye Disease Study Research Group. A Randomized, Placebo-Controlled, Clinical Trial of High-Dose Supplementation with Vitamins C and E, Beta Carotene, and Zinc for Age-Related Macular Degeneration and Vision Loss: AREDS Report No. 8. 119, 1417–1436. [CrossRef]
- Lad, E.M.; Finger, R.P.; Guymer, R. Biomarkers for the Progression of Intermediate Age-Related Macular Degeneration. Ophthalmol. Ther. 2023, 12, 2917–2941. [CrossRef]
- Vallino, V.; Berni, A.; Coletto, A.; Serafino, S.; Bandello, F.; Reibaldi, M.; Borrelli, E. Structural OCT and OCT Angiography Biomarkers Associated with the Development and Progression of Geographic Atrophy in AMD. 262, 3421–3436. [CrossRef]
- Garcia-Layana, A.; Cabrera-López, F.; García-Arumí, J.; Arias-Barquet, L.; Ruiz-Moreno, J.M. Early and Intermediate Age-Related Macular Degeneration: Update and Clinical Review. Clin. Interv. Aging 2017, Volume 12, 1579–1587. [CrossRef]
- Waldstein, S.M.; Vogl, W.D.; Bogunovic, H.; Sadeghipour, A.; Riedl, S.; Schmidt-Erfurth, U. Characterization of Drusen and Hyperreflective Foci as Biomarkers for Disease Progression in Age-Related Macular Degeneration Using Artificial Intelligence in Optical Coherence Tomography. JAMA Ophthalmol. 2020, 138, 740–747. [CrossRef]
- Romano, F.; Ding, X.; Yuan, M.; Vingopoulos, F.; Garg, I.; Choi, H.; Alvarez, R.; Tracy, J.H.; Finn, M.; Razavi, P.; et al. Progressive Choriocapillaris Changes on Optical Coherence Tomography Angiography Correlate With Stage Progression in AMD. 65, 21. [CrossRef]
- Asani, B.; Holmberg, O.; Schiefelbein, J.B.; Hafner, M.; Herold, T.; Spitzer, H.; Siedlecki, J.; Kern, C.; Kortuem, K.U.; Frishberg, A.; et al. Evaluation of OCT Biomarker Changes in Treatment-Naive Neovascular AMD Using a Deep Semantic Segmentation Algorithm. 38, 3180–3186. [CrossRef]
- Tenbrock, L.; Wolf, J.; Boneva, S.; Schlecht, A.; Agostini, H.; Wieghofer, P.; Schlunck, G.; Lange, C. Subretinal Fibrosis in Neovascular Age-Related Macular Degeneration: Current Concepts, Therapeutic Avenues, and Future Perspectives. Cell Tissue Res. 2022, 387, 361–375. [CrossRef]
- Bird, A.C.; Phillips, R.L.; Hageman, G.S. Geographic Atrophy: A Histopathological Assessment. JAMA Ophthalmol. 2014, 132, 338–345. [CrossRef]
- Fang, V.; Gomez-Caraballo, M.; Lad, E.M. Biomarkers for Nonexudative Age-Related Macular Degeneration and Relevance for Clinical Trials: A Systematic Review. Mol. Diagn. Ther. 2021, 25, 691–713. [CrossRef]
- Flores, R.; Carneiro, Â.; Tenreiro, S.; Seabra, M.C. Retinal Progression Biomarkers of Early and Intermediate Age-Related Macular Degeneration. Life 2021, 12, 36. [CrossRef]
- Saha, S.; Nassisi, M.; Wang, M.; Lindenberg, S.; Kanagasingam, Y.; Sadda, S.; Hu, Z.J. Automated Detection and Classification of Early AMD Biomarkers Using Deep Learning. 9, 10990. [CrossRef]
- Latifi-Navid, H.; Barzegar Behrooz, A.; Jamehdor, S.; Davari, M.; Latifinavid, M.; Zolfaghari, N.; Piroozmand, S.; Taghizadeh, S.; Bourbour, M.; Shemshaki, G.; et al. Construction of an Exudative Age-Related Macular Degeneration Diagnostic and Therapeutic Molecular Network Using Multi-Layer Network Analysis, a Fuzzy Logic Model, and Deep Learning Techniques: Are Retinal and Brain Neurodegenerative Disorders Related? 16, 1555. [CrossRef]
- Vinković, M.; Kopić, A.; Benašić, T. Anti-VEGF Treatment and Optical Coherence Tomography Biomarkers in Wet Age-Related Macular Degeneration. [CrossRef]
- Sharma, A.; Parachuri, N.; Kumar, N.; Bandello, F.; Kuppermann, B.D.; Loewenstein, A.; Regillo, C.; Chakravarthy, U. Fluid-Based Prognostication in n-AMD: Type 3 Macular Neovascularisation Needs an Analysis in Isolation. 105, 297–298. [CrossRef]
- Gill, K.; Yoo, H.S.; Chakravarthy, H.; Granville, D.J.; Matsubara, J.A. Exploring the Role of Granzyme B in Subretinal Fibrosis of Age-Related Macular Degeneration. 15. [CrossRef]
- Miladinović, A.; Biscontin, A.; Ajčević, M.; Kresevic, S.; Accardo, A.; Marangoni, D.; Tognetto, D.; Inferrera, L. Evaluating Deep Learning Models for Classifying OCT Images with Limited Data and Noisy Labels. Sci. Rep. 2024, 14, 30321. [CrossRef]
- Wu, Z.; Zhuo, R.; Liu, X.; Wu, B.; Wang, J. Enhancing Surgical Decision-Making in NEC with ResNet18: A Deep Learning Approach to Predict the Need for Surgery through x-Ray Image Analysis. Front. Pediatr. 2024, 12, 1405780. [CrossRef]
- Alex, V.; Khened, M.; Ayyachamy, S.; Krishnamurthi, G. Medical Image Retrieval Using Resnet-18 for Clinical Diagnosis. In Proceedings of the Medical Imaging 2019: Imaging Informatics for Healthcare, Research, and Applications; Bak, P.R.; Chen, P.H., Eds., San Diego, United States, 2019; p. 35. [CrossRef]
- Rahman Siddiquee, M.M.; Shah, J.; Chong, C.; Nikolova, S.; Dumkrieger, G.; Li, B.; Wu, T.; Schwedt, T.J. Headache Classification and Automatic Biomarker Extraction from Structural MRIs Using Deep Learning. Brain Commun. 2022, 5, fcac311. [CrossRef]
- Imran, H.M.; Asad, M.A.A.; Abdullah, T.A.; Chowdhury, S.I.; Alamin, M. Few Shot Learning for Medical Imaging: A Review of Categorized Images. pp. 1–7. [CrossRef]
- Malhotra, A. Single-Shot Image Recognition Using Siamese Neural Networks. In Proceedings of the 2023 3rd International Conference on Advance Computing and Innovative Technologies in Engineering (ICACITE). IEEE, pp. 2550–2553. [CrossRef]
- Xian, Y.; Lampert, C.; Schiele, B.; Akata, Z. Zero-Shot Learning - A Comprehensive Evaluation of the Good, the Bad and the Ugly. PP. [CrossRef]
- Xu, C.; Zheng, H.; Liu, K.; Chen, Y.; Ye, C.; Niu, C.; Jin, S.; Li, Y.; Gao, H.; Hu, J.; et al. Deep Learning for Retina Structural Biomarker Classification Using OCT Images.
- Lu, C.; Wang, X.; Yang, A.; Liu, Y.; Dong, Z. A Few-Shot-Based Model-Agnostic Meta-Learning for Intrusion Detection in Security of Internet of Things. 10, 21309–21321. [CrossRef]
- Wang, H.; Tong, X.; Wang, P.; Xu, Z.; Song, L. Few-Shot Transfer Learning Method Based on Meta-Learning and Graph Convolution Network for Machinery Fault Diagnosis. p. 09544062221148033. [CrossRef]
- Zhao, Z.; Ding, H.; Cai, D.; Yan, Y. Gated Multi-Scale Attention Transformer For Few-Shot Medical Image Segmentation. pp. 1–5. [CrossRef]
- Tang, S.; Yan, S.; Qi, X.; Gao, J.; Ye, M.; Zhang, J.; Zhu, X. Few-Shot Medical Image Segmentation with High-Fidelity Prototypes. 100, 103412, . [CrossRef]
- Wang, J.; Wang, T.; Xu, J.; Zhang, Z.; Wang, H.; Li, H. Zero-Shot Diagnosis of Unseen Pulmonary Diseases via Spatial Domain Adaptive Correction and Guidance by ChatGPT-4o. pp. 2597–2604. [CrossRef]
- Hong, J.H.; Cho, S.B. A Probabilistic Multi-Class Strategy of One-vs.-Rest Support Vector Machines for Cancer Classification. 71, 3275–3281. [CrossRef]
- Jang, J.; Kim, C. One-vs-Rest Network-based Deep Probability Model for Open Set Recognition.
- Flanagan, A.R.; Glavin, F.G. A Systematic Review of Multi-Class and One-vs-Rest Classification Techniques for Near-Infrared Spectra of Crop Cultivars. pp. 1–8. [CrossRef]
- Youden, W.J. Index for Rating Diagnostic Tests. Cancer 1950, 3, 32–35.
- Shreffler, J.; Huecker, M.R. Diagnostic Testing Accuracy: Sensitivity, Specificity, Predictive Values and Likelihood Ratios. In StatPearls; StatPearls Publishing: Treasure Island (FL), 2025.
- English, P.A.; Williams, J.A.; Martini, J.F.; Motzer, R.J.; Valota, O.; Buller, R.E. A Case for the Use of Receiver Operating Characteristic Analysis of Potential Clinical Efficacy Biomarkers in Advanced Renal Cell Carcinoma. Future Oncol. 2016, 12, 175–182. [CrossRef]
- Nebro, A.J.; Galeano-Brajones, J.; Luna, F.; Coello Coello, C.A. Is NSGA-II Ready for Large-Scale Multi-Objective Optimization? 27, 103. [CrossRef]
- Glascoe, F.P. Screening for Developmental and Behavioral Problems. 11, 173–179. [CrossRef]
- Vanderheyden, A.M. Technical Adequacy of Response to Intervention Decisions. 77, 335–350. [CrossRef]
- McDowall, L.M.; Dampney, R.A.L. Calculation of Threshold and Saturation Points of Sigmoidal Baroreflex Function Curves. 291, H2003–H2007. [CrossRef]
- Mukhoti, J.; Kulharia, V.; Sanyal, A.; Golodetz, S.; Torr, P.H.S.; Dokania, P.K. Calibrating Deep Neural Networks using Focal Loss. ArXiv 2020, abs/2002.09437.
- Leão, W. Attended Temperature Scaling: A Practical Approach for Calibrating Deep Neural Networks.
- Dabah, L.; Tirer, T. On Temperature Scaling and Conformal Prediction of Deep Classifiers. [CrossRef]
- Mamalakis, M.; de Vareilles, H.; Murray, G.; Lio, P.; Suckling, J. The Explanation Necessity for Healthcare AI 2024. version: 1, . [CrossRef]
- Metta, C.; Beretta, A.; Pellungrini, R.; Rinzivillo, S.; Giannotti, F. Towards Transparent Healthcare: Advancing Local Explanation Methods in Explainable Artificial Intelligence. Bioengineering 2024, 11, 369. [CrossRef]
Figure 1.
The structure of the CDSS module for AMD staging.
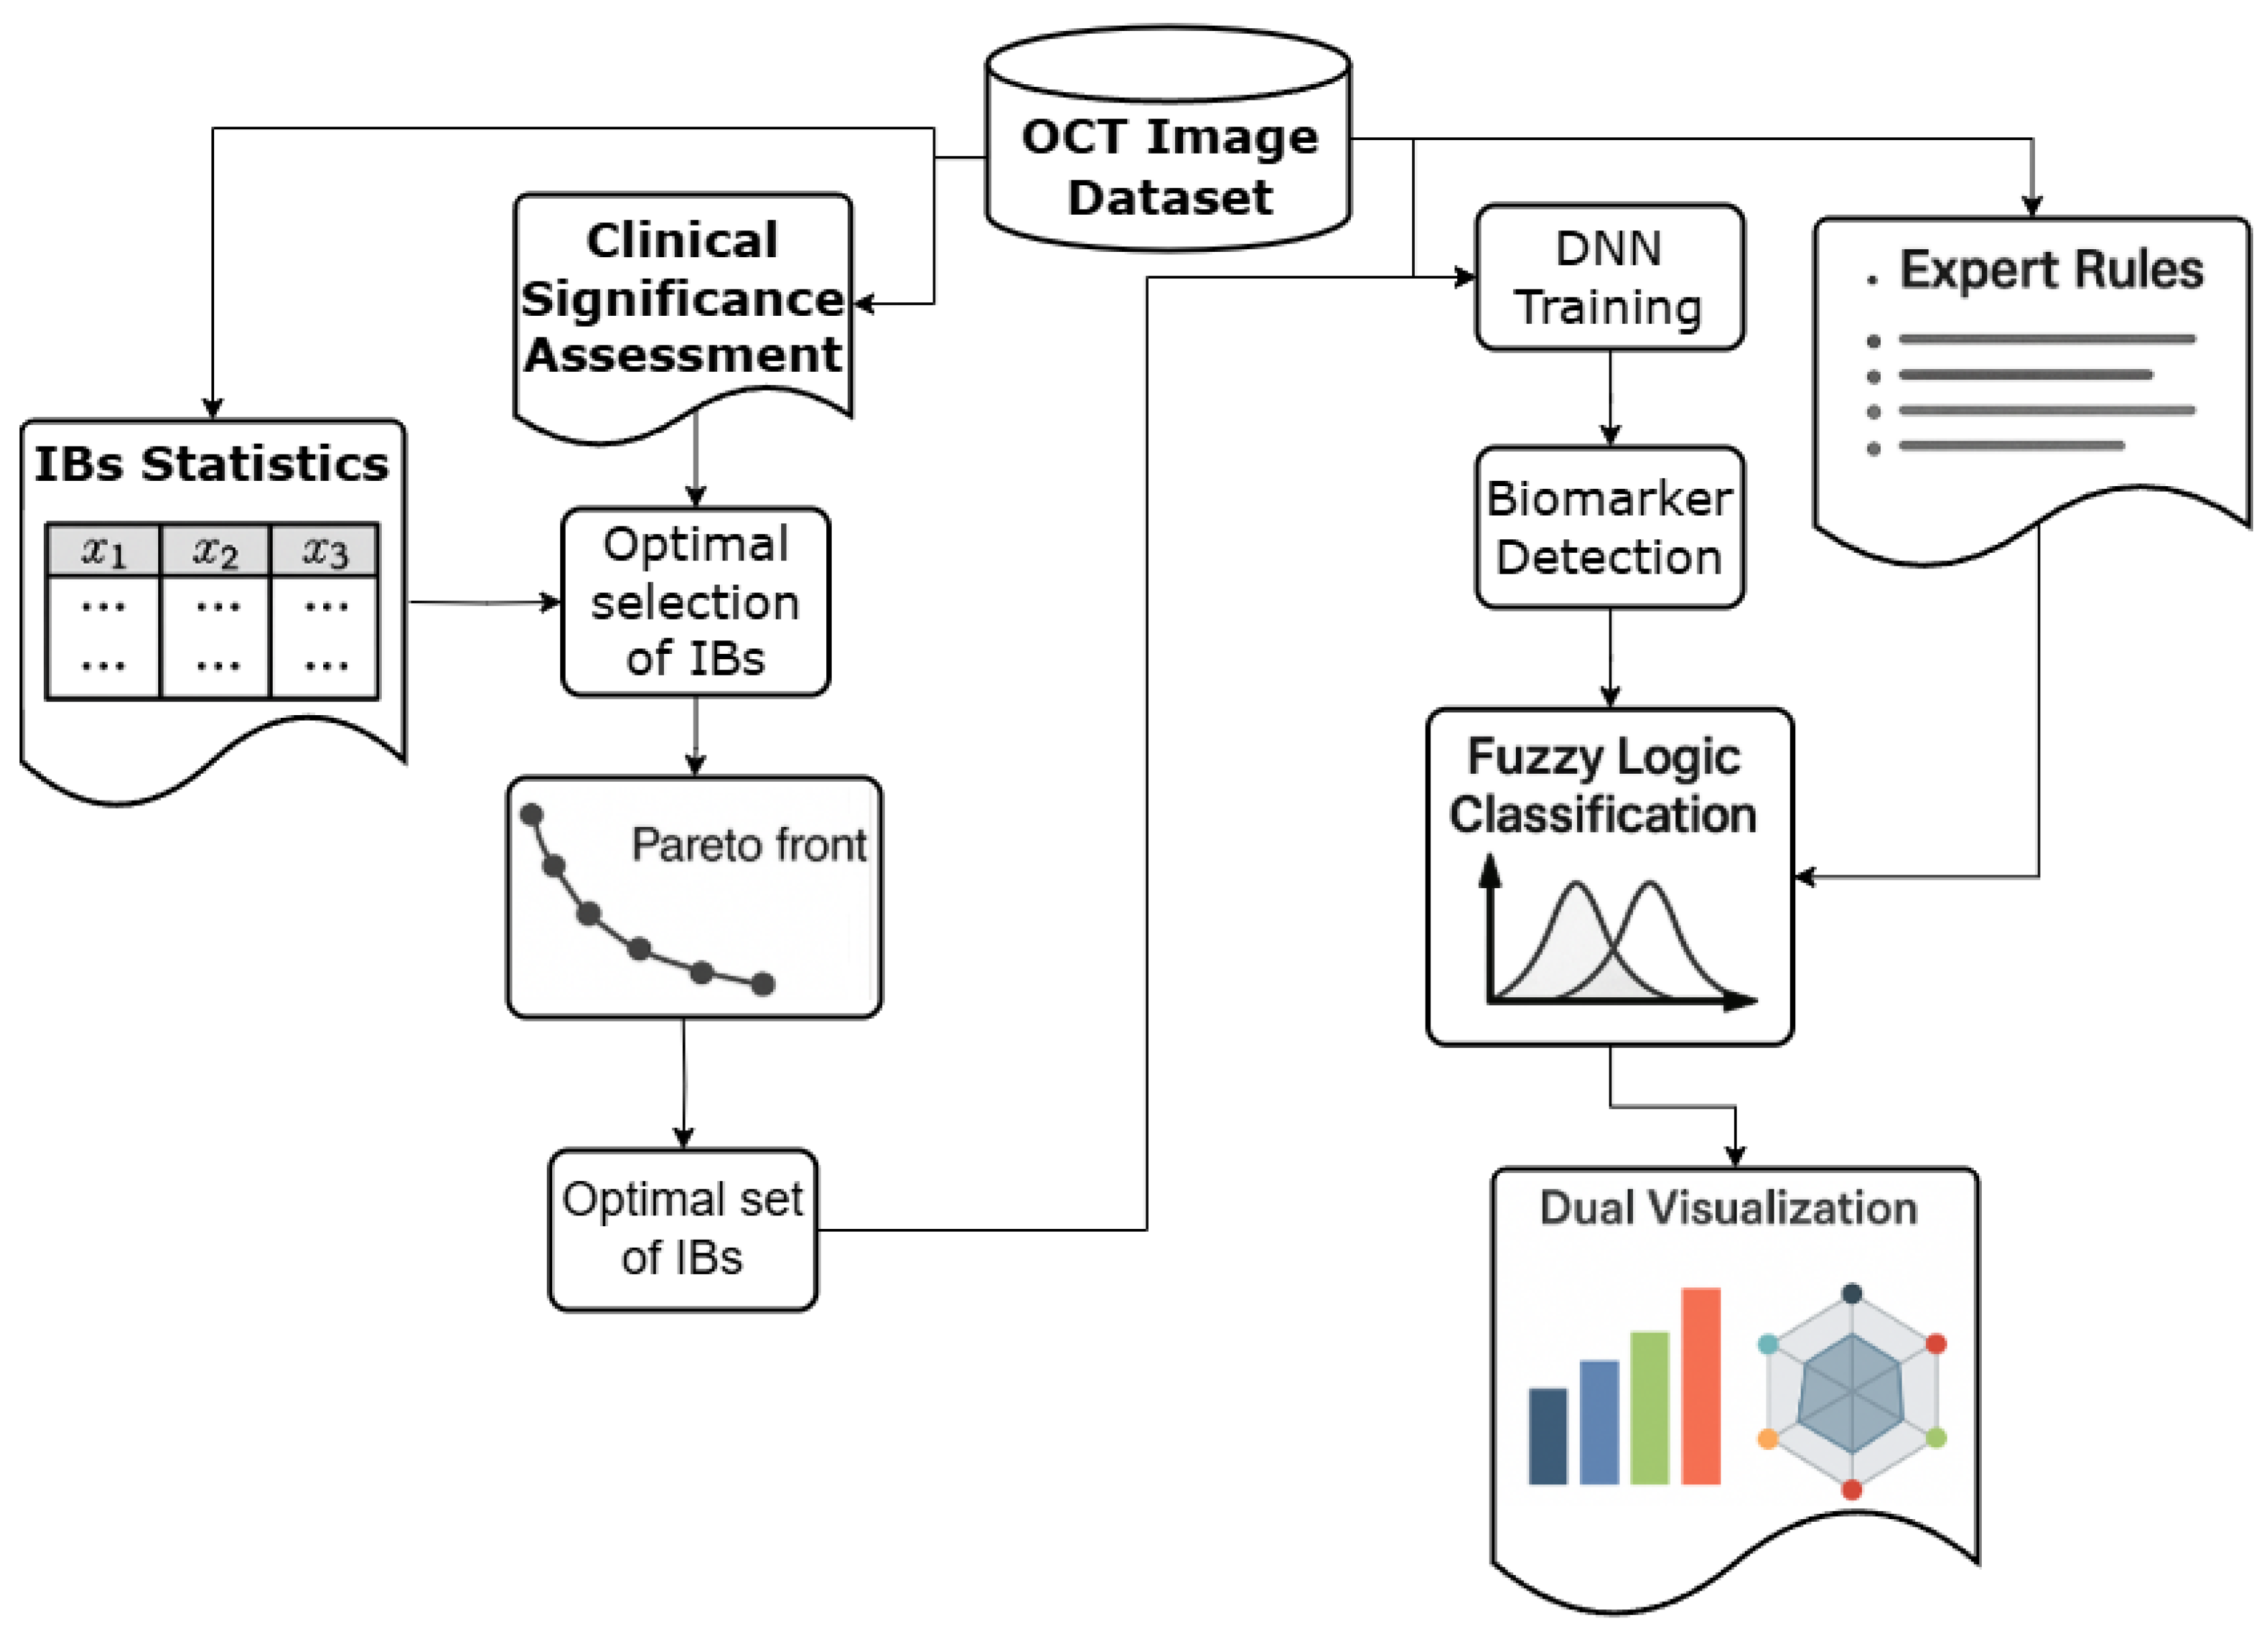
Figure 2.
DNN Performance Metrics with 95% Confidence Intervals
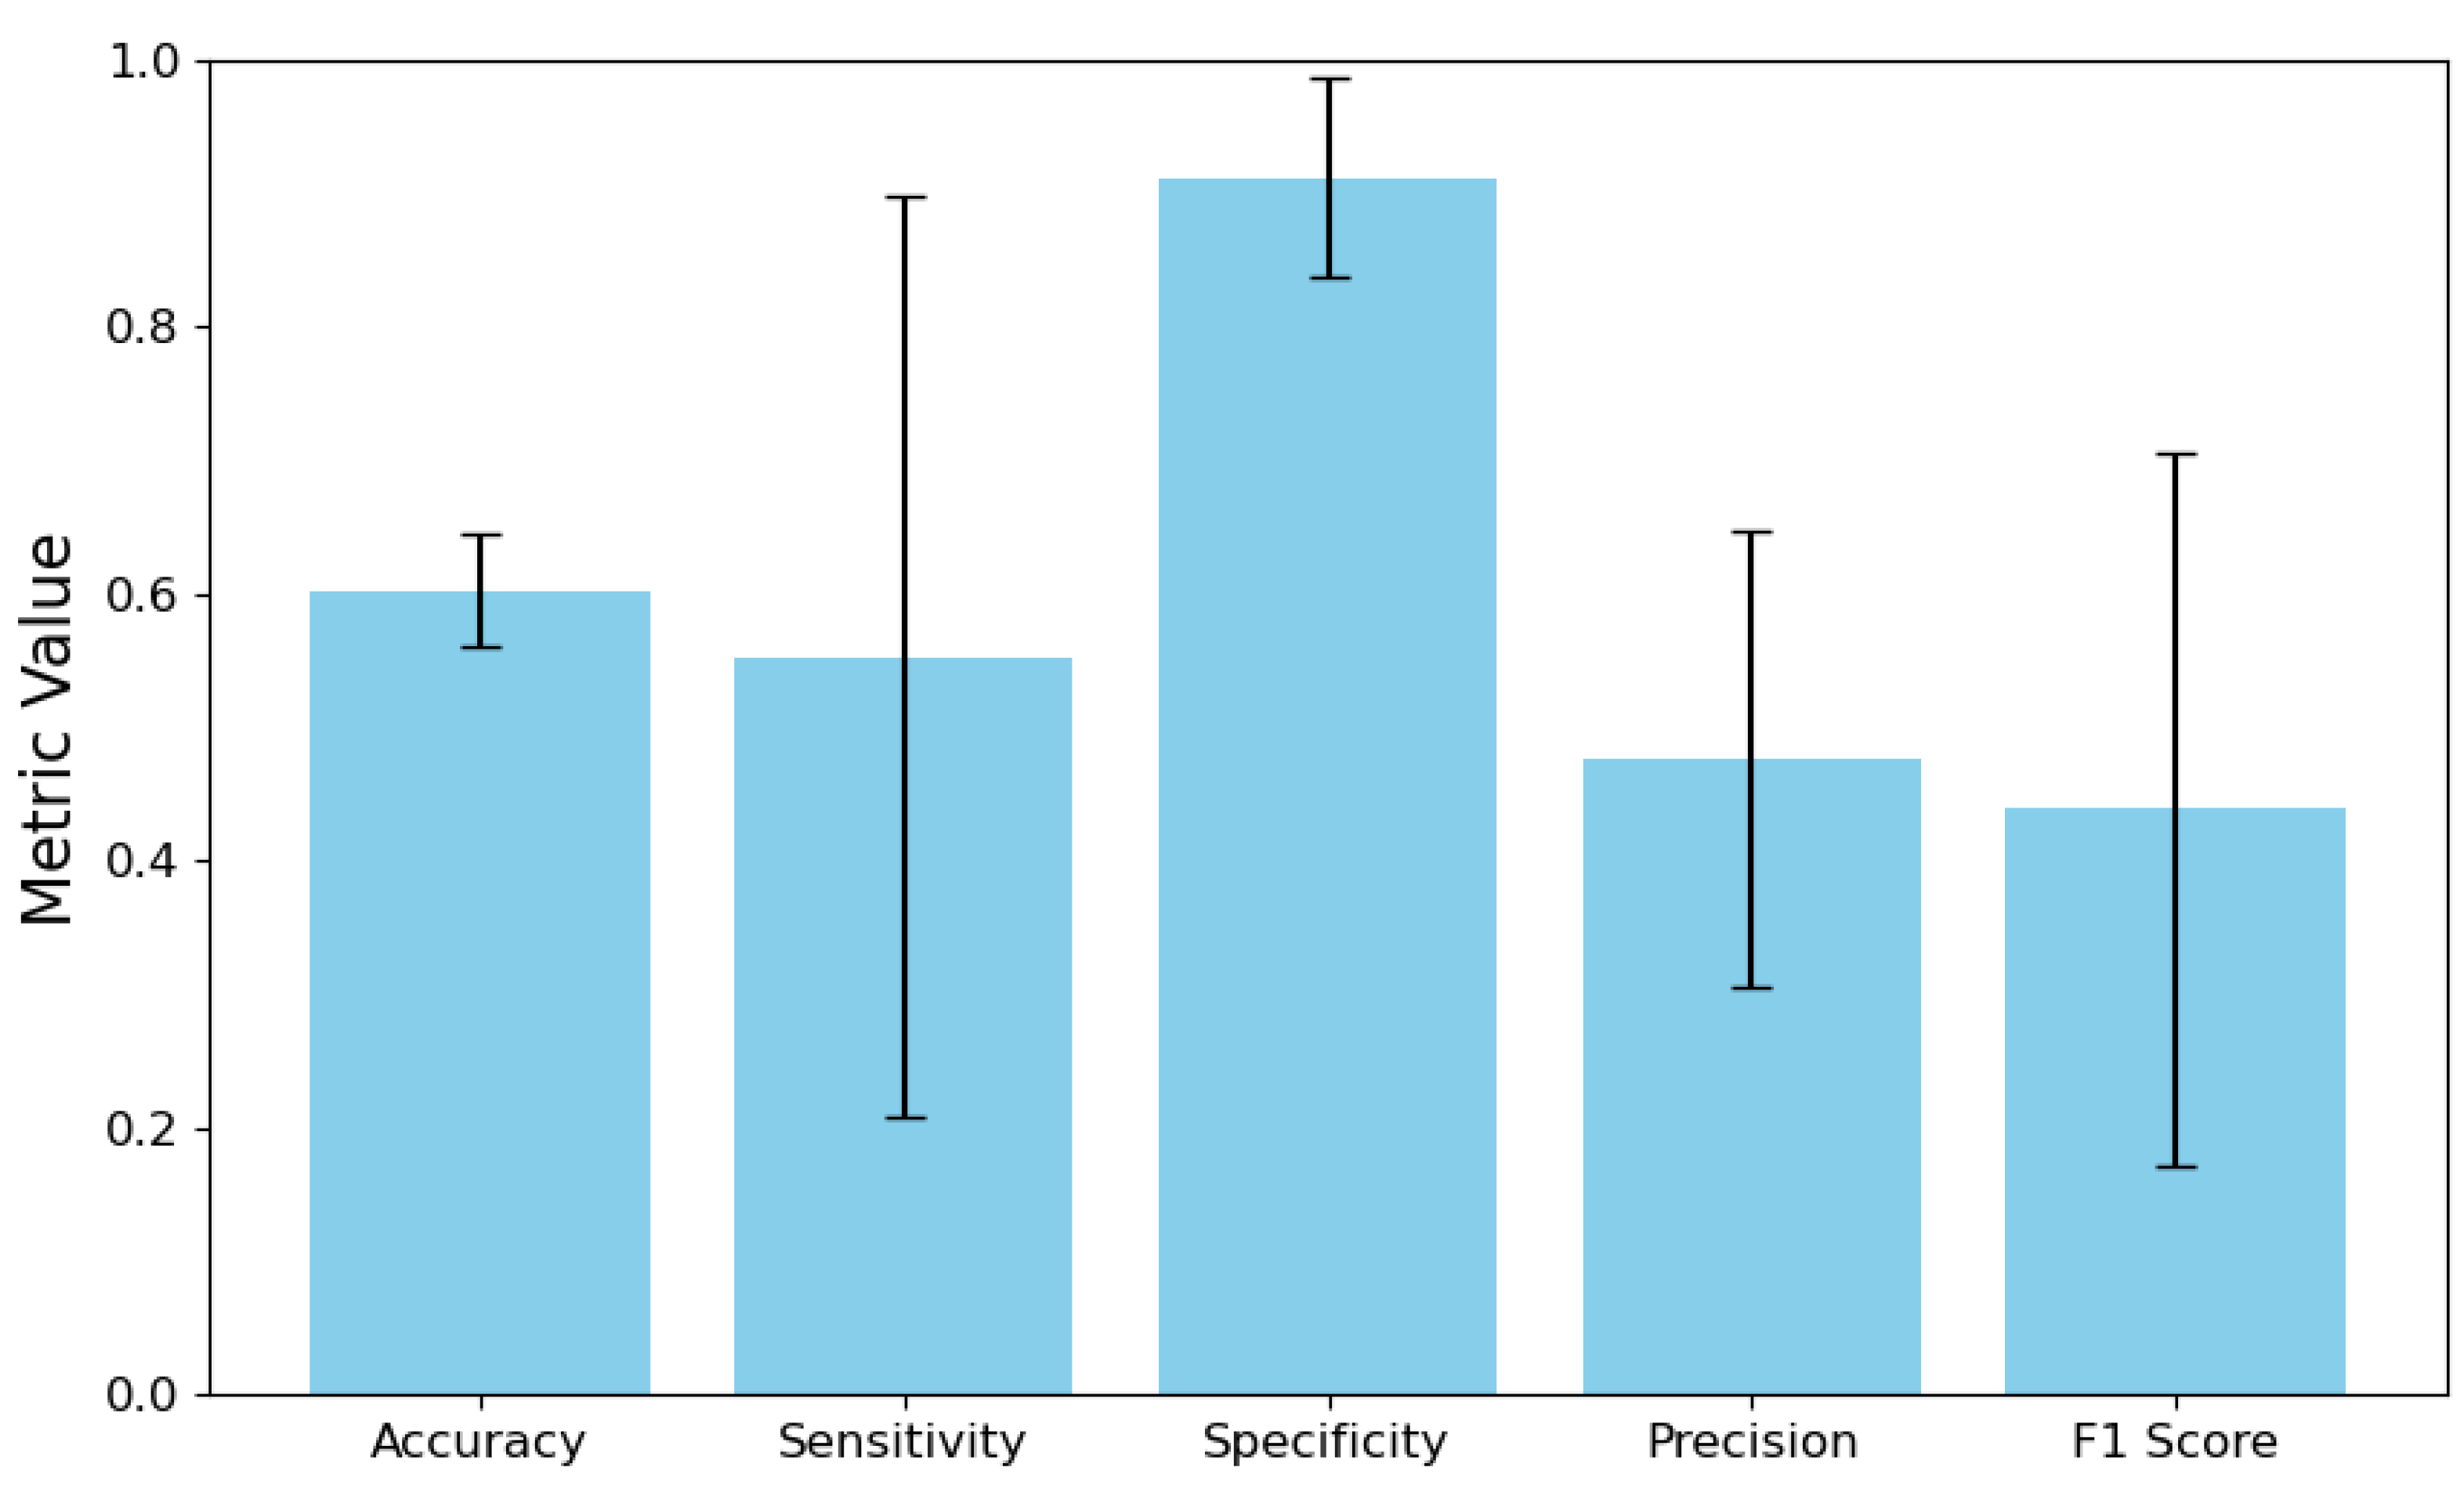
Figure 3.
A bar chart showing IBs confidence scores and a petal chart showing the calculated probabilities of AMD stages.
Figure 3.
A bar chart showing IBs confidence scores and a petal chart showing the calculated probabilities of AMD stages.
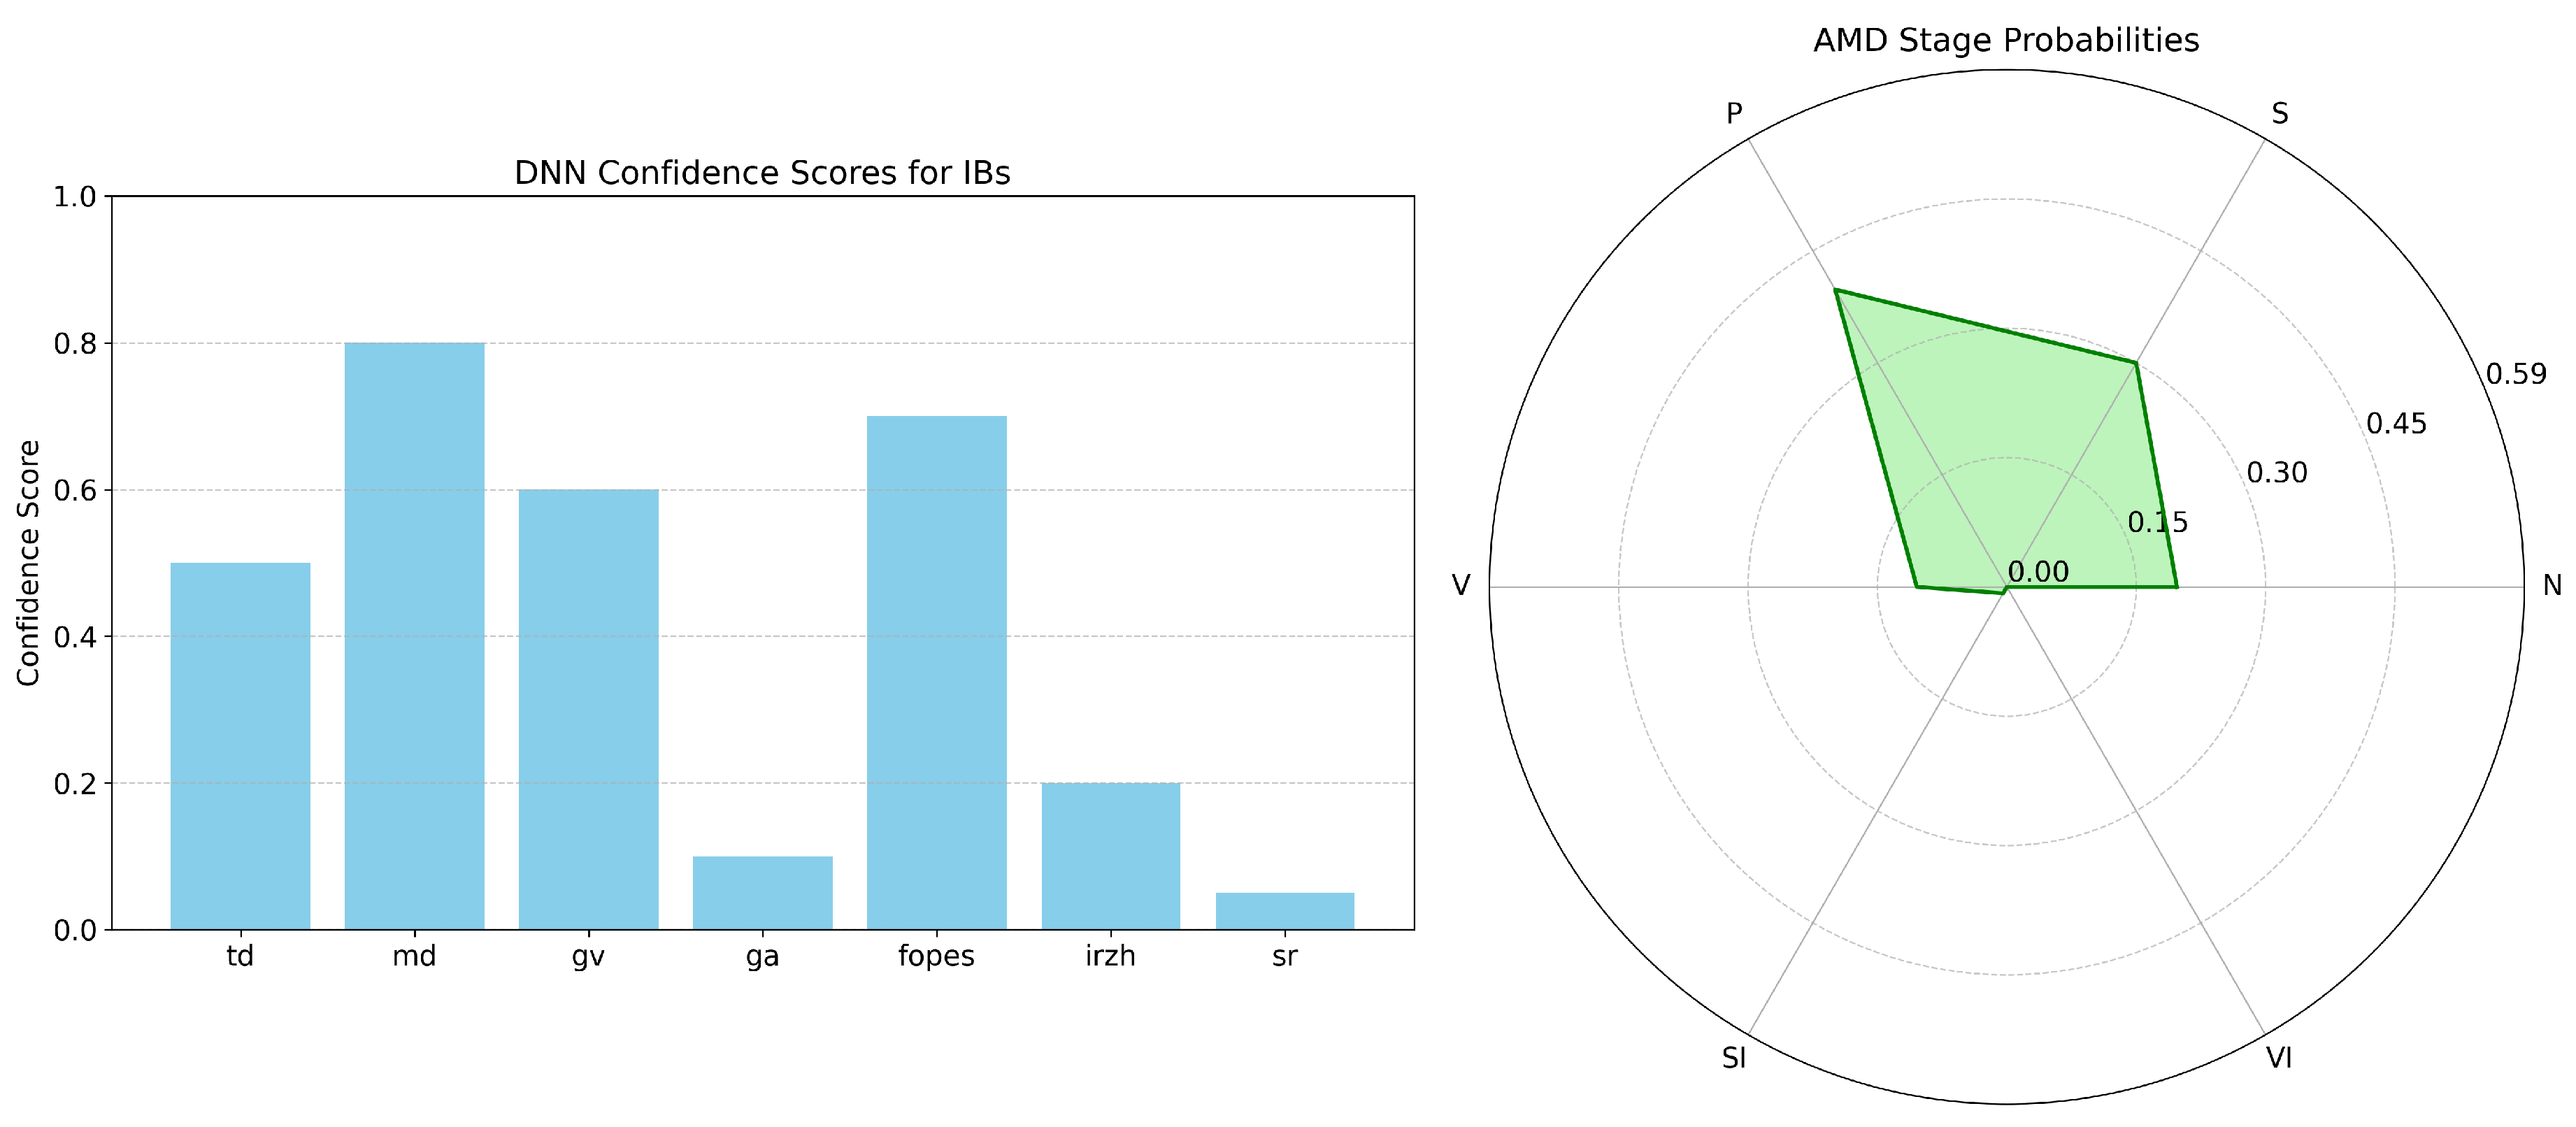
Figure 4.
DNN and an expert system based on fuzzy rules to assess performance indicators with 95% confidence intervals.
Figure 4.
DNN and an expert system based on fuzzy rules to assess performance indicators with 95% confidence intervals.
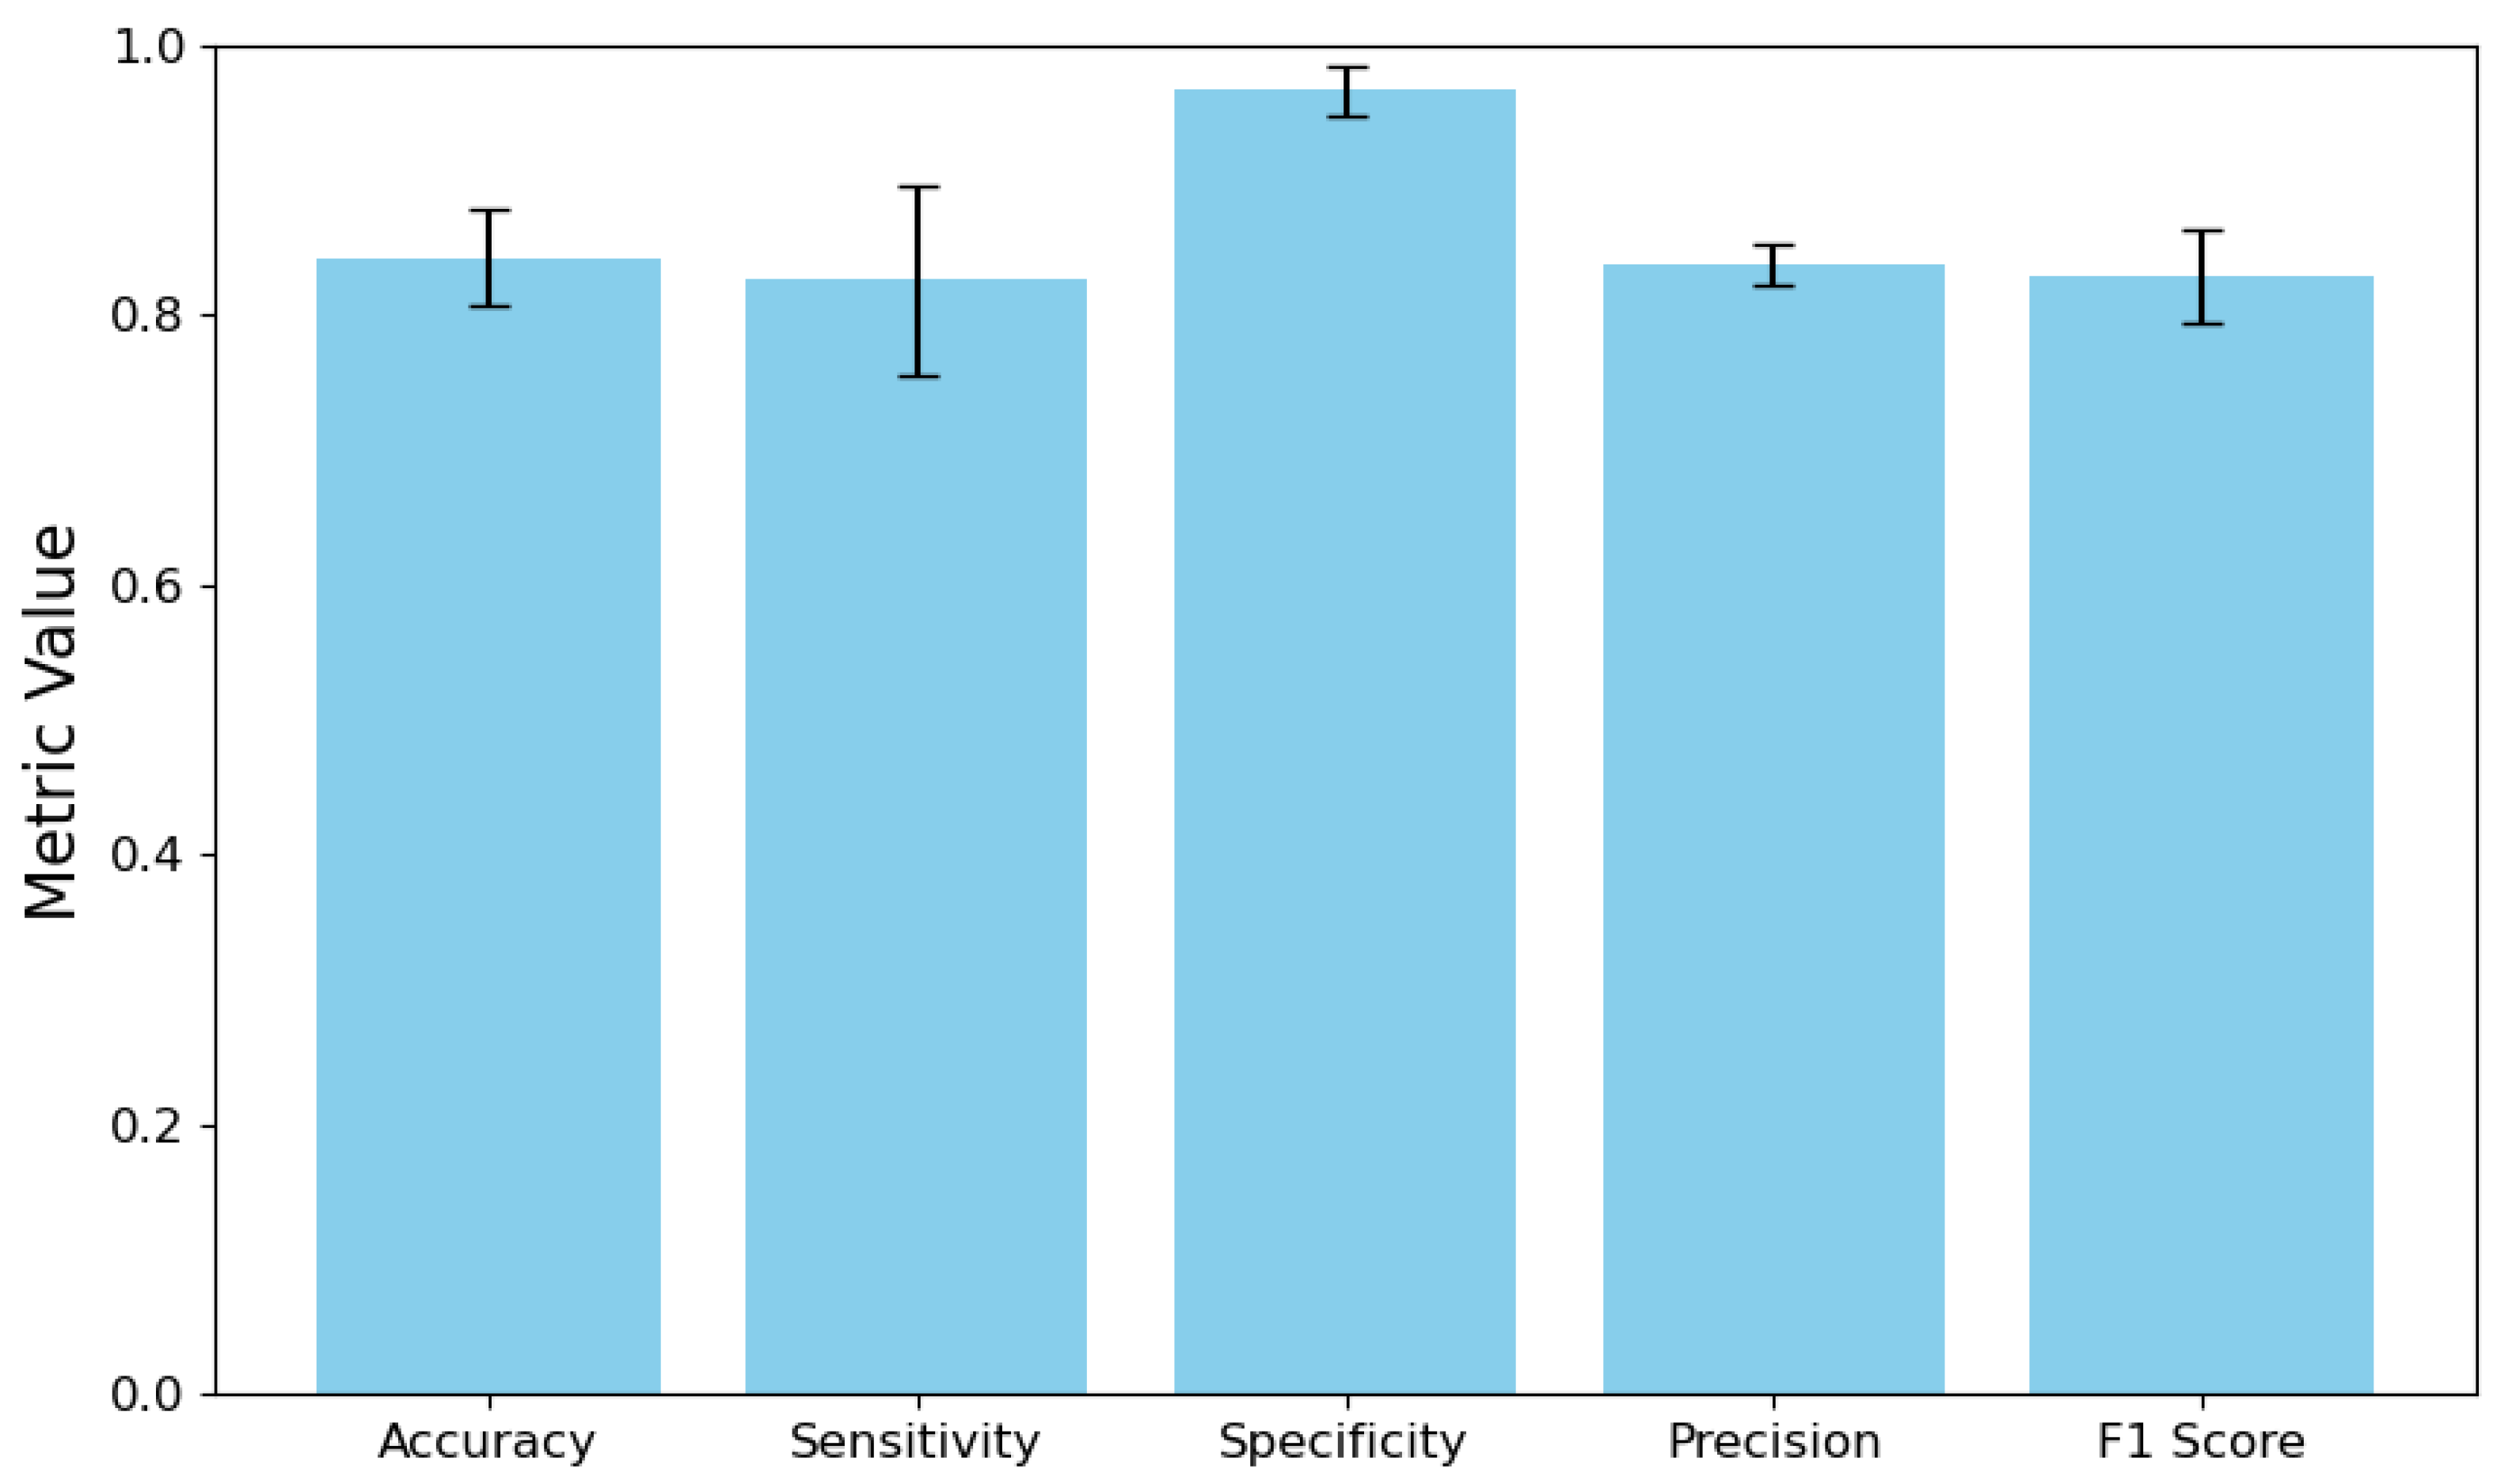
Disclaimer/Publisher’s Note: The statements, opinions and data contained in all publications are solely those of the individual author(s) and contributor(s) and not of MDPI and/or the editor(s). MDPI and/or the editor(s) disclaim responsibility for any injury to people or property resulting from any ideas, methods, instructions or products referred to in the content. |
© 2025 by the authors. Licensee MDPI, Basel, Switzerland. This article is an open access article distributed under the terms and conditions of the Creative Commons Attribution (CC BY) license (http://creativecommons.org/licenses/by/4.0/).
Copyright: This open access article is published under a Creative Commons CC BY 4.0 license, which permit the free download, distribution, and reuse, provided that the author and preprint are cited in any reuse.


