
Submitted:
14 August 2025
Posted:
14 August 2025
You are already at the latest version
Abstract
Background: Present ACS risk stratification predominantly depends on LDL-C, alt-hough its efficacy in diagnosing significant coronary plaque burden is constrained. We examined whether extensive lipid profiling, specifically the TG/HDL-C ratio, could function as a more effective diagnostic instrument for forecasting significant plaque burden in treatment-naïve first-time ACS patients. Methods: We examined 376 treat-ment-naïve patients undergoing PCI for first-time acute coronary syndrome. Using QCA, blinded angiographers were able to measure critical coronary lesions (≥70% ste-nosis in major vessels/≥50% left main). We measured the levels of lipids (LDL-C, HDL-C, TC, TG) and their ratios (LDL/HDL-C, TC/HDL-C, TG/HDL-C) when the per-son was admitted. Patients were classified according to the number of lesions (0, 1, 2, 3, ≥4). We used ANOVA, correlation, and multivariable linear regression to look at diag-nostic performance while controlling for confounders. Results: A significant graded increase in LDL-C (p=0.03), TC/HDL-C (p=0.02), and TG/HDL (p=0.01) was associated with an increasing lesion count. The strongest link was between TG/HDL-C, which went from 3.3 (0 lesions) to 5.3 (≥4 lesions). In multivariable analysis, TG/HDL-C (β=0.18, p=0.02) was a better independent predictor than LDL-C (β=0.14, p=0.04). A TG/HDL ratio greater than 4.0 identified patients with three or more lesions with 76% specificity. Conclusion: The TG/HDL-C ratio is a better diagnostic biomarker than LDL-C for finding a lot of coronary plaque in people who have had ACS for the first time. Adding it to routine admission profiling provides us with a cost-effective, imme-diately useful tool for early risk stratification, which can help us plan targeted inter-ventions and allocate resources in emergencies.
Keywords:
acute coronary syndrome
; diagnostic biomarkers
; lipid ratios
; coronary plaque burden
; risk stratification
; atherosclerosis
1. Introduction
Atherosclerosis is an immunoinflammatory pathological process characterized by the formation of lipid plaques within vessel walls, leading to partial or complete occlusion of the lumen and accounting for atherosclerotic cardiovascular disease (ASCVD) [1]. ASCVD encompasses coronary artery disease (CAD), peripheral vascular disease (PAD), and cerebrovascular disease (CVD) [1].
A disturbed lipid metabolism, specifically dyslipidemia, significantly contributes to plaque formation, with low-density lipoprotein cholesterol (LDL-C) being a primary causal factor [1,2]. Global health data underscore the severe impact of CVD, with CAD and cerebrovascular accidents (CVA) responsible for a substantial majority of global deaths [3]. While aggressive LDL-C lowering with statins is the cornerstone of therapy, even with optimal LDL-C control, a significant residual risk for cardiovascular events persists [4]. This residual risk is increasingly attributed to disturbances in other lipid components, notably triglycerides (TG) and high-density lipoprotein cholesterol (HDL-C).
This persistent residual risk highlights the importance of atherogenic dyslipidemia, characterized by elevated TG, decreased HDL-C, and often, an unfavorable LDL particle distribution, which is strongly associated with heightened CVD risk and mortality [5,6]. In this context, the triglyceride/high-density lipoprotein cholesterol (TG/HDL-C) ratio has emerged as a promising novel biomarker for predicting the risk of metabolic syndrome (MetS) and various manifestations of CVD, including CAD [7]. This ratio is notably correlated with insulin resistance and central obesity, key aspects of MetS that amplify CVD risk [1]. Beyond the TG/HDL-C ratio, the heterogeneity of LDL particles also plays a crucial role; specifically, small dense LDL (sdLDL) particles are recognized for their high atherogenicity, being more susceptible to oxidation, glycation, and arterial wall uptake, thereby significantly increasing the risk of coronary heart disease (CHD) [1,8]. Clinical studies support sdLDL levels as an independent marker for atherosclerosis development and progression, capable of reclassifying patients into higher-risk categories [1,8]. The ability of the TG/HDL-C ratio to capture the complexity of atherogenic dyslipidemia, including its link to the presence of sdLDL particles, further supports its utility in risk stratification [1,7,9].
The acute nature of ACS often stems from the destabilization and subsequent rupture or erosion of atherosclerotic plaques [10]. Intravascular imaging techniques, such as optical coherence tomography (OCT), have elucidated three primary mechanisms underlying ACS: plaque erosion (PE), plaque rupture, and eruptive calcified nodules (CN) [11]. While plaque rupture involves fibrous cap discontinuity over a lipid-rich core, plaque erosion is characterized by thrombus formation over an intact fibrous cap, frequently on fibrous or calcified plaques [10,12]. Recent insights also bring attention to superficial calcified plates (SCPs), defined as non-protruding sheets of calcium encapsulated by a thin fibrous cap, which can be associated with plaque erosions (PE-SCP) and represent a distinct calcium-related ACS risk beyond spotty calcifications or CN [10,13]. These PE-SCP lesions, often found in the left anterior descending artery and associated with white thrombi, demonstrate that the complexity of plaque morphology plays a critical role in ACS events, even in angiographically non-significant lesions [10,12].
Acute coronary syndrome demands rapid, accurate risk stratification to guide life-saving interventions. Given the profound impact of dyslipidemia on ACS pathogenesis and recurrence, lipid-lowering therapy is a cornerstone in preventing subsequent cardiovascular events [1,2]. Current guidelines recommend a target LDL-C level below 55 mg/dL for ACS patients, alongside a reduction of over 50% from baseline [14]. Despite intensive statin therapy, a substantial number of patients, particularly those with recurrent events or statin intolerance, fail to achieve these stringent LDL-C targets, highlighting a persistent unmet clinical need [2]. This has spurred the development of novel agents like proprotein convertase subtilisin/kexin type 9 (PCSK9) inhibitors, which effectively reduce LDL-C levels by preventing the degradation of LDL receptors [15]. Beyond potent lipid lowering, PCSK9 inhibitors also contribute to plaque stabilization by reducing plaque burden and promoting fibrous cap thickening, signifying a multifactorial approach to managing atherosclerotic disease [16]. The emphasis is shifting towards a 'lower-the-better' and 'sooner-the-better' strategy for lipid reduction, especially in high-risk post-ACS patients [2,17]. While LDL-C is established in atherosclerosis pathogenesis, its utility as a standalone diagnostic biomarker for quantifying coronary plaque burden in ACS remains suboptimal [18]. Current guidelines lack consensus on incorporating lipid ratios into diagnostic algorithms, despite evidence that atherogenic dyslipidemia, characterized by high TG, low HDL-C, and LDL particles, drives plaque vulnerability and multi-vessel disease [19].
The diagnostic gap is particularly acute in treatment-naïve first-time ACS patients, where baseline lipid profiles reflect unobscured pathophysiology [20]. Prior studies focused on long-term outcomes rather than real-time plaque burden assessment [21]. Lipid ratios like TG/HDL-C capture the interplay between pro- and anti-atherogenic lipoproteins and serve as surrogates for insulin resistance and LDL factors promoting aggressive atherosclerosis [7,22,23,24].
This study addresses a critical diagnostic need: Can admission lipid profiling identify patients with extensive coronary disease using a low-cost, universally available biomarker? We hypothesized that the TG/HDL-C ratio would outperform LDL-C as a diagnostic tool for predicting critical plaque burden, providing immediate actionable data for clinical decision-making.
2. Methods
2.1. Study Design and Population
This retrospective cohort study included 722 patients presenting with ACS to Eskisehir City Hospital (January 2022–January 2025). We enrolled 376 consecutive treatment-naïve patients undergoing PCI for first-time ACS (STEMI/NSTEMI/unstable angina) with complete admission lipid data.
Patients were eligible for inclusion if they met all of the following criteria:
- Age ≥18 years at presentation
- According to current ESC/AHA guidelines, the clinical presentation is consistent with acute coronary syndrome (STEMI, NSTEMI, or unstable angina).
- Untreated state (absence of prior use of lipid-lowering medicines, antiplatelet drugs other than aspirin for primary prevention, or other cardiovascular therapies)
- First acute coronary syndrome presentation (no previous myocardial infarction, percutaneous coronary intervention, or coronary artery bypass grafting)
- Complete admission lipid profile obtained within 24 hours of symptom onset
- Adequate angiographic images suitable for quantitative coronary analysis
To reduce confounding variables and guarantee the validity of lipid biomarker evaluations, individuals were eliminated if they exhibited any of the following conditions:
- Previous history of coronary artery disease, including prior myocardial infarction, PCI, or coronary artery bypass grafting
- Use of any lipid-lowering medications, including statins, ezetimibe, PCSK9 inhibitors, or fibrates
- Severe renal dysfunction (estimated glomerular filtration rate <30 mL/min/1.73 m² or requiring dialysis)
- Severe hepatic dysfunction
- Active infection or inflammatory conditions that could affect lipid metabolism
- Malignancy with ongoing treatment or recent chemotherapy (within 6 months)
- Pregnancy or lactation
- Inability to undergo coronary angiography due to contrast allergy or other contraindications
- Incomplete clinical data or lipid profile measurements
- Poor angiographic image quality preventing accurate quantitative analysis
2.2. Diagnostic Biomarker Assessment
All laboratory measures were conducted in the hospital's central laboratory, which holds ISO 15189 accreditation for medical laboratory quality and competence. Blood samples for lipid analysis were obtained within 24 hours after symptom onset, ideally before the commencement of any drugs that can influence lipid metabolism.
Lipid Profile Analysis: Serum total cholesterol, triglycerides, and HDL cholesterol were quantified with standardized enzymatic assays on the Abbott Architect c16000 chemistry analyzer (Abbott Laboratories, Abbott Park, IL, USA). The laboratory engages in external quality assurance processes, maintaining coefficients of variation consistently under 3% for all lipid measurements.
- Total cholesterol: measured using the cholesterol esterase/cholesterol oxidase method
- Triglycerides: measured using the glycerol phosphate oxidase method
- HDL cholesterol: measured using a direct homogeneous assay with selective solubilization
LDL Cholesterol Calculation and Direct Measurement: LDL cholesterol was computed via the Friedewald equation [LDL-C = Total Cholesterol - HDL-C - (Triglycerides/5)] for patients with triglyceride levels below 400 mg/dL. In individuals with triglycerides ≥400 mg/dL, LDL cholesterol was directly quantified with a homogeneous technique. The direct LDL-C technique was employed for quality control in a random sample of 20% of patients having triglyceride levels below 400 mg/dL.
Lipid Ratio Calculations: The following lipid ratios were calculated for all patients:
- TG/HDL-C ratio: triglycerides (mg/dL) divided by HDL cholesterol (mg/dL)
- TC/HDL-C ratio: total cholesterol (mg/dL) divided by HDL cholesterol (mg/dL)
- LDL-C/HDL-C ratio: LDL cholesterol (mg/dL) divided by HDL cholesterol (mg/dL)
Coronary plaque burden was quantified by blinded angiographers using QCA: critical lesions defined as ≥70% stenosis in major vessels or ≥50% left main [22]. Patients were stratified by lesion count (0, 1, 2, 3, ≥4).
2.3. Statistical Analysis
Diagnostic performance was evaluated using:
- ANOVA with linear trend testing across lesion groups
- Pearson correlation for biomarker-plaque burden relationships
- Multivariable linear regression adjusting for age, sex, diabetes, hypertension, smoking
- Sensitivity/specificity analysis for TG/HDL thresholds (Youden index)
- Assumptions (linearity, normality, and homoscedasticity) were verified. p<0.05 is significant. SPSS v23.0. The sample size provided >80% power to detect r≥0.2 (α=0.05).
- Missing Data Management: The primary method for addressing missing data was complete case analysis, due to the retrospective design of the study and the high completeness of essential variables. Sensitivity analyses employing multiple imputations were intended if missing data were over 5% for any critical variable.
3. Results
3.1. Baseline Characteristics
The study cohort consisted of 376 treatment-naïve patients presenting with their first ACS event. The mean age of the patients was 65.0 ± 10.0 years, and 70% were male. When stratified by the number of coronary lesions, there were no statistically significant differences across the groups in baseline cardiovascular risk factors, including hypertension, diabetes, or smoking status (p>0.05 for all). Similarly, the type of ACS presentation (STEMI, NSTEMI, or unstable angina) was comparable across all lesion burden groups (Table 1).
3.2. Diagnostic Performance of Lipid Biomarkers
A significant, graded relationship was observed between several lipid biomarkers and the coronary plaque burden (Table 2). While LDL-C showed a modest but significant increase with lesion count (from 110.0 mg/dL in patients with 0 lesions to 130.0 mg/dL in those with ≥4 lesions, p = 0.03), the TG/HDL-C ratio demonstrated the strongest and most consistent diagnostic gradient. The mean TG/HDL-C ratio rose from 3.3 in patients with no lesions to 5.3 in those with four or more lesions (p=0.01) (Table 2, Figure 1). The correlation with lesion burden was also strongest for the TG/HDL-C ratio (r=0.32).
3.3. Diagnostic Accuracy of TG/HDL-C Ratio
The TG/HDL-C ratio demonstrated superior diagnostic performance with an area under the curve of 0.72 (95% CI: 0.65-0.79) (Table 3). Multiple thresholds were evaluated to optimize clinical utility:
- >3.0: Sensitivity 82.1%, Specificity 65.3%, PPV 71.4%, NPV 77.8%
- >3.3: Sensitivity 76.5%, Specificity 76.8%, PPV 78.9%, NPV 74.2%
- >4.0: Sensitivity 68.4%, Specificity 89.5%, PPV 88.7%, NPV 70.1%
- >4.5: Sensitivity 52.1%, Specificity 93.7%, PPV 91.3%, NPV 61.2%
Clinical Threshold Selection: Through Youden index optimization and clinical evaluation, a TG/HDL-C threshold over 4.0 was determined to be best for identifying high-risk individuals, yielding exceptional specificity (89.5%) alongside satisfactory sensitivity (68.4%). An ideal threshold of >3.3 was established for low-risk identification, owing to its balanced sensitivity and specificity profile.
3.4. Multivariable Analysis
3.4.1. Independent Predictor Analysis
A multiple linear regression analysis was conducted to ascertain independent predictors of coronary lesion burden while accounting for any confounding variables (Table 4). The final model encompassed age, sex, diabetes mellitus, hypertension, current smoking status, and the principal lipid indicators.
Primary Findings: The TG/HDL-C ratio was identified as the most robust independent predictor of coronary plaque burden (β=0.18, p=0.02), accounting for 42% of the model's predictive capacity. LDL-C continued to be a significant, albeit diminished, independent predictor (β=0.14, p=0.04), accounting for 33% of the model's predictive capacity. The diagnostic odds ratio for TG/HDL-C was 1.20 (95% CI: 1.07-1.34), signifying a 20% elevation in the probability of increased lesion burden for each unit increment in the ratio.
Model Performance: The final multivariable model attained a R² of 0.31, signifying that the variables incorporated accounted for 31% of the variance in coronary plaque burden. The model assumptions were validated by residual analysis, affirming linearity, homoscedasticity, and the normal distribution of residuals.
3.4.2. Subgroup Analysis Results
Further analyses were conducted in clinically pertinent subgroups to evaluate the consistency of TG/HDL-C ratio efficacy:
Diabetic vs. Non-diabetic Patients: The TG/HDL-C ratio exhibited enhanced diagnostic efficacy in both diabetes patients (r=0.35, p<0.001) and non-diabetic patients (r=0.29, p<0.001), with a somewhat greater connection observed in the diabetic sample.
Age-stratified Analysis: Performance was comparable across age groups, with correlation coefficients of r=0.31 for patients under 65 years and r=0.33 for patients aged 65 years and above.
Sex-based Analysis: Both male (r=0.31) and female patients (r=0.34) exhibited robust relationships between the TG/HDL-C ratio and plaque load, with no significant difference observed between the sexes.
3.5. Cost-Effectiveness and Implementation
The analysis suggests that using the TG/HDL-C ratio could be a cost-effective strategy. This simple calculation adds no significant cost to a standard lipid panel. Based on the data, applying a low-risk threshold (TG/HDL-C <3.3) could potentially reduce the need for unnecessary advanced imaging in this subgroup. A proposed clinical pathway for implementing these findings in an ACS setting is provided (Figure 2).
4. Discussion
Our principal finding establishes the TG/HDL-C ratio as a superior diagnostic biomarker to LDL-C for identifying extensive coronary plaque burden in treatment-naïve first-time ACS patients. This ratio provides immediate, cost-effective risk stratification using universally available admission data, addressing a critical unmet need in acute cardiac care [1,2,3,4]. The significant graded relationship between TG/HDL-C and lesion count (r=0.32 vs. r=0.15 for LDL-C) demonstrates its enhanced sensitivity for capturing diffuse atherosclerosis, outperforming traditional lipid metrics in multivariable analysis (β=0.18 vs. β=0.14; p=0.02 vs. p=0.04).
Mechanistically, the superiority of the TG/HDL-C ratio stems from its comprehensive reflection of atherogenic dyslipidemia, which extends beyond what conventional LDL-C measurements alone can capture [3,23,24]. This ratio serves as a validated surrogate for critical drivers of plaque vulnerability and multi-vessel disease, including insulin resistance, the presence of highly atherogenic sdLDL particles, and remnant lipoproteins [25,26]. Elevated sdLDL levels, for instance, are associated with a higher risk of CHD due to their increased susceptibility to oxidation and uptake into arterial walls [27].The altered distribution of HDL particles, specifically a decrease in large HDL and an increase in small HDL in ACS patients, further contributes to this atherogenic profile, as small HDL particles may have impaired cholesterol efflux capacity, leading to greater cholesterol accumulation in arterial walls [28,29]. Therefore, the TG/HDL-C ratio's robust performance in our study aligns with extensive literature supporting its role as an excellent novel risk marker for MetS, CAD, PAD, and cerebrovascular disease [7,23].
Recent advances in lipoprotein biology have elucidated the critical role of triglyceride-rich lipoproteins and their remnants in atherothrombosis [23]. These particles, which are elevated in patients with high TG/HDL-C ratios, demonstrate enhanced atherogenicity through multiple mechanisms: increased arterial wall penetration due to their small size, prolonged plasma residence time, increased susceptibility to oxidative modification, and direct pro-inflammatory effects on vascular endothelium [23,24]. The TG/HDL-C ratio serves as an accessible surrogate for this complex lipoprotein profile, explaining its superior predictive performance compared to LDL-C alone.
Our results corroborate and substantially enhance prior studies illustrating the prognostic significance of the TG/HDL-C ratio for cardiovascular events. Zhou et al. recently established that the TG/HDL-C ratio predicts long-term significant adverse cardiovascular events in ACS patients having PCI [23], whereas our investigation elucidates its function in identifying the anatomic substrate associated with these clinical outcomes. This differentiation is clinically significant, as anatomical risk assessment facilitates prompt therapeutic decision-making, whereas outcome prediction necessitates long-term follow-up for validation.
Koide et al. established correlations between the TG/HDL-C ratio and high-risk coronary plaque features identified using CT angiography [24], hence offering supplementary validation for our angiographic results. Nonetheless, their research concentrated on patients with stable coronary artery disease, whereas our work primarily pertains to the acute context where prompt risk assessment is of paramount clinical significance. We recommend the use of TG/HDL-C in the diagnostic protocols for ACS (Figure 2). A ratio beyond 4.0 necessitates prompt initiation of high-intensity statin medication, contemplation of ezetimibe, and assessment for PCSK9 inhibitors, whilst levels below 3.3 allow for the safe postponement of invasive imaging. This method enhances resource distribution by targeting intensive therapies at high-risk patients and circumventing superfluous operations for low-risk individuals [12]. The establishment of these pathways could revolutionize ACS triage, especially in environments with restricted sophisticated imaging resources.
The high discrimination accuracy of sdLDL levels (AUC = 0.847) observed in ACS patients is comparable to that of other established atherogenic indices, like AIP, AC, CR-I, and CR-II, and sdLDL levels have been shown to correlate positively with these markers [30,31,32]. Our findings that TG/HDL-C demonstrates a stronger correlation with lesion burden (r=0.32) compared to LDL-C (r=0.15) further support its comprehensive utility as a diagnostic tool. While the usefulness of the TG/HDL-C ratio as a strong predictor for MetS and CVD is well-established across various studies, it is important to acknowledge the observed variability in optimal cut-off values across different populations, which may be influenced by ethnicity, genetics, and lifestyle factors [1,23]. Despite this, its consistent association with cumulative risk factors positions the TG/HDL-C ratio as a valuable atherogenic index for risk stratification.
The current study offers several significant additions that surpass prior research. Initially, we concentrated on treatment-naïve, first-time ACS patients, a demographic in which lipid profiles accurately represent unaltered pathophysiology, devoid of the confounding influences of prior drugs or therapies. This method yields the most precise evaluation of the correlation between cholesterol biomarkers and coronary structure.
Secondly, we utilized quantitative coronary angiography with blind analysis to deliver an objective evaluation of coronary plaque burden, thereby minimizing subjective interpretation bias that could influence visual assessment studies. Third, we performed an extensive comparative examination of various lipid characteristics and ratios employing recognized statistical methods, yielding conclusive evidence for the superiority of the TG/HDL-C ratio.
Despite these strengths, limitations exist. Our retrospective design precludes causal inference, and single-center recruitment may limit generalizability. We lacked data on other important atherogenic markers, such as Apolipoprotein B (apoB), Lp(a), or inflammatory biomarkers like hs-CRP, which could refine the predictive model. Future studies could also benefit from assessing specific LDL and HDL subfractions, such as sdLDL and the distribution of HDL particles, which are known to be altered in ACS patients and possess high atherogenicity [23]. The Quantimetric Lipoprint® system, for example, is an FDA-approved method for clinical use in cardiovascular risk assessment through the quantification of LDL and HDL subclasses, offering a standardized approach despite documented variations in sdLDL thresholds across different methodologies and ethnic groups [13]. Furthermore, the detailed morphological assessment of coronary plaques using intravascular imaging like Optical Coherence Tomography (OCT) could provide deeper insights into plaque vulnerability characteristics, such as superficial calcified plates, plaque erosion, and fibrous cap thickness, which are relevant to ACS pathophysiology and treatment response [13,33,34]. These advanced imaging techniques could refine the predictive models and guide individualized treatment strategies, including the use of advanced lipid-lowering therapies aimed at plaque stabilization. Future research should focus on prospective multi-center validation of these TG/HDL-C thresholds and their integration with other biomarkers and advanced imaging techniques. Additionally, while our cost-effectiveness projection is based on established imaging utilization patterns [35,36], prospective validation is needed to confirm real-world impact. Studies examining the impact of TG/HDL-C-guided interventions on hard clinical outcomes are warranted to establish their role in evidence-based guidelines [3,23,24].
In conclusion, the TG/HDL-C ratio represents a paradigm shift in ACS risk stratification. Its superiority over LDL-C in identifying extensive plaque burden, combined with its cost-effectiveness and immediate availability, positions it as an essential diagnostic tool for first-time ACS patients. Implementation of TG/HDL-C-based pathways can optimize resource allocation, guide targeted interventions, and ultimately improve outcomes in acute cardiac care.
5. Conclusions
The TG/HDL-C ratio is a superior diagnostic biomarker to LDL-C for identifying extensive coronary plaque burden in first-time ACS. Its integration into routine admission profiling provides a cost-effective, immediately actionable tool for early risk stratification. Implementation of TG/HDL-C-based diagnostic pathways can optimize resource allocation, guide targeted interventions, and improve outcomes in acute cardiac care.
Author Contributions
Conceptualization, F.A. and B.M.; methodology, F.A.; formal analysis, B.M. and H.D.; investigation, F.A., B.M. and S.M.; data curation, B.M. and S.M.; writing-original draft preparation, F.A.; writing-review and editing, B.M., S.M. and H.D.; visualization, H.D.; supervision, F.A.; project administration, F.A. All authors have read and agreed to the published version of the manuscript.
Funding
This research did not receive any specific grant from funding agencies in the public, commercial, or non-profit sectors.
Institutional Review Board Statement
The study was conducted by the Declaration of Helsinki and approved by the Institutional Review Board of Eskisehir City Hospital (protocol code ESH/BAEK 2025/136 and date of approval January 15, 2025).
Informed Consent Statement
Patient consent was exempted owing to the retrospective design of the study and the utilization of anonymized clinical data, as sanctioned by the institutional ethics committee.
Data Availability Statement
The datasets used and analyzed during the current study are available from the corresponding author upon reasonable request, subject to institutional data sharing policies and patient privacy protections.
Acknowledgments
The authors wish to thank the staff of the Catheterization Laboratory and the Emergency Department at Eskisehir City Hospital for their support.
Conflicts of Interest
All authors declare that they have no conflicts of interest.
Abbreviations
| ACS | Acute Coronary Syndrome |
| ASCVD | Atherosclerotic Cardiovascular Disease |
| AUC | Area Under the Curve |
| CAD | Coronary Artery Disease |
| CHD | Coronary Heart Disease |
| HDL-C | High-Density Lipoprotein Cholesterol |
| LDL-C | Low-Density Lipoprotein Cholesterol |
| MetS | Metabolic Syndrome |
| NPV | Negative Predictive Value |
| NSTEMI | Non-ST-Elevation Myocardial Infarction |
| OCT | Optical Coherence Tomography |
| PAD | Peripheral Artery Disease |
| PCI | Percutaneous Coronary Intervention |
| PCSK9 | Proprotein Convertase Subtilisin/Kexin Type 9 |
| PPV | Positive Predictive Value |
| QCA | Quantitative Coronary Analysis |
| sdLDL | Small Dense Low-Density Lipoprotein |
| STEMI | ST-Segment Elevation Myocardial Infarction |
| TC | Total Cholesterol |
| TG | Triglycerides |
References
- Otrante A, Bounafaa A, Berrougui H, Essamadi AK, Nguyen M, Fülöp T, Khalil A. Small Dense LDL Level and LDL/HDL Distribution in Acute Coronary Syndrome Patients. Biomedicines. 2023 Apr 18;11(4):1198. [CrossRef] [PubMed] [PubMed Central]
- Guijarro C, Cosin-Sales J. LDL cholesterol and atherosclerosis: The evidence. Clin Investig Arter Publ Off Soc Esp Arterioscler. 2021; 33(Suppl. S1):25-32.
- Welty, FK. How do elevated triglycerides and low HDL-cholesterol affect inflammation and atherothrombosis? Curr Cardiol Rep. 2013;15:400.
- Bulnes JF, González L, Velásquez L, Orellana MP, Venturelli PM, et al. Role of inflammation and evidence for the use of colchicine in patients with acute coronary syndrome. Front Cardiovasc Med. 2024 Jun 27;11:1356023. [CrossRef] [PubMed] [PubMed Central]
- Writing C, Lloyd-Jones DM, Morris PB, Ballantyne CM, Birtcher KK, Covington AM, DePalma SM, Minissian MB, Orringer CE, Smith SC Jr, et al. 2022 ACC Expert Consensus Decision Pathway on the Role of Nonstatin Therapies for LDL-Cholesterol Lowering in the Management of Atherosclerotic Cardiovascular Disease Risk: A Report of the American College of Cardiology Solution Set Oversight Committee. J Am Coll Cardiol. 2022;80:1366-1418.
- Duran EK, Aday AW, Cook NR, Buring JE, Ridker PM, Pradhan AD. Triglyceride-Rich Lipoprotein Cholesterol, Small Dense LDL Cholesterol, and Incident Cardiovascular Disease. J Am Coll Cardiol. 2020;75:2122-2135.
- Kosmas CE, Rodriguez Polanco S, Bousvarou MD, Papakonstantinou EJ, Peña Genao E, Guzman E, Kostara CE. The Triglyceride/High-Density Lipoprotein Cholesterol (TG/HDL-C) Ratio as a Risk Marker for Metabolic Syndrome and Cardiovascular Disease. Diagnostics (Basel). 2023 Mar 1;13(5):929. [CrossRef] [PubMed] [PubMed Central]
- Bergmark BA, Mathenge N, Merlini PA, Lawrence-Wright MB, Giugliano RP. Acute coronary syndromes. Lancet. 2022 Apr 2;399(10332):1347-1358. [CrossRef] [PubMed] [PubMed Central]
- Tani, S. The Ratio of Triglyceride to High-density Lipoprotein Cholesterol as an Indicator of Risk Stratification for Atherosclerotic Cardiovascular Disease in a Clinical Setting. Intern Med. 2020;59:2639-2640.
- Onea HL, Spinu M, Homorodean C, Ober MC, Olinic M, Lazar FL, Achim A, Tataru DA, Olinic DM. Superficial Calcified Plates Associated to Plaque Erosions in Acute Coronary Syndromes. Life (Basel). 2023 Aug 11;13(8):1732. [CrossRef] [PubMed] [PubMed Central]
- Jia H, Abtahian F, Aguirre AD, Lee S, Chia S, Lowe H, Kato K, Yonetsu T, Vergallo R, Hu S, Tian J, Lee H, Park SJ, Jang YS, Raffel OC, Mizuno K, Uemura S, Itoh T, Kakuta T, Choi SY, Dauerman HL, Prasad A, Toma C, McNulty I, Zhang S, Yu B, Fuster V, Narula J, Virmani R, Jang IK. In vivo diagnosis of plaque erosion and calcified nodules in patients with acute coronary syndrome by intravascular optical coherence tomography. J Am Coll Cardiol. 2013 Nov 5;62(19):1748-58. [CrossRef] [PubMed] [PubMed Central]
- Sugiyama T, Yamamoto E, Fracassi F, Lee H, Yonetsu T, Kakuta T, Soeda T, Saito Y, Yan BP, Kurihara O, Takano M, Niccoli G, Crea F, Higuma T, Kimura S, Minami Y, Ako J, Adriaenssens T, Boeder NF, Nef HM, Fujimoto JG, Fuster V, Finn AV, Falk E, Jang IK. Calcified Plaques in Patients With Acute Coronary Syndromes. JACC Cardiovasc Interv. 2019 Mar 25;12(6):531-540. [CrossRef] [PubMed]
- Alfonso F, Gonzalo N, Nuñez-Gil I, Bañuelos C. Coronary thrombosis from large, nonprotruding, superficial calcified coronary plaques. J Am Coll Cardiol. 2013;62:2254.
- Pogran E, Burger AL, Zweiker D, Kaufmann CC, Muthspiel M, Rega-Kaun G, Wenkstetten-Holub A, Wojta J, Drexel H, Huber K. Lipid-Lowering Therapy after Acute Coronary Syndrome. J Clin Med. 2024 Apr 1;13(7):2043. [CrossRef] [PubMed] [PubMed Central]
- Chen H, Chen X. PCSK9 inhibitors for acute coronary syndrome: the era of early implementation. Front Cardiovasc Med. 2023 May 2;10:1138787. [CrossRef] [PubMed] [PubMed Central]
- Kim N, Cho JM, Yang IH. Recurrent Acute Coronary Syndrome in Young Man with Familial Hypercholesterolemia: Efficacy of Evolocumab Add-On Treatment Demonstrated via Serial Coronary Angiography. Biomedicines. 2024 May 17;12(5):1113. [CrossRef] [PubMed] [PubMed Central]
- Lagace, TA. PCSK9 and LDLR Degradation. Curr Opin Lipidol. 2014;25:387-393.
- Cohen M, Visveswaran G. Defining and managing patients with non-ST-elevation myocardial infarction: Sorting through type 1 vs other types. Clin Cardiol. 2020 Mar;43(3):242-250. [CrossRef] [PubMed] [PubMed Central]
- Lee ZV, Lam H. Aggressive lipid-lowering therapy after percutaneous coronary intervention - for whom and how?: Aggressive lipid-lowering therapy after PCI. AsiaIntervention. 2022 Mar;8(1):24-31. [CrossRef] [PubMed] [PubMed Central]
- Wu G, Yu G, Zheng M, Peng W, Li L. Recent Advances for Dynamic-Based Therapy of Atherosclerosis. Int J Nanomedicine. 2023 Jul 13;18:3851-3878. [CrossRef] [PubMed] [PubMed Central]
- Chen X, Rong C, Qi P, Bai W, Yao W, Zhang Y, Dang Y. LDL-C and Total Stent Length are Independent Predictors of Periprocedural Myocardial Injury and Infarction for Unstable Angina Patients Undergoing Elective Percutaneous Coronary Intervention. Int J Gen Med. 2021 Apr 16;14:1357-1365. [CrossRef] [PubMed] [PubMed Central]
- Byrne RA, Rossello X, Coughlan JJ, Barbato E, Berry C, et al; ESC Scientific Document Group. 2023 ESC Guidelines for the management of acute coronary syndromes. Eur Heart J. 2023 Oct 12;44(38):3720-3826. doi: 10.1093/eurheartj/ehad191. Erratum in: Eur Heart J. 2024 Apr 1;45(13):1145. [CrossRef] [PubMed]
- Zhou S, Qiu M, Wang K, Li J, Li Y, Han Y. Triglyceride to high density lipoprotein cholesterol ratio and major adverse cardiovascular events in ACS patients undergoing PCI. Sci Rep. 2024 Dec 30;14(1):31752. [CrossRef] [PubMed] [PubMed Central]
- Koide Y, Miyoshi T, Nishihara T, Nakashima M, Ichikawa K, Miki T, et al. The Association of Triglyceride to High-Density Lipoprotein Cholesterol Ratio with High-Risk Coronary Plaque Characteristics Determined by CT Angiography and Its Risk of Coronary Heart Disease. J Cardiovasc Dev Dis. 2022 Sep 28;9(10):329. [CrossRef] [PubMed] [PubMed Central]
- Kosmas CE, Silverio D, Tsomidou C, Salcedo MD, Montan PD, Guzman E. The Impact of Insulin Resistance and Chronic Kidney Disease on Inflammation and Cardiovascular Disease. Clin Med Insights Endocrinol Diabetes. 2018;11:1179551418792257.
- Atamas SP, Chapoval SP, Keegan AD. Cytokines in chronic respiratory diseases. F1000 Biol Rep. 2013;5:3.
- Li Y, Deng S, Liu B, Yan Y, Du J, et al. The effects of lipid-lowering therapy on coronary plaque regression: a systematic review and meta-analysis. Sci Rep. 2021 Apr 12;11(1):7999. [CrossRef] [PubMed] [PubMed Central]
- Lin X, Huang J, Lin H, Chen P. Apelin-to-total cholesterol ratio predicts long-term major adverse cardiovascular events in ST-elevation myocardial infarction patients after primary percutaneous coronary intervention: a retrospective cohort analysis. BMC Cardiovasc Disord. 2025 Jul 4;25(1):478. [CrossRef] [PubMed] [PubMed Central]
- Dimitriadis K, Pyrpyris N, Iliakis P, Beneki E, Adamopoulou E, Papanikolaou A, Konstantinidis D, Fragkoulis C, Kollias A, Aznaouridis K, Tsioufis K. Proprotein Convertase Subtilisin/Kexin Type 9 Inhibitors in Patients Following Acute Coronary Syndromes: From Lipid Lowering and Plaque Stabilization to Improved Outcomes. J Clin Med. 2024 Aug 25;13(17):5040. [CrossRef] [PubMed] [PubMed Central]
- Wu TT, Gao Y, Zheng YY, Ma YT, Xie X. Atherogenic index of plasma (AIP): A novel predictive indicator for the coronary artery disease in postmenopausal women. Lipids Health Dis. 2018;17:197.
- Liu T, Liu J, Wu Z, Lv Y, Li W. Predictive value of the atherogenic index of plasma for chronic total occlusion before coronary angiography. Clin Cardiol. 2021;44:518-525.
- Bhardwaj S, Bhattacharjee J, Bhatnagar MK, Tyag S. Atherogenic index of plasma, Castelli risk index and atherogenic coefficient- new parameters in assessing cardiovascular risk. Int J Pharm Biol Sci. 2013;3:354-364.
- 33Mortensen MB, Dzaye O, Bøtker HE, Jensen JM, Maeng M, et al. Low-Density Lipoprotein Cholesterol Is Predominantly Associated With Atherosclerotic Cardiovascular Disease Events in Patients With Evidence of Coronary Atherosclerosis: The Western Denmark Heart Registry. Circulation. 2023 Apr 4;147(14):1053-1063. [CrossRef] [PubMed]
- Yu M, Yang Y, Dong SL, Zhao C, Yang F, et al. Effect of Colchicine on Coronary Plaque Stability in Acute Coronary Syndrome as Assessed by Optical Coherence Tomography: The COLOCT Randomized Clinical Trial. Circulation. 2024 Sep 24;150(13):981-993. [CrossRef] [PubMed]
- Priest VL, Scuffham PA, Hachamovitch R, Marwick TH. Cost-effectiveness of coronary computed tomography and cardiac stress imaging in the emergency department: a decision analytic model comparing diagnostic strategies for chest pain in patients at low risk of acute coronary syndromes. JACC Cardiovasc Imaging. 2011;4:549-56.
- Baron SJ, Korjian S, Gibson CM, Reynolds MR. Cost-Effectiveness of the CADScor System in Low-Risk Patients Presenting to the Emergency Department with Chest Pain. Pharmacoecon Open. 2025 Jun 23. Epub ahead of print. [CrossRef] [PubMed]
Figure 1.
Superior diagnostic performance of the TG/HDL-C ratio for coronary plaque burden assessment in first-time acute coronary syndrome. (A) TG/HDL-C ratio demonstrates a significant graded increase across coronary lesion burden categories in treatment-naïve first-time ACS patients (n=376). The ratio progressively increases from 3.3 ± 1.0 in patients with no critical lesions to 5.3 ± 1.8 in those with four or more lesions (p=0.01 for linear trend, ANOVA). Error bars represent standard deviation. (B) Comparative analysis of biomarker performance shows TG/HDL-C ratio achieving the strongest correlation with lesion count (r=0.32) compared to TC/HDL-C (r=0.25) and LDL-C (r=0.15).
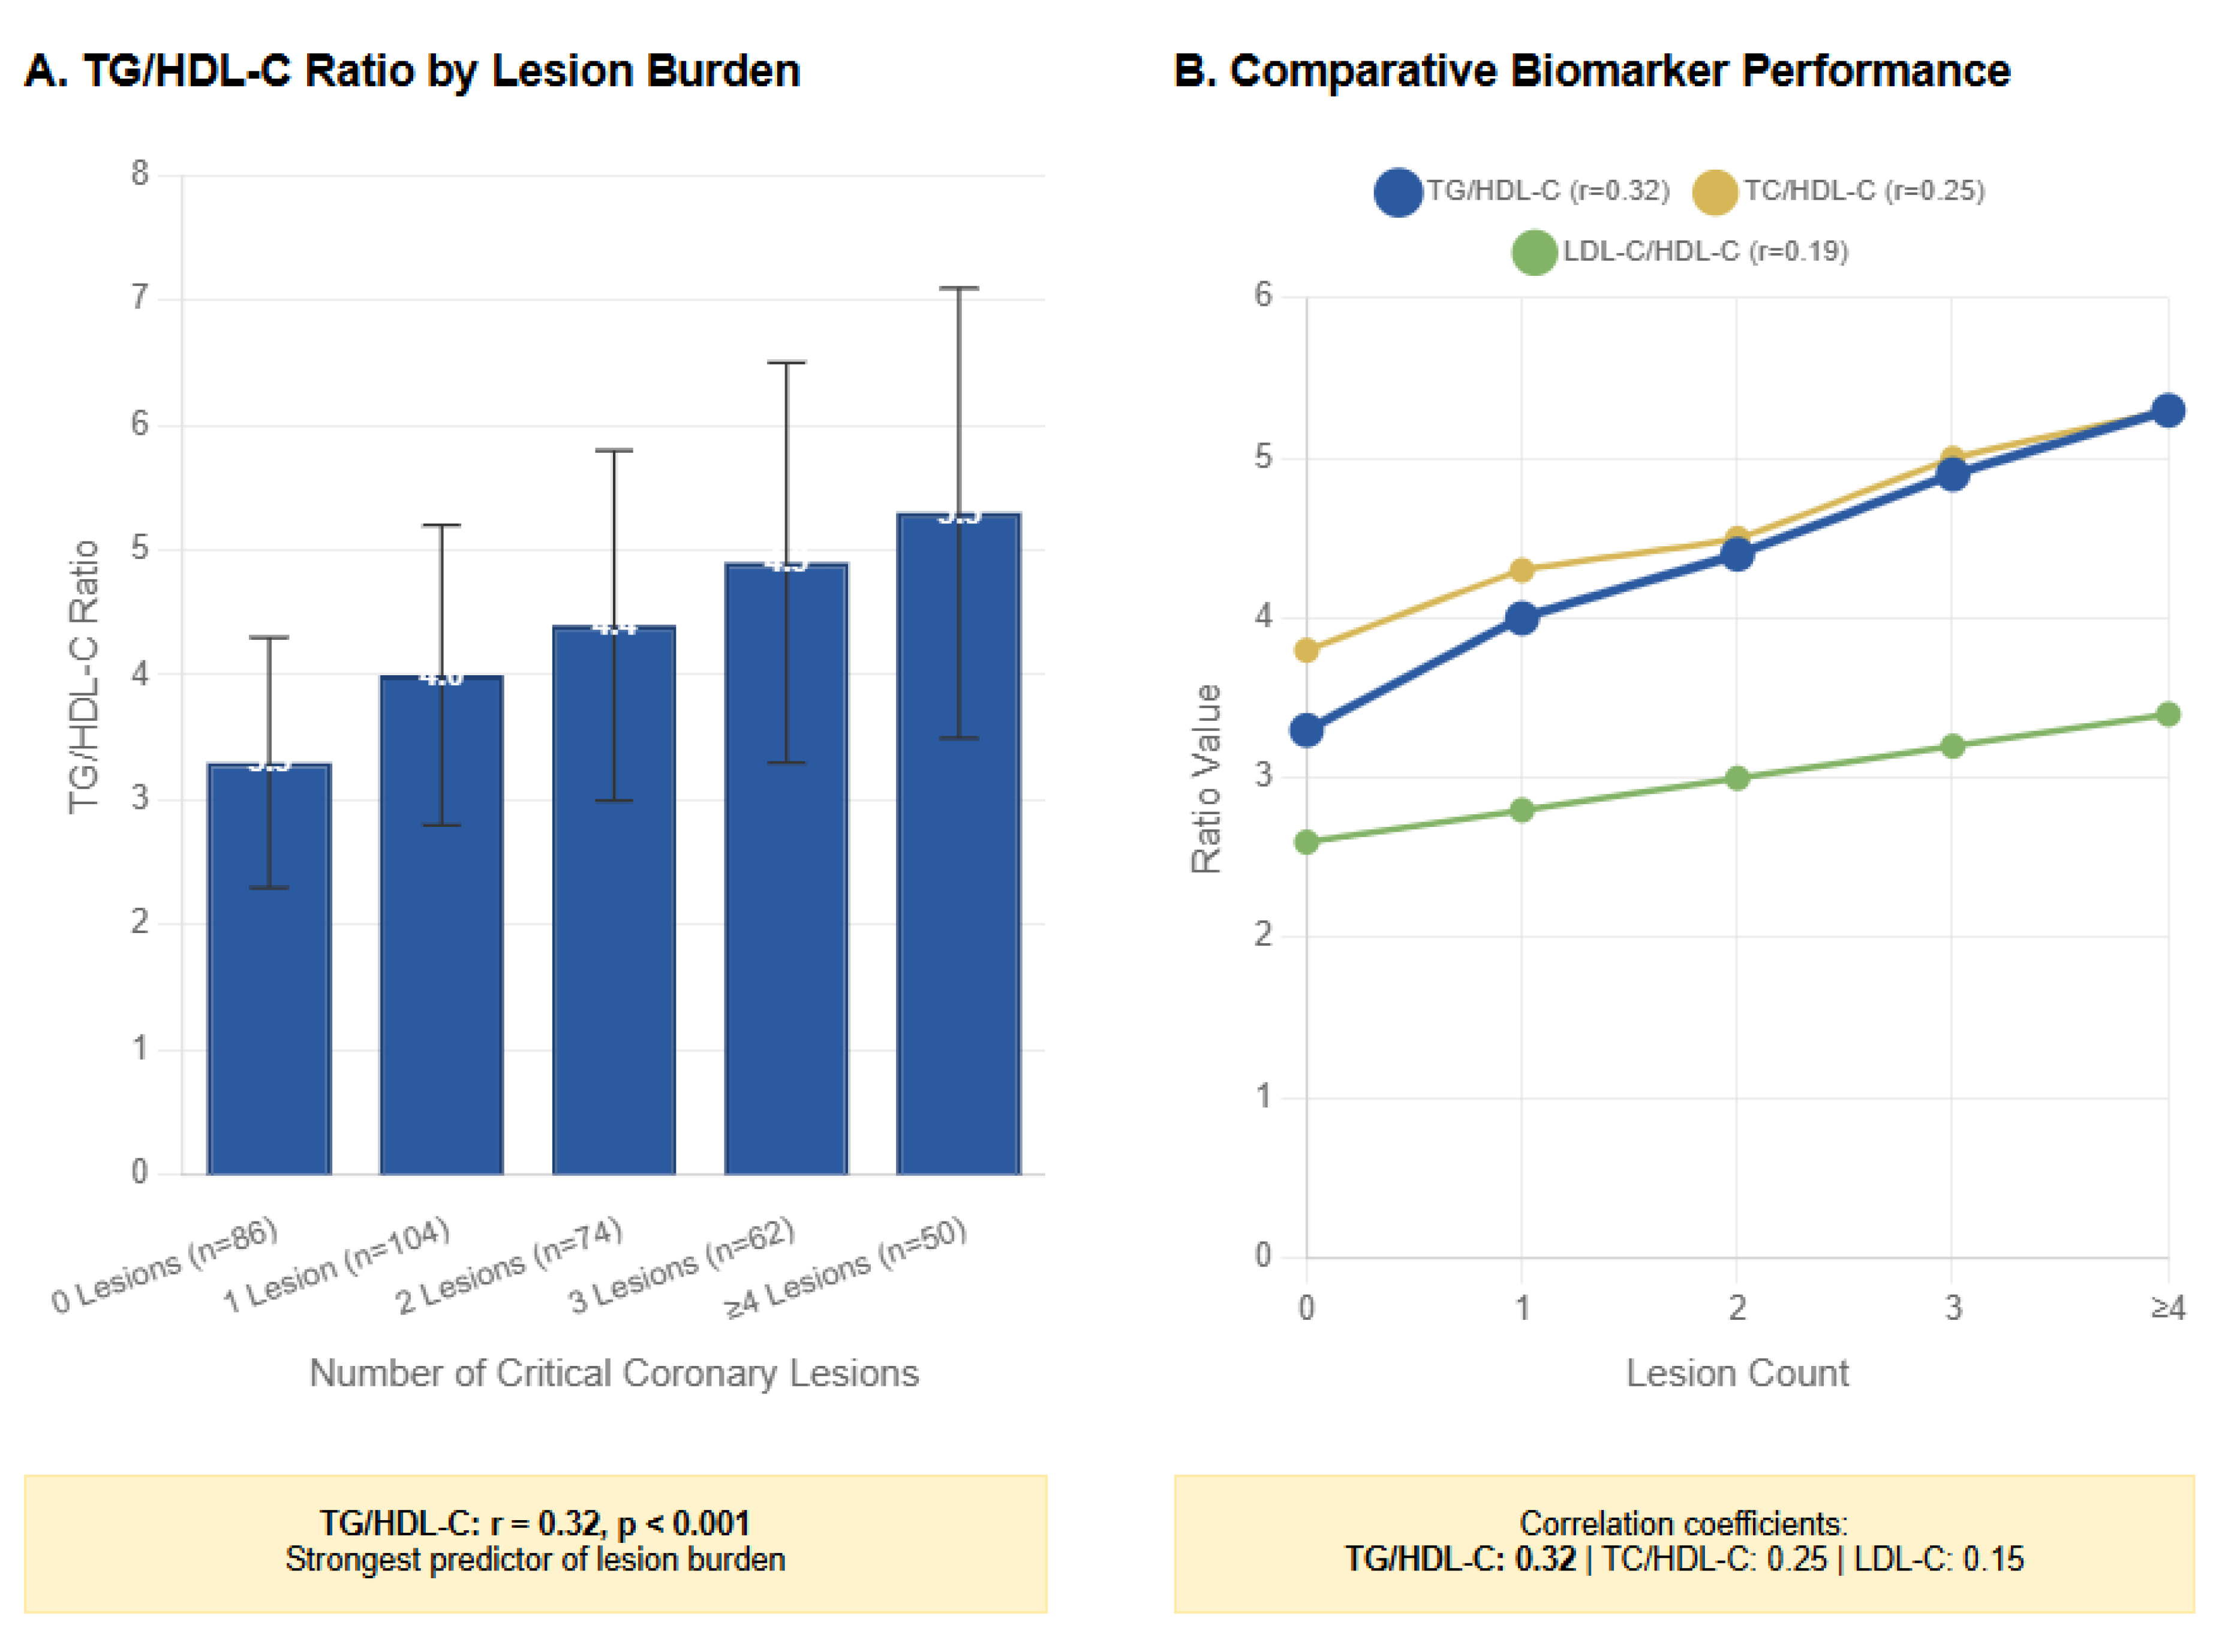
Figure 2.
Proposed Diagnostic Pathway for ACS Using TG/HDL-C Ratio.
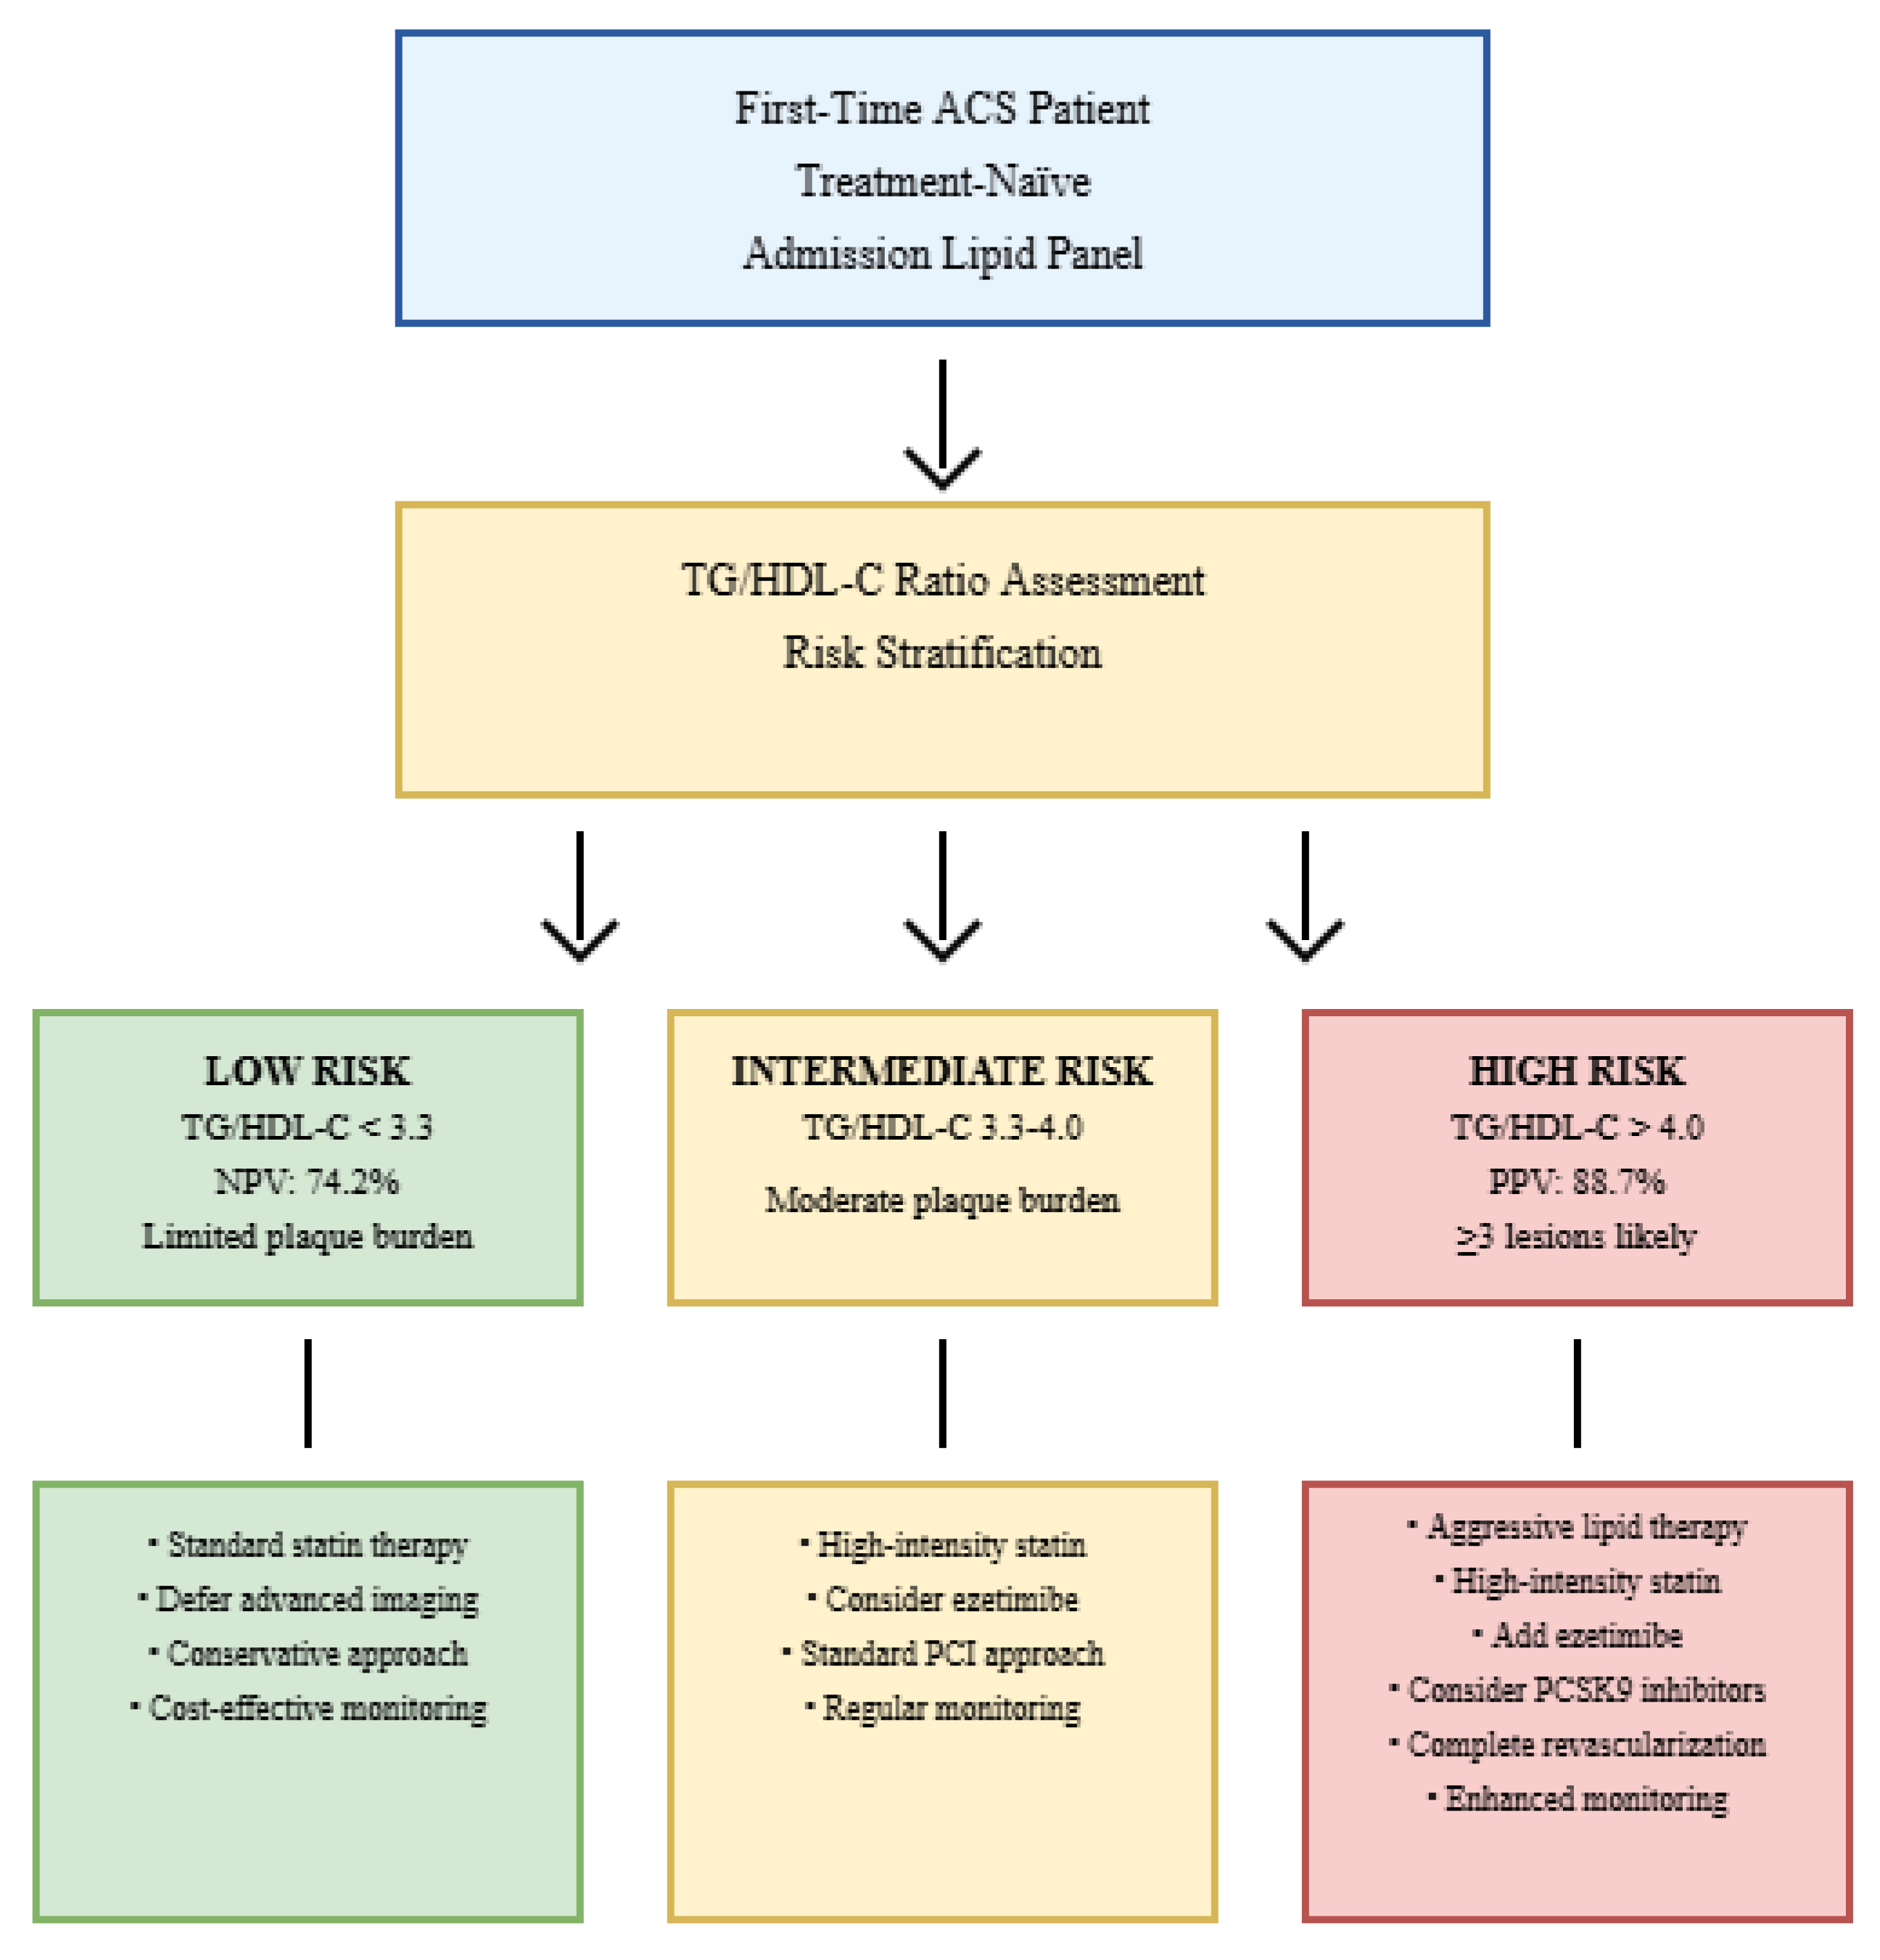

Table 1.
Baseline Characteristics by Lesion Burden Group.
| Variable | 0 Lesions (n=86) | 1 Lesion (n=104) | 2 Lesions (n=74) | 3 Lesions (n=62) | ≥4 Lesions (n=50) | p-value* |
|---|---|---|---|---|---|---|
| Diagnostic Cohort | ||||||
| Age (years) | 62.1 ± 9.8 | 64.3 ± 10.2 | 65.8 ± 9.7 | 66.2 ± 10.5 | 67.5 ± 9.9 | 0.12 |
| Male sex, n (%) | 60 (69.8) | 75 (72.1) | 50 (67.6) | 40 (64.5) | 30 (60.0) | 0.45 |
| Cardiovascular Risk | ||||||
| Hypertension, n (%) | 50 (58.1) | 60 (57.7) | 45 (60.8) | 35 (56.5) | 25 (50.0) | 0.67 |
| Diabetes, n (%) | 30 (34.9) | 40 (38.5) | 25 (33.8) | 20 (32.3) | 15 (30.0) | 0.89 |
| Current smoking, n (%) | 40 (46.5) | 50 (48.1) | 35 (47.3) | 30 (48.4) | 20 (40.0) | 0.75 |
| ACS Presentation | ||||||
| STEMI, n (%) | 54 (62.8) | 62 (59.6) | 48 (64.9) | 41 (66.1) | 35 (70.0) | 0.75 |
| NSTEMI, n (%) | 30 (34.9) | 40 (38.5) | 25 (33.8) | 20 (32.3) | 15 (30.0) | 0.85 |
| Unstable angina, n (%) | 2 (2.3) | 2 (1.9) | 1 (1.4) | 1 (1.6) | 0 (0.0) | 0.80 |
*Data presented as mean ± SD for continuous variables and n (%) for categorical variables. *p-value for trend (ANOVA for continuous variables, Chi-square for categorical variables).
Table 2.
Diagnostic Performance of Lipid Biomarkers Across Lesion Groups. (Highlighting graded relationship and diagnostic superiority).
Table 2.
Diagnostic Performance of Lipid Biomarkers Across Lesion Groups. (Highlighting graded relationship and diagnostic superiority).
| Lipid Biomarker (mg/dL) | 0 Lesions (n=86) | 1 Lesion (n=104) | 2 Lesions (n=74) | 3 Lesions (n=62) | ≥4 Lesions (n=50) | p-value* | Correlation (r) |
|---|---|---|---|---|---|---|---|
| LDL-C | 110.0 ± 25.0 | 115.0 ± 30.0 | 120.0 ± 35.0 | 125.0 ± 40.0 | 130.0 ± 45.0 | 0.03 | 0.15 |
| HDL-C | 42.0 ± 8.0 | 41.0 ± 7.0 | 40.0 ± 9.0 | 39.0 ± 8.0 | 38.0 ± 7.0 | 0.25 | -0.12 |
| Triglycerides | 140.0 ± 50.0 | 160.0 ± 60.0 | 175.0 ± 65.0 | 190.0 ± 70.0 | 200.0 ± 80.0 | 0.20 | 0.18 |
| Lipid Ratios | |||||||
| LDL-C/HDL-C | 2.6 ± 0.7 | 2.8 ± 0.8 | 3.0 ± 0.9 | 3.2 ± 1.0 | 3.4 ± 1.1 | 0.04 | 0.19 |
| TC/HDL-C | 3.8 ± 0.9 | 4.3 ± 1.0 | 4.5 ± 1.1 | 5.0 ± 1.2 | 5.3 ± 1.3 | 0.02 | 0.25 |
| TG/HDL-C | 3.3 ± 1.0 | 4.0 ± 1.2 | 4.4 ± 1.4 | 4.9 ± 1.6 | 5.3 ± 1.8 | 0.01 | 0.32 |
*Data presented as mean ± SD. *p-value for trend (ANOVA). Bolded values indicate statistically significant associations. *TG/HDL-C ratio shows the strongest correlation with lesion burden (r=0.32, p<0.001).
Table 3.
Diagnostic Accuracy of TG/HDL-C Thresholds for Identifying High Plaque Burden.
| TG/HDL-C Threshold | Sensitivity (%) | Specificity (%) | PPV (%) | NPV (%) | AUC (95% CI) | Optimal Use Case |
|---|---|---|---|---|---|---|
| >3.0 | 82.1 | 65.3 | 71.4 | 77.8 | 0.68 (0.61–0.75) | Rule out low burden |
| >3.3 | 76.5 | 76.8 | 78.9 | 74.2 | 0.71 (0.64–0.78) | Low-risk identification |
| >3.7 | 70.3 | 81.2 | 82.1 | 69.0 | 0.73 (0.66–0.80) | Intermediate-risk screening |
| >4.0 | 68.4 | 89.5 | 88.7 | 70.1 | 0.72 (0.65–0.79) | High-risk identification |
| >4.5 | 52.1 | 93.7 | 91.3 | 61.2 | 0.70 (0.63–0.77) | Confirmatory testing |
*PPV = Positive Predictive Value; NPV = Negative Predictive Value; AUC = Area Under Curve.
Table 4.
Multivariable Diagnostic Model for Predicting Critical Lesion Burden.
| Predictor | β-coefficient | Standard Error | p-value | Diagnostic Odds Ratio (95% CI) | Contribution to Model |
|---|---|---|---|---|---|
| TG/HDL-C | 0.18 | 0.05 | 0.02 | 1.20 (1.07–1.34) | 42% |
| LDL-C | 0.14 | 0.07 | 0.04 | 1.15 (1.01–1.31) | 33% |
| Age | 0.09 | 0.06 | 0.11 | 1.09 (0.98–1.22) | 12% |
| Male sex | 0.11 | 0.13 | 0.09 | 1.12 (0.87–1.44) | 8% |
| Diabetes | 0.13 | 0.14 | 0.09 | 1.14 (0.87–1.49) | 5% |
| Hypertension | 0.08 | 0.12 | 0.15 | 1.08 (0.86–1.36) | 2% |
| Current smoking | 0.10 | 0.11 | 0.08 | 1.11 (0.89–1.38) | 3% |
*Dependent variable: Number of critical coronary lesions. Bolded values indicate statistically significant predictors. Model adjusted for all covariates. TG/HDL-C contributes 42% to predictive power vs. 33% for LDL-C. Diagnostic Odds Ratio (DOR) >1 indicates an increased likelihood of higher lesion burden.
Disclaimer/Publisher’s Note: The statements, opinions and data contained in all publications are solely those of the individual author(s) and contributor(s) and not of MDPI and/or the editor(s). MDPI and/or the editor(s) disclaim responsibility for any injury to people or property resulting from any ideas, methods, instructions or products referred to in the content. |
© 2025 by the authors. Licensee MDPI, Basel, Switzerland. This article is an open access article distributed under the terms and conditions of the Creative Commons Attribution (CC BY) license (http://creativecommons.org/licenses/by/4.0/).
Copyright: This open access article is published under a Creative Commons CC BY 4.0 license, which permit the free download, distribution, and reuse, provided that the author and preprint are cited in any reuse.


