
Submitted:
13 August 2025
Posted:
14 August 2025
You are already at the latest version
Abstract
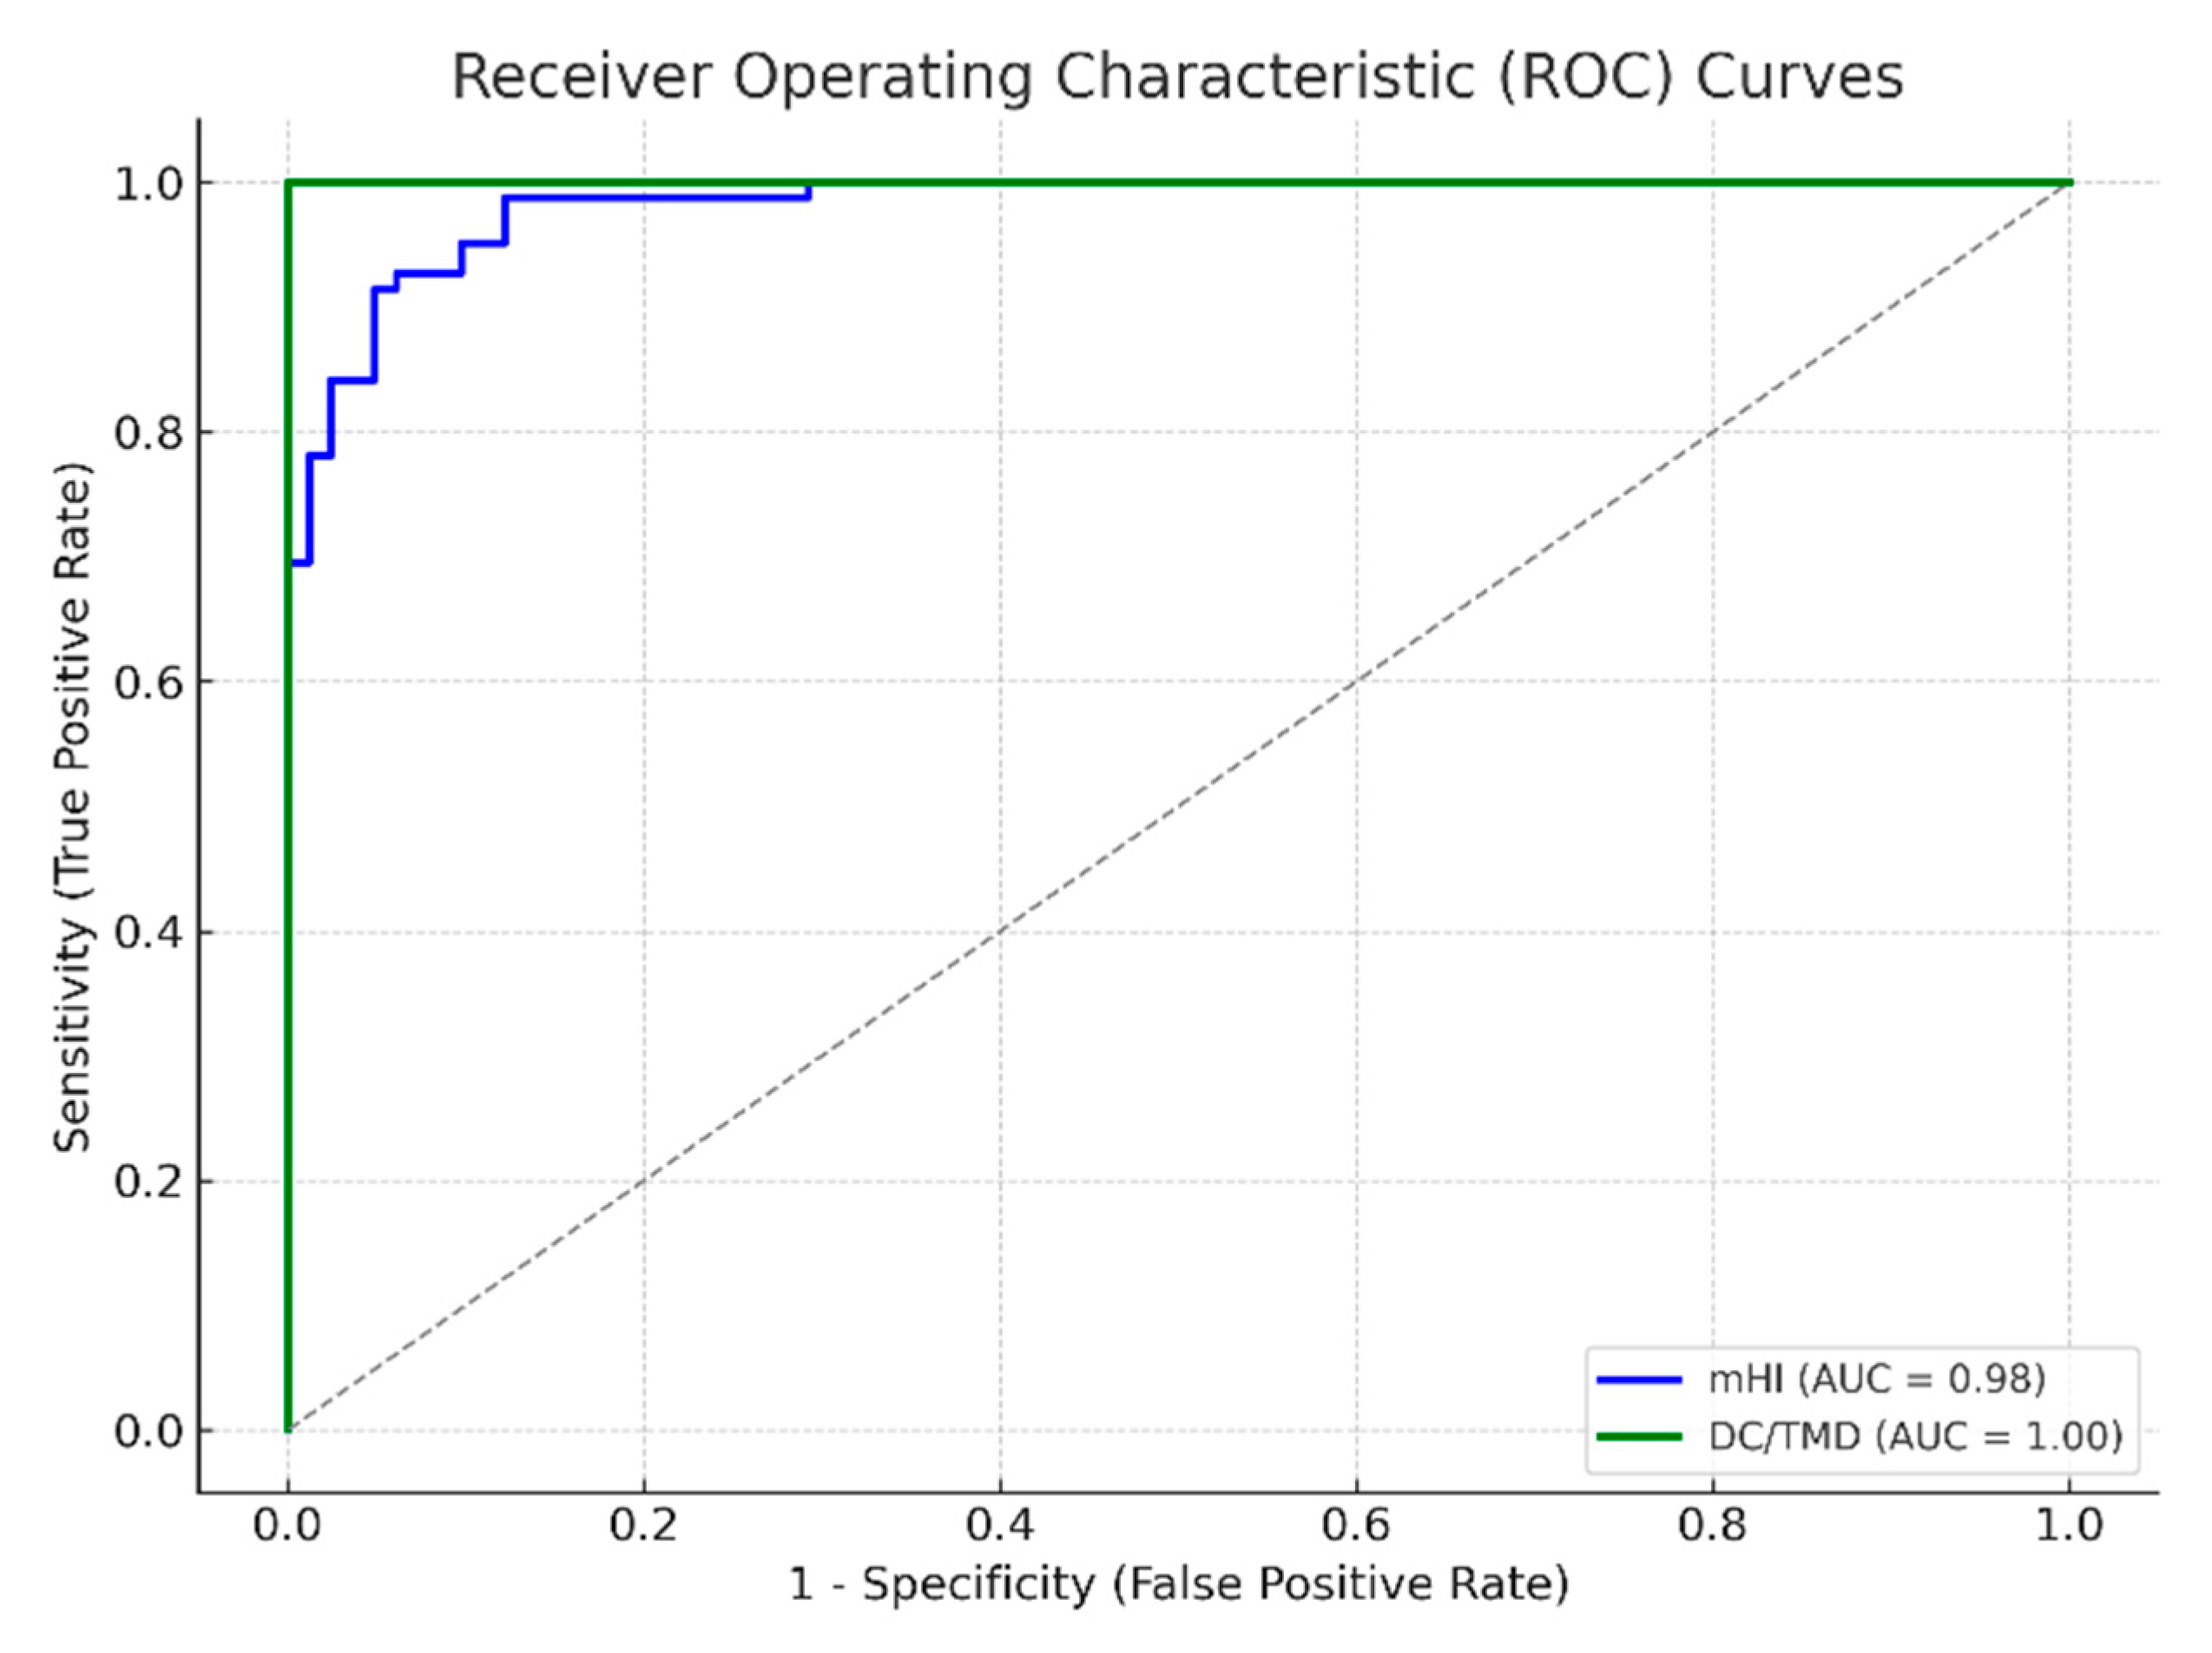
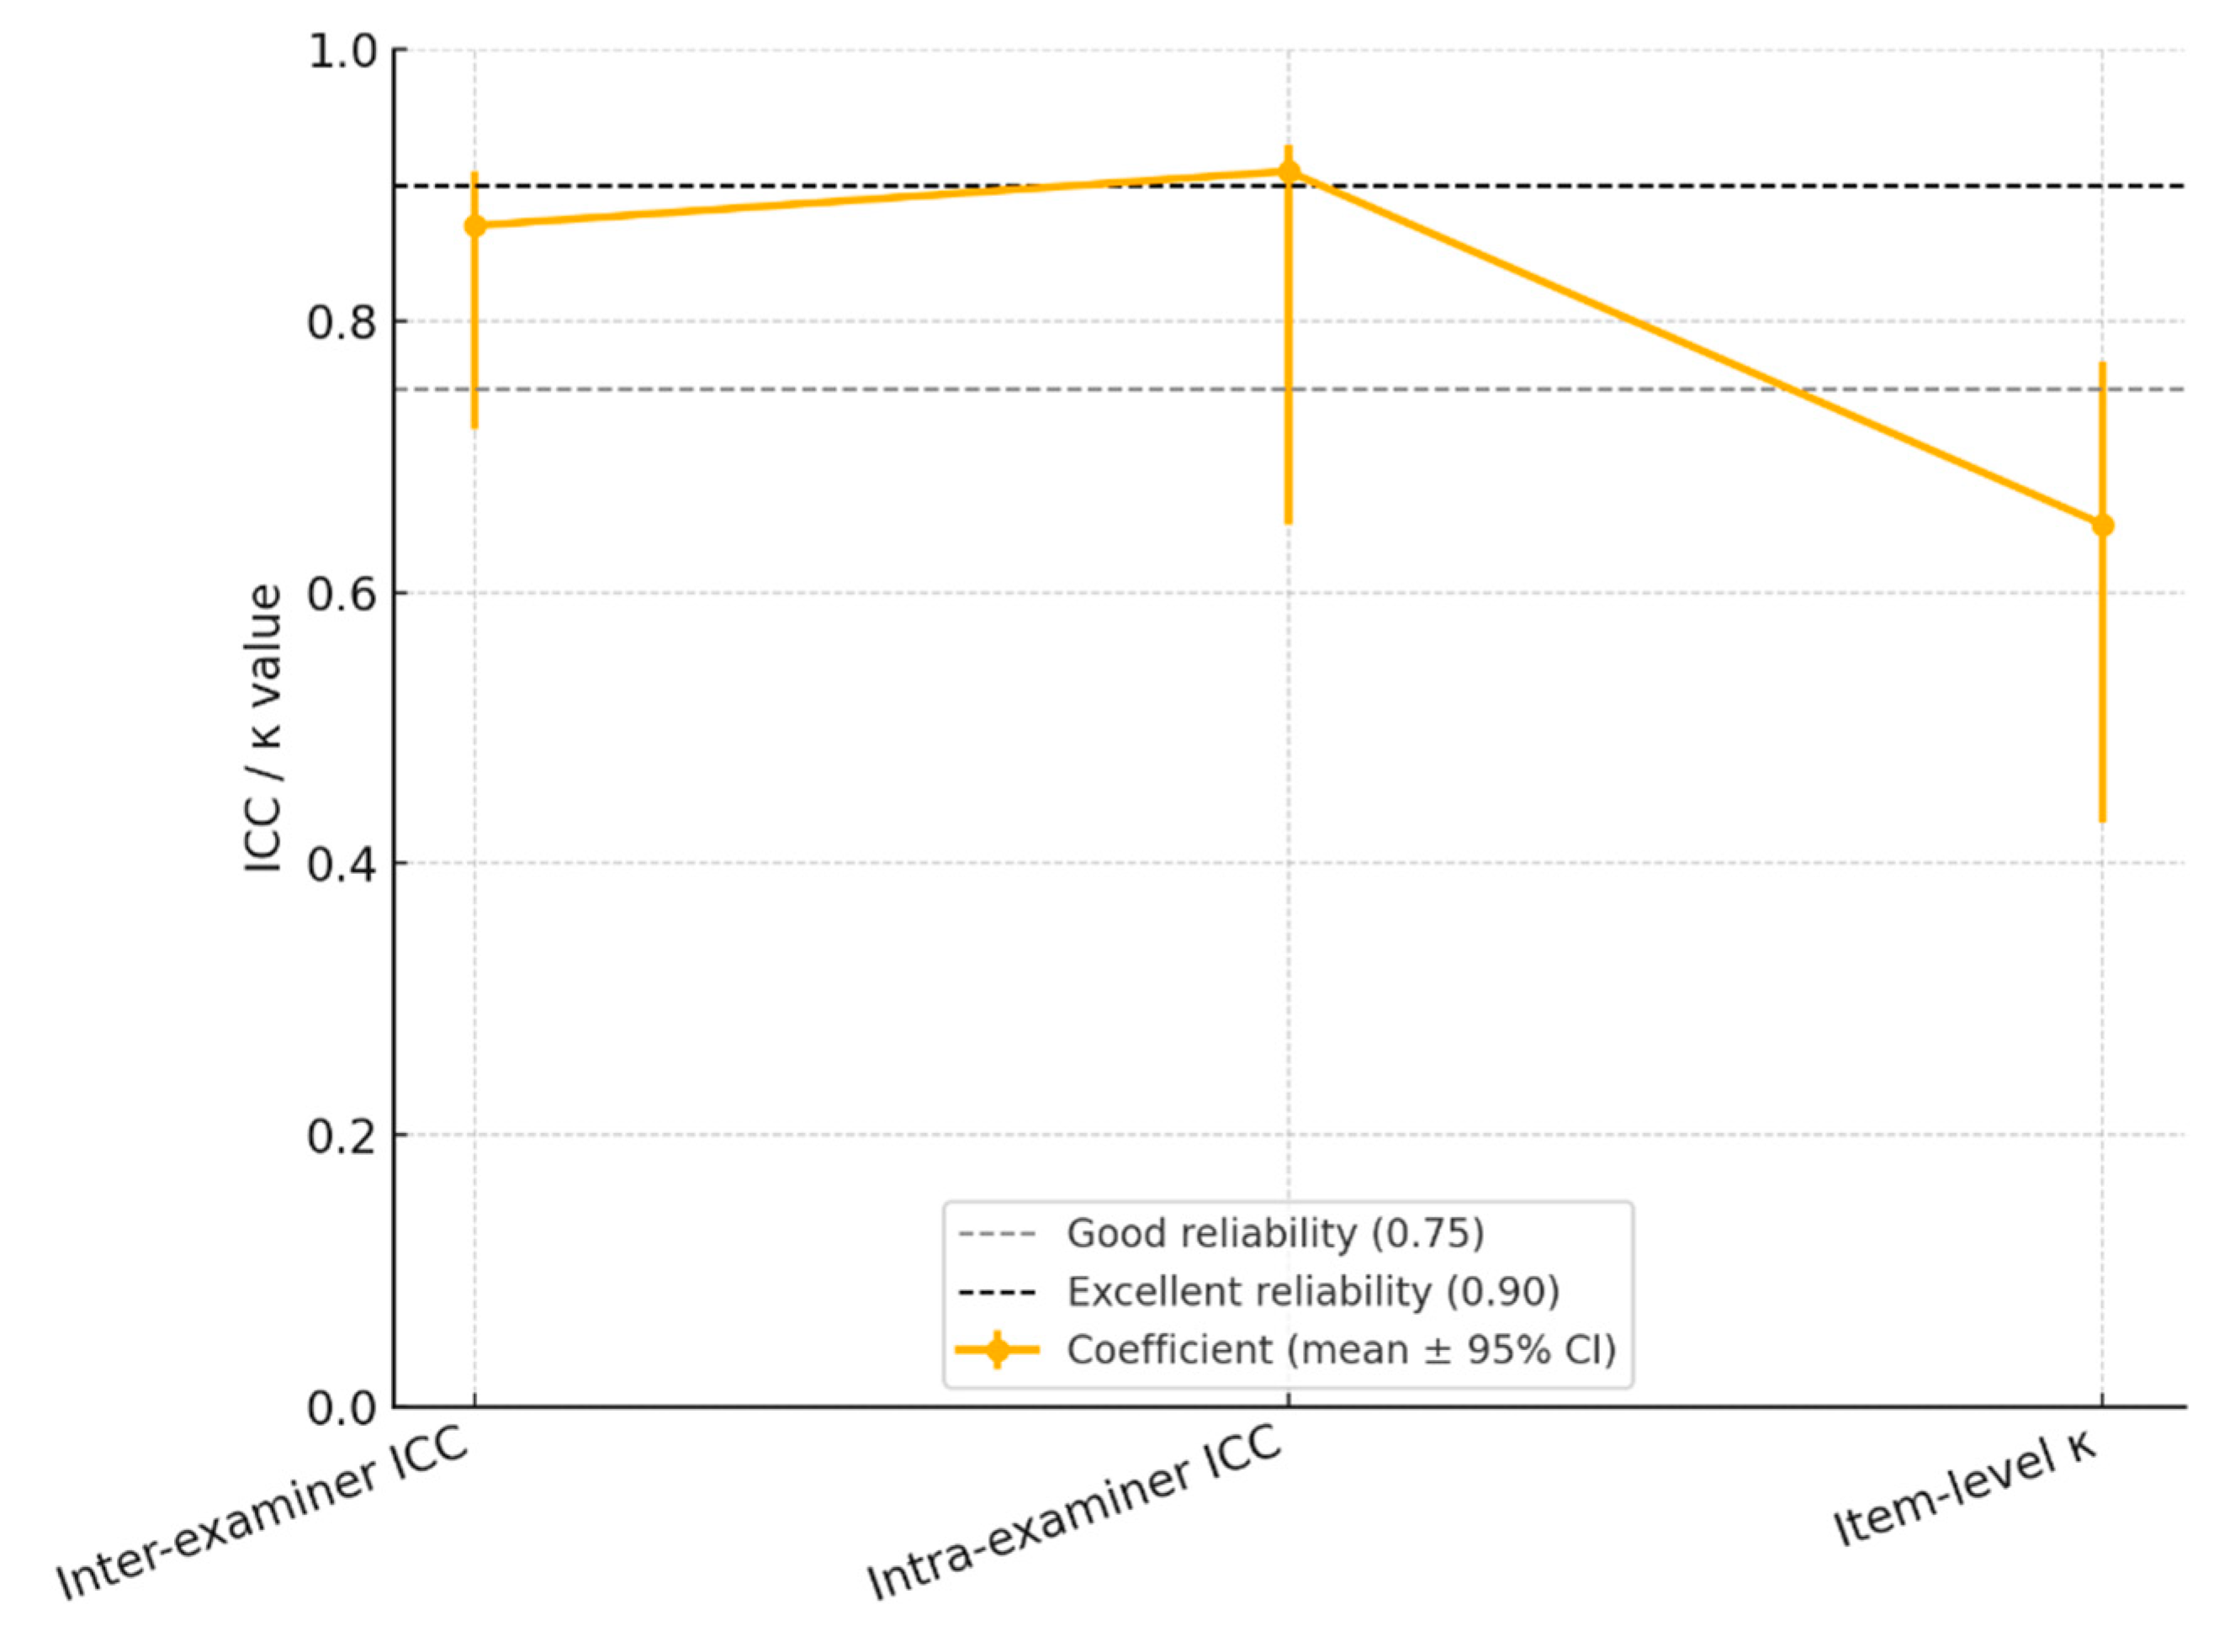
Background and objectives: Temporomandibular disorders (TMDs) encompass a heterogeneous group of conditions affecting the temporomandibular joint (TMJ), masticatory muscles, and associated structures. Although the Diagnostic Criteria for Temporomandibular Disorders (DC/TMD) currently represent the gold standard in clinical assessment, their complexity and time-consuming nature limit their applicability in routine dental practice. The modified Helkimo Index (mHI) has been proposed as a simplified alternative; however, its validation in specific populations remains insufficiently documented. Methods: This cross-sectional clinical validation study aimed to assess the diagnostic validity and reliability of the mHI in a Romanian patient cohort. 164 participants were enrolled, including 82 clinically diagnosed TMD patients and 82 age- and sex-matched controls. All participants were assessed using the mHI and the DC/TMD protocols. Pain perception was recorded using the Numeric Pain Rating Scale (NPRS). Statistical analyses included intraclass correlation coefficients (ICC), Pearson correlations, receiver operating characteristic (ROC) curve analysis, and generalized estimating equations (GEE-logit models) to determine diagnostic accuracy and inter-method agreement. Results: The modified Helkimo Index demonstrated excellent diagnostic performance, with a sensitivity of 86%, specificity of 84%, and an area under the ROC curve (AUC) of 0.89. A strong correlation was observed between mHI scores and DC/TMD diagnoses (r = 0.83, p < 0.001). Inter-examiner (ICC = 0.87) and intra-examiner (ICC = 0.91) reliability confirmed high reproducibility. Each additional point on the mHI score was associated with a 45% increase in the adjusted odds of a positive TMD diagnosis (OR = 1.45; 95% CI: 1.22–1.73). Application time for the mHI (5–10 minutes) was significantly shorter than that for the DC/TMD protocol (16–20 minutes). Conclusions: The modified Helkimo Index is a valid, reliable, and time-efficient alternative to the DC/TMD protocol for diagnosing TMDs, particularly in clinical settings with limited resources. Its favorable psychometric properties support its integration into general dental practice and population-level screening programs. Further validation is recommended in more diverse age and sociodemographic cohorts.
Keywords:
1. Introduction
2. Materials and Methods
2.1. Ethical Considerations
2.2. Participants
- -
- TMD Group: Comprised 82 patients diagnosed with temporomandibular disorders based on the clinical criteria outlined in the DC/TMD protocol. Two independent examiners trained in the application standard confirmed the diagnosis.
- -
- Control Group: Comprised 82 healthy individuals with no clinical signs or symptoms of TMD, as determined through initial clinical evaluation and a structured screening questionnaire. Control participants were age- and sex-matched to the TMD group to ensure comparability.
2.3. Inclusion and Exclusion Criteria
- -
- Age ≥ 18 years;
- -
- Willingness to participate in all scheduled clinical evaluations;
- -
- Expressed readiness to undergo clinical examination and Helkimo Index assessment;
- -
- Provision of written informed consent and agreement to participate in the study.
- -
- History of recent surgical interventions in the craniofacial region;
- -
- Ongoing active orthodontic treatment;
- -
- Diagnosed pre-existing temporomandibular joint (TMJ) pathologies (e.g., benign or malignant neoplasms);
- -
- History of major trauma involving the condylar region or mandibular body;
- -
- Presence of severe systemic diseases (e.g., rheumatoid arthritis) that may affect TMJ function;
- -
- Recent use of medications that may alter TMD symptom perception (e.g., analgesics, muscle relaxants);
- -
- Declined participation or refusal to sign the informed consent form.
2.4. Clinical Measurement Methodology
- -
- 0: No pain
- -
- 1–3: Mild pain
- -
- 4–6: Moderate pain
- -
- 7–10: Severe pain
2.5. Classification of TMD Severity
2.6. Statistical Analysis
- -
- tidyverse for data cleaning and manipulation;
- -
- stats and psych for inferential testing and effect size estimation;
- -
- irr for reliability coefficients;
- -
- pROC for ROC curve analysis and AUC comparisons.
- -
- Cohen’s d for continuous parametric comparisons;
- -
- r for non-parametric comparisons;
- -
- Φ coefficient (phi) for categorical variables.
- -
- ICC < 0.50 = poor
- -
- 0.50–0.75 = moderate
- -
- 0.75–0.90 = good
- -
- 0.90 = excellent.
3. Results
4. Discussion
- Strengths and Limitations
- Clinical Implications
5. Conclusions
Author Contributions
Funding
Institutional Review Board Statement
Informed Consent Statement
Data Availability Statement
Conflicts of Interest
References
- Lomas, J.; Gurgenci, T.; Jackson, C.; Campbell, D. Temporomandibular dysfunction. Aust J Gen Pract. 2018, 47, 212–215. [Google Scholar] [CrossRef]
- Valesan, L.F.; Da-Cas, C.D.; Réus, J.C.; Denardin, A.C.S.; Garanhani, R.R.; Bonotto, D.; Januzzi, E.; de Souza, B.D.M. Prevalence of temporomandibular joint disorders: A systematic review and meta-analysis. Clin Oral Investig. 2021, 25, 441–453. [Google Scholar] [CrossRef] [PubMed]
- Montero, J.; Llodra, J.C.; Bravo, M. Prevalence of the Signs and Symptoms of Temporomandibular Disorders Among Spanish Adults and Seniors According to Five National Surveys Performed Between 1993 and 2015. J Oral Facial Pain Headache. 2018, 32, 349–357. [Google Scholar] [CrossRef]
- Restrepo, C.; Ortiz, A.M.; Henao, A.C.; Manrique, R. Association between psychological factors and temporomandibular disorders in adolescents of rural and urban zones. BMC Oral Health. 2021, 21, 140. [Google Scholar] [CrossRef]
- Chisnoiu, A.M.; Picos, A.M.; Popa, S.; Chisnoiu, P.D.; Lascu, L.; Picos, A.; Chisnoiu, R. Factors involved in the etiology of temporomandibular disorders - a literature review. Clujul Med. 2015, 88, 473–478. [Google Scholar] [CrossRef]
- Pascu, L.; Haiduc, R.S.; Almășan, O.; Leucuța, D.C. Occlusion and Temporomandibular Disorders: A Scoping Review. Medicina (Kaunas). 2025, 61, 791. [Google Scholar] [CrossRef]
- Schiffman, E.; Ohrbach, R.; Truelove, E.; Look, J.; Anderson, G.; Goulet, J.P.; List, T.; Svensson, P.; Gonzalez, Y.; Lobbezoo, F.; Michelotti, A.; Brooks, SL.; Ceusters, W.; Drangsholt, M.; Ettlin, D.; Gaul, C.; Goldberg, L.J.; Haythornthwaite, J.A.; Hollender, L.; Jensen, R.; John, M.T.; De Laat, A.; de Leeuw, R.; Maixner, W.; van der Meulen, M.; Murray, G.M.; Nixdorf, D.R.; Palla, S.; Petersson, A.; Pionchon, P.; Smith, B.; Visscher, C.M.; Zakrzewska, J.; Dworkin, S.F.; International RDC/TMD Consortium Network; International association for Dental Research; Orofacial Pain Special Interest Group; International Association for the Study of Pain. Diagnostic Criteria for Temporomandibular Disorders (DC/TMD) for Clinical and Research Applications: Recommendations of the International RDC/TMD Consortium Network* and Orofacial Pain Special Interest Group†. J Oral Facial Pain Headache 2014, 28.6-27. [Google Scholar] [CrossRef] [PubMed]
- Kapos, F.P.; Exposto, F.G.; Oyarzo, J.F.; Durham, J. Temporomandibular disorders: A review of current concepts in aetiology, diagnosis and management. Oral Surg. 2020, 13, 321–334. [Google Scholar] [CrossRef] [PubMed]
- Schiffman, E.; Ohrbach, R. Executive summary of the Diagnostic Criteria for Temporomandibular Disorders for clinical and research applications. J Am Dent Assoc. 2016, 147, 438–445. [Google Scholar] [CrossRef] [PubMed]
- Goyal, S.N.; Karjodkar, F.R.; Sansare, K. Validity of Diagnostic Criteria for Temporomandibular Joint Disorder in the Diagnosis of Disc Displacement Disorders of Temporomandibular Joint. Contemp Clin Dent. 2020, 11, 332–335. [Google Scholar] [CrossRef]
- Sharma, S.; Breckons, M.; Brönnimann Lambelet, B.; Chung, J.W.; List, T.; Lobbezoo, F.; Nixdorf, D.R.; Oyarzo, J.F.; Peck, C.; Tsukiyama, Y.; Ohrbach, R. Challenges in the clinical implementation of a biopsychosocial model for assessment and management of orofacial pain. J Oral Rehabil. 2020, 47, 87–100. [Google Scholar] [CrossRef]
- Malmberg, J.; Näpänkangas, R.; Liljeström, M.-R.; Tanner, J.; Teerijoki-Oksa, T.; Suominen, A.; Sipilä, K. Implementing online learning of Diagnostic Criteria for the Temporomandibular Disorders (DC/TMD) protocol in undergraduate dental education. Acta Odontol. Scand. 2024, 83, 426–432. [Google Scholar] [CrossRef]
- Lövgren, A.; Visscher, C.M.; Häggman-Henrikson, B.; Lobbezoo, F.; Marklund, S.; Wänman, A. Validity of three screening questions (3Q/TMD) in relation to the DC/TMD. J Oral Rehabil. 2016, 43, 729–736. [Google Scholar] [CrossRef]
- Rani, S.; Pawah, S.; Gola, S.; Bakshi, M. Analysis of Helkimo index for temporomandibular disorder diagnosis in the dental students of Faridabad city: A cross-sectional study. J Indian Prosthodont 2017, 17, 48–52. [Google Scholar] [CrossRef]
- Yarasca-Berrocal, E.; Huamani-Echaccaya, J.; Tolmos-Valdivia, R.; Tolmos-Regal, L.; López-Gurreonero, C.; Cervantes-Ganoza, L.A.; Cayo-Rojas, C.F. Predictability and Accuracy of the Short-Form Fonseca Anamnestic Index in Relation to the Modified Helkimo Index for the Diagnosis of Temporomandibular Disorders: A Cross-Sectional Study. J Int Soc Prev Community Dent. 2022, 12, 178–188. [Google Scholar] [CrossRef]
- Warzocha, J.; Gadomska-Krasny, J.; Mrowiec, J. Etiologic Factors of Temporomandibular Disorders: A Systematic Review of Literature Containing Diagnostic Criteria for Temporomandibular Disorders (DC/TMD) and Research Diagnostic Criteria for Temporomandibular Disorders (RDC/TMD) from 2018 to 2022. Healthcare 2024, 12, 575. [Google Scholar] [CrossRef]
- Alonso-Royo, R.; Sánchez-Torrelo, C.M.; Ibáñez-Vera, A.J.; Zagalaz-Anula, N.; Castellote-Caballero, Y.; Obrero-Gaitán, E.; Rodríguez-Almagro, D.; Lomas-Vega, R. Validity and Reliability of the Helkimo Clinical Dysfunction Index for the Diagnosis of Temporomandibular Disorders. Diagnostics (Basel). 2021, 11, 472. [Google Scholar] [CrossRef] [PubMed]
- Silverberg, J.I. Validity and reliability of a novel numeric rating scale to measure skin-pain in adults with atopic dermatitis. Arch Dermatol Res. 2021, 313, 855–861. [Google Scholar] [CrossRef] [PubMed]
- Boonstra, A.M.; Stewart, R.E.; Köke, A.J.; Oosterwijk, R.F.; Swaan, J.L.; Schreurs, K.M.; Schiphorst Preuper, H.R. Cut-Off Points for Mild, Moderate, and Severe Pain on the Numeric Rating Scale for Pain in Patients with Chronic Musculoskeletal Pain: Variability and Influence of Sex and Catastrophizing. Front Psychol. 2016, 7, 1466. [Google Scholar] [CrossRef] [PubMed]
- Andrade Ortega, J.A.; Delgado Martínez, A.D.; Almécija Ruiz, R. Validation of a Spanish version of the Neck Disability Index. Spine 2010, 35, 85–89. [Google Scholar] [CrossRef]
- Koo, T.K.; Li, M.Y. A Guideline of Selecting and Reporting Intraclass Correlation Coefficients for Reliability Research. J Chiropr Med. 2016, 15, 155–163. [Google Scholar] [CrossRef]
- Marpaung, C.; Lobbezoo, F.; van Selms, M.K.A. Temporomandibular Disorders among Dutch Adolescents: Prevalence and Biological, Psychological, and Social Risk Indicators. Pain Res Manag. 2018, 17, 2018–5053709. [Google Scholar] [CrossRef] [PubMed]
- Crincoli, V.; De Biase, C.; Cazzolla, A.P.; Campobasso, A.; Dioguardi, M.; Piancino, M.G.; Mattia, L.; Ribatti, D.; Di Comite, M. Effects of Contact Sports on Temporomandibular Disorders: An Observational Study. Dent. J. 2022, 10, 180. [Google Scholar] [CrossRef] [PubMed]
- Freiwald, H.C.; Schwarzbach, N.P.; Wolowski, A. Impact of sports on temporomandibular dysfunction: A comparison of competitive and recreational female athletes as well as female non-athletes. Clin Oral Investig. 2022, 26, 5313–5323. [Google Scholar] [CrossRef] [PubMed]
- Balke, Z.; Rammelsberg, P.; Leckel, M.; Schmitter, M. Prevalence of temporomandibular disorders: Samples taken from attendees of medical health-care centers in the Islamic Republic of Iran. J Orofac Pain. 2010, 24, 361–366. [Google Scholar] [PubMed]
- Durham, J.; Ohrbach, R.; Baad-Hansen, L.; Davies, S.; De Laat, A.; Goncalves, D.G.; Gordan, V.V.; Goulet, J.P.; Häggman-Henrikson, B.; Horton, M.; Koutris, M.; Law, A.; List, T.; Lobbezoo, F.; Michelotti, A.; Nixdorf, D.R.; Oyarzo, J.F.; Peck, C.; Penlington, C.; Raphael, K.G.; Santiago, V.; Sharma, S.; Svensson, P.; Visscher, C.M.; Yoshiki, I.; Alstergren, P.; INfORM. Constructing the brief diagnostic criteria for temporomandibular disorders (bDC/TMD) for field testing. J Oral Rehabil. 2024, 51, 785–794. [Google Scholar] [CrossRef]
- Ibáñez-Vera, A.J.; Alonso-Royo, R.; Sánchez-Torrelo, C.M.; Zagalaz-Anula, N.; López-Collantes, J.; Lomas-Vega, R. Psychometric Evaluation of the Krogh-Poulsen Test for the Diagnosis of the Temporomandibular Disorders. Diagnostics 2021, 11, 1876. [Google Scholar] [CrossRef]

| Parameter | Description | Evaluation | Scoring scale |
|---|---|---|---|
| A. Limitation of mandibular range of motion | Assessment of maximum opening, lateral movements, and mandibular protrusion | Direct clinical measurements | - Vertical opening: ≥ 40 mm – 0 points (normal) 30–39 mm – 1 point (mild limitation) <30 mm – 5 points (severe limitation) - Lateral movements and protrusion: ≥ 7 mm – 0 points 4–6 mm – 1 point 0–3 mm – 5 points |
| B. Alterations in joint function | Observation during mandibular opening/closing by palpation and auscultation | Detection of joint sounds, locking, or dislocation | - No deviation or sounds – 0 points - Joint sounds or mandibular deviation – 1 point - Locking or dislocation (with or without sounds) – 5 points |
| C. Pain during movement | Self-reported pain during mandibular movements | - No pain – 0 points - Pain during a single movement – 1 point - Pain during two or more movements – 5 points |
|
| D. Muscle pain | Palpation or functional manipulation of masticatory muscles | Identification of painful areas | - No pain on palpation – 0 points - Pain in 3 zones – 1 point - Pain in 4 or more zones – 5 points |
| E. TMJ pain | Palpation of the periauricular area and external auditory canal | Evaluation of pain on palpation | - No spontaneous or palpation-induced pain – 0 points - Pain on uni/bilateral periauricular palpation – 1 point - Pain on palpation of both the external auditory canal and periauricular area – 5 points |
| Score Range | Severity Level |
|---|---|
| 0 | Absence of temporomandibular disorder (TMD) |
| 1–9 | Mild form of TMD |
| 10–19 | Moderate manifestation of TMD |
| 20–25 | Severe stage of TMD |
| Caracteristic | Total (n = 164) | TMD (n = 82) | Control (n = 82) | Test* | p-Value | Effect Size** |
|---|---|---|---|---|---|---|
| Age, years – mean ± SD | 29,5 ± 6,30 | 28,0 ± 6,00 | 31,0 ± 6,50 | t (Welch) | 0,020 | d = 0,490 |
| Sex, F/M, n (%) | 86 / 78 (52%/48%) | 42 / 40 (51%/49%) | 46 / 36 (56%/44%) | χ² | 0,350 | Φ = 0,070 |
| BMI, kg/m² – mean ± SD | 24,50 ± 3,20 | 24,70 ± 3,40 | 24,30 ± 3,10 | t | 0,370 | d = 0,120 |
| Athletes – yes/no, n (%) | 88 / 76 (54%/46%) | 49 / 33 (60%/40%) | 39 / 43 (48%/52%) | χ² | 0,004 | Φ = 0,270 |
| Residence – rural/urban, n (%) | 76 / 88 (46%/54%) | 49 / 33 (60%/40%) | 27 / 55 (33%/67%) | χ² | 0,003 | Φ = 0,280 |
| Helkimo Score – mean ± SD | 7,50 ± 7,10 | 13,20 ± 4,80 | 1,80 ± 1,60 | t | <0,001 | d = 2,820 |
| Domain | n Patients (n Examiners) |
Examiner 1 (min–max; mean ± SD) |
Examiner 2 (min–max; mean ± SD) |
ICC / κ (95% CI) | SEM | MDC95 | Classification* |
|---|---|---|---|---|---|---|---|
| 1. Inter-examiner | 164 (2) | 0–25; 7.4 ± 6.9 |
0–24; 7.6 ± 7.0 |
0.87 (0.72–0.91) | 1.4 pts | 4.0 pts | > 0.90 |
| 2. Intra-examiner** | 35 (1) | 1–23; 8.1 ± 5.8 |
1–22; 8.0 ± 5.6 |
0.91 (0.65–0.93) | 1.1 pts | 3.1 pts | > 0.90 |
| 3. Item-level κ (median) | 164 (2) | n/a | n/a | 0.65 (0.43–0.77) | n/a | n/a | 0.75–0.90 |
| Domain / Parameter | mHI | DC/TMD (gold standard) | Statistical Comparison / Interpretation |
|---|---|---|---|
| Descriptive – TMD group (n = 82) | |||
| Mean ± SD | 13.2 ± 4.8 | 9.1 ± 2.3 | Cohen’s d = 1.30 (95% CI: 1.00–1.59), p < 0.0001 |
| Min – Max | 5 – 25 | 3 – 12 | n/a |
| Descriptive – Control group (n = 82) | |||
| Mean ± SD | 1.80 ± 1.60 | 2.10 ± 1.10 | p ≈ 0.08 (n.s.) |
| Min – Max | 0 – 7 | 0 – 6 | n/a |
| Diagnostic Performance | |||
| Adjusted OR for TMD | 1.45 (1.22–1.73) | 1.68 (1.35–2.09) | Both significant (CI ≠ 1) |
| AUC (ROC) | 0.89 | 0.95 | ΔAUC < 0.03 → n.s. |
| Optimal threshold (Youden) | ≥ 9 points | ≥ 6 points | n/a |
| Effect Size / Agreement | |||
| Cohen’s d (TMD vs control) | 1.30 | 3.88 (95% CI: 3.36–4.40) | very large |
| ICC (2,1) inter-method | 0.87 (0.72–0.91) | 0.87 (0.72–0.91) | p < 0.001 |
| Other Information | |||
| Score range | 0 – 25 | 0 – 12 | n/a |
| Estimated score interval (95% CI) | [8.4 – 18.0] | [6.8 – 11.4] | n/a |
| Method | Score Correlation (Pearson r) | Mean Score Difference | Paired t-test | Cohen’s d (Effect Size) | Sensitivity | Specificity | LR⁺/LR⁻ | PPV/NPV |
|---|---|---|---|---|---|---|---|---|
| mHI | 0.83 (p < 0.001) |
+4.1 points | t = 6.98 (p < 0.0001) |
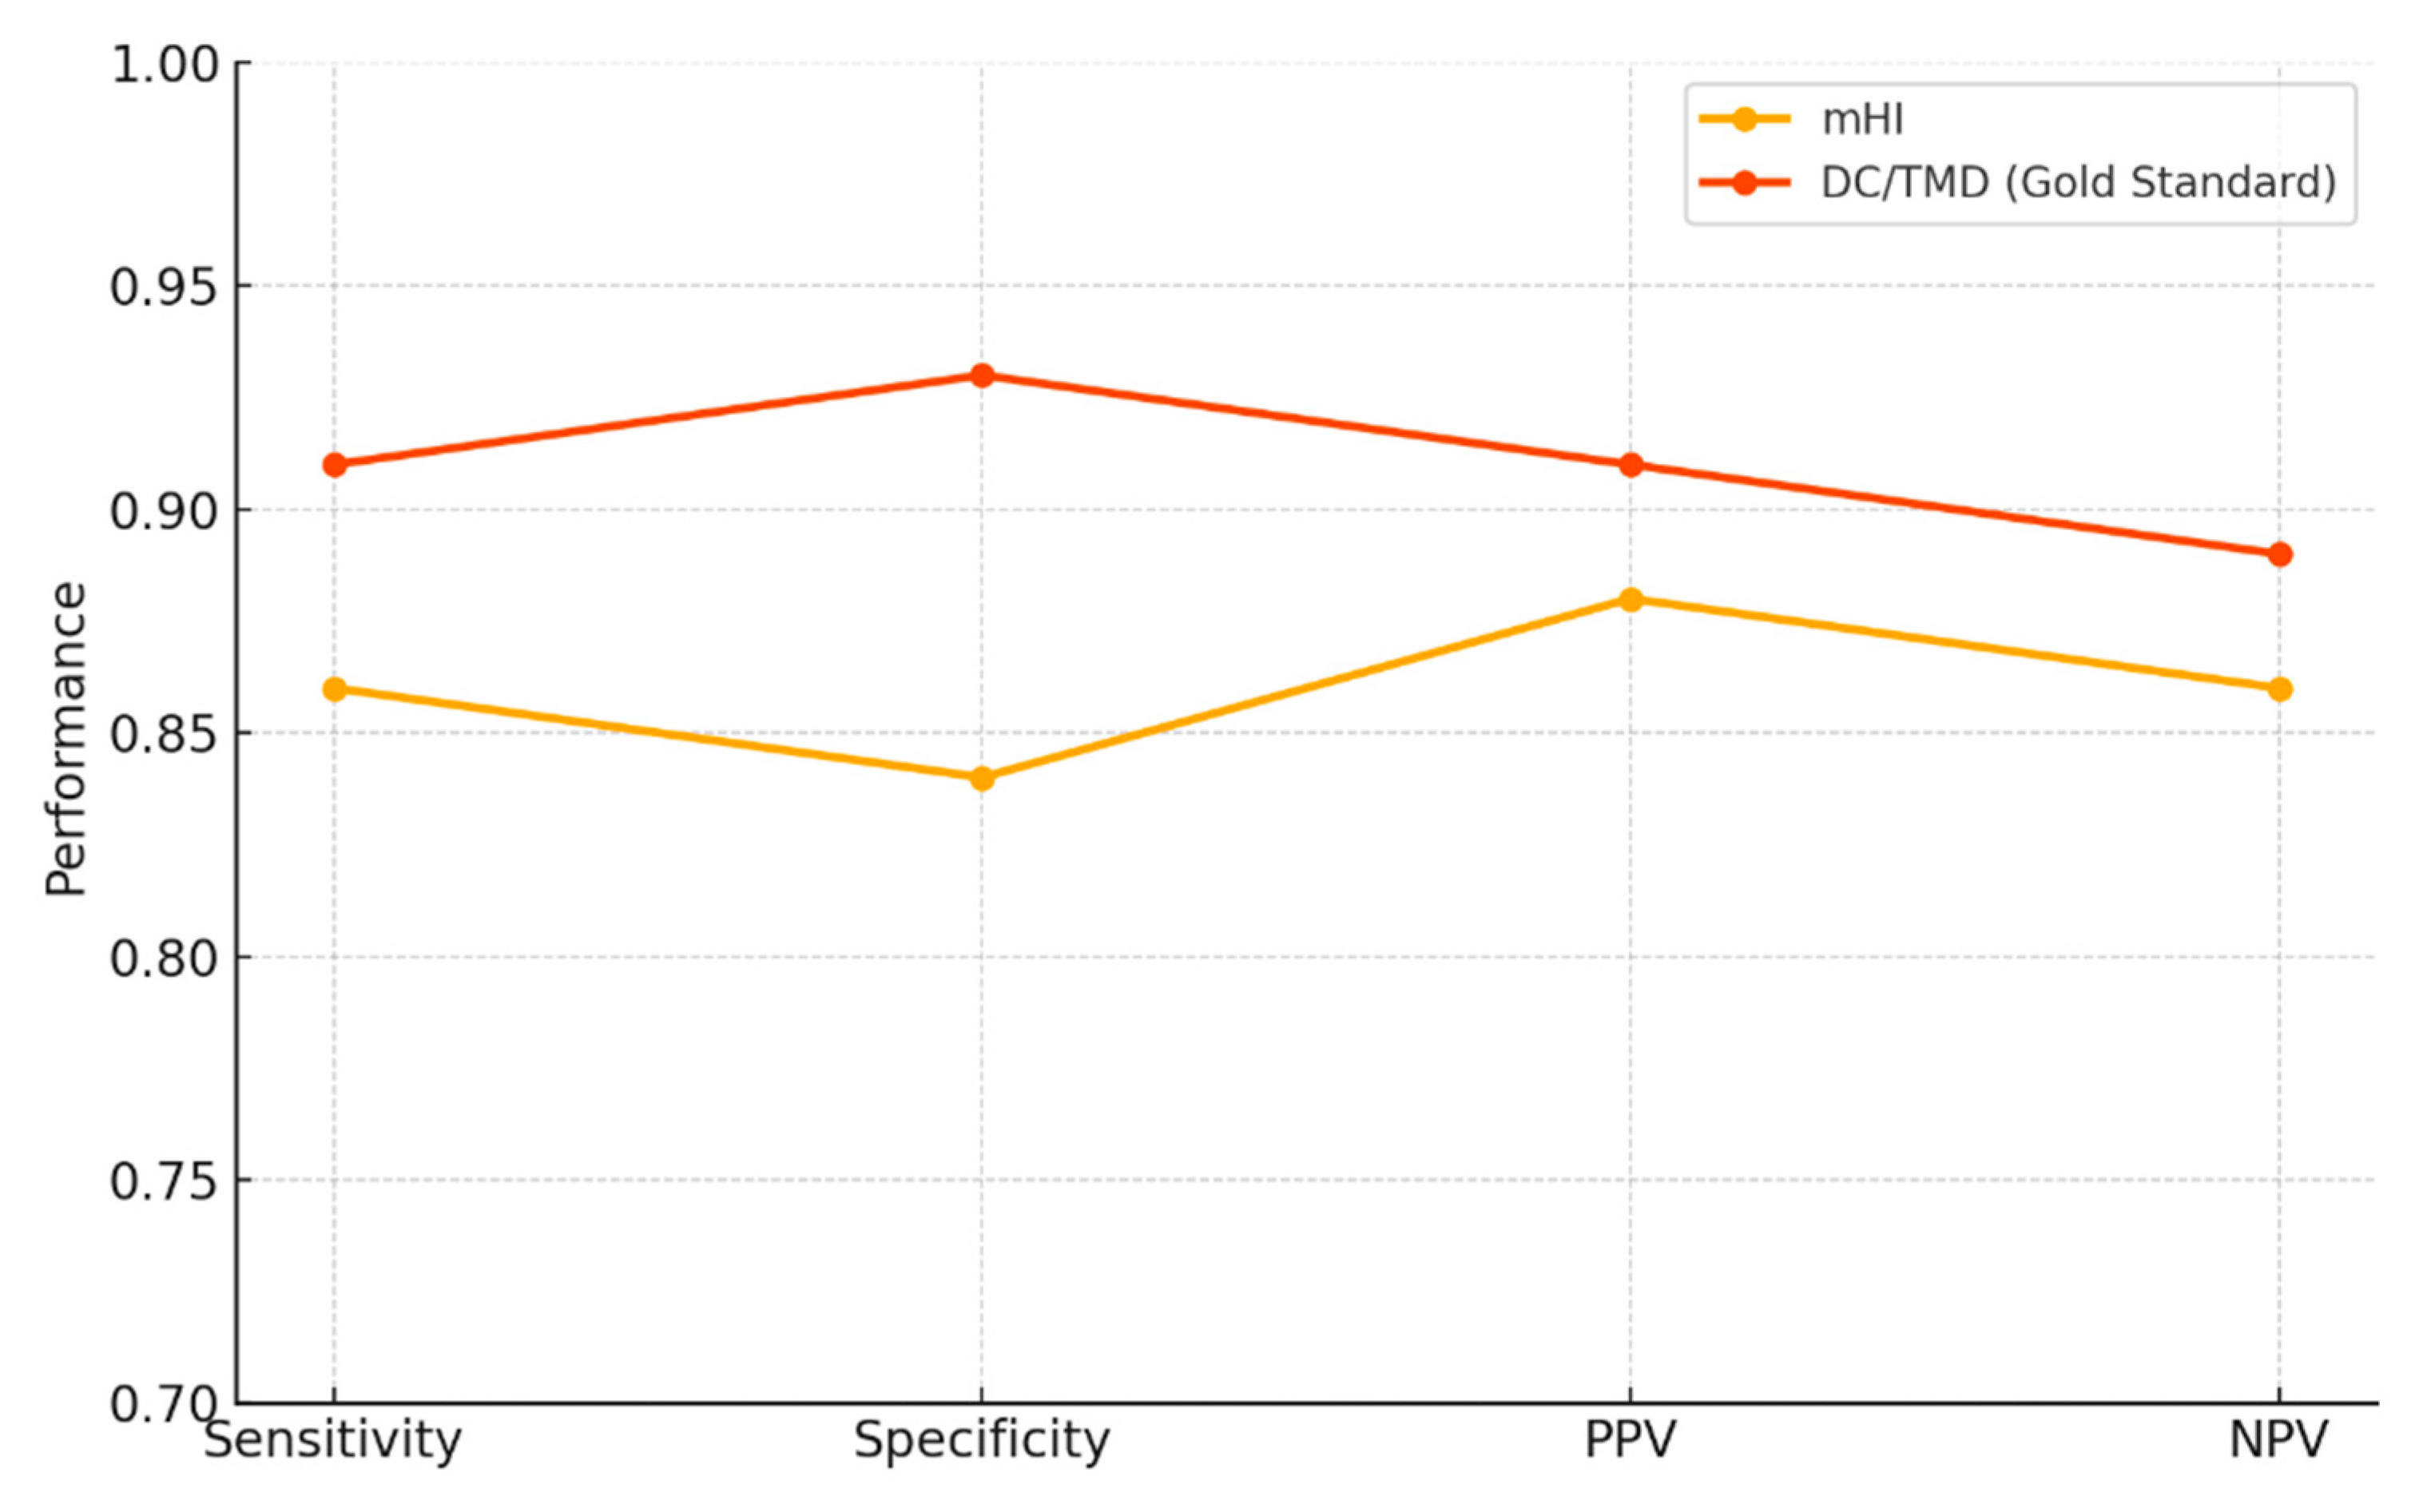
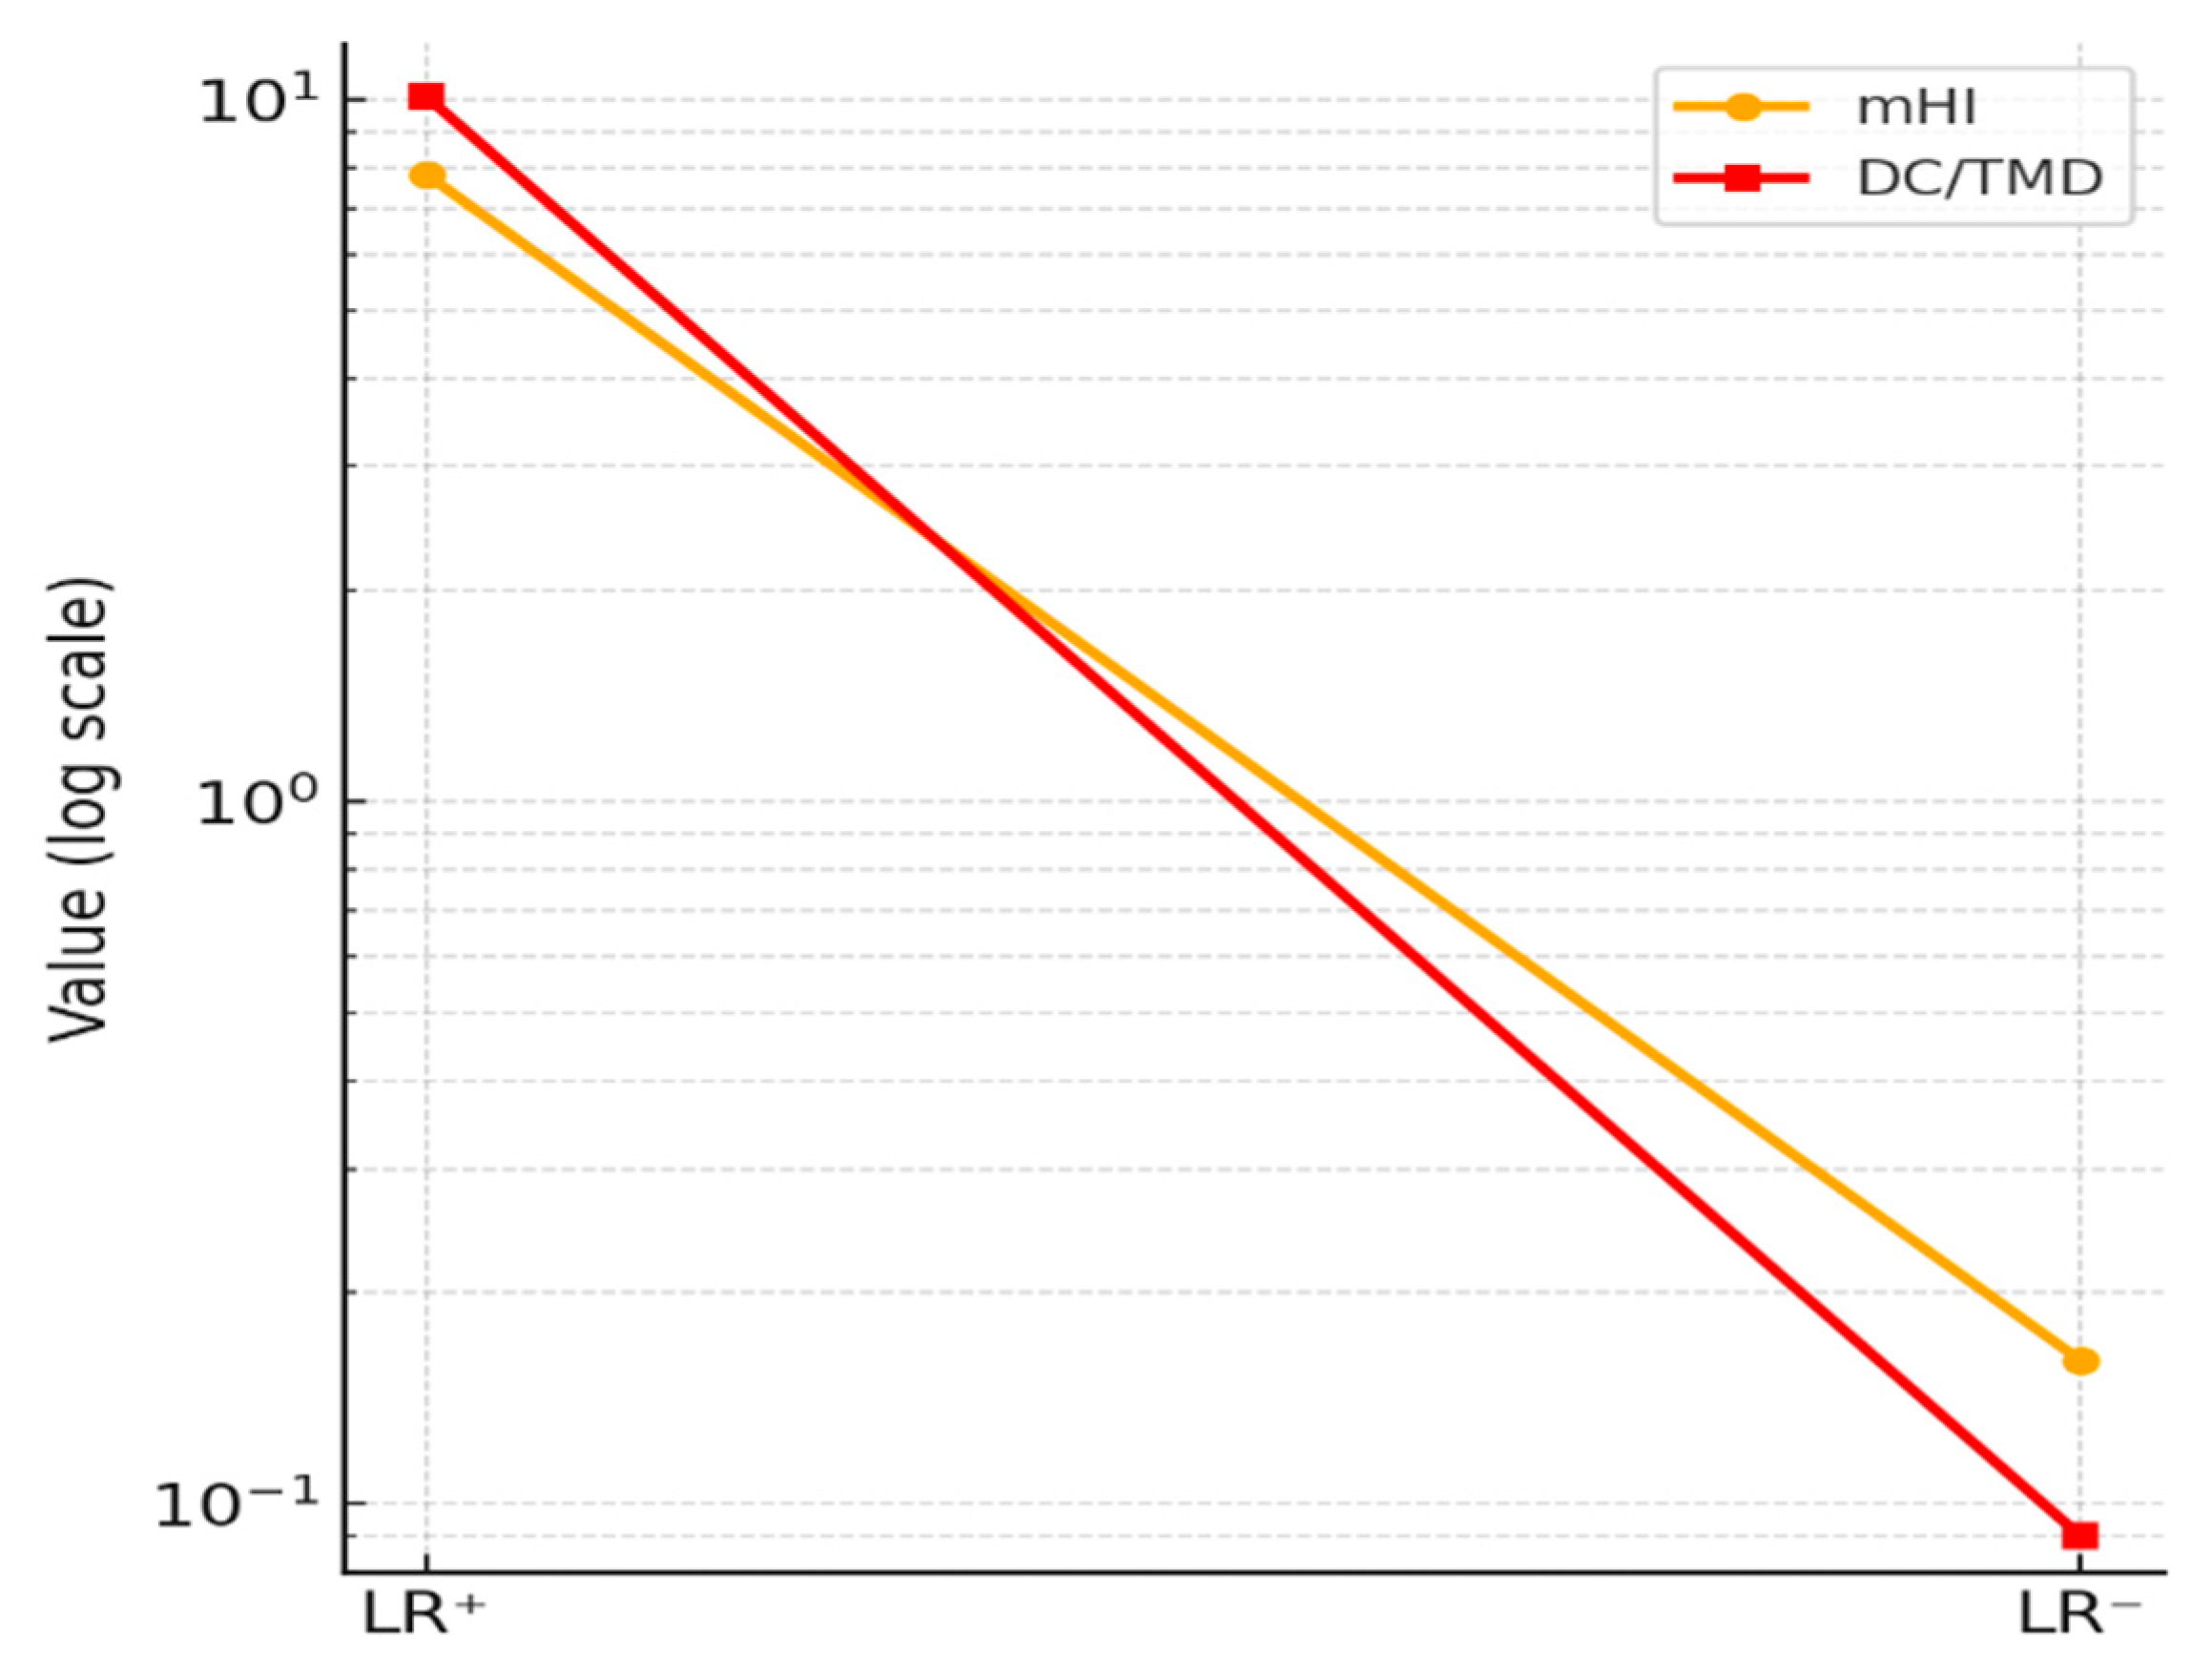
1.09 → large effect | 0.86 | 0.84 | 7.82 / 0.16 | 0.88 / 0.86 |
| DC/TMD (gold standard) | — * | −4.1 points† | t = −6.98 (p < 0.0001)† |
1.09† | 0.91 | 0.93 | 10.1 / 0.09 | 0.91 / 0.89 |
| Variable | mHI – OR [95% CI] | p | DC/TMD – OR [95% CI] | p | Interpretation |
|---|---|---|---|---|---|
| Score (per 1 point) | 1.45 [1.22 – 1.73] | <0.001 | 1.68 [1.35 – 2.09] | <0.001 | ↑ risk ~45–68% per point |
| Age (years) | 1.05 [0.99 – 1.11] | 0.100 | 1.03 [0.97 – 1.09] | 0.340 | not significant |
| Sex (female) | 1.30 [0.74 – 2.30] | 0.360 | 1.22 [0.65 – 2.30] | 0.540 | not significant |
| Examination duration* | ≈ 5–10 min (rapid eval.) | n/a | ≈ 16–20 min (full protocol) | n/a | n/a |
| Parameter | mHI Value | mHI 95% CI | DC/TMD Value | DC/TMD 95% CI |
|---|---|---|---|---|
| Sensitivity | 0.86 | 0.78 – 0.92 | 0.91 | 0.83 – 0.95 |
| Specificity | 0.84 | 0.81 – 0.94 | 0.93 | 0.85 – 0.97 |
| PPV | 0.88 | 0.81 – 0.93 | 0.91 | 0.83 – 0.96 |
| NPV | 0.86 | 0.78 – 0.92 | 0.89 | 0.80 – 0.94 |
| LR⁺ | 7.82 | 4.70 – 13.00 | 10.10 | 5.80 – 26.40 |
| LR⁻ | 0.16 | 0.10 – 0.27 | 0.09 | 0.05 – 0.18 |
Disclaimer/Publisher’s Note: The statements, opinions and data contained in all publications are solely those of the individual author(s) and contributor(s) and not of MDPI and/or the editor(s). MDPI and/or the editor(s) disclaim responsibility for any injury to people or property resulting from any ideas, methods, instructions or products referred to in the content. |
© 2025 by the authors. Licensee MDPI, Basel, Switzerland. This article is an open access article distributed under the terms and conditions of the Creative Commons Attribution (CC BY) license (http://creativecommons.org/licenses/by/4.0/).


