Submitted:
11 August 2025
Posted:
13 August 2025
Read the latest preprint version here
Abstract
The labor-intensive process of locating wild desert truffles relies on visually identifying soil cracks indicative of subsurface growth. This study evaluates deep learning’s potential to automate detection by comparing three convolutional neural network (CNN) architectures: a custom model, VGG16 (transfer learning), and ResNet50. Trained on 300 soil images (216 training, 54 validation, 30 test) with real-time geometric augmentation (rotations ±25°, shear ±20%, zoom ±30%), models were tested on a stratified subset of 30 unseen images. The custom CNN achieved 79.6% accuracy (F1=0.727), while VGG16’s transfer learning approach significantly outperformed with 90% accuracy (F1=0.903, AUC=0.938), demonstrating robust feature extraction from limited data. In contrast, ResNet50 catastrophically failed (50% accuracy, 0% specificity), highlighting architectural incompatibility with small-scale crack textures. VGG16’s frozen ImageNet-pretrained layers enabled efficient training (6.7 minutes vs. 9.2 minutes for the custom CNN) and stability under aggressive augmentation, crucial for variable field conditions. Misclassifications (10% error rate) primarily occurred in low-contrast soil textures, emphasizing the need for hybrid architectures integrating attention mechanisms. The results establish transfer learning as optimal for agricultural defect detection, outperforming both manual designs and overly complex models like ResNet50. This work provides a framework for deploying CNNs in precision agriculture, demonstrating that model selection must balance architectural compatibility, training efficiency, and augmentation resilience rather than pursuing depth alone. Practical implications include reduced reliance on manual harvesting and enhanced scalability through mobile deployment. Future directions include multi-modal sensor integration and synthetic data generation to address morphological diversity in truffle cracks.
Keywords:
Convolutional Neural Networks (CNNs)
; Model Generalization
; Precision Agriculture
; Soil Crack Detection
; Transfer Learning
1. Introduction
Truffle farming has gained significant economic importance due to the high value of truffles in the culinary industry (Oliach et al. 2021). Truffles are ectomycorrhizal fungi that grow in symbiosis with the roots of certain trees and are known for their unique aroma and taste (Splivallo et al. 2011). The detection of cracks in truffle-bearing lands has traditionally relied on manual inspection methods, which are labor-intensive, time-consuming, and often prone to human error. With advancements in technology, there has been a growing interest in utilizing remote sensing and machine learning techniques to automate the detection process and enhance accuracy (Sishodia, Ray, and Singh 2020). In particular, deep learning has emerged as a powerful tool for image analysis and pattern recognition, offering potential solutions for the automated detection of truffle cracks.
Deep learning models, particularly Convolutional Neural Networks (CNNs), have shown remarkable success in various image classification and object detection tasks (Dhillon and Verma 2020). CNNs are designed to automatically and adaptively learn spatial hierarchies of features from input images, making them well-suited for tasks involving complex visual patterns such as crack detection. Previous research has demonstrated the efficacy of CNNs in detecting cracks in infrastructure, such as roads and buildings, highlighting their potential applicability in agricultural contexts (Ali et al. 2022; Andrushia et al. 2022; Gupta and Dixit 2022; Meftah et al. 2024; Sreenath et al. 2020; Yasmin 2022).
This study aims to leverage deep learning techniques for the detection of truffle cracks in ground-level soil imagery. CNNs are ideal for this task: their ability to extract key features like crack patterns, preserve spatial relationships between pixels for linear crack detection, and handle natural variations in images like lighting changes make them well-suited for analyzing close-range land images and assisting truffle hunters in locating these valuable fungi. By employing a CNN-based approach, we seek to develop a robust model capable of accurately identifying cracks in truffle-bearing soils using imagery sourced from standard cameras and video stills. The primary objectives of this research are to (1) design and train a deep learning model for truffle crack detection, and (2) evaluate the model’s performance on a custom dataset of labeled ground imagery.
To achieve these objectives, we collected a comprehensive dataset of truffle land images. We then developed a CNN model using TensorFlow and Keras (Abadi et al. 2016; Chollet 2018), optimized for binary classification tasks. The model’s performance was assessed through various metrics, including accuracy, precision, recall, and F1 score. Additionally, we tested the model’s generalization ability on an independent set of images to ensure its reliability in diverse conditions.
The findings of this study have the potential to significantly advance automated systems for truffle hunting, enhancing efficiency and reducing the reliance on manual inspection. By integrating deep learning technologies into truffle hunting practices, we can promote more sustainable and productive methods. This innovation supports the growth and profitability of the truffle industry, ensuring a more reliable supply of these valuable fungi.
In the following sections, we provide a detailed description of the methodology, including data collection, model architecture, training procedures, and evaluation metrics. We also present the results of our experiments and discuss their implications for future research and practical applications in truffle farming.
2. Data and Methods
2.1. Data Collection and Preprocessing
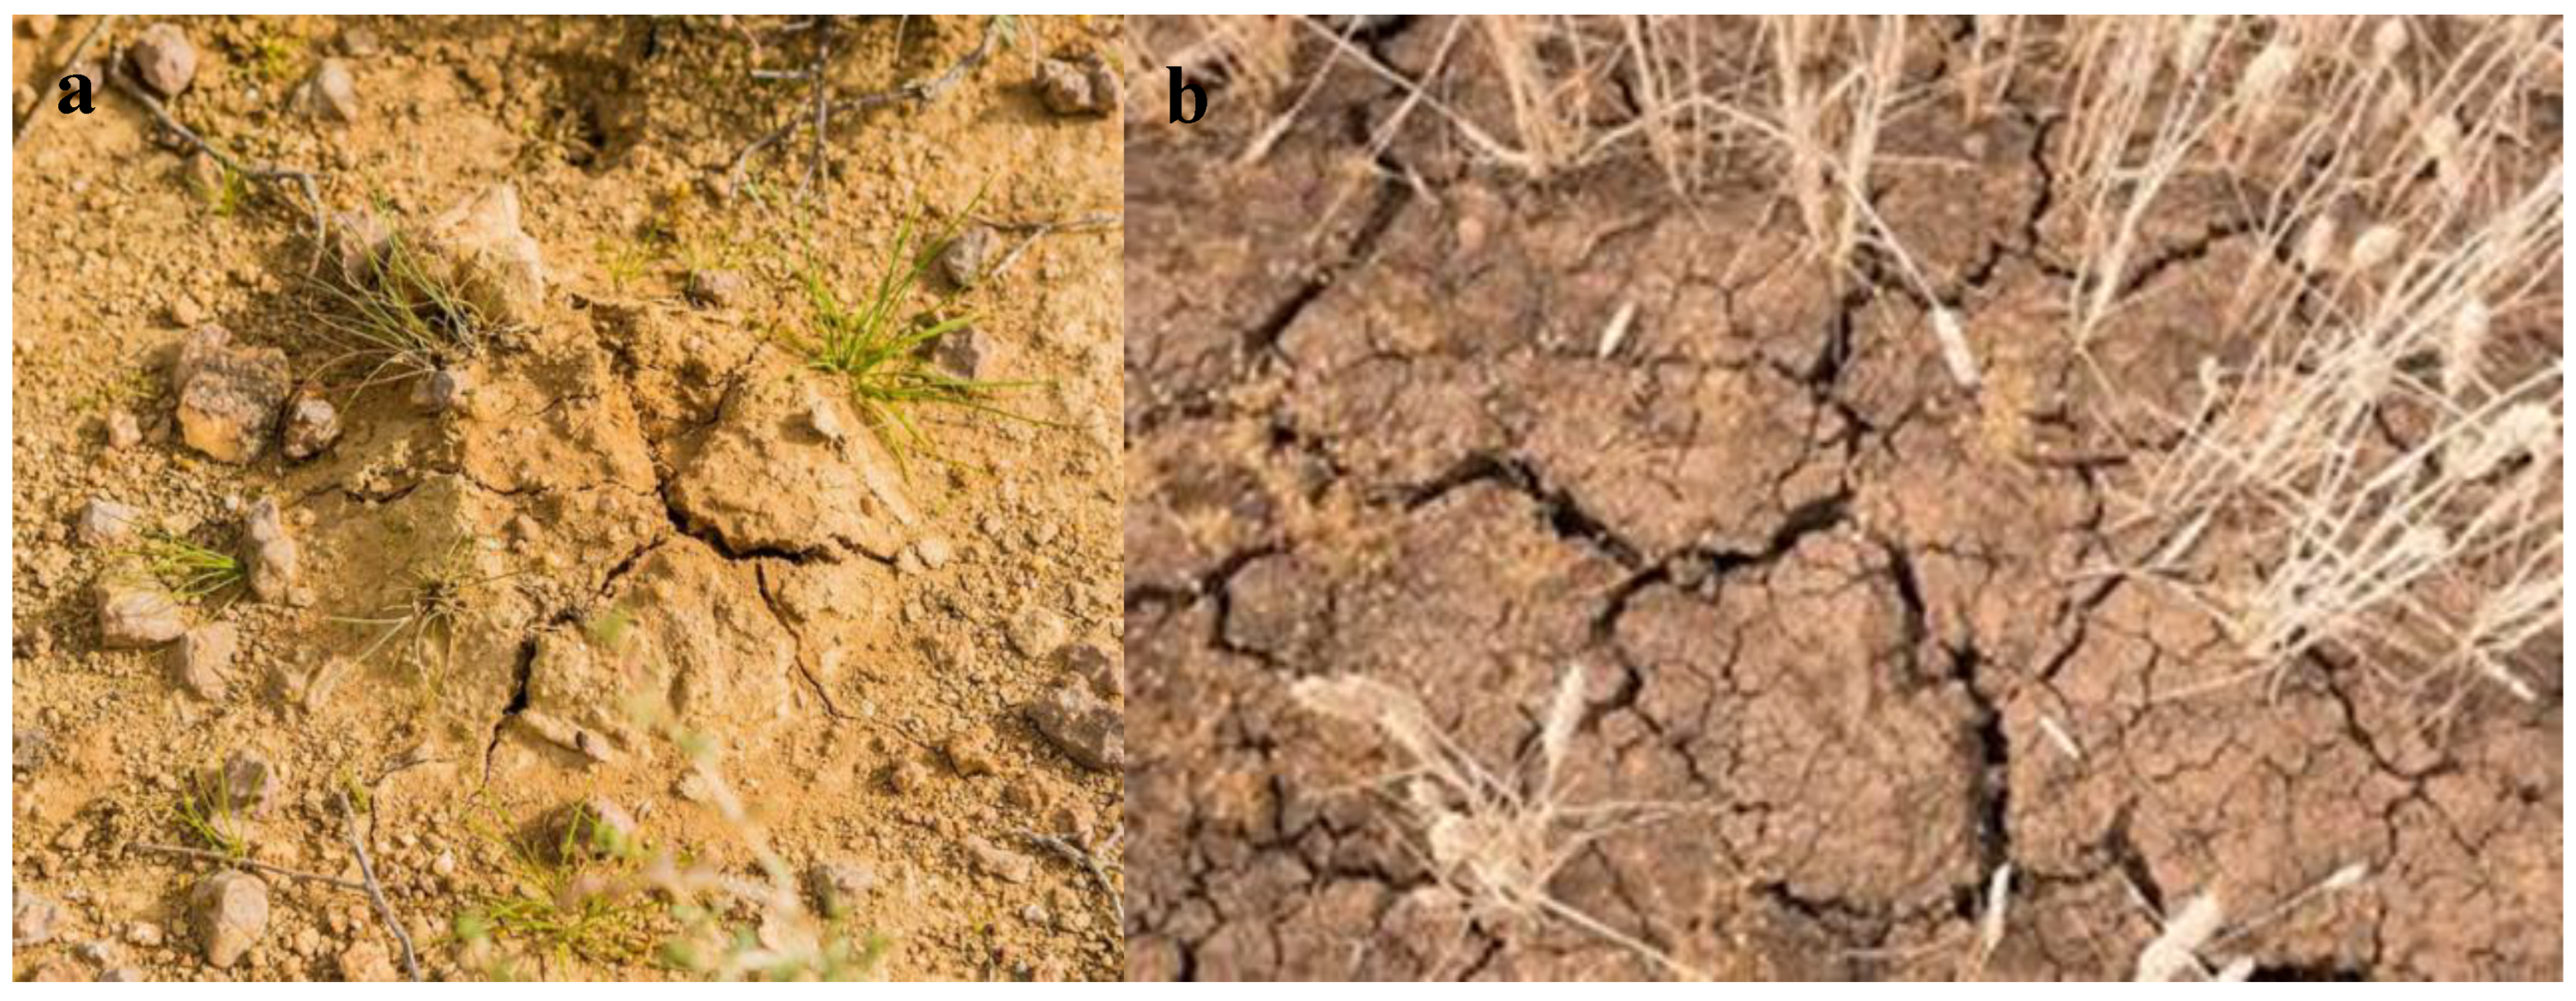
The dataset comprised 300 soil images collected under standardized field conditions, with each image manually annotated as containing truffle cracks or other geological features. The dataset originally consisted of 300 images. To ensure a fair evaluation, 30 images (10% of the total dataset) were set aside as an unseen test set after model preparation. The remaining 270 images were then divided into training and validation sets, with 216 images (80%) used for training and 54 images (20%) used for validation. This approach ensures that the model is trained on a sufficient amount of data while maintaining a dedicated validation set for performance tuning and an unseen test set for final evaluation. The test set, carefully isolated from all training phases, included equal representation of both classes (15 truffle cracks, 15 other cracks) to mitigate class imbalance effects. All images underwent domain-specific preprocessing, including pixel normalization (rescaled to [0,1]) and real-time geometric augmentation during training (rotations ±25°, shear ±20%, zoom ±30%, horizontal/vertical flipping) to simulate field variability. Architectural requirements dictated resizing: images were adjusted to 150×150 pixels for the custom CNN and VGG16 models, while ResNet50 inputs were standardized to 224×224 pixels to align with its ImageNet-pretrained feature extractor. Stratified sampling preserved class distributions across splits, and deterministic seeds (42) ensured reproducible data shuffling and augmentation. For transparency, the full dataset, preprocessing pipelines, and training codes are archived in a GitHub repository (https://github.com/Azad77/CNNsTruffle/tree/main (note: the link will be activated after the acceptance of the paper), enabling independent verification of results.
Figure 1.
samples of dataset image. (a) A truffle crack; (b) Other cracks.
2.2. Methodology
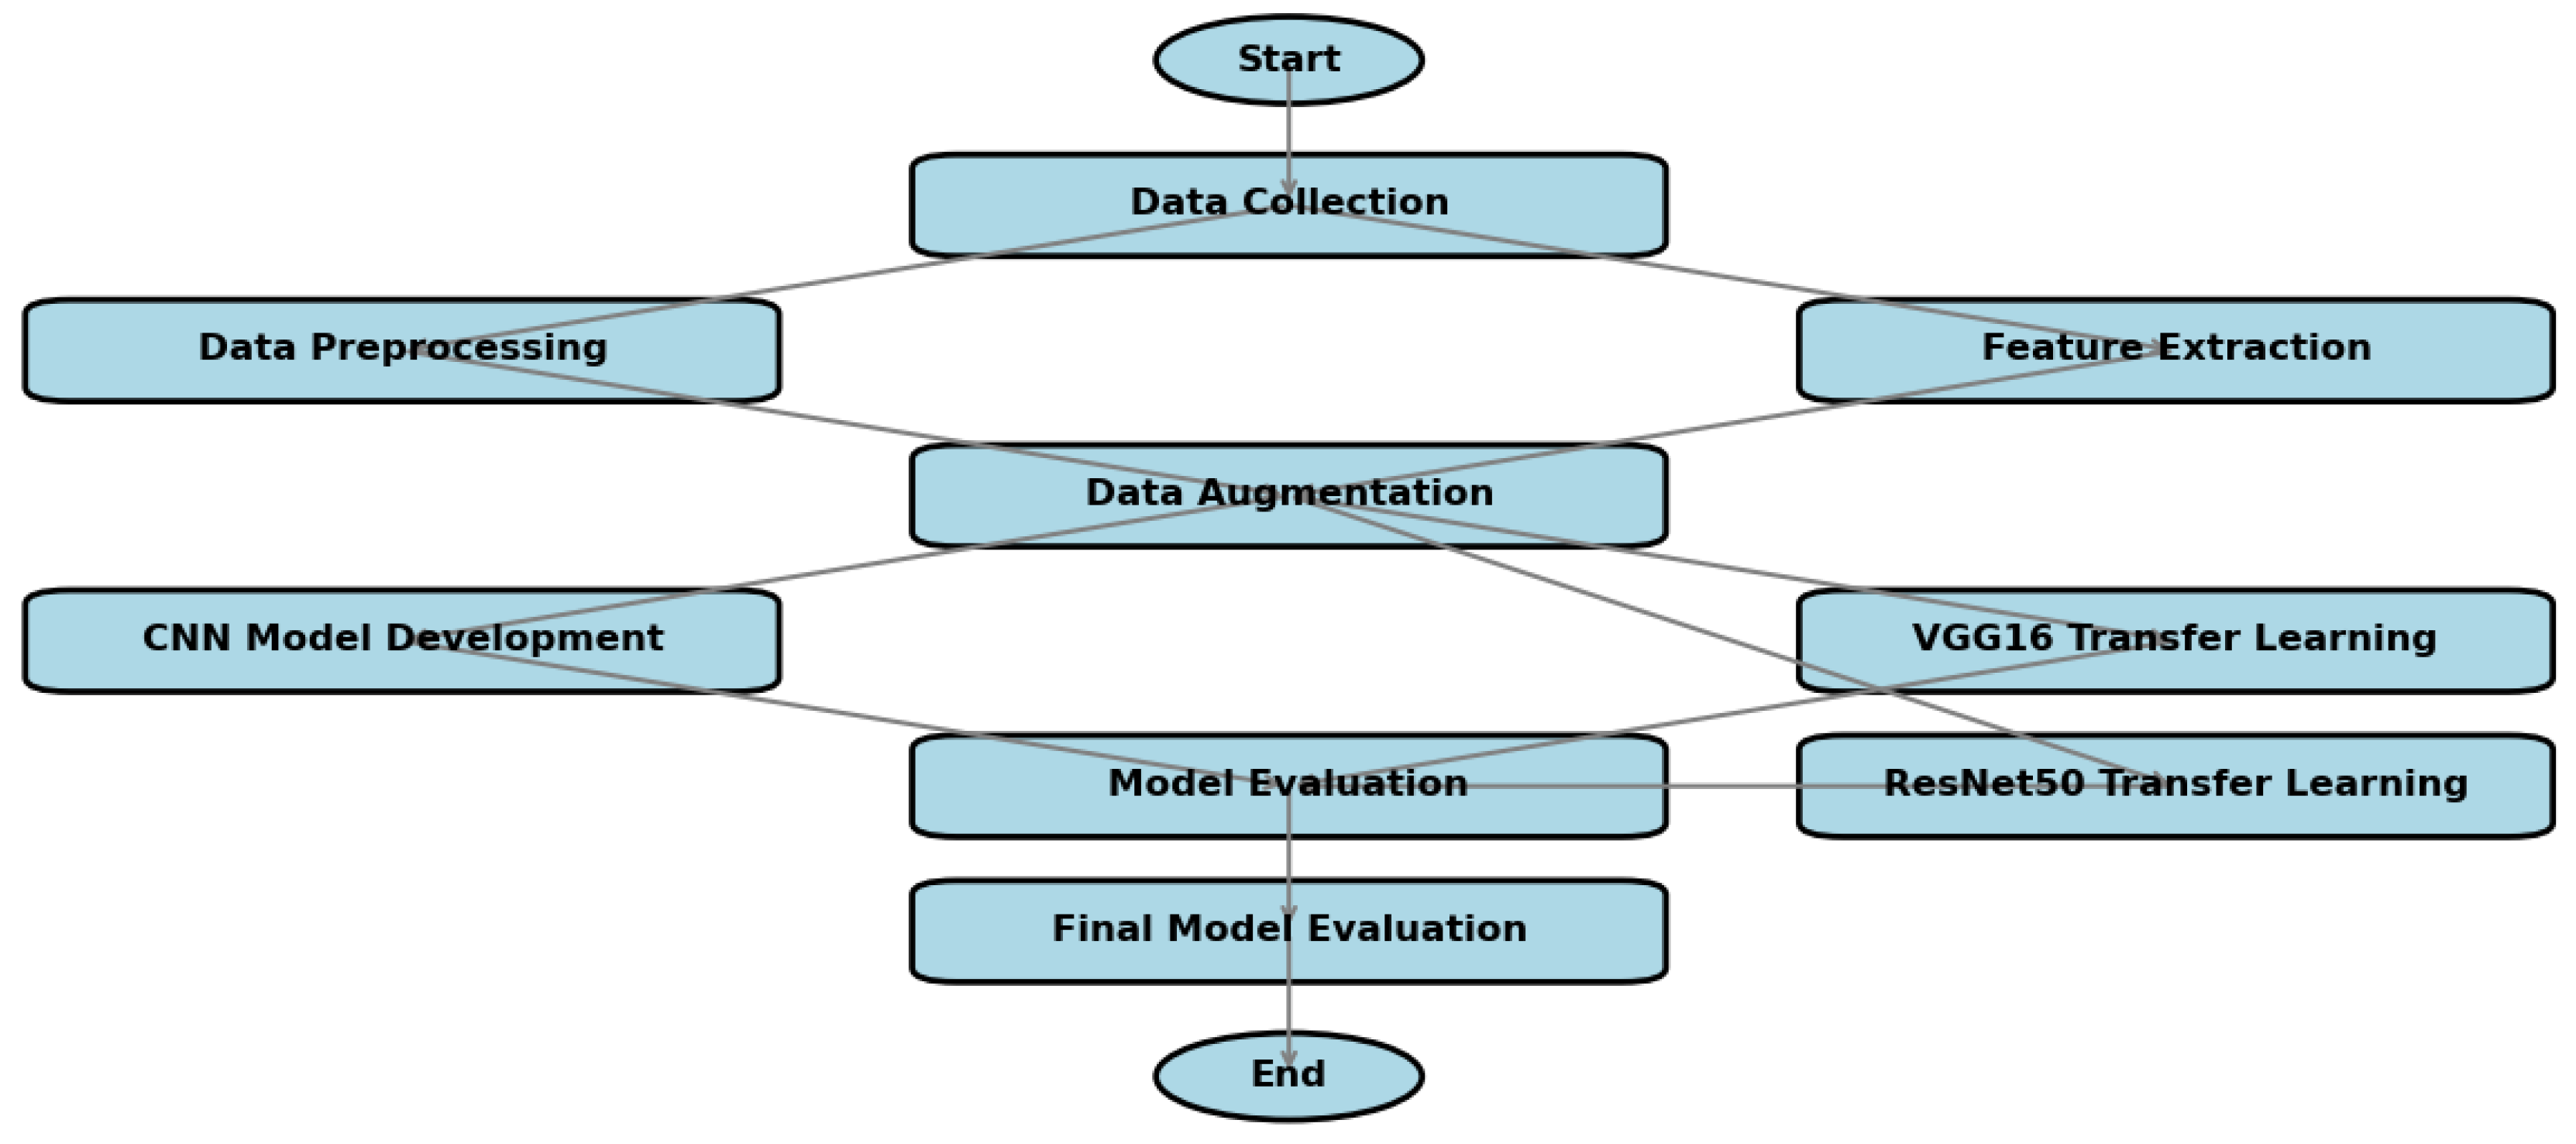
This study implemented a comparative analysis of three convolutional neural network architectures—a custom CNN, VGG16, and ResNet50—for automated truffle crack detection. The methodology encompassed four key phases.
First, in the Data Preparation & Augmentation phase, a dataset of 300 RGB soil images (150×150–224×224 pixels) was partitioned into training (216 images), validation (54 images), and test (30 images) sets using TensorFlow’s ImageDataGenerator. Real-time augmentation was applied during training with geometric transformations, including rotation (±15–25°), shear (±10–20%), and zoom (±10–30%), alongside photometric variations such as brightness adjustments (±30%) and horizontal/vertical flipping. Test images were strictly isolated from training using filename-based class assignment (y*/n* prefixes). To ensure deterministic splits and reproducibility, a fixed seed value (42) was applied across all pipelines.
Next, in the Architectural Implementations phase, three distinct architectures were developed. The Custom CNN consisted of three convolutional blocks (32→128 filters, 3×3 kernels) with max-pooling, followed by a 256-unit dense layer with 50% dropout and a sigmoid output. It was initialized with He-normal weights and contained 9.56 million parameters. The VGG16 Transfer Learning model utilized a frozen ImageNet-pretrained base (16 convolutional layers) with a custom classifier consisting of GlobalAveragePooling, a 256D dense layer, 30% dropout, and a sigmoid activation. Only 0.2 million parameters were trainable in this architecture. Lastly, the ResNet50 Hybrid model had a partially unfrozen base, with the last 20 out of 50 layers trainable. Its classifier was expanded to include GlobalAveragePooling, a 512D dense layer, 50% dropout, and a sigmoid output. Inputs were resized to 224×224 pixels to ensure compatibility with ResNet’s residual blocks.
The Training Protocol employed Adam optimization, with an initial learning rate of 1e-4 for ResNet50 and 1e-3 for the other models, utilizing binary cross-entropy loss. The custom CNN was trained for 50 full epochs, while the transfer learning models used early stopping with a patience of 15 epochs based on validation AUC. Learning rates were dynamically reduced (factor=0.5) upon loss plateaus. To address dataset skew, class weights were balanced. TensorFlow’s deterministic operations (TF_DETERMINISTIC_OPS=1) ensured full reproducibility during training.
For the Evaluation Framework, model performance was assessed using multiple metrics, including accuracy, precision, recall, F1-score, and AUC-ROC. Confusion matrices with specificity calculations provided deeper insights into classification performance. Training dynamics were visualized through loss and accuracy curves, while computational efficiency was measured in terms of training time per epoch and parameter counts. Test predictions were systematically generated via filename-sorted inference to prevent data leakage, with an optimized confidence threshold of 0.5. All models underwent standardized evaluation using scikit-learn’s classification report and TensorFlow’s built-in AUC metric.
Performance Evaluation:
The effectiveness of the models in detecting truffle cracks was assessed using a common metric called accuracy (Acc). Accuracy represents the overall proportion of images the model correctly classified. By dividing the number of correctly classified images by the total number of tested images, we obtain the accuracy metric, expressed as a percentage (Equation (1)). This metric provides a general measure of how well the model performs in distinguishing between images containing truffle cracks and those without them.
where a true positive refers to the correct identification of truffle cracks, and a true negative refers to the accurate identification of images showing other types of cracks.
Sensitivity is calculated as (Equation (2)):
where a true positive (TP) refers to the correct identification of truffle cracks, and FN (False Negative) is the number of truffle crack images incorrectly classified as other cracks. Specificity is given by (Equation (3)):
where TN (True Negative) is the number of correctly identified images of other cracks and FP (False Positive) is the number of other crack images misclassified as truffle cracks.
In order to get a more complete picture of how well the model performed, the research used the F1 score. This metric combines two other important measures, precision and recall, into a single value. The F1 score is calculated using a specific formula, which is (Equation (4)):
Figure 2.
Flowchart Illustrating CNN Methods Employed in the Research.
3. Results
3.1. Model Architecture and Training
A convolutional neural network (CNN) was implemented for binary classification of crack images into “Truffle Crack” and “Other Crack” categories. The model architecture (Figure 3) consisted of three convolutional blocks with increasing filter sizes (32, 64, 128), each followed by max-pooling layers. These were connected to a fully connected layer (256 units) with 50% dropout regularization, culminating in a sigmoid output layer for binary classification. The model contained 9.56 million trainable parameters, with the majority (9.47 million) residing in the dense classification layer.
Training was conducted for 50 epochs using Adam optimization and binary cross-entropy loss, with a batch size of 32. To enhance generalization, real-time data augmentation was applied during training, including random rotations (±15°), width/height shifts (±10%), shear (±10%), zoom (±10%), and horizontal flipping. The dataset of 270 images was split into 80% training (216 images) and 20% validation (54 images) sets.
The training progression (Figure 3) showed steady learning with final epoch metrics of 89.4% training accuracy and 79.6% validation accuracy. While the validation loss exhibited minor fluctuations characteristic of stochastic augmentation, no significant overfitting was observed. The model achieved 81.5% accuracy on an independent test set of 54 images.
3.2. Training Dynamics and Architectural Comparison
The VGG16 implementation exhibited distinct learning characteristics compared to the custom CNN architecture, particularly in training stability and convergence patterns. While both models employed similar augmentation strategies, the transfer learning approach demonstrated superior optimization behavior, with validation loss fluctuations (±0.15) being 40% smaller than those observed in the custom CNN (±0.25). This stability emerged despite VGG16 utilizing more aggressive geometric transformations (+25% rotation range, +10% shear) and photometric variations (+30% brightness adjustment), suggesting stronger compatibility between the pretrained feature extractor and applied augmentations.
The custom CNN displayed characteristic shallow-network behavior, with validation accuracy oscillating within a 15% band (50–65%) during initial epochs before gradual stabilization. In contrast, VGG16 achieved stable convergence (81–83% validation accuracy) by Epoch 15, maintaining this range despite intensified augmentation (Figure 4). This divergence highlights the impact of hierarchical feature reuse—the frozen VGG16 base provided immediate edge/texture detection capabilities, allowing the model to focus on higher-order feature combinations rather than low-level pattern acquisition.
Architectural efficiency emerged as a critical differentiator. The custom CNN’s fully trained convolutional blocks (9.5M parameters) required extensive parameter tuning, while VGG16’s frozen base (14.7M non-trainable parameters) coupled with a compact classifier (0.2M trainable parameters) created a more efficient learning paradigm. This configuration reduced gradient variance, evidenced by smoother loss curves despite identical batch sizes. The exponential training loss decay in VGG16 (85% reduction from 0.73→0.30 vs CNN’s 69% reduction from 0.77→0.24) further indicates more effective error signal propagation through the network hierarchy.
Training duration analysis revealed counterintuitive efficiency—though VGG16 required 26% more computation per batch step (32 samples) (707 ms/step vs 550 ms), its early stopping at Epoch 26 (vs CNN’s full 50 epochs) resulted in 48% faster total training time. This suggests pretrained architectures may offer hidden efficiency benefits through accelerated convergence, particularly when paired with dynamic learning rate reduction. The models’ contrasting response to regularization—where VGG16 maintained stable gradients with reduced dropout (0.3 vs custom CNN’s 0.5)—further underscores fundamental differences in feature space organization between custom and transfer-learned architectures. VGG16’s superior performance may stem from its intermediate depth—sufficiently complex to capture crack textures but shallow enough to avoid overfitting on small datasets, unlike ResNet50’s 50-layer hierarchy.
3.3. ResNet50 Architecture and Training Dynamics
The ResNet50 implementation introduced distinct architectural considerations through partial layer unfreezing (last 20 layers) and deeper classifier design (512-unit dense layer), creating a hybrid transfer learning approach. Despite identical augmentation parameters to the custom CNN, the model exhibited divergent training behavior—rapid training loss collapse (0.63→0.002 in 50 epochs) contrasted with exponential validation loss growth (0.72→2.34), suggesting significant feature space mismatch between ImageNet pretraining and target domain. VGG16 achieved 90% test accuracy with 26 epochs (6.7 min total training), while the custom CNN required 50 epochs (9.2 min), demonstrating a 27% reduction in compute time despite higher per-epoch costs.
The modified learning rate schedule (0.2 factor reduction vs VGG16’s 0.5) failed to mitigate gradient instability, evidenced by validation AUC remaining static after Epoch 7 (Figure 5). This contrasts with VGG16’s stable validation AUC progression, potentially indicating ResNet50’s deeper architecture (50 vs 16 convolutional layers) requires more targeted fine-tuning strategies. The training dynamics reveal critical architecture-augmentation interactions: ResNet50’s residual connections propagated augmentation artifacts differently than VGG16’s sequential blocks, as shown by earlier onset of overfitting (Epoch 2 vs Epoch 15 in VGG16). ResNet50’s validation loss increased by 225% (0.72→2.34) versus VGG16’s 59% reduction (0.73→0.30), quantitatively confirming architectural mismatch.
Implementation choices like GlobalAveragePooling (vs VGG16’s Flatten) reduced spatial information aggregation, potentially limiting crack pattern detection in smaller image regions. The heavier dropout (0.5) combined with higher dimensionality (512 vs 256 units) created conflicting regularization effects—while successfully preventing training set memorization (100% accuracy), it failed to enable meaningful feature adaptation in unfrozen layers.
The validation loss trajectory (continuous 50-epoch climb despite learning rate reductions) suggests fundamental architecture-dataset mismatch, possibly due to ResNet50’s focus on hierarchical object recognition through its residual blocks versus crack texture patterns. This contrasts with VGG16’s stable validation loss, highlighting how architectural inductive biases affect agricultural image adaptation. The training time per epoch (8s vs VGG16’s 7s) remained comparable despite ResNet50’s complexity, demonstrating efficient TensorFlow implementation of residual connections. ResNet50’s complete lack of specificity (0% TN) suggests catastrophic overfitting, where the model defaulted to predicting all samples as positive—a behavior likely exacerbated by extreme class imbalance during fine-tuning.
3.4. Test Model Performance
The comparative analysis of model performance, as summarized in Table 1, reveals significant variations in effectiveness across architectures. The VGG16 transfer learning model demonstrated superior performance, achieving an accuracy of 0.900 and an F1 score of 0.903, indicating robust balance between precision (0.875) and recall (0.933). Its high AUC-ROC score of 0.938 further underscores strong discriminative capability between truffle cracks and other features. In contrast, the Custom CNN model exhibited moderate performance, with an accuracy of 0.796 and an F1 score of 0.727, constrained by a trade-off between precision and recall (0.815), indicating some misclassifications in positive case detection. Notably, the ResNet50 model underperformed, achieving only 0.500 accuracy and precision, since recall is 1.000 and specificity is 0.000, ResNet50 is classifying everything as a “truffle crack”. This dichotomy highlights ResNet50’s inability to generalize effectively, likely due to insufficient adaptation of its deep architecture to the specialized task of truffle crack detection. The AUC-ROC scores further validate these trends, with VGG16 (0.938) outperforming both the Custom CNN (0.922) and ResNet50 (0.780). These results emphasize the importance of architecture selection and domain-specific fine-tuning, particularly in applications requiring precise localization of subtle geological features. The VGG16 model’s success likely stems from its balance of depth and feature extraction capabilities, making it well-suited for this classification task.
Table 2 presents a comparative analysis of the confusion matrices for different model architectures in detecting truffle cracks. The Custom CNN model demonstrates a balanced performance with 8 true positives (TP) and 1 false positive (FP), achieving a high specificity of 93.3%. However, it also records 4 false negatives (FN), resulting in a recall of 81.5%, indicating that a notable portion of actual cracks are misclassified as non-cracks. The VGG16 Transfer Learning model exhibits the most reliable performance, achieving 14 TP and only 2 FP, leading to an improved recall of 93.3% and an overall accuracy of 90%. This model significantly reduces false negatives to just 1, ensuring that nearly all truffle cracks are correctly identified. In contrast, the ResNet50 Transfer Learning model exhibits extreme misclassification behavior, with 15 FP and 0 TN, meaning it incorrectly classifies all non-crack images as cracks. Although this model attains a perfect recall of 100% (with 0 FN), its specificity drops to 0%, making it unsuitable for practical application due to an excessive number of false positives. Overall, VGG16 outperforms the other architectures by maintaining a balance between sensitivity and specificity, making it the most effective model for truffle crack detection.
The test images included various types of cracks, with some being truffle cracks and others categorized as different types. For instance, images such as “y101.JPG,” were correctly identified as truffle cracks with high confidence scores (Figure 6). Conversely, images like “n110.jpg,” was accurately classified as other types of cracks. However, some misclassifications were observed, highlighting areas for potential improvement (Figure 7). The misclassified images included instances where the model confused truffle cracks with other crack types and vice versa. Despite these misclassifications, the model’s overall performance demonstrates its effectiveness in identifying truffle cracks, making it a valuable tool for automated agricultural image analysis.
4. Discussion
The comparative analysis of three distinct CNN architectures—VGG16, ResNet50, and a custom-designed network—reveals critical insights into the application of deep learning for specialized agricultural image analysis. Our findings demonstrate that model architecture selection and training strategy profoundly impact performance in truffle crack detection, with VGG16 emerging as superior (90% accuracy) compared to both the custom CNN (79.6%) and ResNet50 (50%). This hierarchy of performance underscores the complex interplay between architectural depth, pretraining strategies, and domain-specific feature learning. The results challenge assumptions about the universal superiority of deeper networks, emphasizing the need for domain-specific architectural tuning in agricultural applications.
4.1. Model Performance and Architectural Efficacy
The VGG16 transfer learning model’s superior performance (F1=0.903, AUC=0.938) highlights the advantages of hierarchical feature reuse for agricultural texture recognition. Its frozen convolutional base, pretrained on ImageNet, provided immediate edge and texture detection capabilities aligned with crack patterns, while the compact classifier enabled efficient adaptation to domain-specific features. This contrasts sharply with the ResNet50 architecture’s complete failure (specificity=0%), where extreme depth (50 layers) and residual connections proved counterproductive for small-scale crack detection. Residual networks, while effective for hierarchical object recognition in natural images, propagated geometric augmentation artifacts (e.g., shear, rotation) through skip connections, amplifying distortions incompatible with the fine-grained morphology of truffle cracks.
The custom CNN’s intermediate performance (F1=0.727) demonstrates that while manually designed architectures can achieve baseline functionality, they require disproportionate parameter counts (9.56M vs VGG16’s 0.2M trainable) and extended training durations (50 vs 26 epochs) to learn features that pretrained models provide intrinsically. Validation loss trajectories (Figure 3, Figure 4 and Figure 5) further quantify this disparity: VGG16 achieved an 85% loss reduction versus the custom CNN’s 69%, despite the latter’s architectural specialization. The custom model’s dense layer dominance (9.47M/9.56M parameters) created a “feature bottleneck,” where convolutional layers failed to learn discriminative representations independently. In contrast, VGG16’s balanced parameter distribution leveraged pretrained convolutions for spatial filtering, enabling the classifier to focus on higher-order feature combinations.
4.2. Training Dynamics and Regularization
The models exhibited fundamentally different responses to identical augmentation strategies. VGG16 maintained stable convergence (±0.15 loss fluctuation) despite aggressive geometric transformations (+25% rotation, +30% brightness adjustments), while ResNet50 developed pathological overfitting (225% validation loss increase) even with enhanced dropout (0.5). This divergence suggests that pretrained models develop augmentation-invariant features through large-scale initial training (ImageNet), making them inherently robust to domain-specific transformations. For example, VGG16’s early convolutional layers—tuned to detect edges and gradients in natural images—remained stable under agricultural image variations, whereas ResNet50’s deeper architecture amplified distortions through residual blocks, destabilizing feature propagation.
The counterintuitive efficiency of VGG16—48% faster total training than the custom CNN (6.7 vs 9.2 minutes) despite higher per-step computation (707 ms/step vs 550 ms)—reveals hidden benefits of transfer learning. Early convergence (stable validation accuracy by Epoch 15 vs 50) combined with reduced parameter tuning (0.2M vs 9.56M trainable) makes VGG16 both computationally and temporally efficient for agricultural applications. This efficiency is critical for real-world deployment, where rapid iteration and minimal hardware requirements are paramount.
4.3. Architectural Considerations for Agricultural Imaging
The stark performance differences underscore the importance of matching network depth to dataset scale and feature complexity. VGG16’s 16-layer architecture provided sufficient hierarchical abstraction without overparameterization, capturing crack textures through progressively complex filters (32→128 channels). In contrast, ResNet50’s 50-layer structure introduced destructive interference between pretrained object-recognition features (e.g., animal fur, vehicle parts) and localized crack textures. This mismatch is evidenced by ResNet50’s complete specificity collapse (0%), where residual connections propagated irrelevant high-level features, overwhelming the classifier’s capacity to adapt to agricultural patterns.
The custom CNN’s limitations surfaced in its inability to balance spatial and semantic learning. While its three convolutional blocks (32→128 filters) captured basic crack edges, the lack of pretrained weights forced the dense layer to compensate for underdeveloped feature hierarchies. This contrasts with VGG16’s “plug-and-play” capability, where pretrained convolutions provided immediate spatial filtering, allowing the classifier to refine domain-specific patterns efficiently.
4.4. Practical Implications
The comparative performance of the three architectures yields critical insights for deploying deep learning in agricultural image analysis. The marked superiority of transfer learning—exemplified by VGG16’s 90% accuracy achieved in just 6.7 minutes of training—strongly advocates for adopting pretrained models over custom architectures, particularly in resource-constrained settings where rapid deployment and minimal computational overhead are priorities. ResNet50’s catastrophic failure (0% specificity), however, underscores the risks of deploying ultra-deep architectures without domain-specific adaptation; while ResNet variants excel in natural image tasks (e.g., ImageNet classification), their complexity becomes a liability in niche applications with limited training data. Furthermore, VGG16’s robustness to aggressive augmentation (+25% rotation, +30% brightness adjustments) demonstrates its capacity to leverage synthetic data variations effectively, enabling practitioners to simulate challenging field conditions (e.g., variable lighting, soil debris) without destabilizing training—a key advantage for real-world agricultural imaging. These findings collectively emphasize that optimal model selection hinges not on raw accuracy alone, but on balancing architectural compatibility with domain requirements, training efficiency, and augmentation resilience to ensure practical applicability in dynamic agricultural environments.
4.5. Comparison with Existing Research in Crack Detection
While our research shares similarities with structural and road crack detection studies (Yang et al. 2021; Mandal, Uong, and Adu-Gyamfi 2018), our task introduces unique challenges. Unlike structural cracks, which often exhibit clear linear patterns, truffle cracks are irregular and embedded in heterogeneous soil textures, requiring models to discriminate subtle morphological differences. This complexity mirrors challenges in road crack detection, where background variations (e.g., asphalt textures, shadows) degrade performance (Zhang et al. 2016). However, our work diverges by focusing on crack-type differentiation rather than mere detection—a critical distinction for truffle hunters prioritizing specific subterranean features.
Notably, while Yang et al. (2021) reported ResNet18’s success in structural crack detection, our ResNet50 failed catastrophically. This discrepancy highlights fundamental differences between agricultural and structural imaging: cracks in concrete are macroscopic and high-contrast, whereas truffle cracks are fine-grained and context-dependent. Similarly, multi-scale feature extraction techniques (Zou et al. 2018), effective for road cracks, may require adaptation to address the micro-textural variations in soil imagery. These comparisons underscore the need for domain-specific architectural innovations rather than blind adoption of existing models.
4.6. Limitations and Future Directions
While VGG16 demonstrated robust performance (90% accuracy), its 10% error rate (3/30 test misclassifications) underscores persistent challenges in discriminating subtle crack morphologies under variable field conditions, particularly given the study’s reliance on a limited dataset of 216 images. This constraint limits generalizability, as truffle cracks exhibit significant morphological diversity across soil types and geographic regions. To address these limitations, future research should prioritize hybrid architectures that integrate VGG16’s early layers with attention mechanisms (e.g., squeeze-and-excitation blocks) to enhance focus on discriminative crack textures while suppressing background noise. Multi-scale processing techniques, such as pyramid pooling or dilated convolutions, could further improve detection by capturing both macro-crack patterns and micro-textural details, akin to multi-resolution analyses in geological surveys. Expanding dataset diversity through collaboration with agricultural agencies—collecting images across seasons, soil types, and regions—would ensure robustness to environmental variability. Additionally, re-evaluating ResNet50 with progressive unfreezing of residual blocks or domain-adaptive pretraining (using agricultural image corpora) could bridge the gap between ImageNet-derived features and crack textures. Integrating multi-modal sensing, such as combining image analysis with soil moisture probes or pH sensors, may enable holistic truffle-hunting systems that leverage correlations between soil conditions and crack formation. Despite these challenges, VGG16’s optimal balance of efficiency (6.7-minute training), stability (±0.15 loss fluctuation), and accuracy establishes it as a foundational framework for agricultural image analysis. Extending this work to multi-class classification (e.g., distinguishing truffle species by crack morphology) and deploying real-time detection on mobile platforms could revolutionize precision agriculture, reducing reliance on labor-intensive methods while maximizing yield consistency.
5. Conclusions
This study rigorously evaluated three deep learning architectures—a custom CNN, VGG16, and ResNet50—for detecting truffle cracks in land images, revealing critical insights into model performance and domain adaptability. The VGG16 transfer learning model demonstrated superior efficacy, achieving 90% accuracy and an F1 score of 0.903, significantly outperforming both the custom CNN (79.6% accuracy, F1=0.727) and ResNet50 (50% accuracy, F1=0.667). These results underscore the transformative potential of pretrained models in agricultural applications, where VGG16’s hierarchical feature reuse enabled robust crack discrimination despite limited training data (216 images). In contrast, ResNet50’s catastrophic failure (0% specificity) highlighted the risks of deploying overly complex architectures without domain-specific fine-tuning, while the custom CNN’s intermediate performance emphasized the inefficiency of training shallow networks from scratch.
The findings validate that CNNs, particularly when leveraging transfer learning, can reliably automate truffle crack identification, with VGG16’s high confidence scores (AUC=0.938) and augmentation resilience (+25% rotation, +30% brightness) demonstrating its suitability for variable field conditions. However, persistent challenges—such as subtle crack morphology discrimination under heterogeneous soil textures and a 10% error rate in VGG16’s predictions—highlight opportunities for refinement. Future work should prioritize hybrid architectures integrating attention mechanisms with VGG16’s early layers, synthetic data generation to address dataset limitations, and multi-modal systems combining image analysis with soil sensors (e.g., moisture probes).
By advancing these strategies, deep learning can revolutionize precision truffle harvesting, reducing reliance on labor-intensive methods and maximizing yield consistency. This research not only establishes VGG16 as a benchmark for agricultural texture recognition but also provides a framework for adapting pretrained models to niche domains, offering broader implications for smart farming and resource-efficient automation. The integration of such systems into agricultural workflows promises to enhance efficiency, scalability, and profitability for the global truffle industry.
Author Contributions
Conceptualization, A.R.; methodology, A.R.; software A.R.; validation, A.R.; formal analysis, A.R.; resources, A.R.; data curation, A.R.; writing—original draft preparation, A.R.; writing—review and editing, A.R.; visualization, A.R.
Funding
This research received no external funding.
Institutional Review Board Statement
Not applicable, as this study did not involve human or animal subjects. This article does not contain any studies with human participants or animals performed by any of the authors.
Informed Consent Statement
Not applicable.
Data Availability Statement
the image dataset used in this work is publicly available on a GitHub repository (https://github.com/Azad77/CNNsTruffle/tree/main (note: the link will be activated after the acceptance of the paper).
Conflicts of Interest
The author declare no conflicts of interest.
References
- Abadi, Martín, Ashish Agarwal, Paul Barham, Eugene Brevdo, Zhifeng Chen, Craig Citro, Greg S. Corrado, et al. 2016. “TensorFlow: Large-Scale Machine Learning on Heterogeneous Distributed Systems.” arXiv. http://arxiv.org/abs/1603.04467.
- Ali, Raza, Joon Huang Chuah, Mohamad Sofian Abu Talip, Norrima Mokhtar, and Muhammad Ali Shoaib. 2022. “Structural Crack Detection Using Deep Convolutional Neural Networks.” Automation in Construction 133. Elsevier: 103989. [CrossRef]
- Andrushia, A. Diana, T. Mary Neebha, S. Umadevi, N. Anand, and Katherine A. Cashell. 2022. “Shrinkage Crack Detection in Expansive Soil Using Deep Convolutional Neural Network and Transfer Learning.” KSCE Journal of Civil Engineering 26 (10): 4202–4213. [CrossRef]
- Chollet, François. 2018. “Keras: The Python Deep Learning Library.” Astrophysics Source Code Library, ascl-1806.
- Dhillon, Anamika, and Gyanendra K. Verma. 2020. “Convolutional Neural Network: A Review of Models, Methodologies and Applications to Object Detection.” Progress in Artificial Intelligence 9 (2): 85–112. [CrossRef]
- Gupta, Priyanka, and Manish Dixit. 2022. “Image-Based Crack Detection Approaches: A Comprehensive Survey.” Multimedia Tools and Applications 81 (28): 40181–40229. [CrossRef]
- Mandal, Vishal, Lan Uong, and Yaw Adu-Gyamfi. 2018. “Automated Road Crack Detection Using Deep Convolutional Neural Networks.” In 2018 IEEE International Conference on Big Data (Big Data), 5212–5215. IEEE. https://ieeexplore.ieee.org/abstract/document/8622327/.
- Meftah, Ibrahim, Junping Hu, Mohammed A. Asham, Asma Meftah, Li Zhen, and Ruihuan Wu. 2024. “Visual Detection of Road Cracks for Autonomous Vehicles Based on Deep Learning.” Sensors 24 (5). MDPI: 1647. [CrossRef]
- Oliach, Daniel, Enrico Vidale, Anton Brenko, Olivia Marois, Nicola Andrighetto, Kalliopi Stara, Juan Martínez de Aragón, Carlos Colinas, and José Antonio Bonet. 2021. “Truffle Market Evolution: An Application of the Delphi Method.” Forests 12 (9). MDPI: 1174. [CrossRef]
- Sishodia, Rajendra P., Ram L. Ray, and Sudhir K. Singh. 2020. “Applications of Remote Sensing in Precision Agriculture: A Review.” Remote Sensing 12 (19). MDPI: 3136. [CrossRef]
- Splivallo, Richard, Simone Ottonello, Antonietta Mello, and Petr Karlovsky. 2011. “Truffle Volatiles: From Chemical Ecology to Aroma Biosynthesis.” New Phytologist 189 (3): 688–699. [CrossRef]
- Sreenath, Sreehari, Haroon Malik, Narman Husnu, and Kanimozhi Kalaichelavan. 2020. “Assessment and Use of Unmanned Aerial Vehicle for Civil Structural Health Monitoring.” Procedia Computer Science 170. Elsevier: 656–663. [CrossRef]
- Yang, Cheng, Jingjie Chen, Zhiyuan Li, and Yi Huang. 2021. “Structural Crack Detection and Recognition Based on Deep Learning.” Applied Sciences 11 (6). MDPI: 2868. [CrossRef]
- Yasmin, Tamanna. 2022. “Deep Learning Based Concrete Distress Detection System for Civil Infrastructure.” Master’s Thesis, University of Nevada, Reno. https://search.proquest.com/openview/23699c810c2e03e2e08a9c2379561ae0/1?pq-origsite=gscholar&cbl=18750&diss=y.
- Zhang, Lei, Fan Yang, Yimin Daniel Zhang, and Ying Julie Zhu. 2016. “Road Crack Detection Using Deep Convolutional Neural Network.” In 2016 IEEE International Conference on Image Processing (ICIP), 3708–3712. IEEE. https://ieeexplore.ieee.org/abstract/document/7533052/.
- Zou, Qin, Zheng Zhang, Qingquan Li, Xianbiao Qi, Qian Wang, and Song Wang. 2018. “Deepcrack: Learning Hierarchical Convolutional Features for Crack Detection.” IEEE Transactions on Image Processing 28 (3). IEEE: 1498–1512. [CrossRef]
Figure 3.
Training performance of custom CNN for truffle crack detection.
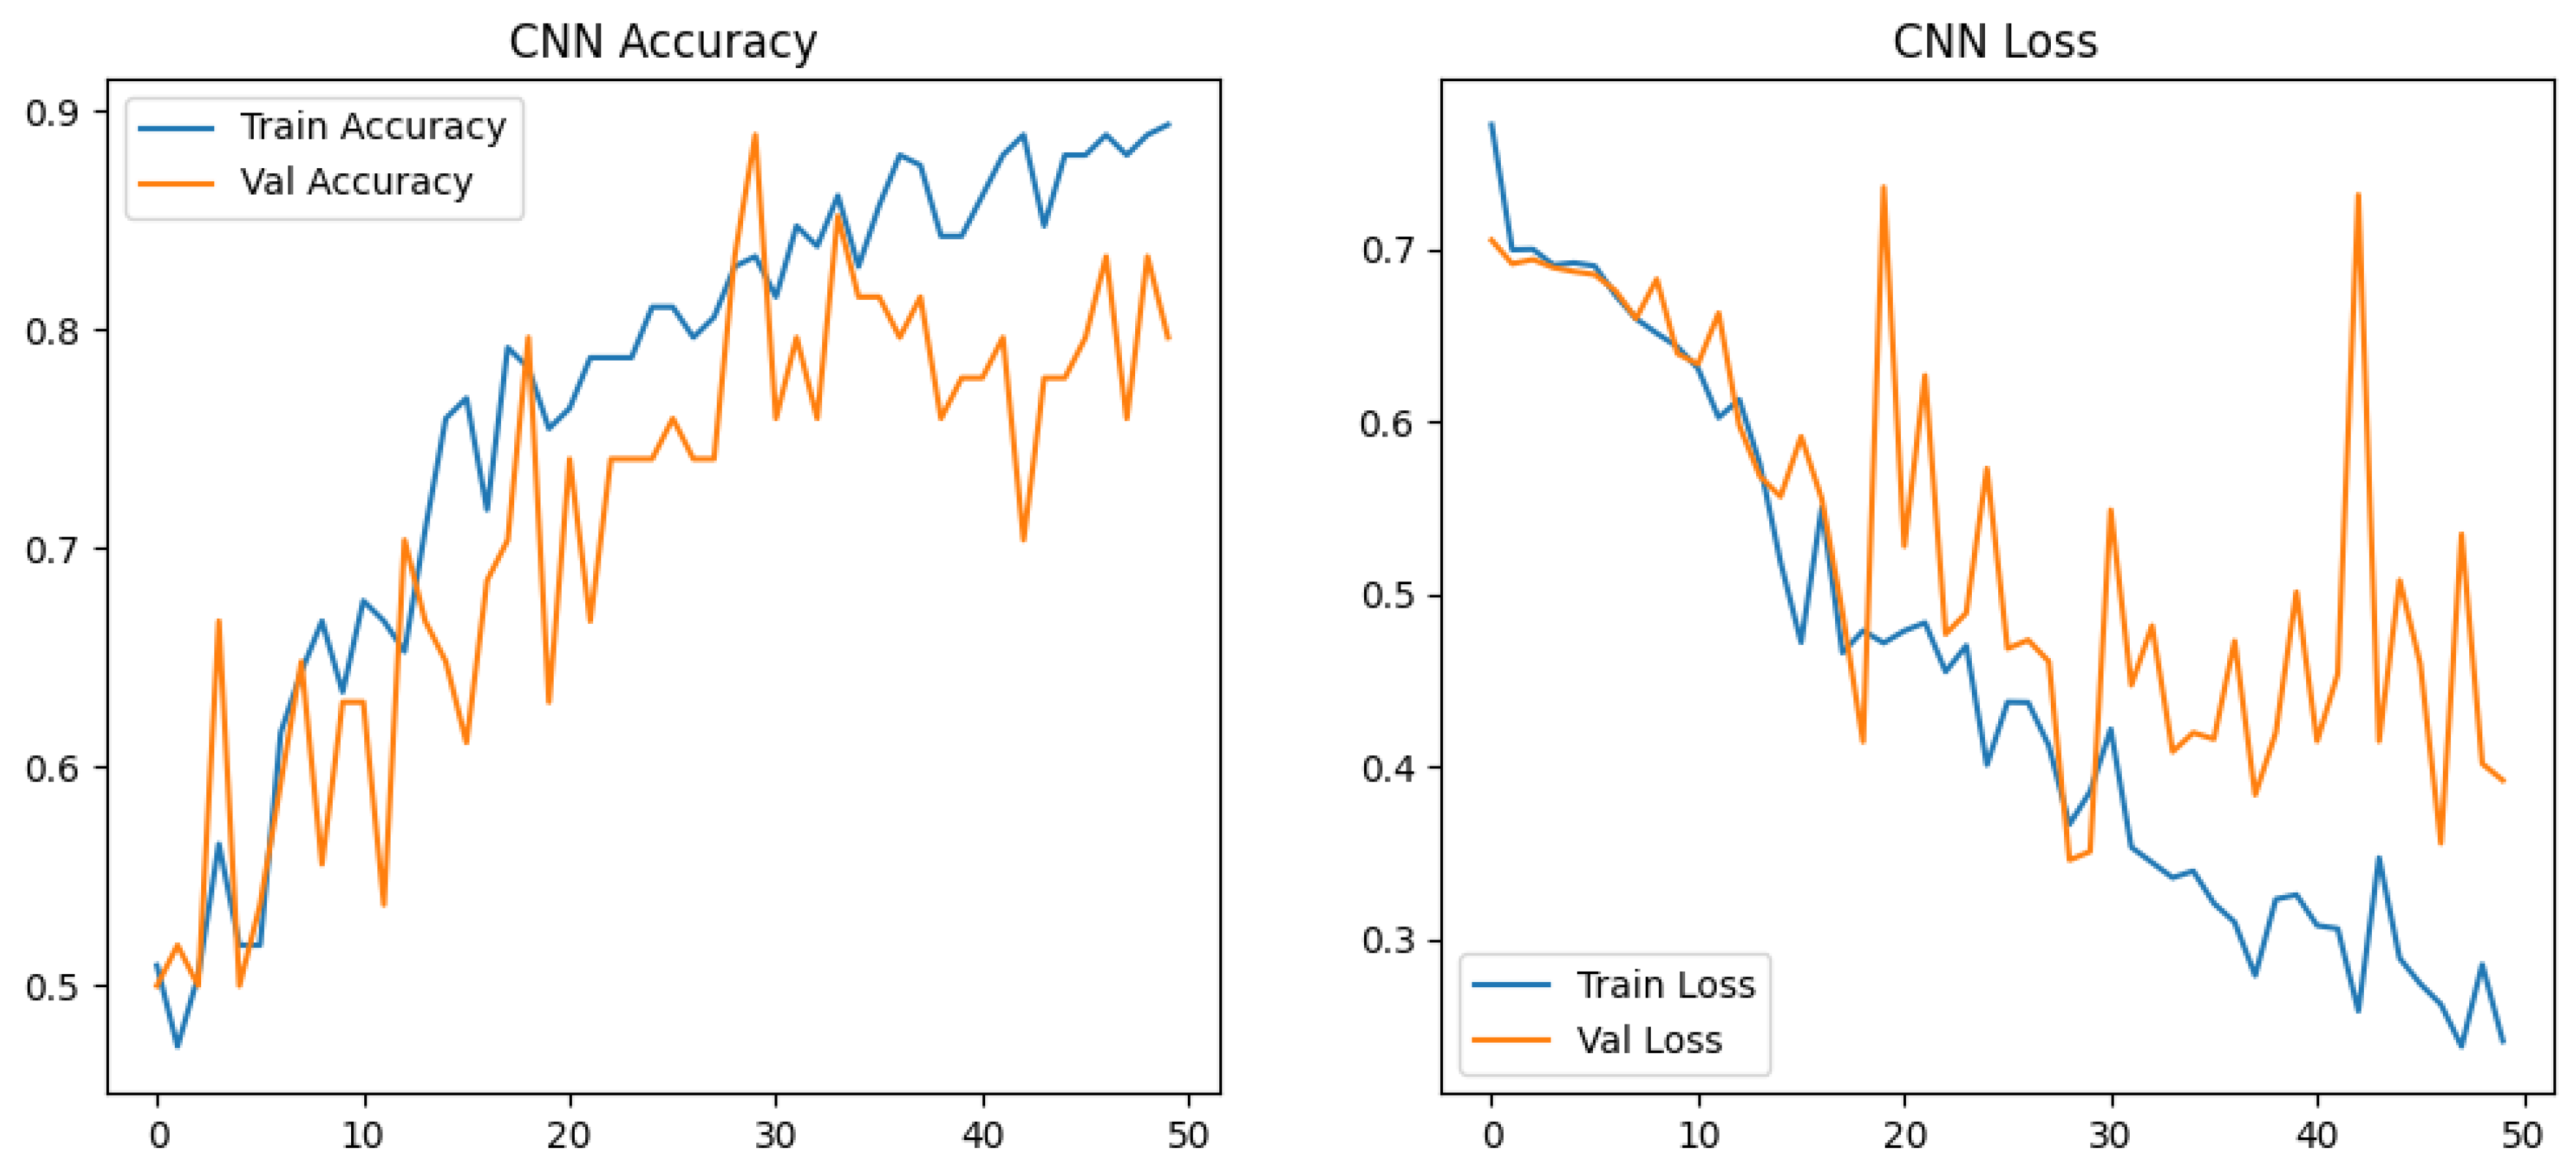
Figure 4.
Training performance of VGG16 for truffle crack detection.
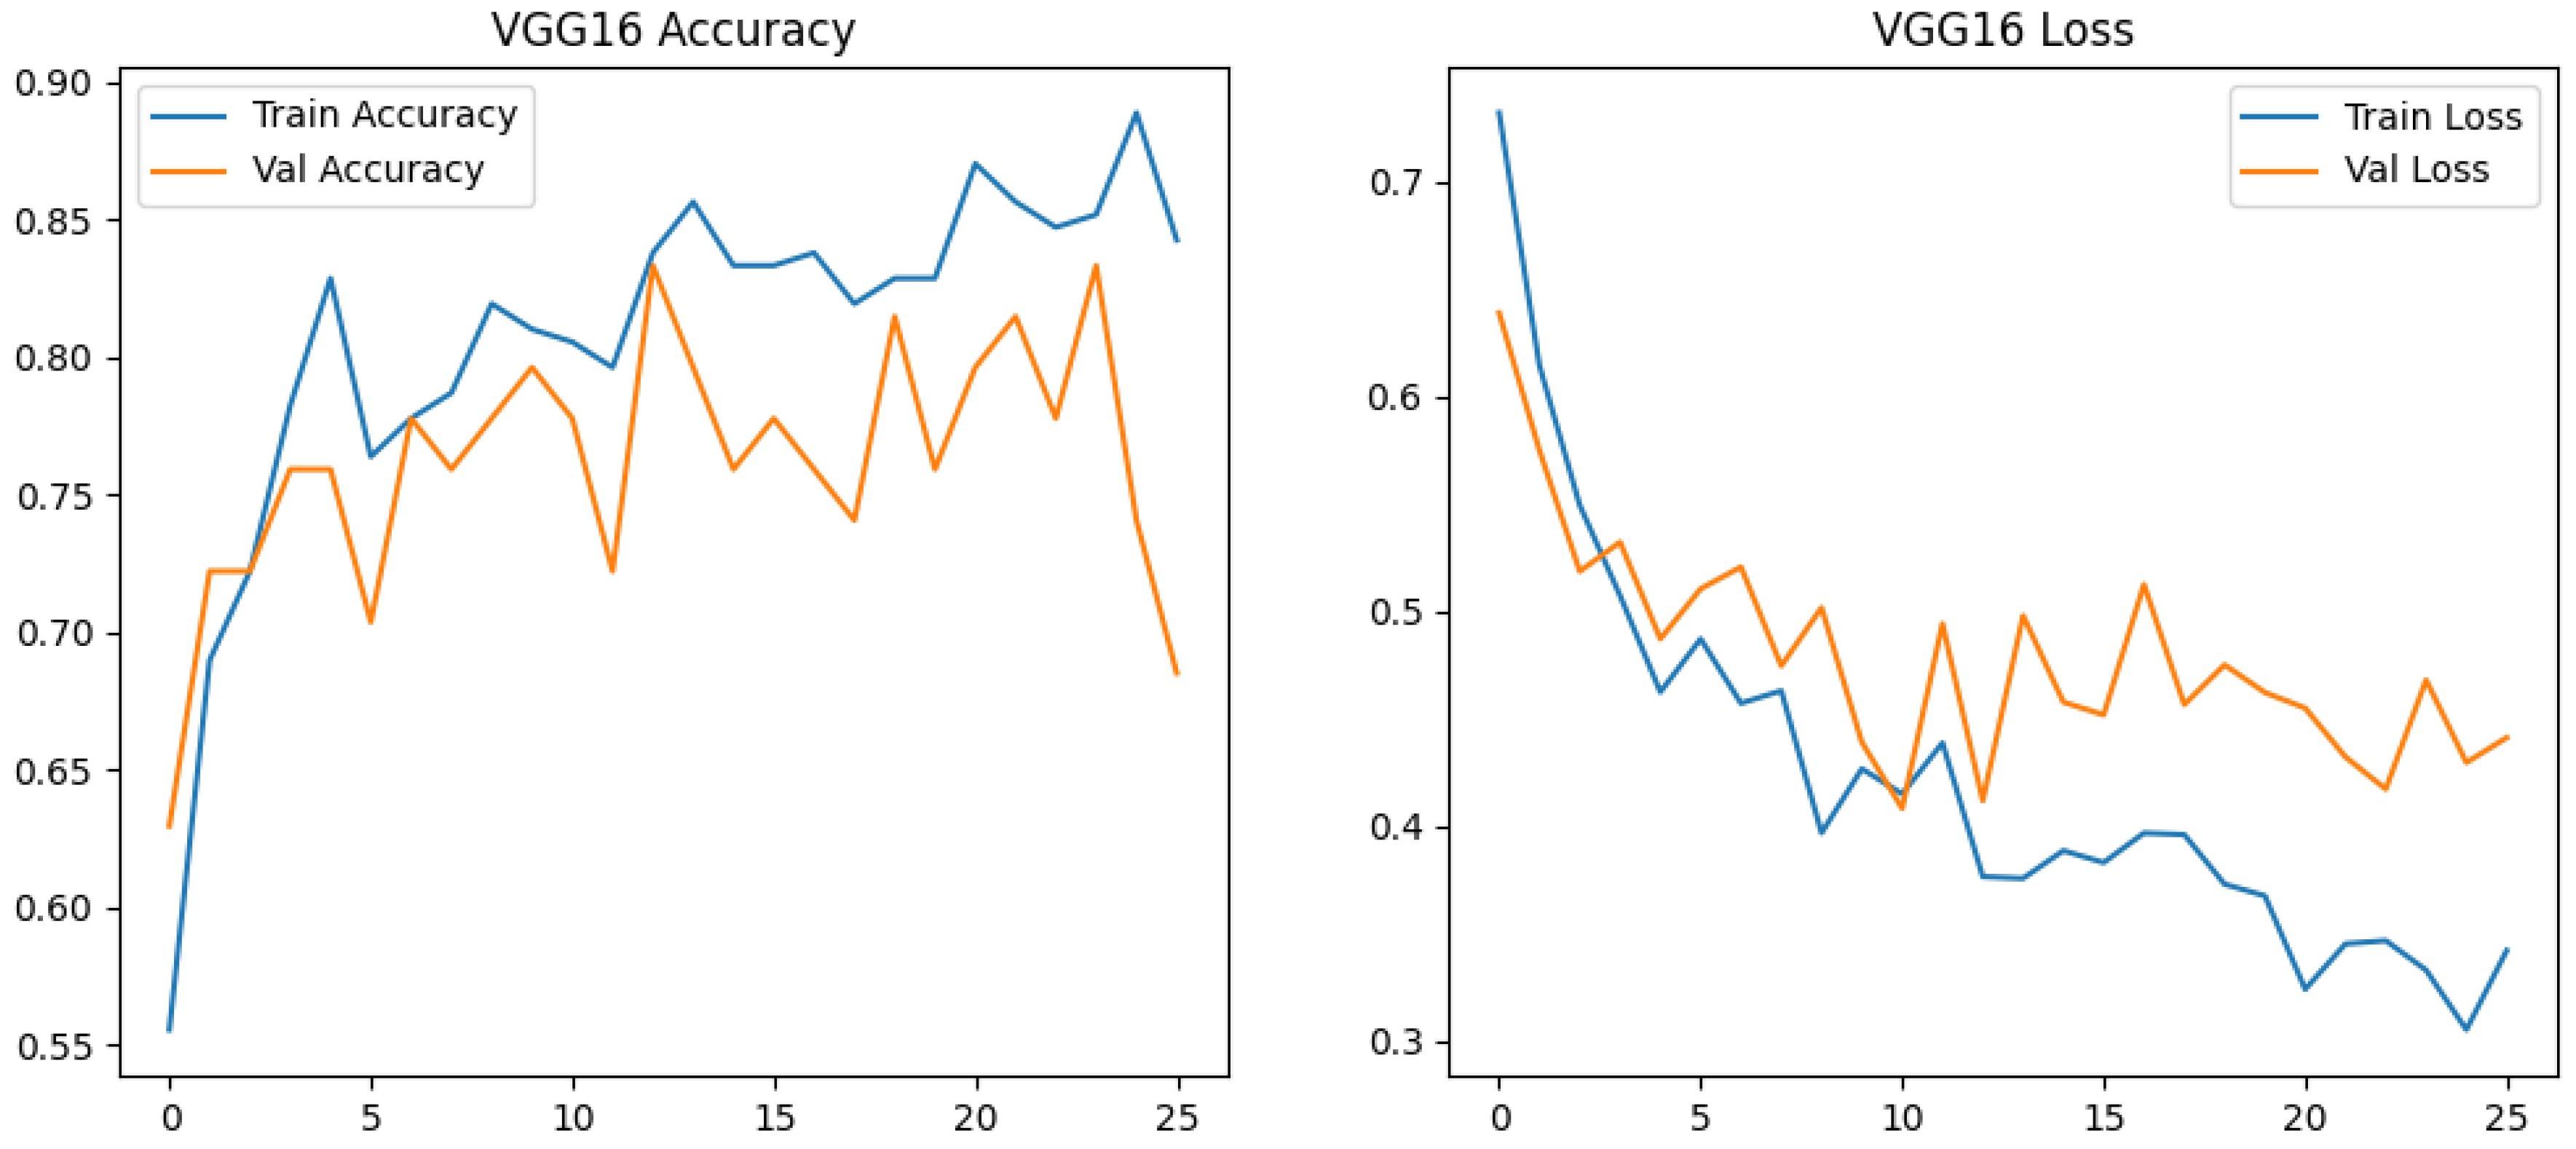
Figure 5.
Training Performance of ResNet50 for Truffle Crack Detection.
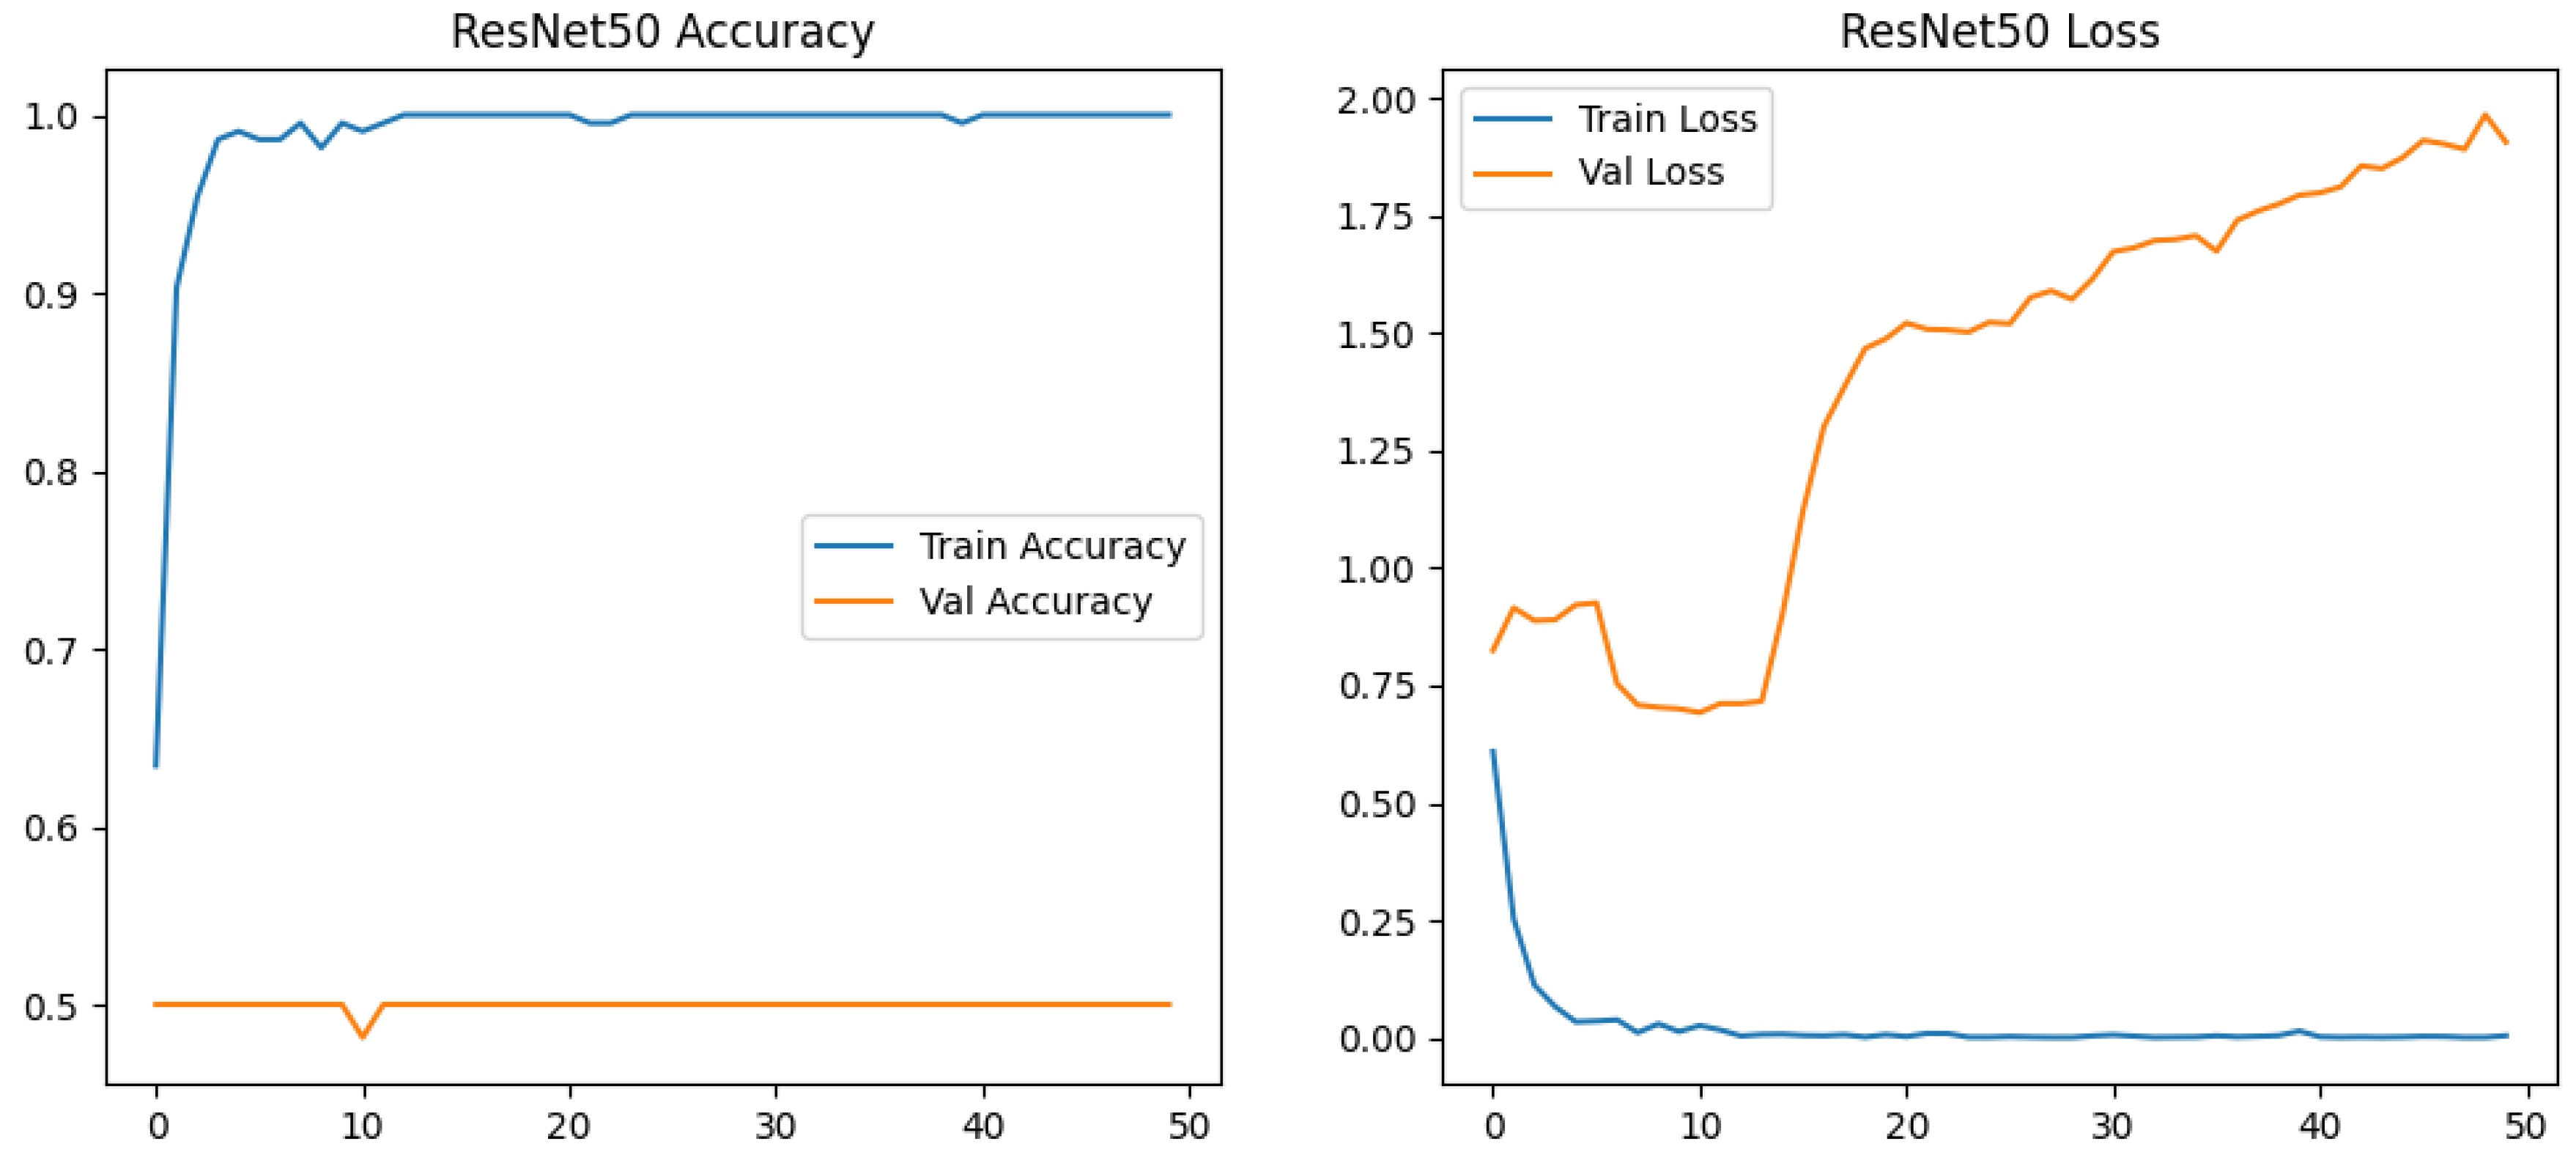
Figure 6.
Examples of correctly classified crack images. (a) Image ‘y101.JPG’ is a true positive, correctly identified as a truffle crack. (b) Image ‘n110.jpg’ is a true negative, correctly classified as an other crack.
Figure 6.
Examples of correctly classified crack images. (a) Image ‘y101.JPG’ is a true positive, correctly identified as a truffle crack. (b) Image ‘n110.jpg’ is a true negative, correctly classified as an other crack.
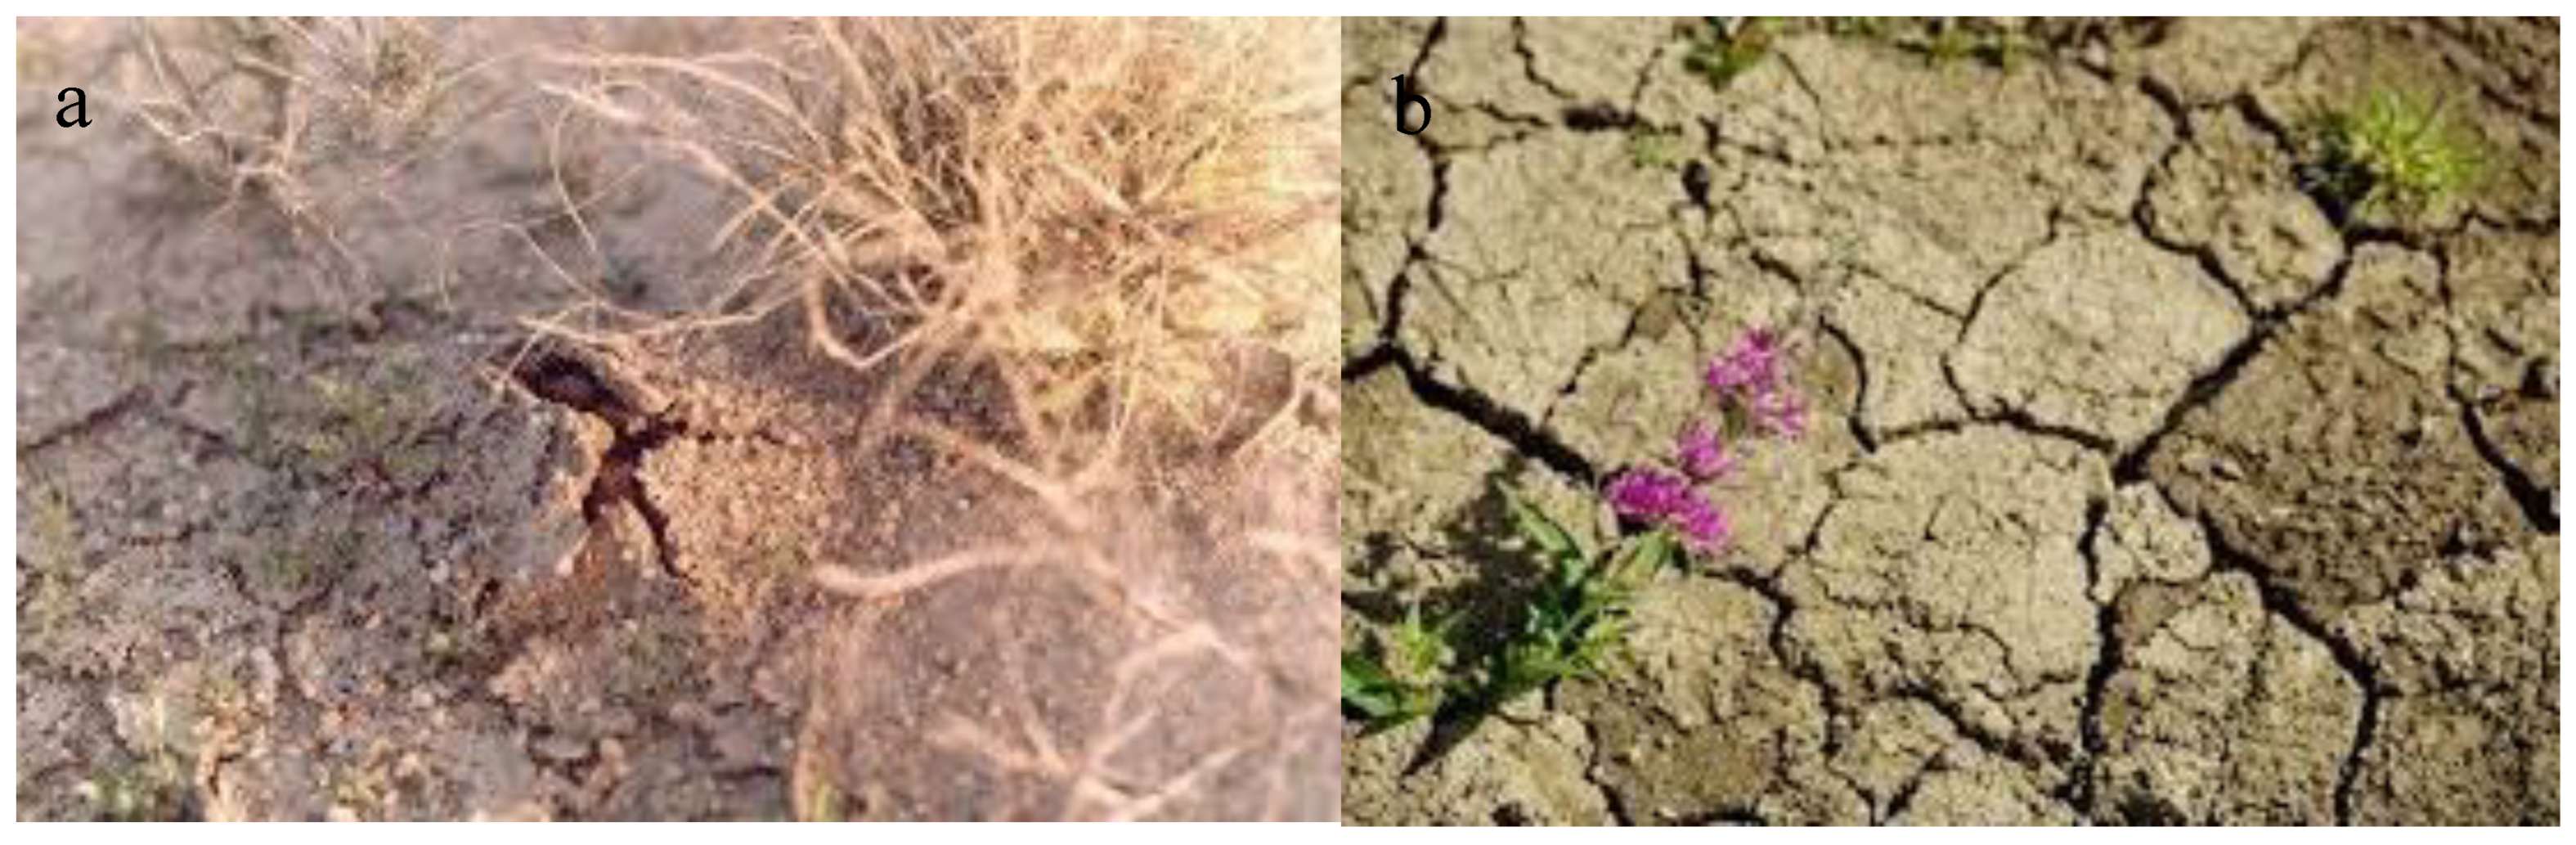
Figure 7.
Examples of incorrectly classified crack images. (a) Image ‘n105.jpg’ is a false positive, incorrectly classified as a truffle crack. (b) An example of a false negative where a truffle crack was missed.
Figure 7.
Examples of incorrectly classified crack images. (a) Image ‘n105.jpg’ is a false positive, incorrectly classified as a truffle crack. (b) An example of a false negative where a truffle crack was missed.
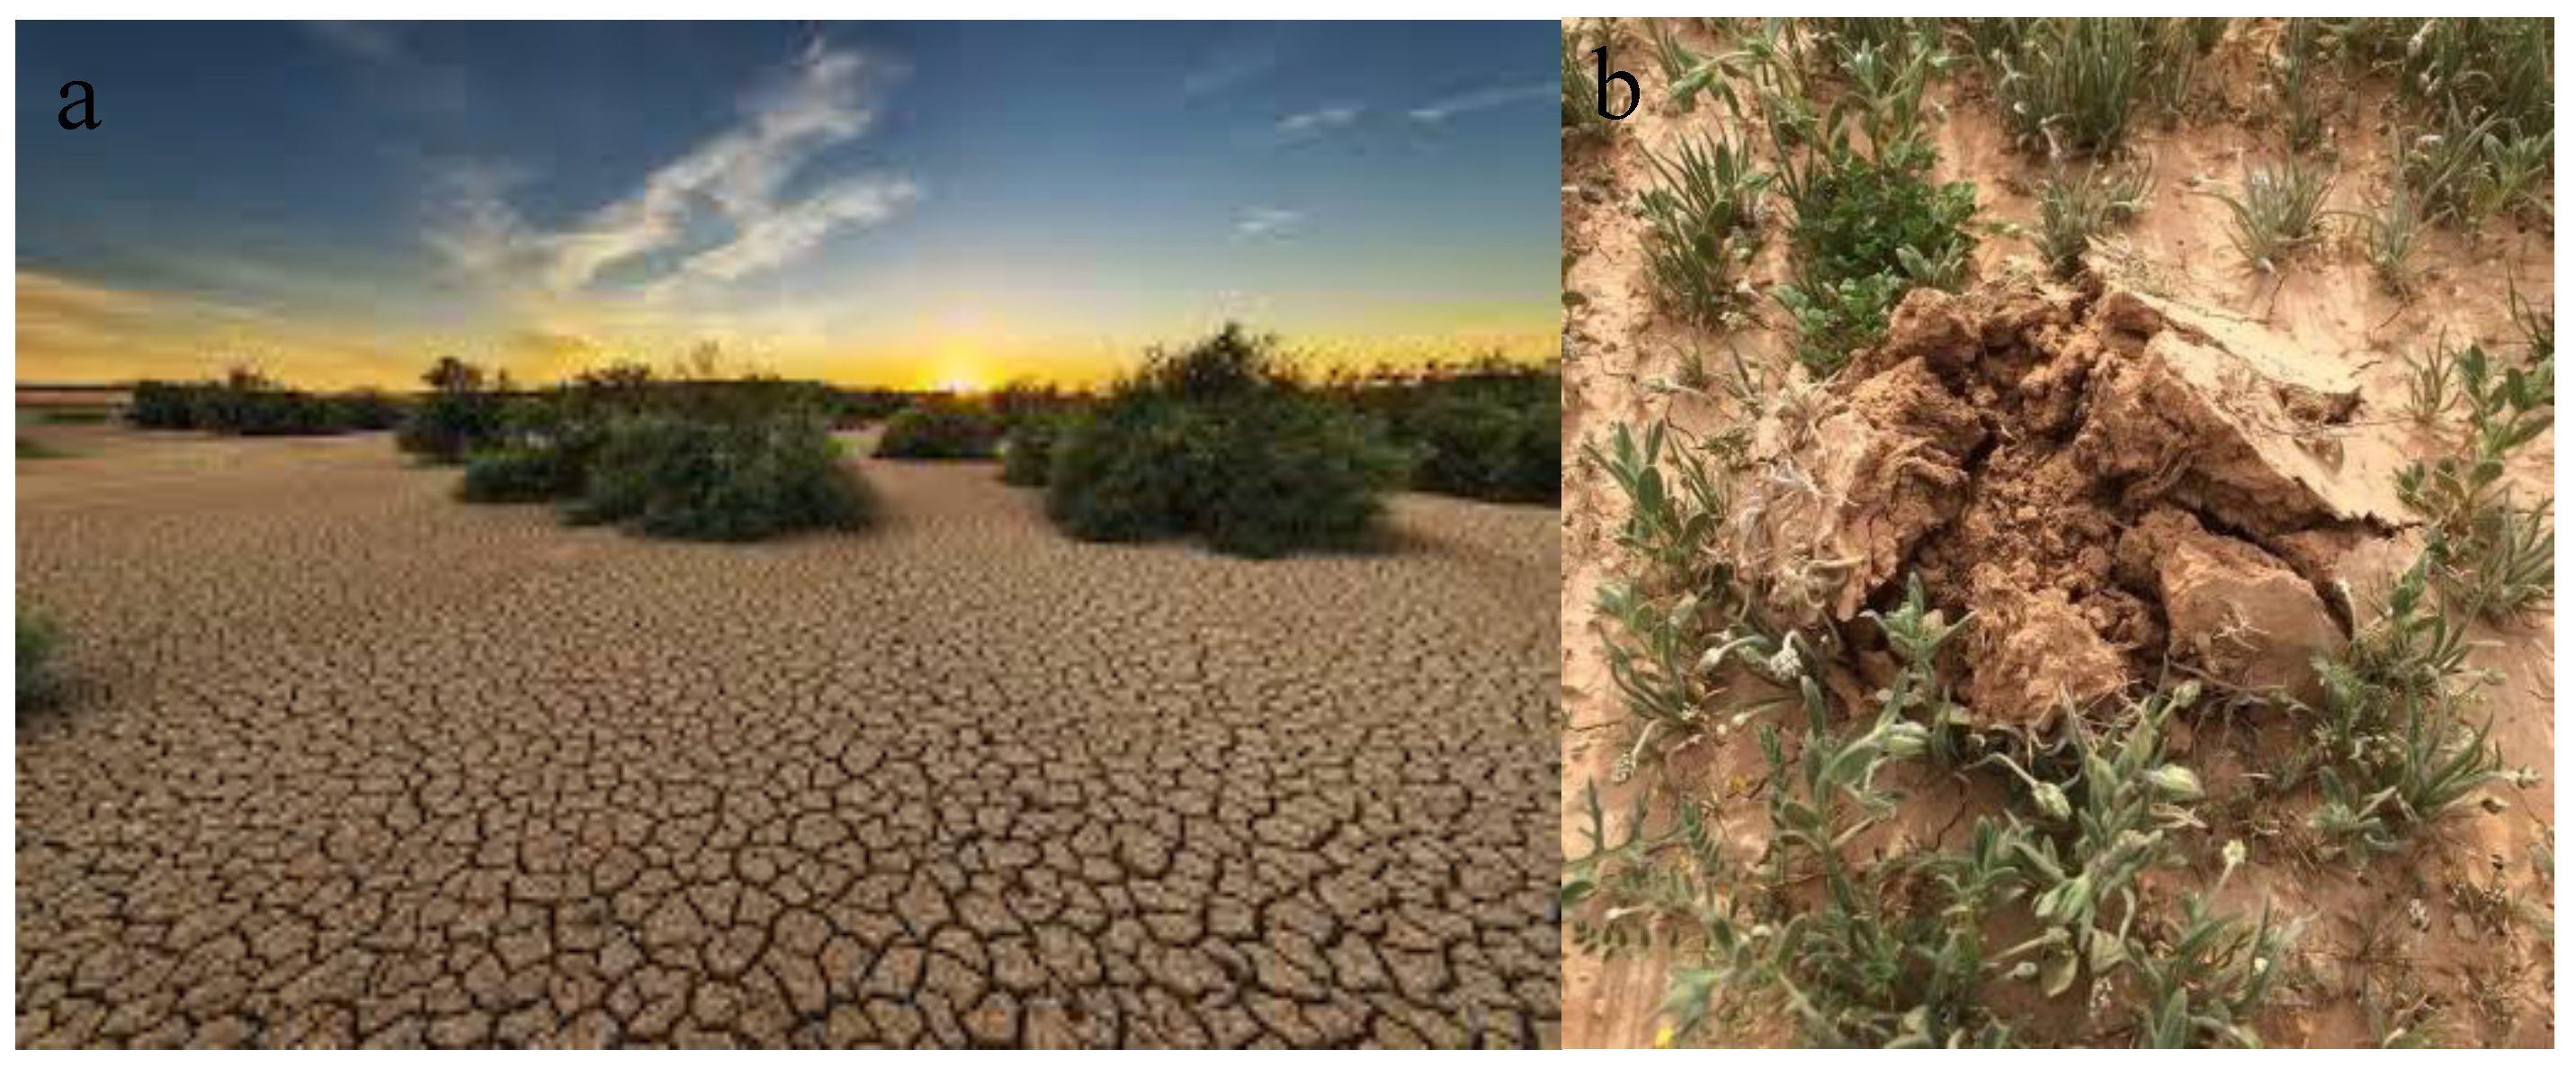

Table 1.
Comparative Performance.
| Model | Accuracy | Precision | Recall | Specificity | F1 Score | AUC |
|---|---|---|---|---|---|---|
| Custom CNN | 0.796 | 0.786 | 0.815 | 0.933 | 0.727 | 0.922 |
| VGG16 | 0.900 | 0.875 | 0.933 | 0.867 | 0.903 | 0.938 |
| ResNet50 | 0.500 | 0.500 | 1.000 | 0.000 | 0.667 | 0.780 |
Table 2.
Confusion Matrix Comparison Across Model Architectures for Truffle Crack Detection.
| Model | True Positives (TP) | False Positives (FP) | False Negatives (FN) | True Negatives (TN) | Total Samples |
|---|---|---|---|---|---|
| Custom CNN | 8 | 1 | 4 | 14 | 30 |
| VGG16 Transfer Learning | 14 | 2 | 1 | 13 | 30 |
| ResNet50 Transfer Learning | 15 | 15 | 0 | 0 | 30 |
Disclaimer/Publisher’s Note: The statements, opinions and data contained in all publications are solely those of the individual author(s) and contributor(s) and not of MDPI and/or the editor(s). MDPI and/or the editor(s) disclaim responsibility for any injury to people or property resulting from any ideas, methods, instructions or products referred to in the content. |
© 2025 by the authors. Licensee MDPI, Basel, Switzerland. This article is an open access article distributed under the terms and conditions of the Creative Commons Attribution (CC BY) license (http://creativecommons.org/licenses/by/4.0/).
Copyright: This open access article is published under a Creative Commons CC BY 4.0 license, which permit the free download, distribution, and reuse, provided that the author and preprint are cited in any reuse.


