Submitted:
11 August 2025
Posted:
12 August 2025
You are already at the latest version
Abstract
Since colonic dopamine levels undergo a sharp reduction in inflammatory bowel disease (IBD) and animal models, we study how dopaminergic signalling affects regulatory T cells (Treg), which are critical limiting gut inflammation. Previously, we showed that the stimulation of the high-affinity dopamine receptor Drd3 impairs the suppressive Treg ac-tivity and limits their colonic tropism upon gut inflammation. Here we study the role of the low-affinity dopamine receptor Drd2 in Treg, finding that stimulation of Drd2 favours the suppressive Treg activity and promotes their colonic tropism. Transcriptomic analysis of intestinal mucosa from IBD patients revealed an association with increased DRD3 and reduced DRD2 expression. Biochemical approaches revealed that Drd2 and Drd3 form a heteromeric receptor. Competition assays using α-helix peptides analogue to the trans-membrane (TM) segments from Drd2 and Drd3 showed that TM5 from Drd2 (TM5Drd2) and TM2Drd3 and TM6Drd3 disrupt the assembly of this heteromer. The Drd2:Drd3 het-eromer was expressed on colonic Treg, and its expression was increased upon inflamma-tion. The heteromer disassembly dampened the suppressive Treg activity and impaired their colonic tropism upon inflammation. Our findings indicate that the Drd2:Drd3 het-eromer constitutes a dopamine sensor that plays a critical role on the suppressive Treg ac-tivity and colonic tropism.
Keywords:
dopamine receptors
; regulatory T cells
; lymphocyte migration
1. Introduction
Inflammatory bowel diseases (IBDs) form a group of chronic remittent inflammatory disorders of the gastrointestinal tract, among which Crohn’s disease (CD) and ulcerative colitis (UC) are the most common. Evidence from mouse models of inflammatory colitis and samples obtained from CD and UC patients has indicated that gut inflammation in IBD is driven mainly by the inflammatory effector CD4+ T-cell (Teff) subsets T-helper 1 (Th1) and Th17 [1,2]. In addition, regulatory T cells (Treg), a suppressive subset of lymphocytes playing a crucial role in maintaining intestinal homeostasis in healthy conditions, seems to be dysfunctional in IBD [3]. The transfer of exogenous Treg cells suppresses inflammation induced by Th1 and Th17 lymphocytes in mouse models of inflammatory colitis [4,5,6]; and the main suppressive mechanism rely on interleukin (IL)-10 secretion by these cells. Indeed, the specific ablation of the il10 gene in Treg (Foxp3+ CD4+) cells results in spontaneous colitis, highlighting the fact that IL-10 produced by Treg is fundamental in maintaining tolerance, particularly at intestinal tissues [7]. Treg cells are increased in the inflamed lamina propria of IBD patients in comparison to non-inflamed mucosa and mucosa from healthy controls. After isolation, these cells retain their ability to suppress effector T-cells in vitro [8,9], thus suggesting that suppressive activity of Treg may be attenuated just in situ by mediators produced by the inflamed gut mucosa.
The marked decrease of dopamine levels in the inflamed gut mucosa from CD and UC patients [10] may affect the function of immune cells expressing dopamine receptors, including Treg and Teff. Importantly, reduced levels of intestinal dopamine have also been observed in inflamed gut mucosa using animal models of inflammatory colitis [11,12]. Dopamine exerts its effects by stimulating dopamine receptors, termed Drd1-Drd5; all belonging to the superfamily of G-protein coupled receptors (GPCRs) [13]. It is important to consider that each dopamine receptor displays different affinities for dopamine, being the Ki values (in nM) 27, 228, 450, 1705, 2340, for Drd3, Drd5, Drd4, Drd2 and Drd1 respectively; thereby their stimulation depends on dopamine levels [12]. Our previous studies showed that Drd3-deficient naive CD4+ T-cells display impaired Th1 differentiation and reduced Th17 expansion [14,15]. The reduction in intestinal dopamine levels (from ≈1000 nM in healthy individuals to ≈100 nM in CD and UC patients [10,16]) and the fact that Drd3 may be selectively stimulated at low dopamine concentrations [17], suggest that low dopamine levels in inflamed gut mucosa favour the inflammatory potential of CD4+ T-cells, thus promoting gut inflammation. Accordingly, our previous work has shown that Drd3-deficiency in CD4+ T-cells results in attenuated inflammatory colitis in mice [14].
Emerging evidence from several animal models of inflammation indicates that high dopamine levels exert a strong anti-inflammatory effect by stimulating low-affinity dopamine receptors, including Drd1 and Drd2 [18,19,20]. In this regard, high dopamine concentrations in the gut of healthy individuals would stimulate Drd1 in macrophages, attenuating the activation of the inflammasome NLRP3 and thereby abrogating the production of inflammatory cytokines [19]. Moreover, high dopamine levels would promote DRD2-stimulation, thus aiding the production of the anti-inflammatory cytokine IL-10 by human CD4+ T-cells in vitro [21] and also reducing both increased motility and ulcer development in an animal model of intestinal lesions [22]. Indeed, the genetic polymorphism of the DRD2 gene includes an allele that involves decreased receptor expression, a risk factor for IBD [23]. Accordingly, although the frequency of Treg cells did not change in the gut, suppressor function of intestinal Treg cells was compromised in inflammatory colitis [3], a condition associated with decreased dopamine levels [11]. Moreover, the impairment of suppressive Treg function was abolished by the administration of cabergoline, a Drd2 agonist [3,24]. Thus, collectively these findings suggest that Drd2-signalling in Treg cells promotes suppressive function in a healthy gut mucosa containing high dopamine levels.
Gut-homing of T-cells is a fundamental process to maintain tolerance to food- and microbiota- derived antigens. CD103+ dendritic cells (DCs) capture antigens coming from the gut lumen, process them and migrate from the intestine into mesenteric lymph nodes (MLN) and Peyer’s patches (PP), where they present these antigens to naïve CD4+ T-cells [25,26,27]. Differently from DCs from other sources, CD103+ DCs coming from the gut express retinaldehyde dehydrogenase 2, which allows them to synthesize retinoic acid (RA) using the vitamin A captured from the gut [26]. By producing RA, CD103+ DCs induce the up-regulation of the chemokine receptor 9 (CCR9) and the integrin α4β7 in activated CD4+ T-cells, thus imprinting gut tropism to these cells. Thereby, in the absence of inflammatory cues, CD103+ DCs arriving to MLN and PP, present antigens to antigen-specific naïve CD4+ T-cells inducing their differentiation into Treg cells with gut tropism [27]. Subsequently, these Treg cells are recruited to the gut by CCL25 (a chemokine produced by endothelial cells in gut mucosa, corresponding to the ligand for CCR9) and MadCAM-1 (Mucosal vascular addressin Cell Adhesion Molecule 1, a surface molecule expressed by mucosal venules, which corresponds to the ligand of α4β7 integrin) to infiltrate into the gut lamina propria. Once Treg cells infiltrate the gut mucosa, they are exposed to IL-10, a cytokine produced constitutively by mucosal homeostatic CD11c+ macrophages [28]. This step is required to confer IL-10-producing capacity to Treg, a critical function for the generation of oral tolerance [27]. Our previous study showed that the heteromer formed by CCR9 and Drd5 is the surface receptor that provide gut tropism to Teff (but not to Treg) upon gut inflammation [29]. Thus, this data indicates that dopaminergic signalling plays an important role in T-cell migration upon gut inflammation.
Our previous study shows that genetic Drd3-deficiency results in attenuated disease manifestation in two mouse models of inflammatory colitis, which was associated with increased IL-10 production by Treg cells infiltrating the colonic lamina propria. Furthermore, Drd3-deficiency enhanced Treg gut tropism, favouring their infiltration into the colonic mucosa upon intestinal inflammation [30]. Accordingly, Drd3-deficiency in Treg cells exacerbated their therapeutic potential in vivo when transferred into wild-type mice undergoing inflammatory colitis [30]. Here we aimed to study the role of Drd2 in Treg in gut inflammation. Interestingly, compared to Drd3-mediated effects, our results indicate that Drd2-signalling induces an opposite effect on the suppressive activity and gut tropism in Treg. Strikingly, we found that Drd2 and Drd3 form a heteromeric complex that works as a dopamine sensor triggering different biological effects on Treg depending on the levels of dopamine.
2. Results
2.1. Drd2-Signalling Favours the Suppressive Activity of Treg and Limits Gut Inflammation
To address the role of Drd2-signalling in CD4+ T-cells in the context of gut inflammation, we used the mouse model of inflammatory colitis induced by the administration of dextran sodium sulfate (DSS) in the drinking water, as in our previous study [30]. Since we hypothesized that Drd2-signalling in CD4+ T-cells is anti-inflammatory, we analysed the disease manifestation in mice harbouring Drd2-deficient CD4+ T-cells (Drd2flox/flox/CD4Cre mice, here called Drd2f/f/CD4Cre) using a suboptimal concentration of DSS (1%). The disease severity was quantified as the extent of the loss of initial body weight. As expected, the results show that Drd2f/f/CD4Cre mice developed a more severe disease manifestation when compared with mice harbouring Drd2-sufficient CD4+ T-cells (Drd2f/f, control littermates) (Figure 1A). To test whether this exacerbated inflammatory response was related to a lower Treg response in Drd2f/f/CD4Cre mice, we next analysed the production of IL-10 by CD4+ T-cells associated to the intestine. To this end, cells isolated from the MLN of these mice were restimulated ex vivo and the extent of IL-10 production by CD4+ T-cells was quantified by intracellular cytokine staining followed by flow cytometry analysis. The results show that the Drd2-deficiency in CD4+ T-cells results in a significant reduction in the IL-10 production by these cells under inflammatory conditions (Figure 1B). To gain more robust evidence in the anti-inflammatory role of Drd2-signalling in vivo, we aimed to complement the genetic evidence with a pharmacologic approach. For this purpose, wild-type mice were treated with a single i.p. injection of a selective Drd2-agonist (sumanirole) or only vehicle (as a control) and then exposed to optimal concentrations of DSS (1,75%). The results show a significant attenuation of the disease manifestation in those mice receiving sumanirole (Figure 1C), indicating a therapeutic potential for the pharmacologic stimulation of Drd2 in the context of inflammatory colitis. Since all these results suggest that Drd2-stimulation favours Treg suppressive activity (Figure 1 A–C), although without directly evaluating Drd2-signalling on Treg activity, in vitro suppressive assays were undertaken to gain direct evidence on Drd2 effect in Treg activity. Accordingly, Treg were stimulated with a Drd2 agonist or vehicle in vitro and then the ability to suppress the proliferation of naïve CD4+ T-cells was quantified. The results revealed that Drd2-stimulation improves substantially Treg suppressive activity (Figure 1D). Altogether these results provide genetic and pharmacologic evidence indicating that Drd2-signalling enhances the ability of Treg to reduce gut inflammation.
2.2. Drd2-Signalling Promotes Colonic Tropism of Treg Upon Gut Inflammation
Since we observed opposite biological effects of Drd2 (Figure 1) and Drd3 [30] on the suppressive Treg activity we wondered whether these divergent effects extended to the regulation of gut tropism [30]. Accordingly, we used an in vivo migration assay in which congenic Treg cells isolated from mice harbouring Drd2-deficient (KO; CD45.2+) or Drd2-sufficient (WT; CD45.1+) CD4+ T-cells were i.v. transferred into wild-type congenic recipient mice (CD45.1+ CD45.2+) previously exposed to optimal DSS concentrations for 72 h. After 48 additional hours the arrival of donor Treg was quantified in the colonic lamina propria and the spleen (as a control). The results revealed a substantial and selective reduction on the arrival of Drd2-deficient Treg into the colonic lamina propria without changes in the ability of these cells to reach the spleen (Figure 2A). Since our previous work indicated that Drd3-signalling reduced the surface CCR9 expression on Treg and consequently dampened their arrival to the inflamed colonic mucosa [30], which release CCL25 [31], we next determined the effect of Drd2 on CCR9 expression and on CCL25-induced migration. To this end, we obtained Treg cells from MLN of mice harbouring Drd2-deficient or Drd2-sufficient CD4+ T-cells and compared their migratory ability towards CCL25 in transwell assays. Whereas the migration of Drd2-sufficient Treg was significantly increased by CCL25, this chemokine had no effect on the extent of migration of Drd2-deficient Treg (Figure 2B). In agreement with the loss of CCL25-induced migration on Drd2-deficient Treg, we detected a significant reduction on the surface CCR9 expression of these cells (Figure 2C). Overall, these results indicate that Drd2-signalling on Treg is required to induce a proper CCR9 expression, and the consequent migration to CCL25, facilitating their recruitment into the colonic lamina propria upon gut inflammation.
2.3. IBD Patients Display Increased DRD3 and Reduced DRD2 Expression in Mucosal Lesions
Since previous results show Drd2 signalling favouring colonic tropism of Treg and their suppressive activity compared to Drd3 stimulation limiting gut tropism and suppressive activity of Treg [30], we questioned whether the expression of these receptors was altered in IBD patients. Accordingly, we compared the DRD2 and DRD3 transcripts levels obtained from intestinal mucosa of IBD patients and healthy controls (HC). Bulk RNA-sequencing data of intestinal biopsies from HC, CD and UC patients [32] showed a reduced expression of DRD2 in inflamed colonic tissue of UC patients compared to the flanking non-inflamed tissue and HC tissue (Figure 3). No differences in DRD2 expression were found in the ileum. Remarkably, the inflamed colonic mucosa and flanking areas from CD or UC patients expressed higher levels of DRD3 compared to HC (Figure 3). DRD3 levels were also increased in inflamed ileum mucosa of IBD patients compared to HC (Figure 3). Altogether, these results reveal that gut inflammation in IBD is associated with an increase in DRD3 expression and a reduction in DRD2 expression, especially in the colonic mucosa.
2.4. Drd2 and Drd3 Form an Heteromeric Complex on Colonic Treg Cells
Since Drd2 and Drd3 signalling exerts opposite biological effects at the level of suppressive activity and colonic tropism of Treg, we suspected that such a crosstalk might be mediated by a receptor heteromer formation. To address this possibility, we transfected HEK293T cells with a constant amount of cDNA coding for Drd3 fused to RLuc (Drd3-RLuc) and increasing amounts of cDNA coding for Drd2 fused to YFP (Drd2-YFP) and conducted bioluminescence resonance energy transfer (BRET) assays in the presence of a luciferase substrate. The results revealed a BRET saturation curve (Figure 4A), indicating a specific interaction between Drd2 and Drd3. To determine whether the Drd2:Drd3 interaction is selective, we performed similar experiments, but transfecting the adenosine receptor A1 (A1R) fused to RLuc (A1R-RLuc) instead Drd3-RLuc, and we observed no significant BRET, indicating no interaction between A1R and Drd2 (Figure 4A). Afterwards, we aimed to determine the transmembrane (TM) segments from Drd2 and from Drd3 involved in this interaction. We designed α-helix peptides with an analogous sequence to the Drd2 or Drd3 TM domains, coupled to a cell-penetrating peptide derived from the transactivator of transcription (TAT) protein of the human immunodeficiency virus giving proper orientation to each peptide within the plasma membrane (Table 1). These TAT-TM peptides were tested in HEK293T cells expressing the Drd2 fused to the N-terminal half of YFP (Drd2-nYFP) and the Drd3 fused to the C-terminal half of YFP (Drd3-cYFP); The heteromer assembly was determined as the YFP associated fluorescence in bimolecular fluorescence complementation (BiFC) assays in the absence or in the presence of different TM peptides. Among the different peptides derived from TM segments from Drd2, the only peptide able to decrease the YFP fluorescence was the TM5 (Figure 4B), whereas in the case of the Drd3, peptides corresponding to TM2 and TM6 induced a significant interference in the generation of YFP fluorescence (Figure 4C). These results revealed three TM segments able to disrupt the assembly of the Drd2:Drd3 heteromer, suggesting that these segments, TM5 from Drd2, and TM2 and TM6 from Drd3, are involved in the interfaces of interaction required for the heteromer assembly.
Afterwards, we wondered whether the Drd2:Drd3 heteromeric complex was expressed in primary colonic Treg cells and, if so, whether the expression of the complex is altered upon inflammation. For this purpose, we treated Foxp3gfp reporter mice with DSS (1,75%) or only water (healthy controls) for 8 days and then, the presence of the Drd2:Drd3 complex was analysed on Treg (GFP+ cells) and non-Treg lymphoid cells (GFP−) in the colonic tissue by in situ proximity ligation assay (PLA). Of note, the in situ PLA has been instrumental to determine whether two proteins are in close proximity in primary cells and tissues [33]. The density of Drd2:Drd3 complex expression was quantified as the number of red dots per cell (ratio, R). The results show that, under homeostatic conditions, Treg (GFP+ cells) express higher density of Drd2:Drd3 complex expression than non-Treg lymphoid cells (GFP−) (Figure 5A,B). Similarly, under inflammatory conditions, the Drd2:Drd3 complex expression was higher in GFP+ cells than in GFP− cells (Figure 5A,B). Interestingly, the density of Drd2:Drd3 complex expression increased in both Treg and non-Treg lymphoid cells upon DSS-induced inflammation (Figure 5A,B).
To confirm that the Drd2:Drd3 complex expression detected on PLA was dependent on Drd2 and Drd3, we conducted similar experiments in Drd2f/f/CD4Cre (Drd2−/−), Drd3−/− (Drd3−/−), or Drd2+/+Drd3+/+ (WT) Foxp3gfp reporter mice treated with DSS or normal drinking water (control) for 8 days followed by in situ PLA analysis in the colonic mucosa. Interestingly, these results revealed that the extent of Treg (GFP+ cells) in the colonic mucosa increased with inflammation, an effect that was dependent on Drd2 and Drd3 (Figure 6A,B). The Drd2:Drd3 complex expression on Treg (GFP+ cells) was lower in knockout mice both in the density of expression (R; Figure 6C) and in the percentage of PLA+ cells (Figure 6D). Also, the density of Drd2:Drd3 complex expression on Treg (GFP+ cells) was increased upon DSS treatment only in WT mice, but not in knockout mice (Figure 6C). However, the percentage of PLA+ Treg cells was not increased with inflammation in any of the genotypes (Figure 6D). These results indicate that under inflammatory conditions the number of Drd2:Drd3 complexes in colonic Treg, but not the number of Treg cells expressing the Drd2:Drd3 complex, increases.
Regarding non-Treg lymphoid cells (GFP−), the percentage of cells expressing Drd2:Drd3 complexes was significantly decreased in wild-type (WT) mice upon inflammation (Figure 6D), and these PLA+ GFP− cells were barely detectable in DSS-treated or non-treated knockout mice (Figure 6D). The increased density of Drd2:Drd3 complexes expression on GFP− cells observed in WT upon inflammation was abrogated only by Drd3 deficiency, but not in Drd2f/f/CD4Cre Foxp3gfp mice (Figure 6C). This result might be due to the expression of the Drd2:Drd3 heteromer in another type of lymphoid cells, possibly γδT cells or innate lymphoid cells.
2.5. The Drd2:Drd3 Heteromer Controls the Suppressive Activity and Colonic Tropism of Treg
Since the highest expression of the Drd2:Drd3 heteromer in the colonic mucosa was observed in Treg cells, which further increases upon inflammation, and both Drd2 and Drd3 exert an important regulation on the suppressive activity and colonic tropism of Treg in inflammatory conditions, we next addressed the relevance of the Drd2:Drd3 heteromer in the suppressive activity and colonic tropism of Treg in gut inflammation. Accordingly, we isolated Treg (GFP+) from Foxp3gfp reporter mice which were treated with a peptide able to disrupt the assembly of the Drd2:Drd3 heteromer, the TM5 from Drd2 (TM5Drd2), or with a peptide irrelevant for the heteromer assembly (TM1Drd2), and then we determined the suppressive activity in vitro both in the presence or in the absence of dopamine. The results show that, only when the heteromer is disrupted by TM5Drd2, the presence of dopamine abrogated the suppressive activity of Treg cells (Figure 7A,B). The presence of dopamine did not significantly affect the Treg suppressive activity in the absence of peptides or in the presence of the non-disrupting peptide TM1Drd2 (Figure 7A,B). Accordingly, the treatment of Treg with the disrupting peptide TM5Drd2 induced a substantial reduction in the levels of IL-10 in the culture supernatant (Figure 7C). Further analysis of molecules involved in the suppressive Treg activity revealed that the Drd2:Drd3 heteromer disruption reduced selectively the expression of CD25, with no effect on the expression of CTLA-4, PD1 and Blimp-1 (Figure S1). Altogether, these results suggest that, in the presence of high dopamine levels, similar to those in the colon under homeostatic conditions (≈ 2 µM), the intact Drd2:Drd3 heteromer avoids the Drd3-signalling, which inhibit the suppressive activity of Treg [30]. These results also suggest that the Drd2:Drd3 heteromer effect on Treg suppressive activity is mediated by affecting the IL-10 production and the surface CD25 expression.
Analogously, we next aimed to determine relevance of the Drd2:Drd3 in the ability of Treg to reach the colonic mucosa upon inflammation using in vitro migration assays. To this end, Treg (GFP+) isolated from congenic Foxp3gfp reporter mice were treated with a disrupting peptide (TM5Drd2; CD45.1+ CD45.2+ cells), or with a peptide irrelevant for the heteromer assembly (TM1Drd2; CD45.1+ cells) and were i.v. transferred into congenic recipients (CD45.2+) previously exposed to DSS treatment for 5 days. The arrival of donor cells to different tissues was analysed 24 hours later (Figure 8A). Before the adoptive transfer, we confirmed that the TM5Drd2 and TM1Drd2 peptides did not affect the surface expression of the gut homing molecules CCR9 and α4β7 integrin on the Treg surface in the absence of dopamine (Figure 8B). Importantly, we observed a substantial reduction in the arrival of TM5Drd2-treated Treg into the colonic lamina propria compared to the TM1Drd2-treated Treg (Figure 8C). Nevertheless, the infiltration of TM5Drd2-treated Treg and TM1Drd2-treated Treg in the MLN was equivalent (Figure 8C). These results indicate that the Drd2:Drd3 disruption abrogated the recruitment of Treg into the colonic mucosa upon inflammatory conditions. Altogether, these results indicate that the Drd2:Drd3 heteromer expressed on Treg plays an important role favouring the suppressive Treg activity and promoting the colonic tropism upon gut inflammation.
3. Discussion
Treg cells play a fundamental role in maintaining intestinal homoeostasis and immune tolerance in steady-state conditions. Interestingly, our present results and previous works [34,35,36] show that colonic Treg cells increase in number upon gut inflammation. This change may be related with the active recruitment of Treg into inflamed sites of the intestine, attempting to suppress inflammation. As the balance between Teff and Treg is pivotal in the pathogenesis and progression of IBD, an increased Treg number suggests a compensatory mechanism to counteract heightened inflammatory response. Accordingly, gut inflammation induces accelerated Treg turnover, proliferation in the colon, and bidirectional movement between the colon and the distal part of the MLN [34]. Another possibility suggests Treg becomes dysfunctional or even adopts a pro-inflammatory profile in response to signals present in the local microenvironment under inflammatory conditions [3,37]. In this regard, gut inflammation has been associated with a marked reduction on the levels of intestinal dopamine in both human IBD patients and mouse models [10,11,16]. Of note, high dopamine levels and the consequent Drd2 stimulation are associated with anti-inflammatory effects [3,18,38], whereas the selective stimulation of Drd3 in T cells, which is favoured in the presence of low dopamine levels, promote Th1 and Th17 mediated inflammation [14,15,30,39].
In a previous study conducted in mouse models of gut inflammation we showed that the selective stimulation of Drd3 in Treg attenuates their suppressive activity and limits their recruitment into the colonic mucosa [30]. Thus, those findings suggest that the decrease in colonic dopamine levels represents a tissue perturbation triggering inflammation. Since high dopamine levels seem to play a homoeostatic role in dopaminergic tissues, we attempted to analyse how the loss of Drd2 signalling in Treg affects their function in the gut. The present data demonstrate that Drd2-signalling promotes Treg function in vivo and attenuates gut inflammation. In fact, a selective Drd2-agonist increased the suppressive Treg activity in vitro. Since Drd3-stimulation inhibits the suppressive Treg activity through downregulating IL-10 production [30], we questioned whether this immunoregulatory cytokine was involved in the mechanism underlying the improved Treg activity triggered by Drd2. Indeed, we found that Drd2-signalling induces a higher IL-10 production, which represents one of the main mechanisms by which Tregs limits gut inflammation. In fact, the lack of IL-10 production by Treg induces inflammation in the colon [7] and il10-deficient mice spontaneously develop colitis [40,41].
In addition to the effects on the suppressive activity, Drd3-signalling dampens the recruitment of Treg into the colonic lamina propria by reducing the surface CCR9 expression [30]. Here we found again that, contrary to the effects promoted by Drd3, Drd2-signalling increases the CCR9 expression on Treg cells, improving their infiltration into the colonic mucosa. Since our observations indicated that dopamine, depending on the concentration might trigger opposite biological effects on Treg cells, we hypothesised that Drd2 and Drd3 form an heteromeric receptor in this lymphocyte population. Evidence has shown that GPCR heteromers constitute a functional unit of physiological relevance, which trigger different biological effects than those triggered by the isolated forms of the receptors that conform the heteromer [42]. An interesting example of a GPCR heteromer that triggers opposite effects depending on the concentration of the same ligand is the complex formed by adenosine receptors A2A (A2AR) and A1R in striatal glutamatergic terminals. Under basal conditions, low levels of adenosine stimulate preferentially A1R, which displays a higher affinity for adenosine than A2AR, inhibiting glutamatergic transmission. However, upon high adenosine concentrations, the stimulation of A2AR in the A2AR:A1R heteromer blocks A1R signalling, thus stimulating glutamate release from striatal nerve terminals [43].
The ability of Drd2 and Drd3 to assembly into a functional Drd2:Drd3 heteromer was previously demonstrated when co-expressed in a heterologous system [44,45]. Co-immunoprecipitation [44] and experiments using SNAP and CLIP tag covalent labelling reagents followed by time-resolved fluorescence resonance energy transfer [45], demonstrate that Drd2 and Drd3 form both homomers and heteromers in steady state conditions [45]. In the present study, BRET analysis of HEK293T cells transfected with RLuc-fused to Drd3 and YFP-fused to Drd2 confirmed the physical interaction between these two receptors. The specificity of this interaction was confirmed as YFP-Drd2 did not interact with RLuc-A1R, since the co-transfection of these constructs led to a barely detectable BRET signal. To further explore the molecular requirements involved in the assembly of the Drd2:Drd3 heteromer, we studied the ability of α-helix peptides analogue to the TM segments from Drd2 and Drd3 to disrupt the assembly of the Drd2:Drd3 heteromer using a BiFC approach. Our results revealed that only TM5 from Drd2 and TM2 and TM6 from Drd3 were able to disrupt the heteromer assembly, indicating that only these three TM segments are involved in the interacting interface.
Importantly, our PLA analysis revealed for the first time that the Drd2:Drd3 heteromeric complex is expressed in primary lymphocytes, particularly in colonic Treg cells. Interestingly, the expression density in colonic Treg increased under inflammatory conditions, suggesting a functional relevance in this pathophysiological context. As part of the physiological response of immune cells to inflammation induced by DSS treatment, a critical step involves the formation of actin-based structures required for migration into the gut. In this regard, heteromerization of Drd2 and Drd3 might be influenced by proteins that regulates their direct interaction, trafficking, and desensitization [46]. For instance, these two dopamine receptors are linked to the actin cytoskeleton through the interaction with filamin-A and mutations in the cytoskeletal-binding domain and in the region of dopamine receptor binding of filamin-A reduces the cell surface expression of Drd2 and Drd3 [47,48]. It seems therefore plausible that surface expression of Drd2:Drd3 heteromers and Treg migration during gut inflammation are linked. Consistent with this, our results indicate that the increased accumulation of colonic Treg during gut inflammation is dependent on both Drd2 and Drd3 expression and correlates with an enhanced surface expression of the heteromer on colonic Treg under inflammatory conditions. Of note, the reduced Treg infiltration in the colonic mucosa of Drd3 deficient mice contradicts our previous study showing Drd3 deficiency in Treg improves their recruitment into the colonic lamina propria upon inflammation, where recruitment of Drd3-sufficient and Drd3-deficient Treg transferred into DSS-treated wild-type recipients was compared [30]. Hence, the different results observed here in the extent of Treg arrival to the colon may be attributed to Drd3 deficiency in other cell types influencing Treg infiltration into the colonic mucosa.
Addressing the functional relevance of the Drd2:Drd3 heteromeric complex in Treg cells, Drd2:Drd3 heteromer signalling is largely responsible for Treg suppressive activity in vitro as disruption of the heteromer abrogated their suppressive function with dopamine levels similar to those in the colon under homeostatic conditions. These findings highlight the physiological relevance of the Drd2:Drd3 heteromer in maintaining the immune homeostasis in the colonic mucosa. Furthermore, the Drd2:Drd3 heteromer was also responsible of the proper recruitment of Treg cells into the colonic mucosa under inflammation, as disrupting the heteromer assembly strongly reduced the arrival of Treg in the colonic lamina propria of DSS treated mice. This indicates that the integrity of the heteromer is essential for the efficient recruitment of Treg into inflamed intestine. Thereby, any event that limits or interferes with the formation of this heteromer might worsen inflammation, as Treg are essential for maintaining immune tolerance and controlling excessive immune responses.
Dopaminergic signalling plays a broader role in regulating leukocyte migration, as an heteromeric receptor formed by CCR9 and Drd5, in response to elevated CCL25 and reduced dopamine levels, promoted effector CD4+ T-cells recruitment into the colonic lamina propria during gut inflammation [29]. The dual stimulation of this heteromer triggers the phosphorylation of the myosin light chain 2 in CD4+ T-cells, enhancing their motility and migratory speed, which in turn improves their infiltration into the inflamed colonic mucosa [49]. Another example, already commented here, is the regulation of Treg migration by DRD3 signalling, which limits the recruitment of these cells into the colonic mucosa by down-regulating CCR9 expression [30]. In addition, Drd3-signalling in naïve CD8+ T-cells favours the recruitment of these cells into the lymph nodes by potentiating the migration towards CCL19 and CCL21 [50]. The ability of dopamine for regulating migration is not limited to lymphoid cells but also occurs in myeloid cells. Indeed, DRD4-stimulaion in macrophages induces an upregulation of CCR5, increasing their migratory ability to infiltrate the brain [51]. Interestingly, the same laboratory reported that DRD1-signalling triggered the opposite effect, down-regulating CCR5 and thereby impairing the macrophage ability to infiltrate the brain [51], illustrating again how dopamine, depending on high or low concentrations, might exert opposite biological effects on leukocytes.
Dopamine receptor heteromerization represents a new dimension for interpreting the actions of this neurotransmitter in physiological and pathological conditions, thus opening new opportunities for the design of more specific therapies. In the context of IBD, a number of therapies have involved the development of antibodies or small molecules designed to interfere with the CCR9-CCL25 or α4β7-MadCAM1 interactions to prevent the recruitment of T-cells into the inflamed gut mucosa [52,53]. However, these interactions are also essential for the recruitment of Treg cells into the intestinal mucosa during homeostasis, which is crucial for maintaining immune tolerance [27]. As a result, blocking CCR9-CCL25 and α4β7-MadCAM1 interactions may lead to serious collateral effects. The emerging understanding of a more intricate control of leukocyte migration, involving specific GPCR heteromers expressed in distinct leukocyte subsets, offers the potential for developing small molecules or monoclonal antibodies that selectively target immune cell recruitment in inflamed tissues. Consequently, a deeper insight into GPCR heteromers regulating leukocyte biology could drive the creation of next-generation therapeutic agents, capable of providing more precise benefits while minimizing side effects in the treatment of IBD and other inflammatory disorders.
4. Materials and Methods
4.1. Animals
Wild-type (CD45.1+/+; CD45.2+/+), CD4Cre, and Rag1−/− mice were obtained from The Jackson Laboratory. Foxp3gfp CD45.1+/+ reporter mice generated as described before [54] were also obtained from The Jackson Laboratory. Drd2flox/flox (Drd2f/f) mice were kindly donated by Dr. Jiawei Zhou [18], and Drd3−/− mice were kindly donated by Dr. Marc Caron [55]. CD4Cre/Drd2f/f, CD4Cre/Drd2f/f/Foxp3gfp, Drd3−/−/Foxp3gfp and, Cd45.1+/−/Cd45.2+/− mice were generated by crossing parental mouse strains. We confirmed the genotype of these new strains by PCR of genomic DNA and by flow cytometry of peripheral blood cells (for GFP). Female mice from 6 to 10 wk were used in all experiments. All procedures performed in animals were approved by and complied with regulations of the Institutional Animal Care and Use Committee at Fundación Ciencia & Vida.
4.2. Dextran Sodium Sulphate Induced Acute Inflammatory Colitis
Mice were treated with 1% (for sub-optimal conditions) or 1.75% (optimal conditions) DSS in the drinking water. DSS was given for a total period of 7 d and then replaced with normal drinking water until the end of the experiment. Body weight was recorded throughout the time-course of disease development. The extent of loss of the initial body weight was used as the main parameter to determine disease severity. At the end of the experiment, mice were sacrificed to obtain the spleen, MLN and cLP. Tissue was digested and homogenized using gentleMACSTM dissociator and then filtered through cell strainers (70 μm pore). In some cases, the colon was fixed and used for in situ PLA assays, while in other cases used to obtain mononuclear cells (MNC) from cLP. For the latter purpose, cells were separated using centrifugation in percoll [56]. MLN cells were re-stimulated with PMA and ionomycin in the presence of brefeldin A and intracellular IL-10 production by T-cells was analysed by flow cytometry.
4.3. In Vitro Suppression Assay
Treg (CD4+ GFP+) obtained from CD45.1+/+ Foxp3gfp reporter mice were incubated in 200 μL RPMI medium containing 100 ng retinoic acid (RA) and 200 IU of IL-2, and activated with 60 ng of plate-bound anti-CD3 and 100 ng of soluble anti-CD28 for 4 h. While activating, Treg were incubated with the indicated peptides (Table 1; GenScript) during 4 h, or with the indicated drugs (TOCRIS) during the last 30 min, and then washed. Naïve CD4+ CD25− T-cells (T naive) isolated from WT CD45.2+/+ mice were loaded with 5 μM cell trace violet (CTV) and co-cultured (105 cells/well) with activating Treg at the indicated Treg:T naive ratios in 96-well plates in the presence of anti-CD3 and anti-CD28 Abs. 3 d later, the extent of T naive proliferation was determined as the dilution of CTV-associated fluorescence in the CD4+ GFP− ZAq− population by flow cytometry. CD25, CTLA-4, PD1, and Blimp-1 expression were analysed in Treg cells by flow cytometry, and the levels of IL-10 in the supernatant were quantified by ELISA.
4.4. In Vivo Migration Assay
Splenic Treg cells (CD4+GFP+) isolated from CD45.1+/+ Foxp3gfp, CD45.1+/− CD45.2+/− Foxp3gfp or CD45.2+/+- Foxp3gfp Drd2f/f CD4Cre mice were incubated with or without the indicated peptides (Table 1; 4μM) and activated for 4 h, as indicated above (see section In vitro Suppression Assay). Then, donor CD4+ T-cells were mixed in a 1:1 ratio and 7×10⁵ total cells were i.v. injected into CD45.1+/− CD45.2+/− or CD45.2+/+ Rag1−/− recipient mice exposed to DSS 1,75%. Mice were sacrificed 24h (when recipients were Rag1−/−) or 48h (when recipients were WT) later and the relative composition (CD45.1+ versus CD45.2+) on CD4+ T-cells isolated from different tissues were analysed, including spleen, MLN and cLP. Quantification of the relative abundance of CD45.1+ versus CD45.2+ CD4+ T-cells was normalized with the input composition.
4.5. In Vitro Migration Assay
Naïve T-cells (CD4+CD62L+CD44−GFP−) isolated from MLN of Drd2f/f/CD4Cre Foxp3gfp or Drd2+/+ Foxp3gfp mice were incubated in 200 μL RPMI medium containing 100 ng RA, 20 ng TGF-β1, 100 ng anti-IFNγ Ab and 200 IU of IL-2, and activated with 60 ng of plate-bound anti-CD3 and 100 ng of soluble anti-CD28 for 5 d to induce the differentiation into iTreg. RA, TGF-β1, anti-IFNγ Ab and IL-2 were renewed at days 2 and 4. 3×10⁵ live iTreg cells were resuspended in 100 µL (PBS) and seeded on the top chamber of 5 µm pore transwells (Corning, NY, USA). 2 h before, the bottom chamber was incubated with fibronectin (10 µg/mL; Sigma Aldrich) in 600 µL of RPMI containing 5% BSA and either mouse CCL25 (300 ng/mL; Biolegend), PBS, or mouse serum. Cells were incubated at 37°C and 5% CO2 for 4 h. Then, both top and bottom chamber cells were recovered, stained with ZAq for 15 min and resuspended in 150 µL of PBS. To quantify the absolute number of cells, 5 µL of 123 count eBeads (eBioscience, Thermo-Fisher) was added to each sample prior to flow cytometry analysis and cell concentration was calculated as indicated by manufacturer’s instructions.
4.6. Flow Cytometry Analysis
Cells were stained with ZAq Fixable Viability kit, followed by fluorochrome-conjugated mAbs specific to cell-surface markers in PBS containing 5% FBS for 15 min. Surface markers analysed included α4β7, CCR9, CD4, CD25, CD45.1, CD45.2, CD44, CD62L, and TCRβ. Afterwards, cells were fixed with 1% paraformaldehyde in phosphate-buffered saline (PBS, Na2HPO4 8.1 µM, KH2PO4 1.47 µM, NaCl 64.2 mM, KCl 2.68 mM, pH 7.4) for 15 min at room temperature, washed twice with PBS, and analysed in a flow cytometer. For intracellular cytokine staining (IL-10), CD4+ T-cells were stimulated for 4 h with phorbol-12-myristate-13-acetate (PMA, 50 ng mL−1, Sigma-Aldrich, St. Louis, MO, USA) and ionomycin (1 μg mL−1, Sigma-Aldrich, St. Louis, MO, USA) in the presence of brefeldin A (5 μg mL−1, Life Technologies). Cells were stained with ZAq Fixable Viability kit (Biolegend), followed by cell-surface markers immunostaining in PBS containing 2% FBS. Afterwards, cells were resuspended in fixation/permeabilization solution (eBioscience, Thermo-Fisher) and incubated for, at least, 30 min. Then, intracellular immunostaining was carried out in permeabilization buffer (eBioscience, Thermo-Fisher) at 4ºC for 1 h. Data were collected with a Canto II (BD) and results were analysed with FACSDiva (BD) and FlowJo software (Tree Star, Ashlan, OR, USA).
4.7. Bulk RNA-Seq Analysis
The raw RNA-seq data underwent quality assessment using FastQC (v0.11.7) with default parameters. Adapters identified by FastQC were removed using Cutadapt (v1.1) with default settings. Sickle (v1.200) was then employed to trim low-quality ends of reads, retaining sequences with a minimum length of 25 nucleotides and a quality score threshold of 20. The cleaned reads were aligned to the human genome (GRCh37, human_glk_v37) using HISAT (v0.1.6), allowing for a maximum of two mismatches. Aligned reads were sorted using SAMtools (v0.1.19), and mapping statistics were generated using SAMtools flagstat and Picard tools (v2.9.0). Samples with a low percentage of aligned reads (<90%) were excluded. Gene-level expression was quantified using HTSeq (v0.9.1) with annotation from Ensembl version 75. Data normalization was performed using the trimmed mean of M-values (TMM) method to account for differences in library sizes.
4.8. Bioluminescence Resonance Energy Transfer Assay
For Bioluminescence Resonance Energy Transfer (BRET) experiments, HEK293T cells transiently co-transfected with a constant amount of cDNA encoding Drd3 (or A1R as a control) fused to RLuc and with increasingly amounts of cDNA encoding Drd2 fused to YFP (see figure legends) were used 48 h after transfection. To quantify BRET measurements, 5 μM coelenterazine H (Molecular Probes, Eugene, OR) was added to the equivalent of 20 μg of cell suspension. After 1 minute, the readings were collected using a Mithras LB 940 (Berthold Technologies, Bad Wildbad, Germany) that allows the integration of the signals detected in the short-wavelength filter at 485 nm and the long-wavelength filter at 530 nm. To quantify protein-RLuc expression, luminescence readings were also performed after 10 minutes of adding 5 μM coelenterazine H. To quantify protein-YFP expression, fluorescence of cells (20 μg protein) was also read. The net BRET is defined as [(long-wavelength emission)/(short-wavelength emission)]-Cf where Cf corresponds to [(longwavelength emission)/(short-wavelength emission)] for the donor construct expressed alone in the same experiment. Data were fitted to a non-linear regression equation, assuming a single-phase saturation curve with GraphPad Prism software (San Diego, CA, USA). BRET is expressed as milli BRET units, mBU (net BRET × 1000).
4.9. Bimolecular Fluorescence Complementation Assay
HEK293T cells were transiently transfected with equal amounts of the cDNA for fusion proteins of the hemi-truncated Venus (1.5 µg of each cDNA). 48h after transfection cells were treated for 4 h at 37º with TM-analogue peptides (0.4 µM) before plating 20 μg of protein in 96-well black microplates (Porvair, King’s lynn, UK). To control the cell number, the sample protein concentration was determined by a Bradford assay kit (Bio-Rad, Munich, Germany) using bovine serum albumin (BSA) dilutions as standard. To quantify fluorescent proteins, cells (20 g of total protein) were distributed in 96-well microplates (black plates with a transparent bottom) and fluorescence was read in a Fluostar Optima Fluorimeter (BMG Labtech, Ofenburg, Germany) equipped with a high-energy xenon flash lamp using a 10-nm bandwidth excitation filter at 485 nm. Protein fluorescence expression was determined as fluorescence of the sample minus the fluorescence of cells not expressing the fusion proteins (basal).
4.10. In Situ Proximity Ligation Assay
Colonic sections of healthy or DSS-treated mice were used to analyse the Drd2:Drd3 heteromer in situ by proximity ligation assay (PLA). Tissue sections were fixed in 4% paraformaldehyde for 15 min, washed with PBS containing 20 mM glycine to quench the aldehyde groups and permeabilized with the same buffer containing 0.05% Triton X-100 for 30 min. Primary antibodies recognising Drd2 (rabbit anti-Drd2; 1:100 dilution; purchased from Santa Cruz, code sc7522) and Drd3 (rabbit anti-Drd3; 1:100 dilution; purchased from Abcam, code ab42114) were used. Primary antibodies were linked directly to PLA probes detecting rabbit antibodies (Duolink II PLA probe anti-goat plus and Duolink II PLA probe anti-Rabbit minus). As negative technical controls, samples followed the same procedure but in the absence of anti-Drd2 primary antibodies. After 1 h incubation at 37º with blocking solution, tissue sections were incubated with the primary antibodies linked to PLA probes and further processed as described before [57]. Nuclei were stained with Hoechst (1:200 dilution; purchased from SigmaAldrich). Coverslips were mounted using mowiol solution. Samples were observed in a Leica SP2 confocal microscope (Leica Microsystems, Mannheim, Germany) equipped with an apochromatic 63X oil-immersion objective (N.A. 1.4), and 405 nm and 561 nm laser lines. For each field of view a stack of two channels (one per staining) and 3 to 4 Z stacks with a step size of 1 µm were acquired. Quantification of cells containing one or more red spots versus total cells (blue nucleus) and, in cells containing spots, the ratio r (number of red spots/cell), were determined by Andy’s algorithms [58].
4.11. Statistical Analyses
Normality of data was assessed using the Shapiro-Wilk test. For data with normal distribution, significant differences were calculated with a two-tailed unpaired Student’s t-test when comparing only two groups and with one-way ANOVA when comparing more than two groups with only one variable (treatment or genotype). Two-way ANOVA was used to analyse differences in experiments comparing distinct genotypes and/or treatments. For data displaying non-normal distribution, Kruskal-Wallis test was used to compare more than two experimental groups. All analyses were conducted using the GraphPad Prism 10 Software. p-values < 0.05 were considered significant.
Supplementary Materials
The following supporting information can be downloaded at: Preprints.org, Figure S1: Disassembling of the Drd2:Drd3 heteromer selectively reduces CD25 expression on Treg.
Author Contributions
R.P.: designed the animal model study and in vitro study; M.A.H.: trancriptomic study design; J.M., C.P., V.U. and A.E.: conducted experiments in animal models and acquired data; J.M., I.R., G.N., P.V. and P.L., conducted in vitro experiments and acquired data; J.M., I.R., G.N., C.P., P.V., R.F. and R.P. analysed data from in vitro and animal model experiments and contributed to results interpretation; R.W.: Patient recruitment, data collection and transcriptomic data analysis; R.G.: Quality control, pre-processing of transcriptomic data analysis and result analysis; M.L.: transcriptomic and differential gene expression data analysis; M.A.H.; transcriptomic results interpretation; G.N., M.A.H. and R.F.: Provided new reagents and methodologies, revised the manuscript. R.P.: wrote the manuscript. All authors read and approved the final manuscript.
Funding
This work was supported by “Financiamiento Basal para Centros Científicos y Tecnológicos de Excelencia de ANID” Centro Ciencia & Vida, FB210008 (to Fundación Ciencia & Vida). This work was also funded by grants FONDECYT-1210013 and FONDECYT-1250021 (to R.P.) from “Agencia Nacional de Investigación y Desarrollo de Chile (ANID)”.
Institutional Review Board Statement
All procedures and housing of mice were compliant with the recommendations in the 8th edition of the Guide for the Care and Use of Laboratory Animals and with the United States Public Health Service Policy. The protocol was approved by the IACUC of Fundación Ciencia & Vida (Permit Number: P016-2020).
Data Availability Statement
Acknowledgments
We thank Dr. Sebastián Valenzuela and Dr. Micaela Ricca for their valuable veterinary assistance in our animal facility. We also thank María José Fuenzalida for her technical assistance in cell sorting and flow cytometry.
Conflicts of Interest
The authors declare no conflicts of interest.
Abbreviations
The following abbreviations are used in this manuscript:
| AnR | adenosine receptor An |
| BiFC | bimolecular fluorescence complementation |
| BRET | bioluminescence resonance energy transfer |
| BSA | bovine serum albumin |
| CD | Crohn’s disease |
| CCR9 | chemokine receptor 9 |
| cLP | colonic lamina propria |
| CTV | cell trace violet |
| DCs | Dendritic cells |
| DSS | dextran sodium sulfate |
| Drdn | Dopamine receptor n |
| GFP | green fluorescent protein |
| GPCR | G-protein coupled receptor |
| IBD | Inflammatory bowel disease |
| IL-n | interleukin n |
| Teff | effector T-cells |
| MadCAM-1 | Mucosal vascular addressin Cell Adhesion Molecule 1 |
| MLN | mesenteric lymph nodes |
| MNC | mononuclear cells |
| PLA | Proximity ligation assay |
| PP | Peyer’s patches |
| RLuc | renilla luciferase |
| PMA | Phorbol 12-myristate 13-acetate |
| TAT | transactivator of transcription |
| Thn | T-helper n |
| Treg | regulatory T cells |
| TM | transmembrane segments |
| UC | ulcerative colitis |
| WT | wild-type |
| YFP | yellow fluorescent protein |
| ZAq | Zombie Aqua |
References
- Granlund, A.; Flatberg, A.; Ostvik, A. E.; Drozdov, I.; Gustafsson, B. I.; Kidd, M.; Beisvag, V.; Torp, S. H.; Waldum, H. L.; Martinsen, T. C.; Damas, J. K.; Espevik, T.; Sandvik, A. K., Whole genome gene expression meta-analysis of inflammatory bowel disease colon mucosa demonstrates lack of major differences between Crohn’s disease and ulcerative colitis. PloS one 2013, 8, (2), e56818. [CrossRef]
- Olsen, T.; Rismo, R.; Cui, G.; Goll, R.; Christiansen, I.; Florholmen, J., TH1 and TH17 interactions in untreated inflamed mucosa of inflammatory bowel disease, and their potential to mediate the inflammation. Cytokine 2011, 56, (3), 633-40. [CrossRef]
- Wu, W.; Sun, M.; Zhang, H. P.; Chen, T.; Wu, R.; Liu, C.; Yang, G.; Geng, X. R.; Feng, B. S.; Liu, Z.; Liu, Z.; Yang, P. C., Prolactin mediates psychological stress-induced dysfunction of regulatory T cells to facilitate intestinal inflammation. Gut 2014, 63, (12), 1883-92. [CrossRef]
- Powrie, F.; Mason, D., OX-22high CD4+ T cells induce wasting disease with multiple organ pathology: prevention by the OX-22low subset. J Exp Med 1990, 172, (6), 1701-8. [CrossRef]
- Mair, I.; Zandee, S. E. J.; Toor, I. S.; Saul, L.; McPherson, R. C.; Leech, M. D.; Smyth, D. J.; O’Connor, R. A.; Henderson, N. C.; Anderton, S. M., A Context-Dependent Role for alphav Integrins in Regulatory T Cell Accumulation at Sites of Inflammation. Frontiers in immunology 2018, 9, 264. [CrossRef]
- Huber, S.; Schramm, C.; Lehr, H. A.; Mann, A.; Schmitt, S.; Becker, C.; Protschka, M.; Galle, P. R.; Neurath, M. F.; Blessing, M., Cutting edge: TGF-beta signaling is required for the in vivo expansion and immunosuppressive capacity of regulatory CD4+CD25+ T cells. J Immunol 2004, 173, (11), 6526-31. [CrossRef]
- Rubtsov, Y. P.; Rasmussen, J. P.; Chi, E. Y.; Fontenot, J.; Castelli, L.; Ye, X.; Treuting, P.; Siewe, L.; Roers, A.; Henderson, W. R., Jr.; Muller, W.; Rudensky, A. Y., Regulatory T cell-derived interleukin-10 limits inflammation at environmental interfaces. Immunity 2008, 28, (4), 546-58. [CrossRef]
- Saruta, M.; Yu, Q. T.; Fleshner, P. R.; Mantel, P. Y.; Schmidt-Weber, C. B.; Banham, A. H.; Papadakis, K. A., Characterization of FOXP3+CD4+ regulatory T cells in Crohn’s disease. Clin Immunol 2007, 125, (3), 281-90. [CrossRef]
- Maul, J.; Loddenkemper, C.; Mundt, P.; Berg, E.; Giese, T.; Stallmach, A.; Zeitz, M.; Duchmann, R., Peripheral and intestinal regulatory CD4+ CD25(high) T cells in inflammatory bowel disease. Gastroenterology 2005, 128, (7), 1868-78. [CrossRef]
- Magro, F.; Vieira-Coelho, M. A.; Fraga, S.; Serrao, M. P.; Veloso, F. T.; Ribeiro, T.; Soares-da-Silva, P., Impaired synthesis or cellular storage of norepinephrine, dopamine, and 5-hydroxytryptamine in human inflammatory bowel disease. Dig Dis Sci 2002, 47, (1), 216-24. [CrossRef]
- Magro, F.; Fraga, S.; Ribeiro, T.; Soares-da-Silva, P., Decreased availability of intestinal dopamine in transmural colitis may relate to inhibitory effects of interferon-gamma upon L-DOPA uptake. Acta Physiol Scand 2004, 180, (4), 379-86. [CrossRef]
- Pacheco, R.; Contreras, F.; Zouali, M. The dopaminergic system in autoimmune diseases. Frontiers in immunology 2014, 5, 117. [Google Scholar] [CrossRef] [PubMed]
- Alexander, S. P. H.; Christopoulos, A.; Davenport, A. P.; Kelly, E.; Mathie, A. A.; Peters, J. A.; Veale, E. L.; Armstrong, J. F.; Faccenda, E.; Harding, S. D.; Davies, J. A.; Abbracchio, M. P.; Abraham, G.; Agoulnik, A.; Alexander, W.; Al-Hosaini, K.; Back, M.; Baker, J. G.; Barnes, N. M.; Bathgate, R.; Beaulieu, J. M.; Beck-Sickinger, A. G.; Behrens, M.; Bernstein, K. E.; Bettler, B.; Birdsall, N. J. M.; Blaho, V.; Boulay, F.; Bousquet, C.; Brauner-Osborne, H.; Burnstock, G.; Calo, G.; Castano, J. P.; Catt, K. J.; Ceruti, S.; Chazot, P.; Chiang, N.; Chini, B.; Chun, J.; Cianciulli, A.; Civelli, O.; Clapp, L. H.; Couture, R.; Cox, H. M.; Csaba, Z.; Dahlgren, C.; Dent, G.; Douglas, S. D.; Dournaud, P.; Eguchi, S.; Escher, E.; Filardo, E. J.; Fong, T.; Fumagalli, M.; Gainetdinov, R. R.; Garelja, M. L.; de Gasparo, M.; Gerard, C.; Gershengorn, M.; Gobeil, F.; Goodfriend, T. L.; Goudet, C.; Gratz, L.; Gregory, K. J.; Gundlach, A. L.; Hamann, J.; Hanson, J.; Hauger, R. L.; Hay, D. L.; Heinemann, A.; Herr, D.; Hollenberg, M. D.; Holliday, N. D.; Horiuchi, M.; Hoyer, D.; Hunyady, L.; Husain, A.; AP, I. J.; Inagami, T.; Jacobson, K. A.; Jensen, R. T.; Jockers, R.; Jonnalagadda, D.; Karnik, S.; Kaupmann, K.; Kemp, J.; Kennedy, C.; Kihara, Y.; Kitazawa, T.; Kozielewicz, P.; Kreienkamp, H. J.; Kukkonen, J. P.; Langenhan, T.; Larhammar, D.; Leach, K.; Lecca, D.; Lee, J. D.; Leeman, S. E.; Leprince, J.; Li, X. X.; Lolait, S. J.; Lupp, A.; Macrae, R.; Maguire, J.; Malfacini, D.; Mazella, J.; McArdle, C. A.; Melmed, S.; Michel, M. C.; Miller, L. J.; Mitolo, V.; Mouillac, B.; Muller, C. E.; Murphy, P. M.; Nahon, J. L.; Ngo, T.; Norel, X.; Nyimanu, D.; O’Carroll, A. M.; Offermanns, S.; Panaro, M. A.; Parmentier, M.; Pertwee, R. G.; Pin, J. P.; Prossnitz, E. R.; Quinn, M.; Ramachandran, R.; Ray, M.; Reinscheid, R. K.; Rondard, P.; Rovati, G. E.; Ruzza, C.; Sanger, G. J.; Schoneberg, T.; Schulte, G.; Schulz, S.; Segaloff, D. L.; Serhan, C. N.; Singh, K. D.; Smith, C. M.; Stoddart, L. A.; Sugimoto, Y.; Summers, R.; Tan, V. P.; Thal, D.; Thomas, W. W.; Timmermans, P.; Tirupula, K.; Toll, L.; Tulipano, G.; Unal, H.; Unger, T.; Valant, C.; Vanderheyden, P.; Vaudry, D.; Vaudry, H.; Vilardaga, J. P.; Walker, C. S.; Wang, J. M.; Ward, D. T.; Wester, H. J.; Willars, G. B.; Williams, T. L.; Woodruff, T. M.; Yao, C.; Ye, R. D., The Concise Guide to PHARMACOLOGY 2023/24: G protein-coupled receptors. Br J Pharmacol 2023, 180 Suppl 2, S23-S144. [CrossRef]
- Contreras, F.; Prado, C.; Gonzalez, H.; Franz, D.; Osorio-Barrios, F.; Osorio, F.; Ugalde, V.; Lopez, E.; Elgueta, D.; Figueroa, A.; Lladser, A.; Pacheco, R., Dopamine Receptor D3 Signaling on CD4+ T Cells Favors Th1- and Th17-Mediated Immunity. J Immunol 2016, 196, (10), 4143-9. [CrossRef]
- Franz, D.; Contreras, F.; Gonzalez, H.; Prado, C.; Elgueta, D.; Figueroa, C.; Pacheco, R. Dopamine receptors D3 and D5 regulate CD4(+)T-cell activation and differentiation by modulating ERK activation and cAMP production. J Neuroimmunol 2015, 284, 18–29. [Google Scholar] [CrossRef] [PubMed]
- Asano, Y.; Hiramoto, T.; Nishino, R.; Aiba, Y.; Kimura, T.; Yoshihara, K.; Koga, Y.; Sudo, N., Critical role of gut microbiota in the production of biologically active, free catecholamines in the gut lumen of mice. Am J Physiol Gastrointest Liver Physiol 2012, 303, (11), G1288-95. [CrossRef]
- Elgueta, D.; Contreras, F.; Prado, C.; Montoya, A.; Ugalde, V.; Chovar, O.; Villagra, R.; Henriquez, C.; Abellanas, M. A.; Aymerich, M. S.; Franco, R.; Pacheco, R., Dopamine Receptor D3 Expression Is Altered in CD4+ T-Cells From Parkinson’s Disease Patients and Its Pharmacologic Inhibition Attenuates the Motor Impairment in a Mouse Model. Frontiers in immunology 2019, 10. [CrossRef]
- Shao, W.; Zhang, S. Z.; Tang, M.; Zhang, X. H.; Zhou, Z.; Yin, Y. Q.; Zhou, Q. B.; Huang, Y. Y.; Liu, Y. J.; Wawrousek, E.; Chen, T.; Li, S. B.; Xu, M.; Zhou, J. N.; Hu, G.; Zhou, J. W., Suppression of neuroinflammation by astrocytic dopamine D2 receptors via alphaB-crystallin. Nature 2013, 494, (7435), 90-4. [CrossRef]
- Yan, Y.; Jiang, W.; Liu, L.; Wang, X.; Ding, C.; Tian, Z.; Zhou, R., Dopamine controls systemic inflammation through inhibition of NLRP3 inflammasome. Cell 2015, 160, (1-2), 62-73. [CrossRef]
- Torres-Rosas, R.; Yehia, G.; Pena, G.; Mishra, P.; del Rocio Thompson-Bonilla, M.; Moreno-Eutimio, M. A.; Arriaga-Pizano, L. A.; Isibasi, A.; Ulloa, L., Dopamine mediates vagal modulation of the immune system by electroacupuncture. Nat Med 2014, 20, (3), 291-5. [CrossRef]
- Besser, M. J.; Ganor, Y.; Levite, M., Dopamine by itself activates either D2, D3 or D1/D5 dopaminergic receptors in normal human T-cells and triggers the selective secretion of either IL-10, TNFalpha or both. J Neuroimmunol 2005, 169, (1-2), 161-71. [CrossRef]
- Miyazawa, T.; Matsumoto, M.; Kato, S.; Takeuchi, K., Dopamine-induced protection against indomethacin-evoked intestinal lesions in rats--role of anti-intestinal motility mediated by D2 receptors. Med Sci Monit 2003, 9, (2), BR71-7.
- Magro, F.; Cunha, E.; Araujo, F.; Meireles, E.; Pereira, P.; Dinis-Ribeiro, M.; Veloso, F. T.; Medeiros, R.; Soares-da-Silva, P., Dopamine D2 receptor polymorphisms in inflammatory bowel disease and the refractory response to treatment. Dig Dis Sci 2006, 51, (11), 2039-44. [CrossRef]
- Tolstanova, G.; Deng, X.; Ahluwalia, A.; Paunovic, B.; Prysiazhniuk, A.; Ostapchenko, L.; Tarnawski, A.; Sandor, Z.; Szabo, S., Role of Dopamine and D2 Dopamine Receptor in the Pathogenesis of Inflammatory Bowel Disease. Dig Dis Sci 2015, 60, (10), 2963-75. [CrossRef]
- Mazzini, E.; Massimiliano, L.; Penna, G.; Rescigno, M., Oral tolerance can be established via gap junction transfer of fed antigens from CX3CR1(+) macrophages to CD103(+) dendritic cells. Immunity 2014, 40, (2), 248-61. [CrossRef]
- Elgueta, R.; Sepulveda, F. E.; Vilches, F.; Vargas, L.; Mora, J. R.; Bono, M. R.; Rosemblatt, M., Imprinting of CCR9 on CD4 T cells requires IL-4 signaling on mesenteric lymph node dendritic cells. J Immunol 2008, 180, (10), 6501-7. [CrossRef]
- Cassani, B.; Villablanca, E. J.; Quintana, F. J.; Love, P. E.; Lacy-Hulbert, A.; Blaner, W. S.; Sparwasser, T.; Snapper, S. B.; Weiner, H. L.; Mora, J. R., Gut-tropic T cells that express integrin alpha4beta7 and CCR9 are required for induction of oral immune tolerance in mice. Gastroenterology 2011, 141, (6), 2109-18. [CrossRef]
- Rivollier, A.; He, J.; Kole, A.; Valatas, V.; Kelsall, B. L., Inflammation switches the differentiation program of Ly6Chi monocytes from antiinflammatory macrophages to inflammatory dendritic cells in the colon. J Exp Med 2012, 209, (1), 139-55. [CrossRef]
- Osorio-Barrios, F.; Navarro, G.; Campos, J.; Ugalde, V.; Prado, C.; Raich, I.; Contreras, F.; Lopez, E.; Espinoza, A.; Lladser, A.; Franco, R.; Pacheco, R., The Heteromeric Complex Formed by Dopamine Receptor D5 and CCR9 Leads the Gut Homing of CD4(+) T Cells Upon Inflammation. Cell Mol Gastroenterol Hepatol 2021, 12, (2), 489-506. [CrossRef]
- Ugalde, V.; Contreras, F.; Prado, C.; Chovar, O.; Espinoza, A.; Pacheco, R., Dopaminergic signalling limits suppressive activity and gut homing of regulatory T cells upon intestinal inflammation. Mucosal Immunol 2021, 14, (3), 652-666. [CrossRef]
- Trivedi, P.J.; Bruns, T.; Ward, S.; Mai, M.; Schmidt, C.; Hirschfield, G.M.; Weston, C.J.; Adams, D.H. Intestinal CCL25 expression is increased in colitis and correlates with inflammatory activity. J Autoimmun 2016, 68, 98–104. [Google Scholar] [CrossRef] [PubMed]
- Hu, S.; Uniken Venema, W. T.; Westra, H. J.; Vich Vila, A.; Barbieri, R.; Voskuil, M. D.; Blokzijl, T.; Jansen, B. H.; Li, Y.; Daly, M. J.; Xavier, R. J.; Dijkstra, G.; Festen, E. A.; Weersma, R. K., Inflammation status modulates the effect of host genetic variation on intestinal gene expression in inflammatory bowel disease. Nature communications 2021, 12, (1), 1122. [CrossRef]
- Callen, L.; Moreno, E.; Barroso-Chinea, P.; Moreno-Delgado, D.; Cortes, A.; Mallol, J.; Casado, V.; Lanciego, J. L.; Franco, R.; Lluis, C.; Canela, E. I.; McCormick, P. J., Cannabinoid receptors CB1 and CB2 form functional heteromers in brain. J Biol Chem 2012, 287, (25), 20851-65. [CrossRef]
- Nakanishi, Y.; Ikebuchi, R.; Chtanova, T.; Kusumoto, Y.; Okuyama, H.; Moriya, T.; Honda, T.; Kabashima, K.; Watanabe, T.; Sakai, Y.; Tomura, M., Regulatory T cells with superior immunosuppressive capacity emigrate from the inflamed colon to draining lymph nodes. Mucosal Immunol 2018, 11, (2), 437-448. [CrossRef]
- Harada, Y.; Miyamoto, K.; Chida, A.; Okuzawa, A. T.; Yoshimatsu, Y.; Kudo, Y.; Sujino, T., Localization and movement of Tregs in gastrointestinal tract: a systematic review. Inflamm Regen 2022, 42, (1), 47. [CrossRef]
- Duan, S.; Cao, Y.; Chen, P.; Yang, Y.; Zhang, Y., Circulating and intestinal regulatory T cells in inflammatory bowel disease: A systemic review and meta-analysis. Int Rev Immunol 2024, 43, (2), 83-94. [CrossRef]
- Komatsu, N.; Okamoto, K.; Sawa, S.; Nakashima, T.; Oh-hora, M.; Kodama, T.; Tanaka, S.; Bluestone, J. A.; Takayanagi, H., Pathogenic conversion of Foxp3+ T cells into TH17 cells in autoimmune arthritis. Nat Med 2014, 20, (1), 62-8. [CrossRef]
- Liu, Z.; Zhai, X. R.; Du, Z. S.; Xu, F. F.; Huang, Y.; Wang, X. Q.; Qiu, Y. H.; Peng, Y. P., Dopamine receptor D2 on CD4(+) T cells is protective against neuroinflammation and neurodegeneration in a mouse model of Parkinson’s disease. Brain, behavior, and immunity 2021, 98, 110-121. [CrossRef]
- Gonzalez, H.; Contreras, F.; Prado, C.; Elgueta, D.; Franz, D.; Bernales, S.; Pacheco, R., Dopamine Receptor D3 Expressed on CD4+ T Cells Favors Neurodegeneration of Dopaminergic Neurons during Parkinson’s Disease. J Immunol 2013, 190, (10), 5048-56. [CrossRef]
- Fiorentino, D. F.; Zlotnik, A.; Vieira, P.; Mosmann, T. R.; Howard, M.; Moore, K. W.; O’Garra, A., IL-10 acts on the antigen-presenting cell to inhibit cytokine production by Th1 cells. J Immunol 1991, 146, (10), 3444-51.
- Huber, S.; Gagliani, N.; Esplugues, E.; O’Connor, W., Jr.; Huber, F. J.; Chaudhry, A.; Kamanaka, M.; Kobayashi, Y.; Booth, C. J.; Rudensky, A. Y.; Roncarolo, M. G.; Battaglia, M.; Flavell, R. A., Th17 cells express interleukin-10 receptor and are controlled by Foxp3(-) and Foxp3+ regulatory CD4+ T cells in an interleukin-10-dependent manner. Immunity 2011, 34, (4), 554-65. [CrossRef]
- Ferre, S.; Baler, R.; Bouvier, M.; Caron, M. G.; Devi, L. A.; Durroux, T.; Fuxe, K.; George, S. R.; Javitch, J. A.; Lohse, M. J.; Mackie, K.; Milligan, G.; Pfleger, K. D.; Pin, J. P.; Volkow, N. D.; Waldhoer, M.; Woods, A. S.; Franco, R., Building a new conceptual framework for receptor heteromers. Nat Chem Biol 2009, 5, (3), 131-4. [CrossRef]
- Ciruela, F.; Casado, V.; Rodrigues, R. J.; Lujan, R.; Burgueno, J.; Canals, M.; Borycz, J.; Rebola, N.; Goldberg, S. R.; Mallol, J.; Cortes, A.; Canela, E. I.; Lopez-Gimenez, J. F.; Milligan, G.; Lluis, C.; Cunha, R. A.; Ferre, S.; Franco, R., Presynaptic control of striatal glutamatergic neurotransmission by adenosine A1-A2A receptor heteromers. J Neurosci 2006, 26, (7), 2080-7. [CrossRef]
- Scarselli, M.; Novi, F.; Schallmach, E.; Lin, R.; Baragli, A.; Colzi, A.; Griffon, N.; Corsini, G. U.; Sokoloff, P.; Levenson, R.; Vogel, Z.; Maggio, R., D2/D3 dopamine receptor heterodimers exhibit unique functional properties. J Biol Chem 2001, 276, (32), 30308-14. [CrossRef]
- Pou, C.; Mannoury la Cour, C.; Stoddart, L. A.; Millan, M. J.; Milligan, G., Functional homomers and heteromers of dopamine D2L and D3 receptors co-exist at the cell surface. J Biol Chem 2012, 287, (12), 8864-78. [CrossRef]
- Kabbani, N.; Levenson, R., A proteomic approach to receptor signaling: molecular mechanisms and therapeutic implications derived from discovery of the dopamine D2 receptor signalplex. Eur J Pharmacol 2007, 572, (2-3), 83-93. [CrossRef]
- Lin, R.; Karpa, K.; Kabbani, N.; Goldman-Rakic, P.; Levenson, R., Dopamine D2 and D3 receptors are linked to the actin cytoskeleton via interaction with filamin A. Proc Natl Acad Sci U S A 2001, 98, (9), 5258-63. [CrossRef]
- Lin, R.; Canfield, V.; Levenson, R., Dominant negative mutants of filamin A block cell surface expression of the D2 dopamine receptor. Pharmacology 2002, 66, (4), 173-81. [CrossRef]
- Campos, J.; Osorio-Barrios, F.; Villanelo, F.; Gutierrez-Maldonado, S. E.; Vargas, P.; Perez-Acle, T.; Pacheco, R., Chemokinergic and Dopaminergic Signalling Collaborates through the Heteromer Formed by CCR9 and Dopamine Receptor D5 Increasing the Migratory Speed of Effector CD4(+) T-Cells to Infiltrate the Colonic Mucosa. Int J Mol Sci 2024, 25, (18). [CrossRef]
- Watanabe, Y.; Nakayama, T.; Nagakubo, D.; Hieshima, K.; Jin, Z.; Katou, F.; Hashimoto, K.; Yoshie, O., Dopamine selectively induces migration and homing of naive CD8+ T cells via dopamine receptor D3. J Immunol 2006, 176, (2), 848-56. [CrossRef]
- Basova, L.; Najera, J. A.; Bortell, N.; Wang, D.; Moya, R.; Lindsey, A.; Semenova, S.; Ellis, R. J.; Marcondes, M. C. G., Dopamine and its receptors play a role in the modulation of CCR5 expression in innate immune cells following exposure to Methamphetamine: Implications to HIV infection. PloS one 2018, 13, (6), e0199861. [CrossRef]
- Biswas, S.; Bryant, R. V.; Travis, S., Interfering with leukocyte trafficking in Crohn’s disease. Best Pract Res Clin Gastroenterol 2019, 38-39, 101617. [CrossRef]
- Sands, B. E., Leukocyte Anti-Trafficking Strategies: Current Status and Future Directions. Digestive diseases 2017, 35, (1-2), 13-20. [CrossRef]
- Fontenot, J. D.; Rasmussen, J. P.; Williams, L. M.; Dooley, J. L.; Farr, A. G.; Rudensky, A. Y., Regulatory T cell lineage specification by the forkhead transcription factor foxp3. Immunity 2005, 22, (3), 329-41. [CrossRef]
- Joseph, J. D.; Wang, Y. M.; Miles, P. R.; Budygin, E. A.; Picetti, R.; Gainetdinov, R. R.; Caron, M. G.; Wightman, R. M., Dopamine autoreceptor regulation of release and uptake in mouse brain slices in the absence of D(3) receptors. Neuroscience 2002, 112, (1), 39-49. [CrossRef]
- Menning, A.; Loddenkemper, C.; Westendorf, A. M.; Szilagyi, B.; Buer, J.; Siewert, C.; Hamann, A.; Huehn, J., Retinoic acid-induced gut tropism improves the protective capacity of Treg in acute but not in chronic gut inflammation. Eur J Immunol 2010, 40, (9), 2539-48. [CrossRef]
- Sierra, S.; Luquin, N.; Rico, A. J.; Gomez-Bautista, V.; Roda, E.; Dopeso-Reyes, I. G.; Vazquez, A.; Martinez-Pinilla, E.; Labandeira-Garcia, J. L.; Franco, R.; Lanciego, J. L., Detection of cannabinoid receptors CB1 and CB2 within basal ganglia output neurons in macaques: changes following experimental parkinsonism. Brain structure & function 2015, 220, (5), 2721-38. [CrossRef]
- Law, A. M. K.; Yin, J. X. M.; Castillo, L.; Young, A. I. J.; Piggin, C.; Rogers, S.; Caldon, C. E.; Burgess, A.; Millar, E. K. A.; O’Toole, S. A.; Gallego-Ortega, D.; Ormandy, C. J.; Oakes, S. R., Andy’s Algorithms: new automated digital image analysis pipelines for FIJI. Scientific reports 2017, 7, (1), 15717. [CrossRef]
Figure 1.
DRD2-signalling promotes Treg function and attenuates gut inflammation. (A,B) Eight-to-ten weeks old Drd2flox/flox (Drd2f/f) and Drd2f/f/CD4Cre mice (n = 9-14 mice per group) received suboptimal dose of DSS (1%) in the drinking water for 7 d. (A) The percentage change relative to initial body weight was quantified. Data are the mean ± SEM (B) Mononuclear cells were extracted from the MLN of Drd2f/f/CD4Cre and Drd2f/f mice, stimulated ex vivo with PMA+Ionomycin in the presence of brefeldin A, and the extent of IL-10 production was analysed in live CD4+ T-cells (CD4+ TCRβ+ ZAq-) by intracellular cytokine staining followed by flow cytometry analysis. IL-10 production was quantified as the mean fluorescence intensity (MFI) associated to IL-10 immunostaining. Left panels show representative dot plots. The right panel shows the quantification. Each symbol represents data from an individual mouse. Mean ± SEM is shown (C) Eight-to-ten weeks old wild-type mice received 1,75% DSS in the drinking water for 7 d. 24h after the beginning of DSS treatment, a group of animals received a single i.p. injection of a Drd2-agonist (sumanirole; 4mg/kg), while the other group received the vehicle (control). The percentage change relative to initial body weight was quantified. Data are the mean ± SEM from 4 mice per group. (D) Naïve CD4+ CD25- T-cells (T naive) isolated from WT CD45.1+/+ mice were loaded with 5 μM CTV and activated with dynabeads coated with anti-CD3 and anti-CD28 Abs and co-cultured with CD4+ CD25+ GFP+ Treg (ratio Treg:Tnaive = 1:8) isolated from CD45.2+/+ Foxp3gfp mice. Before co-culture, Tregs cells were pre-incubated with 100 nM sumanirole or vehicle for 30 min. A control group was incubated without Treg. After 72h, the extent of T naive proliferation was determined as the dilution of CTV-associated fluorescence in the CD4+ CD45.1+ GFP- ZAq- population by flow cytometry. Left panels show representative dot plots. The right panel shows the quantification. Values are the mean ± SEM of triplicates from a representative experiment. Data from one out of three independent experiments are shown. *, p<0.05; **, p<0.01; ***, p<0.001; ****, p<0.0001 by unpaired Student’s t-test (A–C) or one-way ANOVA followed by Tukey’s post-hoc test (D).
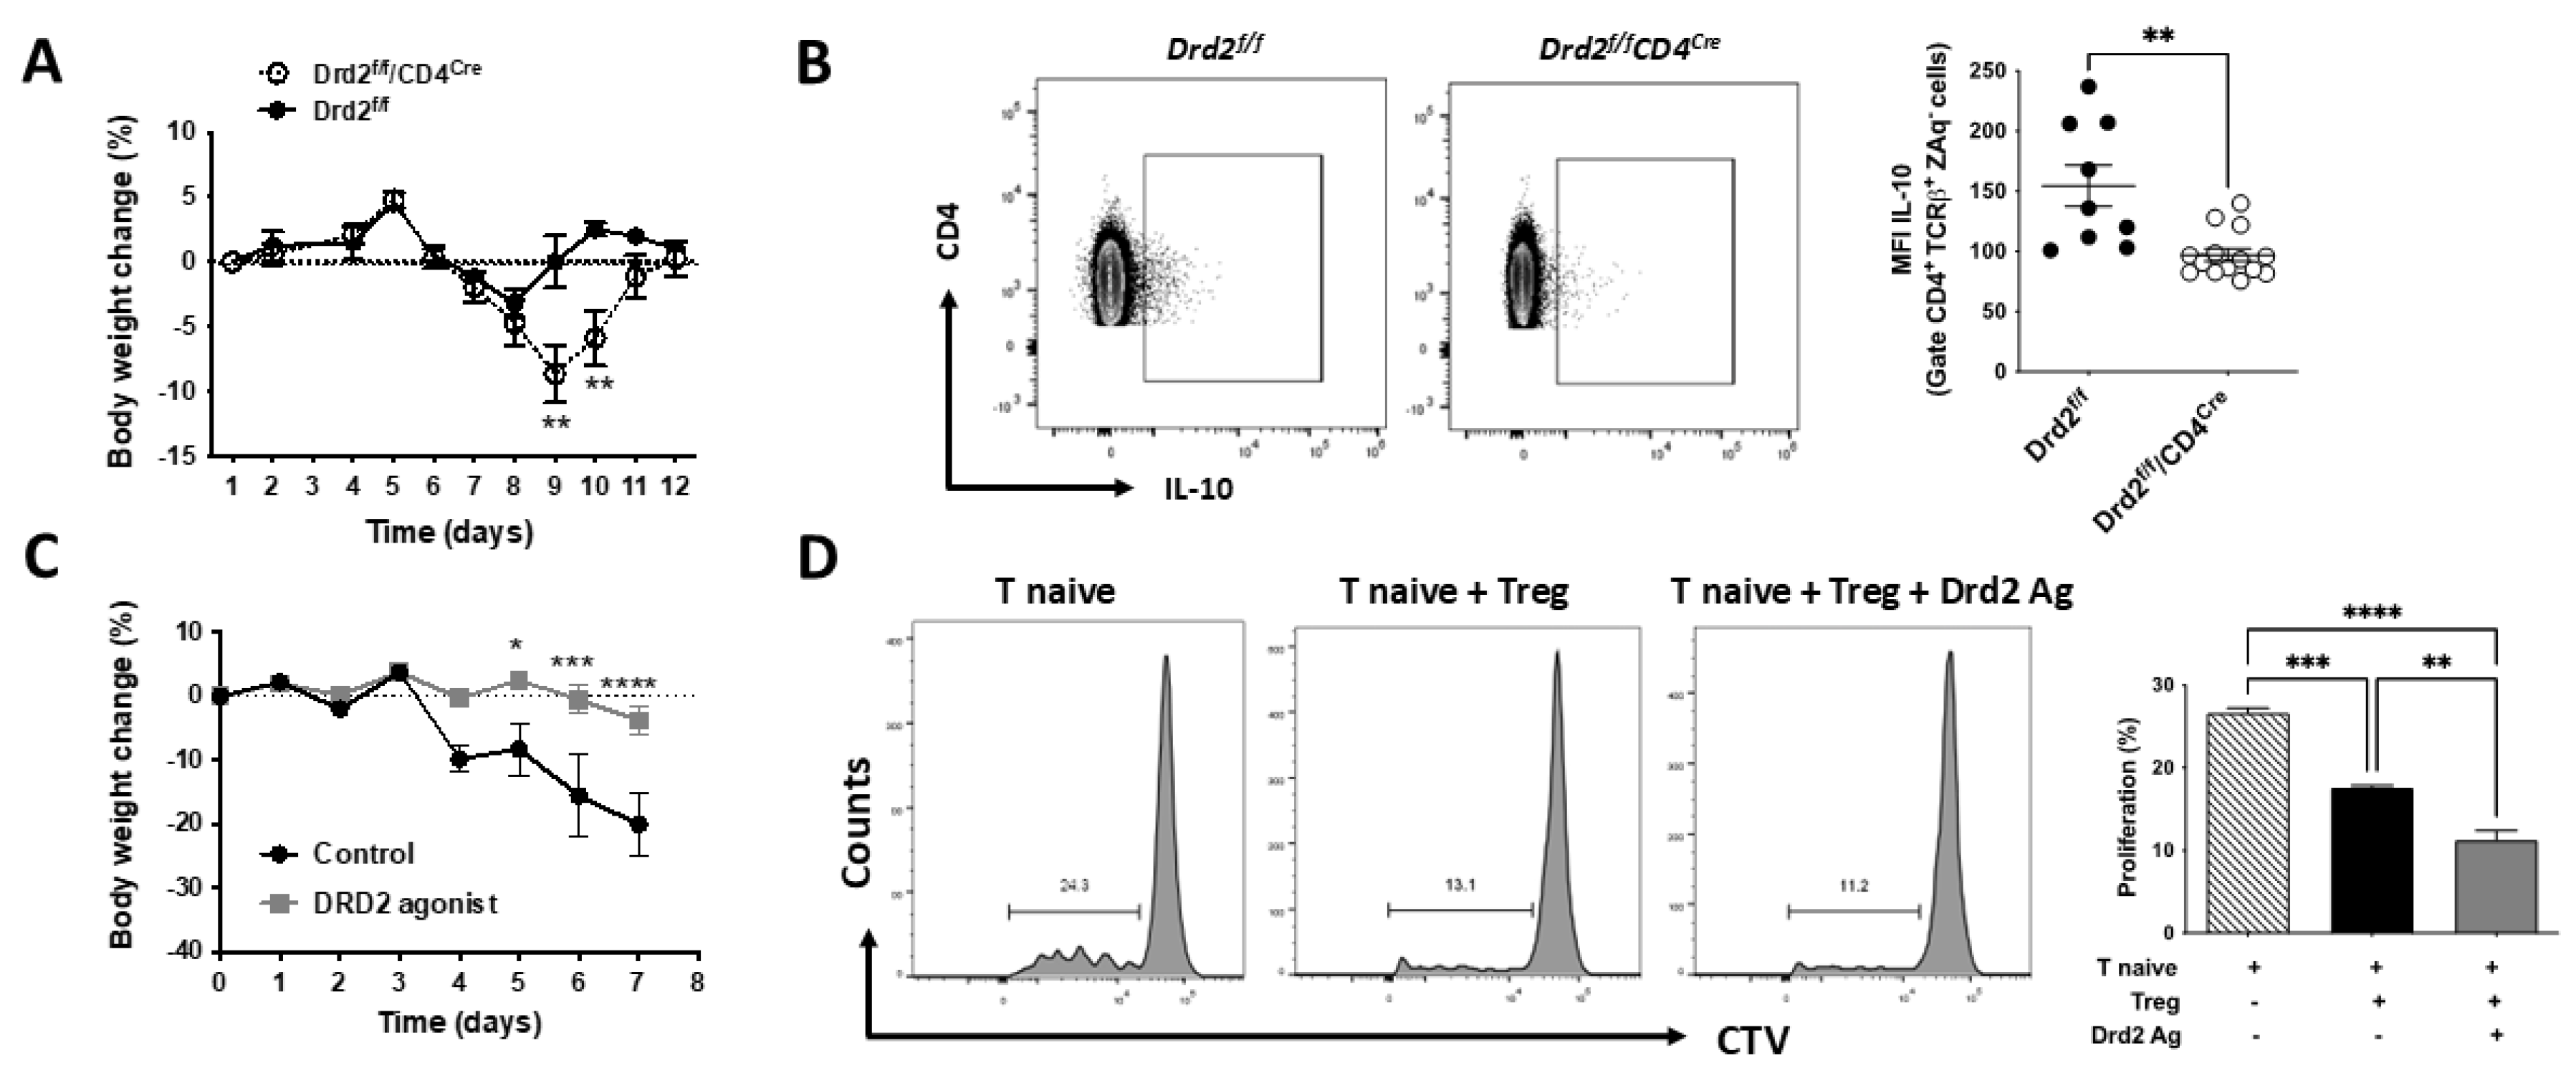
Figure 2.
Drd2-signalling promotes Treg recruitment and retention in the colonic mucosa. (A) Treg cells (CD4+GFP+) isolated from the spleen of wild-type (WT; CD45.1+; black symbols) or from Drd2f/f/CD4Cre (KO; CD45.2+; white symbols) Foxp3gfp mice were mixed in 1:1 ratio (input) and then i.v. injected (7×10⁵ total cells per mouse) into WT (CD45.2+ CD45.1+) recipient mice that previously received DSS for 72h. Mice were further treated with 1.75% DSS for 48h after T-cell transfer and then were sacrificed and the relative composition (CD45.1+ versus CD45.2+) of GFP+ Treg isolated from the spleen or colon was analysed. Top panels show representative contour plots of donor Treg in the input or isolated from recipients. Bottom panels show the quantification of the relative abundance of WT or KO Treg in the spleen (left) or colon (right). Data is the % of single positive CD45.1+ (WT) or double positive CD45.2+ (KO) donor cells in a given tissue. Each symbol represents data obtained from an individual mouse. Mean ± SEM are indicated. Data from a representative experiment are shown. (B) Naïve T-cells (CD4+CD62L+CD44-GFP-) isolated from MLN of Drd2f/f/CD4Cre Foxp3gfp (KO) or Drd2+/+ Foxp3gfp (WT) mice were differentiated into iTreg for 3 d and then, the migration to CCL25 or vehicle was evaluated by transwell assay. Values are the number of iTreg arrived into the bottom chamber. Values are mean ± SEM. (C) Naïve T-cells from Drd2f/f/CD4Cre Foxp3gfp (KO) or Drd2+/+ Foxp3gfp (WT) mice were differentiated into iTreg and CCR9 expression was determined. Values are the percentage of CCR9+ cells in the GFP+ ZAq- population. Mean ± SEM from 4 mice per group. *, p<0.05; ****, p<0.0001 by unpaired t-test (A,C) or two-way ANOVA followed by Sidak’s post-hoc test (B). ns, non-significant.
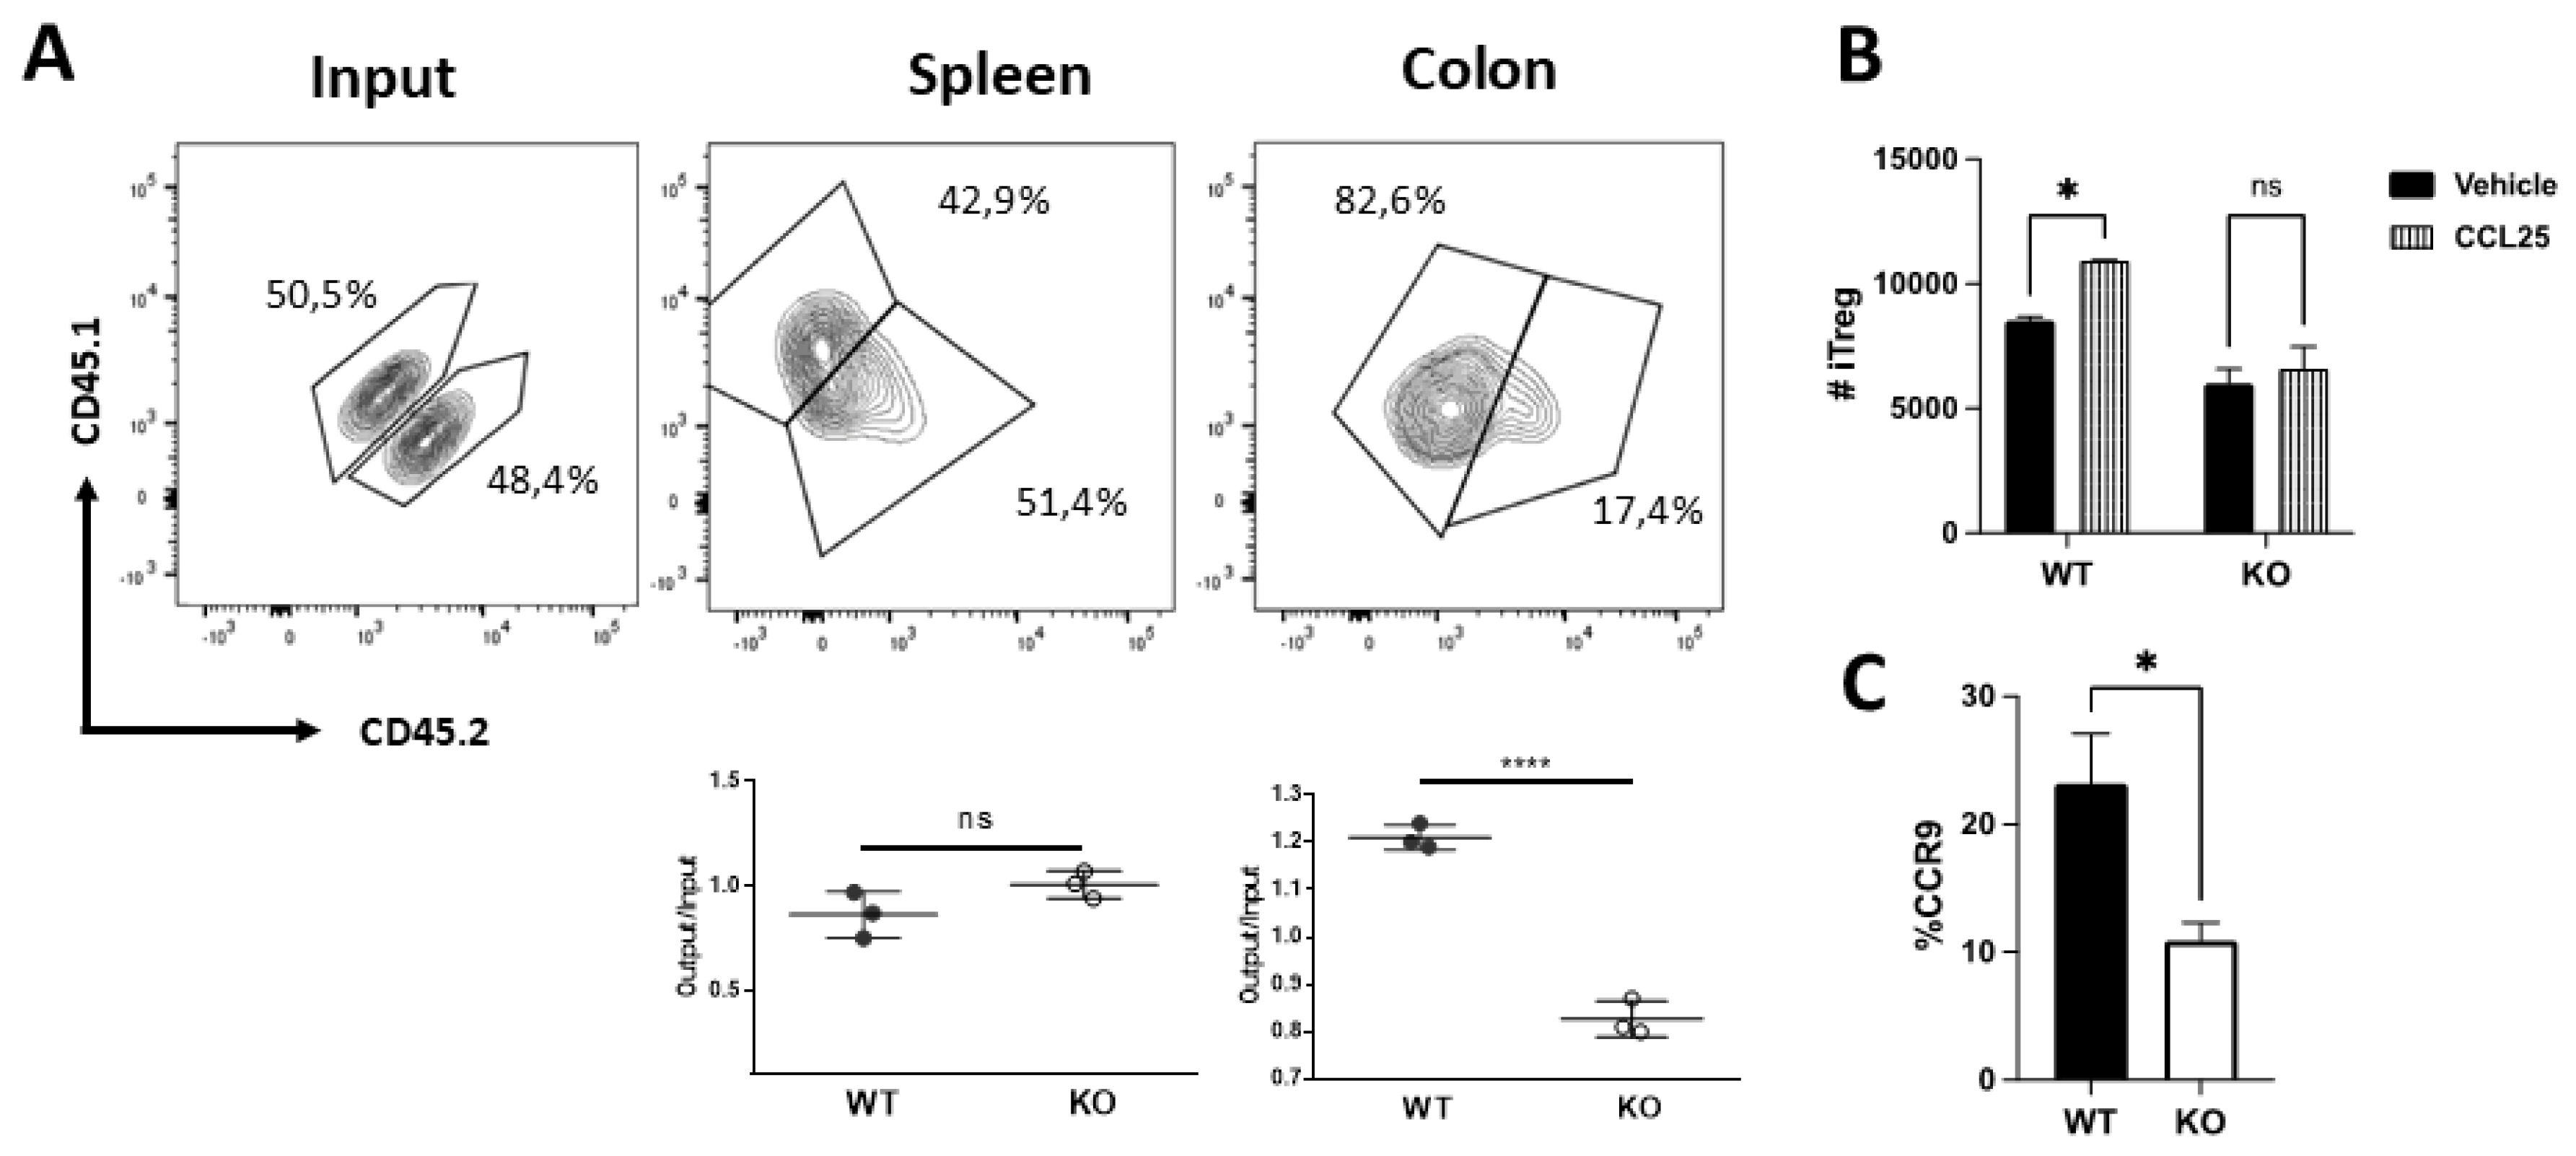
Figure 3.
Reduced DRD2 and increased DRD3 expression in inflamed intestinal mucosa from IBD patients. Gene expression of DRD2 and DRD3 from bulk RNA-sequencing data in ileum and colon biopsies of healthy controls (HC; n=48), non-inflamed (non Inf) and inflamed (Inf) mucosa from patients with Crohn’s Disease (CD; non Inf = 162, Inf = 73), and Ulcerative Colitis (UC; non Inf = 145, Inf = 121). The Y-axis in the graphs represents normalized transcript counts, obtained through TMM normalisation of raw counts from HTSeq. These normalised values are used to depict relative gene expression levels, enabling comparison across samples. Data are presented as medians and interquartile ranges. *, p<0.05; *** p<0.001; p<0.0001 by Kruskal-Wallis test.
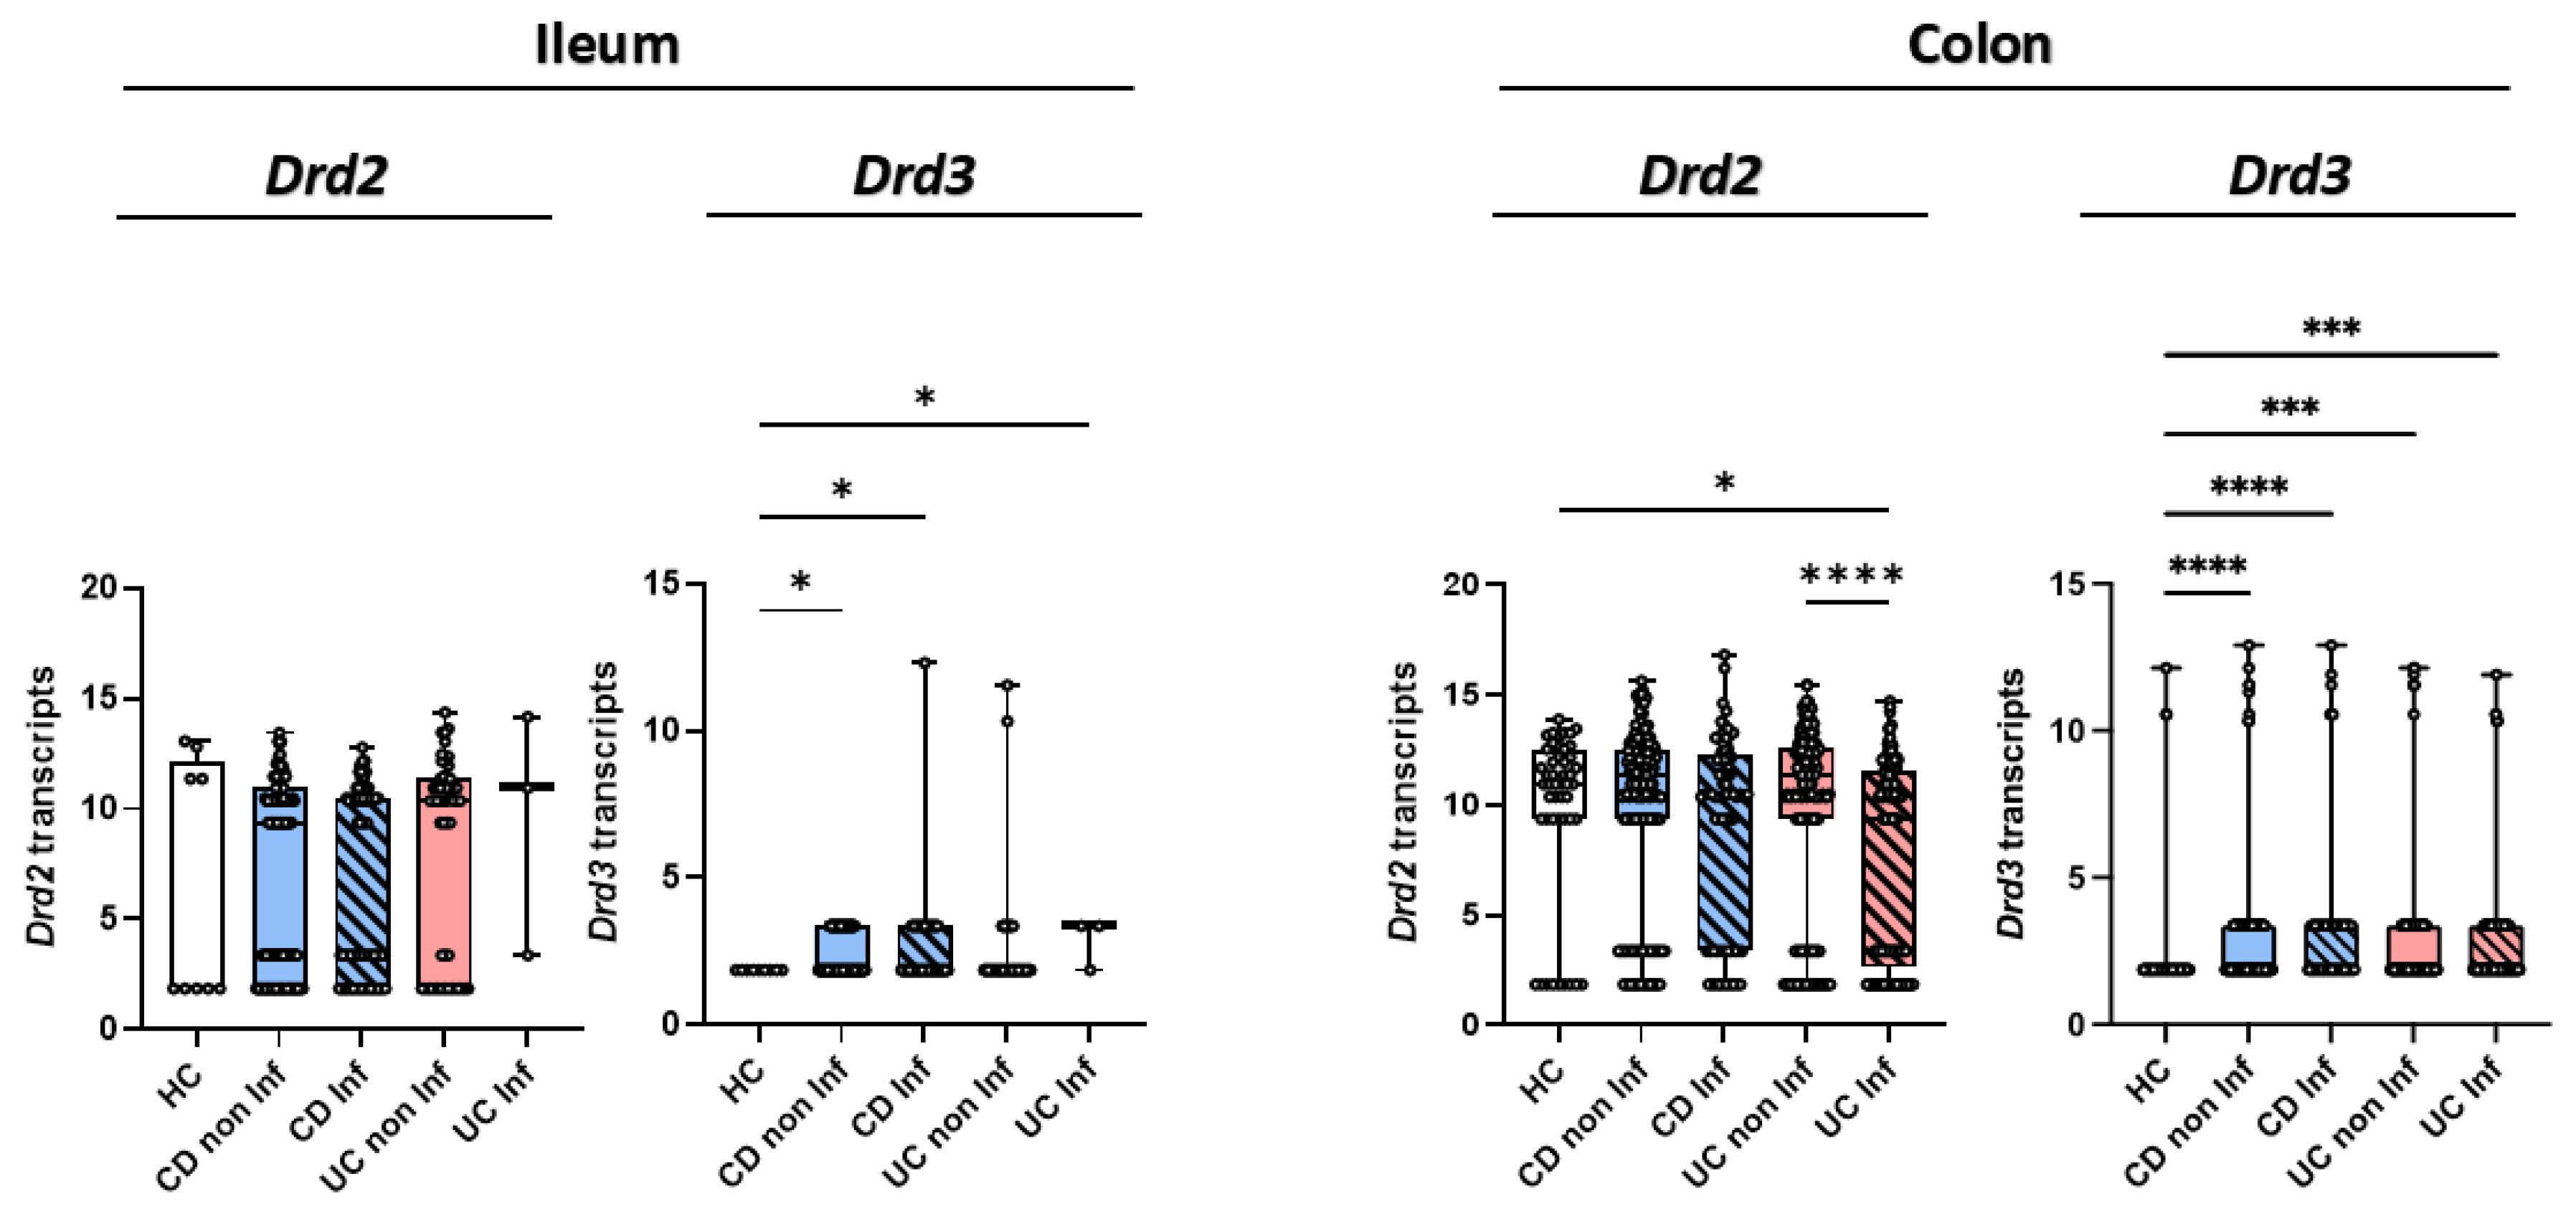
Figure 4.
Drd2 and Drd3 interact physically through TM5 from Drd2 and TM2 and TM6 from Drd3. (A) HEK293T cells, were transfected with constant amount of cDNA encoding for Renilla luciferase (RLuc)-fused to Drd3 (as donor) or to adenosine receptor A1 (A1R, as a negative control) and increasing amounts of cDNA codifying for the Yellow Fluorescent Protein (YFP) fused to Drd2 (as acceptor). BRET was expressed as milli BRET units (mBU) relative to the ratio between YFP fluorescence and RLuc activity. Data from five independent experiments is shown. (B,C) HEK293T cells were transfected with Drd2-nYFP and Drd3-cYFP and BiFC assay was performed. 48h later, cells were left without treatment (Control, black bar) or incubated with different TM-peptides (0,4 μM; see Table 1) from Drd2 (B) or from Drd3 (C) for 4h and YFP-associated fluorescence was determined. Mean ± SEM (n = 16-22 in B; n = 18-36 in C). *, p<0.05; **, p<0.01; ***, p<0.001 by one-way ANOVA followed by Bonferroni’s post-hoc test (B,C).
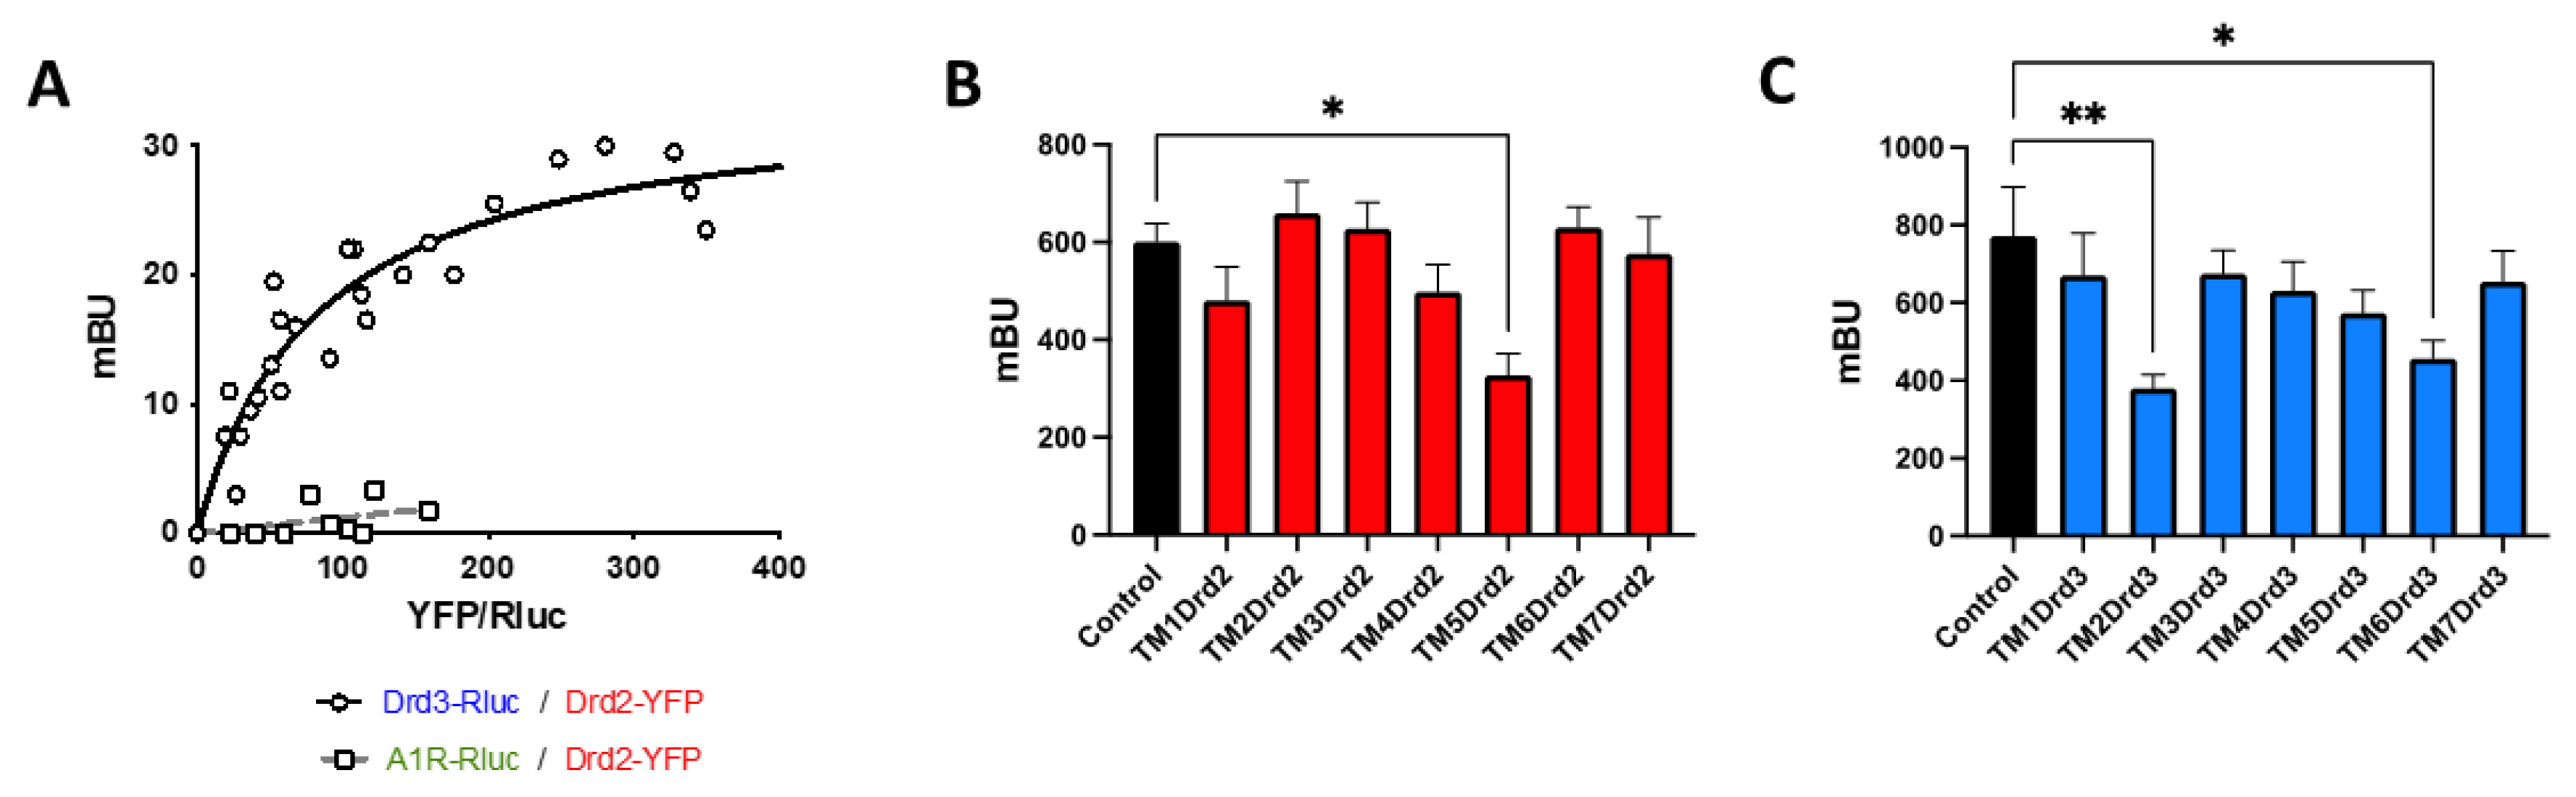
Figure 5.
The Drd2:Drd3 heteromer is expressed on colonic Treg and it is up-regulated upon gut inflammation. Foxp3gfp mice were treated with 1,75% DSS or normal water (Control) for 8 d and the extent of Drd2:Drd3 complexes on GFP+ cells (Treg) and GFP- cells was conducted in the colon by in situ PLA (n = 5 mice per group). (A) Representative images showing staining of nuclei (DAPI, blue), GFP (Foxp3, green), Drd2:Drd3 complexes (PLA, red) and merge. Bar, 20 μm. (B) Quantification of the density of Drd2:Drd3 complexes on GFP+ and GFP- cells with lymphoid morphology. Values are the number of red dots per cell (R). Each symbol represents data obtained from an individual determination from 40-85 fields per group. *, p<0.05; ***, p<0.001; ****, p<0.0001 by two-way ANOVA followed by Sidak’s post-hoc test. * Indicate differences between GFP+ and GFP- cells, while # indicate differences between treatments (control and DSS).
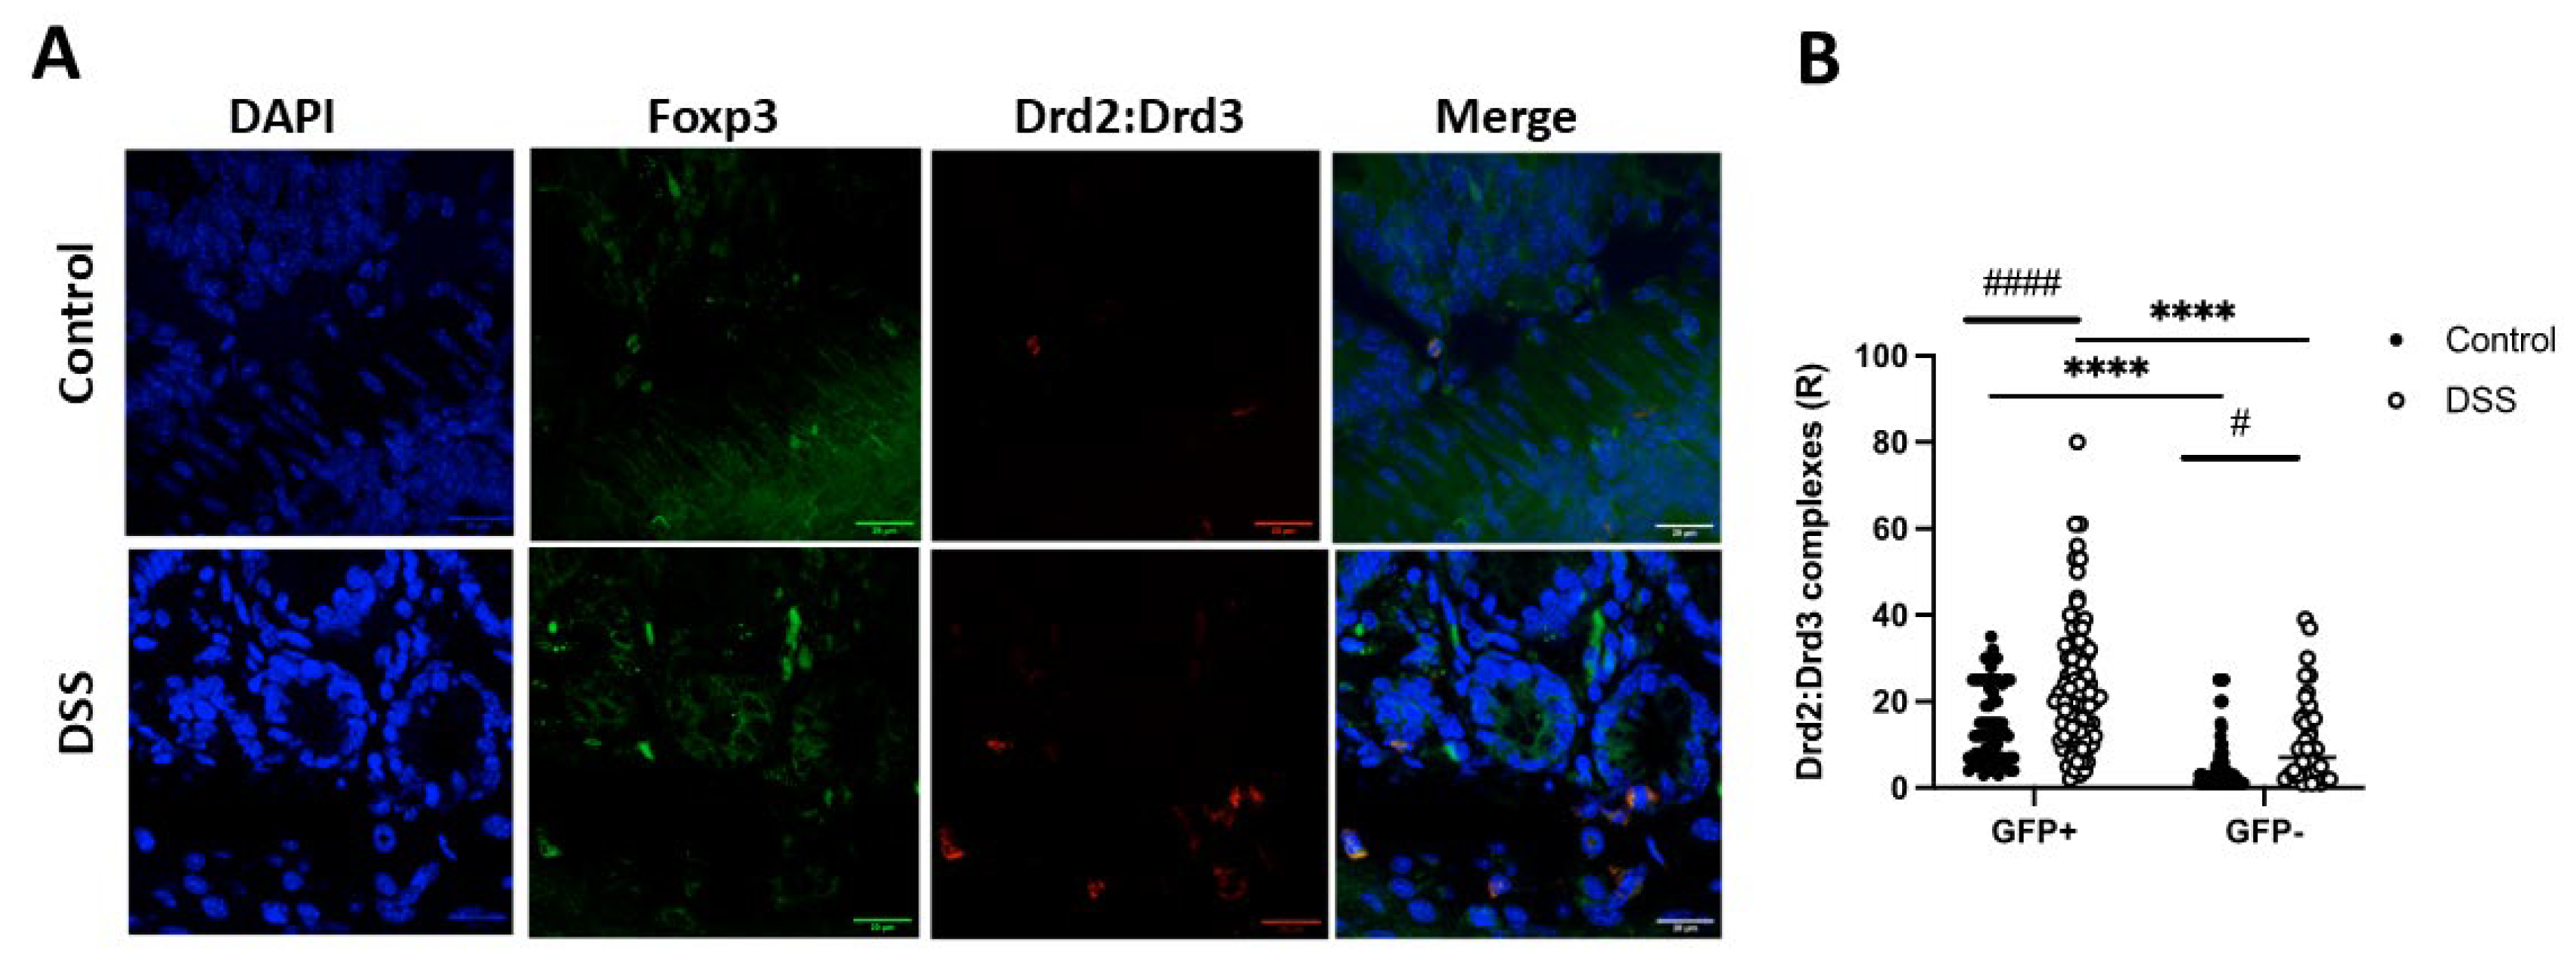
Figure 6.
The population of colonic Treg increases upon gut inflammation, which is dependent on Drd2 and Drd3. Drd2f/f/CD4Cre (Drd2-/-), Drd3-/- (Drd3-/-), or Drd2+/+Drd3+/+ (WT) Foxp3gfp mice were treated with 1,75% DSS or normal water (Control) for 8 d and the extent of Treg infiltration and the expression of Drd2:Drd3 complexes on GFP+ cells (Treg) and GFP- cells was conducted in the colon by in situ PLA (n = 5 mice per group). (A) Representative images showing merged staining of nuclei (DAPI, blue), GFP (Foxp3, green), and Drd2:Drd3 complexes (PLA, red). Bar, 20 μm. (B) Quantification of the percentage of GFP+ cells from the total cells with lymphoid morphology. (C) Quantification of the density of Drd2:Drd3 complexes on GFP+ and GFP- cells with lymphoid morphology. Values are the number of red dots per cell (R). (D) Quantification of the percentage of cells showing PLA+ staining on the GFP+ and GFP- cell population with lymphoid morphology. Each symbol represents data obtained from an individual determination. *, p<0.05; **, p<0.01; ***, p<0.001; ****, p<0.0001 by two-way ANOVA followed by Sidak’s post-hoc test. * indicate differences between genotypes, while # indicate differences between treatments (control and DSS).
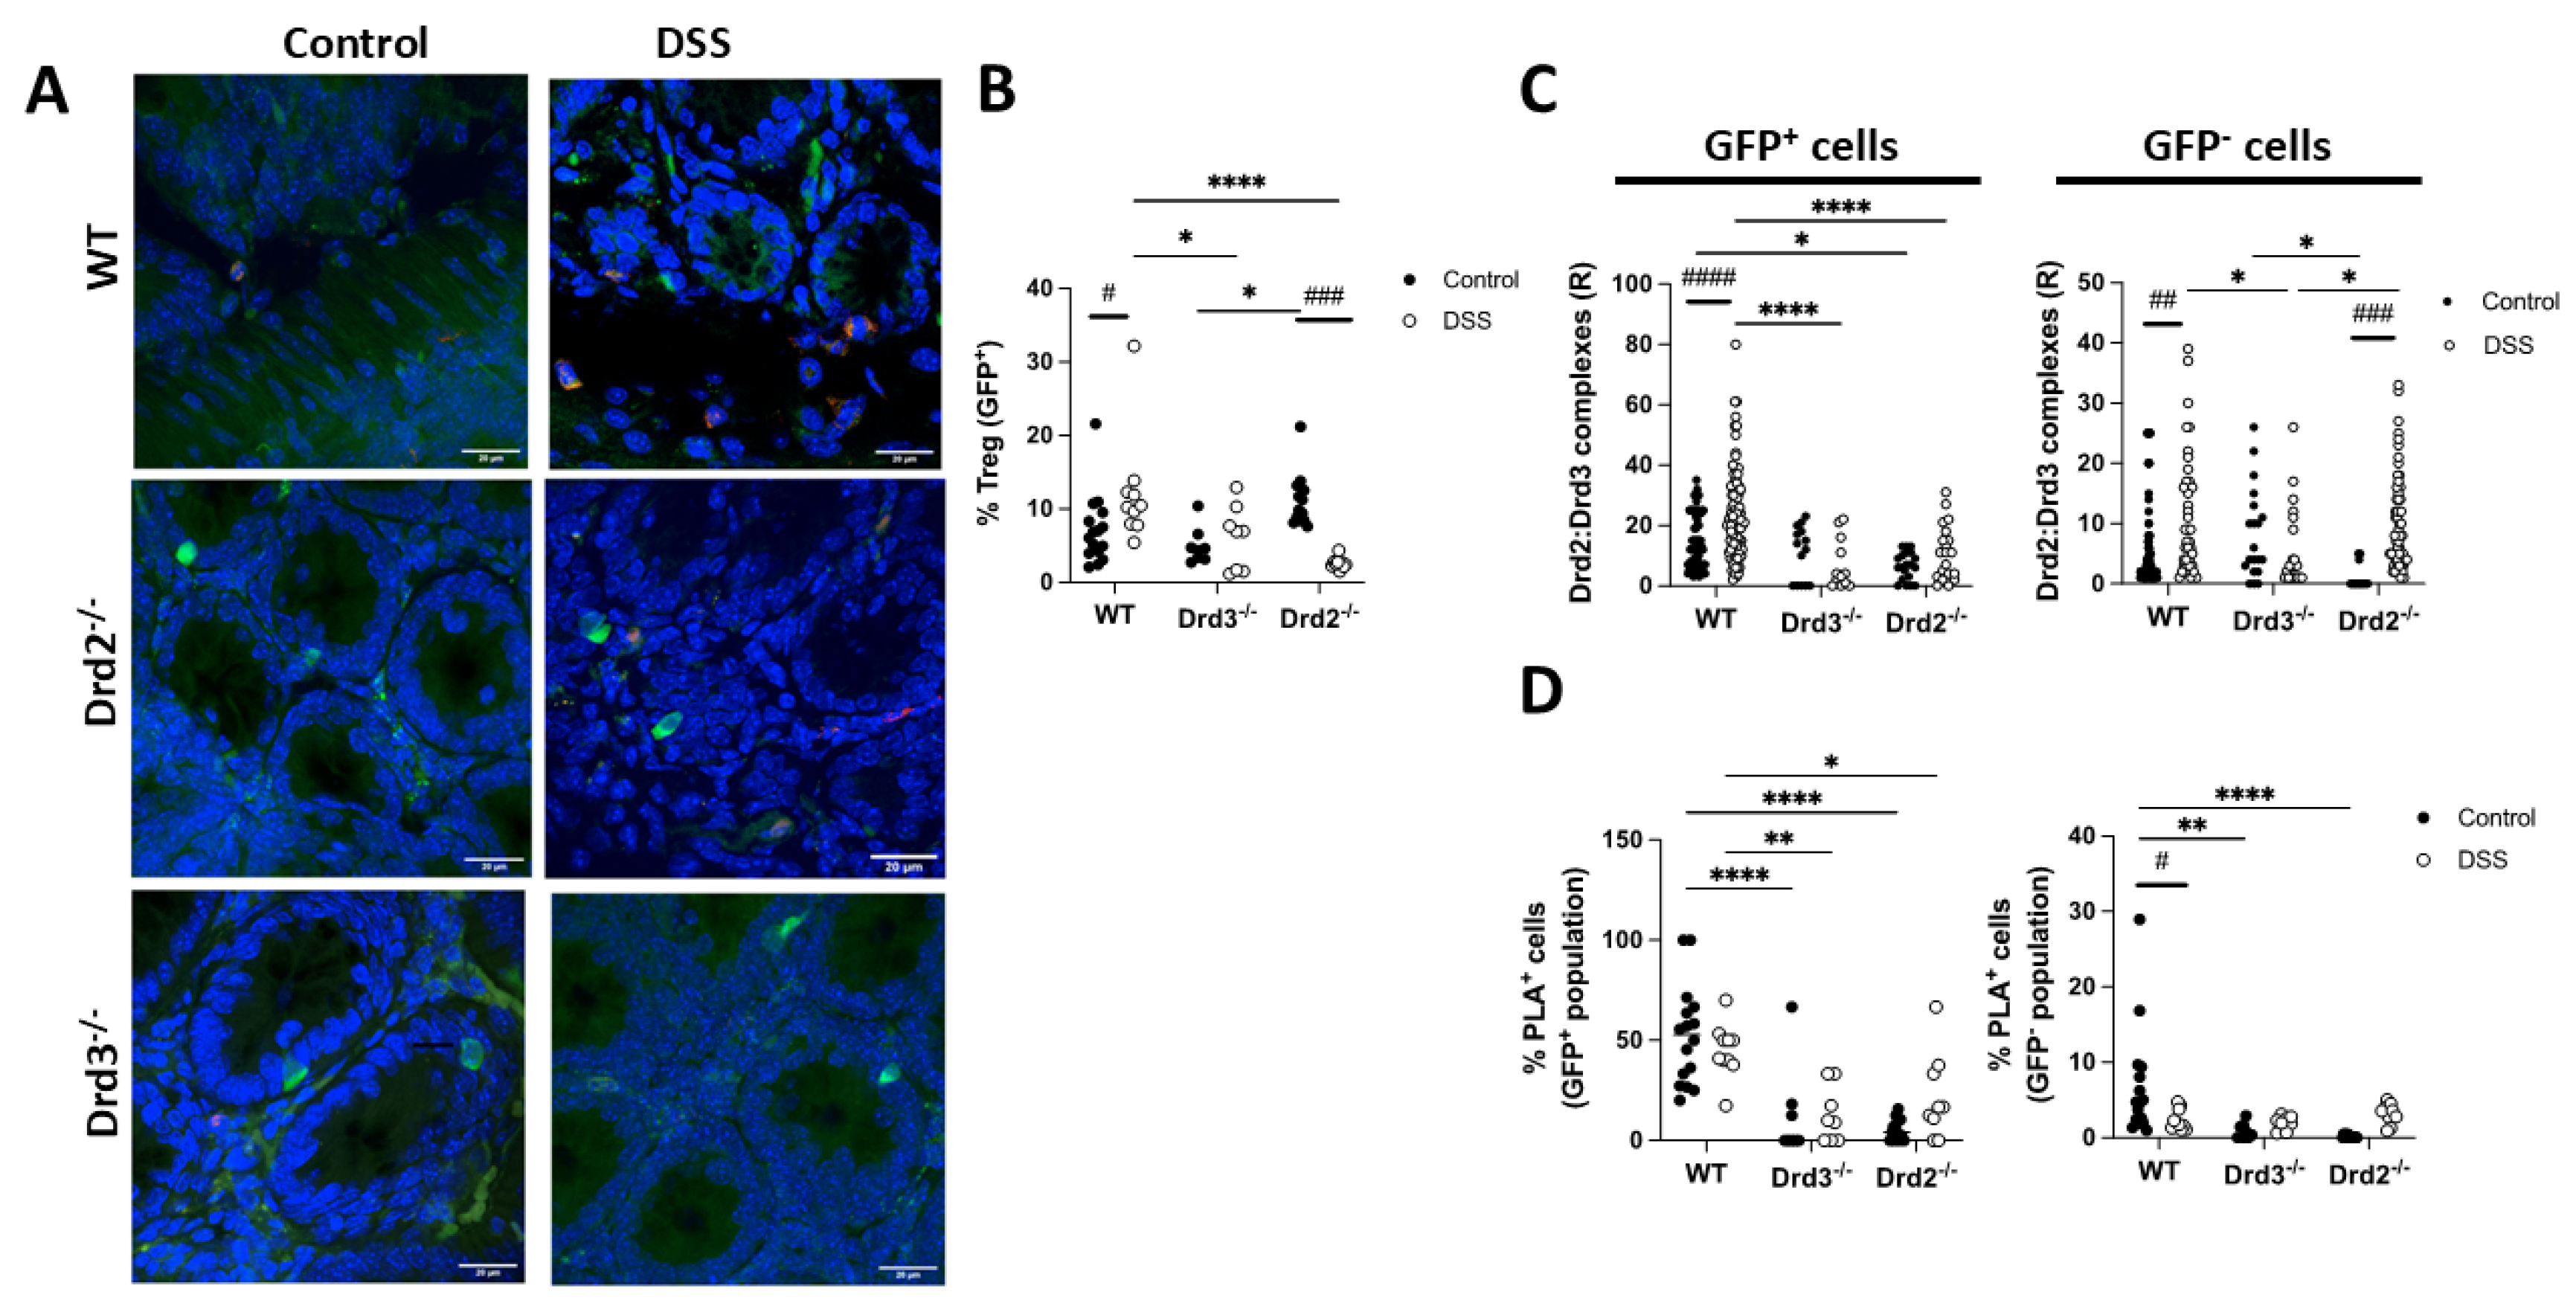
Figure 7.
Disassembling of the Drd2:Drd3 heteromer impairs the suppressive activity of Treg. Splenic Treg cells (CD4+GFP+) isolated from CD45.2+/+ Foxp3gfp mice were incubated with 4 μM TM1Drd2 (green) or TM5Drd2 (red) peptides for 4h. During the last 30 min, cells were non-treated or treated with dopamine 2 μM. Naïve CD4+ CD25- T-cells (T naive) isolated from WT CD45.1+/+ mice were loaded with 5 μM CTV and activated with anti-CD3 and anti-CD28 Abs in the presence of peptide-treated Treg at a Tnaive:Treg ratio of 2:1. After 72h, the extent of T naive proliferation was determined as the dilution of CTV-associated fluorescence in the CD4+ CD45.1+ GFP- ZAq- population by flow cytometry. (A) Representative dot plots. The marker shows proliferating T cells. Numbers on the histogram indicate the percentage of proliferating cells. (B) Quantification was determined as the % of suppression (percentage of reduction in the proliferation relative to the proliferation of T naïve in the absence of Treg). (C) Quantification of IL-10 concentration in the culture supernatant by ELISA. (B,C) Values are the mean ± SEM from a representative experiment conducted with triplicates. Data from one out of three independent experiments are shown. *, p<0.05; **, p<0.01 by two-way ANOVA followed by Sidak’s post-hoc test. ns, non-significant.

Figure 8.
The disruption of the Drd2:Drd3 heteromer assembly dampens the recruitment of Treg into the colonic mucosa upon inflammation. Splenic Treg cells (CD4+GFP+) isolated from CD45.1+ Foxp3gfp or from CD45.1+ CD45.2+ Foxp3gfp mice were incubated with 4 μM TM1Drd2 (green bars) or TM5Drd2 (red bars) peptides respectively for 4h. Afterwards, both groups of Treg cells were mixed in 1:1 ratio (input) and then i.v. injected (7×10⁵ total cells per mouse) into Rag1-/- recipient mice that previously received DSS for 5 days. Mice were further treated with 1.75% DSS for 24h after T-cell transfer and then were sacrificed and the relative composition (CD45.1+ versus CD45.1+ CD45.2+) of GFP+ Treg isolated from the colonic lamina propria or MLN was analysed. (A) Scheme illustrating the experimental strategy. (B) CCR9 and α4β7 expression was determined in the input and analysed by flow cytometry. (C) Top panels showing representative contour plots of donor Treg infiltrated into the colonic lamina propria and MLN of recipients. Numbers indicate the percentage of cells in each region. Bottom panel shows the quantification of the relative abundance of CD45.1+ and CD45.1+ CD45.2+ Treg in particular tissues. Data is the % of CD45.1+ or CD45.1+ CD45.2+ donor cells in a given tissue normalized by the percentage of those cells present in the input. (B,C) Each symbol represents data obtained from an individual mouse. Mean ± SEM are indicated. Data from a representative experiment are shown. ****, p<0.0001 by two-way ANOVA followed by Sidak’s post-hoc test.
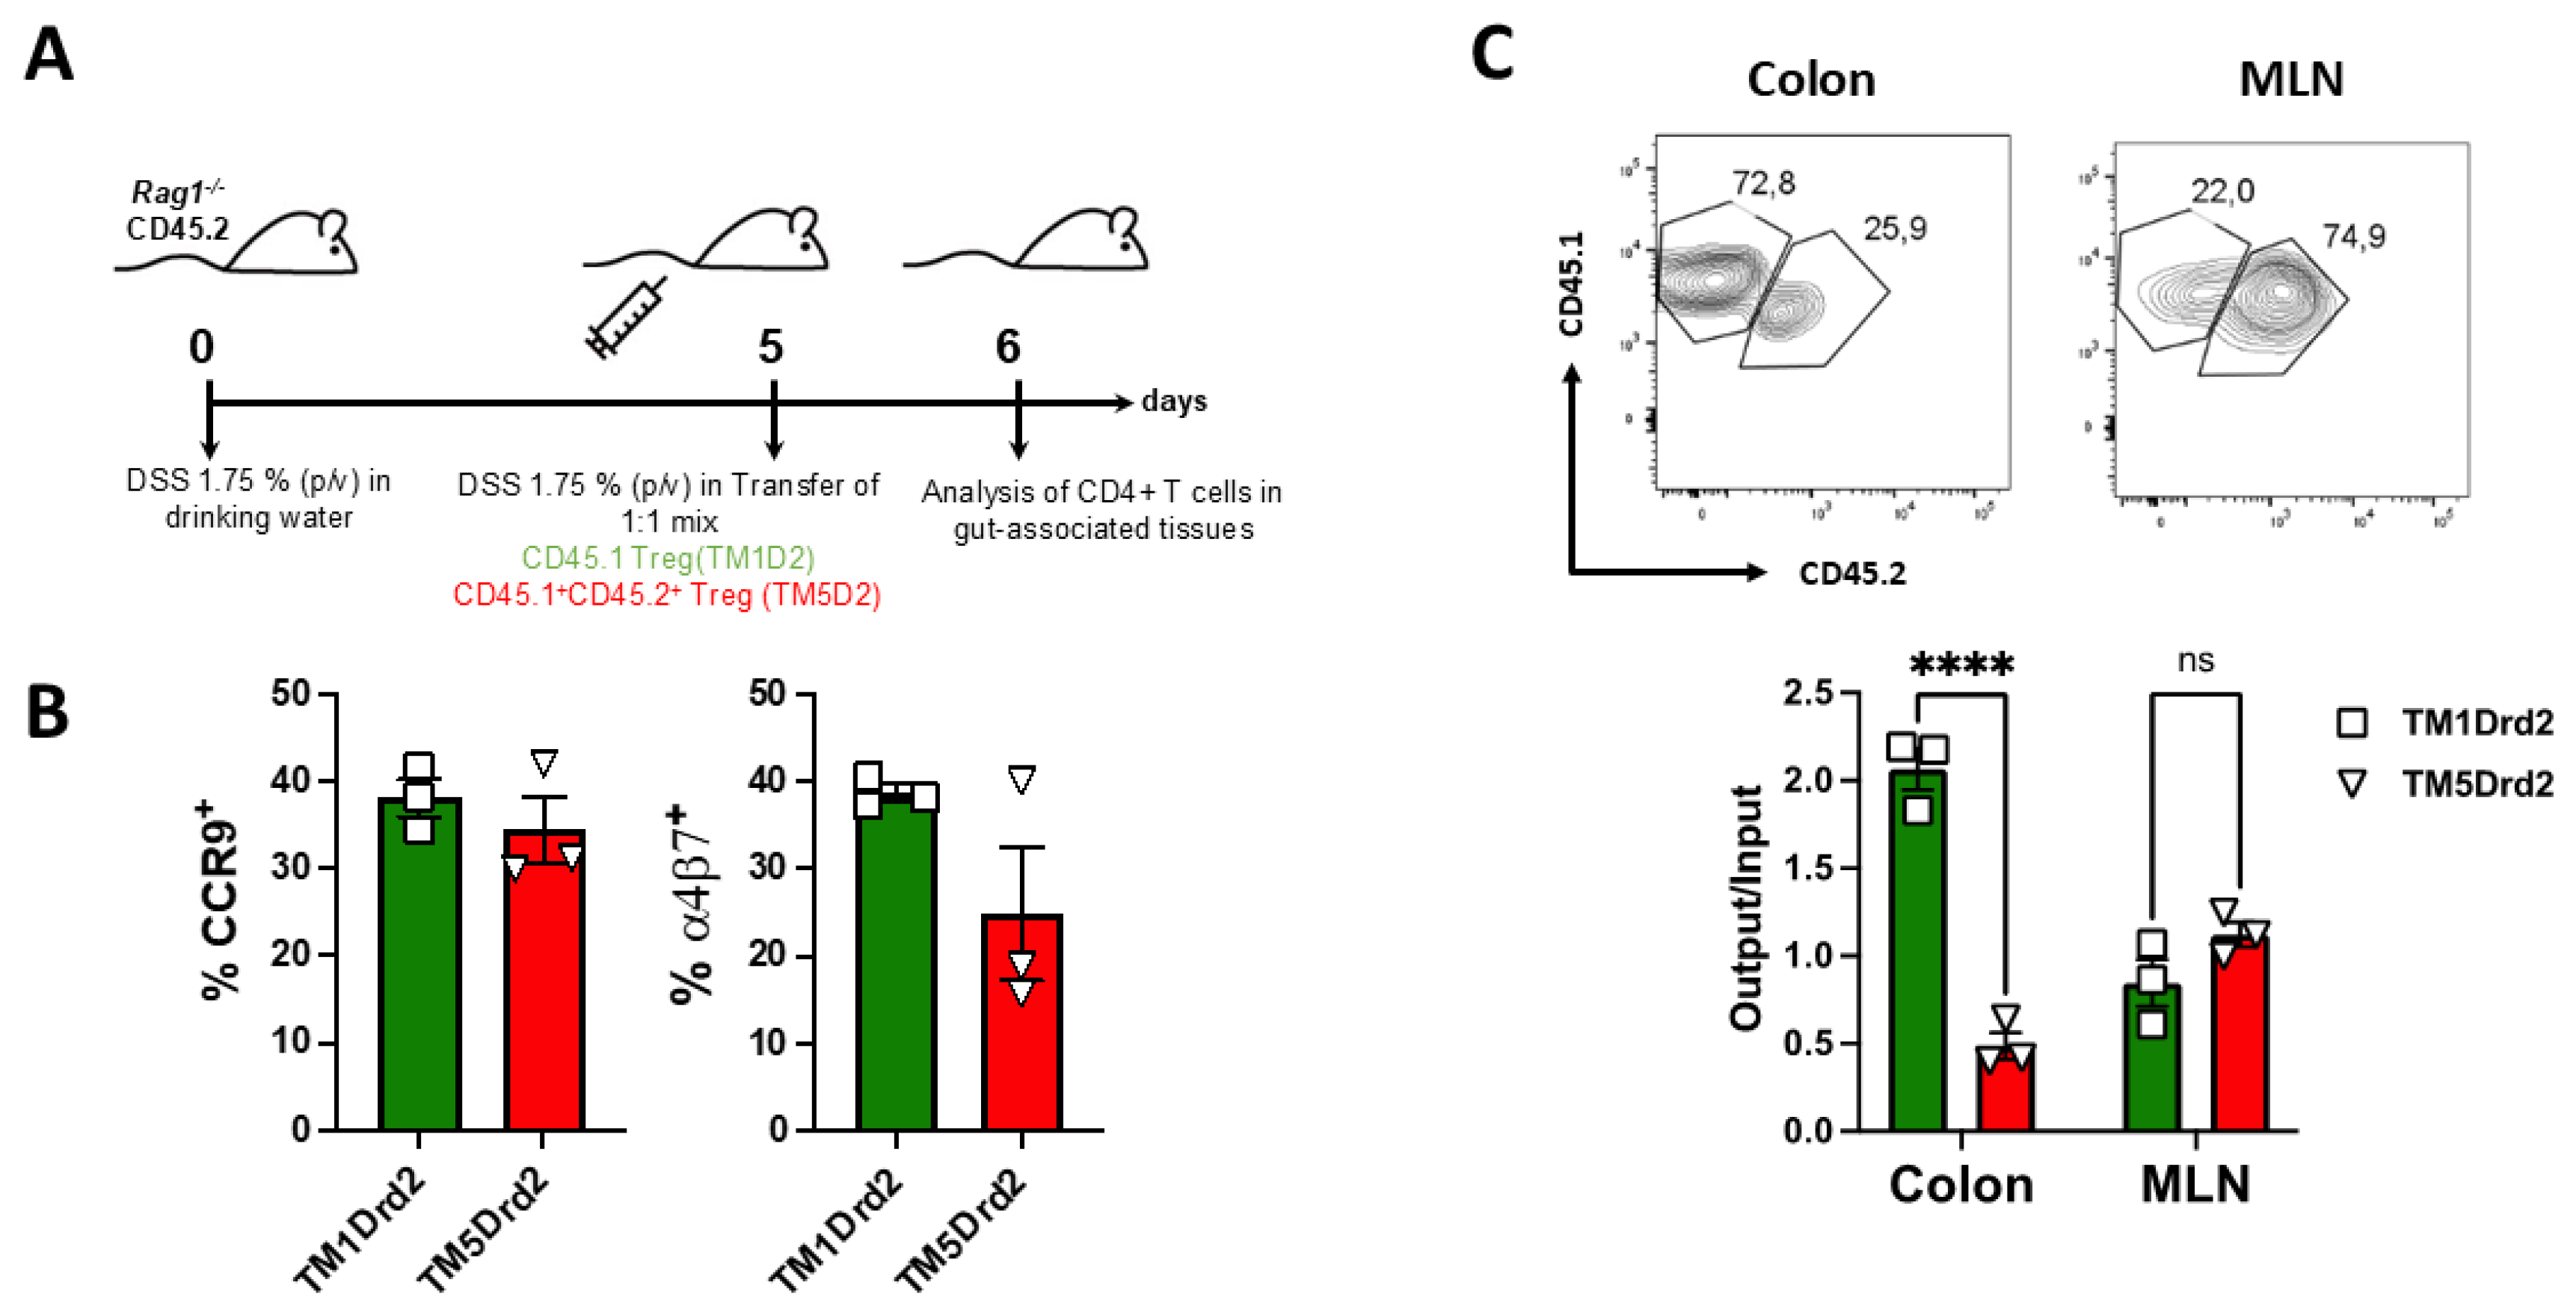

Table 1.
Peptides analogue to transmembrane segments from DRD2 and DRD3.
| Functional name | Short name | Sequence 1 |
|---|---|---|
| TM1hDRD2-TAT | TM1Drd2 | ATLLTLLIAVIVFGNVLVSMAVSYGRKKRRQRRR |
| TAT-TM2hDRD2 | TM2Drd2 | RRRQRRKKRGYYLIVSLAVADLLVATLVMPWVVY |
| TM3hDRD2-TAT | TM3Drd2 | IFVTLDVMMSTASILNLSAISIYGRKKRRQRRR |
| TAT-TM4hDRD2 | TM4Drd2 | RRRQRRKKRGYVTVMISIVWVLSFTISSPLLF |
| TM5hDRD2-TAT | TM5Drd2 | FVVYSSIVSFYVPFIVTLLVYIKIYYGRKKRRQRRR |
| TAT-TM6hDRD2 | TM6Drd2 | RRRQRRKKRGYMLAIVLGVFIISWLPFFITHIL |
| TM7hDRD2-TAT | TM7Drd2 | AFTWLGYVNSAVNPIIYTTFNIYGRKKRRQRRR |
| TM1hDRD3-TAT | TM1Drd3 | ALSYSALILAIVFGNGLVSMAVLYGRKKRRQRRR |
| TAT-TM2hDRD3 | TM2Drd3 | RRRQRRKKRGYYLVVSLAVADLLVATLVMPWVVY |
| TM3hDRD3-TAT | TM3Drd3 | VFVTLDVMMSTASILNLSAISIYGRKKRRQRRR |
| TAT-TM4hDRD3 | TM4Drd3 | RRRQRRKKRGYVALMITAVWVLAFAVSSPLLF |
| TM5hDRD3-TAT | TM5Drd3 | FVIYSSVVSFYLPFGVTVLVYARIYYGRKKRRQRRR |
| TAT-TM6hDRD3 | TM6Drd3 | RRRQRRKKRGYMVAIVLGAFIVSWLPFFLTHVL |
| TM7hDRD3-TAT | TM7Drd3 | ATTWLGYVNSALNPVIYTTFNIYGRKKRRQRRR |
1 Predicted transmembrane regions were obtained for human DRD2 (code P14416) or human DRD3 (code P35462) from uniport. To give a proper delivering of transmembrane peptides with the correct orientation in the plasma membrane, the TAT peptide (shaded in grey) was added in direct orientation (YGRKKRRQRRR) in the C-terminal of odd transmembrane segments and in the inverse orientation (RRRQRRKKRGY) in the N-terminal of even transmembrane segments. The TAT peptide is a cell-penetrating peptide derived from the transactivator of transcription protein of the human immunodeficiency virus. In addition, to avoid the formation of disulfide bridges, cysteines were replaced with serines (underlined).
Disclaimer/Publisher’s Note: The statements, opinions and data contained in all publications are solely those of the individual author(s) and contributor(s) and not of MDPI and/or the editor(s). MDPI and/or the editor(s) disclaim responsibility for any injury to people or property resulting from any ideas, methods, instructions or products referred to in the content. |
© 2025 by the authors. Licensee MDPI, Basel, Switzerland. This article is an open access article distributed under the terms and conditions of the Creative Commons Attribution (CC BY) license (http://creativecommons.org/licenses/by/4.0/).
Copyright: This open access article is published under a Creative Commons CC BY 4.0 license, which permit the free download, distribution, and reuse, provided that the author and preprint are cited in any reuse.


