Submitted:
11 August 2025
Posted:
12 August 2025
Read the latest preprint version here
Abstract
Purpose: In order to better understand the relationship between nutrition and brain health, we compared different studies and their results to evaluate the significant association between diet and preventing psychological & neurological disorders such as: Alzheimer’s disease, depression or how different diet patterns can influence mental and brain health. Method: This research includes a descriptive and retrospective study, including a number of 280 subjects of both sexes and different ages, who accomplished a proposed survey. A statistical analysis was made targeting a variety of parameters that indirectly reflects the impact of diet on mental health. Results: General health– 46,8% of subjects confirm the presence of a high impact on general health (131 cases), followed by the category thinking that chose the presence of a very high impact (114 cases, 40,7%). Physical health – in this case the statistical analysis highlighted equal percentages among high (127 cases, 45,4%) and very high impact (126 cases, 45,0%) on physical health. Mental health – 43,6% of subjects consider that adopting a healthy diet is followed by a significant impact mostly on mental health (122 cases, 43,6%). Focus capacity– 43,2% of subjects consider that healthy alimentation has a significant effect on the ability to focus (121 cases). The ability to memorise – similarly to the previous section, the analysis indicated in the previous item that diet has a high impact on the capacity to memorise (109 cases, 38,9%). Good disposition – the major impact is shown is shown on this aspect as well (125 cases, 44,6%). Conclusion: Over 70% of the subjects involved in this research paper have healthy eating behaviours in correlation with the high percentage of patients without any neuro-degenerative or mental health disorders. Most of the subjects consider that healthy nutrition has a significant impact on health in all its forms (general, mental, physic), but not all of them have healthy food habits, nor use their knowledge. Promising results show that healthy nutrition positively contributes in alleviating focus or learning capacity. There has been a distinctive link between daily caffeine consumption which is associated with an unhealthy diet and unhealthy diet behaviours. 24,6% of subjects with an unhealthy diet and 4,9% of those with relative healthy diet agree daily consumption of soda drinks. Negative feelings, with a significant emotional impact were reported in most of the cases or in superior proportions in subjects with an unhealthy diet (prevailing or intermittent), proving that unhealthy habits might have an important effect on mental health, while exacerbating mental health disorders.
Keywords:
nutrition
; brain health
; unhealthy habbits
; mental health disorders
; healthy diet
; relationships
1. Introduction
In order to better understand the relationship between nutrition and brain health, we compared different studies and their results to evaluate the significant association between diet and preventing psychological or neurological disorders, the link between behaviour and mental health status and dietary patterns as well as the effects of healthy foods, on brain function and wellbeing.
1.1. Nutrition Impact on Brain Health
The high amounts of vitamins, minerals and antioxidants found in high quality food products nourish and protect the brain from oxidative stress and metabolites derived from oxygen consumption reactions from the rest of the body [1].
After ingesting food, secretion of peptides or hormones such as GLP1 (glucagon-like peptide 1) and insulin reach the hypothalamus and hippocampus to activate transduction ways involved in synaptic activation, contributing to memory and learning [2]. Physical activity and diet can influence mitochondrial energy production while the produced ATP might trigger the neurotrophic brain derived factor and insulin growth factor 1 (IGF1) which keeps synaptic plasticity, neuronal excitability and cognitive function [2]. A study that analysed an elderly population found out that consuming more than 58% calories derived from carbohydrates doubles the risk of light mental failure and dementia [3]. Excessive calories may increase cell dysfunction and reduce synaptic plasticity [2]. Many “antioxidant diets” are becoming more and more popular for their beneficial effects on the neuronal function, for instance forest fruits have a high antioxidant property [2].
Micronutrients intake such as vitamins or minerals has been correlated with a better emotion control and less aggressivity among children with ADHD, while a recent meta-analysis claims that a diet rich in refined sugars and saturated fats can increase the risk of hyperreactivity and ADHD compared with a protective effect of diet rich in vegetables and fruits [4].
1.2. Dementia and Alzheimer Disease
Interest has been shown in analysing Mediterranean diet and diet approaches that stop hypertension (DASH) as model diets that have potential strategies of dementia prevention thanks to their anti-inflammatory and cardioprotective influence [5].
Alpha lipoic acid found in meat, especially in heart and vegetables: potatoes, spinach and broccoli, represents a coenzyme that maintains energetic mitochondrial homeostasis, decreases cognitive degradation in small patient groups with Alzheimer disease while improving memory in mammals with Alzheimer [2]. Trans artificial fats could damage brain and can be found in margarine, sweet glazes, snacks and cakes being associated with Alzheimer disease and memory illness [3].
Caloric restriction may have a neuroprotective effect through mitochondrial function enhancement leading to an increase in energy production and supressing reactive oxygen species production
Caloric restriction has anti- inflammatory effects by blocking interleukins (IL6, IL1β, IL4, IL2) and necrosis factors synthesis [6].
2. Diet and Cognition
Epidemiological studies show that the risk of developing Alzheimer disease is not present in subjects having a regular less caloric intake. In a recent case control study based on population, reports show that a high caloric intake is linked with a double risk of having a slight cognitive decline [7].
The Finnish study of geriatric intervention for preventing cognitive disorders and disabilities (FINGER) managed to slow down some cognition decline signs and symptoms by combining physical activity, diet and cognitive training with specific intake of fats, proteins, carbohydrates and small sugar quantities [8].
Fasting
Neuroprotective properties of diet can be linked with an increased concentration of ketonic bodies and biochemical changes that occur in the body as a result of glycolysis inhibition [6]. A 48hours fasting proved an increase of parasympathetic system and a decrease of the frontal cerebral recess activity and improved prefrontal cortex cognitive functions such as metal flexibility [9]. A mice study that took part in an intermittent fasting regimen indicated a decrease in hippocampus neuronal degeneration [7].
3. Diet as a Treatment
Animal studies showed evidence of Western dietary model impact on Alzheimer Disease markers and cerebral insulin signalling [10]. It is well known that the development of dementia is linked with inflammatory risk factors such as: metabolic syndromes, obesity, insulin resistance, type 2 diabetes and hypertension [11]. A meta-analysis of multiple studies highlighted a longitudinal relationship between obesity and depression, observing that depression predisposes to obesity with 55% and vice versa [11].
Eating and Behaviour
The global burden of mental illnesses, both in terms of disability and financial costs competes with all kinds of neoplasm, combined. Furthermore, unipolar depression represents the first cause of disability in high & medium -income countries [12]. High consumption of processed glucides might increase the risk of anxiety and depression through rapid frequent glucose spikes [13].
There are proofs that light dehydration can affect mood and cognitive performance by inducing a negative influence on memory and vigilance, escalation of anxiety, tension and fatigue [14]. It has been also shown in recent studies that N-acetyl cysteine represents a potential therapeutic option for drug abuse, gambling, schizophrenia, depression and bipolar disorder as people consume certain foods as a response to positive and negative emotions [15,16].
4. Nutrition and Mental Health
4.1. Autism
Studies show that ASD (autistic syndrome disorder) patients that stick to a diet without gluten and casein (GFCF- Gluten free Casein free) significantly decreased intestinal permeability compared to healthy individuals (32). GFCF indicated improvements in behaviours and psychological, also in vocal communication and non-vocal, dis and attention, aggressive episodes, motor skills, affection, rituals and routine, learning responses, sleep, empathy and anxiety [17].
4.2. Nutritional Psychiatry
Animal research indicated that the link between appetitive and affective symptoms comes from the neurochemical effects of eating high-carbohydrate and low protein foods, reacts through insulin increasing levels of tryptophane in the brain, facilitating the production of serotonin [18].
5. Experiments Performed in This Study
5.1. Method
This research includes a descriptive and retrospective study, including a number of 280 subjects of both sexes and different ages, that accomplished a proposed survey. A statistical analysis was made targeting a variety of parameters that indirectly reflects the impact of diet on mental health.
5.2. Research Materials
Ensuing two survey models: "Survey about healthy eating habits", "The Effect of healthy diet and Fermented Foods on Mental Health", continuous variables presented mean ± standard deviation. Continuous variables are related using the Student -T test.
Categorical variables are expressed as numbers and/or percentages. Categorical variables are related with the Person Chi - square Test. Each statistical tests are "2-tailed" and with a P<0.05 value studied statistically significant. Also, statistical analyses including odds ratio (OR) were performed in IBM SPSS Statistics (Statistical Package for The Social Sciences) version 20.
5.3. Results
Statistical Analysis of Demographic Data
Choose your age range: 33,02% of the questioned subjects were aged between 18 and 25 years old (93 cases, 33,2%), followed by the fourth decade participants (58 cases, 20,7%). (Table1) (Figure 1)
Please specify your gender– most enrolled subjects in this paper were females (225 cases, 80,4%). (Table 1)
How would you describe your diet habits? – 73,2% of the questioned subjects stated that they have healthy dietary habits (205 cases), followed by the relative unhealthy habits (57 cases, 20,4%). Extreme answering options (very unhealthy, very healthy) were found in small proportions of subjects (2,5, respectively 3,9%). (Table 2) (Figure 2)
Do you have any mental health issues such as anxiety or depression? – 73,6% of subjects do not suffer from anxiety or depression (206 cases) (Figure 3)
Do you suffer from a neuro-degenerative disorder, such as Parkinson or Alzheimer? - 98,6% of the subjects do not suffer from neuro-degenerative disorders (276 cases) (Figure 4)
General healthy– 46,8% of subjects confirm the presence of a high impact on general health (131 cases), followed by the category thinking that chose the presence of a very high impact (114 cases, 40,7%) .(Table 3) (Figure 5)
Physical health – in this case the statistical analysis highlighted equal percentages among high (127 cases, 45,4%) and very high impact (126 cases, 45,0%) on physical health. (Table 3) (Figure 6)
Mental health – 43,6% of subjects consider that adopting a healthy diet is followed by a significant impact mostly on mental health (122 cases, 43,6%). (Table 3) (Figure 7)
Focus capacity– 43,2% of subjects consider that healthy alimentation has a significant effect on the ability to focus (121 cases) (Table 4) (Figure 8)
The ability to memorise – similarly to the previous section, the analysis indicated in the previous item that diet has a high impact on the capacity to memorise (109 cases, 38,9%). (Table 4) (Figure 9)
Good disposition – the major impact is shown is shown on this aspect as well (125 cases, 44,6%) (Table 4) (Figure 10)
How often do you consume the following: vegetables (128 cases, 45,7%) (Figure 11), fruits (116 cases, 41,4%) (Figure 12), meat (137 cases, 48,9%) (Figure 13) and dairy products (130 cases, 46,4%) (Table 5), these being foods consumed weekly by our subjects that filed in the survey for this research paper. White carbohydrates dominated the daily consumption (130 cases, 46,4%) (Figure 14), proportion similar to caffeinated drinks (152 cases, 54,3%) (Figure 15). Fast food is consumed mostly monthly (98 cases, 35,0%) (Table 5). 89,4% of subjects claim a daily water intake (Figure 16), Sweets consumption stake( Figure 17), Snacks consumption stake ( Figure 18), Soft Drinks consumption stake( Figure 19) (Table 5).
Considering the past month, how these affirmations apply to you?
6. Discussions
Recent studies involved 124 participants (mean age: 52 ± 9 years) with sedentary lifestyle, high blood pressure, and body mass index (BMI) greater than 24. After 4 months when they were assessed, a significant improvement in both psychomotor speed and executive function and learning memory was noted [7].
A review of several studies showed that a lower probability of depression was linked to increased consumption of a healthy diet, defined as diet rich in fruits, vegetables, figs or whole grains [4].
The antidepressant effect of resveratrol (found in foods such as peanuts, grapes, blueberries, mulberries and raspberries) has been suggested by several recent studies [7]
The nature of mental health conditions such as depression alters appetite. Atypical depression has been shown to be particularly correlated with increased appetite and subsequent weight gain [11].
Observational research has found that recurrent hypo-glycemia is correlated with mood disorders [13].
The improvement in well-being from increased fruit and vegetable intake is almost immediate, people's interest in eating healthy foods is unmotivated because the physical health benefits appear decades later, and these are falsely seen as more important than well-being [18].
Family context, mental health issues were associated with distant relationships with parents, and family violence, while the school context, feelings of loneliness and trouble sleeping were associated with poor peer relationships, insecurity at school[19].
These results, help to highlight potential points of intervention for supporting public health programs within the boarding-school student population[20].
Another study shows that 79.2% of the pupils that were interviewed came from an organized family, 13.2% came from a disorganized family, and 7.6% came from a reorganized family. 71.1% of the pupils reported being satisfied with their relationship with their parents, while 4.9% were unsatisfied. Girls were significantly more unsatisfied with their relationship with their parents than boys. 46.2% were satisfied with the financial status of their families, while 16.4% were unsatisfied.. The unsatisfaction grade can lead to mental unbalances and can affect mental health on long term and also unhealthy habbits[21].
7. Conclusions
Over 70% of the subjects involved in this research paper have healthy eating behaviours in correlation with the high percentage of patients without any neuro-degenerative or mental health disorders (Table 8). Most of the subjects consider that healthy nutrition has a significant impact on health in all its forms (general, mental, physic), but not all of them have healthy food habits, nor use their knowledge (Table 8 and Table 9).
Promising results show that healthy nutrition positively contributes in alleviating focus or learning capacity. There has been a distinctive link between daily caffeine consumption which is associated with an unhealthy diet and unhealthy diet behaviours. 24,6% of subjects with an unhealthy diet and 4,9% of those with relative healthy diet agree daily consumption of soda drinks( Table 9 and Table 10).
Negative feelings, with a significant emotional impact were reported in most of the cases or in superior proportions in subjects with an unhealthy diet (prevailing or intermittent), proving that unhealthy habits might have an important effect on mental health, while exacerbating mental health disorders( Table 8, 9 and 10).
Author Contributions
Investigation, Sitaru Georgiana Patricia and Folescu Roxana; Methodology, Simbrac Mihaela Cristina; Software, Vacaru Gabriel Cristian and Borca Ciprian Ioan; Supervision, Miloicov Bacean Oana Codruta; Writing – original draft, Mohammad Aljafari Rakan Adnan Mohammad.
Ethical Issues
The research was conduced in accordance with the guidelines outlined in the Declaration of Helsinki. Ethical clearance obtained from “Victor Babes” University of Medicine and Pharmacy, Center for Studies in Preventive Medicine, Timisoara, Romania, Institutional Review Board, research support officers. The research’s objectives, benefit and risks were explained to the participants before data collection and obtained written informed consent from the study participants. The research participants were assured of the attainment of confidentiality, and the information they give us will not be used for any purpose other than the research.
References
- Eva Selhub MD, Contributing Editor. HARVARD HEALTH BLOG „Nutritional psychiatry: Your brain on food” March 26, 2020 https://www.health.harvard.edu/blog/nutritional-psychiatry-your-brain-on-food-201511168626.
- Gómez-Pinilla, F. Brain foods: the effects of nutrients on brain function. Nat Rev Neurosci 9, 568–578 (2008). [CrossRef]
- Elise Mandl, BSc, APD “The 7 Worst Foods for Your Brain” January 28, 2018 https://www.healthline.com/nutrition/worst-foods-for-your-brain.
- Roger A.H. Adan, Eline M. van der Beek, Jan K. Buitelaar, et al.”Nutritional psychiatry: Towards improving mental health by what you eat” Journal: European Neuropsychopharmacology, Volume 29, Issue 12, 2019, Pages 1321-1332. [CrossRef]
- McGrattan, A.M. , McGuinness, B., McKinley, M.C. et al. Diet and Inflammation in Cognitive Ageing and Alzheimer’s Disease. Curr Nutr Rep 8, 53–65 (2019). [CrossRef]
- Włodarek, D. Role of Ketogenic Diets in Neurodegenerative Diseases (Alzheimer’s Disease and Parkinson’s Disease). Nutrients 2019, 11, 169. [Google Scholar] [CrossRef]
- Tytus Murphy, Gisele Pereira Dias, Sandrine Thuret, "Effects of Diet on Brain Plasticity in Animal and Human Studies: Mind the Gap", Neural Plasticity, vol. 2014, Article ID 563160, 32 pages, 2014. [CrossRef]
- Devin Wahl, Victoria C. Cogger, Samantha M. Solon-Biet, et al. Nutritional strategies to optimise cognitive function in the aging brain, Ageing Research Reviews, Volume 31, 2016, Pages 80-92. [CrossRef]
- (https://www.sciencedirect.com/science/article/pii/S156816371630054X).
- Rima Solianik, Artūras Sujeta, Asta Terentjevienė, et al. "Effect of 48 h Fasting on Autonomic Function, Brain Activity, Cognition, and Mood in Amateur Weight Lifters", BioMed Research International, vol. 2016, Article ID 1503956, 8 pages, 2016. [CrossRef]
- Bradley, J. Baranowski, Daniel M. Marko, Rachel K. Fenech, et al. Healthy brain, healthy life: a review of diet and exercise interventions to promote brain health and reduce Alzheimer’s disease risk, Applied Physiology, Nutrition, and Metabolism. 45(10): 1055-1065. [CrossRef]
- Shantal, D. Edirappuli, Ashwin Venkatesh & Rashid Zaman: THE EFFECT OF NUTRITION ON MENTAL HEALTH, A FOCUS ON INFLAMMATORY MECHANISMS Psychiatria Danubina, 2020; Vol. 32, Suppl. 1, pp 114-120 http://www.psychiatria-danubina.com/UserDocsImages/pdf/dnb_vol32_noSuppl%201/dnb_vol32_noSuppl%201_114.pdf.
- Lachance L, Ramsey D. „Food, mood, and brain health: implications for the modern clinician” Mo Med. 2015;112(2):111-115. https://www.ncbi.nlm.nih.gov/pmc/articles/PMC6170050/.
- Firth J, Gangwisch J E, Borsini A, et al. Food and mood: how do diet and nutrition affect mental wellbeing? BMJ 2020; https://www.bmj.com/content/369/bmj.m2382.
- Meeusen, R. , & Decroix, L. (2018). Nutritional Supplements and the Brain, International Journal of Sport Nutrition and Exercise Metabolism, 28(2), 200-211. Retrieved Sep 12, 2021, from https://journals.humankinetics.com/view/journals/ijsnem/28/2/article-p200.xml 15)Marx, W., Moseley, G., Berk, M., & Jacka, F. (2017). Nutritional psychiatry: The present state of the evidence. Proceedings of the Nutrition Society, 76(4), 427-436. [CrossRef]
- Constantin, Elena-Teodora & Fonseca, Sandra. (2020). The effect of food on mental health. Revista Internacional de Educação, Saúde e Ambiente. 3. 1-17. https://www.researchgate.net/publication/343534587_The_effect_of_food_on_mental_health.
- Van De Sande, M. , Van Buul, V., & Brouns, F. (2014). Autism and nutrition: The role of the gut–brain axis. Nutrition Research Reviews, 27(2), 199-214. [CrossRef]
- Wurtman RJ, Wurtman JJ. Brain serotonin, carbohydrate-craving, obesity and depression. Obes Res. 1995 Nov;3 Suppl 4:477S-480S. [CrossRef]
- Escobar. Family and school context: effects on the mental health of brazilian students. Int J Environ Res Public Health. 2020;17:6042. [CrossRef]
- Noll, Noll M, Noll PRES, et al. Health-risk behavior differences 475 between boarding and non-resident students: adolescent National School Health Survey. Arch Public Health. 2020;78:8. [CrossRef]
- Oana Codruta Miloicov Bacean, Ovidiu Fira-Mladinescu, Salomeia Putnoky, Ioana Tuta Sas, Petrescu Cristina, Radu Bagiu, Iulia Cristina Bagiu, Oana Suciu, Corneluta Fira-Mladinescu and Brigitha Vlaicu Article title: High School Pupils’ Relationships with Their Parents, Schoolmates, and Friends, and Health-Related Risk Behaviors Submission no: 306133, Published: May 2021 in Psychology Research and Behavior Management. [CrossRef]
Figure 1.
Age distribution of subjects.
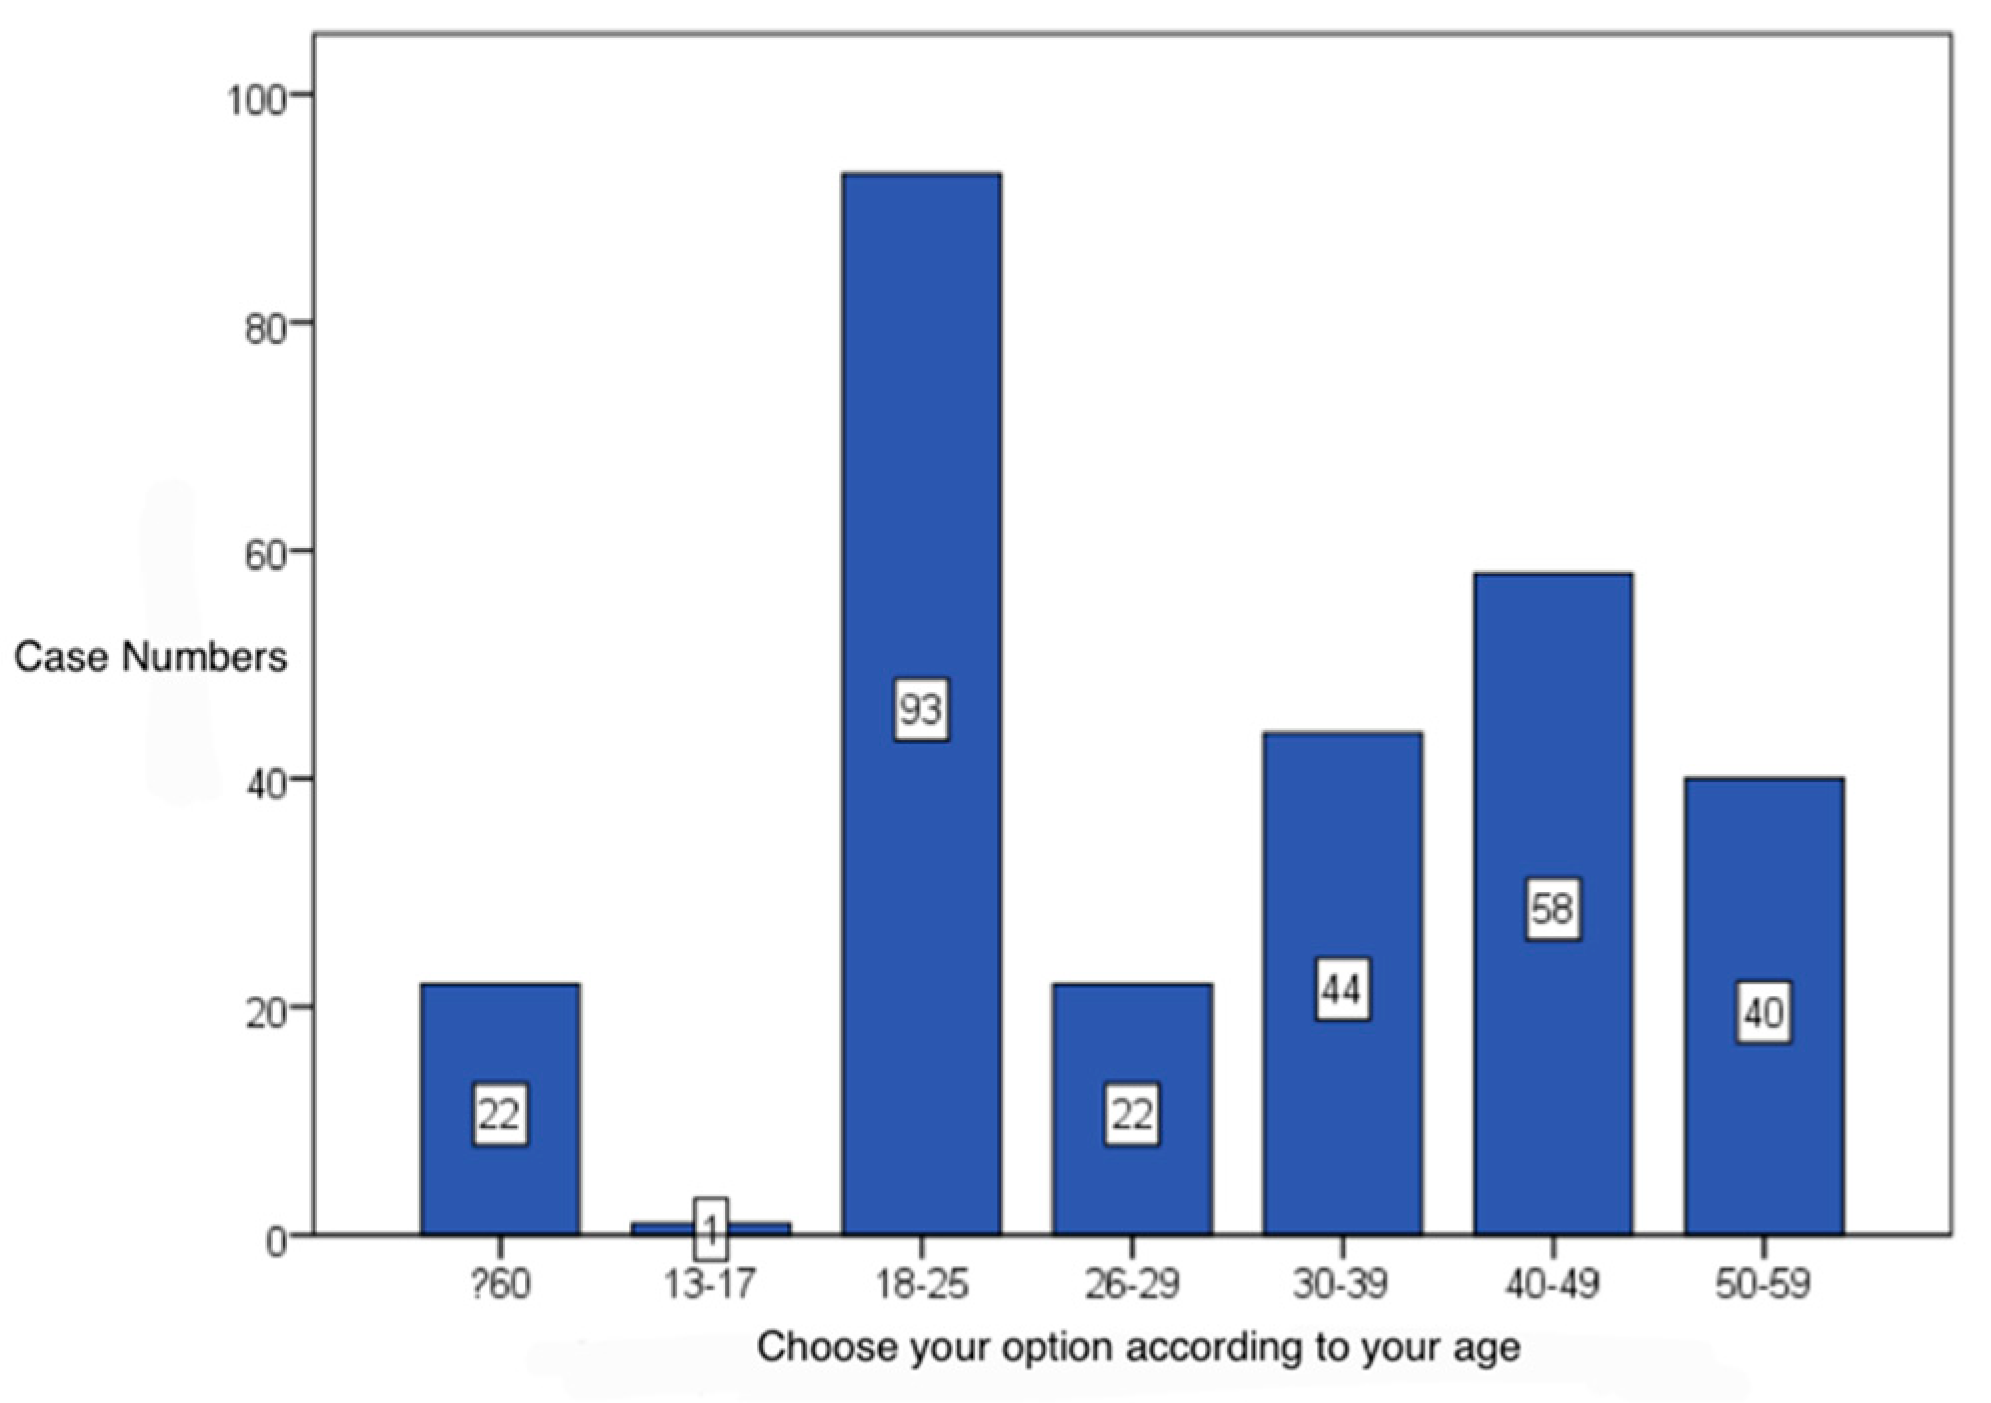
Figure 2.
Eating habits stake.
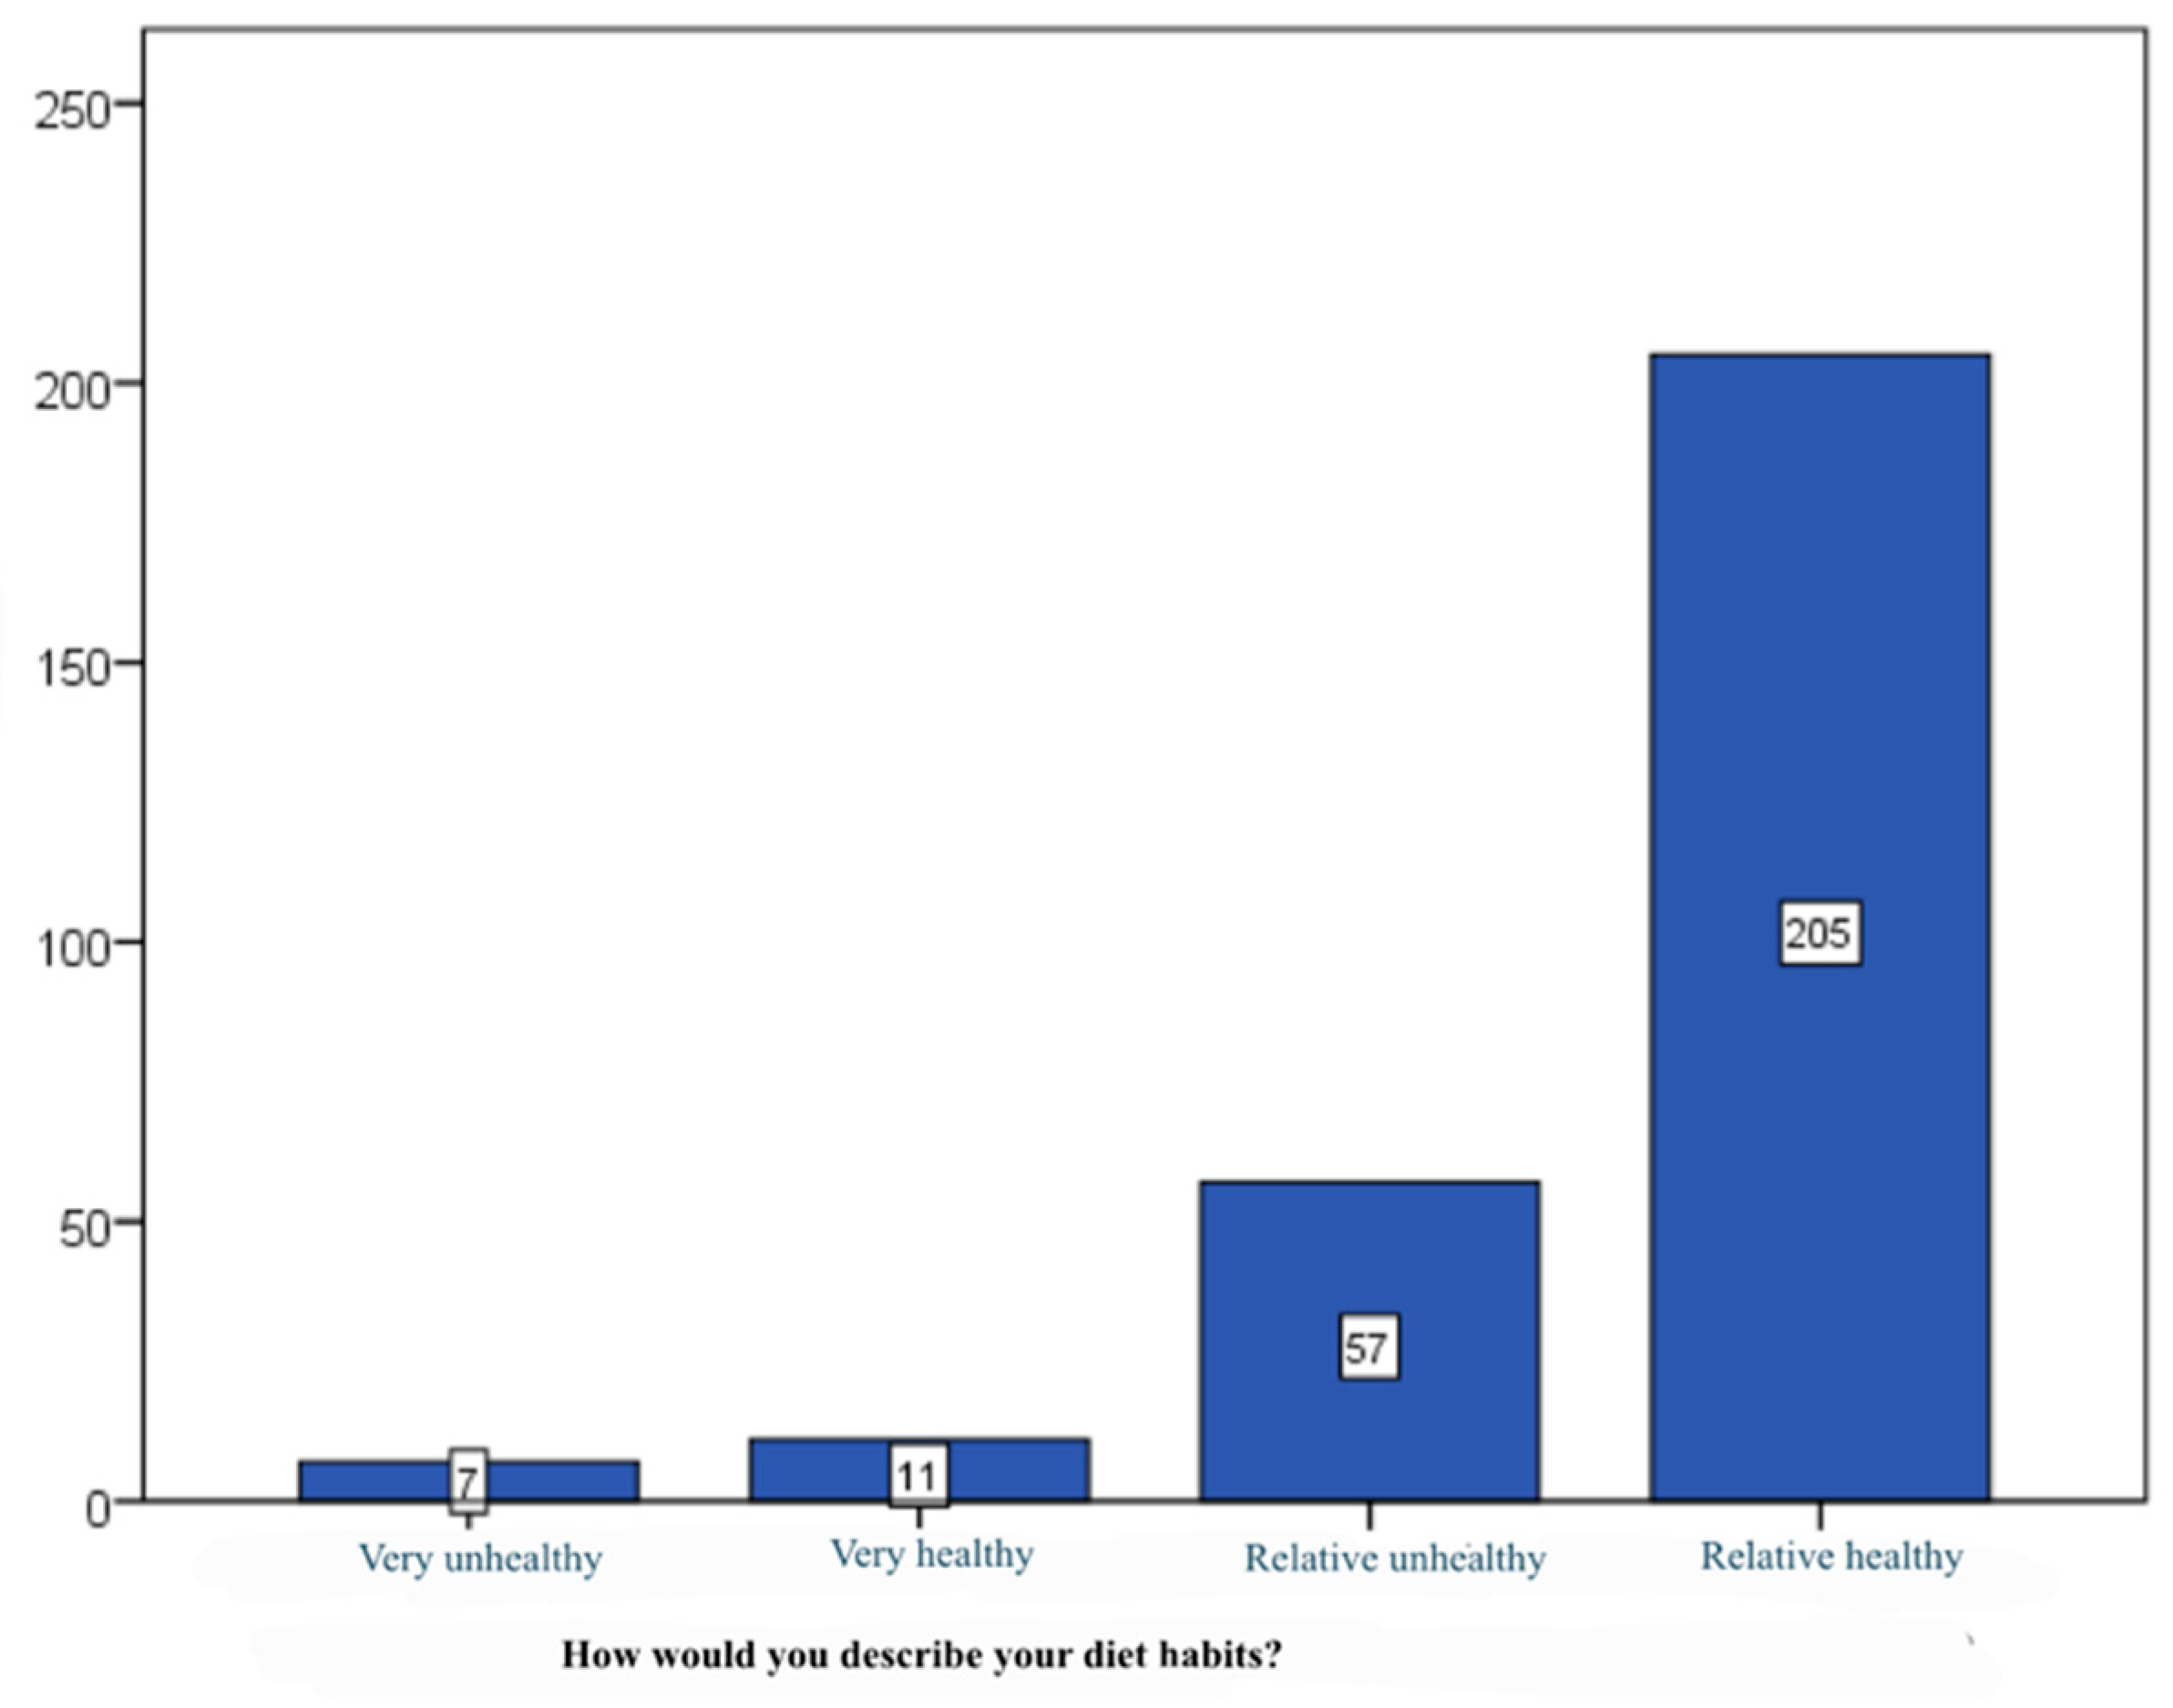
Figure 3.
Stake of subjects with mental health issues.
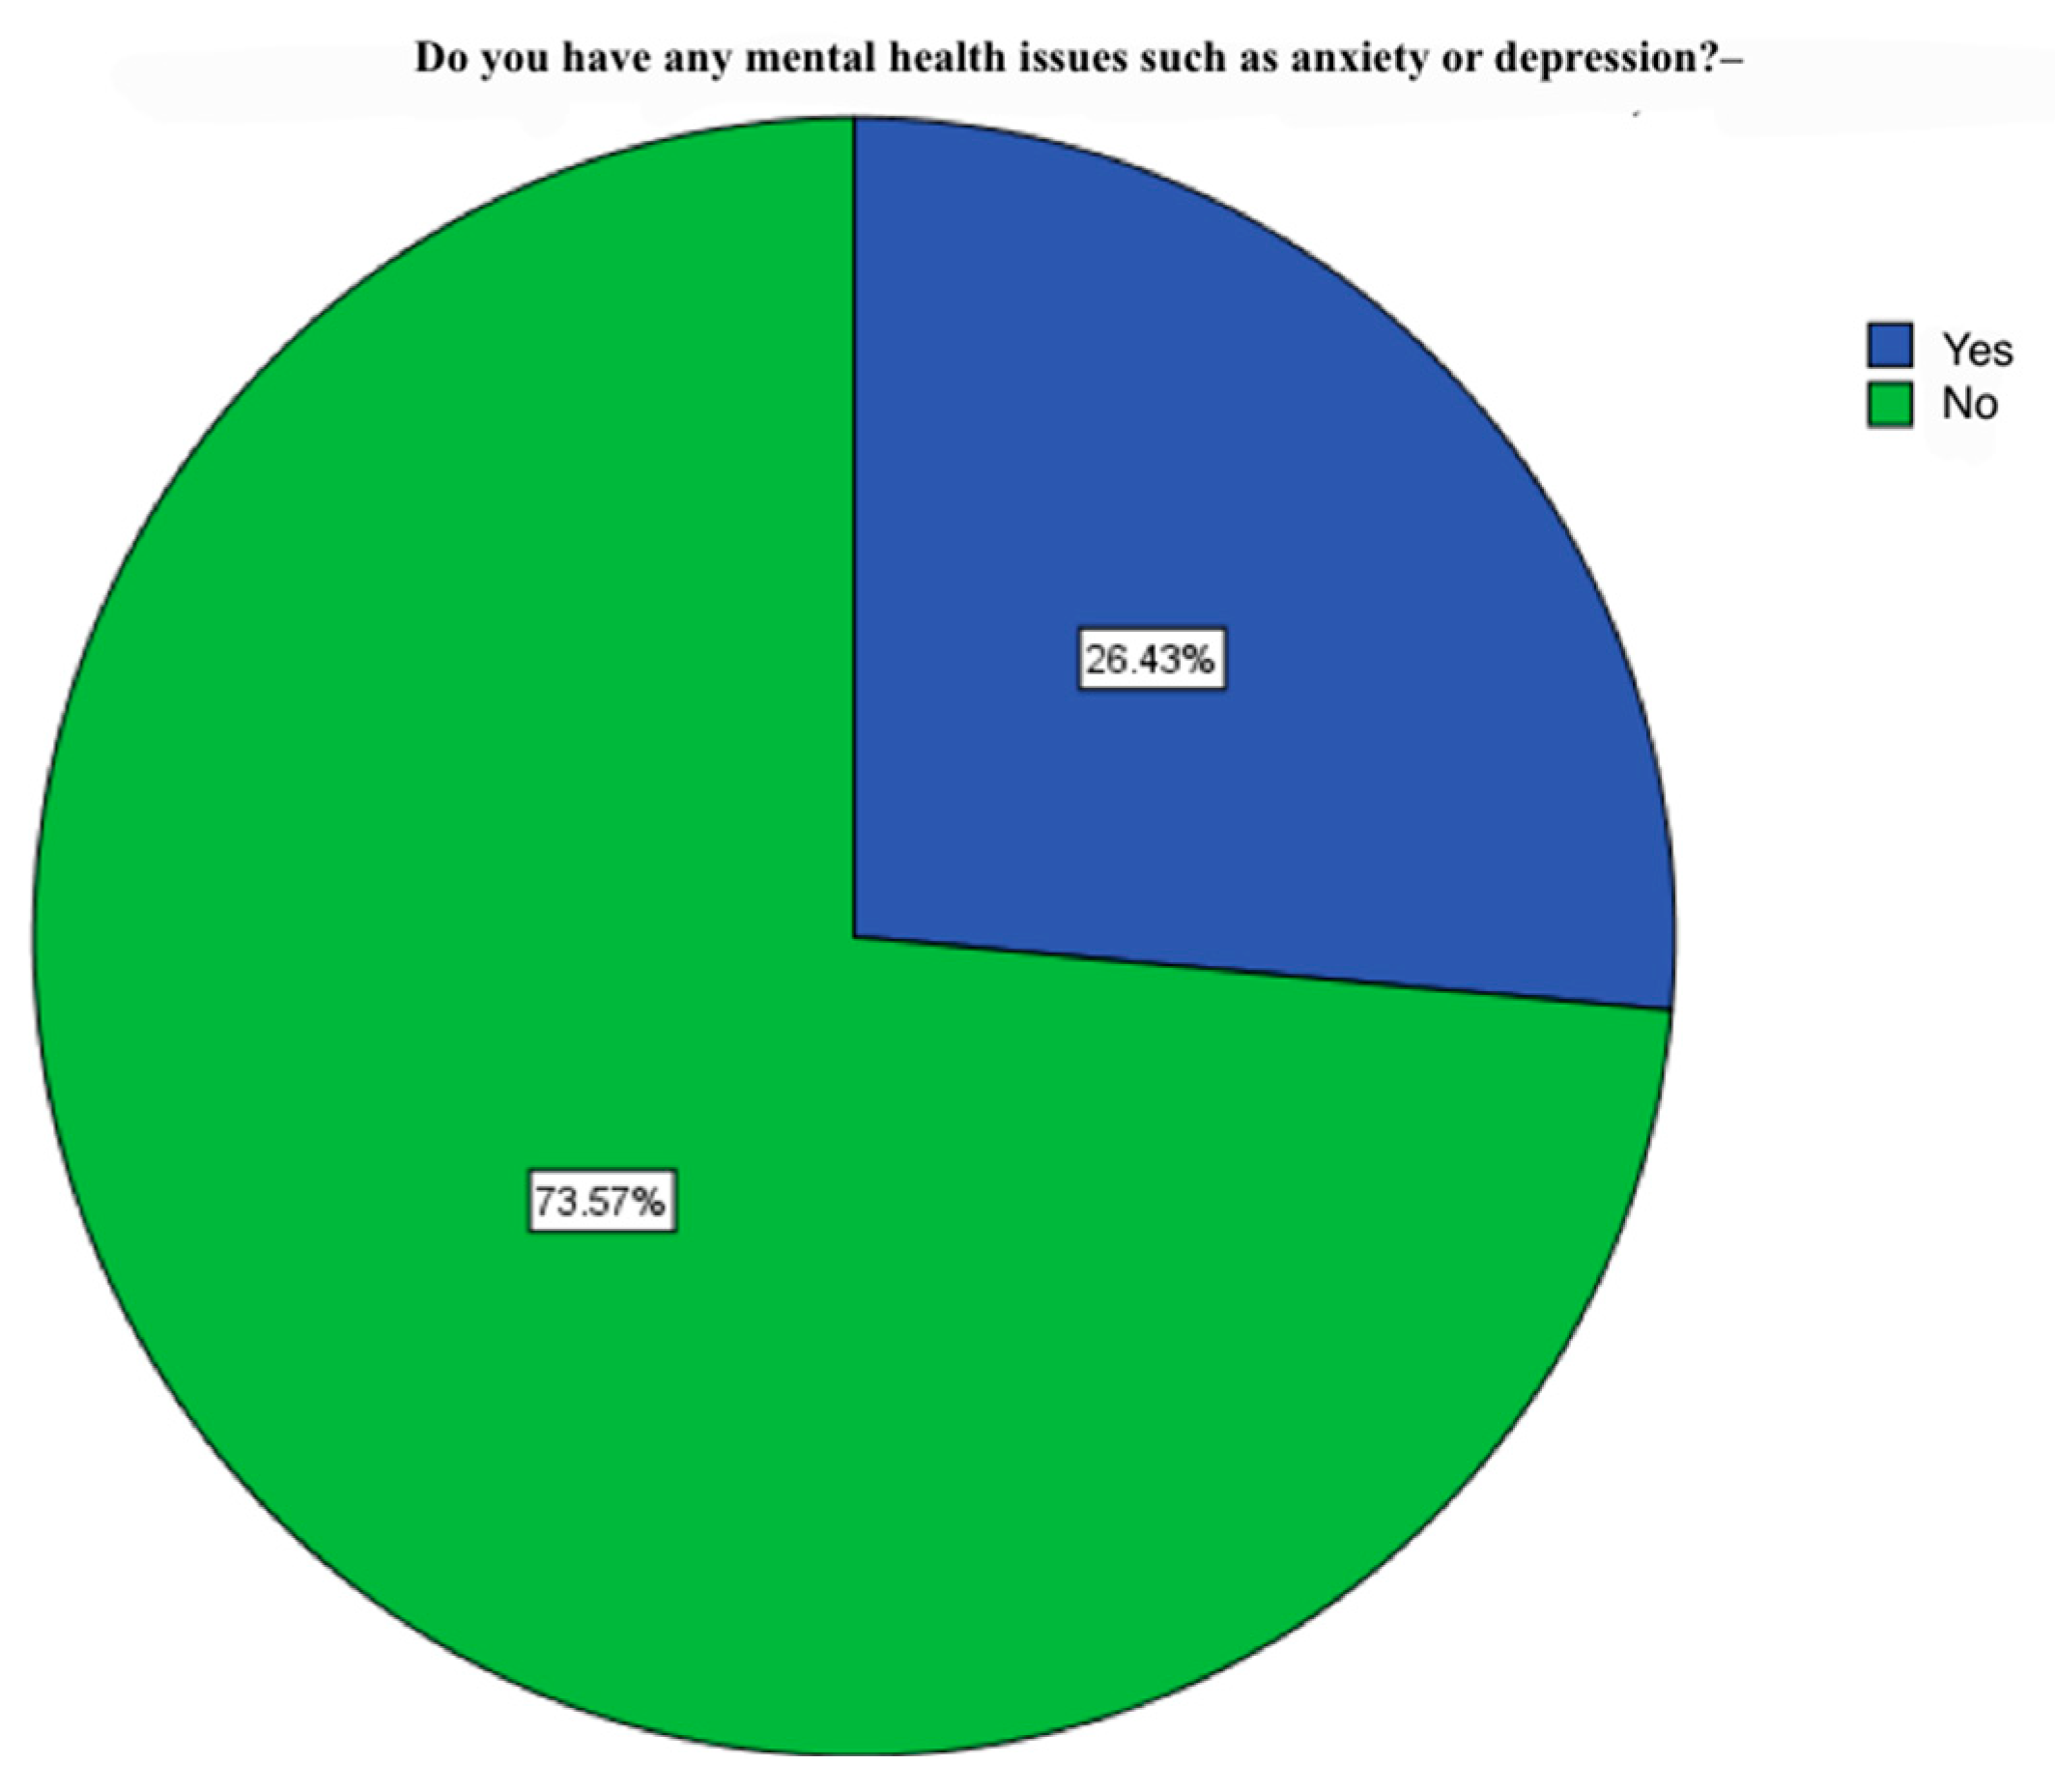
Figure 4.
Stake of subjects with neuro-degenerative disorders.
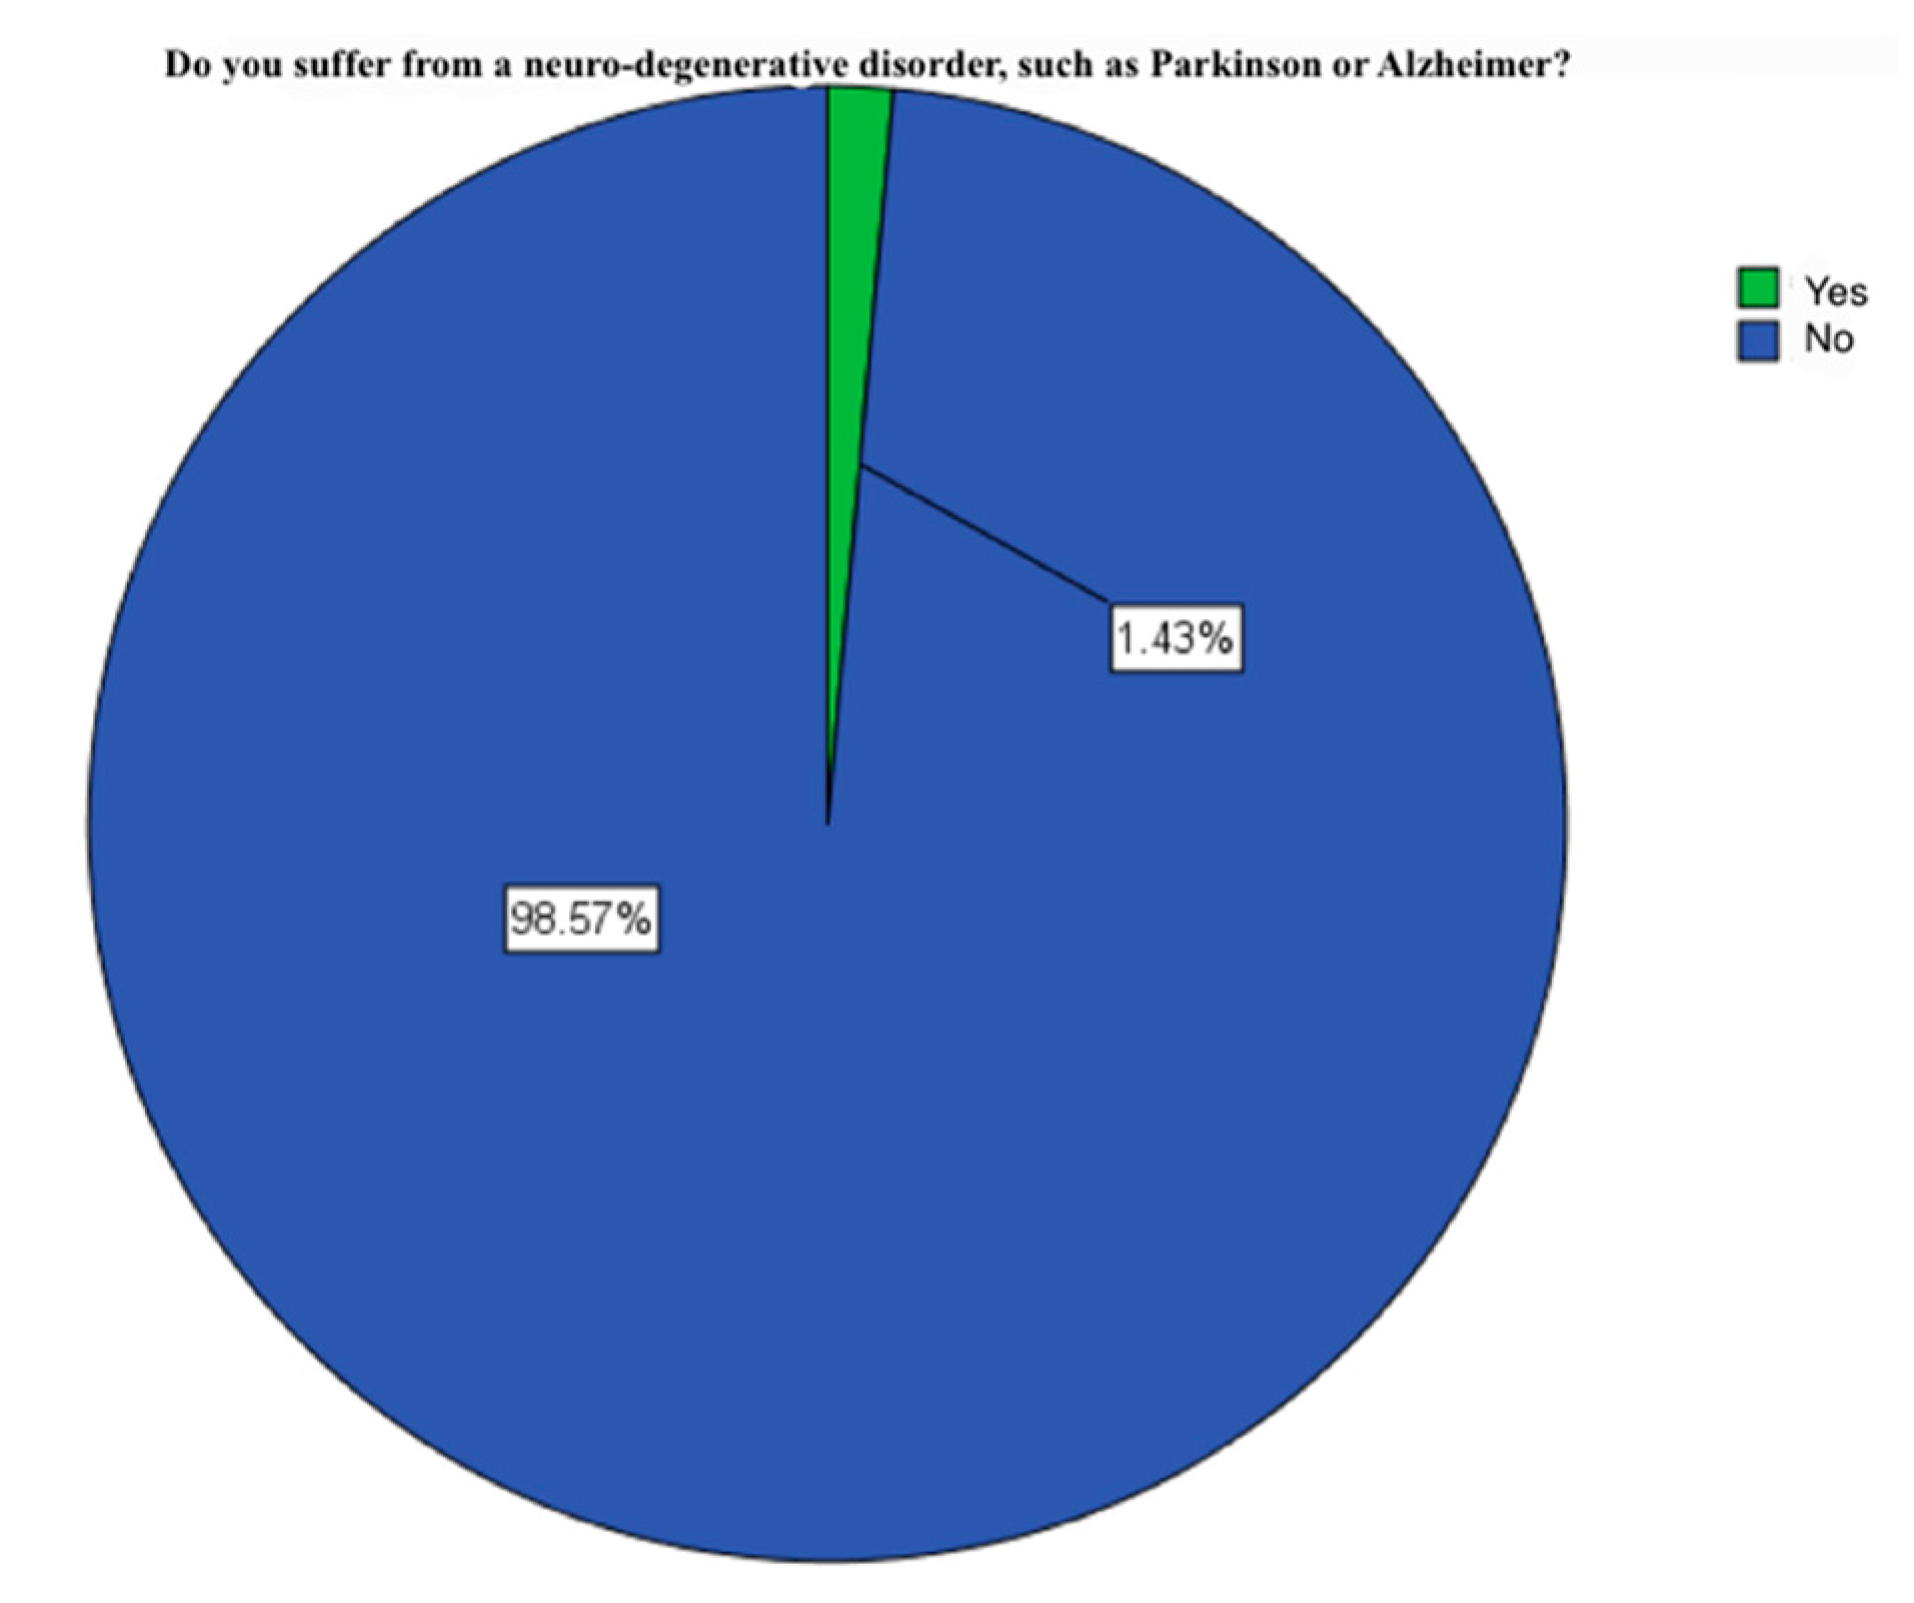
Figure 5.
Healthy diet impact on general health.
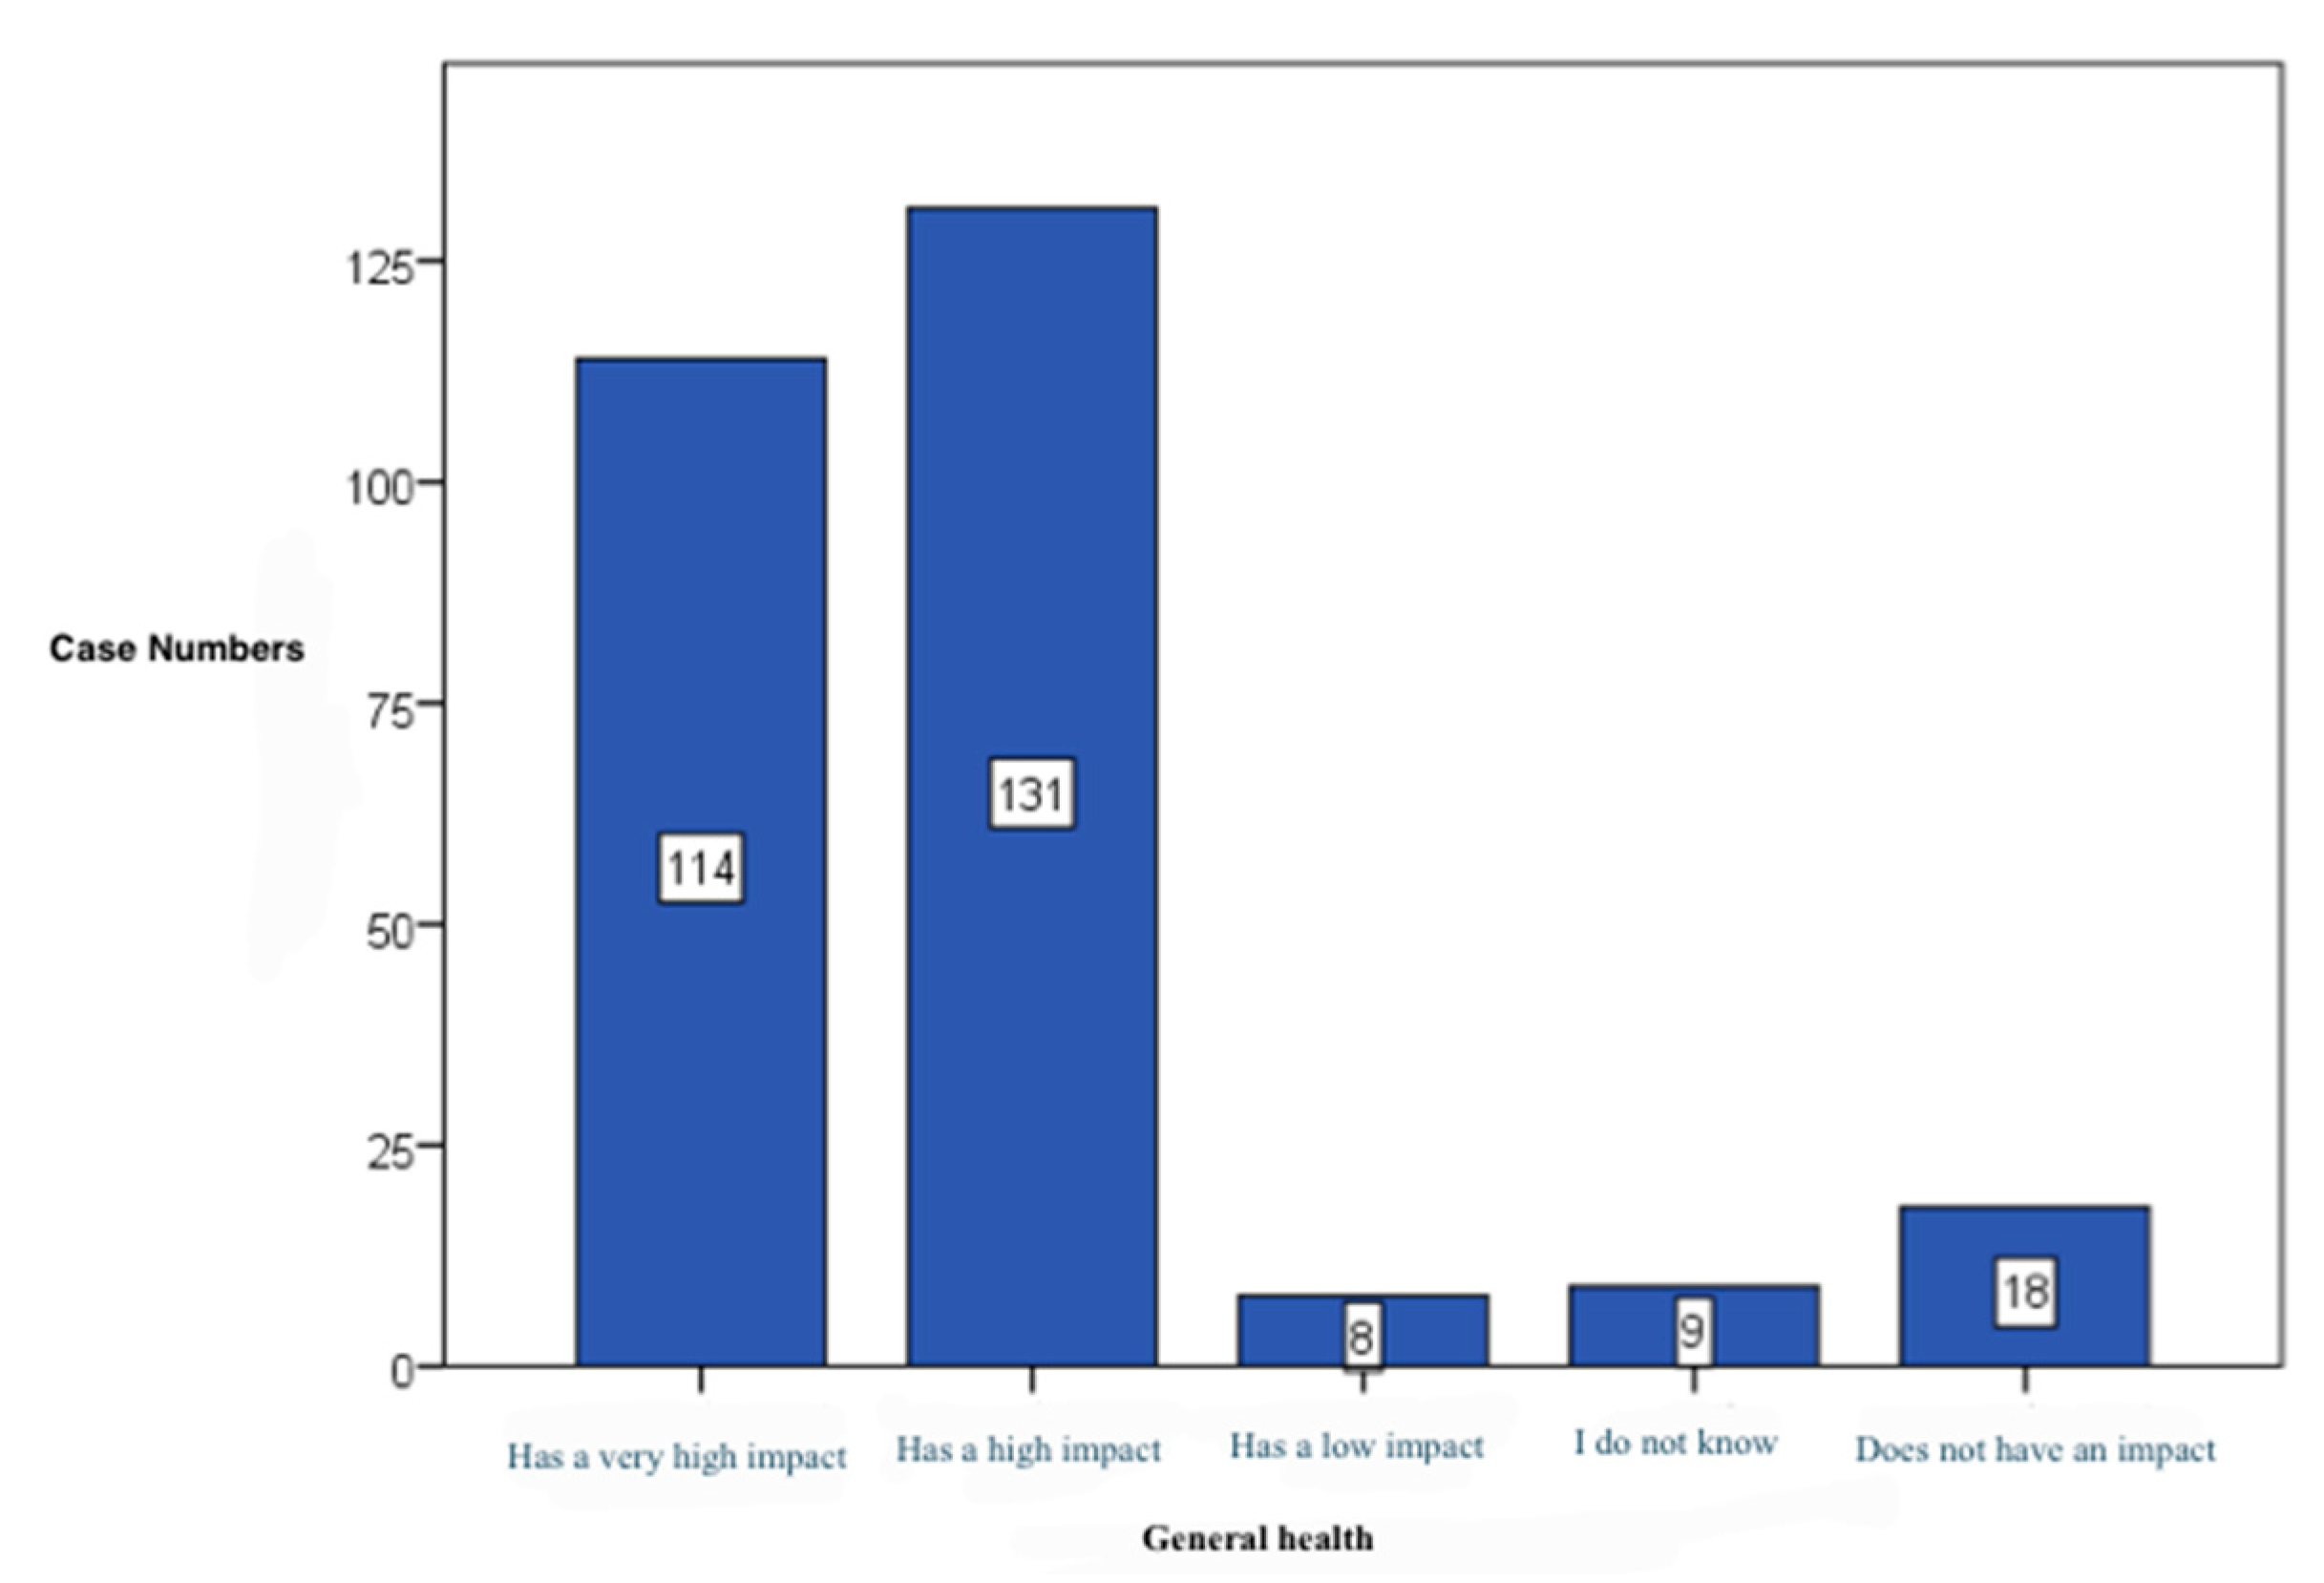
Figure 6.
Healthy diet impact on physical health.
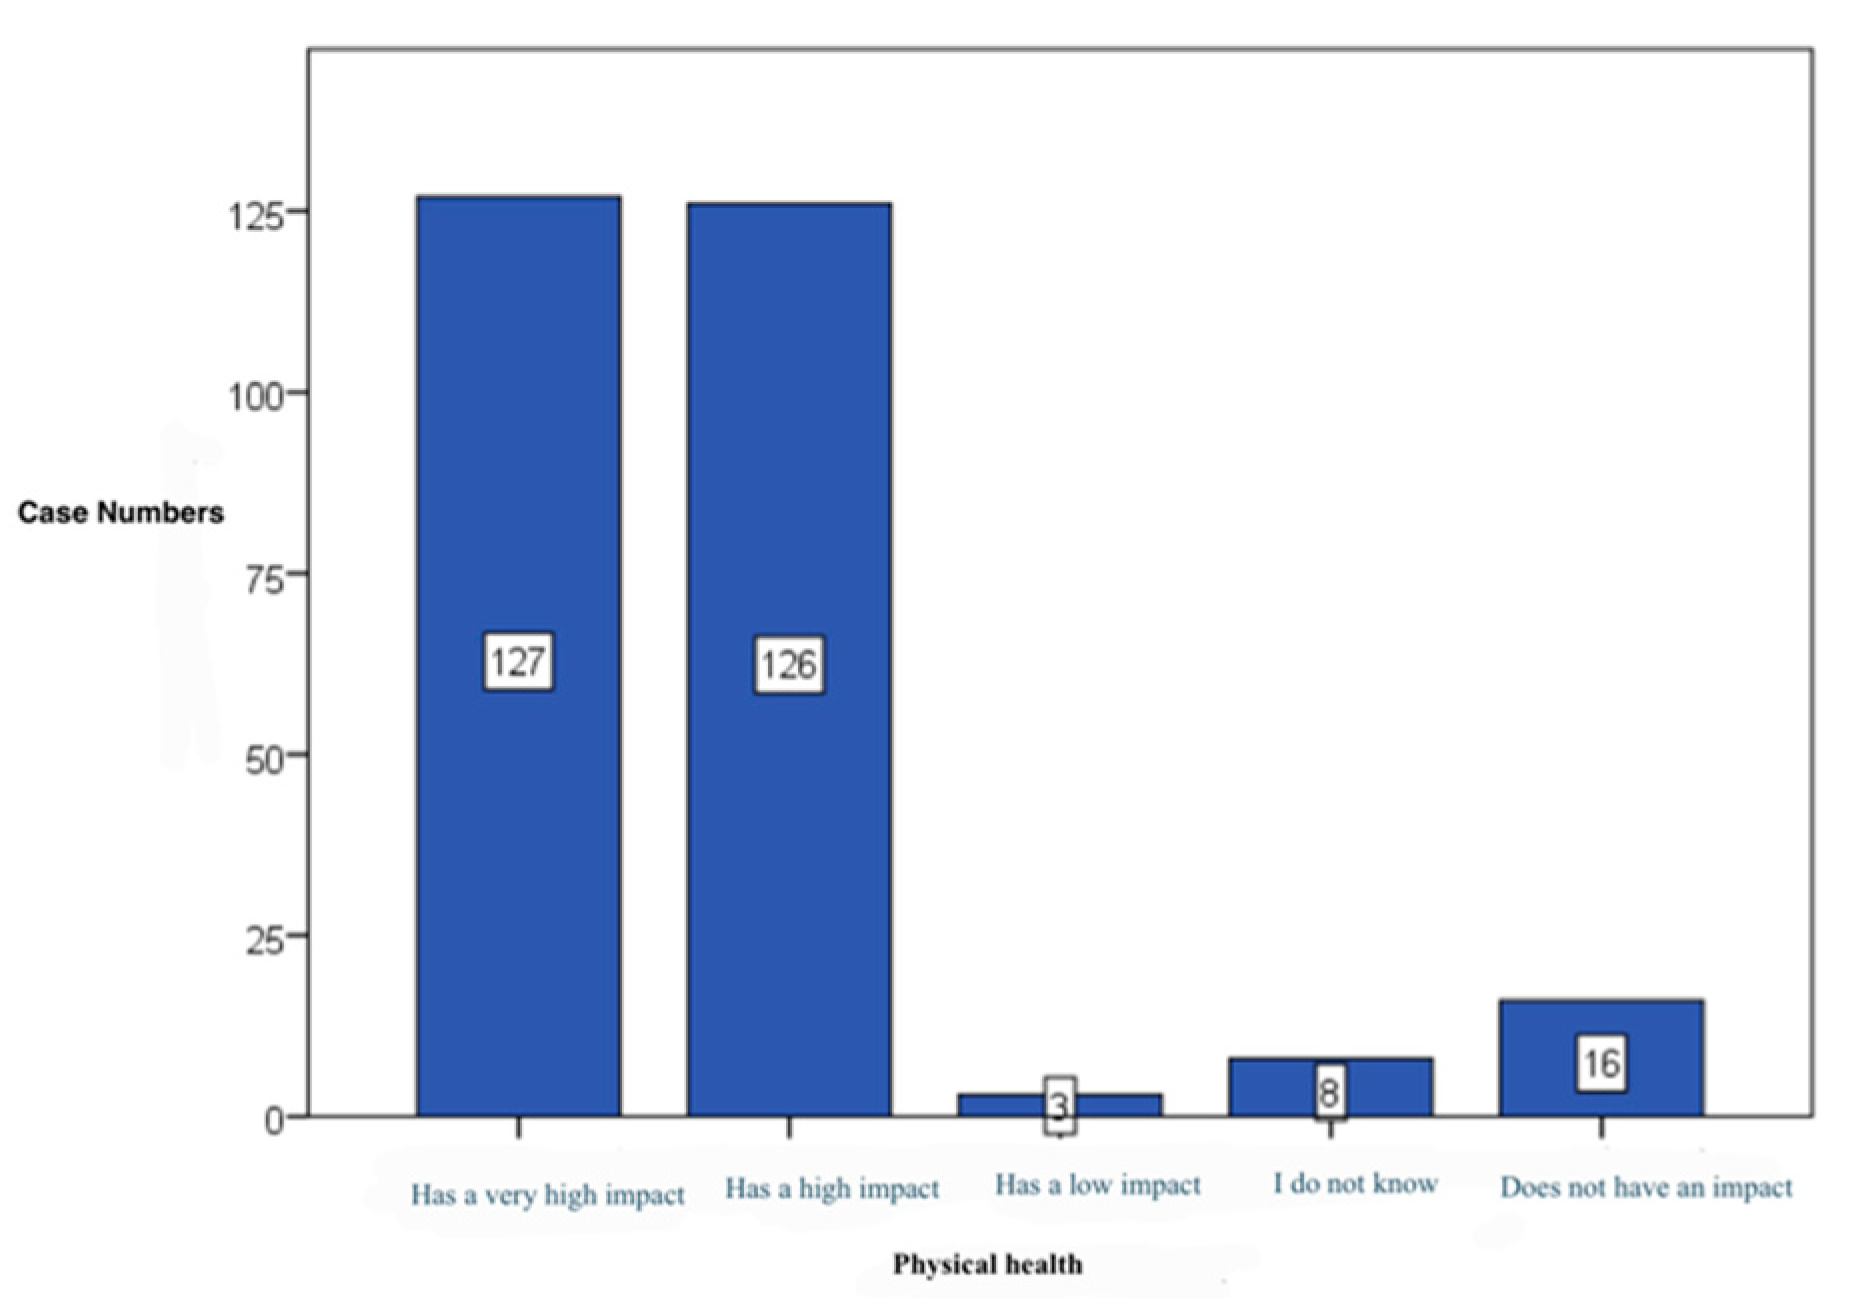
Figure 7.
Healthy diet impact on mental health.
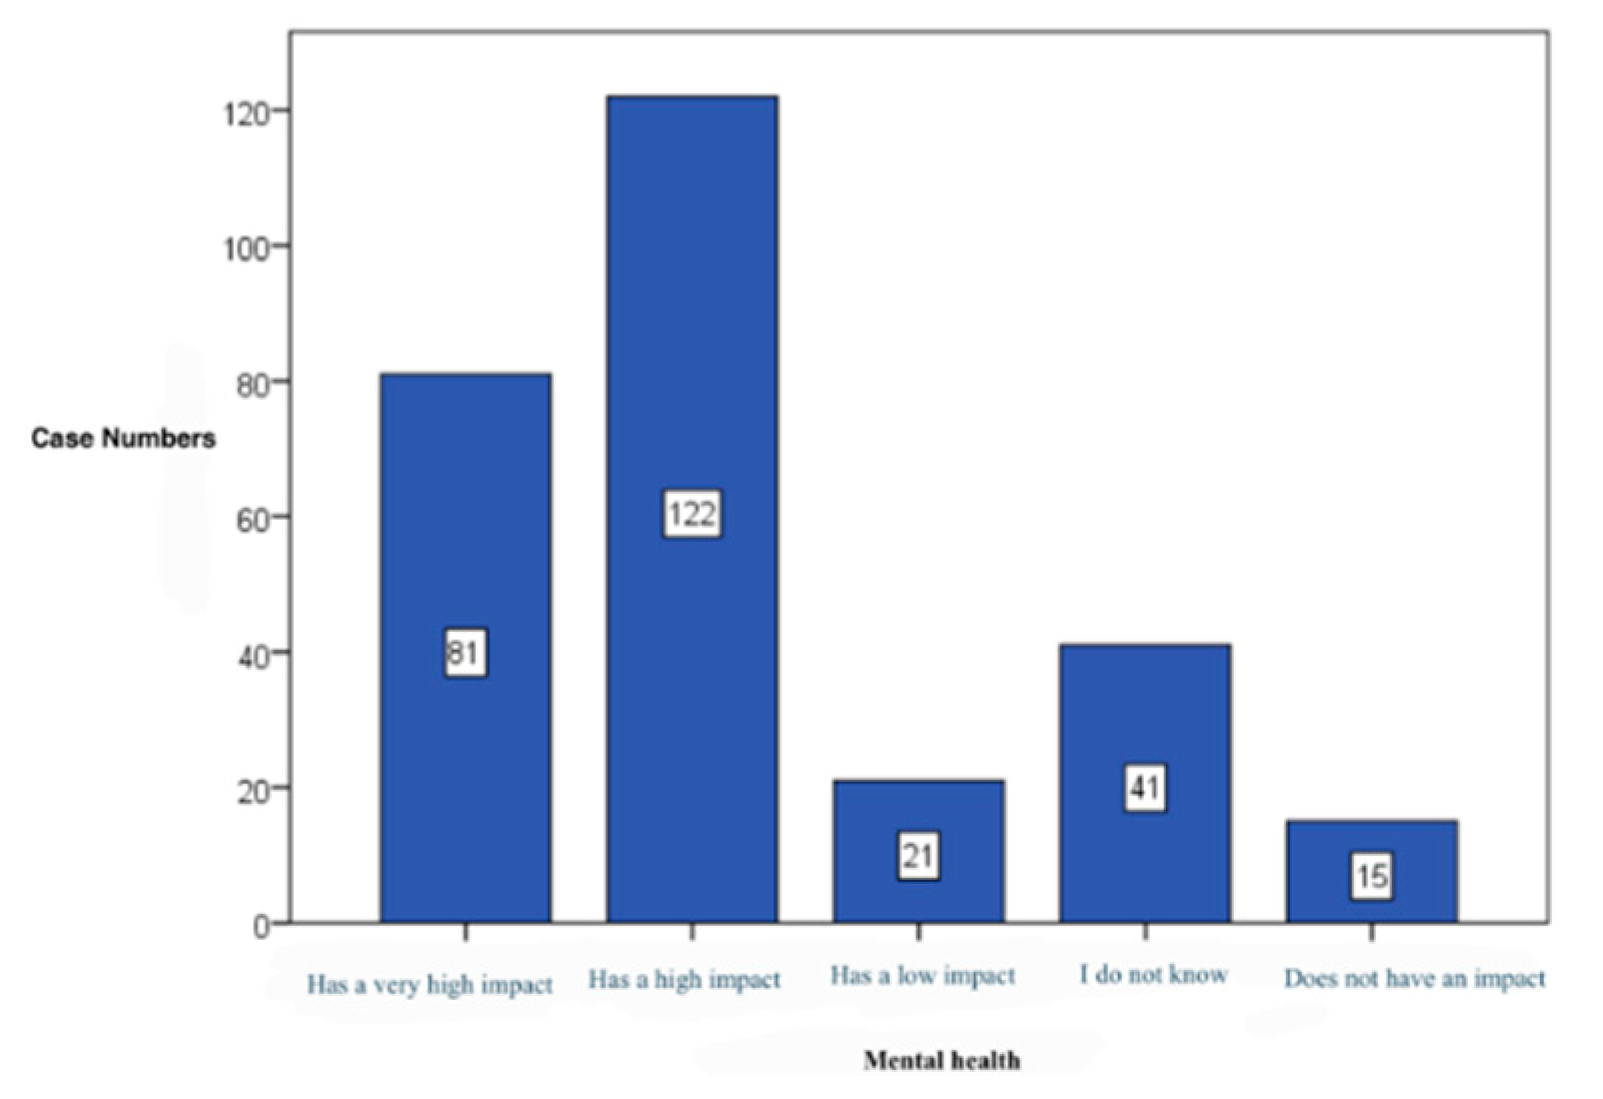
Figure 8.
Healthy diet impact on the ability to focus.
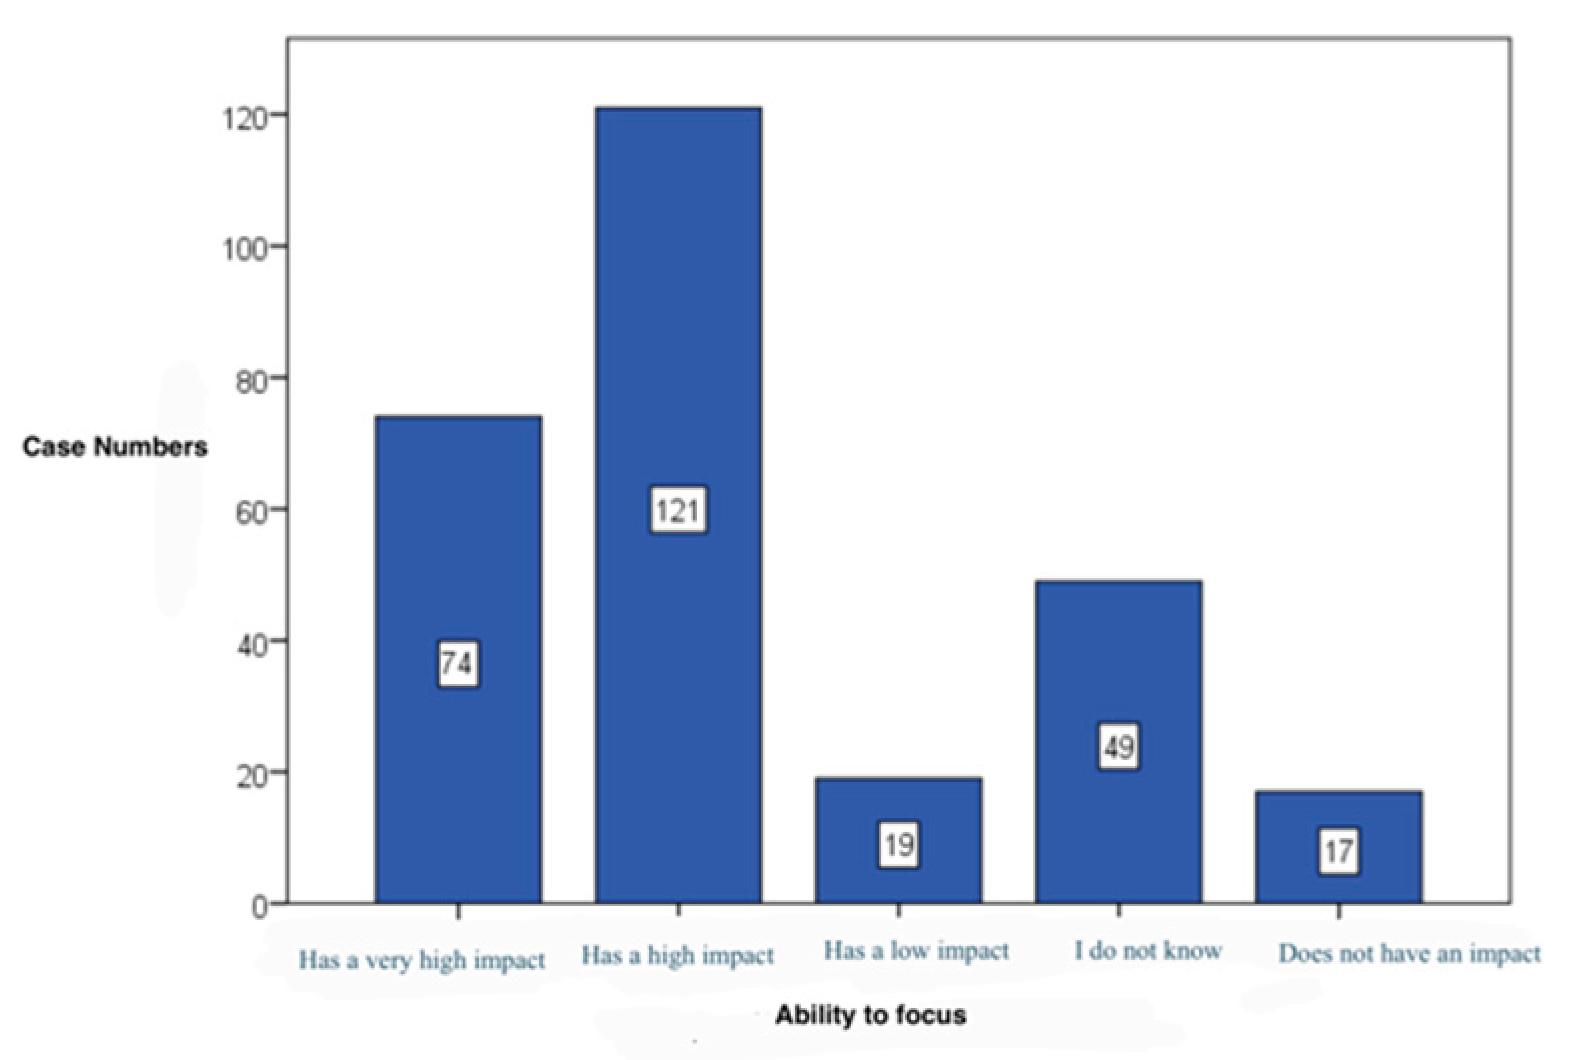
Figure 9.
Unhealthy diet impact on the ability to remember/memorize.
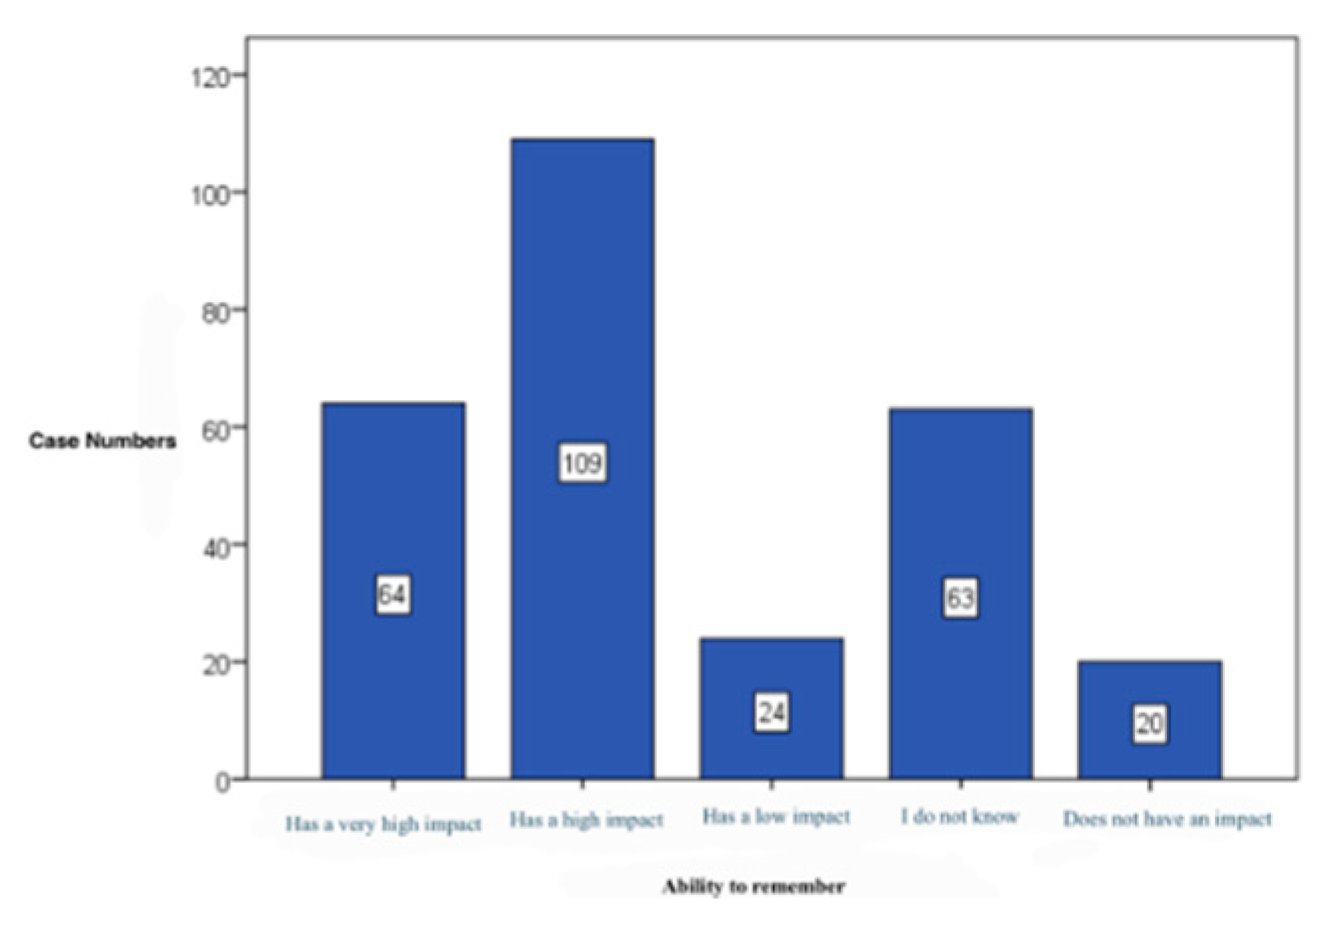
Figure 10.
Healthy diet impact on good disposition.
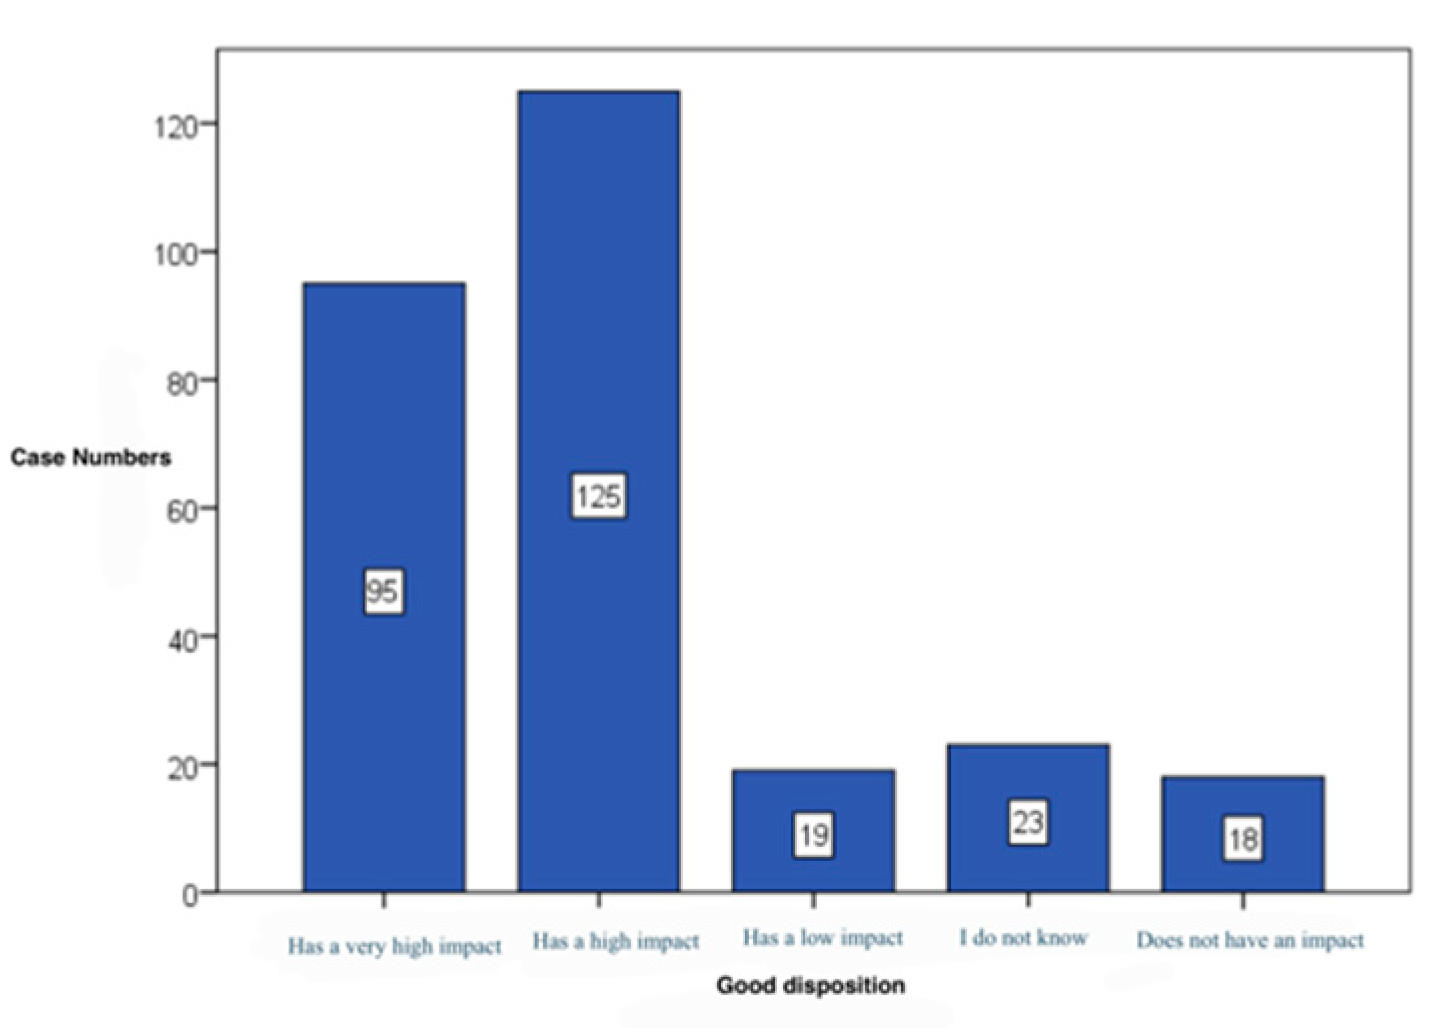
Figure 11.
Vegetable consumption stake.
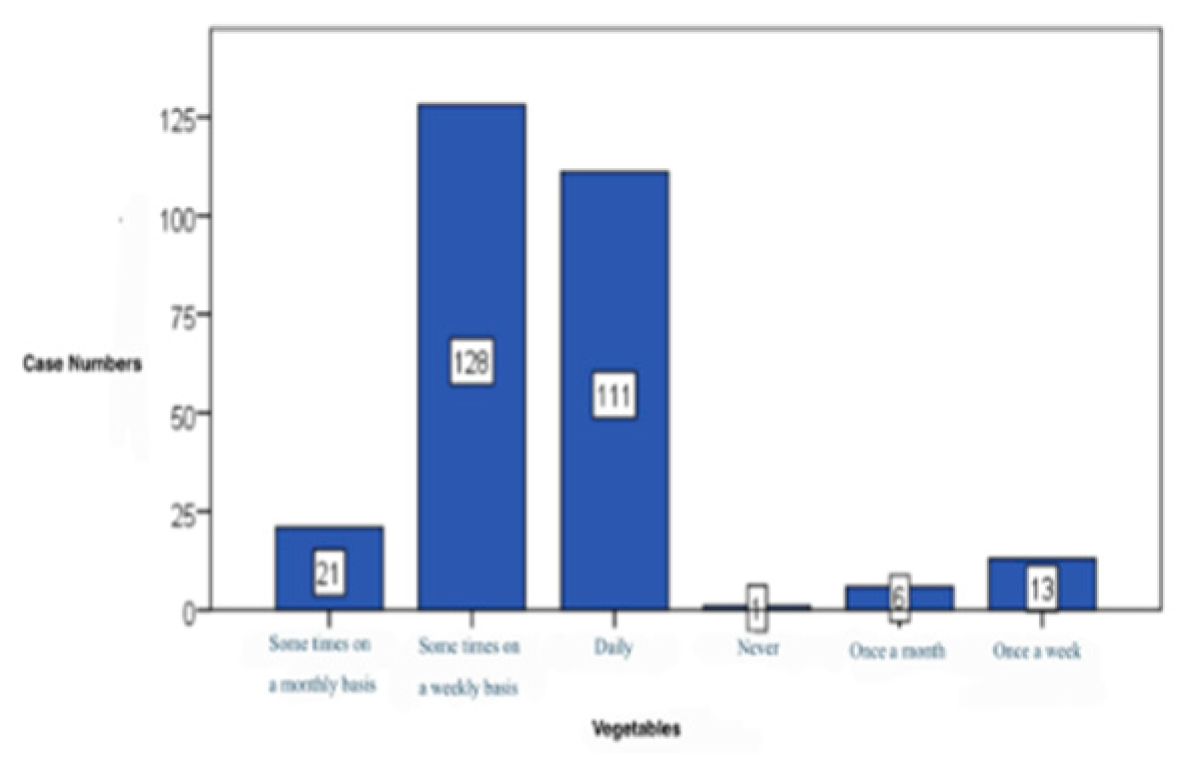
Figure 12.
Fruits consumption stake.
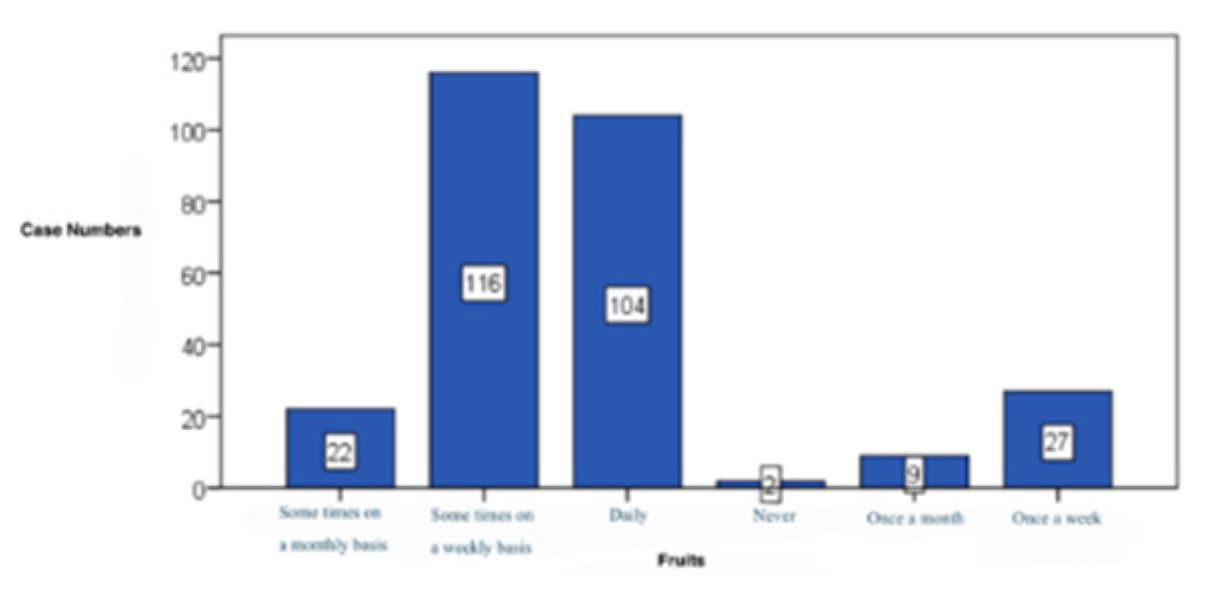
Figure 13.
Meat consumption stake.
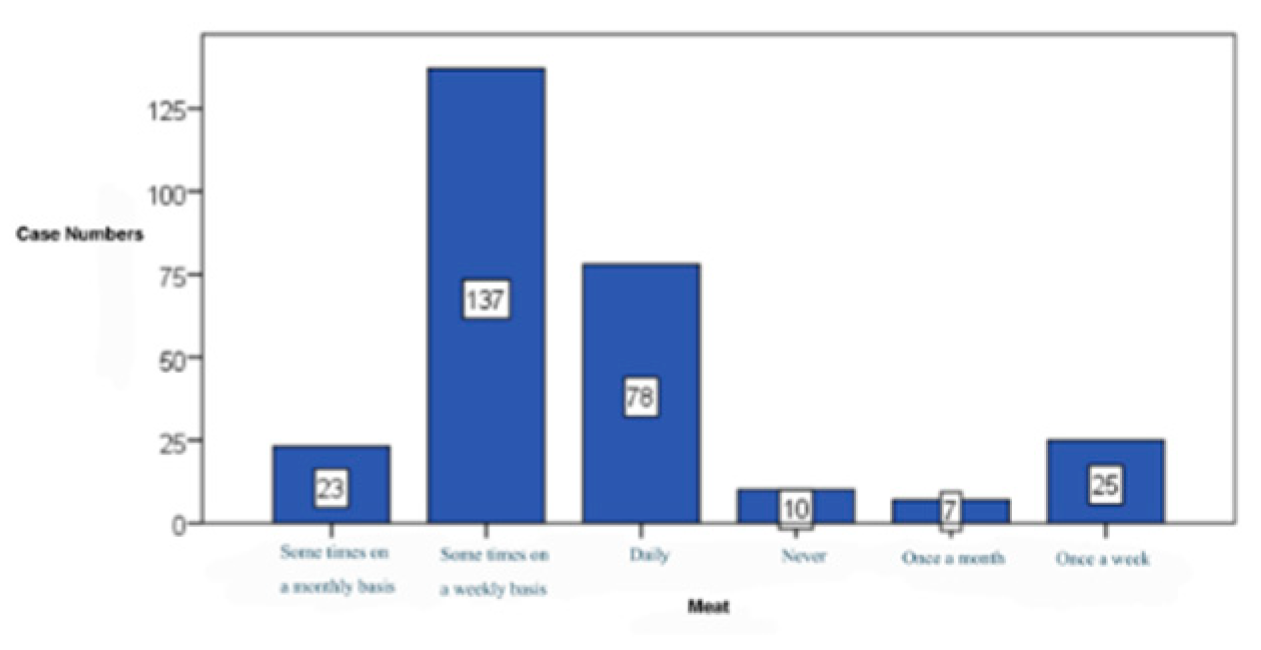
Figure 14.
White carbohydrates consumption stake.
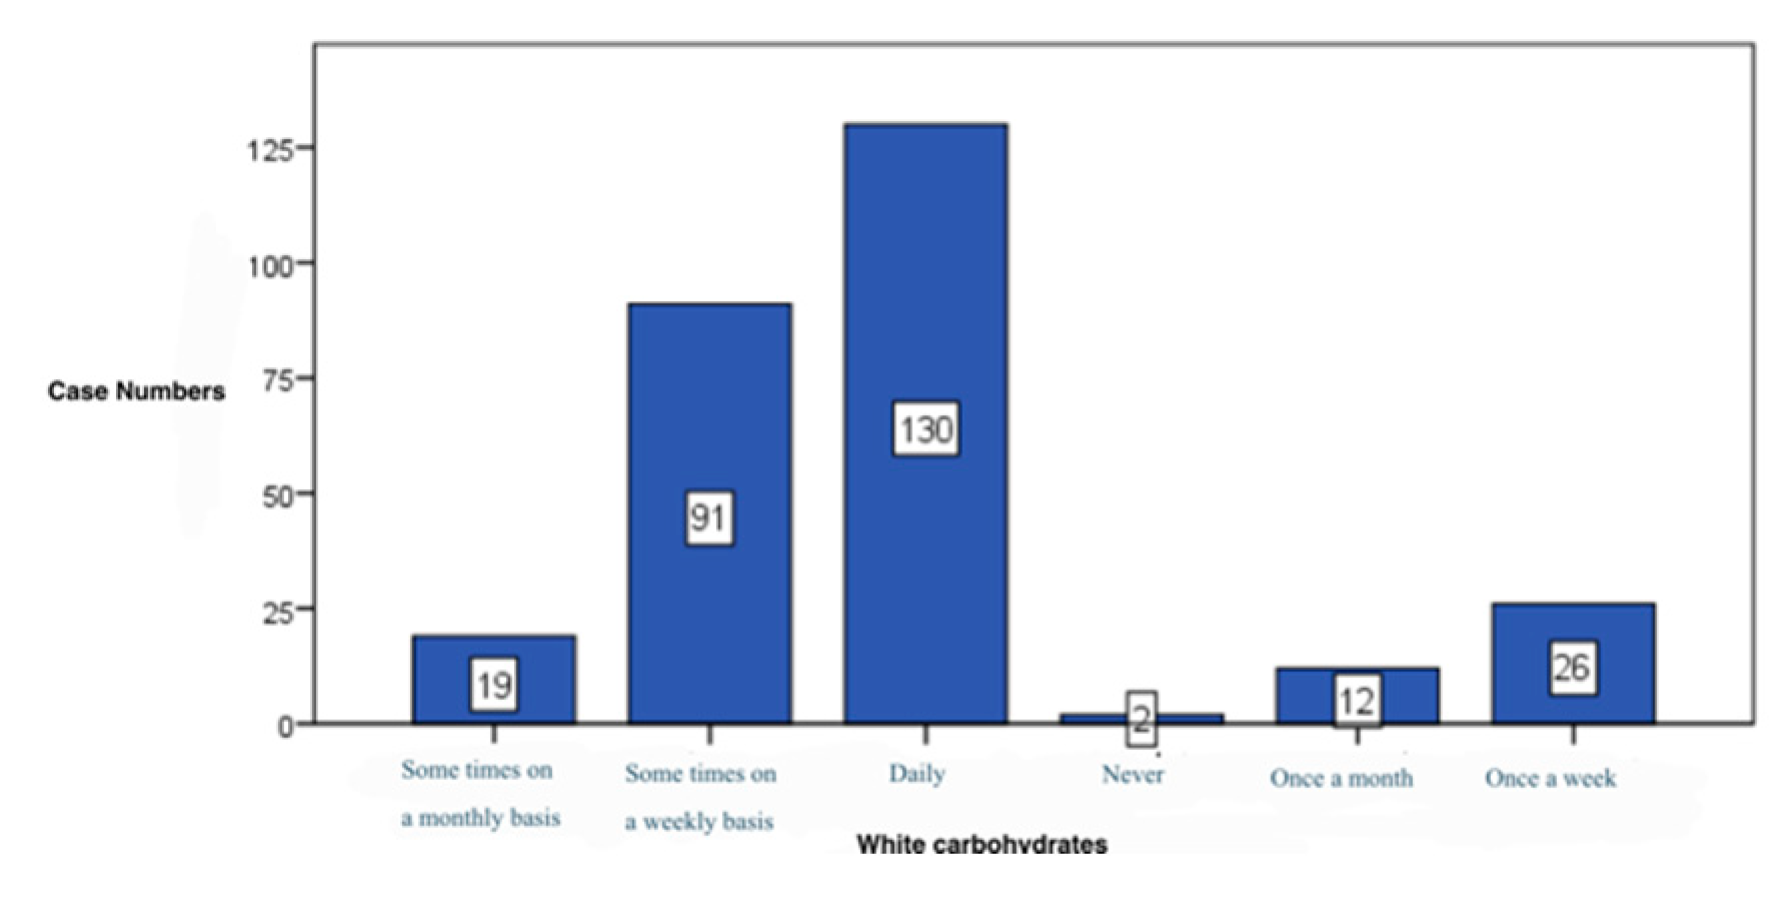
Figure 15.
Caffeinated drinks consumption stake.
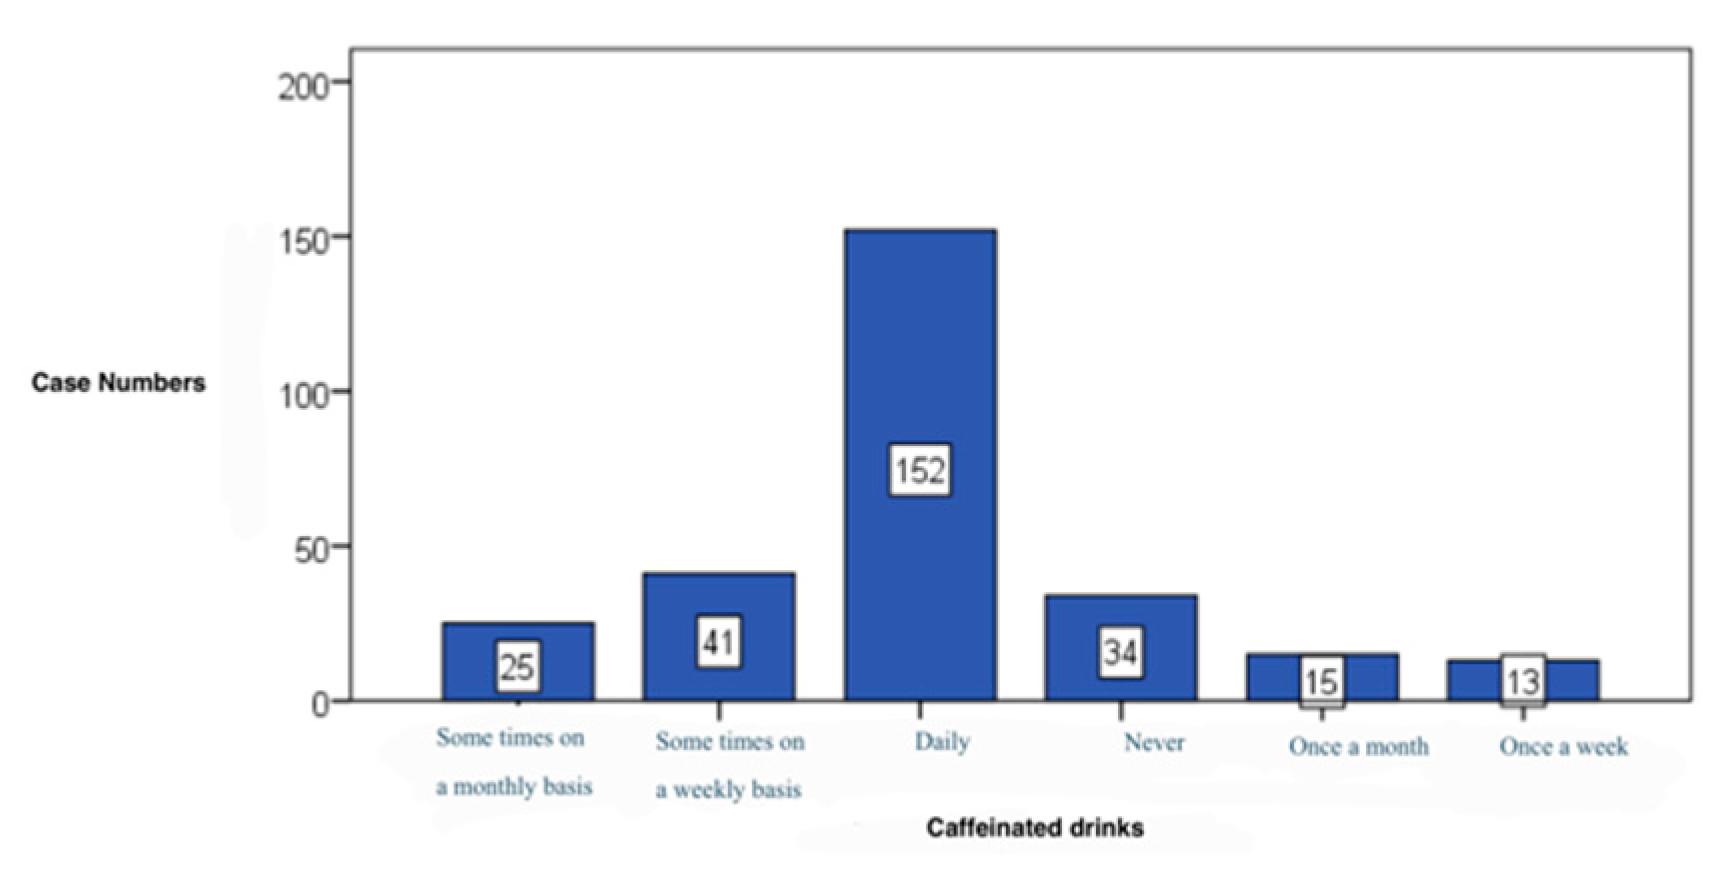
Figure 16.
Water consumption stake.
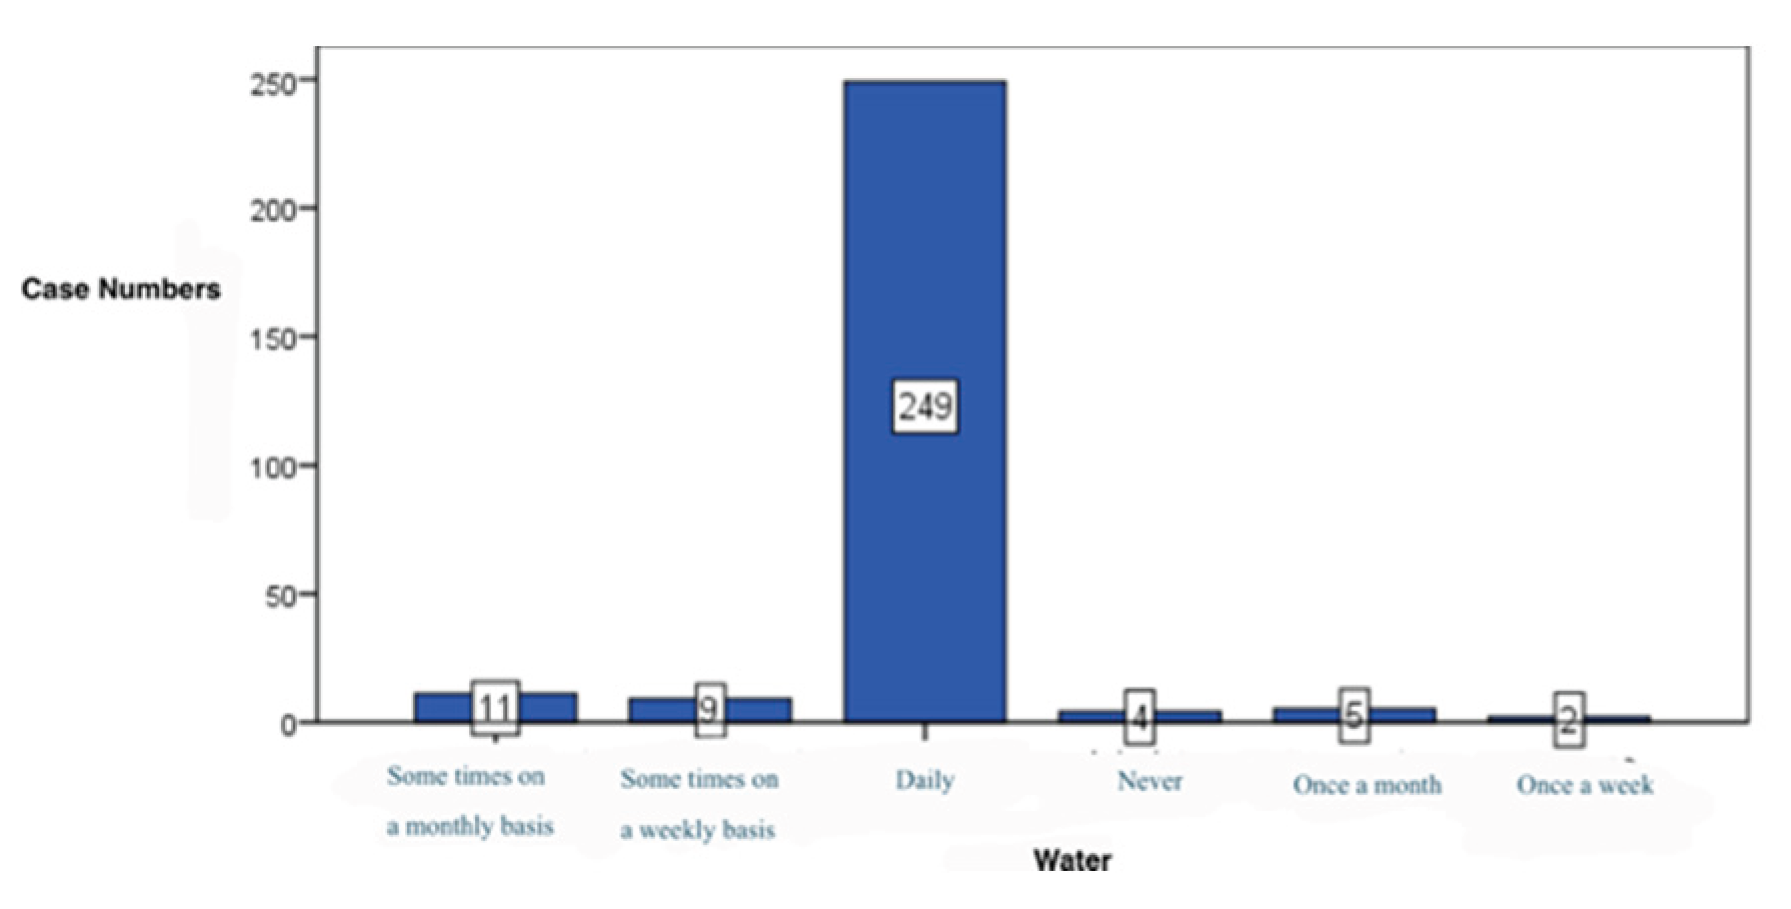
Figure 17.
Sweets consumption stake.
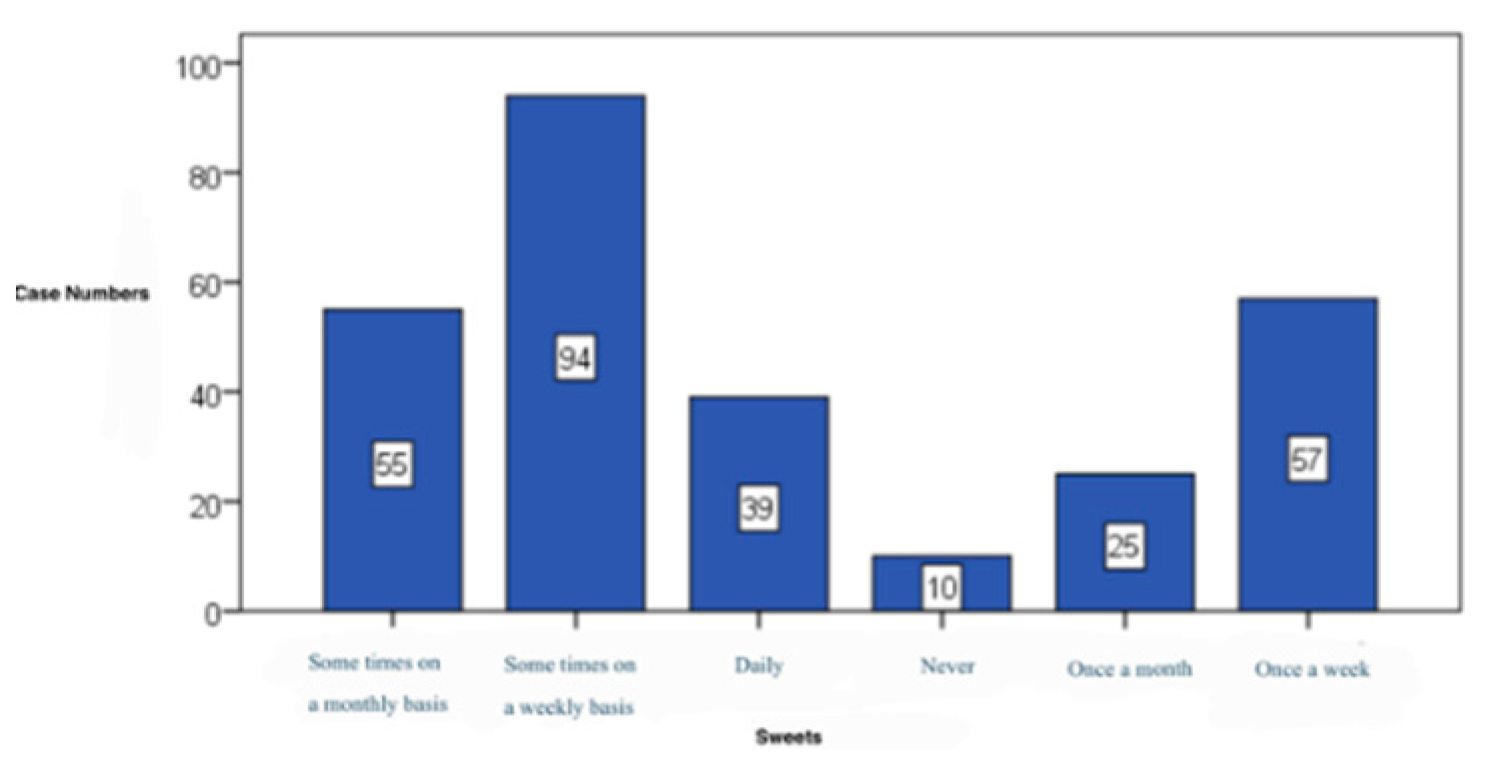
Figure 18.
Snacks consumption stake.
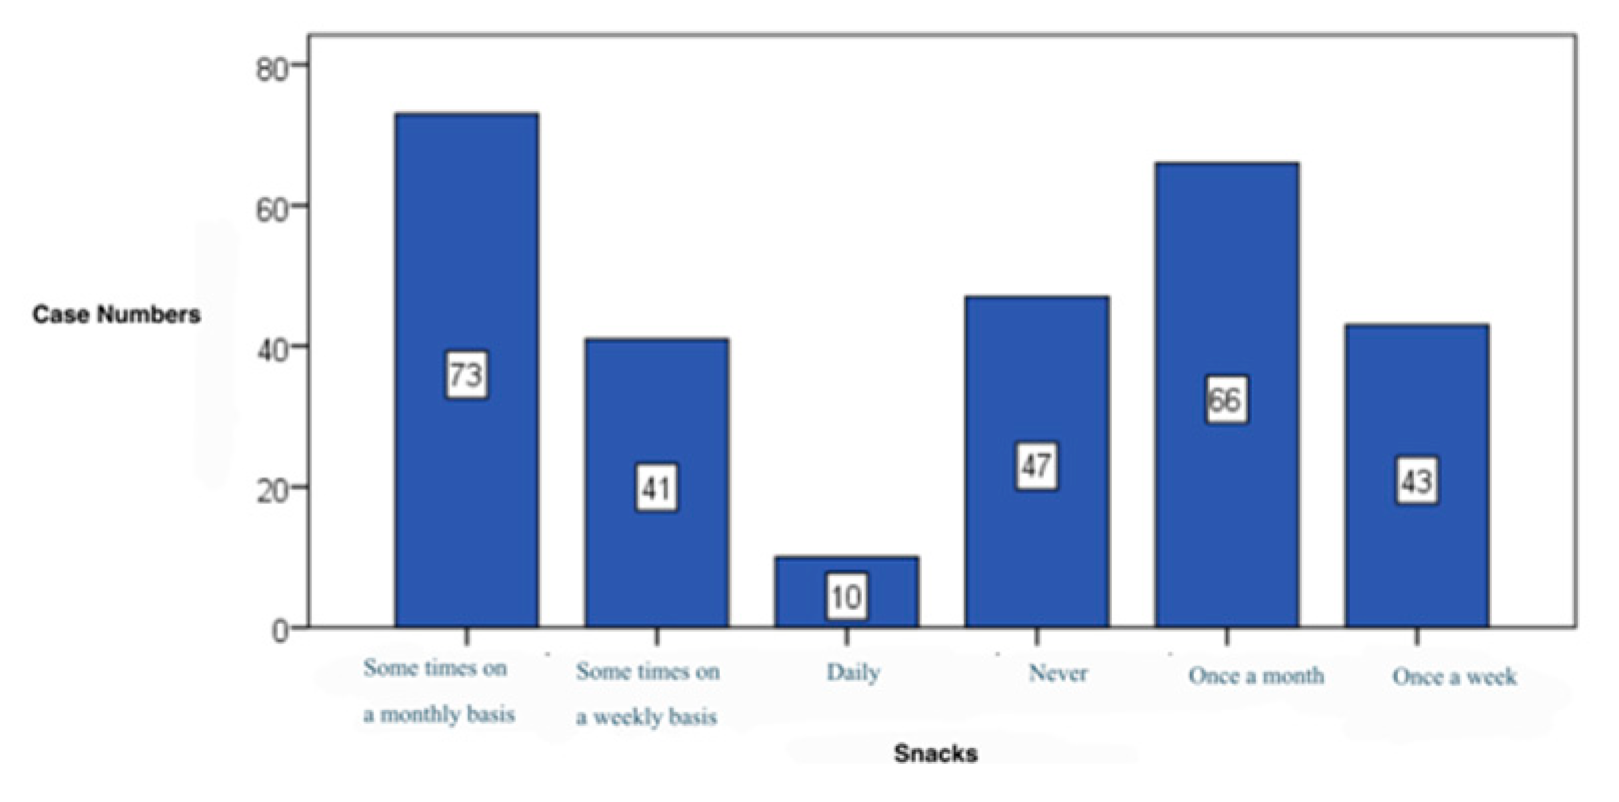
Figure 19.
Soft Drinks consumption stake.
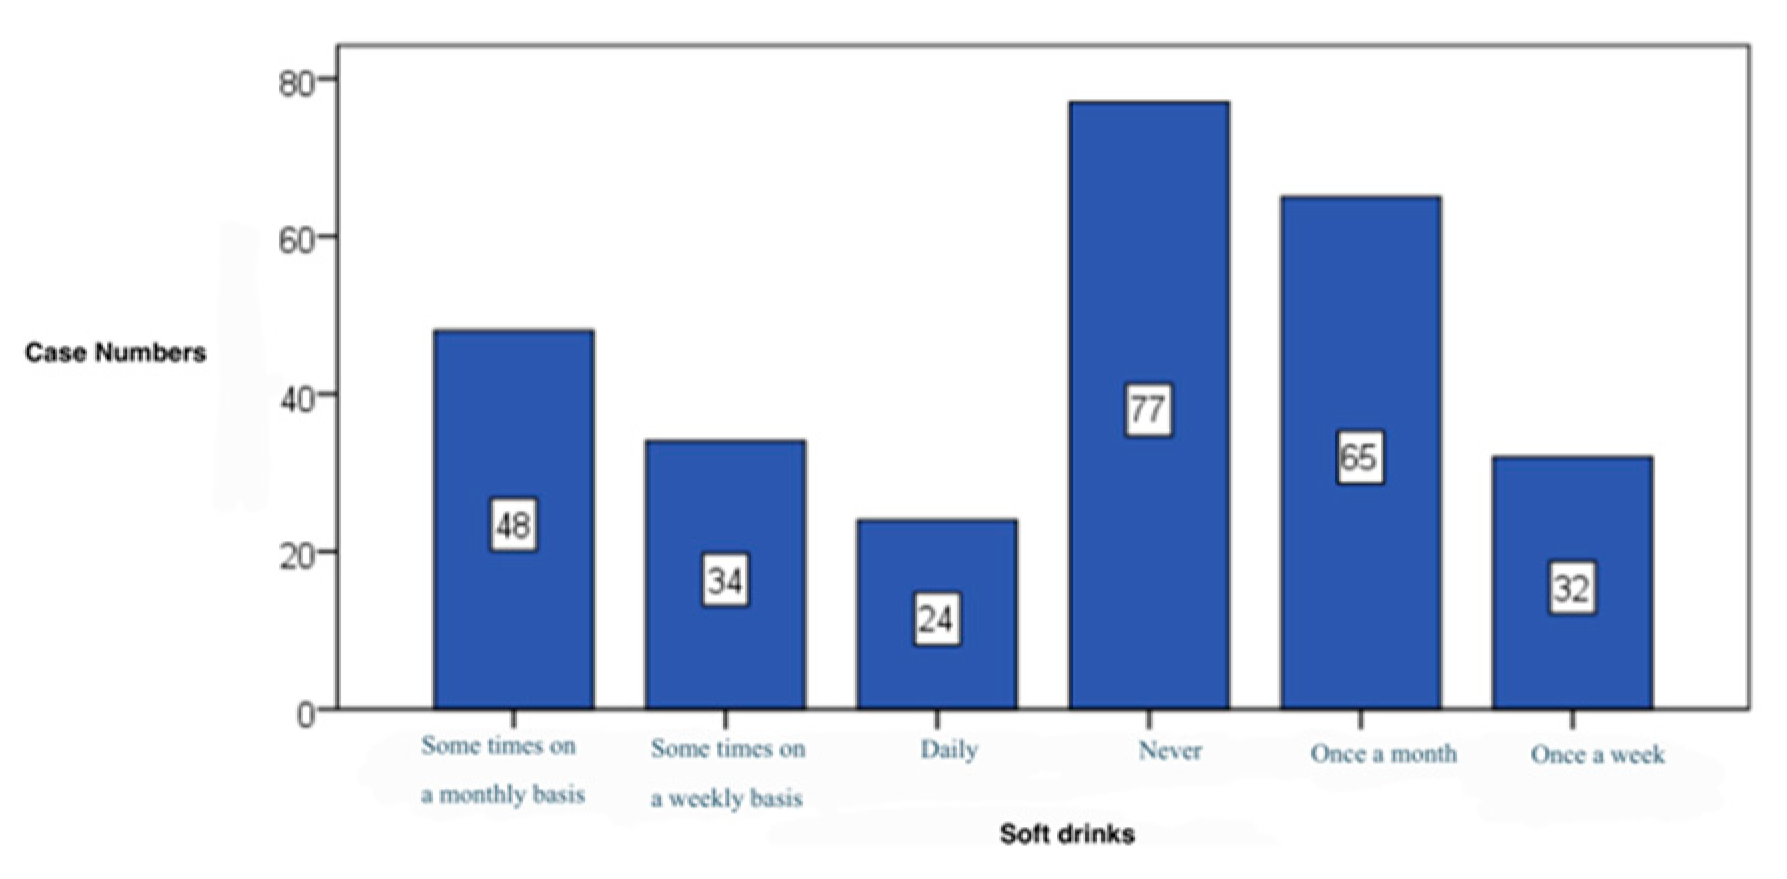
Figure 20.
Positive feelings stake.
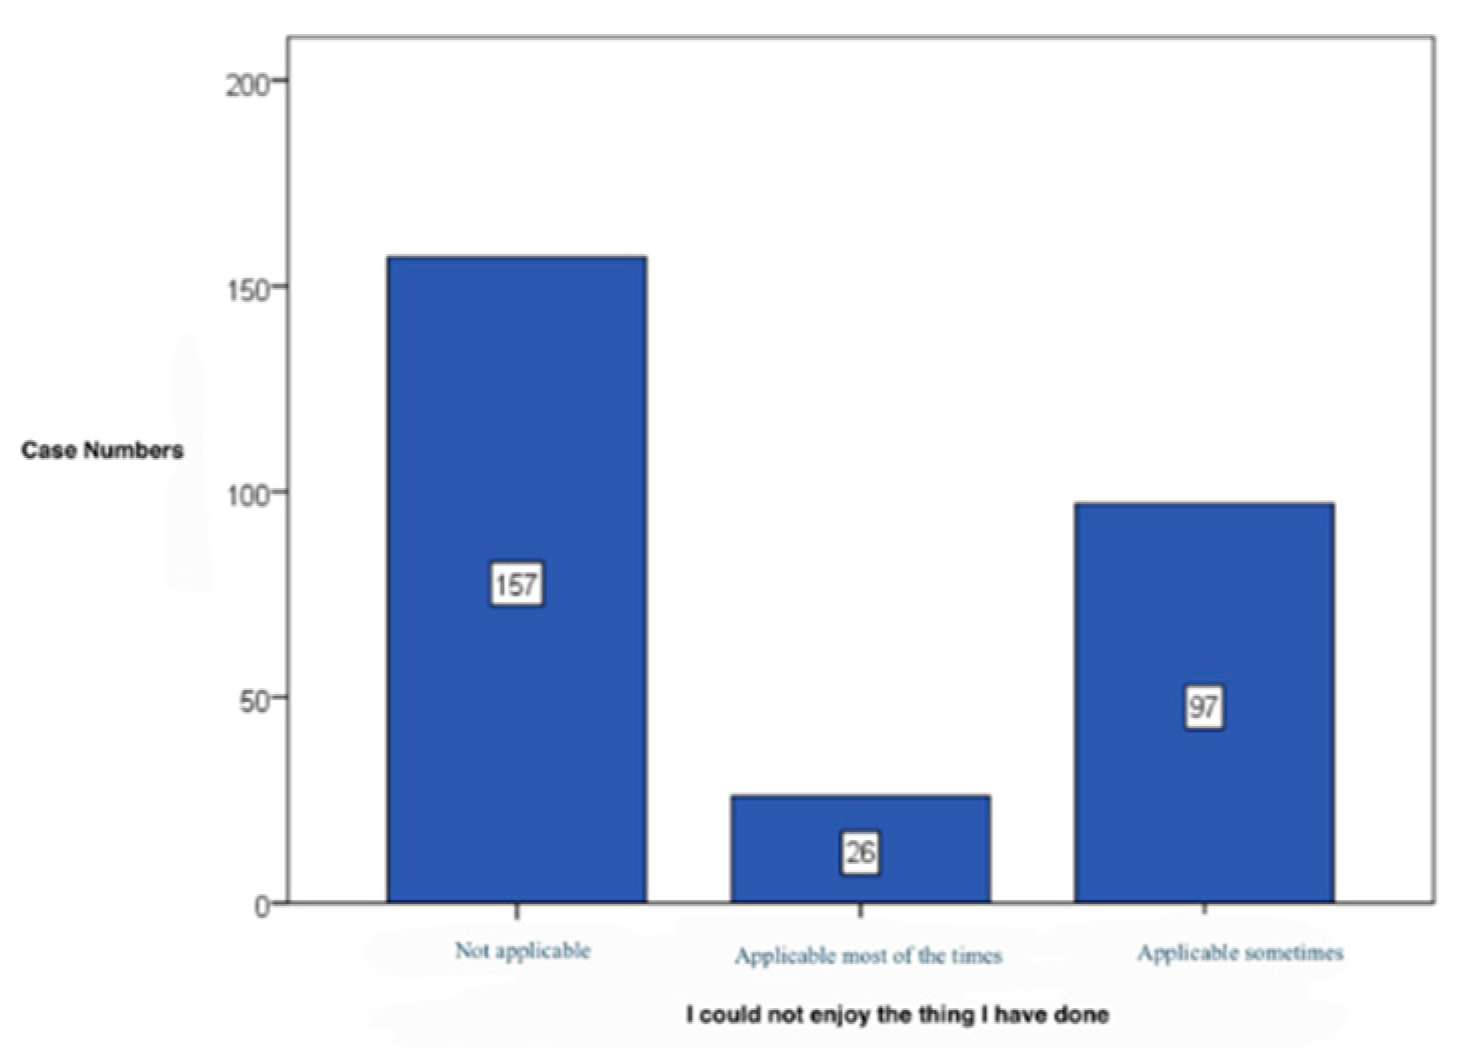
Figure 21.
Demotivation stake.
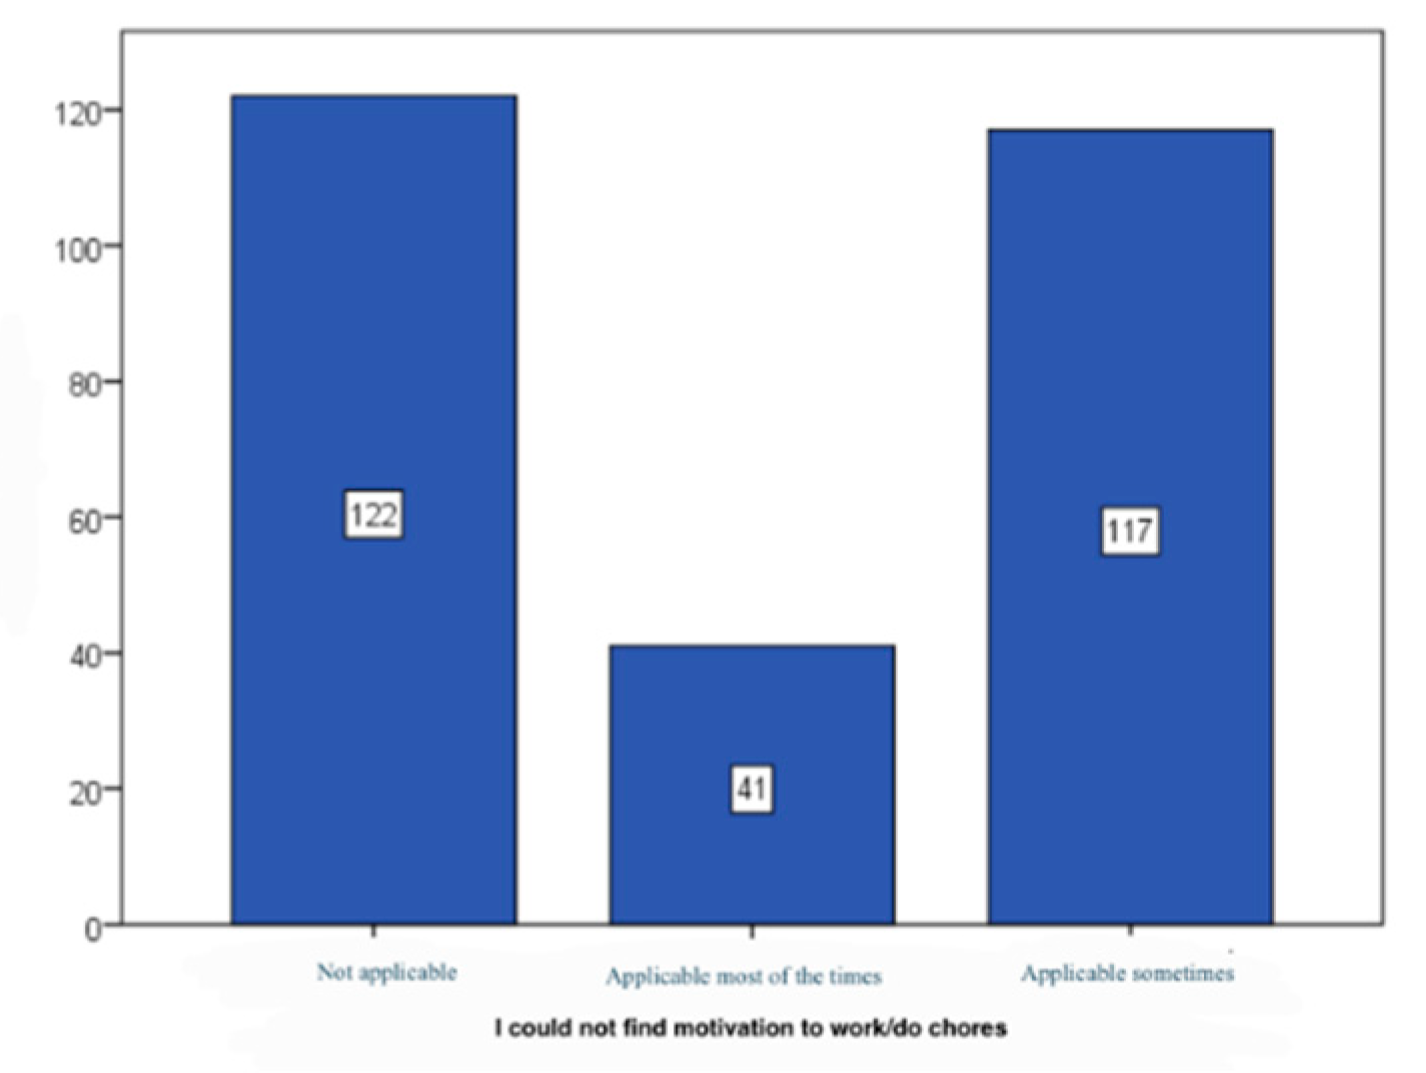
Figure 22.
Lack of the ability to feel joy stake.
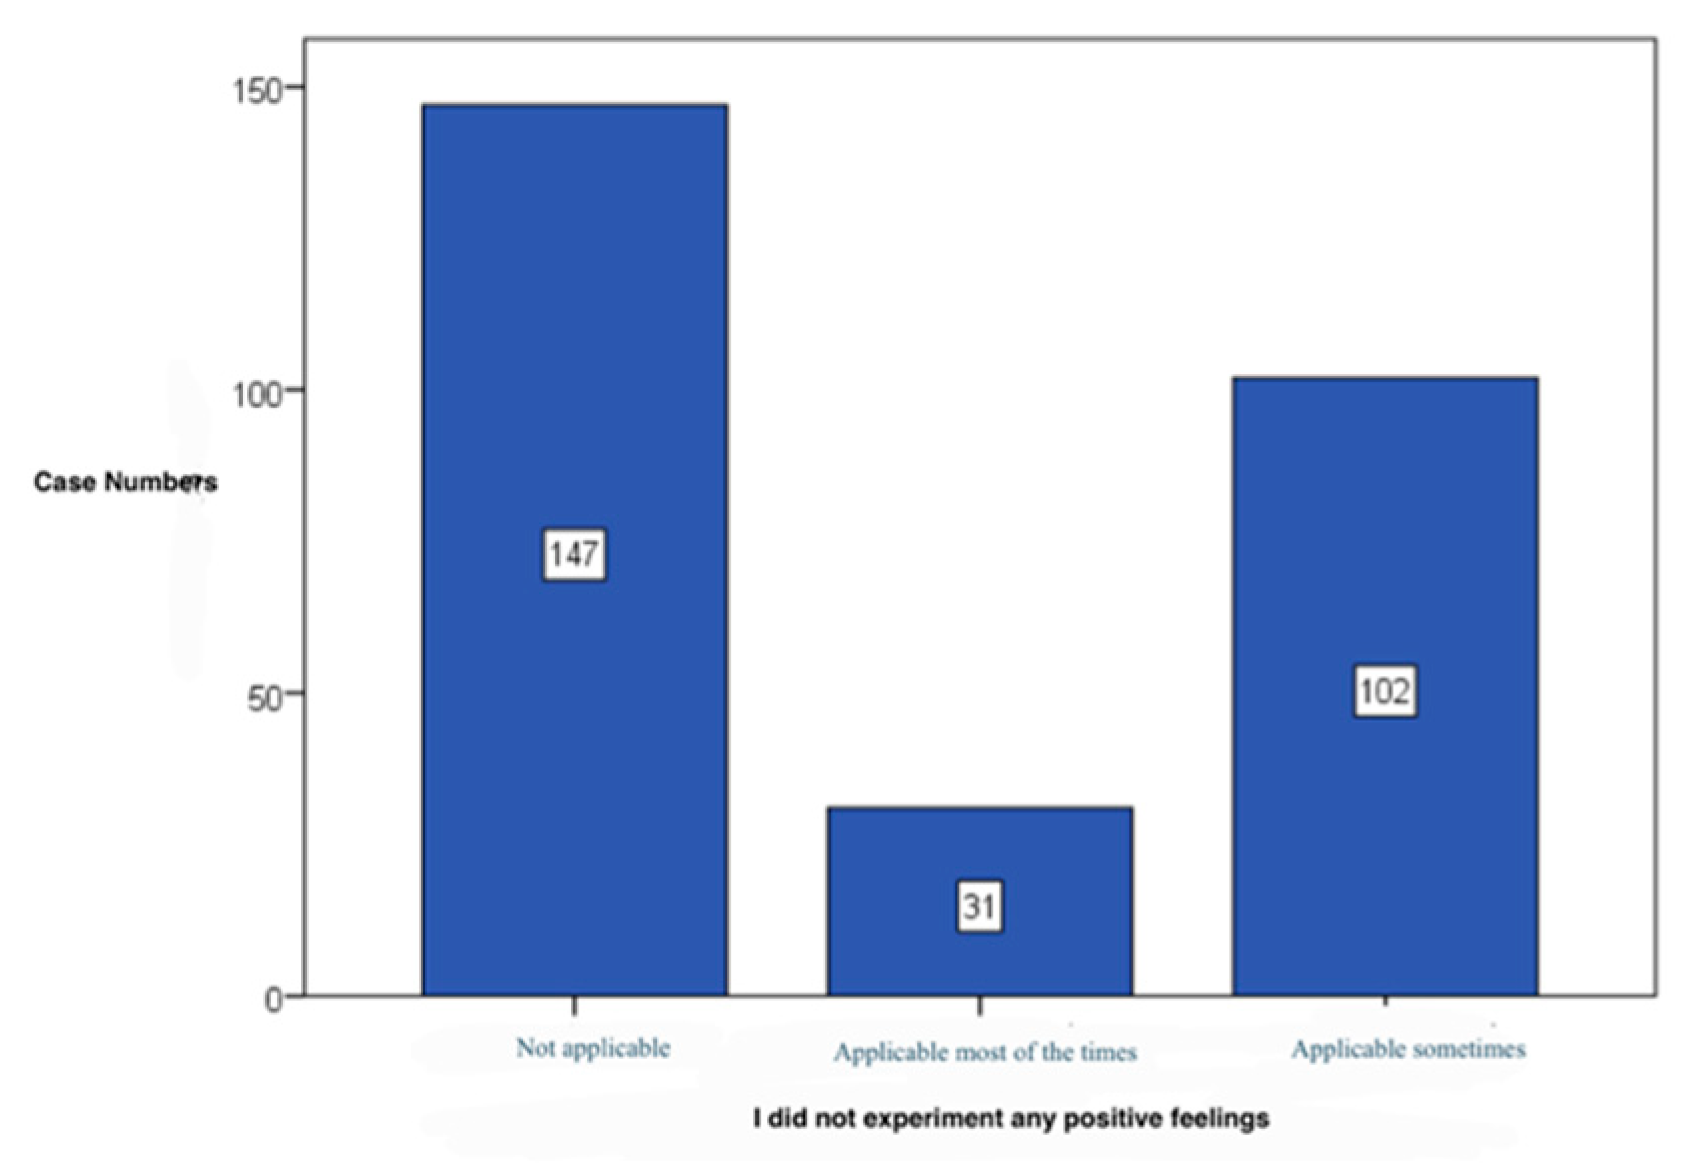
Figure 23.
Stake of subjects that feel alone.
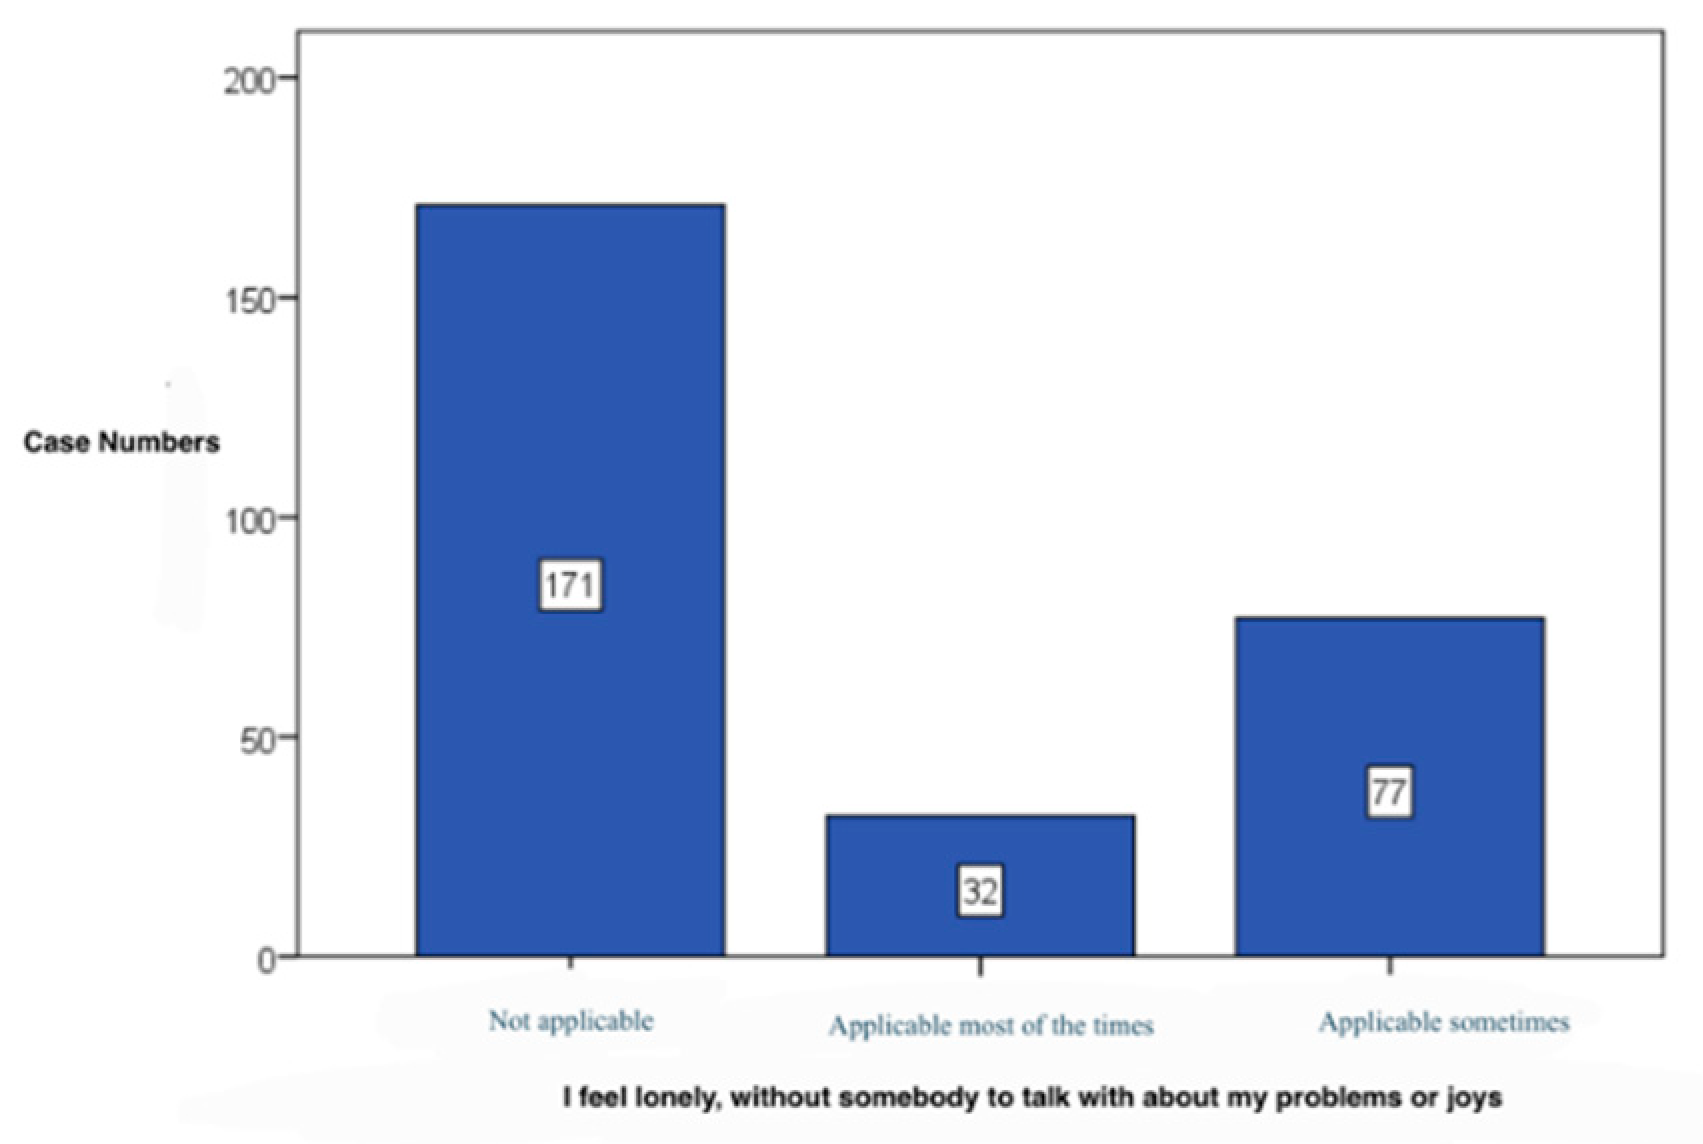
Figure 24.
Stake of subjects that feel that life has no sense.
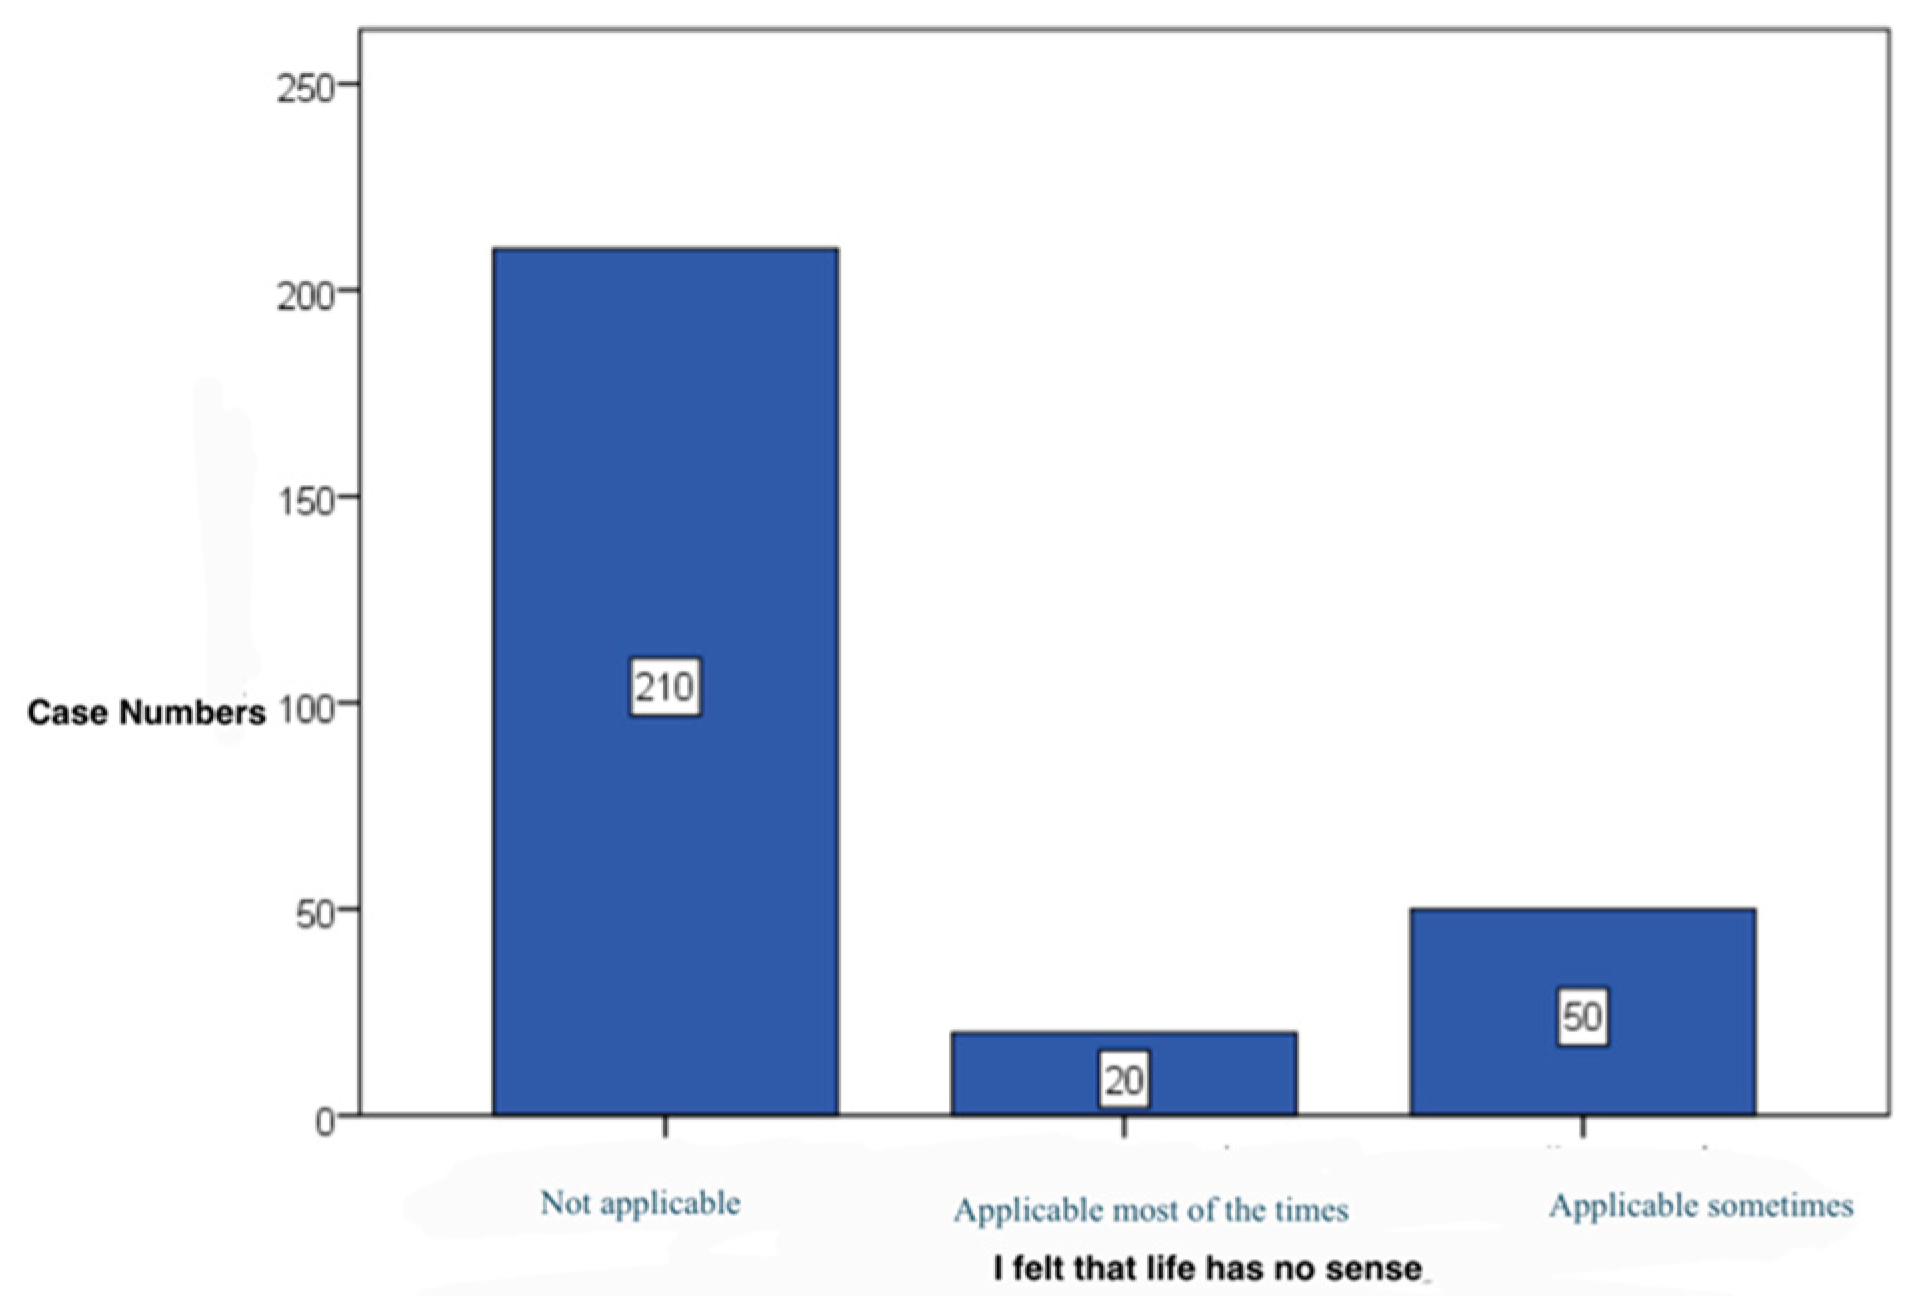
Figure 25.
Stake of subjects that feel worthless.
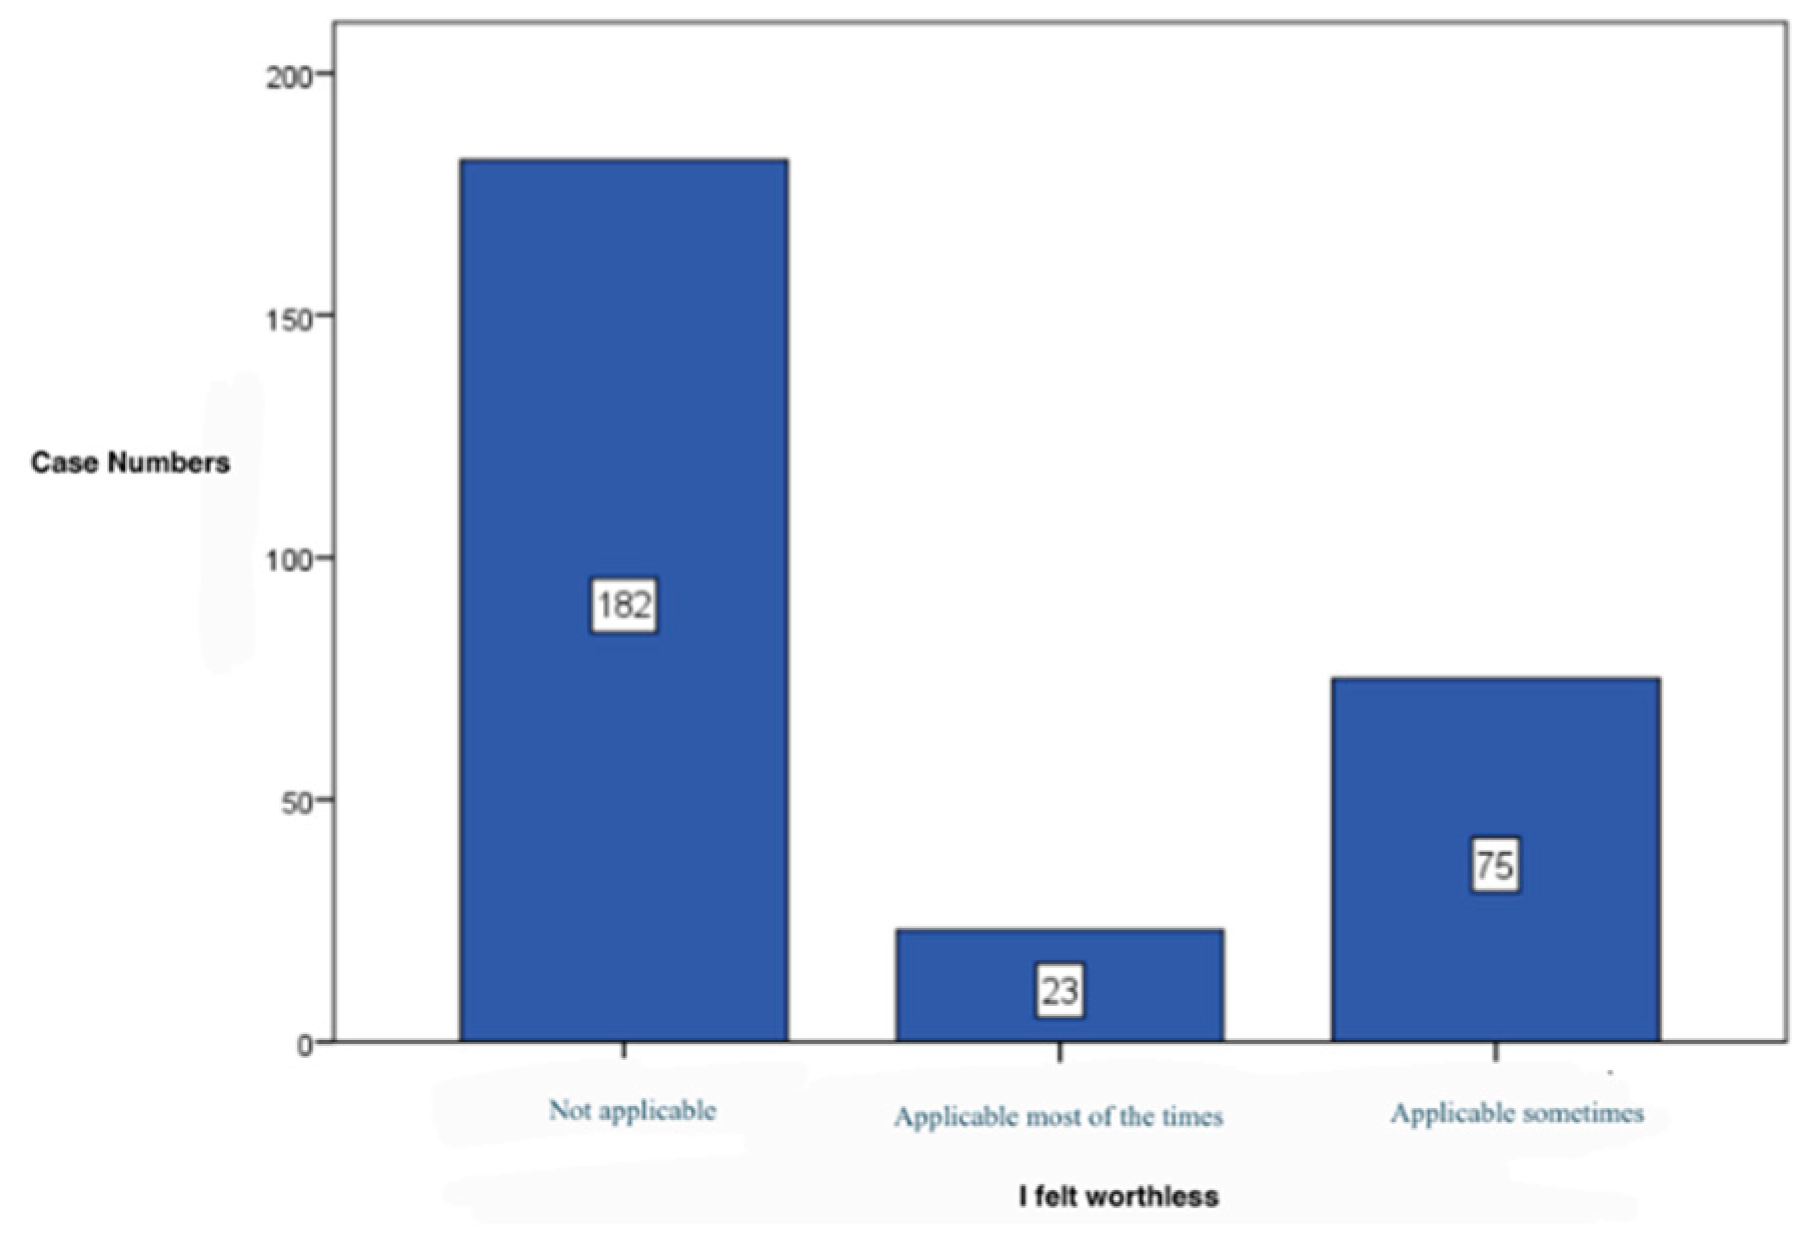
Figure 26.
Stake of subjects that feel sad or depressed.
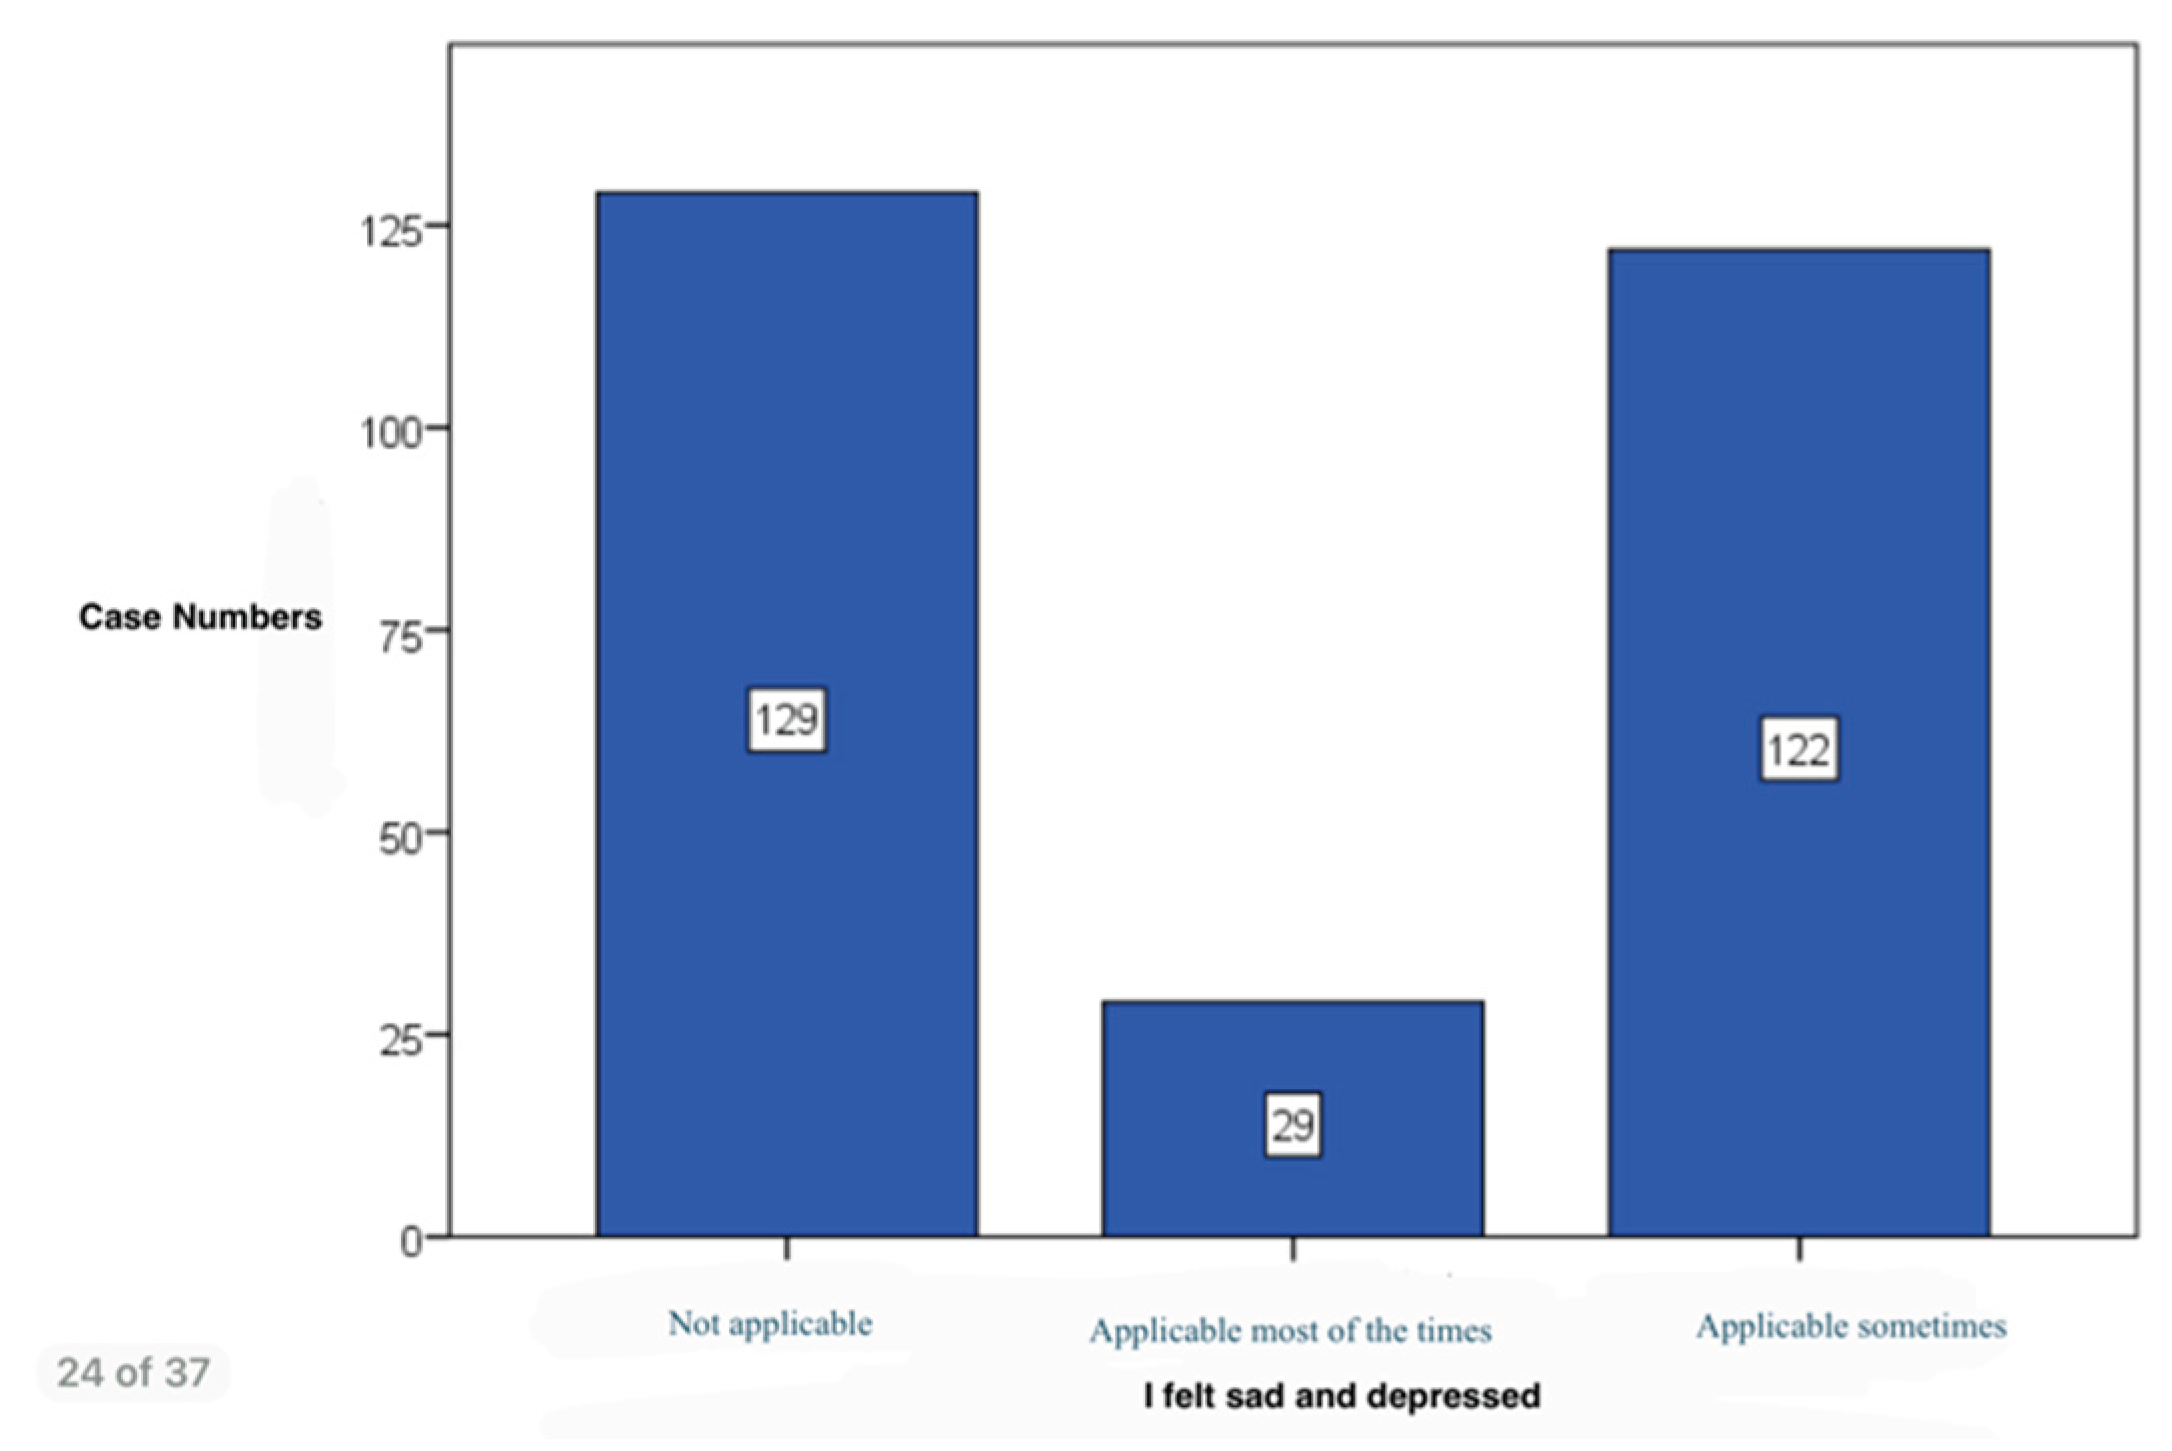
Figure 27.
Stake of subjects that feel worried about situations which could make them feel uncomfortable.
Figure 27.
Stake of subjects that feel worried about situations which could make them feel uncomfortable.
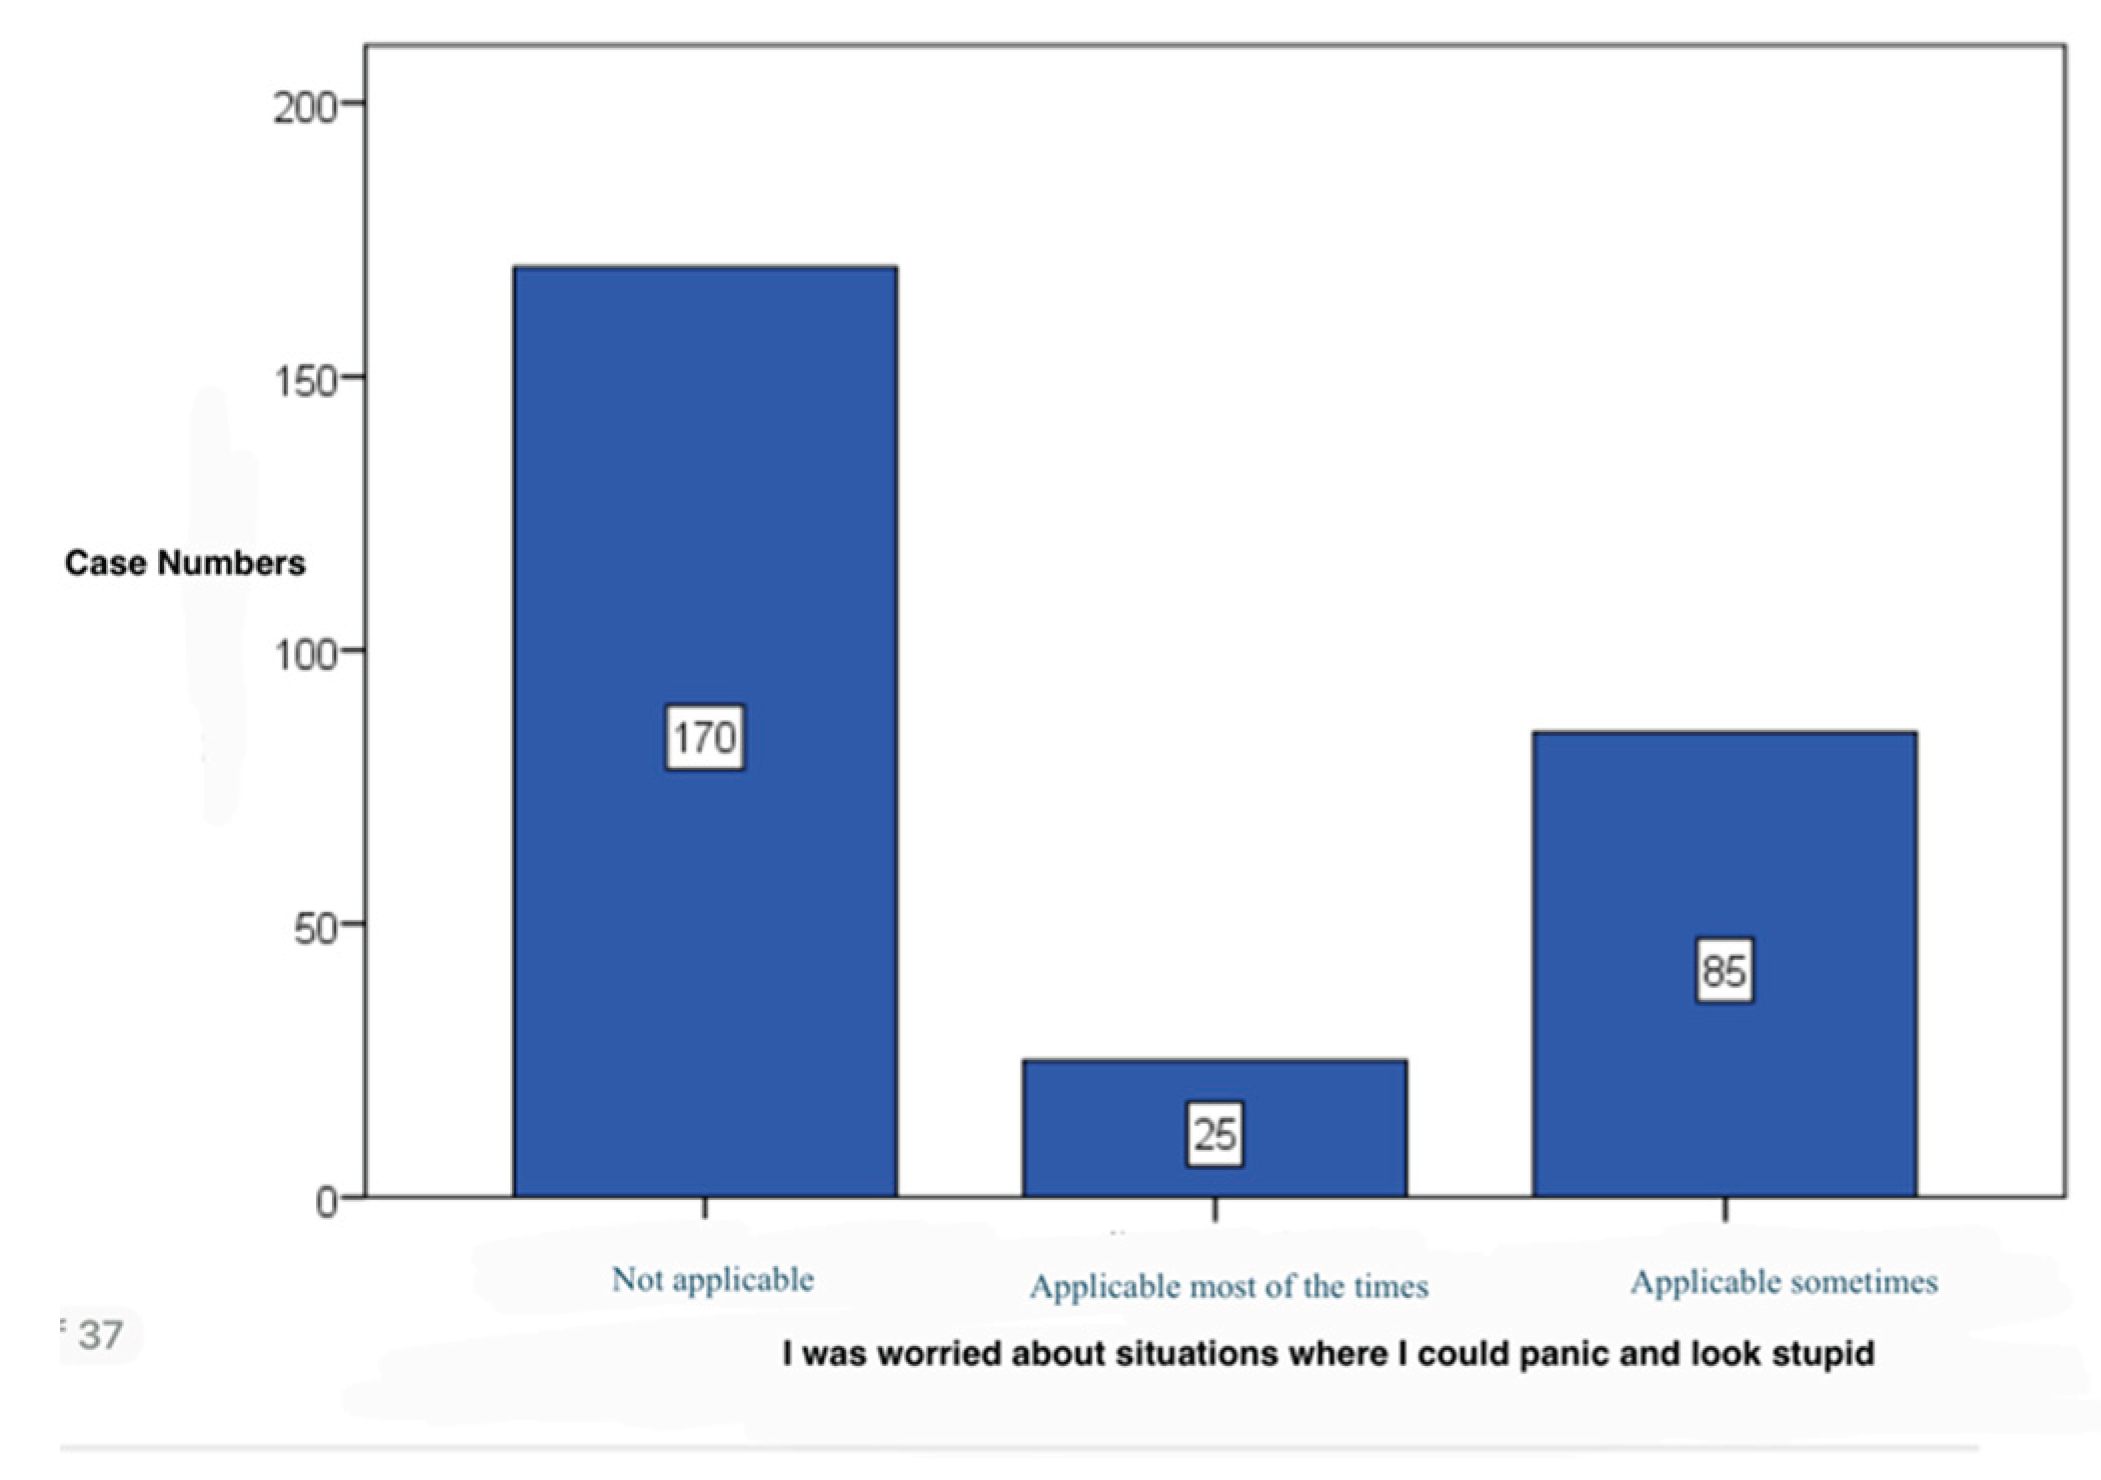
Figure 28.
Stake of subjects with associated anxious episodes.

Figure 29.
Stake of subjects with panic episodes.
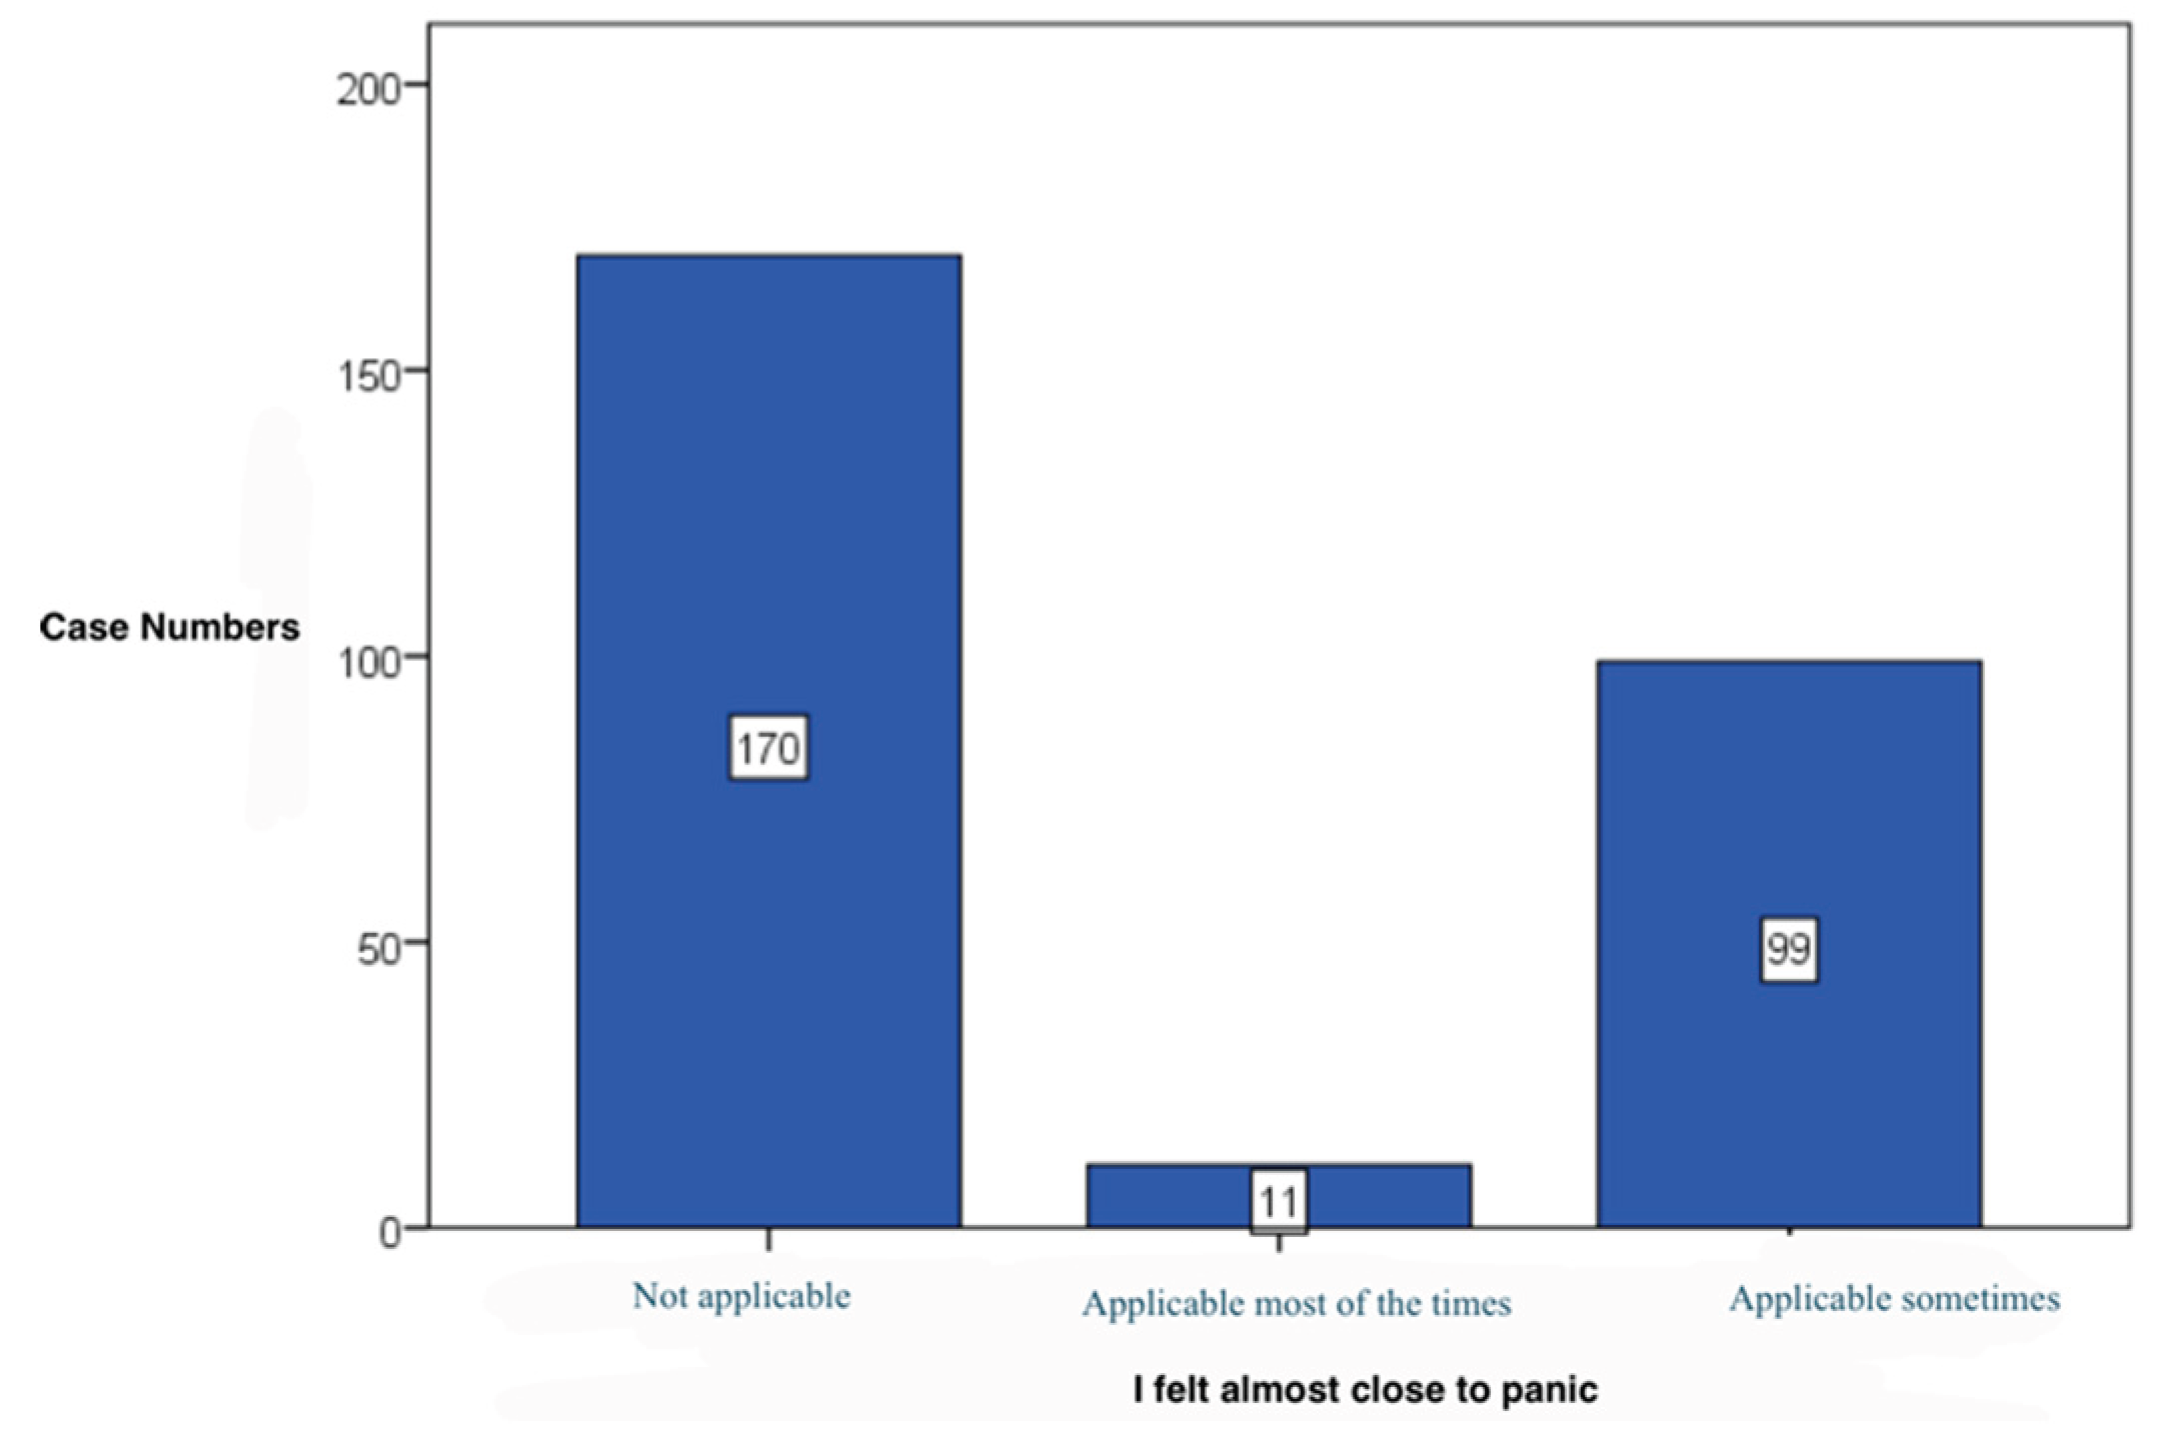
Figure 30.
Stake of subjects with negative experiences.


Table 1.
Statistical analysis of demographic data.
| Case number | Percentage (%) | ||
| Age | ≥60 | 22 | 7.9% |
| 13-17 | 1 | 0.4% | |
| 18-25 | 93 | 33.2% | |
| 26-29 | 22 | 7.9% | |
| 30-39 | 44 | 15.7% | |
| 40-49 | 58 | 20.7% | |
| 50-59 | 40 | 14.3% | |
| Gender | Female | 225 | 80.4% |
| Male | 55 | 19.6% | |
Table 2.
Stake of eating habits answers .
| Case number | Percentage (%) | ||
| Eating habits | Very unhealthy | 7 | 2.5% |
| Very healthy | 11 | 3.9% | |
| Relative unhealthy | 57 | 20.4% | |
| Relative healthy | 205 | 73.2% | |
| Mental health issues | Yes | 74 | 26.4% |
| No | 206 | 73.6% | |
| Neuro-degenerative disorders | Yes | 4 | 1.4% |
| No | 276 | 98.6% | |
Table 3.
Impact of a healthy diet on health.
| Case numbers | Percentage (%) | ||
| General | Has a very high impact | 114 | 40.7% |
| Has a high impact | 131 | 46.8% | |
| Has a low impact | 8 | 2.9% | |
| Does not have an impact | 18 | 6.4% | |
| I do not know | 9 | 3.2% | |
| Physical | Has a very high impact | 127 | 45.4% |
| Has a high impact | 126 | 45.0% | |
| Has a low impact | 3 | 1.1% | |
| Does not have an impact | 16 | 5.7% | |
| I do not know | 8 | 2.9% | |
| Mental | Has a very high impact | 81 | 28.9% |
| Has a high impact | 122 | 43.6% | |
| Has a low impact | 21 | 7.5% | |
| Does not have an impact | 15 | 5.4% | |
| I do not know | 41 | 14.6% | |
Table 4.
Healthy diet impact on the ability to focus and memorise .
| Case numbers | Percentage (%) | ||
| Ability to focus | Has a very high impact | 74 | 26.4% |
| Has a high impact | 121 | 43.2% | |
| Has a low impact | 19 | 6.8% | |
| Does not have an impact | 17 | 6.1% | |
| I do not know | 49 | 17.5% | |
| Ability to memorise | Has a very high impact | 64 | 22.9% |
| Has a high impact | 109 | 38.9% | |
| Has a low impact | 24 | 8.6% | |
| Does not have an impact | 20 | 7.1% | |
| I do not know | 63 | 22.5% | |
| Good dysposition | Has a very high impact | 95 | 33.9% |
| Has a high impact | 125 | 44.6% | |
| Has a low impact | 19 | 6.8% | |
| Does not have an impact | 18 | 6.4% | |
| I do not know | 23 | 8.2% | |
Table 5.
Stake of consumption of certain foods in the statistical analysed lot.
| Case numbers | Percentage (%) | ||
| Vegetables | Some times on a monthly basis | 21 | 7.5% |
| Some times on a weekly basis | 128 | 45.7% | |
| Daily | 111 | 39.6% | |
| Never | 1 | 0.4% | |
| Once a month | 6 | 2.1% | |
| Once a week | 13 | 4.6% | |
| Fruits | Some times on a monthly basis | 22 | 7.9% |
| Some times on a weekly basis | 116 | 41.4% | |
| Daily | 104 | 37.1% | |
| Never | 2 | 0.7% | |
| Once a month | 9 | 3.2% | |
| Once a week | 27 | 9.6% | |
| White carbohydrates | Some times on a monthly basis | 19 | 6.8% |
| Some times on a weekly basis | 91 | 32.5% | |
| Daily | 130 | 46.4% | |
| Never | 2 | 0.7% | |
| Once a month | 12 | 4.3% | |
| Once a week | 26 | 9.3% | |
| Meat | Some times on a monthly basis | 23 | 8.2% |
| Some times on a weekly basis | 137 | 48.9% | |
| Daily | 78 | 27.9% | |
| Never | 10 | 3.6% | |
| Once a month | 7 | 2.5% | |
| Once a week | 25 | 8.9% | |
| Fast-food | Some times on a monthly basis | 59 | 21.1% |
| Some times on a weekly basis | 17 | 6.1% | |
| Daily | 1 | 0.4% | |
| Never | 61 | 21.8% | |
| Once a month | 98 | 35.0% | |
| Once a week | 44 | 15.7% | |
| Sweets | Some times on a monthly basis | 55 | 19.6% |
| Some times on a weekly basis | 94 | 33.6% | |
| Daily | 39 | 13.9% | |
| Never | 10 | 3.6% | |
| Once a month | 25 | 8.9% | |
| Once a week | 57 | 20.4% | |
| Caffeinated drinks | Some times on a monthly basis | 25 | 8.9% |
| Some times on a weekly basis | 41 | 14.6% | |
| Daily | 152 | 54.3% | |
| Never | 34 | 12.1% | |
| Once a month | 15 | 5.4% | |
| Once a week | 13 | 4.6% | |
| Soft Drinks | Some times on a monthly basis | 48 | 17.1% |
| Some times on a weekly basis | 34 | 12.1% | |
| Daily | 24 | 8.6% | |
| Never | 77 | 27.5% | |
| Once a month | 65 | 23.2% | |
| Once a week | 32 | 11.4% | |
| Water | Some times on a monthly basis | 11 | 3.9% |
| Some times on a weekly basis | 9 | 3.2% | |
| Daily | 249 | 88.9% | |
| Never | 4 | 1.4% | |
| Once a month | 5 | 1.8% | |
| Once a week | 2 | 0.7% | |
Table 6.
Answered stake of the survey.
| Case numbers | Percentage (%) | ||
| I did not experiment any positive feelings | Not applicable | 147 | 52.5% |
| Applicable most of the times | 31 | 11.1% | |
| Applicable sometimes | 102 | 36.4% | |
| I could not find motivation to work/do chores | Not applicable | 122 | 43.6% |
| Applicable most of the times | 41 | 14.6% | |
| Applicable sometimes | 117 | 41.8% | |
| I could not enjoy the thing I have done | Not applicable | 157 | 56.1% |
| Applicable most of the times | 26 | 9.3% | |
| Applicable sometimes | 97 | 34.6% | |
| I feel lonely, without somebody to talk with about my problems or joys | Not applicable | 171 | 61.1% |
| Applicable most of the times | 32 | 11.4% | |
| Applicable sometimes | 77 | 27.5% | |
| I felt worthless | Not applicable | 182 | 65.0% |
| Applicable most of the times | 23 | 8.2% | |
| Applicable sometimes | 75 | 26.8% | |
Table 7.
Answers stake of the survey.
| Case numbers | Percentage (%) | ||
| I felt that life has no sense | Not applicable | 210 | 75.0% |
| Applicable most of the times | 20 | 7.1% | |
| Applicable sometimes | 50 | 17.9% | |
| I felt sad and depressed | Not applicable | 129 | 46.1% |
| Applicable most of the times | 29 | 10.4% | |
| Applicable sometimes | 122 | 43.6% | |
| I was worried about situations where I could panic and look stupid | Not applicable | 170 | 60.7% |
| Applicable most of the times | 25 | 8.9% | |
| Applicable sometimes | 85 | 30.4% | |
| I was put in situations in which I was so anxious that I felt most relieved at the end of it | Not applicable | 157 | 56.1% |
| Applicable most of the times | 29 | 10.4% | |
| Applicable sometimes | 94 | 33.6% | |
| I felt almost close to panic | Not applicable | 170 | 60.7% |
| Applicable most of the times | 11 | 3.9% | |
| Applicable sometimes | 99 | 35.4% | |
| I was put in situations where I felt terrified, I was panicked | Not applicable | 190 | 67.9% |
| Applicable most of the times | 10 | 3.6% | |
| Applicable sometimes | 80 | 28.6% | |
Table 8.
Stake of mental illness or psychiatric pathologies in relationship with.
| NUTRITION | |||||||||
| Very unhealthy | Very healthy | Relative unhealthy | Relative healthy | ||||||
| Case numbers, percentage (%) | |||||||||
| Mental illness | Yes | 1 | 14.3% | 1 | 9.1% | 22 | 38.6% | 50 | 24.4% |
| No | 6 | 85.7% | 10 | 90.9% | 35 | 61.4% | 155 | 75.6% | |
| Neuro-degenerative disorders | Yes | 0 | 0.0% | 0 | 0.0% | 0 | 0.0% | 4 | 2.0% |
| No | 7 | 100.0% | 11 | 100.0% | 57 | 100.0% | 201 | 98.0% | |
Table 9.
Stake of foods consumed according to diet.
| NUTRITION | |||||||||
| Very unhealthy | Very healthy | Relative unhealthy | Relative healthy | ||||||
| Case numbers, percentage (%) | |||||||||
| Vegetables | Some times on a monthly basis | 1 | 14.3% | 1 | 9.1% | 6 | 10.5% | 13 | 6.3% |
| Some times on a weekly basis | 3 | 42.9% | 2 | 18.2% | 34 | 59.6% | 89 | 43.4% | |
| Daily | 0 | 0.0% | 8 | 72.7% | 7 | 12.3% | 96 | 46.8% | |
| Never | 1 | 14.3% | 0 | 0.0% | 0 | 0.0% | 0 | 0.0% | |
| Once a month | 2 | 28.6% | 0 | 0.0% | 3 | 5.3% | 1 | 0.5% | |
| Once a week | 0 | 0.0% | 0 | 0.0% | 7 | 12.3% | 6 | 2.9% | |
| Fruits | Some times on a monthly basis | 0 | 0.0% | 1 | 9.1% | 11 | 19.3% | 10 | 4.9% |
| Some times on a weekly basis | 2 | 28.6% | 1 | 9.1% | 24 | 42.1% | 89 | 43.4% | |
| Daily | 0 | 0.0% | 8 | 72.7% | 12 | 21.1% | 84 | 41.0% | |
| Never | 1 | 14.3% | 0 | 0.0% | 0 | 0.0% | 1 | 0.5% | |
| Once a month | 4 | 57.1% | 0 | 0.0% | 3 | 5.3% | 2 | 1.0% | |
| Once a week | 0 | 0.0% | 1 | 9.1% | 7 | 12.3% | 19 | 9.3% | |
| White carbohydrates | Some times on a monthly basis | 0 | 0.0% | 0 | 0.0% | 2 | 3.5% | 17 | 8.3% |
| Some times on a weekly basis | 1 | 14.3% | 5 | 45.5% | 13 | 22.8% | 72 | 35.1% | |
| Daily | 4 | 57.1% | 2 | 18.2% | 37 | 64.9% | 87 | 42.4% | |
| Never | 1 | 14.3% | 0 | 0.0% | 1 | 1.8% | 0 | 0.0% | |
| Once a month | 1 | 14.3% | 3 | 27.3% | 1 | 1.8% | 7 | 3.4% | |
| Once a week | 0 | 0.0% | 1 | 9.1% | 3 | 5.3% | 22 | 10.7% | |
| Meat | Some times on a monthly basis | 0 | 0.0% | 1 | 9.1% | 6 | 10.5% | 16 | 7.8% |
| Some times on a weekly basis | 1 | 14.3% | 4 | 36.4% | 24 | 42.1% | 108 | 52.7% | |
| Daily | 4 | 57.1% | 3 | 27.3% | 21 | 36.8% | 50 | 24.4% | |
| Never | 1 | 14.3% | 1 | 9.1% | 1 | 1.8% | 7 | 3.4% | |
| Once a month | 1 | 14.3% | 0 | 0.0% | 0 | 0.0% | 6 | 2.9% | |
| Once a week | 0 | 0.0% | 2 | 18.2% | 5 | 8.8% | 18 | 8.8% | |
| Diary products | Some times on a monthly basis | 0 | 0.0% | 1 | 9.1% | 3 | 5.3% | 18 | 8.8% |
| Some times on a weekly basis | 4 | 57.1% | 4 | 36.4% | 27 | 47.4% | 95 | 46.3% | |
| Daily | 1 | 14.3% | 3 | 27.3% | 24 | 42.1% | 63 | 30.7% | |
| Never | 1 | 14.3% | 1 | 9.1% | 0 | 0.0% | 3 | 1.5% | |
| Once a month | 1 | 14.3% | 1 | 9.1% | 0 | 0.0% | 6 | 2.9% | |
| Once a week | 0 | 0.0% | 1 | 9.1% | 3 | 5.3% | 20 | 9.8% | |
| Fast-food | Some times on a monthly basis | 1 | 14.3% | 0 | 0.0% | 18 | 31.6% | 40 | 19.5% |
| Some times on a weekly basis | 1 | 14.3% | 0 | 0.0% | 10 | 17.5% | 6 | 2.9% | |
| Daily | 0 | 0.0% | 0 | 0.0% | 0 | 0.0% | 1 | 0.5% | |
| Never | 1 | 14.3% | 7 | 63.6% | 5 | 8.8% | 48 | 23.4% | |
| Once a month | 3 | 42.9% | 4 | 36.4% | 11 | 19.3% | 80 | 39.0% | |
| Once a week | 1 | 14.3% | 0 | 0.0% | 13 | 22.8% | 30 | 14.6% | |
| Snacks | Some times on a monthly basis | 1 | 14.3% | 0 | 0.0% | 12 | 21.1% | 60 | 29.3% |
| Some times on a weekly basis | 2 | 28.6% | 0 | 0.0% | 16 | 28.1% | 23 | 11.2% | |
| Daily | 0 | 0.0% | 0 | 0.0% | 2 | 3.5% | 8 | 3.9% | |
| Never | 2 | 28.6% | 4 | 36.4% | 7 | 12.3% | 34 | 16.6% | |
| Once a month | 1 | 14.3% | 5 | 45.5% | 10 | 17.5% | 50 | 24.4% | |
| Once a week | 1 | 14.3% | 2 | 18.2% | 10 | 17.5% | 30 | 14.6% | |
| Sweets | Some times on a monthly basis | 0 | 0.0% | 0 | 0.0% | 7 | 12.3% | 48 | 23.4% |
| Some times on a weekly basis | 2 | 28.6% | 1 | 9.1% | 24 | 42.1% | 67 | 32.7% | |
| Daily | 1 | 14.3% | 0 | 0.0% | 12 | 21.1% | 26 | 12.7% | |
| Never | 1 | 14.3% | 4 | 36.4% | 1 | 1.8% | 4 | 2.0% | |
| Once a month | 1 | 14.3% | 2 | 18.2% | 4 | 7.0% | 18 | 8.8% | |
| Once a week | 2 | 28.6% | 4 | 36.4% | 9 | 15.8% | 42 | 20.5% | |
| Caffeinated Drinks | Some times on a monthly basis | 0 | 0.0% | 1 | 9.1% | 4 | 7.0% | 20 | 9.8% |
| Some times on a weekly basis | 1 | 14.3% | 0 | 0.0% | 10 | 17.5% | 30 | 14.6% | |
| Daily | 4 | 57.1% | 5 | 45.5% | 37 | 64.9% | 106 | 51.7% | |
| Never | 1 | 14.3% | 4 | 36.4% | 3 | 5.3% | 26 | 12.7% | |
| Once a month | 1 | 14.3% | 0 | 0.0% | 1 | 1.8% | 13 | 6.3% | |
| Once a week | 0 | 0.0% | 1 | 9.1% | 2 | 3.5% | 10 | 4.9% | |
| Soda drinks | Some times on a monthly basis | 0 | 0.0% | 0 | 0.0% | 8 | 14.0% | 40 | 19.5% |
| Some times on a weekly basis | 3 | 42.9% | 0 | 0.0% | 14 | 24.6% | 17 | 8.3% | |
| Daily | 0 | 0.0% | 0 | 0.0% | 14 | 24.6% | 10 | 4.9% | |
| Never | 1 | 14.3% | 9 | 81.8% | 9 | 15.8% | 58 | 28.3% | |
| Once a month | 3 | 42.9% | 2 | 18.2% | 6 | 10.5% | 54 | 26.3% | |
| Once a week | 0 | 0.0% | 0 | 0.0% | 6 | 10.5% | 26 | 12.7% | |
| Water | Some times on a monthly basis | 0 | 0.0% | 1 | 9.1% | 1 | 1.8% | 9 | 4.4% |
| Some times on a weekly basis | 1 | 14.3% | 0 | 0.0% | 4 | 7.0% | 4 | 2.0% | |
| Daily | 4 | 57.1% | 9 | 81.8% | 48 | 84.2% | 188 | 91.7% | |
| Never | 1 | 14.3% | 0 | 0.0% | 2 | 3.5% | 1 | 0.5% | |
| Once a month | 1 | 14.3% | 0 | 0.0% | 2 | 3.5% | 2 | 1.0% | |
| Once a week | 0 | 0.0% | 1 | 9.1% | 0 | 0.0% | 1 | 0.5% | |
Table 10.
Statistical analysis of parameters in relationship with statistical analysed parameters.
| NUTRITION | |||||||||
| Very unhealthy | Very healthy | Relative unhealthy | Relative healthy | ||||||
| Case numbers, percentage (%) | |||||||||
| I did not experiment any positive feelings | Not applicable | 2 | 28.6% | 6 | 54.5% | 19 | 33.3% | 120 | 58.5% |
| Applicable most of the times | 2 | 28.6% | 1 | 9.1% | 6 | 10.5% | 22 | 10.7% | |
| Applicable sometimes | 3 | 42.9% | 4 | 36.4% | 32 | 56.1% | 63 | 30.7% | |
| I could not find motivation to work/do chores | Not applicable | 3 | 42.9% | 7 | 63.6% | 12 | 21.1% | 100 | 48.8% |
| Applicable most of the times | 2 | 28.6% | 1 | 9.1% | 11 | 19.3% | 27 | 13.2% | |
| Applicable sometimes | 2 | 28.6% | 3 | 27.3% | 34 | 59.6% | 78 | 38.0% | |
| I could not enjoy the thing I have done | Not applicable | 3 | 42.9% | 8 | 72.7% | 21 | 36.8% | 125 | 61.0% |
| Applicable most of the times | 1 | 14.3% | 1 | 9.1% | 6 | 10.5% | 18 | 8.8% | |
| Applicable sometimes | 3 | 42.9% | 2 | 18.2% | 30 | 52.6% | 62 | 30.2% | |
| I feel lonely, without somebody to talk with about my problems or joys | Not applicable | 5 | 71.4% | 8 | 72.7% | 29 | 50.9% | 129 | 62.9% |
| Applicable most of the times | 1 | 14.3% | 1 | 9.1% | 14 | 24.6% | 16 | 7.8% | |
| Applicable sometimes | 1 | 14.3% | 2 | 18.2% | 14 | 24.6% | 60 | 29.3% | |
| I felt worthless | Not applicable | 4 | 57.1% | 6 | 54.5% | 30 | 52.6% | 142 | 69.3% |
| Applicable most of the times | 1 | 14.3% | 2 | 18.2% | 8 | 14.0% | 12 | 5.9% | |
| Applicable sometimes | 2 | 28.6% | 3 | 27.3% | 19 | 33.3% | 51 | 24.9% | |
| I felt that life has no sense | Not applicable | 6 | 85.7% | 9 | 81.8% | 34 | 59.6% | 161 | 78.5% |
| Applicable most of the times | 1 | 14.3% | 2 | 18.2% | 5 | 8.8% | 12 | 5.9% | |
| Applicable sometimes | 0 | 0.0% | 0 | 0.0% | 18 | 31.6% | 32 | 15.6% | |
| I felt sad and depressed | Not applicable | 5 | 71.4% | 6 | 54.5% | 16 | 28.1% | 102 | 49.8% |
| Applicable most of the times | 1 | 14.3% | 2 | 18.2% | 10 | 17.5% | 16 | 7.8% | |
| Applicable sometimes | 1 | 14.3% | 3 | 27.3% | 31 | 54.4% | 87 | 42.4% | |
| I was worried about situations where I could panic and look stupid | Not applicable | 5 | 71.4% | 6 | 54.5% | 32 | 56.1% | 127 | 62.0% |
| Applicable most of the times | 0 | 0.0% | 2 | 18.2% | 6 | 10.5% | 17 | 8.3% | |
| Applicable sometimes | 2 | 28.6% | 3 | 27.3% | 19 | 33.3% | 61 | 29.8% | |
| I was put in situations in which I was so anxious that I felt most relieved at the end of it | Not applicable | 4 | 57.1% | 7 | 63.6% | 25 | 43.9% | 121 | 59.0% |
| Applicable most of the times | 1 | 14.3% | 1 | 9.1% | 11 | 19.3% | 16 | 7.8% | |
| Applicable sometimes | 2 | 28.6% | 3 | 27.3% | 21 | 36.8% | 68 | 33.2% | |
| I felt almost close to panic | Not applicable | 5 | 71.4% | 8 | 72.7% | 29 | 50.9% | 128 | 62.4% |
| Applicable most of the times | 0 | 0.0% | 0 | 0.0% | 5 | 8.8% | 6 | 2.9% | |
| Applicable sometimes | 2 | 28.6% | 3 | 27.3% | 23 | 40.4% | 71 | 34.6% | |
| I was put in situations where I felt terrified, I was panicked | Not applicable | 5 | 71.4% | 9 | 81.8% | 32 | 56.1% | 144 | 70.2% |
| Applicable most of the times | 0 | 0.0% | 1 | 9.1% | 1 | 1.8% | 8 | 3.9% | |
| Applicable sometimes | 2 | 28.6% | 1 | 9.1% | 24 | 42.1% | 53 | 25.9% | |
Disclaimer/Publisher’s Note: The statements, opinions and data contained in all publications are solely those of the individual author(s) and contributor(s) and not of MDPI and/or the editor(s). MDPI and/or the editor(s) disclaim responsibility for any injury to people or property resulting from any ideas, methods, instructions or products referred to in the content. |
© 2025 by the authors. Licensee MDPI, Basel, Switzerland. This article is an open access article distributed under the terms and conditions of the Creative Commons Attribution (CC BY) license (http://creativecommons.org/licenses/by/4.0/).
Copyright: This open access article is published under a Creative Commons CC BY 4.0 license, which permit the free download, distribution, and reuse, provided that the author and preprint are cited in any reuse.


