
Submitted:
10 August 2025
Posted:
12 August 2025
You are already at the latest version
Abstract
Maritime surveillance has gained more attention in recent years due to deep-learning vision methods becoming more and more accurate and discriminative. Among different ways to capture maritime images, Synthetic Aperture Radars (SARs) for ships have become an important method due to their advantages in various weather and lighting conditions. Therefore, this work presents a hybrid model approach using Bi-Level Routing Attention (BRA) among backbone and neck layers to improve the YOLOv10n original model when facing SAR images in a maritime context. The BRA insertion tries to capture relevant features by focusing on small objects in the images. The experiment results reveal that the proposed models achieved 97.70% mean Average Precision (mAP) against 97.36% of the original YOLOv10 retrained for SAR context on the SAR Ship Dataset. Also, the proposed model outperformed all analyzed models in the last five years using different approaches on the same dataset. The most recent model achieved 97.72% while our model 97.77%, using a different combination of training and test image amounts.
Keywords:
YOLOv10
; bi-level routing attention
; SAR ship detection
; maritime surveillance
; small ship detection
1. Introduction
Maritime surveillance has gained attention since the evolution of computer methods for detecting, recognizing, and tracking ships in different contexts. Using images and video helps companies identify illegal activities and monitor ships’ behavior on coastlines. The traditional Automatic Identification System (AIS) data used to control maritime traffic and provide increased security for navigation suffer from some problems, mainly caused by human manipulation and incorrect data sent by the ships to the control station. Although AIS data is mandatory for some classes of ships, illegal activities can lead to AIS transponder turn-off. To minimize the impacts, some works have proposed a fusion among AIS data and satellite [1,2,3] and others with radar images [4], like Synthetic Aperture Radar (SAR). The association between two data types allows for identifying collaborative and non-collaborative ships.
The remote sensing technologies involving satellites make the SAR sensor one important maritime monitoring method [5]. The advantages of SAR are its all-day and all-weather data-collecting capabilities. In [6] and [7], surveys on SAR ship detection are presented, ranging from traditional detection methods using sea-land segmentation and constant false alarm rate (CFAR) based models to recent deep learning (DL) computer vision (CV) models. Despite SAR being an important step for maritime imagery, many problems must be tackled. Initially, land-ocean segmentation could be necessary in some SAR image scenarios. With low SAR image volume, fine-tuning in models trained using regular datasets was needed, leading to inefficient detections. Moreover, ships on the ocean or near land with similar patterns can produce complex backgrounds, making the detection more challenging. Since the SAR Ship Detection (SSD) [8] and SAR Ship [9] datasets were released in 2017 and 2019, respectively, many researchers have been trying to improve ship detection in intricate environments with complex backgrounds. These two datasets facilitated access to SAR images in the maritime context, contributing to the research, especially in using Deep Learning. In [6], 177 papers were organized into past, present, and future development of models applied to ship detection in SAR images. Convolution Neural Network (CNN) based models have been used in SAR ship detection, especially the You Only Look Once (YOLO) in almost all versions from YOLOv1 to YOLOv10. The proposed models include modifications in different parts of standard models to achieve better performance in benchmark datasets and try to solve some challenges related to radar images, like small ships, complex backgrounds, and similar objects between land and ships in the ocean.
This work introduces the YOLO-SAR Ship Object Detection (YOLO-SSOD) model, which builds upon the recent YOLO version, YOLOv10 [10], specifically its YOLOv10n variant. The authors demonstrated that YOLOv10 achieves reduced latency and fewer parameters than YOLOv9 size while maintaining equivalent performance. The evolution of the YOLO family has consistently been driven by the dual objectives of reducing complexity and increasing performance.
Leveraging these advancements, the YOLO-SSOD model is designed to enhance SAR ship detection performance. The model incorporates the YOLOv10n architecture and integrates an innovative attention mechanism, Bi-Level Routing Attention (BRA), to improve the detection of small ships in SAR images. The BRA module is embedded in the model using one of three strategies: during the downsampling phase, during the upsampling phase, or as a feature fusion mechanism positioned between the downsampling and upsampling stages. This design aims to optimize feature extraction and enhance detection accuracy, particularly for challenging scenarios involving small or complex ship targets in SAR imagery.
By introducing the BRA mechanism within specific layers of YOLOv10, this study contributes to advancements in SAR ship detection. Firstly, we propose a new model, YOLO-SSOD, built upon the lightweight YOLOv10n architecture and augmented with the BRA module in the feature fusion layers. This module is particularly advantageous for enhancing small target detection, a frequent and challenging requirement in SAR ship detection tasks due to the compact size of maritime vessels in radar imagery. To our knowledge, YOLO-SSOD represents the first YOLOv10-based framework explicitly designed for SAR ship detection, filling a critical gap in existing methodologies. Finally, this work validates YOLO-SSOD’s performance by comparing it against other models. The results demonstrate the superiority of the proposed model in addressing the nuanced challenges of object detection in SAR images, offering a foundation for future investigations into maritime object detection and expanding the applicability of DL models in remote sensing.
The remaining sections are organized as follows. Section 2 presents related works working with SAR images and YOLO’s model. Section 3 includes a dataset description, metrics used, and the architecture proposed for YOLO-SSOD. Section 4 defines the environmental setup and details of execution, the performance of YOLO-SSOD on the SAR Ship Dataset, and the ablations study for the proposed model, including a discussion of the results. Section 5 concludes the work.
2. Related Works
Since the development of the original YOLO model [11], researchers across various fields have continuously proposed new iterations and enhancements to its architecture [12,13]. The evolution from the initial YOLO reflects a consistent effort to achieve two primary goals: reducing model complexity to enable faster image processing and improving detection performance. Remarkably, YOLOv10 has managed to achieve both objectives simultaneously, showcasing advancements in efficiency without compromising accuracy [10].
Detecting small objects is a particularly challenging yet crucial task these models might help address [14]. This task becomes even more demanding when using images captured by stationary cameras, drones, satellites, or other vision systems, where small objects are often indistinguishable from background noise or are represented by only a few pixels [15]. Traditional CNNs face inherent limitations in accurately identifying such small targets despite the substantial progress enabled by the DL paradigm. Overcoming these challenges requires innovative modifications to the architecture and specialized techniques to enhance the detection capabilities for small objects. YOLO’s evolution underscores the importance of addressing these limitations while maintaining its hallmark speed and efficiency, solidifying its relevance in real-world applications.
SAR images are crucial in maritime object detection because they capture data under various weather and lighting conditions [16]. However, these images often include complex backgrounds due to the unique image acquisition process employed by SAR sensors. Additionally, detecting small objects, such as ships, relies heavily on precise chip cropping after image generation to focus on regions of interest. One large SAR image from the sensor is cropped in sub-images, and then ship chips (containing the ship image) are obtained and added to the dataset. This makes ship detection in SAR data (i.e., SAR ship detection) particularly challenging.
Numerous models have been proposed to address this, with many leveraging versions of the YOLO architecture as a baseline. Earlier versions, such as YOLOv3 [17] and YOLOv4 [18], laid the groundwork for applying YOLO-based methods to SAR ship detection. Subsequent advancements, including YOLOv5 [5,19], YOLOv7 [20,21], YOLOv8 [22,23,24], and YOLOX [25], introduced innovations to handle the intricacies of SAR images and the challenges posed by small object detection better.
In addition to the YOLO family, other DL architectures have also been employed. These include Deep Convolutional Neural Networks (DCNNs) [26,27], the Detection Transformer (DETR) [28], and the CenterNet network framework [29], among others. Each approach aims to enhance the detection of small objects in SAR imagery, leveraging unique architectural features to improve accuracy and robustness.
In almost all the cited works, authors have leveraged the layered architecture of recent DL models to integrate various enhancing modules seamlessly. This approach adds to the models’ efficient and performing operations, such as dilated [25], deformable and depthwise separable convolutions, and ghost modules [30]. However, attention mechanisms are one of the most performative ones, which have revolutionized how models focus on relevant regions of an image while ignoring less important details [31]. Attention mechanisms have been particularly effective in addressing challenges like small object detection [32], adverse weather conditions[33], and occlusion [34] by dynamically weighting features based on their relevance. Since the introduction of attention mechanisms for image processing in [35], followed by advancements like Vision Transformer (ViT) [24] and DETR [36], attention-based methods have become integral to modern computer vision tasks.
One notable development is the Bi-Level Routing Attention (BRA) mechanism [37], which introduces a dynamic, query-aware sparse attention mechanism. This innovation has inspired numerous applications across diverse scenarios. For instance, BRA has been utilized in power fitting detection tasks [38], medical imaging for chest X-ray analysis [39], and small object detection in remote sensing images, often in combination with YOLO-based architectures (e.g., BRA+YOLO) [40,41].
Furthermore, BRA has been applied to enhance object detection in adverse weather scenarios using BRA+YOLOv9 [42], improve recognition accuracy, and address the challenges of detecting occluded, long-range, and diminutive targets, such as Unmanned Aerial Vehicles (UAVs) [43]. Additionally, this mechanism has found application in classroom learning behavior recognition, as demonstrated in BRA-enhanced YOLOv8 models [44].
While previous research has made significant advancements in SAR ship detection using DL models, our work introduces key innovations that distinguish it from related studies. One of the primary distinctions lies in the architectural enhancements applied to the YOLOv10n model. Unlike prior approaches that primarily focused on modifications to convolutional layers, such as dilated, deformable, and depthwise separable convolutions [25,30,45], our model integrates the BRA mechanism. This integration allows for improved feature selection, particularly for small objects, a critical challenge in SAR ship detection.
Attention mechanisms have been successfully employed in various object detection models, including Swin-YOLOv5 [32,46] and ViT-based approaches [24]. However, these works typically focus on general object detection tasks rather than the unique complexities of SAR imagery, such as the presence of complex backgrounds and the low resolution of small ships. Our work specifically addresses these challenges by embedding BRA into the feature fusion layers of YOLOv10n, optimizing the detection process for maritime surveillance applications.
Furthermore, our approach differs from existing SAR ship detection models that rely on alternative deep learning frameworks like DETR [28] and CenterNet [29]. While these models offer competitive accuracy, they often suffer from increased computational costs and inference times, making them less suitable for real-time applications. In contrast, our modified YOLOv10n model maintains the efficiency and real-time speed of the YOLO family while enhancing accuracy, as demonstrated by its mAP performance on the SAR Ship Dataset.
3. Materials and Methods
This section provides an overview of the dataset, metrics, architectural design, and methodologies employed in this study to enhance SAR ship detection performance. Central to this work is using the SAR Ship Dataset, a highly challenging dataset characterized by diverse ship sizes, complex backgrounds, and small object features. This section also details the architecture of the proposed YOLO-SSOD model, which integrates state-of-the-art innovations such as the YOLOv10 framework and the BRA mechanism. By addressing specific challenges in SAR imagery, such as small object detection and complex contextual interference, the methodologies aim to optimize detection accuracy and efficiency. The architectural innovations and their implications for feature representation and multi-scale object detection are explored to highlight the advancements introduced by this work.
3.1. Dataset
The SAR Ship Dataset [9] was constructed using SAR images from two satellite sources: 102 images from Gaofen-3 and 108 images from Sentinel-1. The authors processed these SAR images by cropping subregions containing ships to generate a comprehensive collection of labeled samples. Each subregion was resized or standardized to 256 × 256 pixels, resulting in grayscale images suitable for SAR-specific detection tasks.
The dataset consists of 39,729 labeled Ship Chips, with each chip being a grayscale image labeled for ship detection. These images capture diverse maritime environments, including varying ship sizes and complex backgrounds. Representative examples from the dataset are presented in Figure 1.
The authors of the SAR Ship Dataset identify ship size and background complexity as the most significant factors affecting performance in SAR ship detection tasks. Backgrounds in SAR images often include elements that can resemble ships, introducing challenges in distinguishing ships from non-ship objects. Additionally, ship sizes in the dataset can be very small, sometimes represented by only a few pixels, further complicating detection. These characteristics make the SAR Ship Dataset a valuable benchmark for evaluating models designed for SAR-based ship detection.
One of the strengths of this dataset is the variety of ship sizes it offers. This variety arises from the diverse shapes of ships, differences in resolution due to imaging conditions, and the mechanisms used by satellites like Gaofen-3 and Sentinel-1 to capture SAR images. This diversity presents an excellent opportunity to test models for their robustness in detecting ships at multiple scales or to evaluate the performance of sub-models specialized in small, medium, or large ship sizes.
Further insight into ship size distribution is also presented by analyzing the bounding box size relative to the image size. The relative size is computed as:
where and are the bounding box dimensions, and and are the image dimensions. Their analysis reveals that the relative size of bounding boxes is predominantly less than 0.2, indicating that most ships in the dataset are relatively small compared to the image dimensions. This characteristic underscores the importance of models that can handle small object detection effectively.
Another significant challenge posed by the SAR Ship Dataset is its complex background. SAR images are generated based on the reflection of radar signals, which means that all elements within the scene contribute to the final scatter image—not just the ships. This results in a background that can include patterns resembling ships, such as ocean waves, islands, landmasses, and man-made structures like buildings. These elements can share scattering characteristics similar to ships, making the dataset highly complex and demanding for ship detection tasks.
This complexity, while challenging, also offers opportunities for leveraging DCNNs in detection tasks. One of the primary difficulties lies in the small size of ships, which can become even harder to discern after subsampling operations in convolutional layers. Small objects risk being lost in deeper layers of the network due to resolution reduction. However, DCNNs excel in learning intricate patterns and can adapt to the complex background by extracting meaningful features across multiple scales. With the right architectural design, such as incorporating feature pyramids or attention mechanisms, these networks can effectively address small object detection and background complexity, demonstrating strong performance on SAR-based datasets.
3.2. Performance Evaluation Metrics
In object detection, the performance of models is often evaluated using the metric mean average precision (mAP). This metric summarizes how well a model detects objects across different categories and confidence thresholds [47,48]. It is a standard measure in benchmarking datasets and object detection models, enabling meaningful comparisons. For instance, the YOLO series employs mAP to track its models’ performance progression across versions. At the same time, the COCO dataset uses mAP extensively in its challenges to rank and compare models. Two commonly used mAP variations in modern benchmarks are mAP@0.5 and mAP@0.5:0.95. These metrics provide insights into the accuracy and robustness of a model’s predictions.
A foundational concept in computing mAP is the Intersection over Union (IoU), which measures the overlap between the predicted bounding box, , and the ground truth bounding box, . The IoU is given by
where is the area of intersection between the predicted and ground truth boxes, and is the area of their union.
Precision (P) and Recall (R) are key metrics used in object detection:
- Precision measures the proportion of correctly predicted bounding boxes () among all predicted boxes ():
- Recall measures the proportion of correctly predicted bounding boxes () among all ground truth boxes ():
For each class, a Precision-Recall (PR) curve is generated by varying the confidence threshold of predictions. The average precision (AP) for a class is the area under the PR curve
This integration is often approximated numerically using a discrete set of points.
The metric mAP@0.5 computes the mean of AP values across all classes, where a prediction is considered correct if its IoU with the ground truth exceeds 0.5
where C is the total number of object classes.
The metric mAP@0.5:0.95 provides a more comprehensive evaluation by averaging AP values over multiple IoU thresholds from 0.5 to 0.95, with a step size of 0.05
where T is the number of IoU thresholds, typically for thresholds .
The mAP@0.5 focuses on a single IoU threshold (0.5), offering a straightforward measure of detection accuracy, while mAP@0.5:0.95 evaluates performance across multiple IoU thresholds, providing a more comprehensive assessment that rewards models capable of maintaining high accuracy even under stricter criteria.
3.3. Architecture of the Proposed YOLO-SSOD
The proposed YOLO-SSOD has its baseline as the YOLOv10 [10] architecture. The YOLOv10 is an evolution of YOLOv8 and was proposed to optimize the YOLO parameter utilization and efficiency, reducing the computational redundancy in YOLO’s architecture. Beyond all the optimization for efficiency and accuracy improvement under low cost, the YOLOv10 also presents an NMS-free (non-maximum suppression-free) post-processing, reducing the problem of redundancy predictions. The full architecture is presented in Figure 2.
YOLO-SSOD is proposed to tackle the small ship detection task. To achieve this, an attention mechanism called BRA (Bi-level Routing Attention) is incorporated among backbone and neck layers, fusing different feature maps trying to improve object detection performance at multiple scales. This is similar to the approach used in BGF-YOLO [49]. The feature fusion layer in YOLOv8 and YOLOv10 inserts redundant information from different feature maps, and this can be solved using the BRA attention module for feature fusion to avoid redundant information across feature maps. The overall architecture of YOLO-SSOD can be found in Figure 3.
The choice for inclusion of BRA in those layers is based on various tests, and all details and comparative performance can be found in SubSection 4.3.
3.3.1. Bi-level Routing Attention—BRA
The Bi-level Routing Attention [37] was introduced as an attention module in the BiFormer model. BRA is a dynamic, query-aware, sparse attention mechanism where the main goal is for each query to attend to a small portion of the most semantically relevant key-value pairs. The BRA idea is to filter out irrelevant key-value pairs and, only in a small portion of remaining regions, apply fine-grained token-to-token attention in the union of these regions. The first step for BRA is 1. Region partition and input projection, where the 2D input feature map is divided into non-overlapped regions. The query, key, and value tensor are derived with linear projections. A two-dimensional feature map, is divided in non-overlaping regions, each including feature vectors. This way X turn , and obtain the query, key, and value tensor, respectively Q, K, and , by linear projections
where , , and are projections weights for the query, key, and value, respectively. The second step is 2. Region-to-region routing with directed graph, where queries and keys are derived at the region level in this phase, and one affinity metric is used to define how much two regions are semantically related. Being specific, region-level queries and keys are derived, , , via applying per-region average on Q and K, repectively. An adjacency matrix, is derived of region-to-region affinity graph via
The adjacency matrix measures how much two regions are semantically related. After that, the main point is to prune the affinity graph by keeping only top-k connections for each region. A routing index matrix, is derived with the row-wise top-k operator
The row of contains k indices of the most relevant regions for the region. Then, the third step is 3. Token-to-token attention, where fine-grained token-to-token attention is applied using matrix . The key and value tensors are first gathered, then attention is applied to the gathered key-value pairs
where , , and term is a local context enhancement term.
The BRA module can be a good choice for small targets and dense occlusion in object detection tasks [44]. For remote sensing images like SAR ship images in the dataset used in this work, dense small objects can be grouped in some specific areas, and BRA can be used to improve the overall detection accuracy [41]. In [37], some results indicate that BRA can preserve fine-grained details, which are crucial for small objects. Complex backgrounds and severe noise are common in remote sensing images; see Figure 1 for example. The attention mechanism enhances the object detection precision, and the BRA mechanism significantly improves the precision of detecting small objects [40].
The BRA position in YOLO architecture can impact small object detection performance differently. It can be added during upsampling, before downsampling, and before feature fusion. In all scenarios, the small object detection is improved even with different key information from features [40]. The BRA attention mechanism enhances feature representation through the global attention level to capture the overall structure and global semantic information and through the local attention level to capture details and local features. The performance of image classification tasks can be improved by capturing structural and detailed features of images [50].
4. Results and Discussions
This section presents the results obtained from training the model proposed called YOLO-SSOD using the SAR Ship Dataset presented in subSection 3.1. We trained different models with different layer combinations using only YOLOv10 as the baseline model. Both YOLOv10n and YOLO-SSOD were trained from scratch without any pre-trained model. In this section, only one of the model variants is presented since it achieved the best performance and is considered the start of the art until now.
4.1. Environmental Setup
All models tested and presented in this work were trained and analyzed in a machine with Windows 10 Education OS, AMD Ryzen 9 7950X 16-core processor 4.5 Ghz, 64GB RAM, 2TB storage, and NVIDIA GeForce RTX4090 GPU with 24GB graphic memory. For training, we use 500 epochs with patience, defined as 100 epochs, batch 16, and 2 workers. Python was used as the programming language for every job, since dataset manipulation, random image choosing, dataset division in training, validation, testing subset, training model, and prediction.
4.2. Performance Evaluation on SAR Ship Dataset
Table 1 compares the baseline YOLOv10n and the proposed YOLO-SSOD model, both trained on the SAR Ship dataset. The YOLO-SSOD model, which incorporates additional layers through the integration of the BRA module within the backbone and neck layers (see Figure 3), achieved a superior mAP@0.5 of 97.70% compared to 97.36% for YOLOv10n. This improvement in detection performance is accompanied by an increase in model complexity, as evidenced by the additional layers (413 versus 385) and higher computational load (9.2 GFLOPS versus 8.4 GFLOPS). However, despite the increased complexity, the proposed YOLO-SSOD maintains a competitive inference speed, operating at 434 FPS compared to 769 FPS for the original YOLOv10n. These results indicate that while YOLO-SSOD sacrifices some speed, the gains in detection accuracy—particularly in challenging SAR imagery—demonstrate a favorable trade-off for applications where precision is paramount.
Table 2 summarizes the performance of various models on the SAR Ship dataset, as reported by multiple authors since the dataset’s release in 2019. The models listed in the table, ranging from earlier works to more recent methods up to 2022, were originally grouped in [51]. In addition, four very recent models have been incorporated into the comparison to provide a fair assessment alongside the latest technologies and baseline methods.
The table includes key evaluation metrics such as Precision, Recall, mAP@0.5, and mAP@0.5:0.95, as well as details on each study’s data splits (Train/Val/Test). Note that earlier works did not report Precision and Recall, and many only provided mAP@0.5. The mAP@0.5:0.95 metric is available only for the models trained in our work and by [23]. Due to these unbalanced metrics across studies, the mAP@0.5 is used as the primary standard for comparison.
Our experiments with YOLOv10n and the proposed YOLO-SSOD model were conducted under the same environmental conditions. The results indicate that YOLO-SSOD outperformed the original YOLOv10n on the mAP@0.5 metric. When comparing YOLO-SSOD with [23], the two models showed similar mAP@0.5 performance, although YOLO-SSOD achieved slightly better Precision and Recall. One key difference lies in the training data allocation: YOLO-SSOD was originally trained using 70% of the dataset for training, whereas [23] used 80%. To ensure a fair comparison, we retrained YOLO-SSOD with an 80%-20% training-test split, which resulted in further improved performance, making YOLO-SSOD the best-performing model among those using both 70% and 80% training splits. Models marked with an asterisk (*) in Table 2 did not specify their data division strategy, so we assume they followed the original division of the SAR Ship dataset. Overall, this comprehensive comparison highlights the competitive performance of YOLO-SSOD in the context of SAR ship detection, with its improved precision and recall, while maintaining high mAP@0.5 values comparable to the most recent models.
Figure 4 illustrates the evolution of the mAP@0.5 metric during the training process, spanning from epoch 20 to epoch 500, for both the baseline YOLOv10n model and the proposed YOLO-SSOD model. Initially, both models exhibit comparable performance with closely aligned mAP@0.5 values. However, during the final 60 epochs, YOLO-SSOD demonstrates a notable increase in its mAP@0.5, reflecting a significant performance boost as training converges. This late-stage improvement indicates that integrating the BRA module in YOLO-SSOD effectively enhances feature extraction and the learning of fine-grained details, particularly benefiting the detection of small objects in SAR imagery.
Figure 5 presents three predictions using both models and the comparison with the ground truth bounding box. In this example, it is possible to note the best score for bounding box predictions and the best detection performance of YOLO-SSOD.
4.3. Ablation Study of the Proposed YOLO-SSOD
This section presents an in-depth ablation study of the YOLO-SSOD model, analyzing various configurations, their performance, and the corresponding trade-offs. The ablation study provides insights into selecting the optimal model configuration and explores alternative setups that are effective for small object detection.
4.3.1. Ablation Study on BRA Positioning in YOLO-SSOD
As discussed in SubSection 3.3.1, the placement of the BRA module within the YOLO architecture can significantly affect both performance and model complexity. In this study, we systematically investigate different insertion points for the BRA module within the YOLOv10n architecture. For this purpose, we employed a subset of the original SAR Ship dataset, consisting of 2856 images for training, 814 images for validation, and 410 images for testing. Using this reduced dataset accelerated the experimentation process while still providing sufficient data to evaluate the impact of different BRA positioning strategies.
Table 3 summarizes the performance of different BRA insertion strategies within the YOLOv10n-based architecture on the SAR Ship dataset. The results indicate that using fusion modules spanning from layers 2 to 19 combined with fusion from layers 4 to 14 yields the highest performance, achieving a Precision of 0.948, mAP@0.5 of 0.975, and mAP@0.5-0.95 of 0.690—substantially outperforming the baseline YOLOv10n model. Notably, the fusion from layer 4 to 14 configuration alone provided the best Recall value at 0.946. Figure 3 illustrates the final YOLO-SSOD architecture derived from these results. Retraining the model with the optimized BRA positioning on the full SAR Ship dataset confirmed the performance improvements observed in this ablation study, as shown in Table 2. Furthermore, inserting only two BRA modules was sufficient for YOLO-SSOD to surpass the original YOLOv10n; in contrast, the configuration with the BRA insertion in Layer 9 post C2f module alone achieved performance comparable to YOLOv10n, with only marginal improvements in Precision, Recall, and mAP@0.5-0.95.
4.3.2. Ablation Study on the Small Object Detection Layer Applied to YOLOv10n
To address the challenges associated with detecting small objects, several studies [59,60,61] have incorporated an additional detection head into the YOLO architecture, each targeting small objects in different contexts—such as fish, vehicles, and fruits. Similarly, in [44], the authors introduced a fourth detection head, the Tiny Object Detection Layer (TODL), to improve the detection of small faces in classroom environments. These works primarily utilize YOLOv5 and YOLOv8, which originally included three detection heads. In contrast, our approach adapts the concept for YOLOv10 by adding new upsample and downsample modules that enlarge the feature map before the first detection head by a factor of 2.
The SAR Ship dataset presents significant challenges due to the prevalence of small ships amidst complex backgrounds. We integrated the TODL concept into the YOLOv10 architecture to better capture these small targets. Figure 6 illustrates the modified architecture, which includes additional layers (layers 17 to 21). Specifically, the upsampling module in layer 17 doubles the feature map size to , while the convolutional module in layer 20 reduces it back to , aligning with the original scale. A new detection module, V10Detect, is incorporated as a detection head in layer 19. This configuration is designed to improve the detection of small objects by processing them at a higher resolution.
SubSection 4.3.3 further details the performance evaluation of the TODL-enhanced YOLOv10n, including experiments that combine the TODL with BRA modules at various layers. The combined use of BRA and TODL aims to synergize the benefits of both methods, enhancing feature representation and small object detection capabilities in the challenging SAR ship detection task.
4.3.3. Ablation Study on TODL and BRA Applied to YOLOv10n
To further enhance the detection of small objects in the SAR ship context, we conducted an ablation study to evaluate the combined effects of the Tiny Object Detection Layer (TODL) and the BRA module in the YOLOv10n framework. Using the YOLOv10n architecture augmented with the TODL layer (as depicted in Figure 6), we inserted the BRA module at various positions and trained the models from scratch under the same dataset and environmental configurations. A similar experimental approach was undertaken in [44] in a classroom setting, where the combination of BRA and TODL yielded the best performance compared to using only BRA or TODL.
Table 4 reports the performance metrics for different BRA insertion strategies when combined with TODL. For the subset of the SAR Ship dataset used in these experiments, the baseline YOLOv10n achieved a mAP@0.5 of 0.972, while the model with only TODL reached 0.974. In contrast, configurations with various BRA insertions showed mixed results: for example, the fusion configuration spanning layers 4 to 14 achieved the highest Recall (0.948), while the configuration combining fusion from layers 2 to 19 with fusion from layer 4 to 14 yielded a slightly lower mAP@0.5 of 0.968.
To facilitate a fair comparison, we retrained the models on the entire SAR Ship dataset, with the summarized results presented in Table 5 and Table 6. When trained on the smaller subset, the best performance was obtained with the model using only TODL (mAP@0.5 = 0.974) or using only the BRA configuration (Fusion layers 2 to 19 + Fusion layers 4 to 14) with a mAP@0.5 of 0.975. In the full-dataset scenario, the baseline YOLOv10n achieved a mAP@0.5 of 0.9736, while the model with only TODL slightly improved this metric to 0.9769. The best performance was observed with the BRA-only configuration (Fusion layers 2 to 19 + Fusion layers 4 to 14), which achieved a mAP@0.5 of 0.9770.
Overall, these results indicate that while both TODL and BRA independently contribute to improved small object detection in SAR images, combining them does not necessarily yield further enhancements and, in some cases, may even introduce distortions that adversely affect the detection of very small ships. In our experiments, the optimal configuration was achieved by inserting the BRA module in the feature fusion layers spanning from layer 2 to 19 and from layer 4 to 14, which resulted in an improvement in mAP@0.5 from 97.36% (baseline) to 97.70%. Figure 7 provides visual examples demonstrating instances where the optimized YOLO-SSOD outperforms the baseline and the TODL-only configuration.
5. Conclusions
In this work, we proposed the YOLO-SSOD model, an enhanced YOLOv10n-based architecture tailored for SAR ship detection. Our model demonstrated improved feature extraction by incorporating the Bi-Level Routing Attention (BRA) mechanism within the backbone and neck layers, particularly for small and complex ship targets in SAR imagery. The experimental results confirmed the efficacy of our approach, with YOLO-SSOD achieving a mAP of 97.70%, outperforming the original YOLOv10n model on the SAR Ship Dataset. Moreover, YOLO-SSOD set a new benchmark, surpassing previously proposed models over the last five years.
Despite its improved accuracy, YOLO-SSOD incurs a slight increase in computational complexity due to additional layers introduced by the BRA module. However, the significant performance gains observed in maritime surveillance tasks justify this trade-off. These findings highlight the potential of integrating advanced attention mechanisms into YOLO-based models to enhance detection capabilities in challenging remote sensing applications.
Future work will explore optimizing the model’s computational efficiency to reduce inference time without compromising detection performance. Moreover, we will extend this approach to tracking scenarios and further evaluate YOLO-SSOD’s performance on additional datasets, including those with oriented bounding boxes and aerial images. This will help assess the model’s generalizability and adaptability to maritime monitoring conditions. Investigating YOLO-SSOD’s applicability to real-time ship monitoring systems will also be a valuable next step. The results of this research contribute to the advancement of SAR-based maritime surveillance and provide a solid foundation for further improvements in deep learning-based ship detection methodologies.
Author Contributions
Conceptualization, R.d.L.R. and F.A.P.d.F.; methodology, R.d.L.R. and F.A.P.d.F.; validation, R.d.L.R. and F.A.P.d.F.; formal analysis, F.A.P.d.F.; writing—original draft preparation, R.d.L.R.; writing—review and editing, R.d.L.R. and F.A.P.d.F.; supervision, F.A.P.d.F.; project administration, F.A.P.d.F.; funding acquisition, F.A.P.d.F. All authors have read and agreed to the published version of the manuscript.
Funding
This work was partially funded by CNPq (Grant Nos. 403612/2020-9, 311470/2021-1, and 403827/2021-3), by Minas Gerais Research Foundation (FAPEMIG) (Grant Nos. PPE-00124-23, APQ-04523-23, APQ-05305-23, and APQ-03162-24) and by the projects XGM-AFCCT-2024-2-5-1 and XGM-AFCCT-2024-9-1-1 supported by xGMobile - EMBRAPII-Inatel Competence Center on 5G and 6G Networks, with financial resources from the PPI IoT/Manufatura 4.0 from MCTI grant number 052/2023, signed with EMBRAPII.
Acknowledgments
In this section you can acknowledge any support given which is not covered by the author contribution or funding sections. This may include administrative and technical support, or donations in kind (e.g., materials used for experiments).
Conflicts of Interest
The authors declare that the research was conducted in the absence of any commercial or financial relationships that could be construed as a potential conflict of interest.
References
- Milios, A.; Bereta, K.; Chatzikokolakis, K.; Zissis, D.; Matwin, S. Automatic Fusion of Satellite Imagery and AIS data for Vessel Detection. In Proceedings of the 2019 22th International Conference on Information Fusion (FUSION); 2019; pp. 1–5. [Google Scholar] [CrossRef]
- Yasir, M.; Liu, S.; Mingming, X.; Wan, J.; Pirasteh, S.; Dang, K.B. ShipGeoNet: SAR Image-Based Geometric Feature Extraction of Ships Using Convolutional Neural Networks. IEEE Trans. Geosci. Remote Sens. 2024, 62, 1–13. [Google Scholar] [CrossRef]
- Yasir, M.; Shanwei, L.; Mingming, X.; Jianhua, W.; Nazir, S.; Islam, Q.U.; Dang, K.B. SwinYOLOv7: Robust ship detection in complex synthetic aperture radar images. Appl. Soft Comput. 2024, 160, 111704. [Google Scholar] [CrossRef]
- Galdelli, A.; Mancini, A.; Ferrà, C.; Tassetti, A.N. A Synergic Integration of AIS Data and SAR Imagery to Monitor Fisheries and Detect Suspicious Activities. Sensors 2021, 21. [Google Scholar] [CrossRef]
- Humayun, M.F.; Nasir, F.A.; Bhatti, F.A.; Tahir, M.; Khurshid, K. YOLO-OSD: Optimized Ship Detection and Localization in Multiresolution SAR Satellite Images Using a Hybrid Data-Model Centric Approach. IEEE J. Sel. Top. Appl. Earth Obs. Remote Sens. 2024, 17, 5345–5363. [Google Scholar] [CrossRef]
- Li, J.; Xu, C.; Su, H.; Gao, L.; Wang, T. Deep Learning for SAR Ship Detection: Past, Present and Future. Remote Sens. 2022, 14. [Google Scholar] [CrossRef]
- El-Darymli, K.; McGuire, P.; Power, D.; Moloney, C.R. Target detection in synthetic aperture radar imagery: A state-of-the-art survey. J. Appl. Remote Sens. 2013, 7, 071598. [Google Scholar] [CrossRef]
- Li, J.; Qu, C.; Shao, J. Ship detection in SAR images based on an improved faster R-CNN. In Proceedings of the 2017 SAR in Big Data Era: Models, Methods and Applications (BIGSARDATA). IEEE; 2017; pp. 1–6. [Google Scholar]
- Wang, Y.; Wang, C.; Zhang, H.; Dong, Y.; Wei, S. A SAR Dataset of Ship Detection for Deep Learning under Complex Backgrounds. Remote Sens. 2019, 11. [Google Scholar] [CrossRef]
- Wang, A.; Chen, H.; Liu, L.; Chen, K.; Lin, Z.; Han, J.; Ding, G. 2024; arXiv:YOLOv10: Real-Time End-to-End Object Detection, cs.CV/2405.14458].
- Redmon, J.; Divvala, S.; Girshick, R.; Farhadi, A. You Only Look Once: Unified, Real-Time Object Detection. In Proceedings of the 2016 IEEE Conference on Computer Vision and Pattern Recognition (CVPR); 2016; pp. 779–788. [Google Scholar] [CrossRef]
- Yi, H.; Liu, B.; Zhao, B.; Liu, E. Small Object Detection Algorithm Based on Improved YOLOv8 for Remote Sensing. IEEE J. Sel. Top. Appl. Earth Obs. Remote Sens. 2024, 17, 1734–1747. [Google Scholar] [CrossRef]
- Gao, Z.; Yu, X.; Rong, X.; Wang, W. Improved YOLOv8n for Lightweight Ship Detection. J. Mar. Sci. Eng. 2024, 12. [Google Scholar] [CrossRef]
- Li, Y.; Li, Q.; Pan, J.; Zhou, Y.; Zhu, H.; Wei, H.; Liu, C. SOD-YOLO: Small-Object-Detection Algorithm Based on Improved YOLOv8 for UAV Images. Remote Sens. 2024, 16. [Google Scholar] [CrossRef]
- Shen, L.; Lang, B.; Song, Z. DS-YOLOv8-Based Object Detection Method for Remote Sensing Images. IEEE Access 2023, 11, 125122–125137. [Google Scholar] [CrossRef]
- Song, Y.; Tang, L.; He, G. LW-SARDet: A Lightweight SAR Ship Detector via Decomposed Convolution. IEEE Geosci. Remote Sens. Lett. 2024, 21, 1–5. [Google Scholar] [CrossRef]
- Hong, Z.; Yang, T.; Tong, X.; Zhang, Y.; Jiang, S.; Zhou, R.; Han, Y.; Wang, J.; Yang, S.; Liu, S. Multi-Scale Ship Detection From SAR and Optical Imagery Via A More Accurate YOLOv3. IEEE J. Sel. Top. Appl. Earth Obs. Remote Sens. 2021, 14, 6083–6101. [Google Scholar] [CrossRef]
- Xu, P.; Li, Q.; Zhang, B.; Wu, F.; Zhao, K.; Du, X.; Yang, C.; Zhong, R. On-Board Real-Time Ship Detection in HISEA-1 SAR Images Based on CFAR and Lightweight Deep Learning. Remote Sens. 2021, 13. [Google Scholar] [CrossRef]
- Zhou, K.; Zhang, M.; Wang, H.; Tan, J. Ship Detection in SAR Images Based on Multi-Scale Feature Extraction and Adaptive Feature Fusion. Remote Sens. 2022, 14. [Google Scholar] [CrossRef]
- Li, X.; Yang, W.; Jiang, Y.; Guan, S.; Zhang, Y. Research on SAR Image Ship Target Detection Algorithm with Improved YOLOv7. In Proceedings of the 2024 2nd International Conference on Signal Processing and Intelligent Computing (SPIC); 2024; pp. 443–448. [Google Scholar] [CrossRef]
- Shao, R.; Pan, X.; Ding, D.; Yang, L.; Han, M.; Huang, Z. Small Ship Detection Method of SAR Images Using Lightweight Feature-fused Enhancement Learning. In Proceedings of the 2024 IEEE International Conference on Computational Electromagnetics (ICCEM); 2024; pp. 1–3. [Google Scholar] [CrossRef]
- Haochen Wang, Juan Shi, H. K.F.L.; Wang, F. YOLOSAR-Lite: a lightweight framework for real-time ship detection in SAR imagery. Int. J. Digit. Earth 2024, 17, 2405525. [Google Scholar] [CrossRef]
- Xu, Y.; Du, W.; Deng, L.; Zhang, Y.; Wen, W. Ship target detection in SAR images based on SimAM attention YOLOv8. IET Commun. 2024. [Google Scholar] [CrossRef]
- Huang, Y.; Wang, D.; Huang, W.; An, D. A ViT Merged Oriented-Detector with Neuron Attention for Ship Detection in SAR Images. In Proceedings of the 2024 IEEE 7th International Conference on Electronic Information and Communication Technology (ICEICT); 2024; pp. 85–90. [Google Scholar] [CrossRef]
- Zhang, Y.; Dong, C.; Guo, L.; Meng, X.; Liu, Y.; Wei, Q. AFMSFFNet: An Anchor-Free-Based Feature Fusion Model for Ship Detection. Remote Sens. 2024, 16. [Google Scholar] [CrossRef]
- Yu, J.; Zhou, G.; Zhou, S.; Qin, M. A Fast and Lightweight Detection Network for Multi-Scale SAR Ship Detection under Complex Backgrounds. Remote Sens. 2022, 14. [Google Scholar] [CrossRef]
- Zhang, G.; Li, Z.; Li, X.; Yin, C.; Shi, Z. A Novel Salient Feature Fusion Method for Ship Detection in Synthetic Aperture Radar Images. IEEE Access 2020, 8, 215904–215914. [Google Scholar] [CrossRef]
- Lin, H.; Liu, J.; Li, X.; Wei, L.; Liu, Y.; Han, B.; Wu, Z. DCEA: DETR With Concentrated Deformable Attention for End-to-End Ship Detection in SAR Images. IEEE J. Sel. Top. Appl. Earth Obs. Remote Sens. 2024, 17, 17292–17307. [Google Scholar] [CrossRef]
- Wang, X.; Cui, Z.; Cao, Z.; Dang, S. Dense Docked Ship Detection via Spatial Group-Wise Enhance Attention in SAR Images. In Proceedings of the IGARSS 2020 - 2020 IEEE International Geoscience and Remote Sensing Symposium; 2020; pp. 1244–1247. [Google Scholar] [CrossRef]
- Li, S.; Fu, X.; Dong, J. Improved Ship Detection Algorithm Based on YOLOX for SAR Outline Enhancement Image. Remote Sensing 2022, 14. [Google Scholar] [CrossRef]
- Vaswani, A.; Shazeer, N.; Parmar, N.; Uszkoreit, J.; Jones, L.; Gomez, A.N.; Kaiser, L.u.; Polosukhin, I. Attention is All you Need. In Proceedings of the Advances in Neural Information Processing Systems; Guyon, I.; Luxburg, U.V.; Bengio, S.; Wallach, H.; Fergus, R.; Vishwanathan, S.; Garnett, R., Eds. Curran Associates, Inc., Vol. 30. 2017. [Google Scholar]
- Gong, H.; Mu, T.; Li, Q.; Dai, H.; Li, C.; He, Z.; Wang, W.; Han, F.; Tuniyazi, A.; Li, H.; et al. Swin-Transformer-Enabled YOLOv5 with Attention Mechanism for Small Object Detection on Satellite Images. Remote Sens. 2022, 14. [Google Scholar] [CrossRef]
- Chen, X.; Wei, C.; Xin, Z.; Zhao, J.; Xian, J. Ship Detection under Low-Visibility Weather Interference via an Ensemble Generative Adversarial Network. J. Mar. Sci. Eng. 2023, 11. [Google Scholar] [CrossRef]
- Chen, L.; Shi, W.; Deng, D. Improved YOLOv3 Based on Attention Mechanism for Fast and Accurate Ship Detection in Optical Remote Sensing Images. Remote Sens. 2021, 13. [Google Scholar] [CrossRef]
- Xu, K.; Ba, J.; Kiros, R.; Cho, K.; Courville, A.C.; Salakhutdinov, R.; Zemel, R.S.; Bengio, Y. Show, Attend and Tell: Neural Image Caption Generation with Visual Attention. CoRR, 2015, abs/1502.03044, [1502.03044]. [Google Scholar]
- Carion, N.; Massa, F.; Synnaeve, G.; Usunier, N.; Kirillov, A.; Zagoruyko, S. End-to-End Object Detection with Transformers. In Proceedings of the Computer Vision – ECCV 2020; Vedaldi, A.; Bischof, H.; Brox, T.; Frahm, J.M., Eds., Cham; 2020; pp. 213–229. [Google Scholar]
- Zhu, L.; Wang, X.; Ke, Z.; Zhang, W.; Lau, R.W. Biformer: Vision transformer with bi-level routing attention. In Proceedings of the IEEE/CVF conference on computer vision and pattern recognition; 2023; pp. 10323–10333. [Google Scholar]
- Xie, Z.; Fu, M.; Liu, X. Detection of Fittings Based on the Dynamic Graph CNN and U-Net Embedded with Bi-Level Routing Attention. Electronics 2023, 12. [Google Scholar] [CrossRef]
- He, B.; Chen, Y.; Zhu, D.; Xu, Z. Domain adaptation via Wasserstein distance and discrepancy metric for chest X-ray image classification. Sci. Rep. 2024, 14, 2690. [Google Scholar] [CrossRef]
- Yao, G.; Zhu, S.; Zhang, L.; Qi, M. HP-YOLOv8: High-Precision Small Object Detection Algorithm for Remote Sensing Images. Sensors 2024, 24. [Google Scholar] [CrossRef]
- Jin, X.; Tong, A.; Ge, X.; Ma, H.; Li, J.; Fu, H.; Gao, L. YOLOv7-Bw: A Dense Small Object Efficient Detector Based on Remote Sensing Image. IECE Trans. Intell. Syst. 2024, 1, 30–39. [Google Scholar] [CrossRef]
- Li, J.; Feng, Y.; Shao, Y.; Liu, F. IDP-YOLOV9: Improvement of Object Detection Model in Severe Weather Scenarios from Drone Perspective. Appl. Sci. 2024, 14. [Google Scholar] [CrossRef]
- Li, J.; Xie, C.; Wu, S.; Ren, Y. UAV-YOLOv5: A Swin-Transformer-Enabled Small Object Detection Model for Long-Range UAV Images. Ann. Data Sci. 2024, pp. 1–30.
- Liu, Q.; Jiang, R.; Xu, Q.; Wang, D.; Sang, Z.; Jiang, X.; Wu, L. YOLOv8n_BT: Research on Classroom Learning Behavior Recognition Algorithm Based on Improved YOLOv8n. IEEE Access 2024, 12, 36391–36403. [Google Scholar] [CrossRef]
- Yasir, M.; Liu, S.; Pirasteh, S.; Xu, M.; Sheng, H.; Wan, J.; de Figueiredo, F.A.; Aguilar, F.J.; Li, J. YOLOShipTracker: Tracking ships in SAR images using lightweight YOLOv8. Int. J. Appl. Earth Obs. Geoinf. 2024, 134, 104137. [Google Scholar] [CrossRef]
- Yasir, M.; Shanwei, L.; Mingming, X.; Hui, S.; Hossain, M.S.; Colak, A.T.I.; Wang, D.; Jianhua, W.; Dang, K.B. Multi-scale ship target detection using SAR images based on improved Yolov5. Front. Mar. Sci. 2023, 9, 1086140. [Google Scholar] [CrossRef]
- Teixeira, E.; Araujo, B.; Costa, V.; Mafra, S.; Figueiredo, F. Literature review on ship localization, classification, and detection methods based on optical sensors and neural networks. Sensors 2022, 22, 6879. [Google Scholar] [CrossRef] [PubMed]
- Rocha, R.d.L.; de Figueiredo, F.A. Beyond Land: A Review of Benchmarking Datasets, Algorithms, and Metrics for Visual-Based Ship Tracking. Electronics 2023, 12, 2789. [Google Scholar] [CrossRef]
- Kang, M.; Ting, C.M.; Ting, F.F.; Phan, R.C.W. BGF-YOLO: enhanced YOLOv8 with multiscale attentional feature fusion for brain tumor detection. In Proceedings of the Medical Image Computing and Computer-Assisted Intervention – MICCAI 2024: 27th International Conference, Marrakesh, Morocco, 2024, Proceedings, Part VIII; Linguraru, M.G.; et al.., Eds., Cham, 2024; Vol. 15008, Lecture Notes in Computer Science (LNCS), October 6–10; pp. 35–45. [CrossRef]
- Qu, Y.; Wang, C.; Xiao, Y.; Yu, J.; Chen, X.; Kong, Y. Optimization Algorithm for Surface Defect Detection of Aircraft Engine Components Based on YOLOv5. Appl. Sci. 2023, 13. [Google Scholar] [CrossRef]
- Li, J.; Xu, C.; Su, H.; Gao, L.; Wang, T. Deep Learning for SAR Ship Detection: Past, Present and Future. Remote Sens. 2022, 14. [Google Scholar] [CrossRef]
- Cui, Z.; Wang, X.; Liu, N.; Cao, Z.; Yang, J. Ship Detection in Large-Scale SAR Images Via Spatial Shuffle-Group Enhance Attention. IEEE Trans. Geosci. Remote Sens. 2021, 59, 379–391. [Google Scholar] [CrossRef]
- Chen, Y.; Yu, J.; Xu, Y. SAR Ship Target Detection for SSDv2 under Complex Backgrounds. In Proceedings of the 2020 International Conference on Computer Vision, Image and Deep Learning (CVIDL); 2020; pp. 560–565. [Google Scholar] [CrossRef]
- Chaudhary, Y.; Mehta, M.; Goel, N.; Bhardwaj, P.; Gupta, D.; Khanna, A. YOLOv3 Remote Sensing SAR Ship Image Detection. In Proceedings of the Data Analytics and Management; Khanna, A.; Gupta, D.; Pólkowski, Z.; Bhattacharyya, S.; Castillo, O., Eds., Singapore; 2021; pp. 519–531. [Google Scholar]
- Zhu, C.; Zhao, D.; Liu, Z.; Mao, Y. Hierarchical Attention for Ship Detection in SAR Images. In Proceedings of the IGARSS 2020 - 2020 IEEE International Geoscience and Remote Sensing Symposium; 2020; pp. 2145–2148. [Google Scholar] [CrossRef]
- Wang, X.; Cui, Z.; Cao, Z.; Tian, Y. Ship Detection in Large Scale Sar Images Based on Bias Classification. In Proceedings of the IGARSS 2020 - 2020 IEEE International Geoscience and Remote Sensing Symposium; 2020; pp. 1263–1266. [Google Scholar] [CrossRef]
- Wu, Z.; Hou, B.; Ren, B.; Ren, Z.; Wang, S.; Jiao, L. A Deep Detection Network Based on Interaction of Instance Segmentation and Object Detection for SAR Images. Remote Sens. 2021, 13. [Google Scholar] [CrossRef]
- Dong, Y.; Zhang, H.; Wang, C.; Zhang, B.; Li, L. Ship Detection based on M2Det for SAR images under Heavy Sea State. In Proceedings of the EUSAR 2021; 2021, 13th European Conference on Synthetic Aperture Radar; pp. 1–4.
- Li, J.; Liu, C.; Lu, X.; Wu, B. CME-YOLOv5: An Efficient Object Detection Network for Densely Spaced Fish and Small Targets. Water 2022, 14. [Google Scholar] [CrossRef]
- Kim, M.; Jeong, J.; Kim, S. ECAP-YOLO: Efficient Channel Attention Pyramid YOLO for Small Object Detection in Aerial Image. Remote Sens. 2021, 13. [Google Scholar] [CrossRef]
- Yang, W.; Ma, X.; Hu, W.; Tang, P. Lightweight Blueberry Fruit Recognition Based on Multi-Scale and Attention Fusion NCBAM. Agronomy 2022, 12. [Google Scholar] [CrossRef]
Figure 1.
Examples of ship chips in the SAR Ship Dataset.
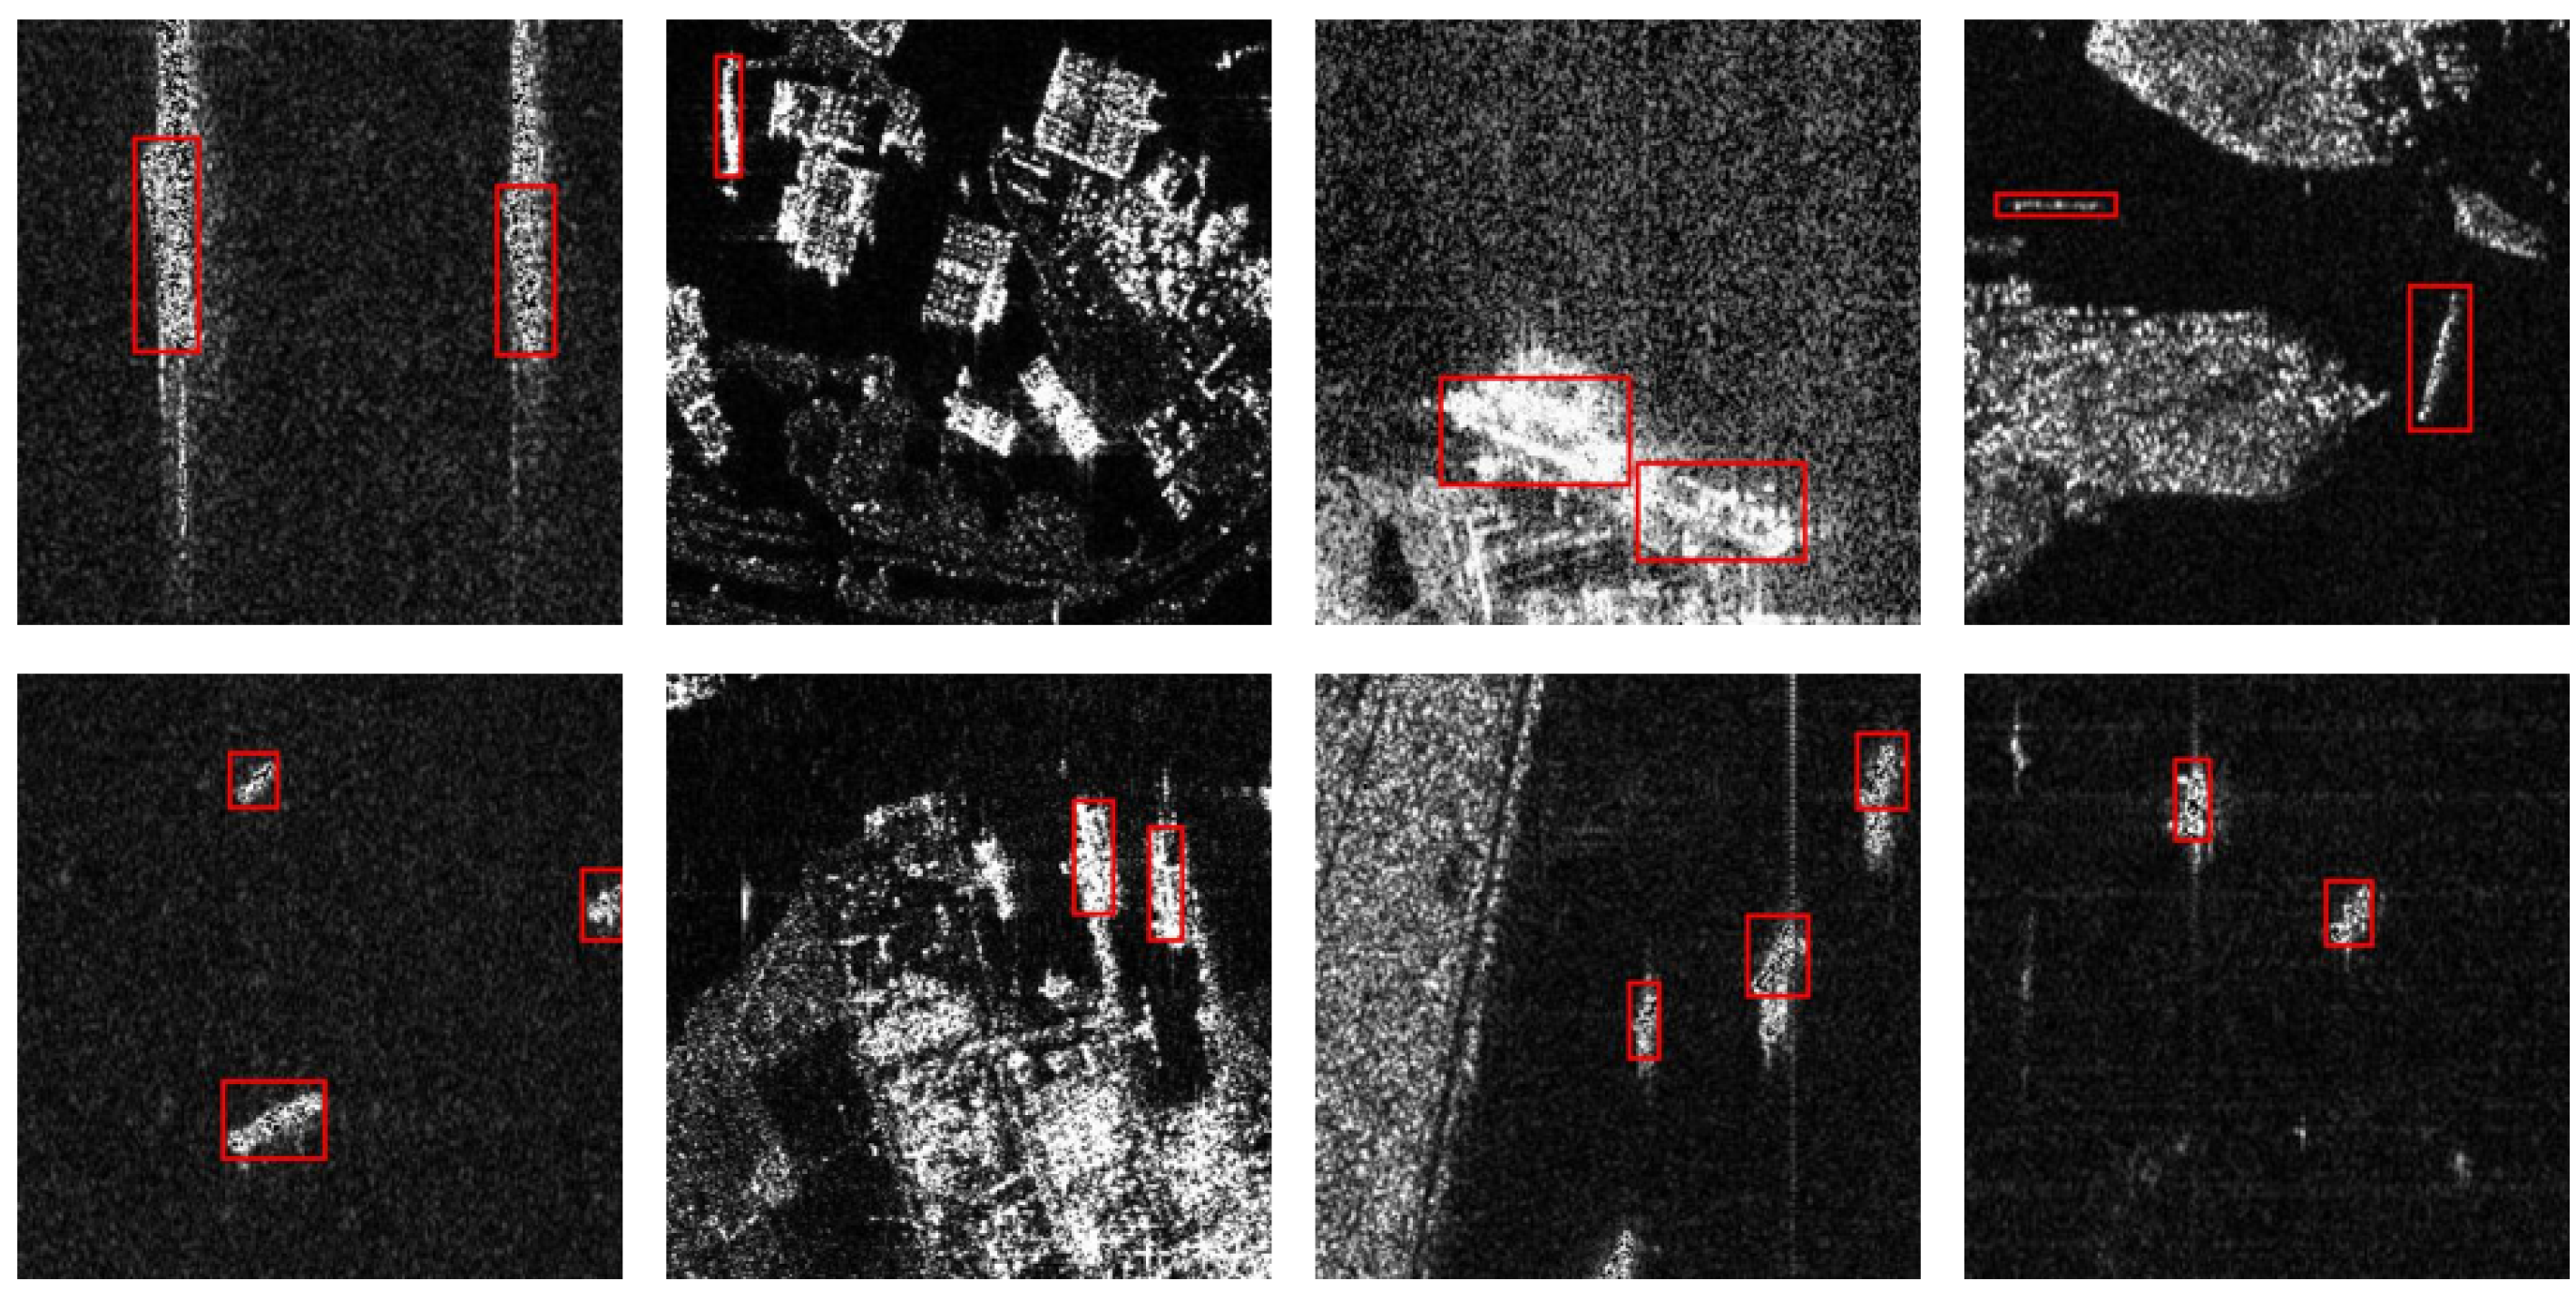
Figure 2.
YOLOv10n Architecture.
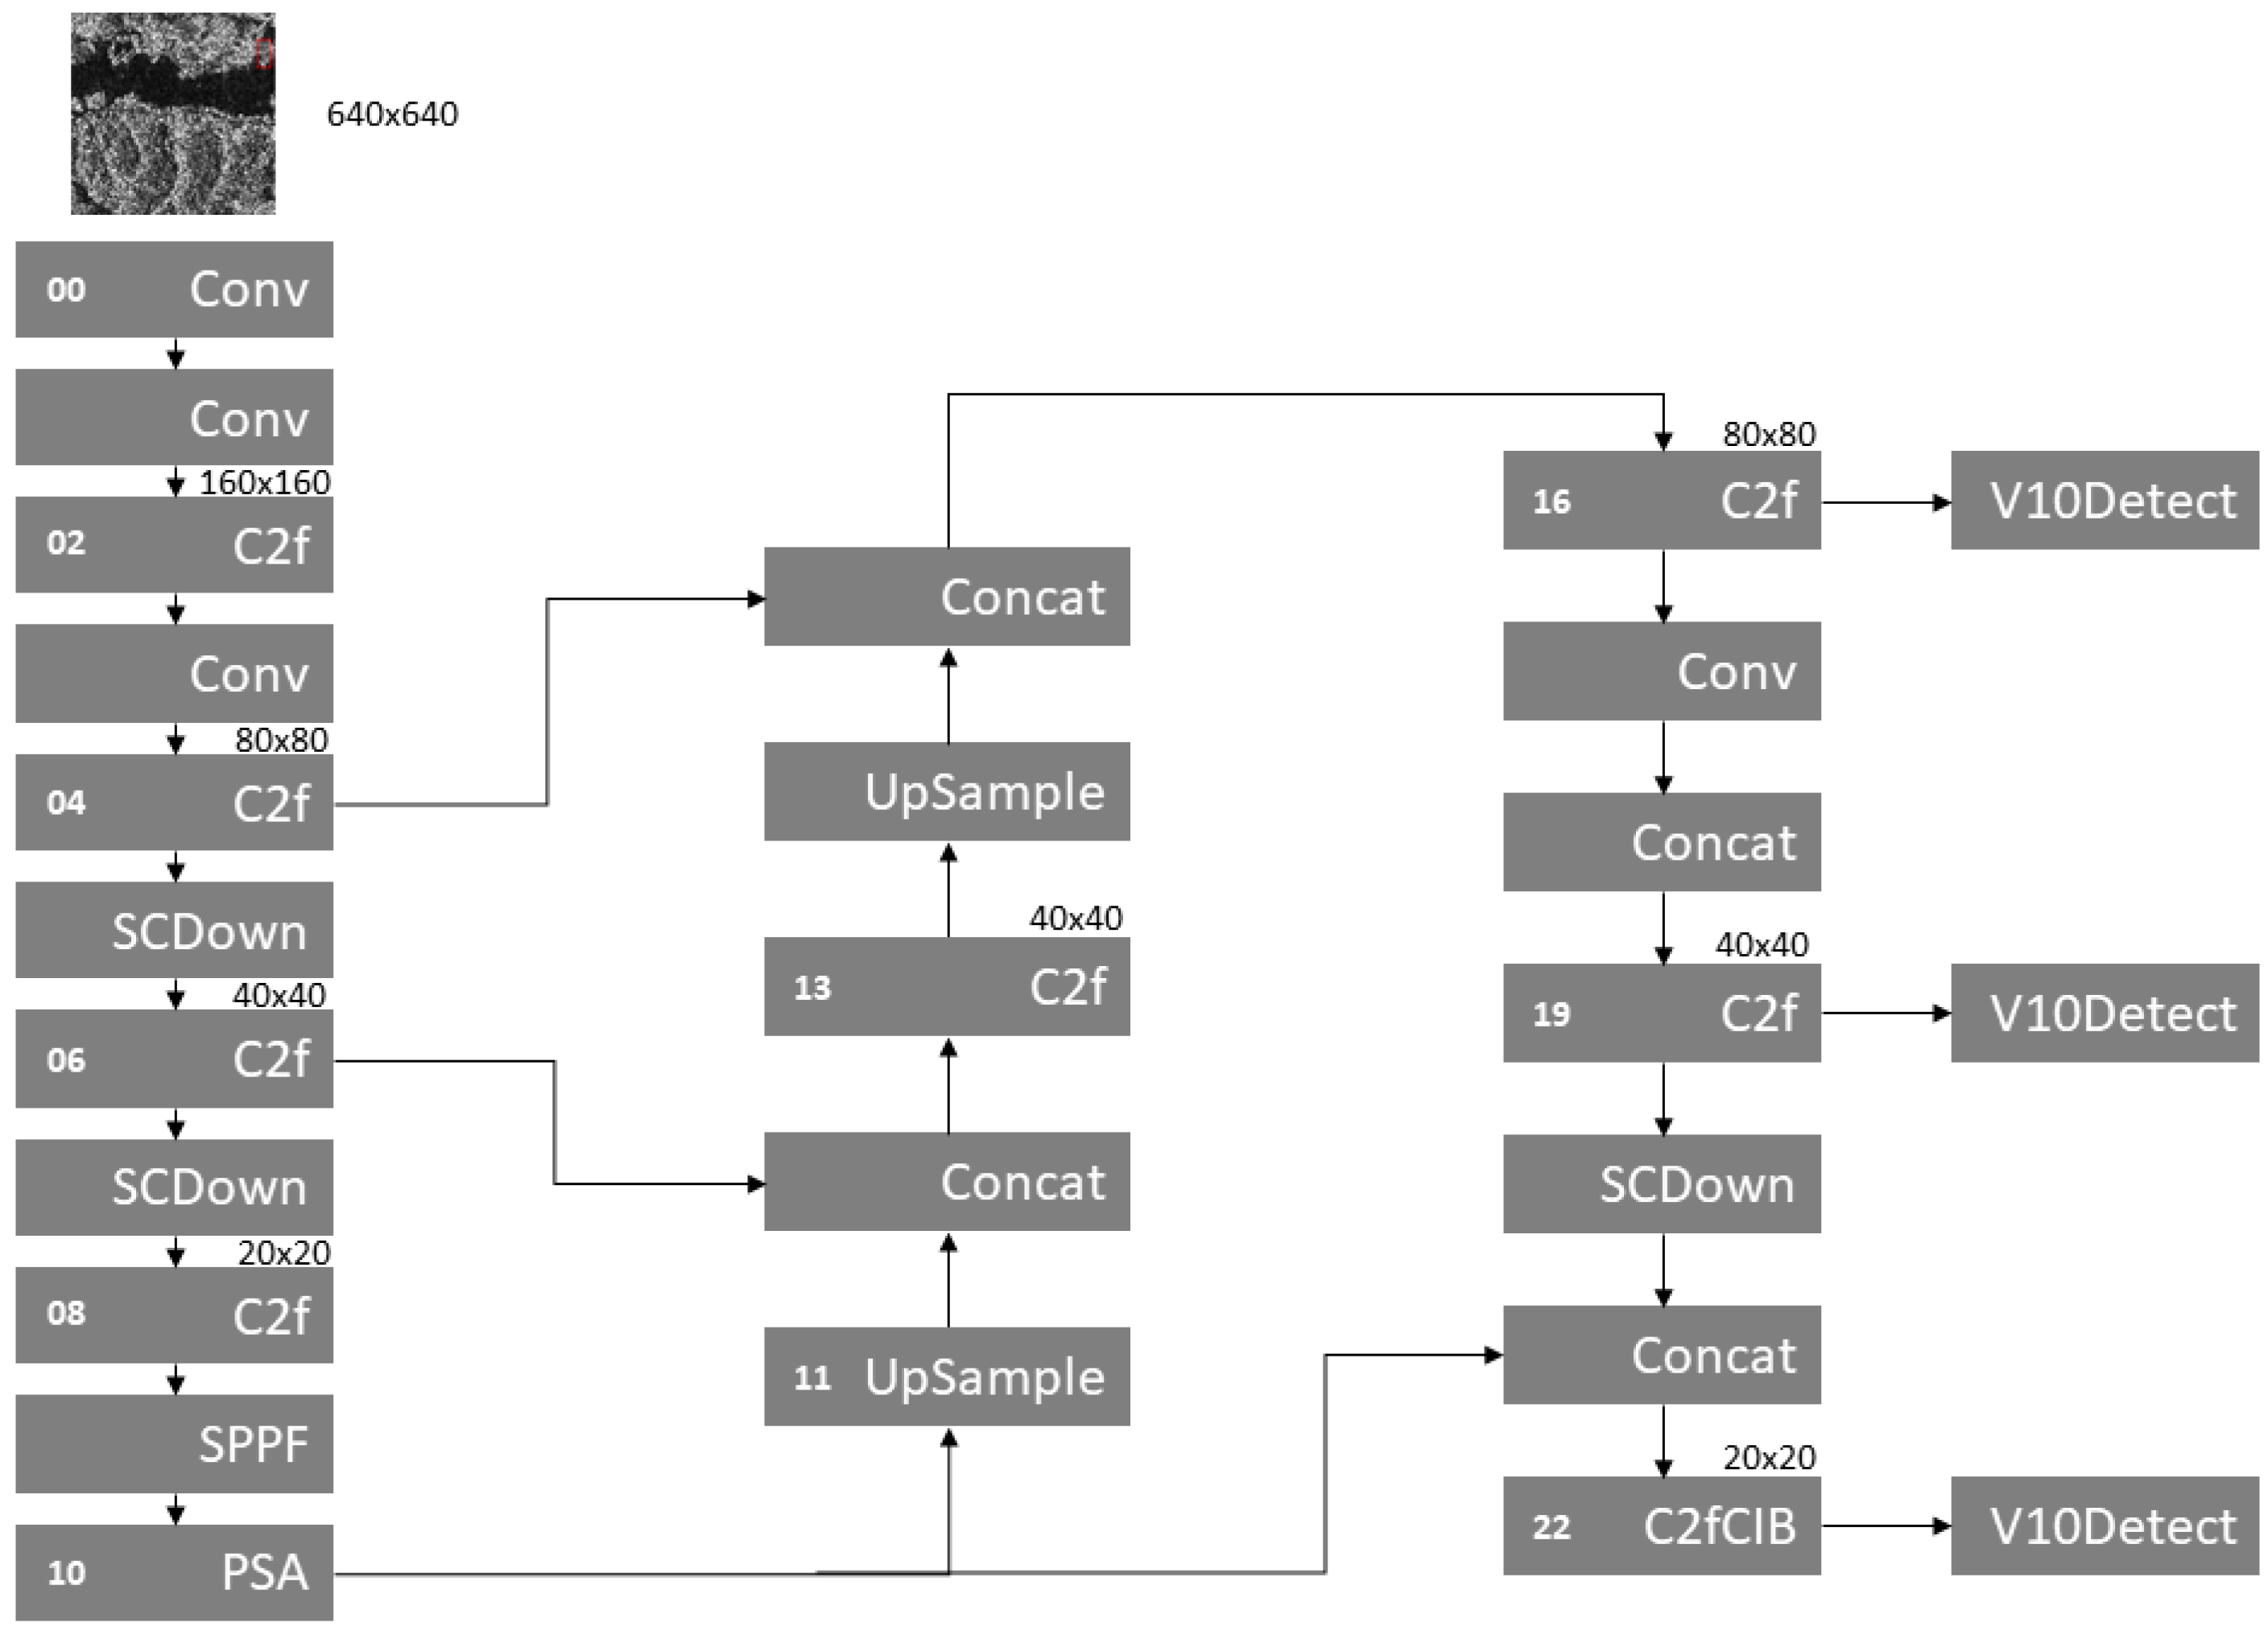
Figure 3.
YOLO-SSOD Architecture.
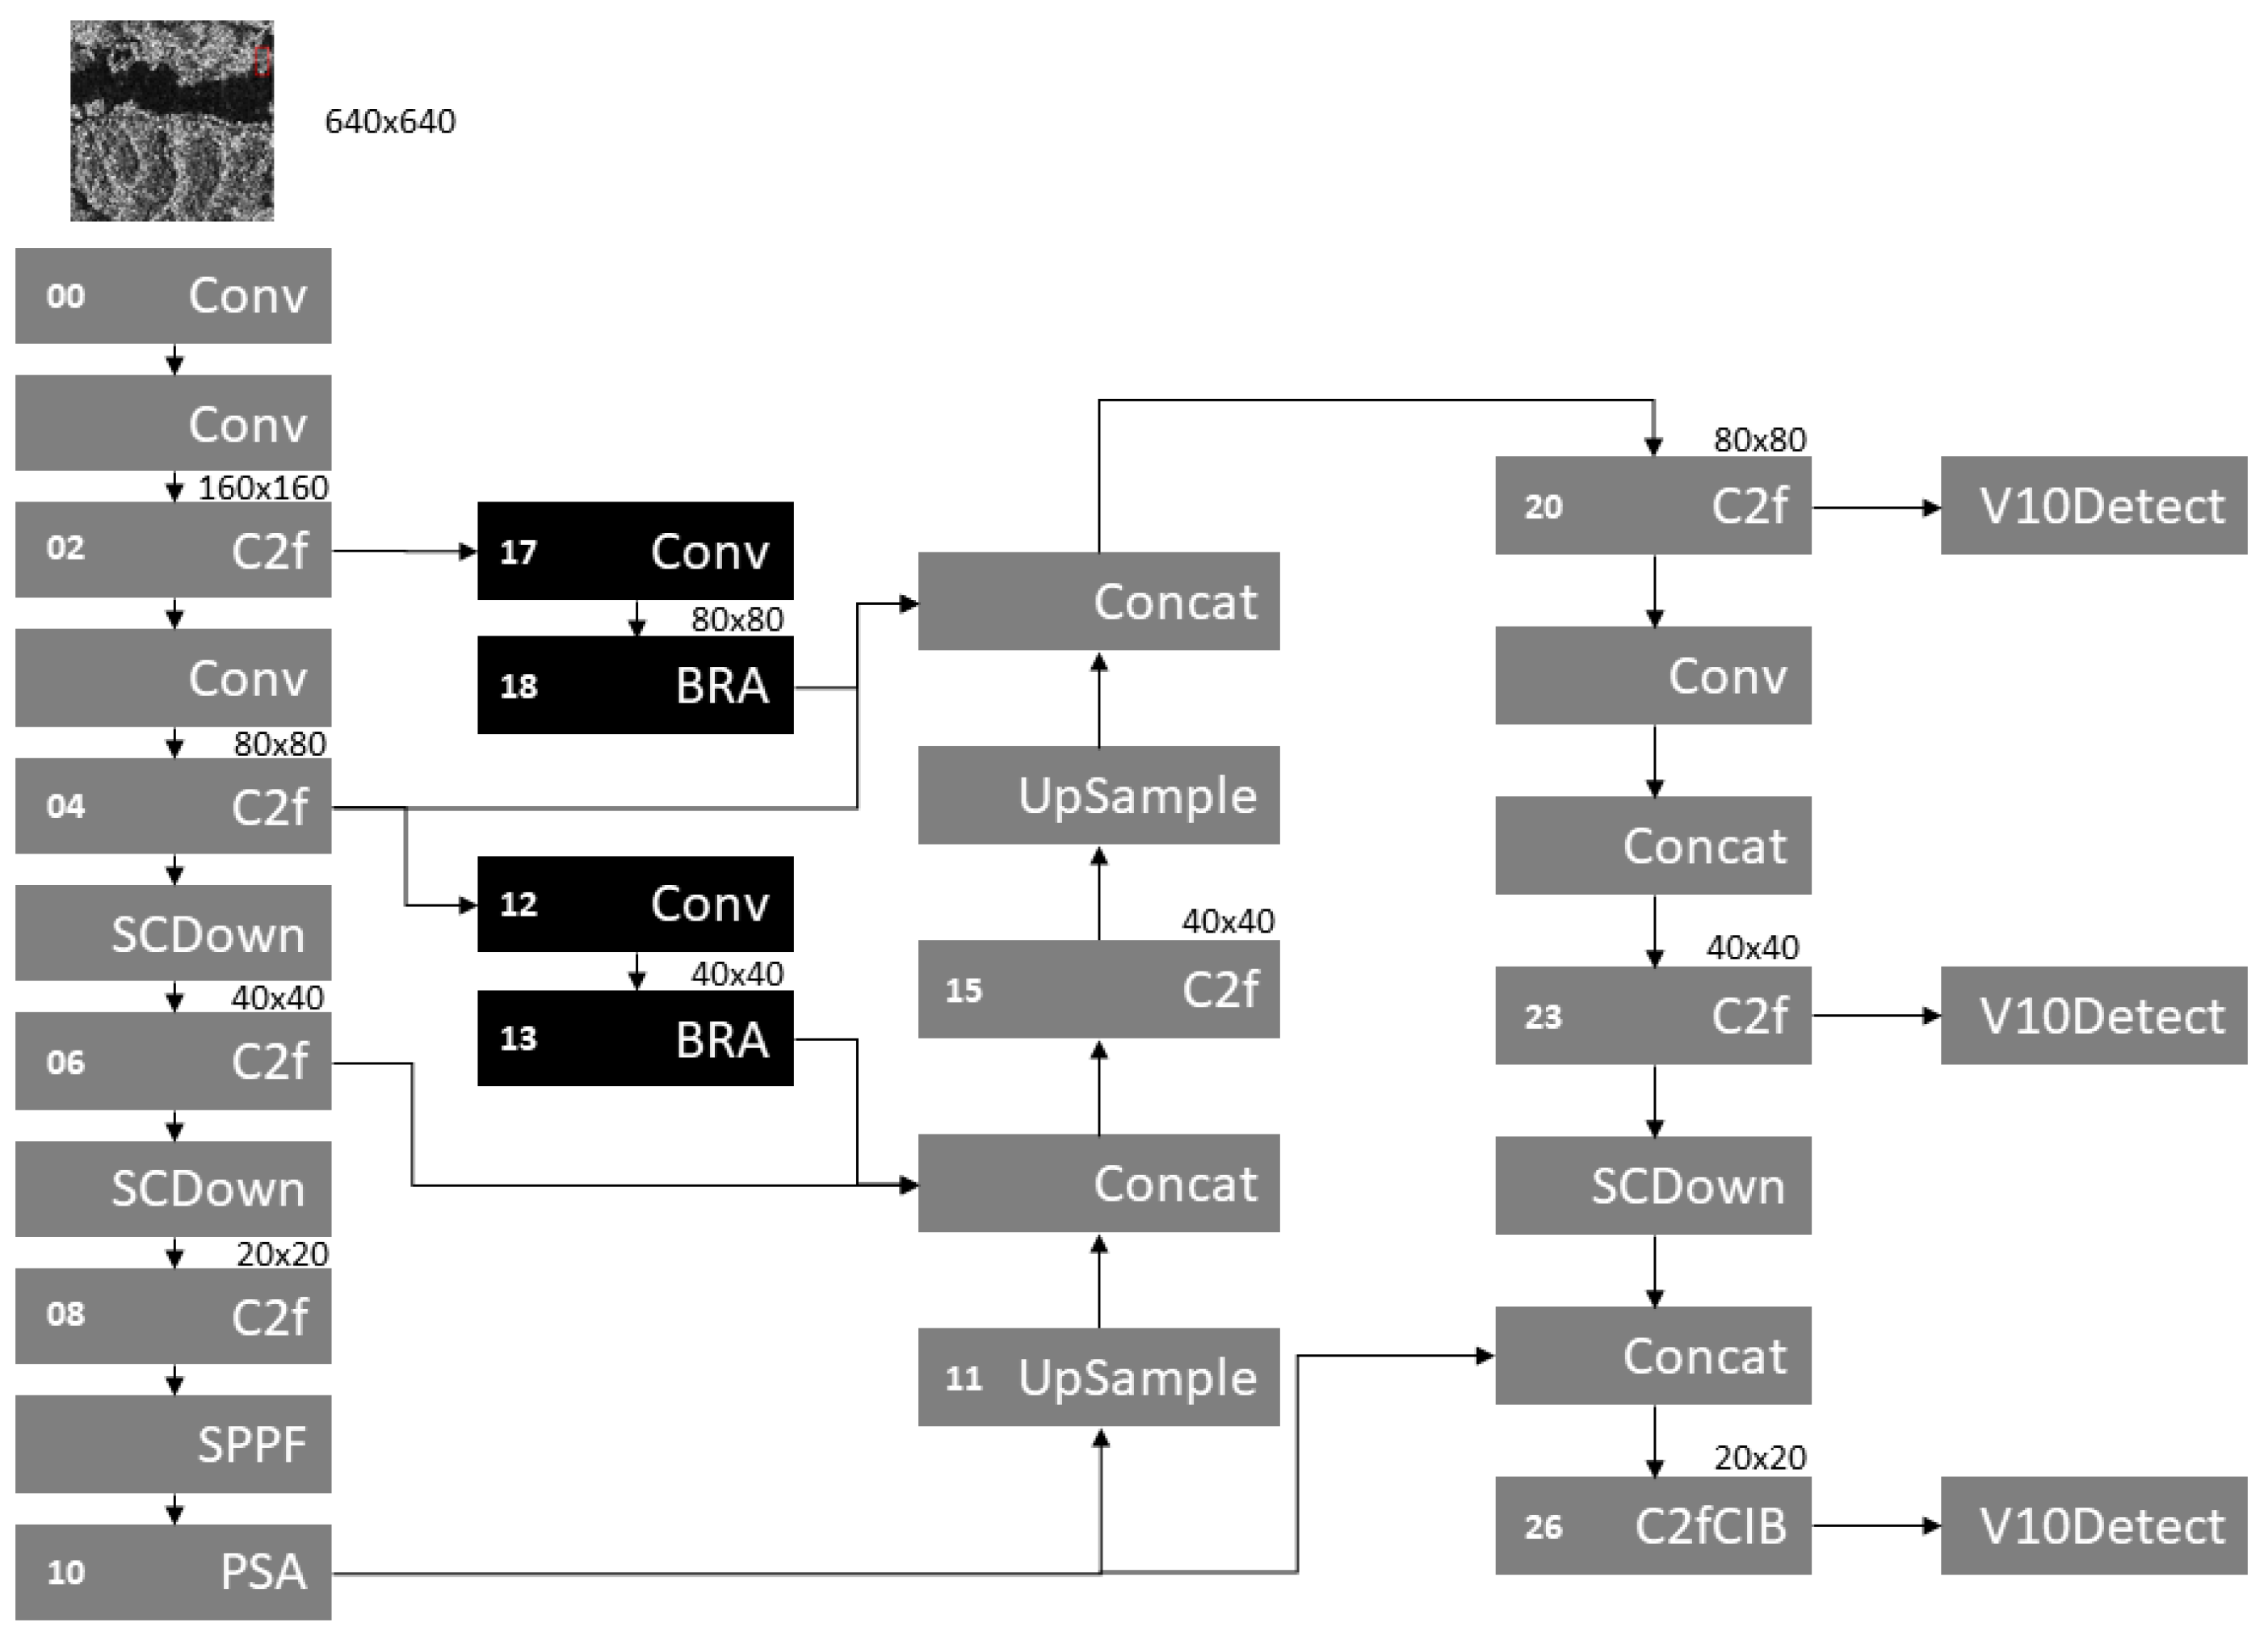
Figure 4.
mAP evolution among YOLOv10n and YOLO-SSOD.
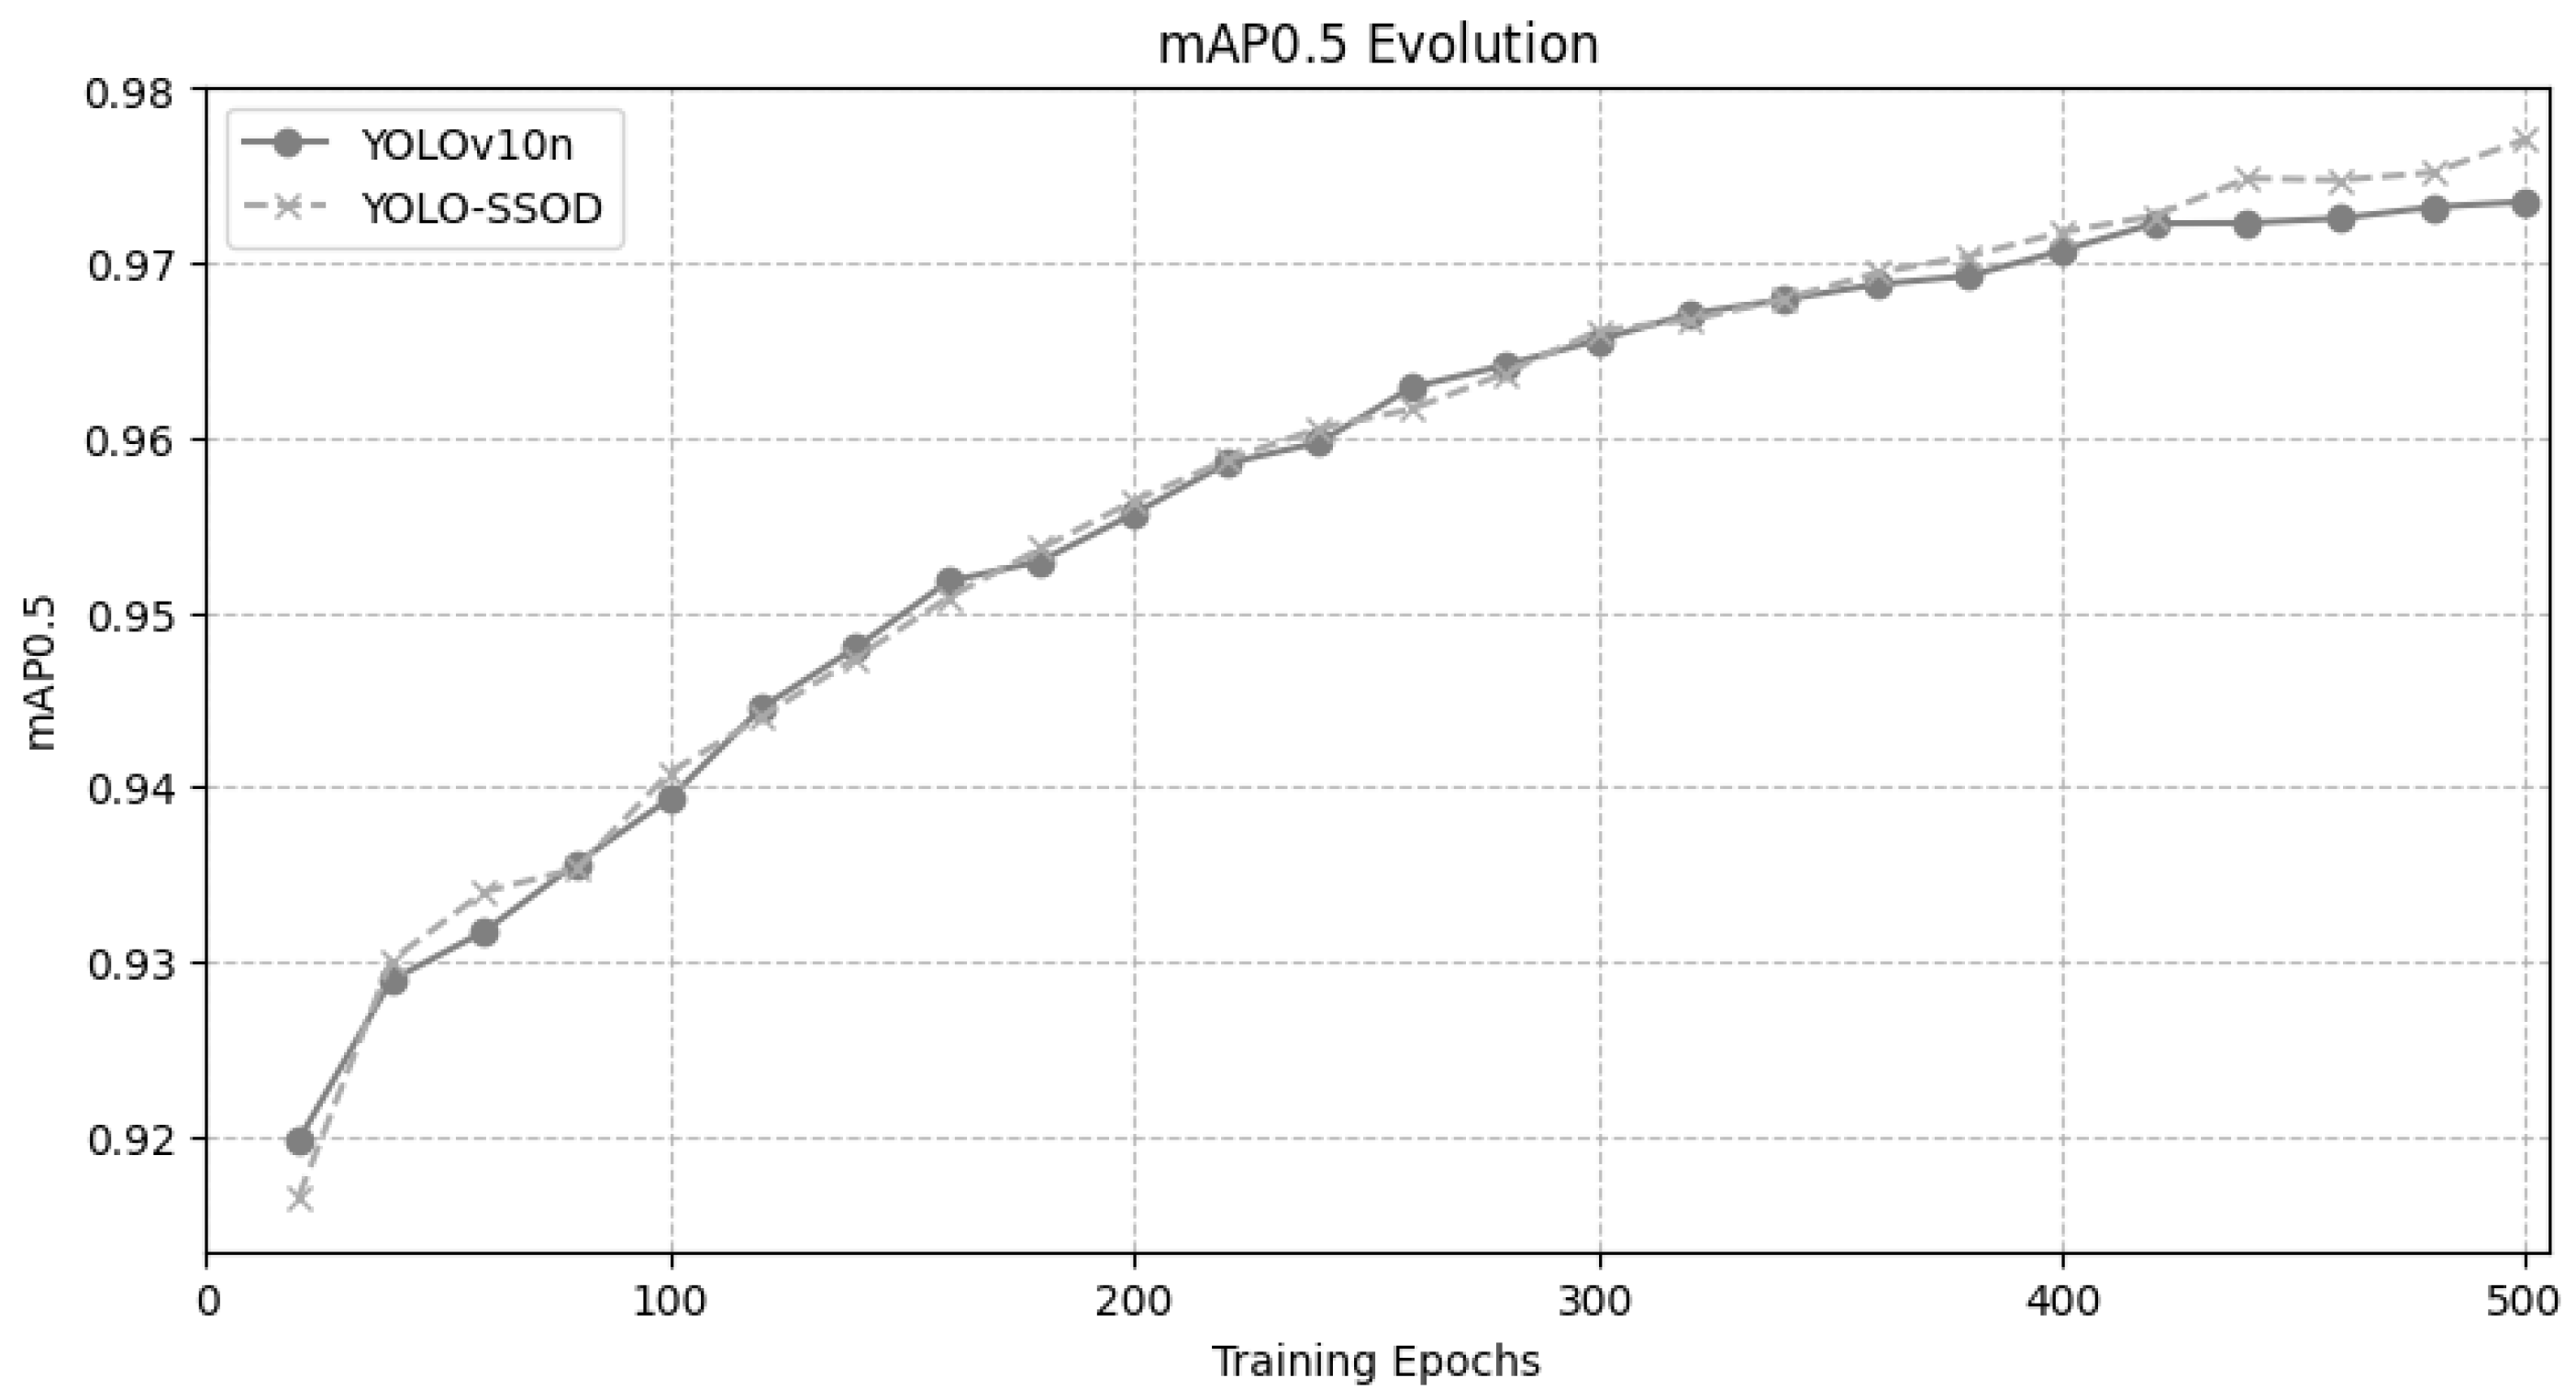
Figure 5.
Predictions examples. In the first column, all images are original from the SAR Ship dataset with a ground truth bounding box. The second column is the YOLO-SSOD prediction with a confidence score, and the third column shows the prediction for YOLOv10n and its confidence score.
Figure 5.
Predictions examples. In the first column, all images are original from the SAR Ship dataset with a ground truth bounding box. The second column is the YOLO-SSOD prediction with a confidence score, and the third column shows the prediction for YOLOv10n and its confidence score.
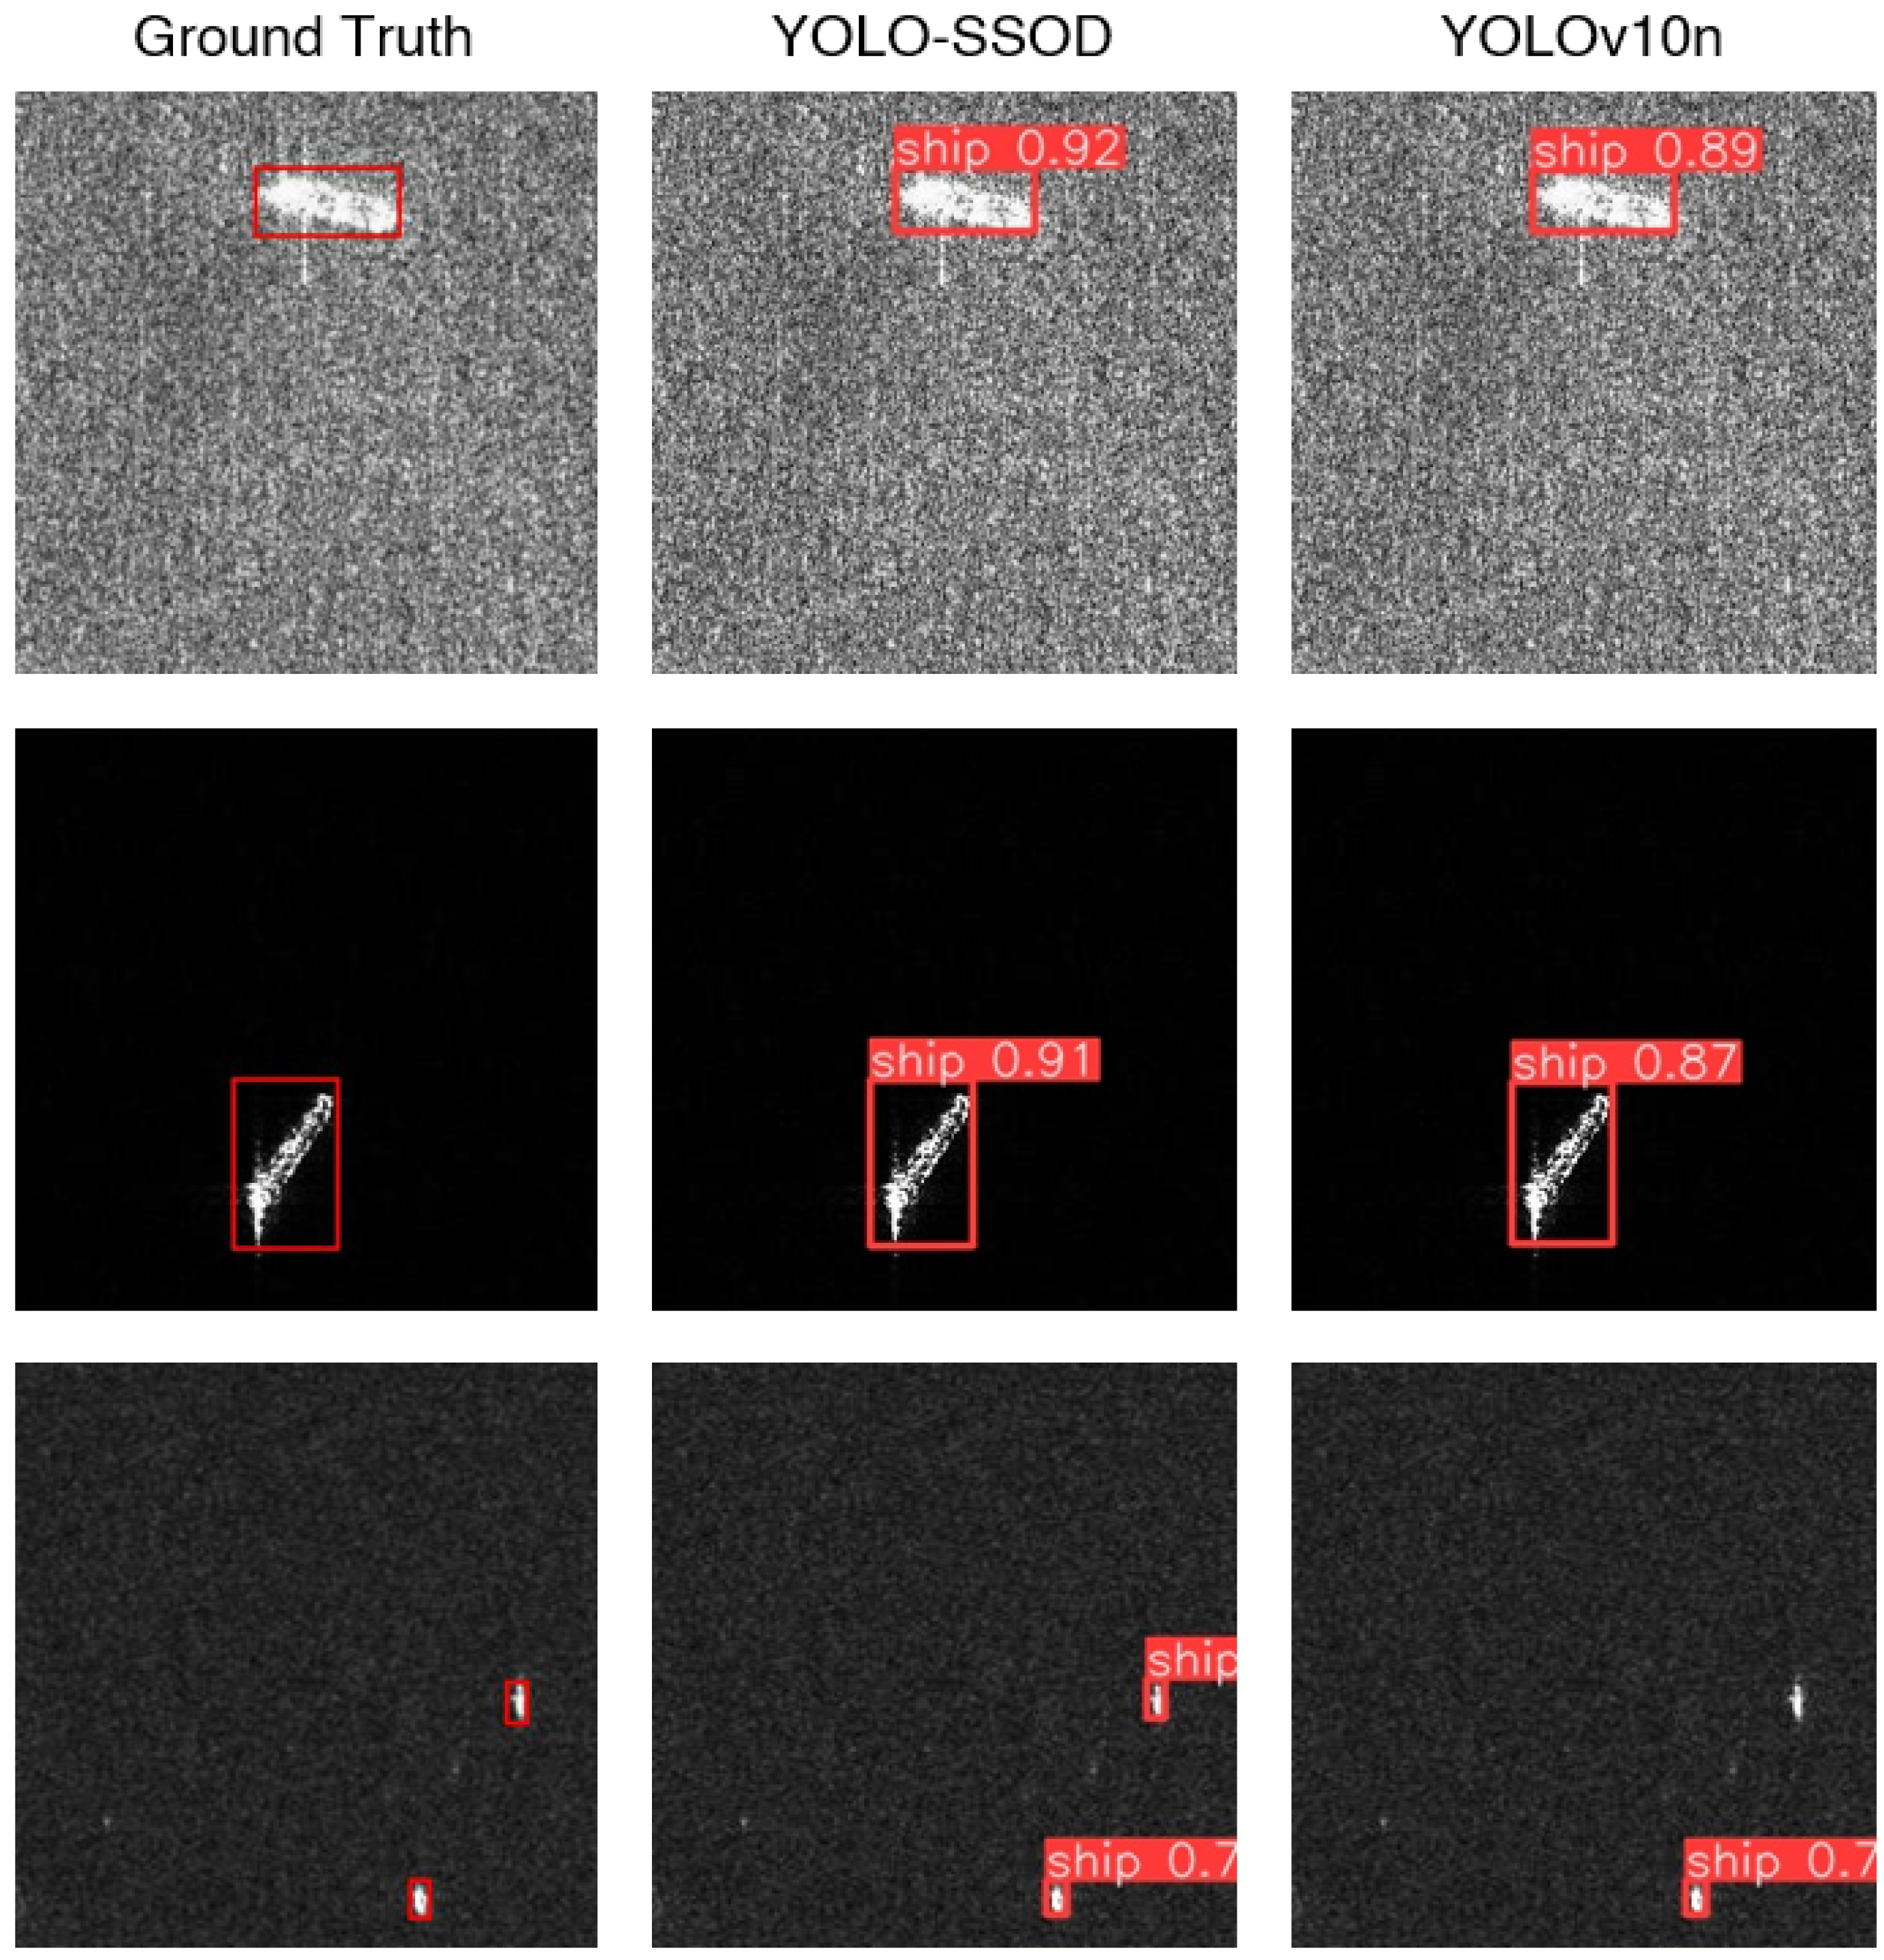
Figure 6.
YOLOv10n with a new head layer for Tiny Object Detection.
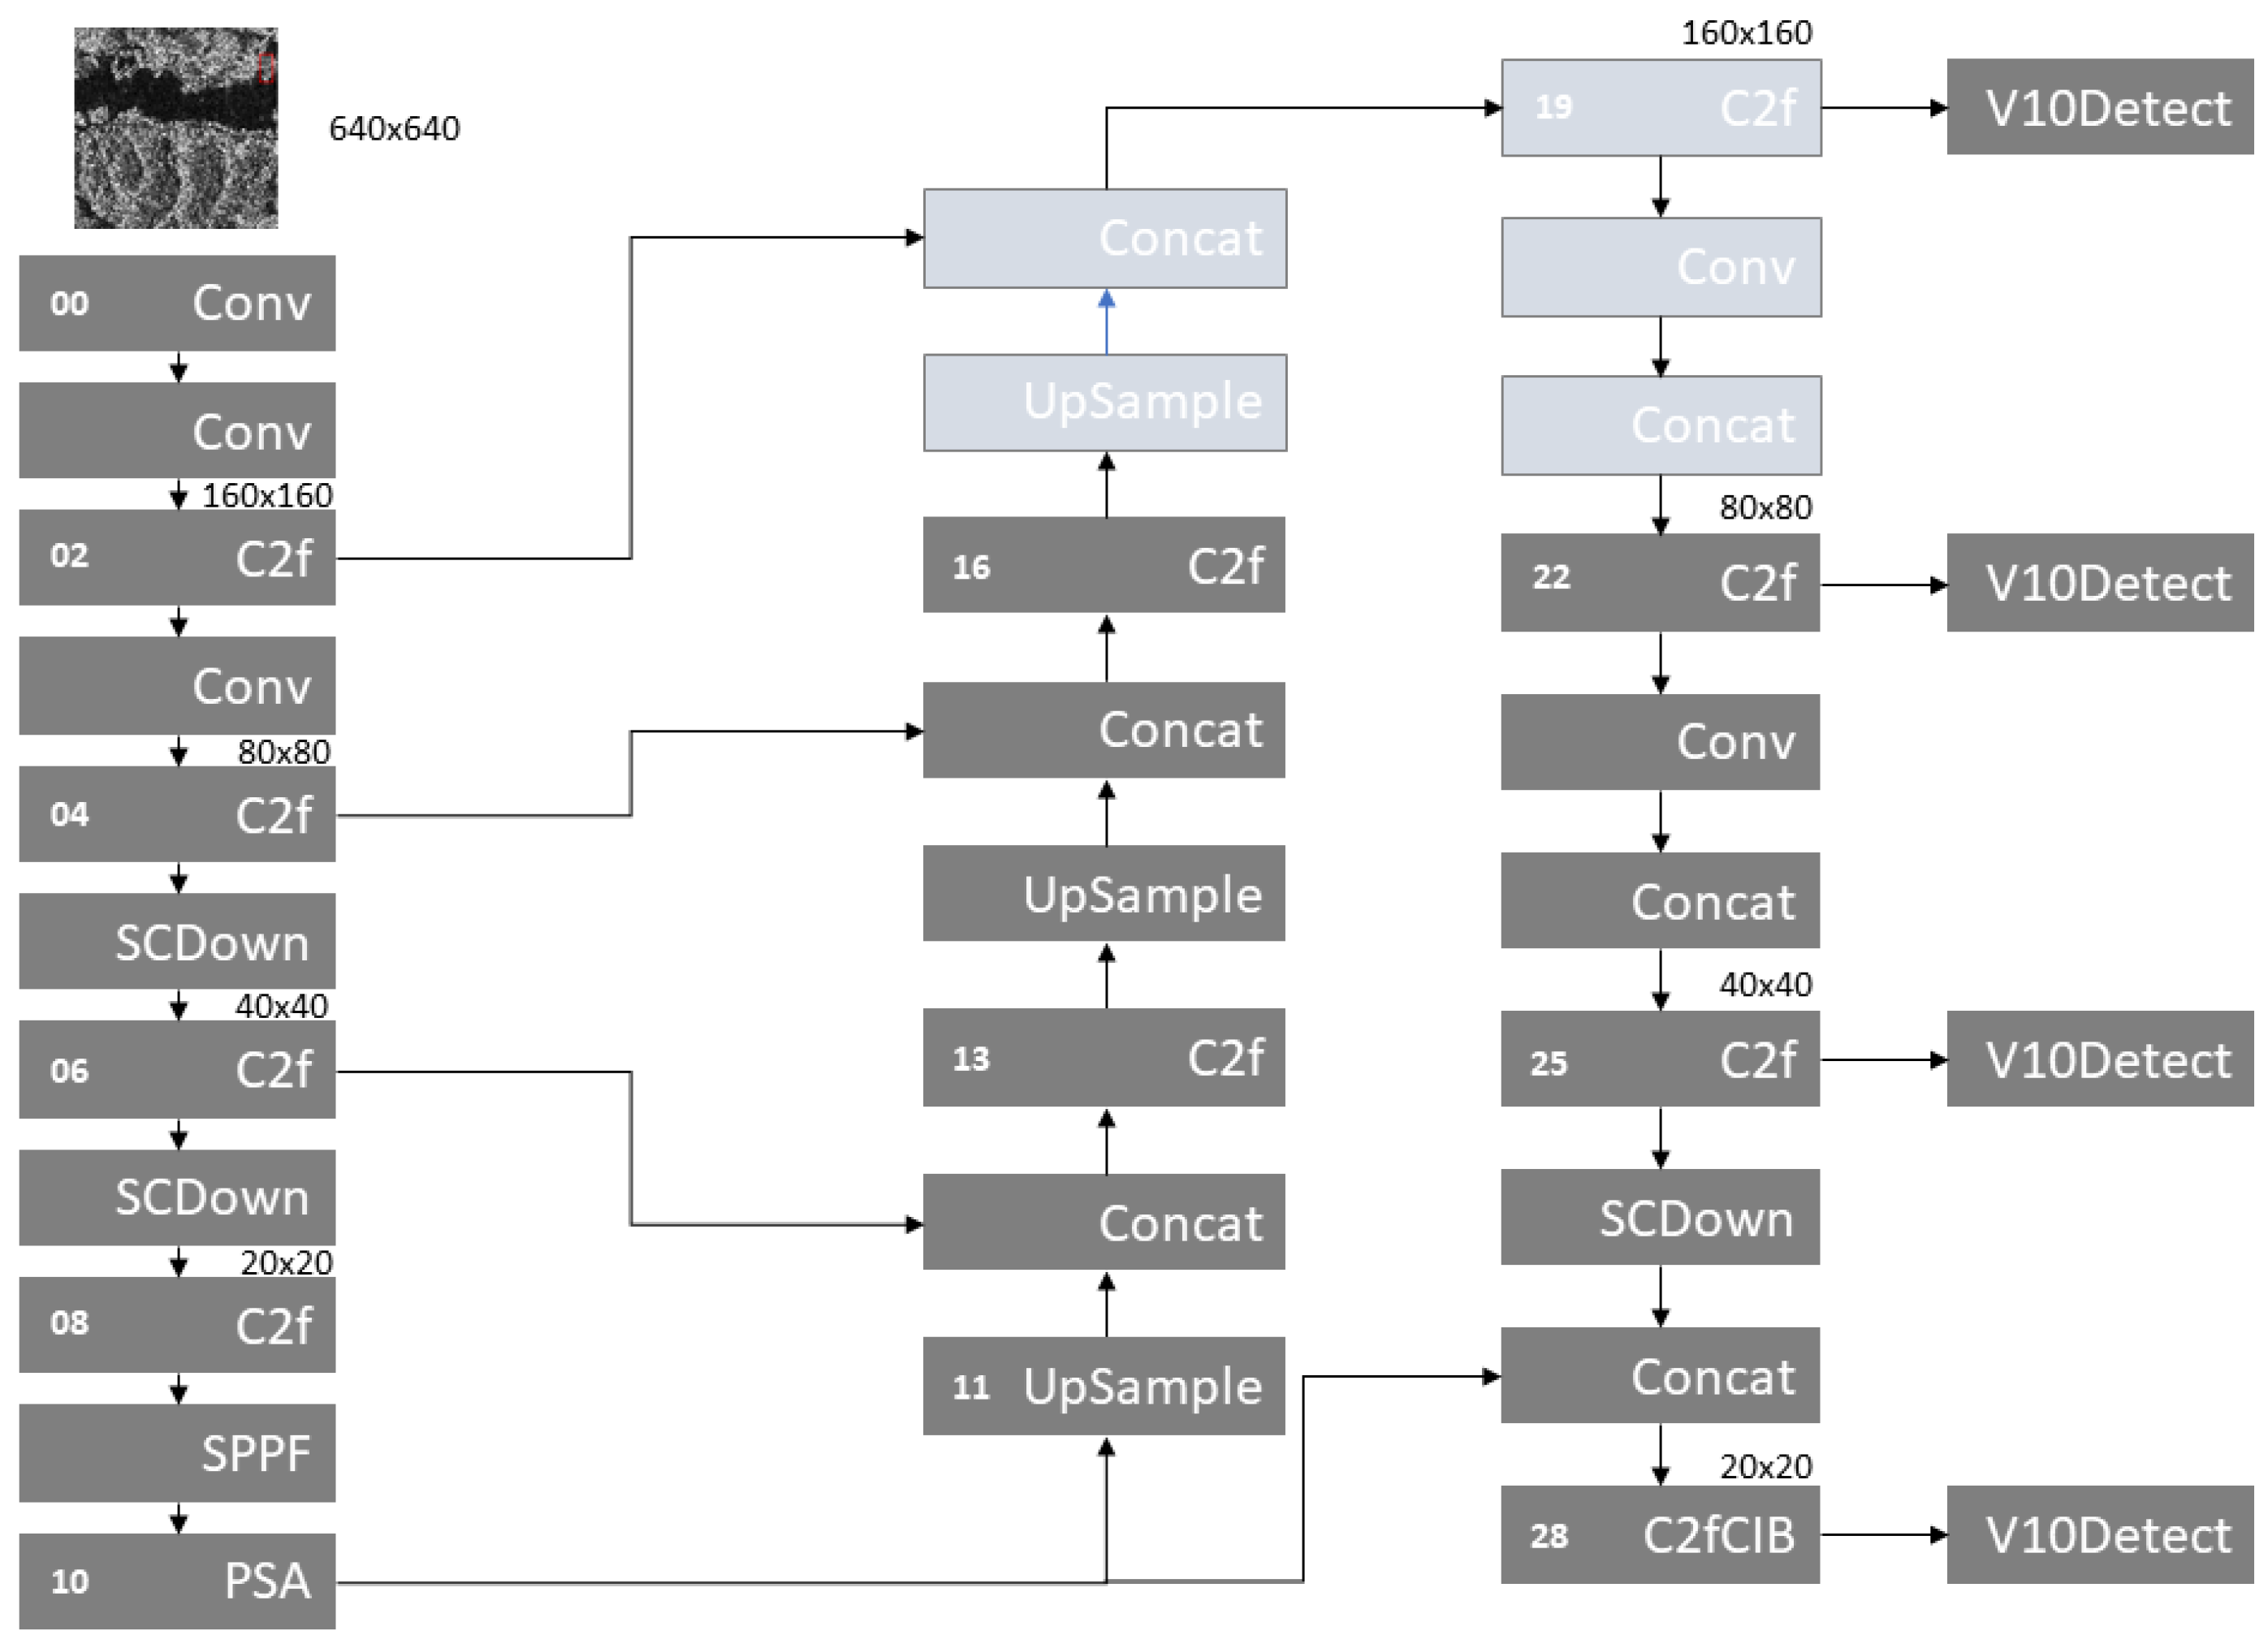
Figure 7.
YOLOv10n with a new head layer for Tiny Object Detection.
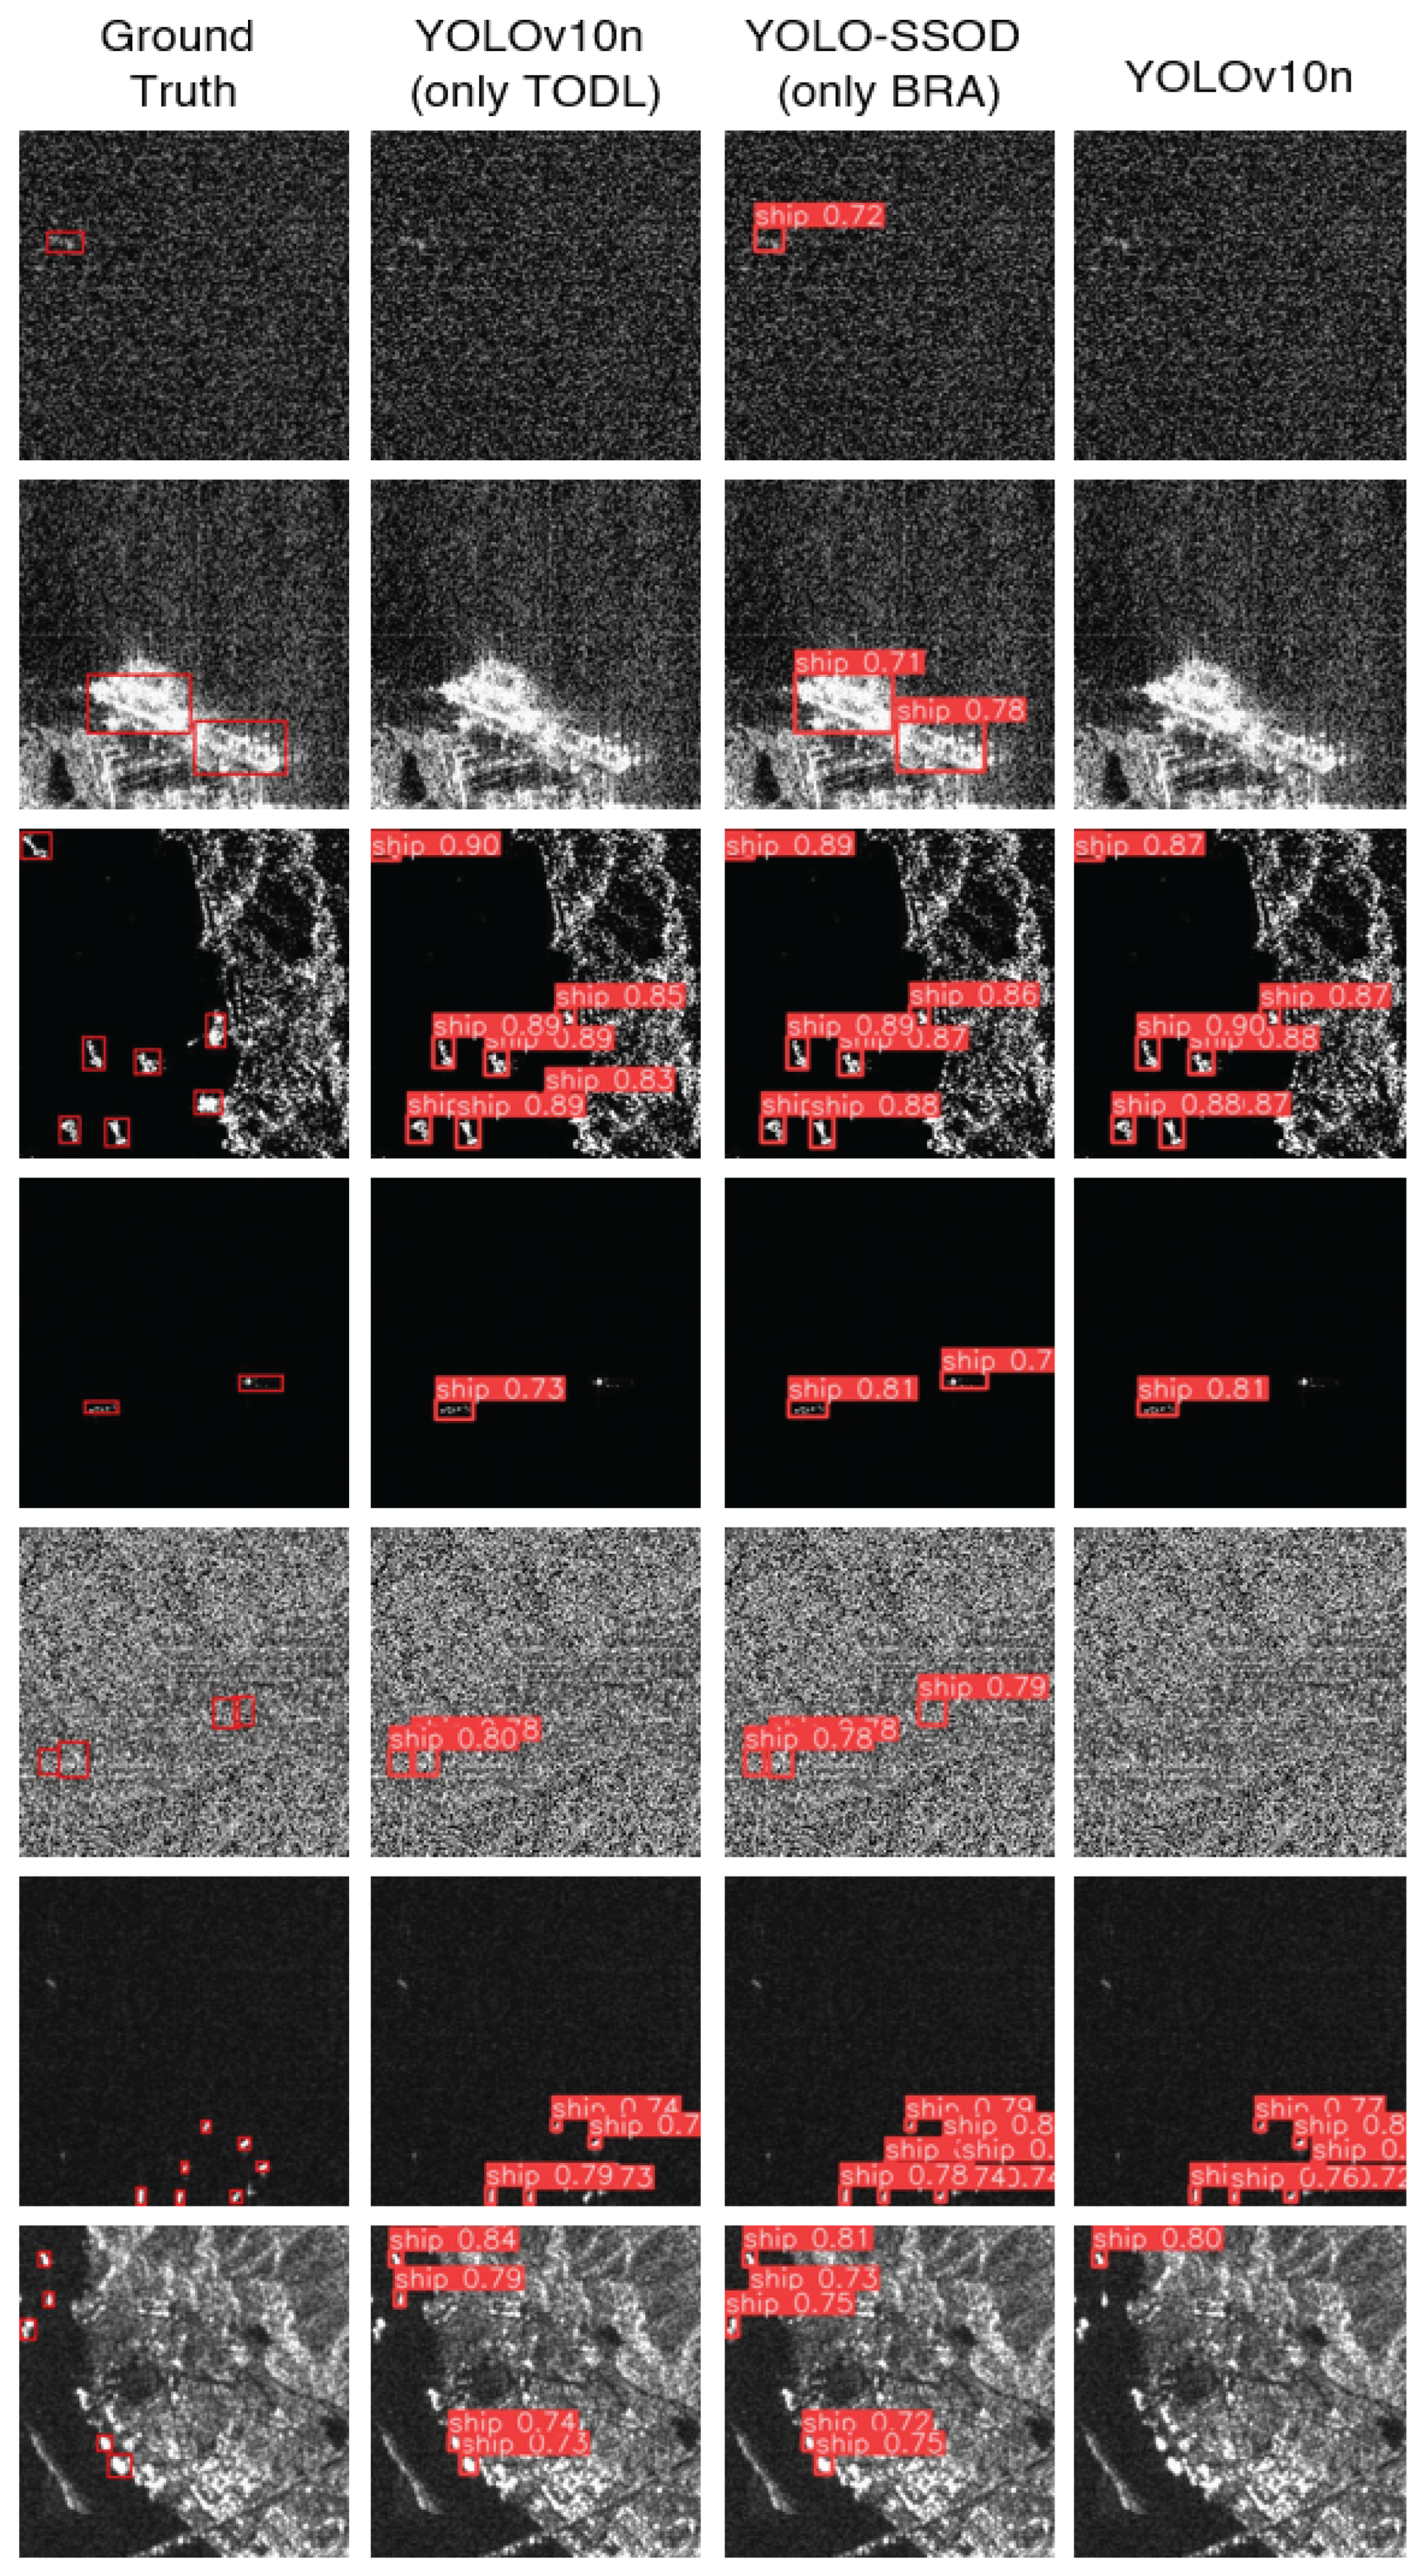

Table 1.
Model Performance on SAR Ship Dataset.
| Model | P | R | mAP | mAP- | layers | GFLOPS | FPS |
|---|---|---|---|---|---|---|---|
| YOLOv10n | 0,951 | 0,947 | 0,9736 | 0,687 | 385 | 8,4 | 769 |
| YOLO-SSOD (ours) | 0,950 | 0,948 | 0,9770 | 0,685 | 413 | 9,2 | 434 |
Table 2.
Performance Comparison on SAR Ship Dataset.
| Model | Train/Val/Test | P | R | mAP0.5 | mAP- |
|---|---|---|---|---|---|
| [9] | 7:2:1 | - | - | 0,8907 | - |
| [52] | 8:1:1 | - | - | 0,9470 | - |
| [27] | 7:2:1 | 0,944 | - | 0,9189 | - |
| [53] | 7:2:1 | - | - | 0,9107 | - |
| [54] | - | - | - | 0,9025 | - |
| [29] | 7:2:1* | - | - | 0,9390 | - |
| [55] | 7:1:2 | - | - | 0,9510 | - |
| [56] | 7:2:1* | - | - | 0,9240 | - |
| [18] | 7:2:1 | - | - | 0,9346 | - |
| [17] | 7:0:3 | 0,837 | 0,958 | 0,9552 | - |
| [57] | 7:0:3 | - | - | 0,9580 | - |
| [58] | 7:2:1* | - | - | 0,9439 | - |
| [26] | 8:0:2 | 0,911 | 0,922 | 0,9610 | - |
| [19] | 8:0:2 | - | - | 0,9510 | - |
| [25] | 7:2:1 | 0,924 | 0,957 | 0,9721 | - |
| [28] | 8:2:0 | - | - | 0,9620 | - |
| [22] | 7:1:2 | 0,927 | 0,914 | 0,9606 | - |
| YOLOv10n | 7:2:1 | 0,951 | 0,947 | 0,9736 | 0,687 |
| [23] | 8:0:2 | 0,947 | 0,945 | 0,9772 | 0,690 |
| YOLO-SSOD (ours) | 7:2:1 | 0,950 | 0,948 | 0,9770 | 0,685 |
| YOLO-SSOD (ours) | 8:0:2 | 0,952 | 0,951 | 0,9777 | 0,700 |
Table 3.
Performance for BRA positioning in YOLO-SSOD.
| BRA Positioning | P | R | mAP0.5 | mAP0.5-0.95 |
|---|---|---|---|---|
| YOLOv10n (baseline) | 0,925 | 0,938 | 0,972 | 0,678 |
| Layer 5 post C2f | 0,925 | 0,929 | 0,966 | 0,671 |
| Layer 7 post C2f | 0,945 | 0,907 | 0,971 | 0,676 |
| Layer 9 post C2f | 0,933 | 0,940 | 0,972 | 0,680 |
| Fusion 4 to 14 | 0,924 | 0,946 | 0,969 | 0,682 |
| Fusion 2 to 17 | 0,930 | 0,938 | 0,971 | 0,682 |
| Layer 9 + Fusion 2 to 18 | 0,944 | 0,927 | 0,974 | 0,678 |
| Fusion 2 to 19 + Fusion 4 to 14 | 0,948 | 0,930 | 0,975 | 0,690 |
Table 4.
Performance for TODL+BRA applied for YOLOv10n.
| BRA Positioning+TODL | P | R | mAP0.5 | mAP0.5-0.95 |
|---|---|---|---|---|
| YOLOv10n (baseline) | 0,925 | 0,938 | 0,972 | 0,678 |
| Only TODL | 0,913 | 0,939 | 0,974 | 0,688 |
| Layer 5 post C2f | 0,937 | 0,934 | 0,973 | 0,685 |
| Layer 7 post C2f | 0,928 | 0,935 | 0,972 | 0,680 |
| Layer 9 post C2f | 0,917 | 0,921 | 0,968 | 0,679 |
| Fusion 4 to 14 | 0,920 | 0,948 | 0,969 | 0,681 |
| Fusion 2 to 17 | 0,925 | 0,944 | 0,970 | 0,681 |
| Fusion 2 to 19 + Fusion 4 to 14 | 0,928 | 0,925 | 0,968 | 0,683 |
Table 5.
Performance comparison for all models—Best in each scenario using a subset of SAR Ship Dataset.
Table 5.
Performance comparison for all models—Best in each scenario using a subset of SAR Ship Dataset.
| Model | P | R | mAP0.5 | mAP0.5-0.95 |
|---|---|---|---|---|
| YOLOv10n (baseline) | 0,925 | 0,938 | 0,972 | 0,678 |
| Only TODL | 0,913 | 0,939 | 0,974 | 0,688 |
| Only BRA Fusion 2 to 19 + Fusion 4 to 14 | 0,948 | 0,930 | 0,975 | 0,690 |
Table 6.
Performance comparison for all models—Best in each scenario using whole SAR Ship Dataset
| Model | P | R | mAP0.5 | mAP0.5-0.95 |
|---|---|---|---|---|
| YOLOv10n (baseline) | 0,951 | 0,947 | 0,9736 | 0,687 |
| Only TODL | 0,950 | 0,948 | 0,9769 | 0,692 |
| Only BRA Fusion 2 to 19 + Fusion 4 to 14 | 0,950 | 0,948 | 0,9770 | 0,685 |
Disclaimer/Publisher’s Note: The statements, opinions and data contained in all publications are solely those of the individual author(s) and contributor(s) and not of MDPI and/or the editor(s). MDPI and/or the editor(s) disclaim responsibility for any injury to people or property resulting from any ideas, methods, instructions or products referred to in the content. |
© 2025 by the authors. Licensee MDPI, Basel, Switzerland. This article is an open access article distributed under the terms and conditions of the Creative Commons Attribution (CC BY) license (http://creativecommons.org/licenses/by/4.0/).
Copyright: This open access article is published under a Creative Commons CC BY 4.0 license, which permit the free download, distribution, and reuse, provided that the author and preprint are cited in any reuse.


