Submitted:
08 August 2025
Posted:
11 August 2025
You are already at the latest version
Abstract
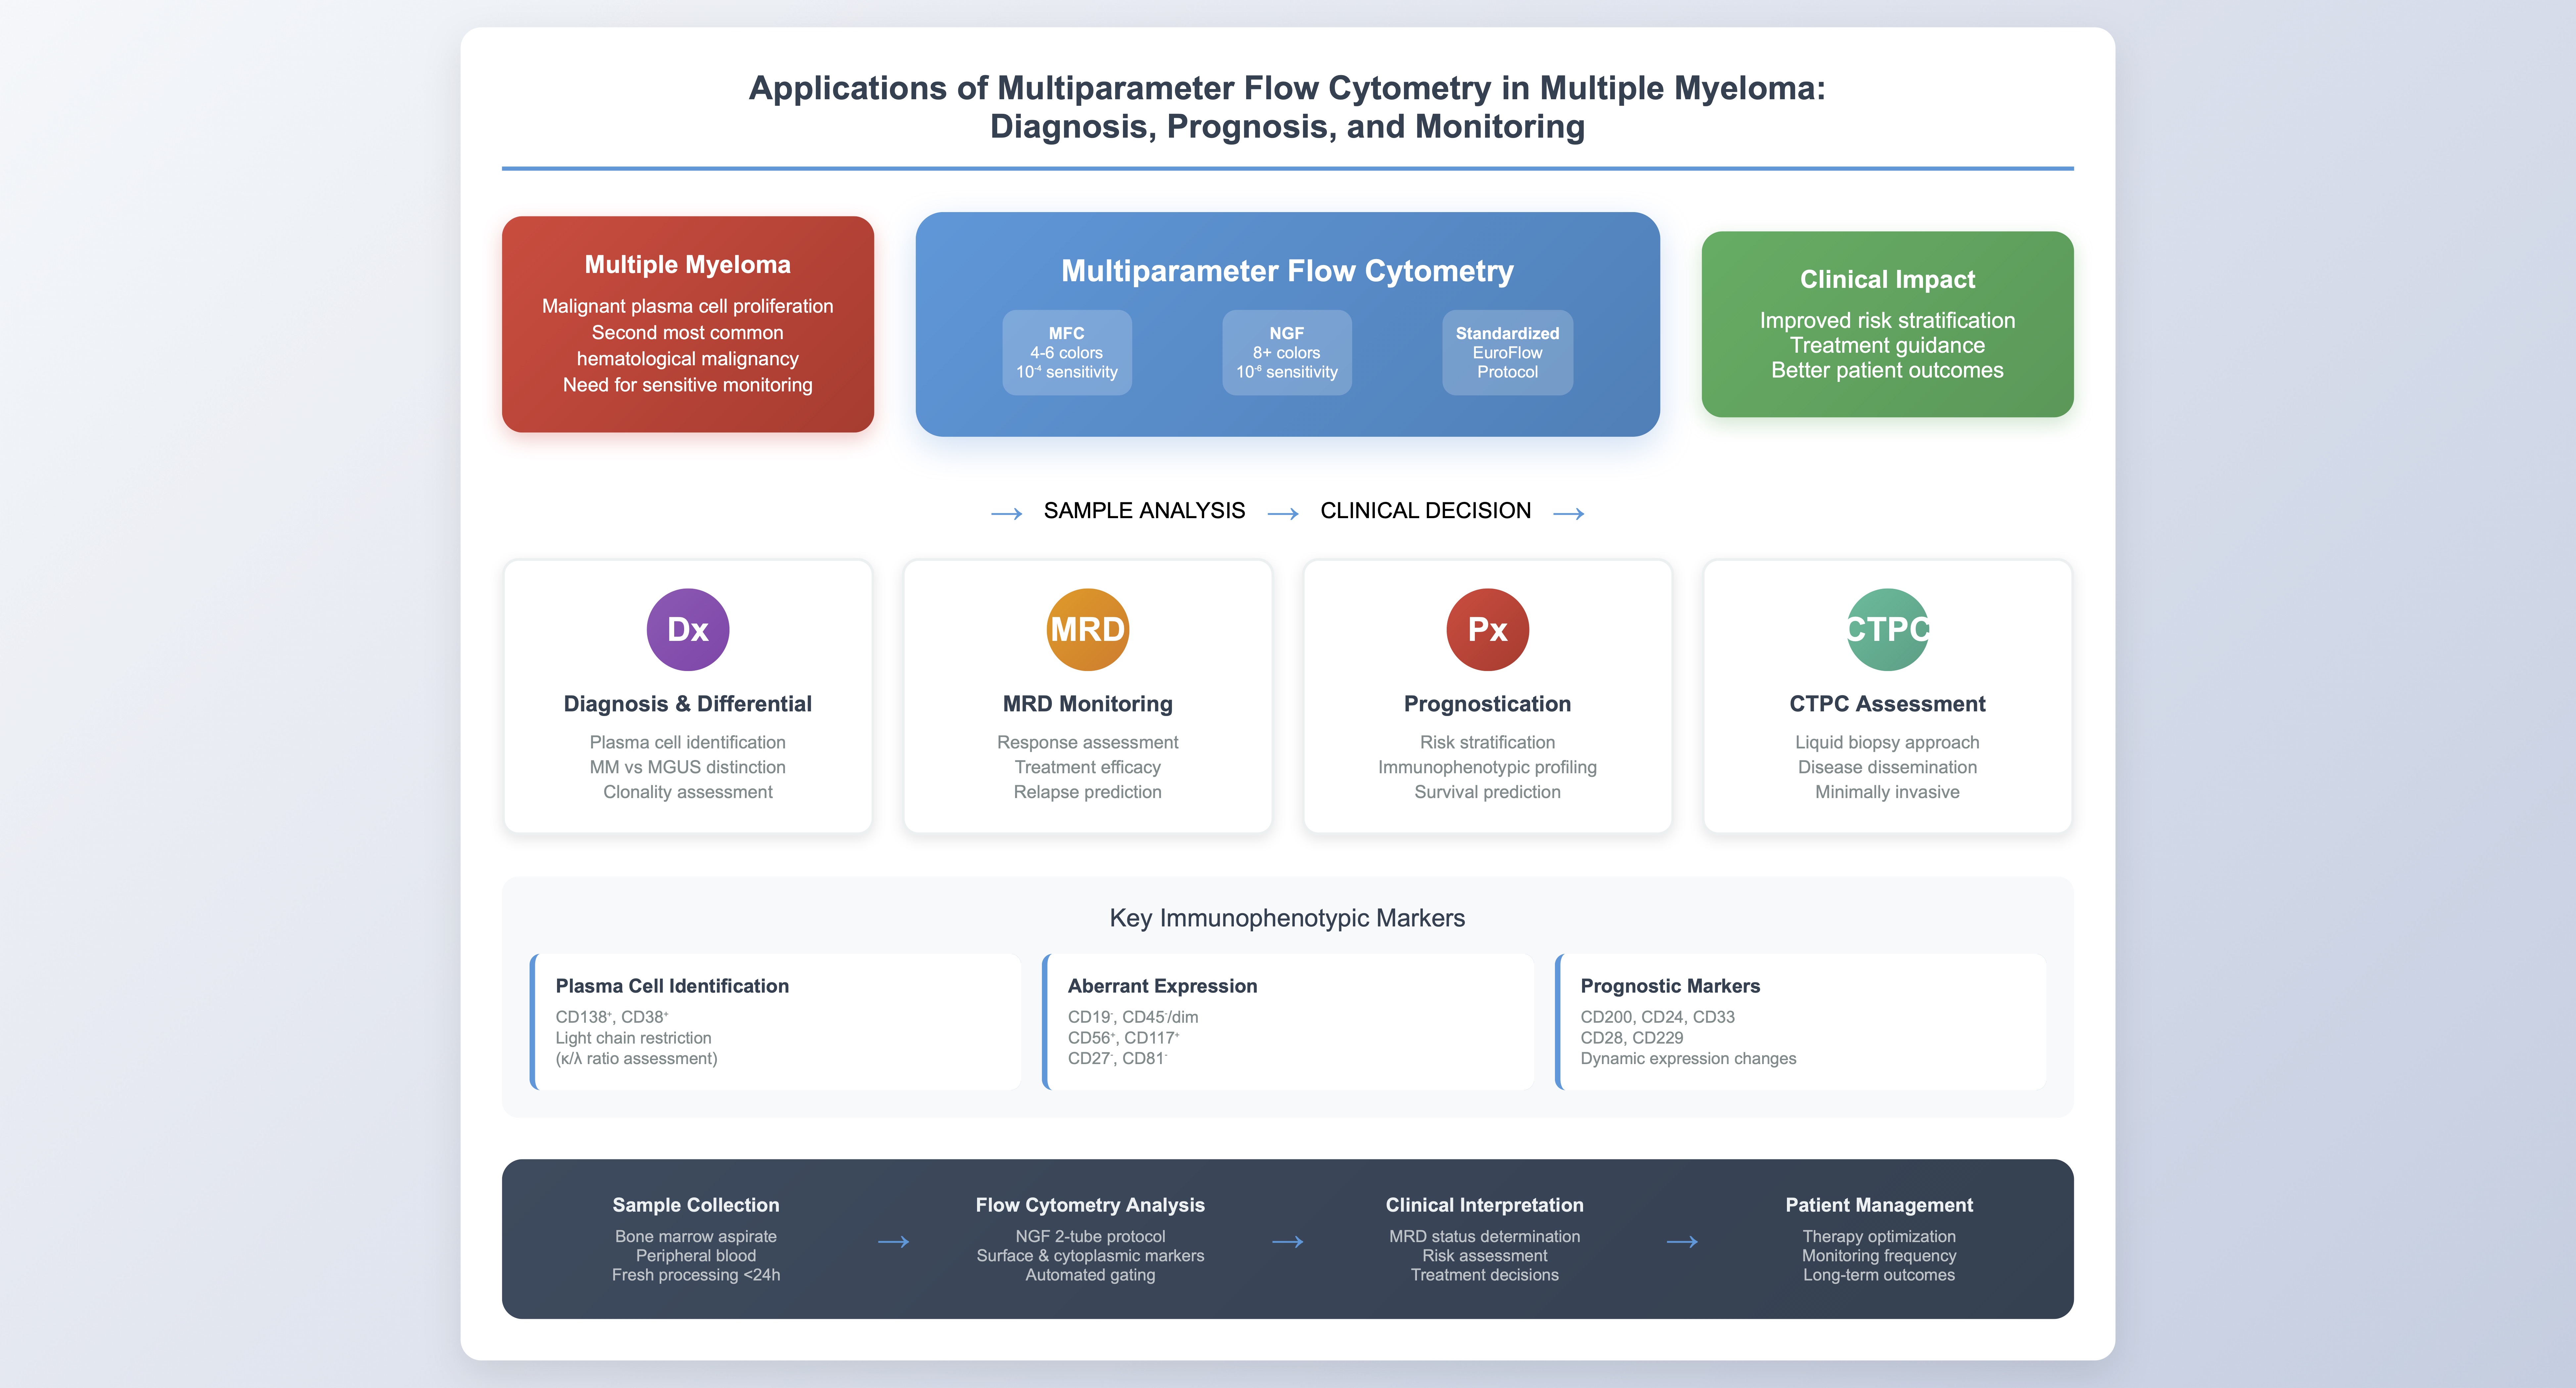
Multiple myeloma (MM) is one of the most common hematological malignancies and remains incurable. However, survival of multiple myeloma patients has significantly increased due to the implementation of novel therapies along with autologous stem cell transplantation, changing the natural history of the disease. Consequently, there is an unmet need for more sensitive response assessment techniques capable of quantifying minimal tumor burden to identify patients at higher risk of early relapse. Multiparameter flow cytometry (MFC) is an essential tool for diagnosing and monitoring patients with various hematological conditions and has recently gained prominence in identifying, characterizing, and monitoring malignant plasma cells. The implementation of Next Generation Flow (NGF) by EuroFlow aims to overcome the pitfalls of conventional MFC, including lack of standardization and lower sensitivity, by offering standardized and optimized protocols for evaluating response depth. Both MFC and NGF have wide-ranging applications in MM for diagnosis and minimal residual disease (MRD) monitoring. Plasma cell identification and clonality evaluation through MFC and NGF assist in diagnostic workup and are routinely used to assess therapeutic response through MRD analysis. Additionally, flow cytometry is applied for circulating tumor plasma cell (CTPC) enumeration, which has demonstrated significant prognostic value. Immune composition studies through MFC may provide better understanding of disease biology. Furthermore, MFC provides additional information about other bone marrow cell populations, assessing cellularity, immunophenotypic characteristics of plasma cells, and possible hemodilution. This review explores the applications of MFC and NGF in MM, highlighting their roles in diagnosis, response assessment, and prognosis, and underscores the importance of incorporating these techniques into routine clinical practice for enhanced patient monitoring.
Keywords:
multiple myeloma
; flow cytometry
; measurable residual disease
; immunophenotype
; circulating plasma cells
1. Introduction
Multiple myeloma (MM) is a malignancy of terminally differentiated plasma cells in the bone marrow. These malignant plasma cells produce a monoclonal immunoglobulin (paraprotein), that can be detected in serum or urine, contributing to the disease’s pathophysiology. The accumulation of these clonal plasma cells leads to destruction of the bone marrow microenvironment, impairing normal hematopoiesis and suppressing polyclonal immunoglobulin production [1].
With an estimated 6 new cases per 100,000 people annually, MM is one of the most common hematological malignancies, second to Non-Hodgkin lymphomas, accounting for 10% of all hematological diseases and 1% of all neoplasms in general [1,2]. Monoclonal gammopathy of undetermined significance (MGUS) is usually a preceding stage, with a progression risk of 1% per year in the first 5 years [3]. In total, approximately 15% of MGUS patients will advance to symptomatic MM at some time during their disease course [4].
Recent advances in understanding MM biology, improving diagnostic techniques, and developing novel therapeutic approaches have revolutionized patient management. Enhanced diagnostic criteria, the use of highly sensitive monitoring tools, and integration of novel therapeutic agents have all contributed to significant progress in MM outcomes [2,5]. The use of three- or four-drug combinations, in conjunction with autologous stem cell transplantation and CAR-T cell therapy has resulted in deeper responses and improved outcomes [5,6]. Implementation of such regimens achieves overall response rates of nearly 100%, with high percentage of near-complete remissions [7,8]. Subsequently, overall survival (OS) has been significantly prolonged in recent years.
Despite these very promising results, multiple myeloma patients will eventually relapse [5,9,10]. This situation highlights the limitations of conventional response assessment and monitoring (serum electrophoresis, immunofixation, quantification of serum free light chains) and emphasizes the need for more sensitive response assessment techniques capable of quantifying minute quantities of cancer cells, providing greater insight into response depth and improving long-term prognostication [4,8,11]. Currently, response assessment and minimal residual disease (MRD) quantification constitute one of the most compelling research fields in MM, as they enable better prognostication and, hopefully, clinical decision-making.
Multiparameter flow cytometry (MFC) has become an essential tool across several disciplines, including immunology, virology, hematology, oncology, and infectious diseases. In hematology, it is predominantly used for diagnosing and monitoring various hematological diseases. MFC was first explored in monoclonal gammopathy research in the 1980s [12,13]. In 2002, two groups first demonstrated the clinical use of flow cytometry for assessing residual disease and therapeutic response in MM patients [13,14,15]. In recent years, technological progress and instrumentation advances have enabled the use of more fluorochromes, with simultaneous assessment of more than 30 immunophenotypic markers and acquisition of greater numbers of cells in faster turnaround times, rendering MFC an invaluable tool for studying biological samples [16].
2. Advantages and Disadvantages of MFC
Response assessment and monitoring in MM patients requires techniques that meet several important criteria: high sensitivity, broad applicability, standardization, and cost-effectiveness [10,17,18]. Flow cytometry-based methods offer a balance between accuracy, availability, and cost, making them highly attractive for monitoring. Conventional flow cytometry is applicable to virtually all MM patients (>95%), and its wide availability and reproducibility facilitate routine use. These appealing features of MFC facilitate diagnostic workup in daily clinical practice by providing accurate diagnosis with low turnaround time and cost-effectiveness [17,19,20].
The sensitivity of conventional 4-6 color flow cytometry is approximately 10⁻⁴, which is lower than that of next-generation sequencing (NGS). However, recent advancements and the addition of more fluorochromes have significantly improved flow cytometry sensitivity, making it comparable to molecular assays. A notable advantage of flow cytometry in patient monitoring is that a diagnostic baseline sample is not required, allowing MRD status assessment at any point during therapy [21]. Moreover, MFC provides simultaneous detection of both intracellular and extracellular antigens and quantitative evaluation of various bone marrow cell populations based on their immunophenotypic antigen expression [21,22,23]. Additionally, MFC may provide intra-sample quality assessment for possible hemodilution—a pitfall that may result in underestimation of neoplastic tumor burden—by identifying other cellular populations [24].
Despite its strengths, flow cytometry has several limitations that have prompted further research and optimization. MFC applied to bone marrow samples has limited value in predicting patchy or extramedullary disease, as bone marrow aspirates may not reflect overall tumor burden [16,20]. Moreover, fresh sample collection and analysis, preferably within 24-36 hours, is necessary for cell viability and immunophenotypic integrity preservation. Four- to six-color flow cytometers have limited sensitivity compared to NGS and other molecular methods in assessing MRD, highlighting the need for upgraded flow cytometry assays [16,24].
Furthermore, the lack of standardization and consensus in flow cytometry, including variability in antibody panels, numbers of acquired cells, and MRD positivity criteria, contributes to inconsistent results across different laboratories [19,20,24]. A laboratory survey conducted by Flanders et al. demonstrated considerable variability between laboratories, resulting in up to 100-fold differences in assay sensitivity. The survey revealed substantial discrepancies regarding antibody panel composition, sample staining, data acquisition, result reporting, and quality requirements. Thus, it remains clear that implementing a reference method is mandatory to provide uniformity in analysis and reporting across laboratories [24,25].

Table 1.
Comparison of Bone Marrow MRD assessment techniques.
| MFC | NGF | NGS | |
|---|---|---|---|
| Applicability | Nearly 100% | Nearly 100% | Around 90% |
| Availability | Wide | Wide | Limited |
| Cost | Cost-effective | Cost-Effective | High |
| Sensitivity | 10-4 – 10-5 | 10-6 | 10-6 |
| Complexity | Rapid turnaround time | Rapid turnaround time | Labor intensive, requires intense bioinformatic infrastructure |
| Standardization | Not standardized | Standardized by the EuroFlow Consortium | Standardized |
| Sample processing | Fresh samples within 24h | Fresh samples within 24h | Stored samples can be assessed |
| Need for baseline sample | No | No | Yes |
3. Next Generation Flow (NGF)
In response to these challenges, the EuroFlow Consortium introduced NGF in 2017 as a standardized and highly sensitive method for MRD assessment in MM. NGF employs innovative protocols for sample preparation, antibody panel construction, and cell acquisition to address the lack of standardization and inconsistencies associated with conventional flow cytometry [26].
The EuroFlow consortium suggests a 2-tube, 8-color combination to identify both surface and intracellular markers, assessing the immunophenotypic characteristics and clonality of neoplastic plasma cells. In the first tube, the main plasma cell (PC) identification markers (CD138, CD38) are combined with CD45, CD19, CD56, CD81, CD117, and CD27. These combinations can distinguish aberrant plasma cells from other cell lineages and normal bone marrow plasma cells. In the second tube, antibodies bound to kappa and lambda cytoplasmic light chains are added, along with CD138, CD38, and the four most common markers (CD19, CD45, CD56, and CD27). The proposed antigenic panel is analyzed in Table 2 [26,27].
The NGF initiative suggests a bulk-lysis procedure using a 0.5% bovine serum albumin lysis solution, which allows acquisition of significantly greater numbers of cells (approximately 10⁷ cells), resulting in a sensitivity advantage compared to conventional flow cytometry. The NGF protocol also involves automatic gating features, reducing bioinformatic labor and turnaround time compared to expert-based conventional MFC [27,28,29]. Expert-controlled data interpretation is one of the main causes of inter-laboratory result discrepancies. This automation improves both the consistency and efficiency of MRD detection, reducing inter-laboratory discrepancies.
4. Current Applications of MFC in Multiple Myeloma
4.1. Detection of Plasma Cells
MFC provides a fast and widely applicable method for detecting plasma cells in bone marrow, peripheral blood, or any other compartment. The technique primarily relies on evaluating light scatter characteristics and detecting certain immunophenotypic markers. The simultaneous assessment of CD138 and CD38 constitutes the most specific combination for plasma cell identification [21,30].
CD38 is expressed throughout various stages of B-cell maturation but is uniquely upregulated in plasma cells. This high expression level distinguishes plasma cells from other CD38-positive hematopoietic cells, such as monocytes and activated lymphocytes [31,32]. CD38 has also become a therapeutic target with monoclonal antibodies such as daratumumab and isatuximab, which interfere with CD38-based detection. Newer MFC technologies utilize alternative multiepitope and nanobody CD38 antibodies conjugated with fluorochromes; consequently, CD38-based detection is feasible even in patients receiving anti-CD38-based regimens [33].
CD138 (syndecan-1) is primarily expressed on plasma cells and minimally on other hematopoietic cells, representing another highly specific marker for plasma cell identification [13]. However, significant CD138 downregulation has been observed in MM samples not processed within 24 hours after collection in heparin-containing tubes, as heparin exposure may lead to CD138 redistribution on the cell surface [11]. Plasma cells expressing low levels of CD138 have been reported, mainly in peripheral blood [34].
Along with CD38 and CD138, MFC uses additional markers such as CD45 and scatter characteristics to distinguish plasma cells from other hematopoietic cells. Plasma cells, being terminally differentiated B cells, typically express some common B-cell markers like CD19 and CD45, although CD20 expression is lost from the plasmablast stage onwards [13,21,30].
Flow cytometry is not only capable of detecting plasma cells but also assessing aberrant immunophenotypes and their clonality, which is a hallmark of malignancy. Neoplastic plasma cells present a distinct immunophenotypic spectrum compared to normal bone marrow plasma cells [26]. Since the first description almost 25 years ago [32], additional studies have verified that neoplastic plasma cells typically present lower expression of [26]CD45, CD19, CD27, and CD81, and elevated expression of CD28, CD33, CD56, CD117, and CD200. It is also worth noting that CD38 expression is weaker in tumor plasma cells compared to their normal plasma cell counterparts .
As mentioned above, immunophenotypic heterogeneity exists due to factors such as sample preparation and processing time. It is important to emphasize that an aberrant immunophenotypic profile cannot rely on one specific marker. Within the plasma cell population, certain markers typically considered aberrant may still be expressed on a subset of normal plasma cells. For example, CD56, while commonly associated with malignant plasma cells, can also be expressed in a small subset of normal or reactive plasma cells. Additionally, although lack of CD19 expression may suggest neoplastic behavior, approximately 30% of normal PCs are also CD19-negative. Therefore, a combination of multiple markers and confirmation of clonal nature is required for highly sensitive and accurate plasma cell detection [26].
For instance, long-lived normal plasma cells tend to downregulate CD19, CD38, and CD45 and upregulate CD56 and CD28, resembling a more malignant immunophenotype. Additionally, samples from MM patients not processed within 24 hours present lower CD138 expression [32,34]. It is also worth mentioning that immunophenotypic characteristics differ between bone marrow and circulating tumor plasma cells. Peripheral blood circulating tumor plasma cells (CTPCs) present a more immature and less proliferative immunophenotype than their bone marrow counterparts. They display lower levels of CD38 and CD138, as well as markers that act as stromal adhesion molecules, such as CD56, CD81, and CD117 [35].
Moreover, the immunophenotype of PCs is dynamic, as malignant PCs are prone to major antigenic shifts upon therapy. Small alterations in immunophenotype may occur because of clonal selection of chemoresistant cells [36]. This phenotypic shift may complicate MRD assessment and emphasize the significance of diagnostic samples in better understanding disease evolution. Immunophenotypic differences between normal and aberrant plasma cells are presented in Table 3.
4.2. Differential Diagnosis
Multiparameter flow cytometry (MFC) serves as a critical tool for differential diagnosis of various hematologic conditions, including MM, complementing morphology and bone marrow biopsy. In the context of suspected plasma cell dyscrasias, MFC is particularly valuable in distinguishing MM from precursor conditions like monoclonal gammopathy of undetermined significance (MGUS) [37]. This differentiation is achieved through quantification of both malignant and normal plasma cell populations within the bone marrow. MGUS is typically characterized by the presence of a mixture of malignant and normal plasma cells, with the latter representing a significant portion. Studies indicate that 98% of MGUS cases exhibit more than 3% normal plasma cells alongside polyclonal cytoplasmic light chain production—features distinct from MM, where malignant plasma cells dominate [37].
Moreover, a study conducted by Paiva et al. identified a subgroup of MM patients with an "MGUS-like" immunophenotypic profile, accounting for approximately 14% of cases. These patients exhibited lower bone marrow infiltration, higher hemoglobin levels, reduced immunosuppression, and prolonged progression-free survival (PFS) and overall survival (OS). Notably, these patients had more than 5% residual normal plasma cells at diagnosis, marking them as outliers in terms of disease progression and survival. Identifying such patients is clinically significant, as they may achieve favorable outcomes even in the absence of complete response [38,39].
In addition to distinguishing MM from precursor conditions like MGUS, MFC is also valuable in differentiating MM from other hematologic malignancies, such as B-cell lymphomas with plasma cell differentiation [13]. One of the most common examples is lymphoplasmacytic lymphoma/Waldenström's macroglobulinemia, where neoplastic cells produce monoclonal proteins detectable through serum protein electrophoresis and immunofixation. MFC aids in this differential diagnosis by assessing CD19 expression, which is positive in the vast majority of lymphoma-associated plasma cells but negative in over 90% of MM cases. Additionally, CD56, a marker frequently expressed in approximately 75% of MM plasma cells, is much less commonly found in plasma cells associated with non-Hodgkin lymphomas (NHLs), appearing in only about 33% of cases [13,40].
Despite the usefulness of immunophenotyping in MM diagnosis, it should be noted that MFC is recommended only for clonality assessment through kappa and lambda light chain restriction, and not for plasma cell enumeration, according to the International Myeloma Working Group (IMWG) diagnostic criteria for MM [1]. Therefore, while flow cytometry offers valuable complementary data, it should be used in conjunction with other baseline diagnostic tools to ensure accurate and comprehensive diagnosis.
4.3. Response Assessment
Conventional response assessment relies on evaluating monoclonal protein concentrations in serum and urine by electrophoresis and immunofixation, supplemented by free-light chain quantification [4]. Morphological studies of bone marrow aspirate accompany biochemical studies through direct identification of plasma cells by microscopy, with sensitivity around 10⁻². With current response assessment techniques, approximately 68% of complete response (CR) patients relapse within 2 years [41]. This fact highlights the necessity to renew traditional response criteria and implement more sensitive techniques that surpass the sensitivity limit of 10⁻². Additionally, serum protein electrophoresis with immunofixation does not exclusively reflect bone marrow compartment occupation due to the half-life of circulating paraprotein [4,17,37].
Flow cytometry using 4-6 colors has proven to be a more sensitive technique that may achieve a sensitivity level of 10⁻⁴, although still inferior to molecular methods. Recent advancements, particularly NGF with simultaneous assessment of ≥8 markers, may accomplish sensitivity of 10⁻⁶, which is comparable to NGS [28]. The 2016 International Myeloma Working Group (IMWG) criteria endorsed multiparameter flow cytometry (MFC) for MRD evaluation in CR patients, cementing its role in response assessment and prognostication [4]. NGF has addressed many concerns about standardization and variability between research centers, offering a robust, standardized protocol that includes improved sample preparation, advanced antibody panels, and automated gating features for enhanced sensitivity [4,23,28].
The second tube not only provides information concerning plasma cell clonality but also plays a confirmatory role to results exported from the first tube through a second independent measurement. Flores Montero et al. highlighted NGF's efficacy through comparison with 8-color single tube flow cytometry. A discrepant number of cases was observed, as 25% of patients classified as MRD-negative by conventional 8-color flow cytometry were MRD-positive by NGF. This was largely due to NGF's ability to evaluate cytoplasmic kappa and lambda light chains, which helped distinguish between monoclonal and polyclonal plasma cells, thus minimizing false positives [27,28,32,42].
Additionally, a cost-effective alternative method was proposed using single-tube, 10-color flow cytometry assay, showing high levels of concordance (98%) with the EuroFlow 8-color, 2-tube assay [43]. However, the two-tube method can acquire 15% more cells due to combined surface and cytoplasmic staining. It should be mentioned that the latter assay has not been standardized, and validation of the method was made on a small patient population, so further investigation is needed [4,43]
Furthermore, extensive research has been conducted to establish MFC and NGF as key instruments in response assessment at the same level of accuracy as molecular methods. In 2019, researchers investigating post-consolidation MRD results from the CASSIOPEIA trial reported excellent levels of concordance between MFC and NGS. In patients achieving CR or greater, there was 94.4% agreement between the two methods [44]. Also, NGS was compared to second-generation MFC showing good levels of agreement, although some discrepancies were attributed to different sensitivity levels between the two techniques. Medina et al. compared NGS and NGF for MRD assessment, also proving excellent levels of agreement. These findings reinforce and verify the establishment of MFC, and especially NGF, as very sensitive and valuable tools for response assessment and patient monitoring [45].
4.4. Prognostication
4.4.1. Prognostication Through the Assessment of MRD
To date, prognosis and risk stratification of MM patients are estimated using the International Stage System (ISS) and the Revised International Stage System (R-ISS). However, additional prognostic factors should be considered, such as circulating plasma cells, extramedullary disease, gene expression profiles, and others, offering great heterogeneity in patient outcomes. High-risk patients often experience inferior survival even when achieving similar responses to therapy as standard-risk patients [4]. Thus, the diversity of different prognostic factors contributes to heterogeneity in predicting patient outcomes. Additionally, these prognostic models using single-step modeling generally rely on pre-treatment factors without integrating depth of response to therapy [46].
The International Myeloma Working Group (IMWG) has emphasized the use of minimal residual disease (MRD) as the preferred biomarker for assessing treatment response. MRD status surpasses traditional criteria, such as complete response (CR), as MRD-negative CR patients have been shown to experience significantly longer survival compared to MRD-positive CR patients. The IMWG strongly recommends using multiparameter flow cytometry (MFC), particularly Next Generation Flow (NGF), to assess MRD in MM patients due to its high sensitivity, specificity, and feasibility [4].
Extensive research [6,9,47] has validated the prognostic advantage of patients who achieve MRD negativity. Achieving MRD negativity identifies a subset of patients with markedly reduced risk of disease progression. The PETHEMA/GEM2012MENOS65 trial demonstrated that accomplishing MRD negativity before maintenance therapy was associated with an 82% reduction in progression risk and an 88% reduction in death risk [27]. In this group, median PFS was 63 months, whereas in patients achieving only CR, median PFS was 27 months [27]. Similarly, Lahuerta et al. showed that MRD-positive patients in CR had identical outcomes to patients achieving very good partial response (VGPR) and partial response (PR), with PFS between 27 and 29 months [48].
One large meta-analysis conducted by Munshi et al. analyzed data from 44 studies and 4,297 patients and confirmed that MRD negativity is associated with remarkably improved survival outcomes, regardless of disease setting (newly diagnosed or relapsed/refractory disease), thresholds used for MRD, cytogenetic risk, and method used for MRD assessment [6]. Compared to MRD-positive patients, achievement of MRD negativity was associated with significantly improved PFS (HR, 0.33; 95% CI, 0.29-0.37; P<0.001) and OS (HR, 0.45; 95% CI, 0.39-0.51; P<0.001). Multivariate analysis further demonstrated that achievement of MRD negativity is an independent prognostic factor, regardless of age, disease stage, cytogenetics, or transplant eligibility [6].
Risk is a dynamic factor, since patients with a non-favorable prognosis may shift into a better prognosis through accomplishment of MRD negativity. Thus, patients with initially poor prognoses can achieve outcomes comparable to lower-risk patients if MRD negativity is reached. This dynamic nature of risk suggests that MRD negativity should be pursued across different patient subgroups, including older and transplant-ineligible individuals, to ameliorate patient outcomes [27,48,49].
The most recent and largest meta-analysis (EVIDENCE meta-analysis) conducted by Landgren et al. examined data from over 4,900 patients across multiple clinical trials, confirming that MRD negativity at 12 months is strongly correlated with improved progression-free survival (PFS) and overall survival (OS), with global odds ratios of 4.02 for PFS in newly diagnosed patients and 7.67 in the relapsed/refractory setting. These findings suggest that MRD negativity is a robust prognostic marker that can accelerate drug approvals by serving as an early clinical endpoint, further supporting its utility in guiding therapeutic decisions [50]. Similarly, the MASTER trial demonstrated that 81% of patients reached MRD negativity with quadruplet induction therapy, and those who achieved a sustained MRD-negative, treatment-free state (termed MRD-SURE) had excellent long-term outcomes, including high 3-year OS and PFS rates, irrespective of cytogenetic risk. This evidence highlights MRD negativity as an essential marker for guiding treatment and risk stratification in both standard and high-risk MM patients [51].
Thus, application of MFC and NGF in MM patients for MRD evaluation provides a robust tool for improving risk stratification, assessing therapeutic efficacy, and identifying those at higher risk of short-term progression. MRD negativity represents a critical goal for achieving improved patient outcomes, offering insights that surpass the limitations of conventional response criteria [42,49].
4.4.2. Prognostication Through Immunophenotypic Expression Characteristics
Persistence of residual tumor burden after treatment correlates with worse outcomes. However, there is considerable heterogeneity in survival outcomes among MRD-positive patients. Recently, with the ability to detect extremely low levels of residual disease, there is also a growing need to stratify MRD-positive patients. Unlike other MRD assessment techniques, flow cytometry offers additional insights into tumor biological behavior through immunophenotypic analysis, providing valuable prognostic information [13,52].
One of the most commonly studied markers on the surface of malignant plasma cells is CD56, which is expressed in approximately 70-80% of multiple myeloma (MM) cases. Studies have shown that the absence of CD56 correlates with poor prognosis, including elevated levels of lactate dehydrogenase (LDH), increased β2-microglobulin, higher International Staging System (ISS) stage, and greater bone marrow infiltration. Additionally, CD56 expression showed a more mature degree of plasma cell differentiation. However, the effect on overall survival in CD56-negative patients remains a controversial issue of extensive research [53].
The expression of CD200 has also garnered significant attention. CD200 is present in about 70-75% of aberrant plasma cells in MM. CD200-positive patients tend to have significantly shorter OS compared to their CD200-negative counterparts (p = 0.009) [54]. The adverse effect of CD200 expression is believed to be immunomodulatory, involving dysregulation of the CD4/CD8 T-cell ratio, particularly through an increase in CD8 T-cells. Some studies suggest that dynamic changes in CD200 expression during treatment may have prognostic value, with many patients shifting to CD200 negativity, which is associated with improved survival outcomes. However, dynamic changes in CD200 expression may also be of prognostic value. Most patients shift to CD200 negativity through the course of treatment. Those patients had favorable survival outcomes compared to others. Consequently, baseline detection of CD200 through flow cytometry and monitoring its expression throughout the disease course may extract prognostic information. However, to date, CD200 is not one of the commonly used markers suggested by the EuroFlow consortium [54].
Sahara et al. demonstrated that MM patients expressing CD33 exhibited higher levels of β2-microglobulin and LDH, as well as higher incidence of anemia and thrombocytopenia. Their study found that CD33-positive patients had significantly shorter 3-year survival compared to CD33-negative patients (p = 0.042). CD33 expression was linked to drug resistance, as it increased in some patients following treatment [55]. Another key marker, CD28, is expressed in the majority of aberrant plasma cells and becomes more prevalent as the disease progresses, particularly in advanced stages such as extramedullary disease, relapse, or secondary plasma cell leukemia [21].
Recently, Zohar et al. investigated the prognostic impact of CD24. CD24 is a glycoprotein found in the membrane surface that is thought to stimulate cell adhesion to the bone marrow extracellular matrix. Its role has also been studied in solid tumors, where it has been correlated with metastatic disease formation and poor prognosis. It acts as a differentiation marker on B-cell progenitors, and its expression decreases once lymphocytes enter the germinal center and undergo terminal differentiation. In MM, CD24 expression presents a dynamic pattern, with CD24 levels being elevated in progressive stages of the disease. However, contrary to solid malignancy behavior, in MM higher CD24 expression is correlated with greater survival rates and overall better prognosis, as CD24-positive plasma cells present less tumorigenic behavior than CD24-negative plasma cells. Furthermore, in a series of 124 patients with newly diagnosed MM or primary amyloidosis, it has been shown that patients with CD24 expression (with a cut-off level of 5% on PCs at diagnosis) have a median PFS of 36.2 months, compared to 22.8 months for patients with lower expression levels (p = 0.002) [56].
Moreover, Chen et al. explored the prognostic impact of CD81 and CD117 expression. They found that CD117+ patients had longer PFS and overall survival (OS), whereas CD81+ patients had shorter PFS and OS. Based on CD81 and CD117 expression, patients were categorized into three groups: CD117+/CD81- (good prognosis), CD117-/CD81+ (poor prognosis), and a mixed group (intermediate prognosis) [35].
Arana et al. studied the prognostic significance of various immunophenotypic markers in 1,265 patients enrolled in the GEM/PETHEMA studies. They found that the combination of CD19+, CD27-, CD38low, CD45+, CD81+, CD117-, and CD138low was associated with worse outcomes. Multivariate analysis revealed that the CD38low, CD117-, and CD81+ phenotype had an independent adverse impact on survival, with significantly lower PFS (median 22 vs. 35 months) and OS (median 43 vs. 76 months). The study also noted that a phenotypic combination of CD138high, CD38high, and CD19- was associated with superior survival outcomes. Furthermore, the study observed antigen expression shifts during MRD assessment, particularly with CD81. These shifts were detected in approximately 17% of patients, primarily involving CD81, and did not affect overall MRD detection [52].
Another critical application of MFC is the ability to provide real-time information on other parameters beyond MRD, offering insights into the biological behavior of the malignancy. Paiva et al. analyzed 40 elderly MM patients enrolled in the GEM2010MAS65 study to characterize the immunophenotypic and genetic features of chemoresistant MRD clones. Using 8-color flow cytometry, they identified significant upregulation of integrins such as CD11a, CD11c, CD29, CD44, CD49d, CD49e, CD54, CD138, CXCR4, and HLA-DR in these resistant cells [57]. These phenotypic differences are considered to result from therapy-induced phenotypic selection between diagnosis and MRD stage, showing greater expression of integrins and adhesion molecules, giving these resistant cells a survival advantage [57,58]. In summary, immunophenotypic profiling through flow cytometry has emerged as a powerful tool in understanding the prognostic landscape of multiple myeloma, offering crucial insights into patient outcomes and resistance mechanisms.
5. Circulating Tumor Plasma Cells (CTPCs) and Peripheral Blood Assessment
Despite bone marrow being the most frequently involved tissue in plasma cell neoplasms, several studies report involvement of circulating tumor plasma cells in most patients. Plasma cell identification in peripheral blood depends on the subtype of plasma cell neoplasm, biological behavior, and sensitivity of the technique used. With conventional microscopy, due to its limited sensitivity and small number of assessed cells, CTPCs are identified only in a subset of patients with significant disease dissemination and aggressive disease behavior [59,60]. Currently, using more sensitive techniques such as MFC and NGF, CTPCs are found in the majority of treatment-naïve patients, and higher CTPC levels are associated with worse clinical outcomes [61].
Sanoja Flores et al. [59], utilizing NGF, showed that CTPCs may be found in 70% of patients with plasma cell neoplasms. The frequency of CTPC identification gradually increased from patients with solitary plasmacytoma (18%) to MGUS (59%) to smoldering multiple myeloma (SMM) and MM (100%). Additionally, since every CTPC-positive case is also MRD-positive, enumeration of CTPCs may indicate a surrogate marker of persistent disease [59]. Thus, use of CTPCs as a biomarker for disease evaluation has attracted attention due to the minimally invasive nature of liquid biopsies, precise enumeration of CTPCs, independence from hemodilution and the patchy nature of MM, and the association between CTPC numbers and disease aggressiveness [59,61,62].
Extensive research has been conducted using flow cytometry studies to support the correlation between CTPC numbers and disease dissemination and to establish CTPC quantification as a disease severity biomarker. Sanoja Flores et al., using ROC curve analysis and a cut-off of 0.058 CTPCs/μL, identified MGUS cases with increased risk of progression to symptomatic MM and a small subset of MM cases with more benign clinical behavior (MGUS-like phenotype) that display significantly longer survival and time-to-progression based on their CTPC absolute numbers [59]. Multiple studies have supported that high levels of CTPCs strongly correlate with worse outcomes in newly diagnosed multiple myeloma (NDMM). Multivariable analysis showed that patients with advanced ISS stage (ISS II and III), increased levels of LDH and β2-microglobulin, and high-risk cytogenetics present increased levels of CTPCs [61,62,63,64].
Kostopoulos et al. analyzed 525 matched bone marrow and peripheral blood samples from patients with NDMM using NGF. After median follow-up of 42 months, investigators used a cut-off of 0.02% of CTPCs for risk stratification. NDMM patients with CTPCs >0.02% showed a 2.2-fold higher risk of progression compared to patients with CTPCs <0.02% (36 vs. 60 months), which was independent of baseline characteristics. Immune composition analysis showed that patients with increased CTPCs presented a plasma cell leukemia-like profile in terms of cell migration, proliferation, and DNA damage control. These patients presented increased numbers of CD8+ T-cells, NK cells, tumor-associated macrophages, and an elevated ratio of memory to naïve B cells, indicating more cytotoxic behavior [65].
Garcés et al., using NGF, also proved the prognostic significance of CTPCs in a total of 374 transplant-eligible patients with NDMM [66]. Five-year rates of PFS progressively deteriorated in cases with increasingly higher logarithmic percentages of CTPCs, from >0.0001% to >1%. A cut-off of 0.01% was used for risk stratification, showing that patients with CTPCs >0.01% had inferior PFS and OS than patients with CTPCs <0.01%. That study aimed to incorporate CTPC count with other most used prognostic factors (ISS stage, lactate dehydrogenase levels, and cytogenetics) to improve risk stratification. With median follow-up of 5 years, 90% of patients with undetectable CTPCs after receiving fixed-duration maintenance therapy remain progression-free. Another study conducted by Sathya et al., using a baseline cut-off of 0.197%, showed that there was significant association between CTPC percentage at baseline and depth of response (p = 0.008), as patients with baseline CTPCs <0.197% tend to have deeper responses (VGPR and above) post-induction [66].
Primary plasma cell leukemia (pPCL) is the most aggressive form of plasma cell dyscrasias. It was formerly characterized by ≥20% plasma cells in peripheral blood until 2021, when diagnostic criteria were revised and the threshold was decreased to ≥5%. Jelinek et al. used 8-color flow cytometry to give prominence to the dismal prognosis of patients with increased CTPCs, assessing a total of 590 transplant-eligible and transplant-ineligible patients [67]. They used a clinically relevant cutoff of 2%, dividing patients into two groups: one being patients with <2% CTPCs and the other being patients with CTPCs from 2 to 20%. Patients with >2% CTPCs were compared to a pPCL patient cohort. Overall survival rates were identical, and the difference was not statistically significant (13 vs. 14.6 months, p = 0.908). Thus, using flow cytometry, they established a threshold of 2% to identify extremely high-risk patients with pPCL-like clinical behavior and similar outcomes [60,67,68].
In summary, detection of CTPCs using flow cytometry may provide valuable insights into management and risk stratification of MM patients. CTPCs serve as a surrogate biomarker of great significance to assess disease burden and dissemination, as higher counts of CTPCs are an independent prognostic factor associated with dismal outcomes. Evaluation of peripheral blood through flow cytometry provides a minimally invasive approach, not affected by patchy disease distribution and hemodilution, to monitor treatment response and therefore prognosis of MM patients. Extensive research has been and is ongoing to validate the role of flow cytometry studies in peripheral blood and to establish this technique as a first-line component of patient monitoring [63,66].
6. Immune Composition Assessment Using Flow Cytometry
Multiple myeloma is characterized by proliferation of neoplastic plasma cells in the bone marrow compartment, altering the bone marrow microenvironment and immune cell composition. Interactions between cellular components and dysregulation of the immune profile create an immunosuppressive state, rendering the bone marrow susceptible to tumor cell proliferation and drug resistance [69]. Flow cytometry has been applied to assess immune cell profiles at different stages of the disease and associate immune composition with patient outcomes. The NGF protocol allows evaluation of the whole bone marrow compartment and monitoring of cellular composition alterations that may arise during relapse [70].
Multiple myeloma patients achieving long-term disease control present a considerably different immune profile compared to patients with symptomatic multiple myeloma and healthy patients. Pessoa de Magalhães et al. [71] used flow cytometry to compare immune profiles of multiple myeloma patients in long-term remission with those who had symptomatic MM. They found that patients in long-term remission had an expanded population of CD8+ T-cells and natural killer (NK) cells, along with a lower CD4/CD8 ratio, suggesting a more cytotoxic immune environment. This immune profile was associated with better disease control and outcomes, highlighting the role of immune surveillance in long-term disease remission [71].
Paiva et al. [72] used 8-color flow cytometry to investigate whether immune profile at the time of MRD assessment was of prognostic significance. It categorizes patients into three immune profile groups based on cell counts of B-cell precursors, mature B-cells, and erythroblasts. The study reported that patients with more favorable immune composition—characterized by higher counts of mature naïve and memory B-cells—had significantly better overall survival and progression-free survival, even among MRD-positive patients. These data highlight the prognostic value of immune profiling alongside MRD monitoring [72].
Luoma et al. categorized patients into two groups based on their response to therapy and investigated their respective immune profiles. Using flow cytometry, they found that patients responding well to treatment had increased cytotoxic T-cell and NK-cell populations with higher expression of cytotoxicity markers (such as CD45RA and CD57). Patients who responded poorly showed higher numbers of CD4+ T-cells and memory cells, indicating a less effective immune response. This study suggests that immune profiling can provide insights into mechanisms of response and resistance to immunomodulatory treatments like lenalidomide [69].
Krzywdzinska et al., using the EuroFlow panel, assessed bone marrow microenvironment immune composition alterations in patients at biochemical relapse. The study reported a reduction in B-cell precursors and an increase in memory B-cells during disease progression, along with a slight rise in T-cell and NK-cell numbers. These findings suggest that patients at relapse exhibit a shift toward a more memory-dominant immune profile, which could potentially impact disease recurrence and treatment resistance. This profiling offers insights into the immune system's involvement in MM progression [70].
7. Other Perspectives
The establishment of MFC for monitoring MM patients is an achievement of recent years, mainly aiming for MRD detection, predominantly for prognostication purposes. The purpose of MRD evaluation in MM is to extract information regarding disease status on which clinical decisions should be based. Therefore, it is necessary that MRD assessment should provide reproducible, reliable, prognostically relevant, and quick answers to face clinical uncertainties and dilemmas, differentiating patients who are likely to benefit from certain interventions. Since multi-drug treatment regimens come with increased toxicity, especially in older, frail patients, evaluation of MRD should provide guidance concerning therapy regimens, intensity, and duration based on MRD status. For instance, MRD positivity after treatment raises the question of whether it is necessary to change the treatment regimen or address treatment intensification to improve response depth. MRD negativity after therapy may be an indication for treatment de-escalation or even discontinuation of maintenance therapy, especially in patients with many comorbidities [17,20]. However, to date, MFC is not routinely used as a tool to provide treatment decision guidance. The impact of MRD assessment in clinical decision-making needs to be determined, and extensive research is ongoing to validate its significance. MFC and especially NGF, as mentioned above, provide a highly applicable and available method of therapy response evaluation that can be assessed at any point of therapy without the need for a baseline sample. However, even though the prognostic significance of MRD is validated, extensive debate is ongoing about its predictive value and whether it should be used for guidance in clinical decision-making. Further studies are required to establish the predictive value of MRD assessment.
It should be underlined that multiple myeloma is a patchy disease with also the potential presence of extramedullary sites of active disease. Extramedullary disease may be present in approximately 10% of patients at diagnosis and is associated with poor prognosis. Given the spatial heterogeneity of MM and the fact that bone marrow MRD is assessed from a specific point of aspiration, it is crucial that a more systemic approach is mandatory. Paiva et al. demonstrated that even in NGF MRD-negative patients, early relapses still occur, attributed to the presence of extramedullary disease and circulating tumor cells [8,37,48]. Imaging, with PET-CT being the greatest representative, plays a complementary role to bone marrow MRD [73]. Rasche et al. showed that patients who were both flow-MRD and PET/CT-MRD negative had better prognosis, with the best PFS outcome, as compared to flow-MRD negative but PET/CT positive or vice versa [42,74,75].
MRI is an imaging technique with great value at diagnosis, according to the IMWG criteria [4]. However, focal lesions may take time to disappear, even in patients responding to therapy, thus making MRI an inferior tool for response assessment compared to PET-CT. The answer to distinguishing active disease and bone remodeling through MRI was given through functional Diffusion Weighted Imaging (DWI). MRI with DWI assays presents comparable results to PET/CT when addressing response to therapy through imaging [8,76].
Hemodilution is a main technical issue that may corrupt MRD analysis of bone marrow, giving at times false negative MRD results, even if enough cells are obtained. Thus, it is crucial to evaluate the quality of the aspirated sample through assessing cellularity and analyzing additional cell populations with a high degree of partition between bone marrow and peripheral blood. It is worth mentioning that MFC may provide an overall assessment of the bone marrow compartment and sample quality check, identifying possible sample contamination and hemodilution. These populations include nucleated red blood cells (cells negative for all antigens commonly tested in myeloma MRD tube), mast cells (exceptionally bright CD117 with somewhat increased side scatter), early maturing B cells (hematogones) (CD19-positive cells with bright CD81 and CD38 without cytoplasmic light chain expression with relatively dim CD45), and early myeloid and erythroid precursors (CD117-positive, CD27-negative cells). Evaluation of these additional populations was automated by the EuroFlow assay and can also be easily performed manually outside of the platform [9,25]. Hemodiluted samples are inadequate for MRD detection; therefore, qualitative assessment of bone marrow aspirate is of great significance before drawing further conclusions [10].
8. Conclusion
In previous years, immunophenotyping with the use of MFC has not been routinely used for MM patients, unlike other hematological malignancies where MFC had wide acceptance. Currently, consensus exists about the usefulness of MFC, especially in the following disciplines in the MM field: first, differential diagnosis of plasma cell disorders and other hematological malignancies; second, evaluation of response depth and MRD monitoring; and third, prognostic stratification of MM patients. Furthermore, application of MFC to peripheral blood samples offers a minimally invasive approach to assessing disease dissemination and prognosis, facilitating frequent monitoring throughout treatment. Consequently, it is of great importance that MFC should be incorporated in routine monitoring of MM patients in day-to-day clinical practice, complementing conventional methods of disease follow-up. Continued research is essential to further expand the capabilities of MFC, with the aim of improving patient care and outcomes in MM.
Author Contributions
Conceptualization, E.H. and D.L.; literature review and data collection, D.L., A.E.K., V.G., and E.A.; drafting of the original manuscript, D.L. and E.K.; critical revision and editing, E.H. E.K. and L.B.; visualization and graphical abstract, A.E.K.; supervision and project oversight, E.H. All authors have read and approved the final version of the manuscript.
Funding
This research received no external funding.
Institutional Review Board Statement
This study does not involve experiments on humans or animals or patients’ personal information.
Data Availability Statement
Our study is a review of the current international literature, which is analyzed in the reference section. No new data were created or analyzed in this study. Therefore, data sharing is not applicable to this article.
Acknowledgments
Generative AI tools were used exclusively for language refinement and grammatical editing during the preparation of this manuscript. These tools were not employed for data extraction, analysis, or scientific interpretation. All outputs were critically reviewed and edited by the authors, who assume full responsibility for the content and conclusions presented in this publication.
Conflicts of Interest
The authors declare no conflicts of interest.
Abbreviations
The following abbreviations are used in this manuscript:
| MFC | Multiparameter Flow Cytometry |
| NGF | Next Generation Flow |
| CTPCs | Circulating Tumor Plasma Cells |
| MRD | Measurable residual Disease |
References
- Rajkumar, S.V.; Dimopoulos, M.A.; Palumbo, A.; Blade, J.; Merlini, G.; Mateos, M.V.; Kumar, S.; Hillengass, J.; Kastritis, E.; Richardson, P.; et al. International Myeloma Working Group updated criteria for the diagnosis of multiple myeloma. Lancet Oncol 2014, 15, e538–548. [Google Scholar] [CrossRef] [PubMed]
- Kumar, S.K.; Rajkumar, V.; Kyle, R.A.; van Duin, M.; Sonneveld, P.; Mateos, M.V.; Gay, F.; Anderson, K.C. Multiple myeloma. Nat Rev Dis Primers 2017, 3, 17046. [Google Scholar] [CrossRef]
- van de Donk, N.; Pawlyn, C.; Yong, K.L. Multiple myeloma. Lancet 2021, 397, 410–427. [Google Scholar] [CrossRef]
- Kumar, S.; Paiva, B.; Anderson, K.C.; Durie, B.; Landgren, O.; Moreau, P.; Munshi, N.; Lonial, S.; Bladé, J.; Mateos, M.V.; et al. International Myeloma Working Group consensus criteria for response and minimal residual disease assessment in multiple myeloma. Lancet Oncol 2016, 17, e328–e346. [Google Scholar] [CrossRef]
- Bal, S.; Weaver, A.; Cornell, R.F.; Costa, L.J. Challenges and opportunities in the assessment of measurable residual disease in multiple myeloma. Br J Haematol 2019, 186, 807–819. [Google Scholar] [CrossRef] [PubMed]
- Munshi, N.C.; Avet-Loiseau, H.; Anderson, K.C.; Neri, P.; Paiva, B.; Samur, M.; Dimopoulos, M.; Kulakova, M.; Lam, A.; Hashim, M.; et al. A large meta-analysis establishes the role of MRD negativity in long-term survival outcomes in patients with multiple myeloma. Blood Adv 2020, 4, 5988–5999. [Google Scholar] [CrossRef] [PubMed]
- Maclachlan, K.H.; Came, N.; Diamond, B.; Roshal, M.; Ho, C.; Thoren, K.; Mayerhoefer, M.E.; Landgren, O.; Harrison, S. Minimal residual disease in multiple myeloma: defining the role of next generation sequencing and flow cytometry in routine diagnostic use. Pathology 2021, 53, 385–399. [Google Scholar] [CrossRef]
- Diamond, B.T.; Rustad, E.; Maclachlan, K.; Thoren, K.; Ho, C.; Roshal, M.; Ulaner, G.A.; Landgren, C.O. Defining the undetectable: The current landscape of minimal residual disease assessment in multiple myeloma and goals for future clarity. Blood Rev 2021, 46, 100732. [Google Scholar] [CrossRef]
- Munshi, N.C.; Avet-Loiseau, H.; Rawstron, A.C.; Owen, R.G.; Child, J.A.; Thakurta, A.; Sherrington, P.; Samur, M.K.; Georgieva, A.; Anderson, K.C.; et al. Association of Minimal Residual Disease With Superior Survival Outcomes in Patients With Multiple Myeloma: A Meta-analysis. JAMA Oncol 2017, 3, 28–35. [Google Scholar] [CrossRef] [PubMed]
- Romano, A.; Palumbo, G.A.; Parrinello, N.L.; Conticello, C.; Martello, M.; Terragna, C. Minimal Residual Disease Assessment Within the Bone Marrow of Multiple Myeloma: A Review of Caveats, Clinical Significance and Future Perspectives. Front Oncol 2019, 9, 699. [Google Scholar] [CrossRef] [PubMed]
- Kothari, S.; Hillengass, J.; McCarthy, P.L.; Holstein, S.A. Determination of Minimal Residual Disease in Multiple Myeloma: Does It Matter? Curr Hematol Malig Rep 2019, 14, 39–46. [Google Scholar] [CrossRef]
- Galtseva, I.V.; Davydova, Y.O.; Kapranov, N.M.; Julhakyan, H.L.; Mendeleeva, L.P. Minimal residual disease in multiple myeloma: Benefits of flow cytometry. Int J Lab Hematol 2018, 40, 12–20. [Google Scholar] [CrossRef]
- Jelinek, T.; Bezdekova, R.; Zatopkova, M.; Burgos, L.; Simicek, M.; Sevcikova, T.; Paiva, B.; Hajek, R. Current applications of multiparameter flow cytometry in plasma cell disorders. Blood Cancer J 2017, 7, e617. [Google Scholar] [CrossRef]
- Rawstron, A.C.; Davies, F.E.; DasGupta, R.; Ashcroft, A.J.; Patmore, R.; Drayson, M.T.; Owen, R.G.; Jack, A.S.; Child, J.A.; Morgan, G.J. Flow cytometric disease monitoring in multiple myeloma: the relationship between normal and neoplastic plasma cells predicts outcome after transplantation. Blood 2002, 100, 3095–3100. [Google Scholar] [CrossRef]
- San Miguel, J.F.; Almeida, J.; Mateo, G.; Bladé, J.; López-Berges, C.; Caballero, D.; Hernández, J.; Moro, M.J.; Fernández-Calvo, J.; Díaz-Mediavilla, J.; et al. Immunophenotypic evaluation of the plasma cell compartment in multiple myeloma: a tool for comparing the efficacy of different treatment strategies and predicting outcome. Blood 2002, 99, 1853–1856. [Google Scholar] [CrossRef] [PubMed]
- McKinnon, K.M. Flow Cytometry: An Overview. Curr Protoc Immunol 2018, 120, 5.1–1. [Google Scholar] [CrossRef] [PubMed]
- Mina, R.; Oliva, S.; Boccadoro, M. Minimal Residual Disease in Multiple Myeloma: State of the Art and Future Perspectives. J Clin Med 2020, 9. [Google Scholar] [CrossRef] [PubMed]
- Bertamini, L.; D'Agostino, M.; Gay, F. MRD Assessment in Multiple Myeloma: Progress and Challenges. Curr Hematol Malig Rep 2021, 16, 162–171. [Google Scholar] [CrossRef]
- Yanamandra, U.; Kumar, S.K. Minimal residual disease analysis in myeloma - when, why and where. Leuk Lymphoma 2018, 59, 1772–1784. [Google Scholar] [CrossRef]
- Oliva, S.; D'Agostino, M.; Boccadoro, M.; Larocca, A. Clinical Applications and Future Directions of Minimal Residual Disease Testing in Multiple Myeloma. Front Oncol 2020, 10, 1. [Google Scholar] [CrossRef]
- Paiva, B.; Merino, J.; San Miguel, J.F. Utility of flow cytometry studies in the management of patients with multiple myeloma. Curr Opin Oncol 2016, 28, 511–517. [Google Scholar] [CrossRef] [PubMed]
- Paiva, B.; van Dongen, J.J.; Orfao, A. New criteria for response assessment: role of minimal residual disease in multiple myeloma. Blood 2015, 125, 3059–3068. [Google Scholar] [CrossRef]
- Soh, K.T.; Wallace, P.K. Evaluation of measurable residual disease in multiple myeloma by multiparametric flow cytometry: Current paradigm, guidelines, and future applications. Int J Lab Hematol 2021, 43 Suppl 1, 43–53. [Google Scholar] [CrossRef]
- Soh, K.T.; Came, N.; Otteson, G.E.; Jevremovic, D.; Shi, M.; Olteanu, H.; Natoni, A.; Lagoo, A.; Theakston, E.; Óskarsson, J.; et al. Evaluation of multiple myeloma measurable residual disease by high sensitivity flow cytometry: An international harmonized approach for data analysis. Cytometry B Clin Cytom 2022, 102, 88–106. [Google Scholar] [CrossRef]
- Flanders, A.; Stetler-Stevenson, M.; Landgren, O. Minimal residual disease testing in multiple myeloma by flow cytometry: major heterogeneity. Blood 2013, 122, 1088–1089. [Google Scholar] [CrossRef] [PubMed]
- Flores-Montero, J.; de Tute, R.; Paiva, B.; Perez, J.J.; Böttcher, S.; Wind, H.; Sanoja, L.; Puig, N.; Lecrevisse, Q.; Vidriales, M.B.; et al. Immunophenotype of normal vs. myeloma plasma cells: Toward antibody panel specifications for MRD detection in multiple myeloma. Cytometry B Clin Cytom 2016, 90, 61–72. [Google Scholar] [CrossRef] [PubMed]
- Paiva, B.; Puig, N.; Cedena, M.T.; Rosiñol, L.; Cordón, L.; Vidriales, M.B.; Burgos, L.; Flores-Montero, J.; Sanoja-Flores, L.; Lopez-Anglada, L.; et al. Measurable Residual Disease by Next-Generation Flow Cytometry in Multiple Myeloma. J Clin Oncol 2020, 38, 784–792. [Google Scholar] [CrossRef]
- Flores-Montero, J.; Sanoja-Flores, L.; Paiva, B.; Puig, N.; García-Sánchez, O.; Böttcher, S.; van der Velden, V.H.J.; Pérez-Morán, J.J.; Vidriales, M.B.; García-Sanz, R.; et al. Next Generation Flow for highly sensitive and standardized detection of minimal residual disease in multiple myeloma. Leukemia 2017, 31, 2094–2103. [Google Scholar] [CrossRef]
- Terpos, E.; Kostopoulos, I.V.; Kastritis, E.; Ntanasis-Stathopoulos, I.; Migkou, M.; Rousakis, P.; Argyriou, A.T.; Kanellias, N.; Fotiou, D.; Eleutherakis-Papaiakovou, E.; et al. Impact of Minimal Residual Disease Detection by Next-Generation Flow Cytometry in Multiple Myeloma Patients with Sustained Complete Remission after Frontline Therapy. Hemasphere 2019, 3, e300. [Google Scholar] [CrossRef]
- Rawstron, A.C.; Orfao, A.; Beksac, M.; Bezdickova, L.; Brooimans, R.A.; Bumbea, H.; Dalva, K.; Fuhler, G.; Gratama, J.; Hose, D.; et al. Report of the European Myeloma Network on multiparametric flow cytometry in multiple myeloma and related disorders. Haematologica 2008, 93, 431–438. [Google Scholar] [CrossRef]
- Arroz, M.; Came, N.; Lin, P.; Chen, W.; Yuan, C.; Lagoo, A.; Monreal, M.; de Tute, R.; Vergilio, J.A.; Rawstron, A.C.; et al. Consensus guidelines on plasma cell myeloma minimal residual disease analysis and reporting. Cytometry B Clin Cytom 2016, 90, 31–39. [Google Scholar] [CrossRef] [PubMed]
- Ocqueteau, M.; Orfao, A.; Almeida, J.; Bladé, J.; González, M.; García-Sanz, R.; López-Berges, C.; Moro, M.J.; Hernández, J.; Escribano, L.; et al. Immunophenotypic characterization of plasma cells from monoclonal gammopathy of undetermined significance patients. Implications for the differential diagnosis between MGUS and multiple myeloma. Am J Pathol 1998, 152, 1655–1665. [Google Scholar]
- Anderson, K.C.; Auclair, D.; Adam, S.J.; Agarwal, A.; Anderson, M.; Avet-Loiseau, H.; Bustoros, M.; Chapman, J.; Connors, D.E.; Dash, A.; et al. Minimal Residual Disease in Myeloma: Application for Clinical Care and New Drug Registration. Clin Cancer Res 2021, 27, 5195–5212. [Google Scholar] [CrossRef]
- Kumar, S.; Kimlinger, T.; Morice, W. Immunophenotyping in multiple myeloma and related plasma cell disorders. Best Pract Res Clin Haematol 2010, 23, 433–451. [Google Scholar] [CrossRef]
- Chen, F.; Hu, Y.; Wang, X.; Fu, S.; Liu, Z.; Zhang, J. Expression of CD81 and CD117 in plasma cell myeloma and the relationship to prognosis. Cancer Med 2018, 7, 5920–5927. [Google Scholar] [CrossRef]
- Kostopoulos, I.V.; Ntanasis-Stathopoulos, I.; Gavriatopoulou, M.; Tsitsilonis, O.E.; Terpos, E. Minimal Residual Disease in Multiple Myeloma: Current Landscape and Future Applications With Immunotherapeutic Approaches. Front Oncol 2020, 10, 860. [Google Scholar] [CrossRef]
- Paiva, B.; Almeida, J.; Pérez-Andrés, M.; Mateo, G.; López, A.; Rasillo, A.; Vídriales, M.B.; López-Berges, M.C.; Miguel, J.F.; Orfao, A. Utility of flow cytometry immunophenotyping in multiple myeloma and other clonal plasma cell-related disorders. Cytometry B Clin Cytom 2010, 78, 239–252. [Google Scholar] [CrossRef] [PubMed]
- Paiva, B.; Vidriales, M.B.; Mateo, G.; Pérez, J.J.; Montalbán, M.A.; Sureda, A.; Montejano, L.; Gutiérrez, N.C.; García de Coca, A.; de las Heras, N.; et al. The persistence of immunophenotypically normal residual bone marrow plasma cells at diagnosis identifies a good prognostic subgroup of symptomatic multiple myeloma patients. Blood 2009, 114, 4369–4372. [Google Scholar] [CrossRef] [PubMed]
- Paiva, B.; Vídriales, M.B.; Rosiñol, L.; Martínez-López, J.; Mateos, M.V.; Ocio, E.M.; Montalbán, M.; Cordón, L.; Gutiérrez, N.C.; Corchete, L.; et al. A multiparameter flow cytometry immunophenotypic algorithm for the identification of newly diagnosed symptomatic myeloma with an MGUS-like signature and long-term disease control. Leukemia 2013, 27, 2056–2061. [Google Scholar] [CrossRef] [PubMed]
- Seegmiller, A.C.; Xu, Y.; McKenna, R.W.; Karandikar, N.J. Immunophenotypic differentiation between neoplastic plasma cells in mature B-cell lymphoma vs plasma cell myeloma. Am J Clin Pathol 2007, 127, 176–181. [Google Scholar] [CrossRef]
- Ding, H.; Xu, J.; Lin, Z.; Huang, J.; Wang, F.; Yang, Y.; Cui, Y.; Luo, H.; Gao, Y.; Zhai, X.; et al. Minimal residual disease in multiple myeloma: current status. Biomarker Research 2021, 9, 75. [Google Scholar] [CrossRef] [PubMed]
- Goicoechea, I.; Puig, N.; Cedena, M.T.; Burgos, L.; Cordón, L.; Vidriales, M.B.; Flores-Montero, J.; Gutierrez, N.C.; Calasanz, M.J.; Ramos, M.M.; et al. Deep MRD profiling defines outcome and unveils different modes of treatment resistance in standard- and high-risk myeloma. Blood 2021, 137, 49–60. [Google Scholar] [CrossRef] [PubMed]
- Roshal, M.; Flores-Montero, J.A.; Gao, Q.; Koeber, M.; Wardrope, J.; Durie, B.G.M.; Dogan, A.; Orfao, A.; Landgren, O. MRD detection in multiple myeloma: comparison between MSKCC 10-color single-tube and EuroFlow 8-color 2-tube methods. Blood Adv 2017, 1, 728–732. [Google Scholar] [CrossRef] [PubMed]
- Avet-Loiseau, H.; Bene, M.C.; Wuilleme, S.; Corre, J.; Attal, M.; Arnulf, B.; Garderet, L.; Macro, M.; Stoppa, A.-M.; Delforge, M.; et al. Concordance of Post-consolidation Minimal Residual Disease Rates by Multiparametric Flow Cytometry and Next-generation Sequencing in CASSIOPEIA. Clinical Lymphoma Myeloma and Leukemia 2019, 19, e3–e4. [Google Scholar] [CrossRef]
- Medina, A.; Puig, N.; Flores-Montero, J.; Jimenez, C.; Sarasquete, M.E.; Garcia-Alvarez, M.; Prieto-Conde, I.; Chillon, C.; Alcoceba, M.; Gutierrez, N.C.; et al. Comparison of next-generation sequencing (NGS) and next-generation flow (NGF) for minimal residual disease (MRD) assessment in multiple myeloma. Blood Cancer J 2020, 10, 108. [Google Scholar] [CrossRef]
- Levin, A.; Hari, P.; Dhakal, B. Novel biomarkers in multiple myeloma. Transl Res 2018, 201, 49–59. [Google Scholar] [CrossRef]
- Landgren, O.; Devlin, S.; Boulad, M.; Mailankody, S. Role of MRD status in relation to clinical outcomes in newly diagnosed multiple myeloma patients: a meta-analysis. Bone Marrow Transplant 2016, 51, 1565–1568. [Google Scholar] [CrossRef]
- Lahuerta, J.J.; Paiva, B.; Vidriales, M.B.; Cordón, L.; Cedena, M.T.; Puig, N.; Martinez-Lopez, J.; Rosiñol, L.; Gutierrez, N.C.; Martín-Ramos, M.L.; et al. Depth of Response in Multiple Myeloma: A Pooled Analysis of Three PETHEMA/GEM Clinical Trials. J Clin Oncol 2017, 35, 2900–2910. [Google Scholar] [CrossRef]
- Charalampous, C.; Kourelis, T. Minimal Residual Disease Assessment in Multiple Myeloma Patients: Minimal Disease With Maximal Implications. Front Oncol 2021, 11, 801851. [Google Scholar] [CrossRef]
- Landgren, O.; Prior, T.J.; Masterson, T.; Heuck, C.; Bueno, O.F.; Dash, A.B.; Einsele, H.; Goldschmidt, H.; Knop, S.; Li, C.; et al. EVIDENCE meta-analysis: evaluating minimal residual disease as an intermediate clinical end point for multiple myeloma. Blood 2024, 144, 359–367. [Google Scholar] [CrossRef]
- Costa, L.; Medvedova, E.; Chhabra, S.; Dholaria, B.; Dhakal, B.; Godby, K.; Silberman, R.; Bal, S.; D’souza, A.; Giri, S.; et al. S203: QUADRUPLET INDUCTION THERAPY, ASCT AND MRD-MODULATED CONSOLIDATION AND TREATMENT CESSATION IN NEWLY DIAGNOSED MULTIPLE MYELOMA: FINAL ANALYSIS OF THE MASTER TRIAL. HemaSphere 2023, 7, e1332195. [Google Scholar] [CrossRef]
- Arana, P.; Paiva, B.; Cedena, M.T.; Puig, N.; Cordon, L.; Vidriales, M.B.; Gutierrez, N.C.; Chiodi, F.; Burgos, L.; Anglada, L.L.; et al. Prognostic value of antigen expression in multiple myeloma: a PETHEMA/GEM study on 1265 patients enrolled in four consecutive clinical trials. Leukemia 2018, 32, 971–978. [Google Scholar] [CrossRef]
- Koumpis, E.; Tassi, I.; Malea, T.; Papathanasiou, K.; Papakonstantinou, I.; Serpanou, A.; Tsolas, E.; Kapsali, E.; Vassilakopoulos, T.P.; Papoudou-Bai, A.; et al. CD56 expression in multiple myeloma: Correlation with poor prognostic markers but no effect on outcome. Pathol Res Pract 2021, 225, 153567. [Google Scholar] [CrossRef]
- Shi, Q.; Wu, C.; Han, W.; Zhao, S.; Wu, Y.; Jin, Y.; Qu, X.; Li, J.; Zhang, R.; Chen, L. Clinical significance of CD200 expression in newly diagnosed multiple myeloma patients and dynamic changing during treatment. Leuk Lymphoma 2021, 62, 709–715. [Google Scholar] [CrossRef]
- Sahara, N.; Ohnishi, K.; Ono, T.; Sugimoto, Y.; Kobayashi, M.; Takeshita, K.; Shigeno, K.; Nakamura, S.; Naito, K.; Tamashima, S.; et al. Clinicopathological and prognostic characteristics of CD33-positive multiple myeloma. Eur J Haematol 2006, 77, 14–18. [Google Scholar] [CrossRef] [PubMed]
- Gross Even-Zohar, N.; Pick, M.; Hofstetter, L.; Shaulov, A.; Nachmias, B.; Lebel, E.; Gatt, M.E. CD24 Is a Prognostic Marker for Multiple Myeloma Progression and Survival. J Clin Med 2022, 11. [Google Scholar] [CrossRef]
- Paiva, B.; Corchete, L.A.; Vidriales, M.B.; Puig, N.; Maiso, P.; Rodriguez, I.; Alignani, D.; Burgos, L.; Sanchez, M.L.; Barcena, P.; et al. Phenotypic and genomic analysis of multiple myeloma minimal residual disease tumor cells: a new model to understand chemoresistance. Blood 2016, 127, 1896–1906. [Google Scholar] [CrossRef]
- Paíno, T.; Paiva, B.; Sayagués, J.M.; Mota, I.; Carvalheiro, T.; Corchete, L.A.; Aires-Mejía, I.; Pérez, J.J.; Sanchez, M.L.; Barcena, P.; et al. Phenotypic identification of subclones in multiple myeloma with different chemoresistant, cytogenetic and clonogenic potential. Leukemia 2015, 29, 1186–1194. [Google Scholar] [CrossRef] [PubMed]
- Sanoja-Flores, L.; Flores-Montero, J.; Garcés, J.J.; Paiva, B.; Puig, N.; García-Mateo, A.; García-Sánchez, O.; Corral-Mateos, A.; Burgos, L.; Blanco, E.; et al. Next generation flow for minimally-invasive blood characterization of MGUS and multiple myeloma at diagnosis based on circulating tumor plasma cells (CTPC). Blood Cancer J 2018, 8, 117. [Google Scholar] [CrossRef] [PubMed]
- An, G.; Qin, X.; Acharya, C.; Xu, Y.; Deng, S.; Shi, L.; Zang, M.; Sui, W.; Yi, S.; Li, Z.; et al. Multiple myeloma patients with low proportion of circulating plasma cells had similar survival with primary plasma cell leukemia patients. Ann Hematol 2015, 94, 257–264. [Google Scholar] [CrossRef]
- Granell, M.; Calvo, X.; Garcia-Guiñón, A.; Escoda, L.; Abella, E.; Martínez, C.M.; Teixidó, M.; Gimenez, M.T.; Senín, A.; Sanz, P.; et al. Prognostic impact of circulating plasma cells in patients with multiple myeloma: implications for plasma cell leukemia definition. Haematologica 2017, 102, 1099–1104. [Google Scholar] [CrossRef]
- Yao, W.; Yang, H.; You, H.; Shang, J.; Zhai, Y.; Yan, Z.; Yan, S.; Shi, X.; Yao, Y.; Wang, J.; et al. The prognostic significance of circulating plasma cells in newly diagnosed multiple myeloma patients. Front Oncol 2023, 13, 1266868. [Google Scholar] [CrossRef]
- Sathya, P.; Kayal, S.; Srinivas, B.H.; Hamide, A.; Kar, R. Quantification of circulating clonal plasma cells by multiparametric flow cytometry as a prognostic marker in patients with newly diagnosed multiple myeloma. Int J Lab Hematol 2023, 45, 917–926. [Google Scholar] [CrossRef]
- Li, J.; Wang, N.; Tesfaluul, N.; Gao, X.; Liu, S.; Yue, B. Prognostic value of circulating plasma cells in patients with multiple myeloma: A meta-analysis. PLoS One 2017, 12, e0181447. [Google Scholar] [CrossRef] [PubMed]
- Kostopoulos, I.V.; Ntanasis-Stathopoulos, I.; Rousakis, P.; Eleutherakis-Papaiakovou, E.; Panteli, C.; Malandrakis, P.; Angelis, N.; Kanellias, N.; Orologas-Stavrou, N.; Papanota, A.; et al. Circulating Plasma Cells in Newly Diagnosed Multiple Myeloma: Prognostic and More. J Clin Oncol 2023, 41, 708–710. [Google Scholar] [CrossRef] [PubMed]
- Garcés, J.J.; Cedena, M.T.; Puig, N.; Burgos, L.; Perez, J.J.; Cordon, L.; Flores-Montero, J.; Sanoja-Flores, L.; Calasanz, M.J.; Ortiol, A.; et al. Circulating Tumor Cells for the Staging of Patients With Newly Diagnosed Transplant-Eligible Multiple Myeloma. J Clin Oncol 2022, 40, 3151–3161. [Google Scholar] [CrossRef]
- Jelinek, T.; Bezdekova, R.; Zihala, D.; Sevcikova, T.; Anilkumar Sithara, A.; Pospisilova, L.; Sevcikova, S.; Polackova, P.; Stork, M.; Knechtova, Z.; et al. More Than 2% of Circulating Tumor Plasma Cells Defines Plasma Cell Leukemia-Like Multiple Myeloma. J Clin Oncol 2023, 41, 1383–1392. [Google Scholar] [CrossRef] [PubMed]
- Hofste Op Bruinink, D.; Kuiper, R.; van Duin, M.; Cupedo, T.; van der Velden, V.H.J.; Hoogenboezem, R.; van der Holt, B.; Beverloo, H.B.; Valent, E.T.; Vermeulen, M.; et al. Identification of High-Risk Multiple Myeloma With a Plasma Cell Leukemia-Like Transcriptomic Profile. J Clin Oncol 2022, 40, 3132–3150. [Google Scholar] [CrossRef]
- Luoma, S.; Sergeev, P.; Javarappa, K.K.; Öhman, T.J.; Varjosalo, M.; Säily, M.; Anttila, P.; Sankelo, M.; Partanen, A.; Nihtinen, A.; et al. Deep Immune Profiling of Multiple Myeloma at Diagnosis and under Lenalidomide Maintenance Therapy. Cancers (Basel) 2023, 15. [Google Scholar] [CrossRef]
- Krzywdzińska, A.; Puła, B.; Szymczak, D.; Milanowska, A.; Szeremet, A.; Jamroziak, K. Immunophenotypic Characteristics of Bone Marrow Microenvironment Cellular Composition at the Biochemical Progression of Multiple Myeloma. J Clin Med 2022, 11. [Google Scholar] [CrossRef]
- Pessoa de Magalhães, R.J.; Vidriales, M.B.; Paiva, B.; Fernandez-Gimenez, C.; García-Sanz, R.; Mateos, M.V.; Gutierrez, N.C.; Lecrevisse, Q.; Blanco, J.F.; Hernández, J.; et al. Analysis of the immune system of multiple myeloma patients achieving long-term disease control by multidimensional flow cytometry. Haematologica 2013, 98, 79–86. [Google Scholar] [CrossRef]
- Paiva, B.; Cedena, M.T.; Puig, N.; Arana, P.; Vidriales, M.B.; Cordon, L.; Flores-Montero, J.; Gutierrez, N.C.; Martín-Ramos, M.L.; Martinez-Lopez, J.; et al. Minimal residual disease monitoring and immune profiling in multiple myeloma in elderly patients. Blood 2016, 127, 3165–3174. [Google Scholar] [CrossRef]
- Costa, L.J.; Derman, B.A.; Bal, S.; Sidana, S.; Chhabra, S.; Silbermann, R.; Ye, J.C.; Cook, G.; Cornell, R.F.; Holstein, S.A.; et al. International harmonization in performing and reporting minimal residual disease assessment in multiple myeloma trials. Leukemia 2021, 35, 18–30. [Google Scholar] [CrossRef] [PubMed]
- Rasche, L.; Alapat, D.; Kumar, M.; Gershner, G.; McDonald, J.; Wardell, C.P.; Samant, R.; Van Hemert, R.; Epstein, J.; Williams, A.F.; et al. Combination of flow cytometry and functional imaging for monitoring of residual disease in myeloma. Leukemia 2019, 33, 1713–1722. [Google Scholar] [CrossRef] [PubMed]
- Caers, J.; Garderet, L.; Kortüm, K.M.; O'Dwyer, M.E.; van de Donk, N.; Binder, M.; Dold, S.M.; Gay, F.; Corre, J.; Beguin, Y.; et al. European Myeloma Network recommendations on tools for the diagnosis and monitoring of multiple myeloma: what to use and when. Haematologica 2018, 103, 1772–1784. [Google Scholar] [CrossRef] [PubMed]
- Pawlyn, C.; Fowkes, L.; Otero, S.; Jones, J.R.; Boyd, K.D.; Davies, F.E.; Morgan, G.J.; Collins, D.J.; Sharma, B.; Riddell, A.; et al. Whole-body diffusion-weighted MRI: a new gold standard for assessing disease burden in patients with multiple myeloma? Leukemia 2016, 30, 1446–1448. [Google Scholar] [CrossRef]
Table 2.
Antigens conjugated with fluorochromes proposed by the Euroflow-NGF initiative.
| Tube 1 (Surface antigens) | Tube 2 (Surface and Cytoplasmic antigens) |
|---|---|
| CD138-BV421 | CD138-BV421 |
| CD38-FITC | CD38-FITC |
| CD19-PEC7 | CD19-PEC7 |
| CD45-PERCP | CD45-PERCP |
| CD56-PE | CD56-PE |
| CD27-BV510 | CD27-BV510 |
| CD81-APCC750 | Lamda-APCC750 |
| CD117-APC | Kappa-APC |
Table 3.
Immunophenotypic differences between normal and aberrant plasma cells.
| Title 1 | Normal PCs | Aberrant PCs |
|---|---|---|
| CD138 | Positive | Positive |
| CD38 | Positive/High | Positive/Diminished |
| CD19 | Positive | Negative |
| CD45 | Positive | Negative (80%) |
| CD56 | Negative | Positive |
| CD27 | Positive | Negative |
| CD117 | Negative | Positive |
| CD81 | Positive | Negative |
| CD28 | Negative | Positive (40-50%) |
| CD200 | Negative | Positive |
| CD229 | Negative | Positive |
| CD307 | Negative | Positive |
| CD317 | Negative | Positive |
Disclaimer/Publisher’s Note: The statements, opinions and data contained in all publications are solely those of the individual author(s) and contributor(s) and not of MDPI and/or the editor(s). MDPI and/or the editor(s) disclaim responsibility for any injury to people or property resulting from any ideas, methods, instructions or products referred to in the content. |
© 2025 by the authors. Licensee MDPI, Basel, Switzerland. This article is an open access article distributed under the terms and conditions of the Creative Commons Attribution (CC BY) license (http://creativecommons.org/licenses/by/4.0/).
Copyright: This open access article is published under a Creative Commons CC BY 4.0 license, which permit the free download, distribution, and reuse, provided that the author and preprint are cited in any reuse.


