Submitted:
09 August 2025
Posted:
11 August 2025
You are already at the latest version
Abstract
Background: Cervical lymph node metastases are a major prognostic factor in patients with oral squamous cell carcinoma (OSCC). Despite advances in imaging, accurate preoperative prediction of nodal involvement remains a challenge. This study evaluated the utility of Isotope Ratio Mass Spectrometry (IRMS) in assessing the risk of lymph node metastases in patients with OSCC. We hypothesize that alterations in the abundance of 13C and 15N stable isotopes in OSCC tumor tissues reflect metabolic reprogramming associated with tumor progression and may correlate with cervical lymph node metastases. Methods: A prospective cohort of 61 patients with primary OSCC undergoing surgical treatment was analyzed. Tumor tissue samples were evaluated for the relative abundance of nitrogen-15 (¹⁵N) and carbon-13 (¹³C) isotopes using IRMS. Correlations between isotopic values and nodal metastases, as well as established clinicopathological risk factors, were assessed. Results: IRMS measurements of ¹³C and ¹⁵N abundance did not directly correlate with the presence of lymph node metastases but were associated with advanced tumor stages and negative prognostic features, such as angioinvasion/neuroinvasion. The median of the average nitrogen ¹⁵N content was higher in patients with more advanced clinical stages (11.89% in stage IV vs. 11.12% in stages I–III; p=0.04), and the median δ¹³C was lower in stage IV compared to stages I–III (-22.40‰ vs. -22.88‰; p<0.05). Patients with angioinvasion/neuroinvasion also had a lower median δ¹³C (-22.26‰ vs. -22.75‰; p<0.05). These findings suggest that IRMS reflects metabolic changes in tumor biology rather than specifically predicting nodal metastases. Multivariate logistic regression identified age, gender, and clinical tumor stage as independent predictors of nodal involvement. Conclusion: IRMS-based isotopic profiling may reflect key metabolic alterations associated with OSCC progression. Although IRMS parameters of carbon 13C and nitrogen 15N were not independently predictive of lymph node status, they were associated with key adverse prognostic features, indicating potential as an adjunctive biomarker and may complement traditional histopathological evaluation.
Keywords:
oral cavity cancer
; tumor
; isotopic composition
; IRMS
; spectrometry
; isotopic analysis
; lymph node metastases
; tumor metabolism
1. Introduction
Isotope Ratio Mass Spectrometry (IRMS) is an analytical method useful for measuring the relative abundance of selected isotopes. Lately, this technique has gained popularity and new applications in biomedicine [1,2,3]. Utilization of IRMS in this field of science is supported by the fact that various tissues of the human body have a different isotopic composition and also by the fact that isotopic abundance is influenced by the metabolic pathways in cells that constitute tissues and organs. In biomedicine, stable isotopes of light chemical elements are mainly selected for analyses, like: hydrogen (H), carbon (C), nitrogen (N), oxygen (O) and sulphur (S) [4,5]. It has been proven that various diseases are accompanied by disturbances of cell metabolism leading to changes in metabolic pathways and consequently to changes in their isotopic composition. For example, Taran et al. observed altered nitrogen and carbon signatures in Wilms’ tumor, while Tea et al. demonstrated metabolic reprogramming reflected in isotope abundance in breast cancer [6,7].
IRMS offers numerous possibilities for research in cancer biology, as it reflects changes in cell metabolic reactions. Metabolic reprogramming, which is believed to be a major hallmark of cancerogenesis, includes several well-defined changes in cancer cell pathways. Those changes facilitate providing essential substances and energy to meet alter needs of cancer cells’ anabolism and growth. This complex process includes upregulation of aerobic glycolysis, glutaminolysis, lipid metabolism, increased pentose phosphate pathway and amino acid metabolism, as well as mitochondrial changes [8,9]. There are many factors affecting oncogene-driven metabolic changes in metabolism, including oncogenes, tumor suppressor genes, growth factors, and tumor-host cell interactions, as well as the conditions of microenvironment (amongst others hypoxia, oxidative stress) [9]. It has also been observed that the degree of clinical advancement (staging) of malignant tumors is associated with varying degrees of deviations in the metabolism of cancer cells. The biochemical processes that constitute metabolic reprogramming at particular stages of carcinogenesis occur at different speeds [10]. Recently, several studies that used stable isotope ratio assessment revealed that there are some significant implications between IRMS measurements and clinical findings, like disease-free survival time (bladder cancer), tumor aggressiveness (Wilm’s tumor) and propensity to be invasive (breast cancer) [6,7,11].
Malignant neoplasms derived from epithelial tissues are characterized, amongst others, by early cervical lymph node metastases. It has been proven that carcinoma spread to lymph nodes is one of the major factors affecting the outcome of treatment of patients with oral squamous cell carcinoma (OSCC), decreasing the 5-year survival rate. Metastasis to regional cervical lymph nodes is related with deterioration of tumor control (it increases the risk of loco-regional recurrence and distant metastases) [12]. Despite the advancements in radiological diagnosis, the pre-surgical detection of lymph node metastases is characterized by a relatively high rate of false positive and false negative cases. Sensitivity in detecting lymph node involvement with the use of standard radiological imaging methods ranges from around 60% to 85% for computed tomography (CT) and to about 90% for magnetic resonance imaging (MRI) [13,14]. It has been estimated that about half of patients with oral cancer have metastases to lymph nodes unilaterally or bilaterally at the time of initial diagnosis. The exact epidemiology data varies among different countries and is related to many factors i.e. primary tumor size [15]. It is also hypothesized that the presence of occult metastases to lymph nodes can be correlated with a decreased survival rate. It is estimated that in advanced stages (T3 and T4) the risk of occult lymph node spread can be higher than 20-30% [16].
A more accurate method for stratification the risk of lymph node metastases could improve the overall treatment outcome in patients with oral cancer. In this study, we investigated if IRMS measurements can serve as a useful method in assessing the risk of lymph node spread. It can be assumed that alterations of tumor biology evaluated at the isotopic level can be a good predictor of lymph node metastases. The aim of this study was to verify if there is a correlation between nodal status in patients with OSCC and the abundance of nitrogen 15N and carbon 13C isotopes in tumor tissues. In addition, the correlation between clinico-pathological risk factors for cervical lymph node metastases and IRMS parameters was analyzed.
2. Materials and Methods
2.1. Study design and patient cohort
This prospective study included 61 consecutive adult patients with OSCC treated surgically in our department, fulfilling the inclusion criteria. The cohort consisted of 24 females and 37 males aged 43 to 92 years (mean age 66.3 ± 9.4 SD). Inclusion criteria were: primary diagnosis of OSCC (confirmed by histopathological examination), and localized tumor advancement enabling radical resection with clear surgical margins (R0 resection, defined as no microscopic residual tumor at the resection margin). Exclusion criteria included: prior malignancy or irradiation of the head and neck region, previous chemotherapy or antibody therapy, and presence of distant metastases. This study was approved by the Bioethics Committee (RNN/185/18/KE).
All patients enrolled into this study underwent standard therapeutic procedures (tumor resection, neck dissection) and adjuvant treatment, if necessary, as recommended in NCCN guidelines [17]. The following demographic and pathological information was collected: gender, age at the time of diagnosis, primary tumor site, pathomorphological stage (pTNM) and grade, lymph node status. Subsequently, using the IRMS procedure, we obtained the information on the isotopic abundance of 15N and 13C of samples derived from oral carcinomas. Patients were divided into two groups. The first one constituted individuals without lymph node metastases – LNM (-). The second group included patients with nodal spread – LNM (+).
Additionally, the lymph node ratio (LNR) was calculated for each patient in the pN(+) group. This parameter is defined as the number of lymph nodes with metastases divided by the total number of dissected lymph nodes (LNR = number of metastatic lymph nodes / total dissected lymph nodes).
Histopathological assessment was combined with IRMS to provide a comprehensive understanding of nodal spread.
2.2. Preparation of the samples
During surgical procedures, four tissue samples (approximately 2x2 mm each) were extracted from each patient’s tumor. The collected specimens underwent specific processing routes for IRMS analysis and for histopathological assessment. Two samples were immersed in formalin, embedded in paraffin, and evaluated histopathologically by an experienced pathomorphologist (JK). The entire postoperative tumor and lymph node specimens underwent routine histopathological examination, assessing features such as depth of cancer infiltration (DOI, measured in millimeters), tumor thickness and diameter, bone invasion, surgical margins status (R status), angioinvasion, neuroinvasion, number and localization of lymph node metastases, and extranodal extension (ENE). TNM staging, following the American Joint Committee on Cancer 8th Edition, was used [18]. The remaining two samples were frozen at -70°C for IRMS analysis.
2.3. IRMS Procedure
IRMS analysis of δ¹⁵N and δ¹³C isotopes was performed on 82 tissue samples from OSCCs. Samples were frozen at -70°C for 48 hours, lyophilized using a Christ Delta 1–24 LSC lyophilizer (GmbH, Osterode am Harz, Germany), and approximately 3±1 mg of each sample was weighed into tin capsules for IRMS analysis. On average, three samples were obtained from one tissue section. Vanadium pentoxide served as the combustion catalyst, and thiobarbituric acid, calibrated against atmospheric nitrogen and Pee Dee Belemnite (PDB), was the primary reference standard for δ¹⁵N and δ¹³C, respectively.
IRMS measurements were conducted using a Sercon SL20–22 Continuous Flow Isotope Ratio Mass Spectrometer connected to a Sercon SL elemental analyzer for simultaneous carbon–nitrogen analysis. Isotopic ratios were expressed as δ values, calculated using the formula:
where X represents δ¹⁵N or δ¹³C, and R is the isotope ratio of the heavier to lighter isotope (¹⁵N/¹⁴N or ¹³C/¹²C). For carbon isotopes, δ¹³C values were compared to the ¹³C/¹²C ratio in the PDB standard; for nitrogen isotopes, δ¹⁵N values were determined relative to the ¹⁵N/¹⁴N ratio of atmospheric nitrogen. IRMS measurements were validated using control samples (standard reference materials) with a standard deviation of ±0.2‰ for δ¹³C and ±0.3‰ for δ¹⁵N, ensuring repeatability and accuracy.
δX(‰) = (R sample/R standard − 1) x 1000,
Additional IRMS parameters analyzed included minimal (Min) and maximal (Max) percentage mass content of carbon (C) and nitrogen (N), median and interquartile range (IQR), mean ± standard deviation (SD), percentage mass content of C and N, and total nitrogen-to-carbon ratio ([N]/[C]).
Statistical Analysis
Statistical analyses were performed using Statistica Software (version 12, Statsoft, TIBCO Software, Dell, Tulsa, OK, USA). For univariate analysis of risk factors for cervical lymph node metastasis, the χ2 test of independence was applied. William’s correction, a statistical adjustment for χ2 tests in small sample sizes or multiple categories, was used to improve the accuracy of p-values [19]. Logistic regression was used for multivariate analysis to determine independent risk factors. One-way analysis of variance (ANOVA) was used to detect differences in IRMS measurements between clinical groups, with the Kruskal-Wallis test applied for non-normal data distributions (assessed via Shapiro-Wilk test). Homogeneity of variance was checked with Levene’s test. A p-value < 0.05 was considered significant.
3. Results
3.1. Lymph Node Status (pN) and Neck Dissections
In total, 61 patients were enrolled into this prospective analysis. About 60% of the study group were men (n=37) in mean age 64.2±8.9 years. The rest of the group consisted of 24 women (39.4%) with a mean age 69.5±8.4 years.
Most patients (45.9%) were diagnosed with an advanced stage of the disease (pT4). Almost 80% of cases (n=47) were staged as class IV according to the AJCC 8th edition. Most patients (60.7%) had a positive history of cigarette smoking, and 28.3% of alcohol abuse. Analysis of histopathological grading showed that the majority of tumors were intermediately differentiated (G2) in 61 patients. The frequency of G1 and G3 diagnosis was quite similar in 10 of the G1 patients (16%) OSCCs were well differentiated (G1), and in 11 cases (18%) – poorly differentiated (G3). (Table 1)
The majority of OSCCs involved the floor of the mouth (n=18, 29.5%) and the lower gingiva (n=18, 29.5%). Detailed data is presented in Figure 1
Neck dissections were performed on the whole group of patients (61 cases) enrolled into the study. The extent of lymphadenectomy (the levels of cervical lymph nodes removed and one-sided or bilateral neck surgery) depended on the primary tumor site and preoperative radiological assessment of the neck lymph nodes. Overall, we performed 115 neck dissections. Selective neck dissections (SND) – lymphadenectomies limited to levels I – III (supraomohioid neck dissections, SOHND) and surgeries limited to levels I – IV (extended supraomohioid neck dissections, ESOHND). SND prevailed in this study - 91 procedures were done. Levels I – V dissections – radical neck dissections (RND) and modified radical neck dissections (MRND) were performed 24 times.
uring all SND procedures where 1450 cervical nodes were cleared (range from 9 to 33 lymph nodes), on average 15.9 nodes per procedure. During levels I – V dissections, in total 572 nodes per procedure were resected (range from 14 to 42 lymph nodes per procedure), on average 23.8 nodes per procedure. Taking into consideration all types of neck dissection a median lymph node yield was 15 nodes per procedure (range from 9 to 49). In total 2022 lymph nodes were dissected during all surgeries, on average, 33.2 nodes per patient.
In 33 out of 61 patients, cervical lymph node metastases were confirmed by histopathological examination. A total number of positive lymph nodes resected during all procedures was 123, on average 3.7, median 3.0 (range from 1 to 9). The median lymph node ratio (LNR) was 0.10690 (range from 0.02222 to 0.36). (Table 2)
Analysis of nodal involvement disclosed that pN3b status was most frequent in patients with cervical lymph node metastases. It was determined in 28 cases (45.9%). A minority of this study group were patients in pN1 stage – 1 case, pN2b – 3 cases and pN2c – 1 case. The rest of our cohort were patients without lymph node spread (n=28).
Contralateral metastases were found in 9 cases, while bilateral lymph nodes involvement were observed in 8 patients. Metastases larger than 3cm occurred in 17 patients. Single metastases were observed in 26 cases, while multiple metastases were observed in 8 individuals. Lymph node spread was most commonly present in patients with tumors involving lower gingiva (n=12, 36,4%) and floor of the mouth (n=11, 33.4%). In our cohort in patients with lower lip cancer, we did not observe regional lymph node involvement. The distribution of lymph metastases within the different primary tumor sites is presented in Figure 2.
Histopathological assessment disclosed that in most patients in pN(+) stage extracapsular nodal spread was present. It was observed in 27 patients (79,4%).
Subsequently, a univariate analysis of risk factors of cervical lymph node metastasis was performed. It indicated that factors like male gender (p<0.05), age under 65 year old (p<0.05), smoking (p<0.05), stage IV of clinical advancement of oral cancer (assessed according to 8th edition of the AJCC), (p<0.0000), presence of angioinvasion and/or neuroinvasion (p<0.05), DOI > 10mm (p<0.05), presence of keratosis (p<0.05) were statistically important risk factors of regional lymph node involvement (p˂ 0.05). Additionally, primary tumor site, as well as histopathological grading, turned out to be related to cervical lymph node involvement. In these cases, due to small sample sizes, statistical analysis (χ2 test) was applied with William’s corrections. Metastases were most commonly observed in patients with tumors involving the lower gingiva (n=18, 29,5%) and floor of the mouth (n=18, 22.5%), (p<0.00000). Well-differentiated tumors (G1) in histopathological examination were related to negative lymph node findings (p<0.00000). Other analyzed factors proved to have no impact on the neck lymph node status (p˂ 0.05). The detailed data concerning nodal status was presented in Table 3.
3.2. Multivariate logistic regression analysis of the risk factors of cervical lymph node metastasis
The following statistical variables were included to perform multivariate logistic regression: age, gender, smoking status, depth of invasion, tumor stage, presence of angio/neuroinvasion, and keratodes. The age, gender, and tumor staging proved to be independent risk factors of cervical lymph node metastasis (p ˂ 0.05). Age was identified as a protective factor (OR=0.869, 95%, ei: 0.78-0.97), suggesting that older age is associated with a reduced risk of lymph node metastasis. Female sex was also limited to a lower risk of pN(+) status compared to male sex (OR=0.22, 95% ei: 0.049-0.997). Tumor stage remained the strongest prediction with very low odds ratios for stages I, II and III compared to stage IV. The exact data is presented in Table 4.
3.3. IRMS measurements of nitrogen 15N and carbon 13C in tumor tissues
The measurements of abundance of nitrogen 15N and carbon 13C were obtained with the use of IRMS in samples derived from tumor tissues in both analyzed groups of patients – LNM (-) and LNM (+). The percentage content of these isotopes was presented as minimum, maximum, standard deviation and median values.
Statistical analysis disclosed that the nodal status did not affect the values of the mean percentage mass content of nitrogen 15 and carbon 13C (p>0.05). Similarly, in both compared groups (patients pN 0 and pN(+)), other analyzed IRMS parameters did not differ significantly (p>0.05). The detailed results are shown in Table 5.
3.4. Correlation between IRMS measurements and risk factors of cervical lymph node metastasis
A statistical analysis was performed to investigate the correlation between the isotope abundance of 13C and 15N in tumor tissues and factors that proved to be important risk factors of the cervical lymph node metastasis in this study. Most comparisons did not reach statistical significance (p > 0.05). However, patients with advanced clinical stage (AJCC stage IV) demonstrated significantly higher median nitrogen content (13%) compared to those in stages I–III (12%). (Table 6a) Additionally, a statistically significant difference in carbon isotopic composition (δ¹³C) was observed between these groups - patients in stage IV had lower δ¹³C values (median −22.40‰) compared to earlier-stage cases (median −22.88‰; p < 0.05), indicating a potential shift in carbon metabolism in more advanced disease. (Table 6b) Furthermore, patients with angioinvasion or neuroinvasion also showed significantly lower δ¹³C values (−22.26‰) than those without these negative prognostic factors (−22.75‰; p < 0.05).
4. Discussion
The results of this prospective study provide valuable insight into the potential utility of IRMS in understanding biological background of oral cancer, especially these underlying tumor progression and lymph nodes involvement. Although we did not observe statistically significant differences in isotopic abundance of 15N and 13C were observed between patients with and without lymph node metastasis we recognized noteworthy associations between IRMS parameters and clinicopathological features. Significant associations were noticed between advanced clinical tumor stage and histopathological features such as the presence of angioinvasion or neuroinvasion. Specifically, the average nitrogen 15N content was higher in patients with more advanced clinical stages (p<0.05), and the median δ13C was lower in stage IV (-22.40) compared to stages I-III (-22.88) (p<0.05). Patients with angioinvasion or neuroinvasion also exhibited a lower median δ13C (-22.26) compared to those without these features (-22.75) (p<0.05). These observations align with existing literature. For instance, the findings reported in the present study are consistent with our previous research, which demonstrated that the isotopic composition of OSCC tissues is associated with tumor aggressiveness and clinical advancement [20]. In our earlier study we have observed that the mean nitrogen content was significantly higher in patients with stage IV disease compared to those with stage II–III (11.89% vs. 11.12%; p = 0.04), while the δ¹³C values were significantly lower in more advanced tumors (−22.69‰ vs. −23.32‰; p = 0.04). These results are concordant; both discussed studies indicate that with the current analysis. Confirming firstly that the higher nitrogen content correlates with more advanced disease, and secondly that there is a negative correlation between δ13C and tumor progression. Moreover, the presence of angioinvasion and neuroinvasion was associated with altered isotopic abundance. Previously we reported a non-significant trend toward lower δ¹³C in tumors exhibiting angioinvasion (−22.16‰ vs. −23.17‰). These observation supports the notion that metabolic reprogramming reflected in isotopic shifts may underlie aggressive histological features.
In the above-mentioned article, we also demonstrated that IRMS measurements can distinguish OSCC tissues from margins and healthy tissues. Similarly, Madej et al. utilized the natural abundance of 13C in urothelium as a marker for monitoring patients with bladder cancer [11]. In pediatric oncology, Taran et al. investigated the isotopic composition of Wilms’ tumor, suggesting IRMS as a biomarker for individualized cancer treatment approaches [6].
Our findings are consistent with data presented in the literature, indicating that variations in isotopic 13C and 15N content can differentiate between malignant and non-malignant tissues, as well as between aggressive and indolent tumor phenotypes [6,7,11].
These observations are consistent with the metabolic reprogramming that occurs in the cancer cells. Advanced tumors often exhibit enhanced glycolysis, glutaminolysis. It can be assumed that more aggressive tumor behavior can be related to dysregulation of carbon metabolism. Similarly, the pattern of the 15N isotope content suggests that upregulation of the turnover of nitrogen-rich biomolecules (such as amino acids and nucleotides) is related to tumor progression.
Nonetheless, the global comparison of IRMS parameters between LNM(+) and LNM(−) groups failed to reach the level of statistical significance. Several explanations may account for this finding. First of all, it is possible that the metabolic profiles of primary oral tumors are similar regardless of their metastatic status. IRMS measurements capture the biochemical environment and nutrient molecules utilized by cancer cells. However, the ability to metastasize is driven by a distinct set of factors - such as genetic mutations, epithelial-to-mesenchymal transition, and tumor-stromal interactions - which may not be mirrorised in isotopic variations. Moreover, isotopic abundance was measured in samples from primary tumors only. The metabolic microenvironment of these tumors may differ from that present in metastases in lymph nodes. Additionally, the sample size, inter-patient variability, and biological heterogeneity may be the confounding factors that affected our results. The sample size of 61 patients may have been insufficient to detect subtle correlations between IRMS parameters and lymph node status.
Our observations suggest that isotopic changes may serve as indicators of overall tumor biology related to metabolic reprogramming rather than direct predictors of lymph node metastasis.
From the clinical point of view the relevance of our findings lies in their potential to improve the stratification of patients with poor prognosis and those at risk for lymph node metastases. Current radiological methods, such as computed tomography (CT) and magnetic resonance imaging (MRI), have limitations in detecting occult metastases, with sensitivities ranging from 60–90% [13,14]. In our cohort, approximately 54% of patients had histopathologically confirmed cervical lymph node metastases, which is consistent with the reported prevalence of nodal involvement in OSCC [15].
Our study also identified important risk factors for cervical lymph node metastases, namely male gender, age under 65 years, smoking, advanced clinical disease stage, angioinvasion/neuroinvasion, depth of infiltration (DOI > 10 mm), histopathological grade, and presence of keratosis. These findings are consistent with previous reports linking these factors to adverse outcomes in OSCC patients [12]. Additionally, primary tumor site also proved to be correlated with the risk of nodal spread. However, the small sample sizes of subgroups limit the power of statistical analysis. Notably, the primary tumor site, particularly the floor of the mouth and lower gingiva, was strongly associated with lymph node involvement (p < 0.00000), likely due to the rich lymphatic drainage in these regions. The absence of lymph node metastases in lower lip cancers in our cohort further supports the site-specific nature of metastatic risk, as lower lip tumors are known to have a lower propensity for nodal spread [15].
Nevertheless, further statistical analysis found that only 3 of them are independent risk factors for nodal metastases in our cohort, including younger age (<65 years), male gender, and advanced clinical stage. Importantly, we found that the isotopic parameters also varied with these factors. These observations support the hypothesis that the metabolic profile assessed by IRMS reflects the underlying tumor biology associated with metastatic potential.
The results of our study suggest that IRMS might not replace traditional histopathological examination in assessing lymph node metastasis risk. However, it may serve as a valuable tool, that may complement diagnostic methods by providing additional information on tumor metabolism. This may be particularly useful in a multimodal approach to risk stratification. Incorporating IRMS analysis together with clinical, pathological and genetic markers may offer comprehensive strategy that could better predict treatment outcomes and guide therapeutic decisions. For instance, lower δ13C values in tumors with angioinvasion or neuroinvasion may indicate more aggressive tumor biology, potentially justifying more intensive treatment or closer monitoring.
In future investigations, longitudinal assessment of δ13C and δ15N in both primary tumors and metastatic lymph nodes could offer deeper insight into the dynamics of tumor progression. Furthermore, integrating IRMS with other molecular, metabolic, genetic and imaging biomarkers may enhance its predictive value and clinical utility. The use of isotopic analysis in cancer research is still in its early stages, but preliminary results from this study and others suggest it has the potential to enhance our understanding of tumor metabolism and support its clinical application in the future.
5. Conclusions
Our study demonstrates that the isotopic abundance of nitrogen 15N and carbon 13C in oral cancer tissues does not differ significantly between patients with lymph node metastases and those without nodal spread. This suggests that the metabolic characteristics reflected by stable isotope composition in tumor tissues may not affect the propensity of nodal involvement. The results underscore the complexity of tumor biology, indicating that while isotopic profiling provides valuable insights into cellular metabolism and nutrient utilization, it may not directly relate with metastatic potential. Further research incorporating additional molecular and metabolic markers may help to better understand the association tumor metabolism with the risk of lymph nodes involvement.
Although IRMS parameters of carbon 13C and nitrogen 15N were not independently predictive of lymph node status, they were associated with key adverse prognostic factors, indicating potential as adjunctive biomarkers and may complement classical histopathological evaluation.
Author Contributions
Conceptualisation, J.K.; methodology, P.P., J.K., M.K. and K.B.; validation, K.B., M.K., P.P. and J.K.; formal analysis, P.P., J.K., M.K. and K.B.; investigation, K.B.; resources, P.P., M.K., J.K. and K.B.; data curation, K.B.; writing—original draft preparation, K.B.; writing—review and editing, K.B., J.K., M.K. and P.P.; visualisation, K.B.; supervision, K.B., J.K., M.K. and P.P.; project administration, M.K., P.P. and J.K.; funding acquisition, M.K. and P.P. All authors have read and agreed to the published version of the manuscript.
Funding
This research was funded by the Medical University of Lodz (grant numbers 503/5-06102/503-51-001-18, 503/5-061-02/503-51-001-17, and 503/5-061-02/503-51-002-18).
Institutional Review Board Statement
The study was conducted in accordance with the Declaration of Helsinki and approved by the Bioethics Committee of the Medical University of Lodz (RNN/185/18/KE; 18 June 2018).
Informed Consent Statement
Informed consent was obtained from all subjects involved in the study.
Data Availability Statement
The data on which this study is based will be made available upon request at https://www.researchgate.net/profile/Marcin-Kozakiewicz
Conflicts of Interest
The authors declare no conflicts of interest.
References
- Rozanova, S.; Barkovits, K.; Nikolov, M.; Schmidt, C.; Urlaub, H.; Marcus, K. Quantitative mass spectrometry-based proteomics: an overview. Methods Mol. Biol. 2021, 2228, 85–116. [Google Scholar] [CrossRef] [PubMed]
- Leslie, A.; Teh, E.; Druker, A.; Pinto, D.M. A targeted isotope dilution mass spectrometry assay for osteopontin quantification in plasma of metastatic breast cancer patients. PLoS One 2023, 18, e0281491. [Google Scholar] [CrossRef] [PubMed]
- Andersson, A.; Piper, T.; Ekström, L.; Hirschberg, A.L.; Thevis, M. Usefulness of serum androgen isotope ratio mass spectrometry (IRMS) to detect testosterone supplementation in women. Drug Test. Anal. 2023, 15, 465–469. [Google Scholar] [CrossRef] [PubMed]
- Tea, I.; De Luca, A.; Schiphorst, A.M.; Grand, M.; Barillé-Nion, S.; Mirallié, E.; Drui, D.; Krempf, M.; Hankard, R.; Tcherkez, G. Stable isotope abundance and fractionation in human diseases. Metabolites 2021, 11, 370. [Google Scholar] [CrossRef] [PubMed]
- Cichoń, M.J.; Gąsior, K.J.; Hincz, A.; Taran, K. The first pyrolysis protocol based on experimental measurements in the atomic level structured cancer studies. J. Health Study Med. 2022, 1, 5–18. [Google Scholar] [CrossRef]
- Taran, K.; Frączek, T.; Sikora-Szubert, A.; Sitkiewicz, A.; Młynarski, W.; Kobos, J. The first investigation of Wilms’ tumor atomic structure-nitrogen and carbon isotopic composition as a novel biomarker. Oncotarget 2016, 7, 76726–76734. [Google Scholar] [CrossRef] [PubMed]
- Tea, I.; Martineau, E.; Antheaume, I.; Domanski, D.; Tcherkez, G. 13C and 15N natural isotope abundance reflects breast cancer cell metabolism. Sci. Rep, 2016, 6, 34251. [Google Scholar] [CrossRef] [PubMed]
- Phan, L.M.; Yeung, S.C.; Lee, M.H. Cancer metabolic reprogramming: importance, main features, and potentials for precise targeted anti-cancer therapies. Cancer Biol. Med. 2014, 11, 1–19. [Google Scholar] [CrossRef] [PubMed]
- Miranda-Gonçalves, V.; Lameirinhas, A.; Henrique, R.; Jerónimo, C. Metabolism and epigenetic interplay in cancer: regulation and putative therapeutic targets. Front. Genet. 2018, 9, 427. [Google Scholar] [CrossRef] [PubMed]
- Faubert, B.; Solmonson, A.; DeBerardinis, R.J. Metabolic reprogramming and cancer progression. Science 2020, 368, eaaw5473. [Google Scholar] [CrossRef] [PubMed]
- Madej, A.; Forma, E.; Golberg, M.; Kamiński, R.; Paneth, P.; Kobos, J.; Różański, W.; Lipiński, M. 13C natural isotope abundance in urothelium as a new marker in the follow-up of patients with bladder cancer. Cancers 2022, 14, 2423. [Google Scholar] [CrossRef] [PubMed]
- Haidari, S.; Obermeier, K.T.; Kraus, M.; Otto, S.; Probst, F.A.; Liokatis, P. Nodal disease and survival in oral cancer: is occult metastasis a burden factor compared to preoperatively nodal positive neck? Cancers 2022, 14, 4241. [Google Scholar] [CrossRef] [PubMed]
- Dammann, F.; Horger, M.; Mueller-Berg, M.; Schlemmer, H.; Claussen, C.; Hoffman, J.; Eschmann, S.; Bares, R. Rational diagnosis of squamous cell carcinoma of the head and neck region: comparative evaluation of CT, MRI and 18 FDG PET. AJR Am. J. Roentgenol. 2005, 184, 1326–1331. [Google Scholar] [CrossRef] [PubMed]
- He, T.; Sun, J.; Wu, J.; Wang, H.; Li, S.; Su, S. PET-CT versus MRI in the diagnosis of lymph node metastasis of cervical cancer: a meta-analysis. Microsc. Res. Tech. 2022, 85, 1791–1798. [Google Scholar] [CrossRef] [PubMed]
- Mashberg, A.; Samit, A. Early diagnosis of asymptomatic oral and oropharyngeal squamous cancers. CA Cancer J. Clin. 1995, 45, 328–351. [Google Scholar] [CrossRef] [PubMed]
- Goekerm, M.; Braun, J.; Stoeckli, S.J. Evaluation of clinical and histomorphological parameters as potential predictors of occult metastases in sentinel lymph nodes of early squamous cell carcinoma of the oral cavity. Ann. Surg. Oncol. 2010, 17, 527–535. [Google Scholar]
- National Comprehensive Cancer Network. NCCN clinical practice guidelines in oncology: head and neck cancers. Version 4.2025. Plymouth Meeting (PA): National Comprehensive Cancer Network; 2025. Available online: https://www.nccn.org/guidelines/guidelines-detail?category=1&id=1437 (accessed on 31.07.2025).
- Amin, M.B.; Edge, S.B.; Greene, F.L.; Byrd, D.R.; Brookland, R.K.; Washington, M.K.; Gershenwald, J.E.; Compton, C.C.; Hess, K.R.; Sullivan, D.C.; Jessup, J.M.; Brierley, J.D.; Gaspar, L.E.; Schilsky, R.L.; Balch, C.M.; Winchester, D.P.; Asare, E.A.; Madera, M.; Gress, D.M.; Meyer, L.R.; AJCC cancer staging manual. 8th ed. New York (NY): Springer; 2017. Available online: https://cancerstaging.org/references-tools/deskreferences/Pages/8EUpdates.aspx (accessed on 31.07.2025).
- Bogusiak, K.; Puch, A.; Mostowski, R.; Kozakiewicz, M.; Paneth, P.; Kobos, J. Characteristic of oral squamous cell carcinoma tissues using isotope ratio mass spectrometry. Cancers 2020, 12, 3760. [Google Scholar] [CrossRef] [PubMed]
- Bogusiak, K.; Kozakiewicz, M.; Puch, A.; Mostowski, R.; Paneth, P.; Kobos, J. Oral Cavity Cancer Tissues Differ in Isotopic Composition Depending on Location and Staging. Cancers 2023, 15, 4610. [Google Scholar] [CrossRef] [PubMed]
Figure 1.
Distribution of OSCCs according to anatomical sites.
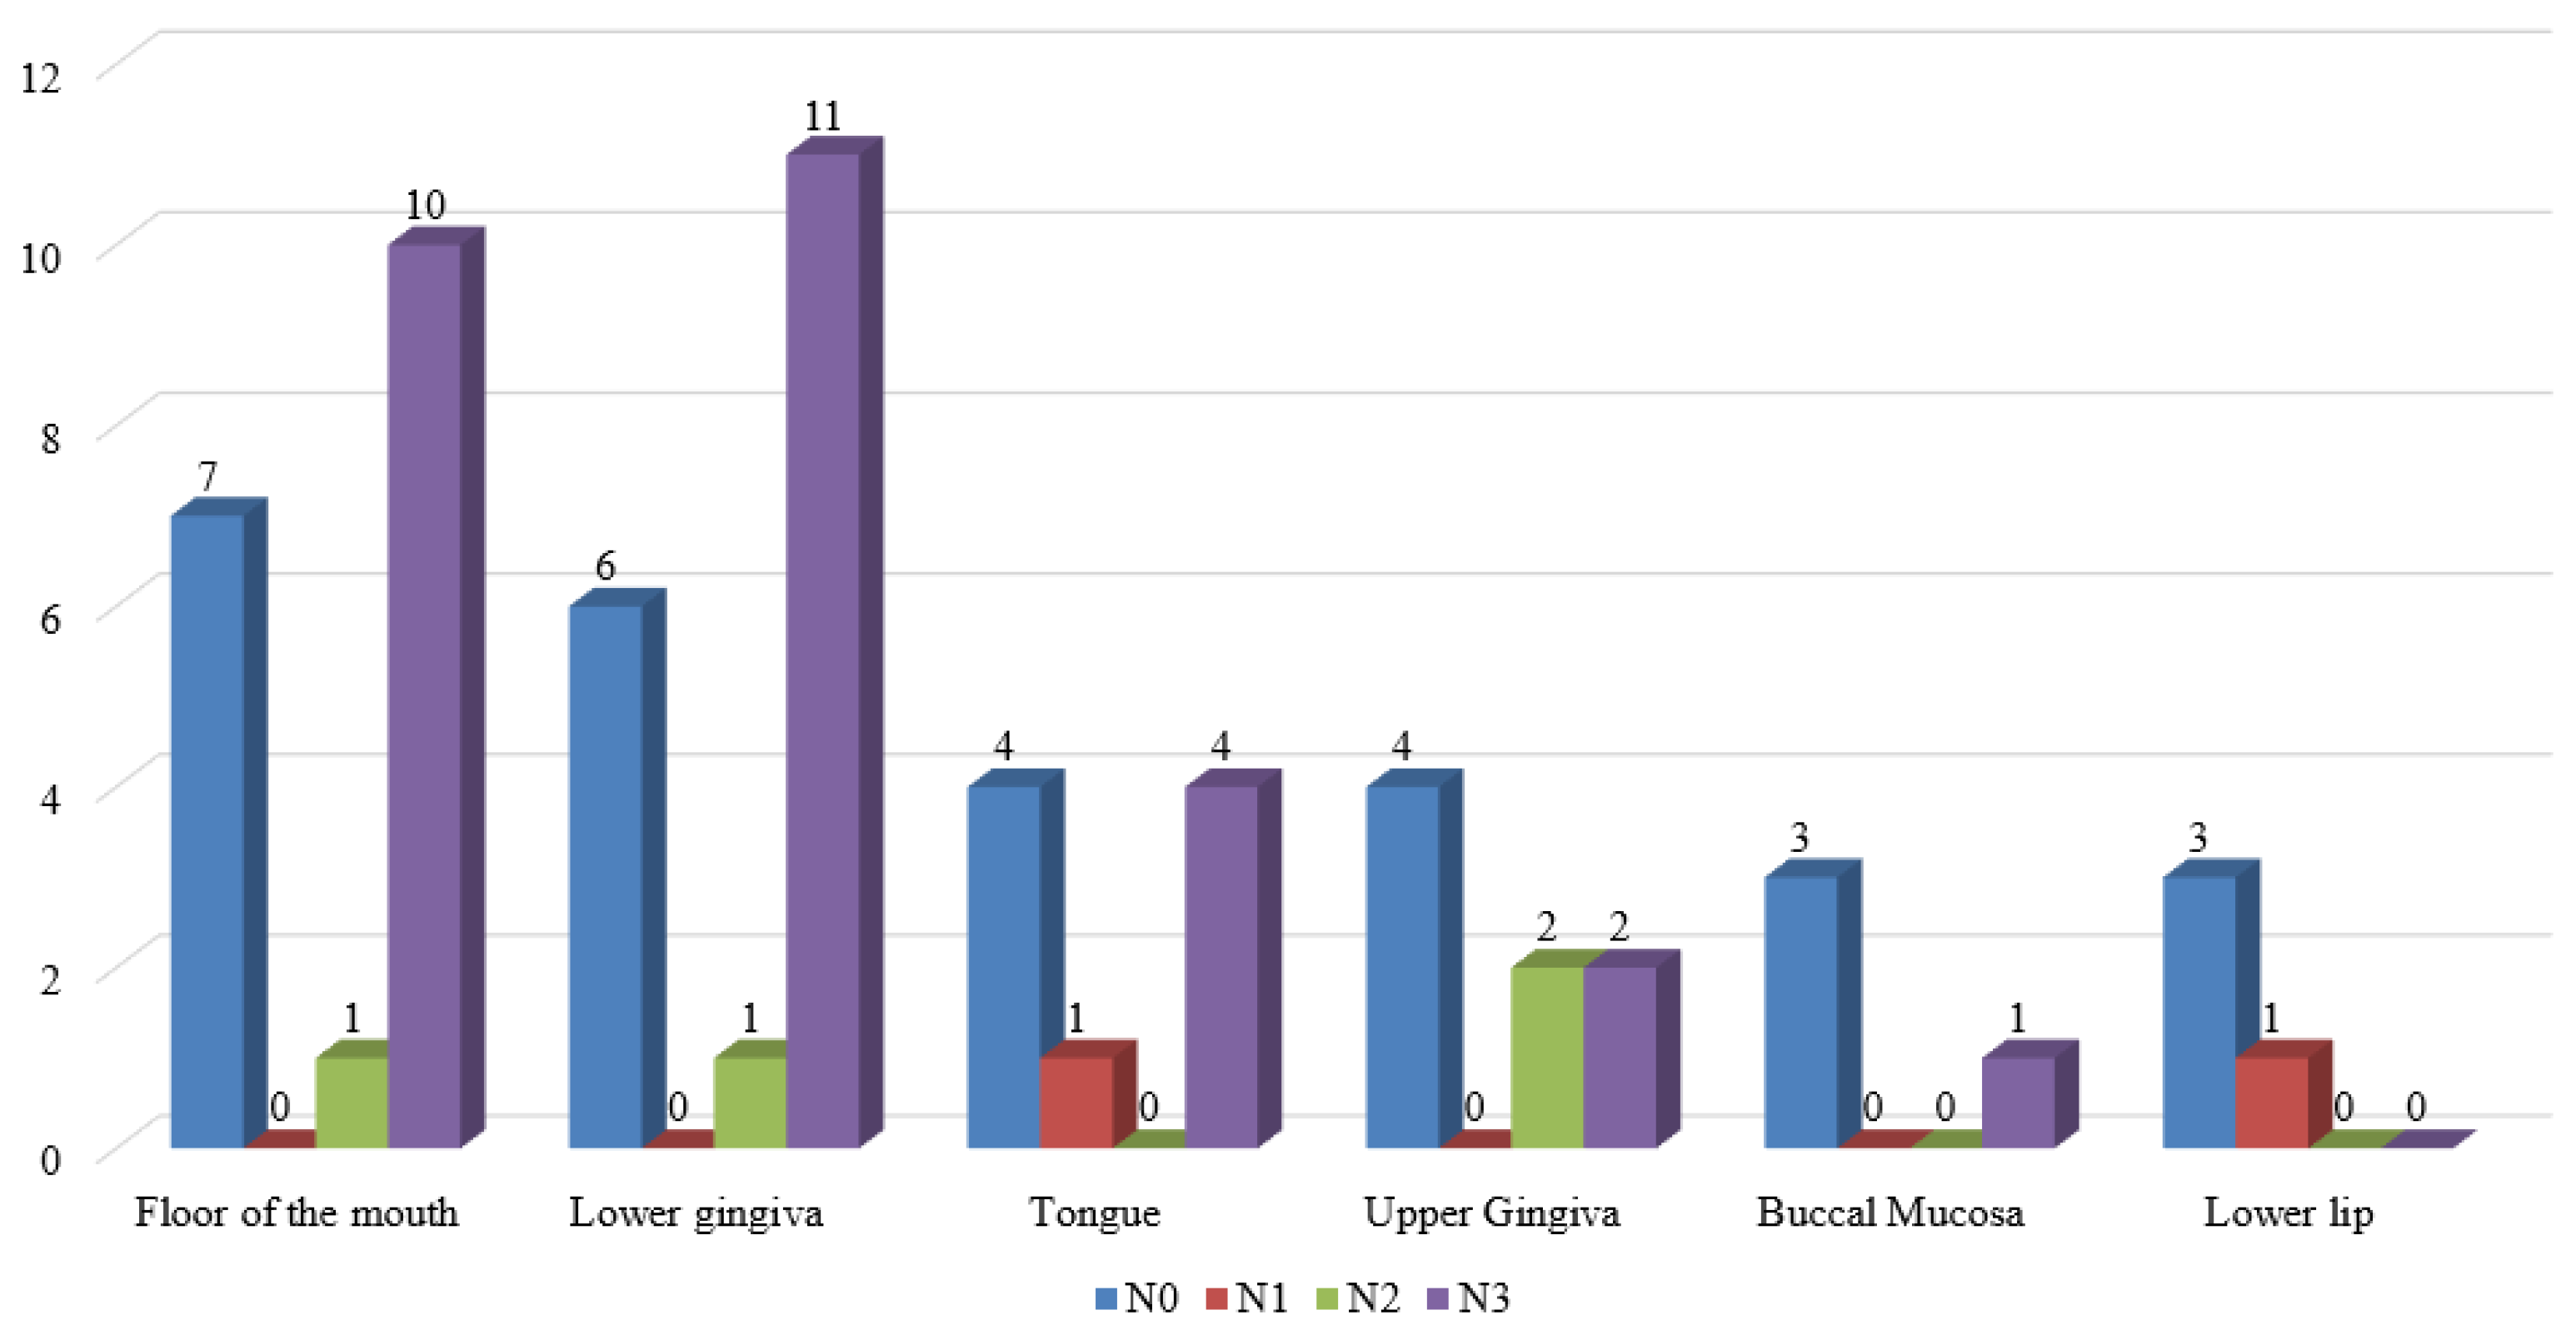
Figure 2.
Distribution of lymph node metastases within the different primary tumor sites.
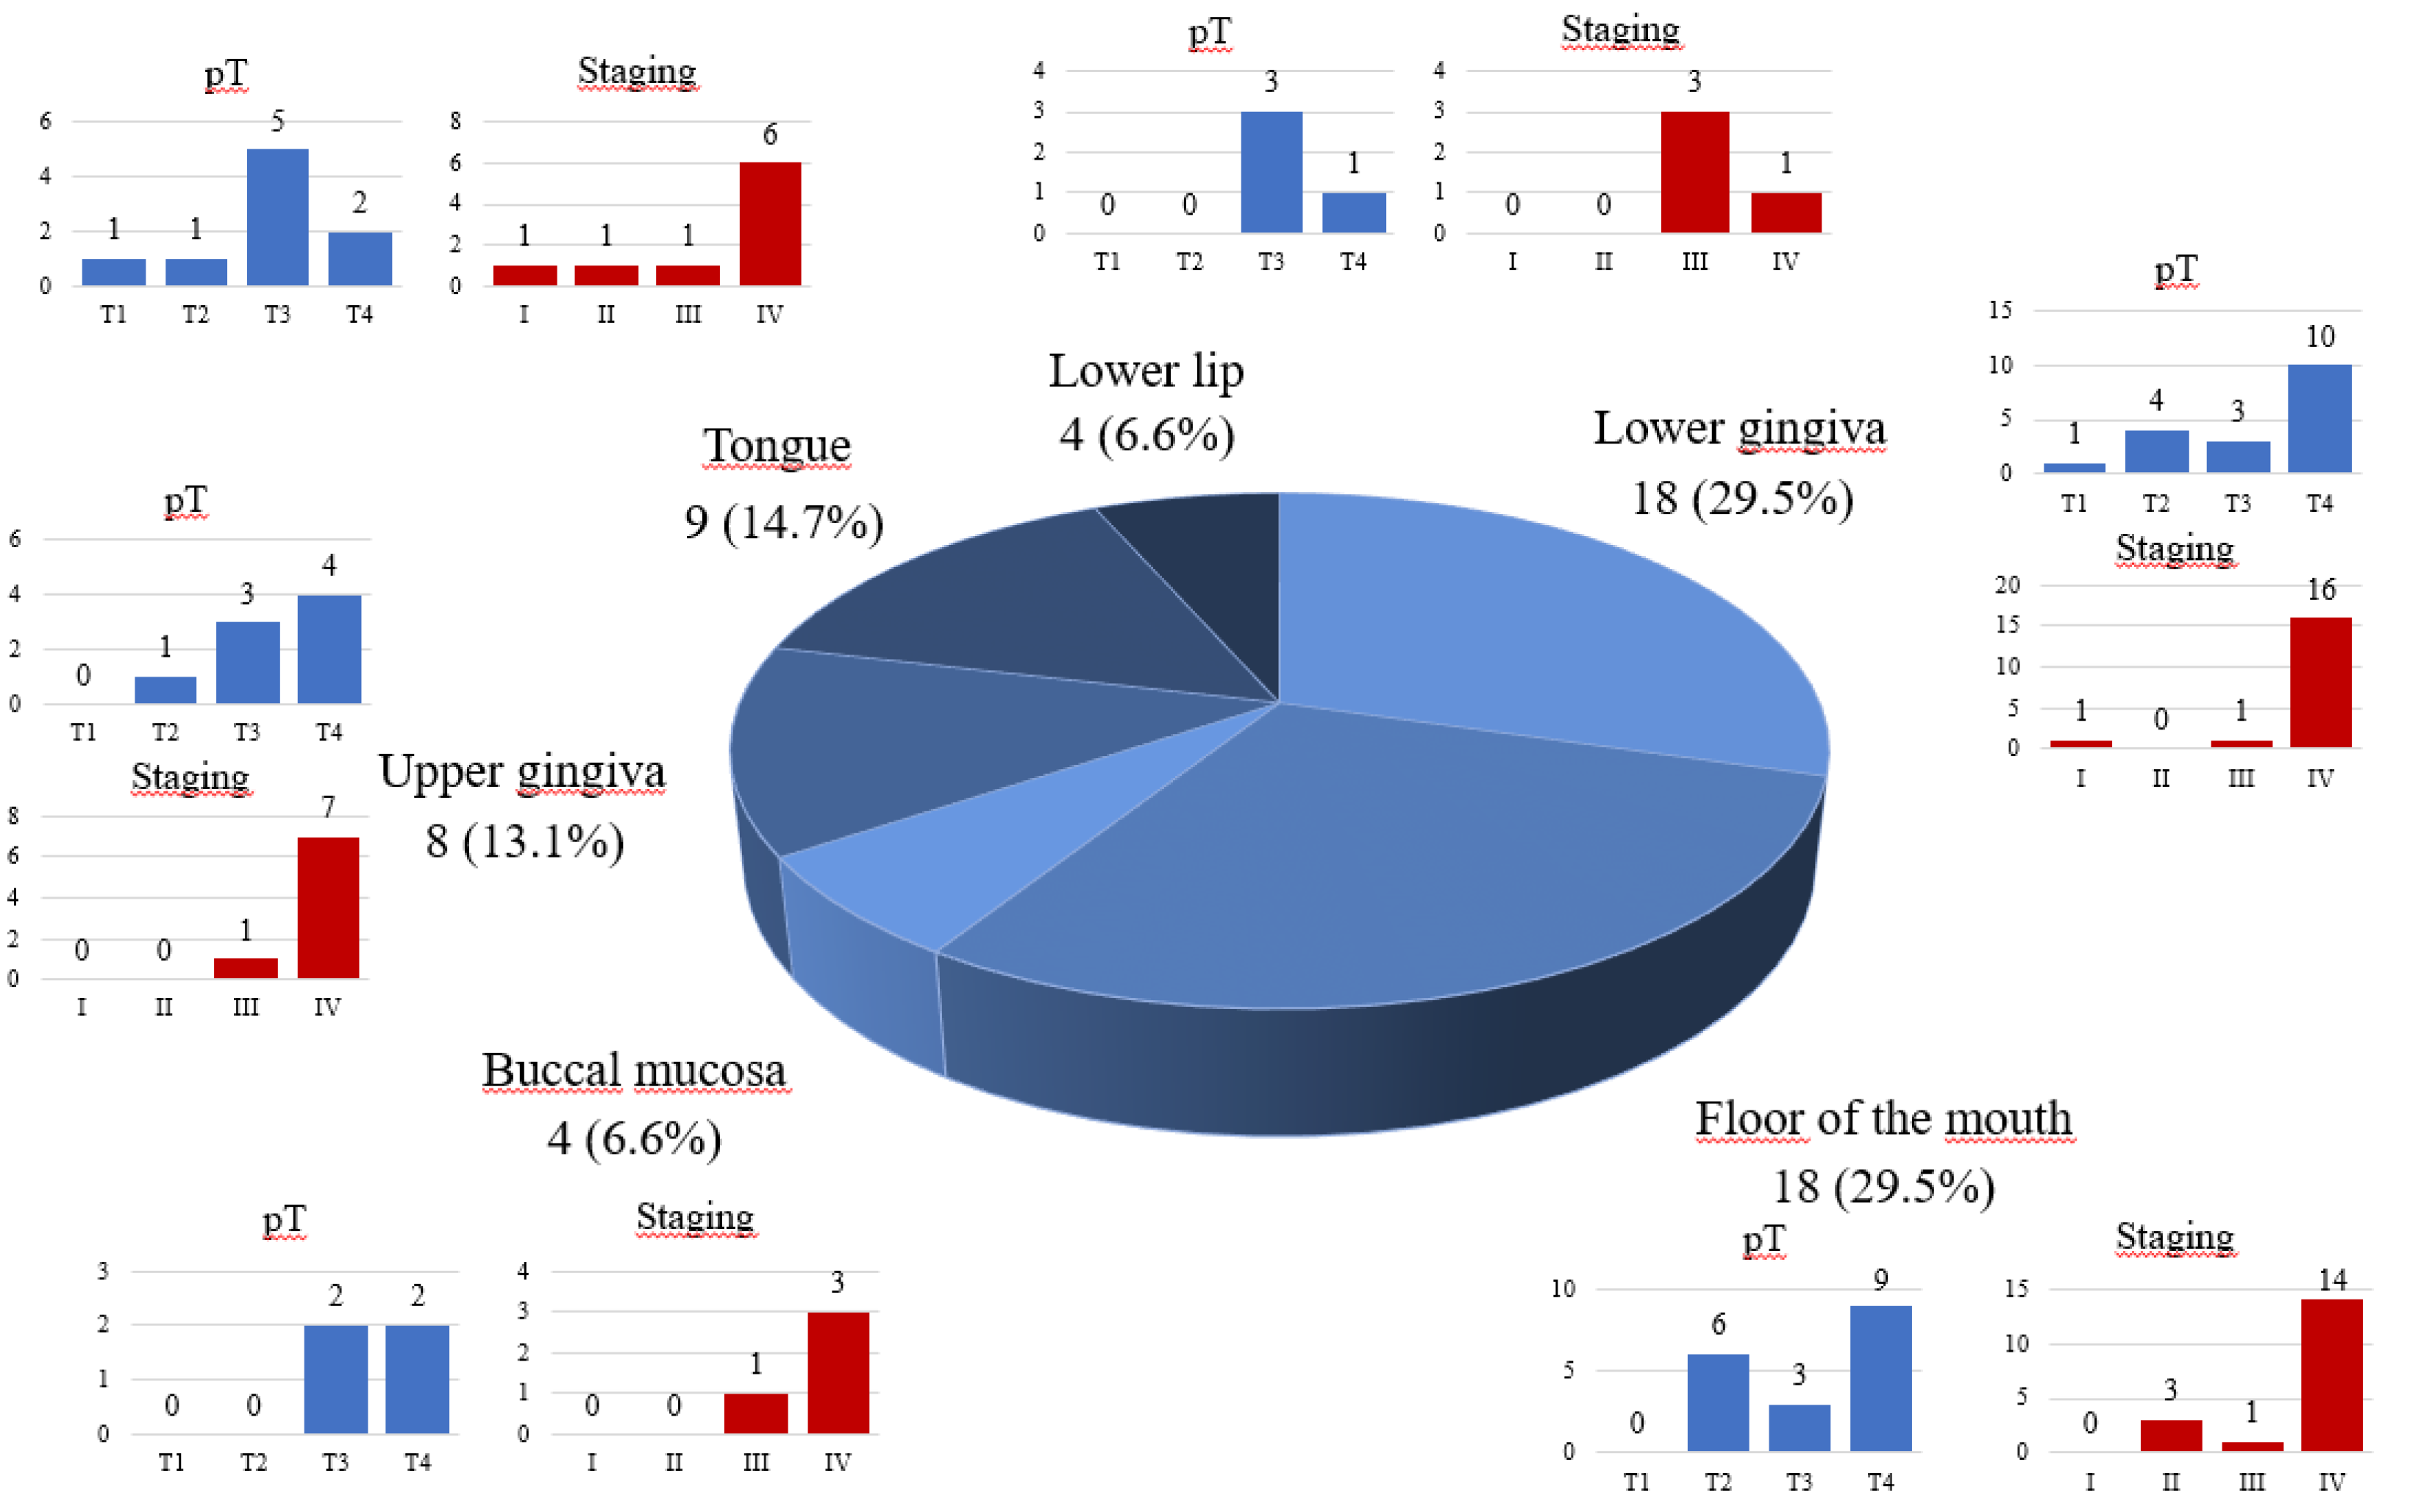

Table 1.
Selected demographic and histopathological features in complete cohort (n = 61).
| Characteristics | Number of patients | ||
| n | % | ||
| Gender | |||
| Male | 37 | 60.7 | |
| Female | 24 | 39.3 | |
| Age | |||
| <65 years | 23 | 37.7 | |
| ≥65 years | 38 | 62.3 | |
| Smoking | |||
| yes | 37 | 60.7 | |
| no | 24 | 39.3 | |
| Alcohol consumption | |||
| yes | 17 | 27.9 | |
| no | 44 | 72.1 | |
| pT stage | |||
| T1 | 2 | 3.3 | |
| T2 | 12 | 19.7 | |
| T3 | 19 | 31.1 | |
| T4 | 28 | 45.9 | |
| Cervical lymph node metastasis | |||
| N0 | 27 | 44.2 | |
| N1 | 2 | 3.3 | |
| N2 | 4 | 6.6 | |
| N3 | 28 | 45.9 | |
| Grading | |||
| G1 | 11 | 18.0 | |
| G2 | 40 | 65.6 | |
| G3 | 10 | 16.4 | |
| AJCC stage | |||
| I | 2 | 3.3 | |
| II | 4 | 6.6 | |
| III | 8 | 13.1 | |
| IV | 47 | 77.0 | |
Table 2.
Characteristics of dissected lymph nodes in patients with cervical lymph node metastasis per patient (n=33 patients; 64 procedures).
Table 2.
Characteristics of dissected lymph nodes in patients with cervical lymph node metastasis per patient (n=33 patients; 64 procedures).
| Mean | Median | SD | Min | Max | |
| Lymph node yield | 36.9 | 36 | 10.5 | 21 | 59 |
| Number of positive lymph nodes | 3.7 | 3 | 2.4 | 1 | 9 |
| Lymph node ratio | 0.10690 | 0.09090 | 0.07334 | 0.02222 | 0.36 |
Table 3.
Characteristics and statistical analysis of clinical and pathomorphological features of analysed group of patients – with and without lymph nodes metastases.
Table 3.
Characteristics and statistical analysis of clinical and pathomorphological features of analysed group of patients – with and without lymph nodes metastases.
| Characteristics | Number of patients | Lymph node metastasis |
χ2 value |
P value | ||
| n | Yes | No | ||||
| Gender | 4.390 | p < 0.05 | ||||
| Male | 37 | 24 | 13 | |||
| Female | 24 | 9 | 15 | |||
| Age | 5.838 | p < 0.05 | ||||
| <65 years | 23 | 17 | 6 | |||
| ≥65 years | 38 | 16 | 22 | |||
| Smoking | 4.390 | p < 0.05 | ||||
| yes | 37 | 24 | 13 | |||
| no | 24 | 9 | 15 | |||
| Alcohol consumption | 1.068 | p > 0.05 | ||||
| yes | 17 | 11 | 6 | |||
| no | 44 | 22 | 22 | |||
| Primary tumor site** | 49.969** | p < 0.05 | ||||
| Buccal Mucosa | 4 | 1 | 3 | |||
| Floor of the mouth | 18 | 11 | 7 | |||
| Lower lip | 4 | 0 | 4 | |||
| Lower gingiva | 18 | 12 | 6 | |||
| Upper gingiva | 8 | 4 | 4 | |||
| Tongue | 9 | 5 | 4 | |||
| Ulceration | 0.236 | p > 0.05 | ||||
| yes | 35 | 18 | 17 | |||
| no | 26 | 15 | 11 | |||
| pT stage | 0.100 | p > 0.05 | ||||
| T1+T2 | 14 | 8 | 6 | |||
| T3 | 19 | 11 | 8 | |||
| T4 | 28 | 14 | 14 | |||
| Depth of infiltration | 4.573 | p < 0.05 | ||||
| ≤ 10 mm* | 28 | 11 | 17 | |||
| > 10 mm | 33 | 22 | 11 | |||
| Stage (AJCC 8th edition) | 22.881 | p < 0.05 | ||||
| I+II+III | 14 | 0 | 14 | |||
| IV | 47 | 33 | 14 | |||
| Angioinvasion and/or Neuroinvasion | 6.573 | p < 0.05 | ||||
| yes | 26 | 19 | 7 | |||
| no | 35 | 14 | 21 | |||
| ENE | N/A | N/A | ||||
| yes | 27 | 27 | 0 | |||
| no | 34 | 6 | 28 | |||
| Keratodes | 6.416 | p < 0.05 | ||||
| yes | 53 | 32 | 21 | |||
| no | 8 | 1 | 7 | |||
| Grade** | 39.165 | p < 0.05 | ||||
| G1 | 11 | 4 | 7 | |||
| G2 | 40 | 24 | 16 | |||
| G3 | 10 | 5 | 5 | |||
N/A – not applied. * only in 2 patients DOI was ≤ 5 mm and they were combined with patients with DOI 5-10 mm. ** χ2 value with William’s correction.
Table 4.
Multivariate logistic regression analysis of the risk factors of the cervical lymph node metastasis in OSCC patients enrolled into this study.
Table 4.
Multivariate logistic regression analysis of the risk factors of the cervical lymph node metastasis in OSCC patients enrolled into this study.
| Variables | B value | S.E. value | Wald X2 value | OR (95% ei) | P value | |
| Age | 0.869 | 0.056 | 8.898 | 0.869 (0.779 – 0.970) | 0.0029 | |
| Gender | 0.220 | 0.770 | 4.133 | 0.22 (0.049 – 0.997) | 0.0420 | |
| Tumor stage | ||||||
| I | 2.236 | 223.609 | 34.396 | 2.236 (1.030 – 4.854) | 0.0000 | |
| II | 1.379 | 158.117 | 1.379 (3.546 – 5.364) | |||
| III | 2.896 | 111.805 | 2.896 (1.865 – 4.263) | |||
S.E. – standard error.
Table 5.
Comparison of nitrogen 15N and carbon 13C abundance in tumor tissues in patients with lymph node involvement and without it.
Table 5.
Comparison of nitrogen 15N and carbon 13C abundance in tumor tissues in patients with lymph node involvement and without it.
| Lymph node metastasis | Lymph node metastasis | χ2 value | P value | ||
| Yes | No | ||||
| Nitrogen (%) | Min-Max | 3.10 – 13.40 | 6.40 – 13.10 | 0.195 | 0.097488 |
| Median | 12.70 | 12.50 | |||
| IQR | 0.60 | 0.80 | |||
|
Carbon (%) |
Min-Max | 44.00 – 69.50 | 44.10 – 63.90 | 0.103 | 0.890641 |
| Median | 46.20 | 46.20 | |||
| IQR | 1.40 | 2.00 | |||
| [N]/[C] | Min-Max | 0.045 – 0.316 | 0.104 – 0.291 | 0.641 | 0.195206 |
| Median | 0.274 | 0.272 | |||
| IQR | 0.014 | 0.024 | |||
| δ15N(‰) | Min-Max | 7.240 – 10.218 | 7.500 – 10.838 | 0.064 | 0.249896 |
| Median | 8.800 | 8.700 | |||
| IQR | 1.117 | 0.945 | |||
| δ13C(‰) | Min-Max | -26.506 – -20.072 | -25.780 – -20.858 | 0.103 | 0.116341 |
| Median | -22.304 | -22.746 | |||
| IQR | 1.145 | 0.653 | |||
Table 6.
a. Correlation between IRMS measurements and risk factors of cervical lymph node metastasis.
Table 6.
a. Correlation between IRMS measurements and risk factors of cervical lymph node metastasis.
| Category | Nitrogen (%) | Carbon (%) | |||||||||
| Min-Max | Median | IQR | χ2 | P value | Min-Max | Median | IQR | χ2 | P value | ||
| Age | |||||||||||
| <65 years | 3.10–13.30 | 12.0 | 2.10 | 0.15 | p>0.05 | 44.0–69.50 | 46.0 | 14.40 | 0.02 | p>0.05 | |
| ≥65 years | 3.10–13.10 | 13.0 | 0.70 | 44.0–69.50 | 46.0 | 1.40 | |||||
| Gender | |||||||||||
| Male | 6.30–13.40 | 13.0 | 0.90 | 0.01 | p>0.05 | 44.0–63.90 | 46.0 | 2.60 | 0.04 | p>0.05 | |
| Female | 3.10–13.0 | 13.0 | 0.90 | 44.0–69.50 | 46.0 | 2.10 | |||||
| Stage | |||||||||||
| I+II+III | 6.40–13.40 | 12.0 | 6.10 | 4.12 | p<0.05 | 44.80–63.90 | 46.0 | 15.70 | 0.09 | p>0.05 | |
| IV | 3.10–13.40 | 13.0 | 0.90 | 44.0–69.50 | 46.0 | 1.70 | |||||
| Smoking | |||||||||||
| Yes | 3.10–13.40 | 13.0 | 0.90 | 0.03 | p>0.05 | 44.0–69.50 | 46.0 | 2.00 | 0.06 | p>0.05 | |
| No | 3.10–13.40 | 13.0 | 1.40 | 44.0–69.50 | 46.0 | 5.30 | |||||
| DoI (mm) | |||||||||||
| ≤ 10 mm | 6.50–13.20 | 13.0 | 1.00 | 0.05 | p>0.05 | 44.0–63.90 | 46.0 | 5.40 | 0.08 | p>0.05 | |
| > 10 mm | 3.10–13.40 | 13.0 | 0.80 | 44.0–69.50 | 46.0 | 1.60 | |||||
| Angioinvasion or Neuroinvasion | |||||||||||
| Yes | 3.10–13.0 | 12.0 | 0.70 | 0.07 | p>0.05 | 44.0–69.50 | 46.0 | 1.60 | 0.03 | p>0.05 | |
| No | 5.50–13.40 | 13.0 | 1.40 | 44.0–69.50 | 46.0 | 3.60 | |||||
| ENE(+) (ipsilateral or contralateral) | |||||||||||
| Yes | 10.30–13.40 | 13.0 | 0.90 | 0.09 | p>0.05 | 44.0–50.80 | 46.0 | 1.40 | 0.12 | p>0.05 | |
| No | 3.10–13.40 | 12.0 | 1.10 | 44.0–69.50 | 46.0 | 3.60 | |||||
| Keratodes | |||||||||||
| Yes | 3.10–13.40 | 13.0 | 0.90 | 0.04 | p>0.05 | 44.0–69.50 | 46.0 | 1.60 | 0.05 | p>0.05 | |
| No | 6.60–13.40 | 12.0 | 5.20 | 45.80–63.70 | 46.0 | 13.70 | |||||
| Grade | |||||||||||
| G1 | 6.40–13.10 | 13.0 | 6.20 | 0.06 | p>0.05 | 45.40–63.90 | 46.0 | 15.70 | 0.08 | p>0.05 | |
| G2 | 3.10–13.40 | 13.0 | 0.90 | 44.0–69.50 | 46.0 | 1.70 | |||||
| G3 | 3.10–12.70 | 12.0 | 9.40 | 45.80–69.50 | 46.0 | 23.70 | |||||
Table 6.
b. Correlation between IRMS measurements and risk factors of cervical lymph node metastasis.
Table 6.
b. Correlation between IRMS measurements and risk factors of cervical lymph node metastasis.
| Category | [N]/[C] | δ15N(‰) | δ13C(‰) | |||||||||||||
| Min-Max | Median | IQR | χ2 | P value | Min-Max | Median | IQR | χ2 | P value | Min-Max | Median | IQR | χ2 | P value | ||
| Age | ||||||||||||||||
| <65 years | 0.045–0.316 | 0.27 | 0.066 | 0.08 | p>0.05 | 7.24–10.25 | 8.99 | 1.19 | 0.73 | p>0.05 | -26.51– -20.07 | -22.70 | 2.48 | 0.26 | p>0.05 | |
| ≥65 years | 0.045–0.286 | 0.27 | 0.009 | 7.74–10.84 | 8.65 | 1.34 | -26.51– -20.86 | -22.41 | 1.04 | |||||||
| Gender | ||||||||||||||||
| Male | 0.104–0.316 | 0.27 | 0.034 | 0.02 | p>0.05 | 7.24–10.25 | 8.65 | 1.01 | 0.12 | p>0.05 | -24.69– -20.07 | -22.44 | 1.52 | 0.03 | p>0.05 | |
| Female | 0.045–0.291 | 0.27 | 0.010 | 8.19–10.22 | 8.83 | 1.31 | -26.51– -21.29 | -22.48 | 0.76 | |||||||
| Stage | ||||||||||||||||
| I+II+III | 0.104–0.291 | 0.27 | 0.168 | 0.07 | p>0.05 | 8.13–10.84 | 8.83±0.87 | 1.02 | 0.11 | p>0.05 | -24.68– -22.01 | -22.88 | 1.68 | 4.25 | p<0.05 | |
| IV | 0.045–0.316 | 0.27 | 0.013 | 7.24–10.22 | 8.86±0.67 | 1.35 | -26.51– -20.07 | -22.40 | 2.48 | |||||||
| Smoking | ||||||||||||||||
| Yes | 0.045–0.316 | 0.27 | 0.012 | 0.04 | p>0.05 | 7.24–10.25 | 8.81±0.76 | 1.33 | 0.09 | p>0.05 | -26.51– -20.07 | -22.45 | 1.44 | 0.02 | p>0.05 | |
| No | 0.045–0.291 | 0.27 | 0.030 | 7.74–10.84 | 8.91±0.64 | 1.35 | -26.51– -20.86 | -22.47 | 2.68 | |||||||
| DoI (mm) | ||||||||||||||||
| ≤ 10 mm | 0.104–0.312 | 0.27 | 0.011 | 0.03 | p>0.05 | 7.24–10.84 | 8.81±0.84 | 1.08 | 0.14 | p>0.05 | -25.76– -20.07 | -22.70 | 1.62 | 0.04 | p>0.05 | |
| > 10 mm | 0.045–0.316 | 0.27 | 0.010 | 7.74–9.86 | 8.88±0.60 | 1.17 | -26.51– -21.29 | -22.70 | 1.52 | |||||||
| Angioinvasion or Neuroinvasion | ||||||||||||||||
| Yes | 0.045–0.280 | 0.27 | 0.009 | 0.06 | p>0.05 | 7.90–10.22 | 8.92±0.56 | 1.38 | 0.18 | p>0.05 | -26.51– -20.07 | -22.26 | 1.15 | 4.03 | p<0.05 | |
| No | 0.045–0.316 | 0.27 | 0.034 | 7.24–10.84 | 8.80±0.81 | 1.27 | -26.51– -20.86 | -22.75 | 2.68 | |||||||
| ENE(+) (ipsilateral or contralateral) | ||||||||||||||||
| Yes | 0.214–0.316 | 0.28 | 0.018 | 0.08 | p>0.05 | 7.24–10.22 | 8.87±0.74 | 1.19 | 0.16 | p>0.05 | -23.92– -20.07 | -22.38 | 1.15 | 0.05 | p>0.05 | |
| No | 0.045–0.291 | 0.27 | 0.026 | 7.74–10.84 | 8.83±0.69 | 1.47 | -26.51– -20.86 | -22.71 | 2.68 | |||||||
| Keratodes | ||||||||||||||||
| Yes | 0.045–0.316 | 0.27 | 0.011 | 0.03 | p>0.05 | 7.24–10.22 | 8.84±0.68 | 1.27 | 0.07 | p>0.05 | -26.51– -20.07 | -22.44 | 2.16 | 0.06 | p>0.05 | |
| No | 0.104–0.291 | 0.27 | 0.150 | 7.50–10.84 | 8.89±0.93 | 2.12 | -24.69– -22.01 | -22.72 | 2.02 | |||||||
| Grade | ||||||||||||||||
| G1 | 0.104–0.312 | 0.27 | 0.168 | 0.05 | p>0.05 | 7.24–10.84 | 8.63±0.95 | 1.09 | 0.13 | p>0.05 | -24.68– -21.37 | -22.70 | 1.83 | 0.07 | p>0.05 | |
| G2 | 0.045–0.316 | 0.27 | 0.014 | 7.50–10.22 | 8.90±0.65 | 1.27 | -26.51– -20.07 | -22.41 | 2.48 | |||||||
| G3 | 0.045–0.278 | 0.27 | 0.229 | 8.55–9.66 | 8.89±0.62 | 1.06 | -26.51– -21.29 | -22.58 | 4.21 | |||||||
Disclaimer/Publisher’s Note: The statements, opinions and data contained in all publications are solely those of the individual author(s) and contributor(s) and not of MDPI and/or the editor(s). MDPI and/or the editor(s) disclaim responsibility for any injury to people or property resulting from any ideas, methods, instructions or products referred to in the content. |
© 2025 by the authors. Licensee MDPI, Basel, Switzerland. This article is an open access article distributed under the terms and conditions of the Creative Commons Attribution (CC BY) license (http://creativecommons.org/licenses/by/4.0/).
Copyright: This open access article is published under a Creative Commons CC BY 4.0 license, which permit the free download, distribution, and reuse, provided that the author and preprint are cited in any reuse.


