Submitted:
08 August 2025
Posted:
11 August 2025
You are already at the latest version
Abstract
Injera baking in Ethiopia involves labor-intensive work in high-temperature environ-ments, raising concerns about occupational heat stress. Despite this, data on heat ex-posure and related health impacts in this setting are limited. This study aimed to assess heat exposure levels, the prevalence of heat-related illnesses (HRI), and associated factors among workers in the Injera Baking and Local Market sectors in Addis Ababa. A comparative cross-sectional study was conducted among 309 workers (159 bakers and 150 local market workers) who were selected through random sampling. Heat stress was measured using the Wet Bulb Globe Temperature (WBGT). Health and environ-mental data were collected via a modified HOTHAPS questionnaire (administered through Kobo Toolbox), supported by an observational checklist. Multivariable logistic regression was used to identify key factors associated with HRI. The median and range of WBGT during working hours at the Baking Center were 25 and 20.8-32.4°C, respec-tively, higher than the comparative site, 19.5 and 13-22°C. It exceeded ACGIH limits for moderate work from 10 AM to 4 PM at the baking center. Heat-related illness was more prevalent among bakers (46.1%) than among comparative workers (9.7%), with common symptoms including excessive sweating and fatigue. Statistically significant factors associated with HRI included workplace type (AOR = 13.2, 95% CI: 3.4-50.7), lack of cold drinking water (AOR = 4.3, 95% CI: 1.69-10.9), inadequate rest breaks (AOR = 3.5, 95% CI: 1.5-8.13), and daily water intake < 3 liters (AOR = 3.9, 95% CI: 1.55-9.73). The findings underscore the urgent need for workplace interventions to reduce heat exposure and improve hydration and rest practices among Injera baking workers.
Keywords:
heat-related illness
; occupational heat stress
; comparative cross-sectional
; injera baking
; WBGT
; Ethiopia
1. Introduction
Heat stress refers to the cumulative heat load on the human body resulting from both internal metabolic heat production and external sources of heat, and it significantly impacts workers' performance, safety, and health [1]. In recent years, heat stress has become a prolonged and severe global phenomenon, intensifying with climate change and increasing the burden on various sectors, particularly in tropical and subtropical regions [2,3]. Exposure to excessive heat can lead to adverse health consequences such as heat rash, heat cramps, heat exhaustion, and heat stroke, all of which severely affect individual well-being and occupational productivity [4]. Despite these risks, heat stress remains one of the most neglected occupational hazards in many countries [5].
Physiologically, the body responds to high temperatures through mechanisms like sweating and vasodilation [6]. However, chronic exposure may overwhelm these systems, resulting in heat stress symptoms that can escalate from mild discomfort to severe illness or even death [7]. As climate change drives more extreme and frequent temperature events [8], certain occupations, particularly in food production and processing, are becoming increasingly vulnerable to thermal strain [9].
Among these vulnerable occupations is injera baking, a labor-intensive and heat-intensive practice that is both economically and culturally significant in Ethiopia. Injera, a staple food for millions, is traditionally baked on hot clay griddles (mitads) that emit intense radiant heat [10]. Women, who represent the vast majority of workers in this sector, often operate in enclosed or semi-enclosed spaces with poor ventilation and limited access to cooling interventions.
Workers in these settings, such as those at the Lemi Injera Baking Center in Addis Ababa, are routinely exposed to extreme temperatures without adequate occupational safety protocols. Although studies in other sectors, such as floriculture, kitchen work, and manufacturing, have documented the impacts of heat exposure on health and productivity in Ethiopia and other low- and middle-income countries [11], there is a lack of published research that specifically examines occupational heat stress and heat-related illness among injera bakers. This creates a substantial evidence gap and impedes the development of effective, evidence-based interventions in this sector.
In addition, the gendered nature of this labor, being predominantly female, raises specific concerns about occupational vulnerability, especially in light of existing gender inequalities in workplace safety, access to health care, and decision-making.
This lack of targeted investigation hinders the development of effective interventions and workplace protections related to the injera baking sector. Moreover, it limits the understanding of how climate-induced occupational heat stress affects informal, female-dominated workforces in rapidly urbanizing cities. The economic and public health importance of this work highlights the urgency of research that can inform policy, promote occupational safety, and enhance the overall well-being of the workforce.
Therefore, this study aims to assess environmental heat exposure levels, the prevalence of heat-related illnesses (HRI), and associated factors among workers at the Lemi Injera Baking Center in Addis Ababa. A comparison group of local market workers was also included to contextualize the findings. By addressing this knowledge gap, the study contributes novel evidence to inform preventive strategies and occupational health improvements for injera baking workers and similar vulnerable populations.
2. Materials and Methods
2.1. Study Setting
Addis Ababa, Ethiopia's capital city, located at an altitude of 2,200 to 2,500 m above sea level, is characterized by a temperate climate with annual average temperatures ranging from 9.89°C to 24.64 °C [12]. The city is the country’s center for socio-economic development, which contributed 38.3% ( $61.2 billion) to the national GDP [13].
The Lemi Injera Baking Centre, which is found in Lemi Kura sub-city, was established in 2023 by the Addis Ababa City Administration. This center specializes in the production of large-scale injera, a kind of Ethiopian food. The shades were made of thick iron sheets. Workstations operate in shifts, more than 490 employees exposed to high ambient and radiant heat from multiple ovens, creating a persistently elevated thermal environment.
The comparative study site is a Local Market Centre in the same sub-city neighboring the main study site. This center houses over 500 workers who prepare and sell a range of products in a shared marketplace. These workers operate in a space with minimal thermal load, lacking direct exposure to heat-generating sources, making the site suitable for comparison. Workers work in an area not exposed to direct sun or other extreme sources of heat, and it is a suitable comparison environment for the study. The shades were made of iron sheets. A good part of these workers are mainly women, similar to the socio-demographics of the injera baking workers (age and economic status). The overlaps facilitate a scientifically sound benchmarking of the primary study sample, thereby allowing for valid comparison. A map based on a GIS of the study area is below in Figure 1.
2.2. Study Design
A comparative cross-sectional study was applied to determine the level of heat exposure and HRI among workers at Lemi Injera Baking and Local Market Centers in Addis Ababa. With this design, it was possible to compare heat stress levels and HRIs between Injera baking and Market workers.
2.3. Study Period and Population
Data collection was conducted from February 17 to March 2, 2025. This period was chosen because it represents one of the warmer phases in Addis Ababa’s annual climate cycle, based on data from the Ethiopian National Meteorological Agency. It reflects typical working conditions in the pre-rainy season.
The study population for this research consists of all baking workforces selected at the Lemi Injera Baking Center who experience heat stress challenges. A similar group was also selected from the Local Market workers in the nearby location.
2.4. Inclusion and Exclusion Criteria
Only women aged above 18 years were included, because men are not engaged in a baking activity. Pregnant women and those aged 60 years and above were excluded because they are more susceptible to heat stress.
2.5. Sample size and Sampling Procedure
The final sample size for the study was 318 participants, with 159 workers from the Lemi Injera Baking Center and 159 from the Local Market Center calculated based on double population proportion (95%CI, 90% power, 10% non-response rate, P1=78.2%, P2=61.2%: a study among hospitality kitchen workers [9]. Participants were randomly selected from a total eligible workforce of 490 injera bakers and 500 market workers using simple random sampling. Therefore, the sample represents a statistically powered subset, not the entire workforce. Additionally, WBGT heat stress measurements were conducted, four days at the baking center (two-day shifts and two-night shifts), and one day at the market center, to assess environmental heat exposure levels.
2.6. Data Collection
Data were collected through environmental monitoring using the Ques Temp 34WI WBGT device (WBGT, Ques Temp 34WI, USA), structured interviews, and site observations using a checklist. Heat exposure was measured following standard procedures to capture temperature, humidity, and radiant heat. WBGT readings were recorded at one-hour intervals in three different zones of the work area to capture spatial and temporal variation.
Trained health professionals conducted interviews using a modified HOTHAPS questionnaire [14] via Kobo Toolbox to gather data on demographics, heat-related symptoms, and work conditions. The HOTHAPS questionnaire was adapted through translation to Amharic and inclusion of context-specific symptoms such as excessive tiredness and double-layer clothing practices.
To ensure transparency and reproducibility, the original and adapted versions of the questionnaire, along with the observational checklist, have been provided as supplementary materials. Observations assessed PPE use, water access, and ventilation.
2.6.1. Operational Definitions
Self-reported heat-related illness: Presence of ≥4 symptoms such as excessive sweating, fatigue, muscle cramps, headache, rashes, nausea, dizziness, or fainting during hot work periods [15,16,17].
Heat stress: Total heat load from environmental and metabolic sources, assessed using WBGT per ACGIH guidelines; threshold limits are 27.5°C for heavy and 28.5°C for moderate workloads [18].
Sufficient rest break: Rest time excluding bathroom use > 60 min (≤8-hr shift), ≥75 min (8–10 hr), or ≥90 min (10–12 hr).
Water access: Availability of drinking water within a 3-minute walk from the work area [19].
2.7. Data Analysis
The median and range of WBGT measurements were compared between the injera baking and market sites to assess heat stress levels against occupational safety standards. Descriptive statistics were used to determine the prevalence of self-reported heat-related illnesses in each group. Bivariate and multivariable logistic regression analyses identified factors associated with heat-related illness, with variables showing p < 0.2 in bivariate analysis included in the multivariable model after testing for multicollinearity. A p-value < 0.05 was considered statistically significant.
2.8. Ethical Considerations
Ethical clearance was obtained from the AAU SPH Ethics Review Committee and the Addis Ababa Health Bureau. Verbal informed consent was obtained from all participants after explaining the study’s purpose, risks, and benefits. Privacy was ensured, data were securely stored, and participants with health issues were referred to nearby health centers.
3. Results
3.1. Sociodemographic Characteristics
Of the total (318) study participants, 309 (97.2%) respondents participated in the study. Among these participants, 154(49.8%) were from the injera baking and 155 (50.2%) were from the Local market center. All participants were female for both groups. The mean age was 37.28±7.44 for the participants from Injera Baking and 38.26±8.40 for the participants from Local Market. Among the study participants, 155 (50.2%) had at least a primary education. 226 (73.1%) of participants were married. The socio-demographic profiles between the two groups were largely comparable, suggesting minimal confounding from baseline characteristics as shown in Table 1 below.
3.2. WBGT-Based Heat Exposure Measurement
The measured WBGT values during working hours were consistently higher at the Baking Center compared to the Local Market site, indicating elevated heat exposure.
Box plots in Figure 2 show that bakery day shift workers faced the highest heat exposure (median WBGT >29°C), followed by the night shift (~24°C). Reference workers had the lowest exposure.
At the Baking Center, during the day shift, WBGT levels rose steadily from 20.8°C at 8 AM to a peak of 32.4°C at 11 AM. After a slight decrease to 32.3°C at noon, levels dropped more notably at 1 PM, when injera baking activity was inactive. Then after WBGT increased again to 31.1°C at 3 PM, before gradually declined to 25.2°C by 5 PM. Generally, these values are beyond the international standard TLV for moderate work (ACGIH) from 10:00 AM to 4:00 PM. The reference area WBGT showed consistently lower values, ranging from 13°C at 8 AM to a peak of 22°C at 1 PM, with more gradual changes than the Baking Center. Figure 3 indicates generally lower heat stress at the Local Market Center during the day.
During the night shift, WBGT levels increased from 8 PM and 10 PM, reaching a peak of 27.4°C at 10 PM, when the baking activity was at fast with full staff. The lowest WBGT, 21.3°C, was recorded at midnight when injera baking activity was stopped. After midnight, WBGT increased again until 3 AM as baking resumed, followed by a gradual decrease Figure 4.
3.3. Prevalence of Self-Reported Heat-Related Illness and Symptoms.
Heat-related illnesses (≥4 symptoms) were significantly more common among Injera Baking workers (46.1%) than Market workers (9.7%), with a relative risk over 4.7 times higher. Table 2 shows excessive sweating (85.7%) and fatigue (80.5%) were the most common symptoms among bakers. These results emphasize the heightened physiological burden on workers in the baking environment and justify targeted preventive interventions.
3.3. Multivariable Logistic Regression
In Table 3 results from multivariable logistic regression showed some variables that were statistically significantly associated with heat-related illness, which include the work group, availability of cold drinking water, availability of sufficient break time, and water intake.
This study found that the odds of developing HRIs among Injera baking workers are 13 times higher than those of local market workers, AOR=13.2 (95% CI: 3.4-50.7). Cold drinking water availability was also very important; workers without access to cold drinking water had over four times the risk of acquiring heat-related illness (AOR=4.3, 95% CI: 1.69-10.9). Sufficient break time also had an effect; workers without sufficient breaks had over three times the risk of acquiring heat-related illness (AOR = 3.5, 95% CI: 1.5-8.13). Drinking less than 3 liters of water per day during hot weather increases the odds of heat-related illness by over three times (AOR =3.9, 95% CI: 1.55-9.73, p = 0.004) compared to those drinking more.
3.3. Observational Findings
Workers at the injera facility mostly worked close to a baking stove (nearly 20cm) and managed three stoves at a time, while those at the market center did tasks with less heat exposure.
At the injera production site, there was a local exhaust ventilation system, but it was not working. Management explained that when they did use it, the quality of the injera got worse. The natural airflow was also poor because the air entering the openings was too small and not well-designed. They also were not positioned to take in the usual eastern winds, so they were not effective in cooling down the workspace. In contrast, the market center had good natural ventilation. This improved air quality and made the work environment more comfortable for workers.
The injera production site did not have enough access to clean drinking water and shower facilities for workers. The main water source is from a mobile water truck to fill the tanker that was installed at the work site. Water was not available continuously some workers had to bring their own drinking water from home due to concerns about cleanliness and availability.
Workers in the injera production facility commonly wore double workwear, including a standard uniform. Conversely, workers in the market center typically wore breathable cotton full-body suits, which are more conducive to maintaining thermal comfort.
4. Discussion
The study showed differences in heat exposure level and HRIs between Injera Baking and Local Market workers in Addis Ababa. WBGT measurements showed higher heat exposure among Injera Baking workers compared to Local Market workers. The prevalence of heat-related illnesses was markedly greater among Injera Baking workers (46.1%) than Local Market workers (9.7%), with self-reported symptoms such as excessive sweating, fatigue, and muscle cramps being far more common among the baking group. Factors significantly associated with HRIs include work setting, access to cold drinking water, rest breaks, and water intake (p<0.05).
The median WBGT during working hours at the Baking Center was 25°C, with a range of 20.8˚C-32.4°C, which was is significantly higher than the comparative site’s median of 19.5°C and range of 13°C -22°C (P < 0.05). This difference mainly due to the continuous operation of multiple baking stoves in a space with poor ventilation. This is inline with the study conducted in Floriculture Industry of Ethiopia, which reported the median and range of WBGT level was 25.5˚C and 18.1˚C to 31.5˚C respectively [11].
In the Baking Center WBGT peaked at 32.4°C by 11 AM because of the combined effects of rising outdoor temperatures, sunlight, and accumulated indoor heat. A temporary drop occurred at 1 PM during break time. Between 10:00 AM and 4:00 PM the WBGT values exceeded 28.5°C (threshold limit) recommended by the ACGIH standard for moderate work [18]. During night shift at the Injera Baking Center, the maximum WBGT was 27.4°C, which was around 10 PM, when baking activity was highest with full staff.
The occupational heat exposure guideline (ACGIH) is based on the maximum WBGT value for various work levels. The ACGIH standard provides specific recommendations. Based on moderate workload and WBGT level recorded (above 28.5 °C) at the Injera Baking Center, workers should get 25% rest and 75% work per hour between 10:00 AM and 4:00 PM. As this is necessary to prevent HRI by controlling the core body temperatures below 38°C [18].
Socio-demographic characteristics of study participants were generally comparable between the two study groups, which minimizes the confounding variables when comparing HRIs. This includes the mean age, work experience, and monthly income.
The prevalence of HRIs was greatly different between the two study groups. It was 46.1% and 9.7% among Injera Baking and Market workers, respectively. The higher prevalence of HRIs among baking workers is linked with prolonged exposure to high-heat sources in often poorly ventilated spaces. In contrast, market workers typically operate in more ventilated settings, reducing their heat exposure risk. This result was much lower than the result from previous Ethiopian studies among other occupational settings with high heat exposure and similar operational case definition, where HRI rates were 83.9% and 12.6%, respectively, among Steel and Pepsi-Cola factory workers [17]. Similarly, higher rates were reported among aluminum and water bottling factory workers, at 85.3% and 27%, respectively [15]. These discrepancies may be attributed to differences like heat exposure level, workload, and duration of exposure.
Among baking workers, the most commonly self-reported symptoms were excessive sweating, and tiredness/fatigue, while fainting was the least common reported. In contrast, Local market workers primarily reported tiredness/fatigue then excessive sweating. The differences are attributed to the prolonged and direct heat exposure among baking workers.
The previous study conducted in Gonder city among kitchen workers reported lower rates of sweating (43%), tiredness (41.5%), but almost similar fainting cases (6.6%) [9]. The variation in prevalence of the first two symptoms between the studies could be attributed to differences in work exposure time, and the larger sample size in the previous study may have influenced the detection rates of symptoms.
There were significantly higher odds (AOR =13.2, 95% CI: 3.4-50.7) of developing HRIs among bakeries compared to those in the Local Market. This indicates a strong association between occupational setting and the risk of heat-related illness.
The finding was in line with the comparative study conducted in the Aluminum and Water Bottling factory near Addis Ababa, which concluded that workers in the Aluminum factory had almost ten times the odds of developing HRI compared with the control groups(AOR=9.98, 95%CI:4.16–23.95) [15].
The absence of water access increased the odds of heat-related illness more than fourfold (AOR=4.3, 95%CI: 1.69-10.9, p =0.002) than those who had access to water. Other studies showed that the availability of water in a working area decreases the risk of HRIs [16,20]. This ensures access to drinking water is a vital preventive measure against HRIs for heat-exposed workers.
The lack of sufficient rest breaks was found to be a significant risk factor in this study, with workers who did not have sufficient breaks being over three times more likely to develop heat-related illnesses (AOR=3.5, 95%CI:1.5-8.13, p = 0.003). The finding was parallel with the study result from Tanzania and Japan, which highlights that the absence of sufficient breaks was associated with a higher risk of HRIs [20,21]. This shows the importance of routine rest periods as an effective measure to reduce HRI risks in hot working environments.
Concerning water intake, workers who consumed less than 3 liters of water per day had over two times the odds of developing heat-related illnesses compared to those who drank 3 liters or more (AOR = 2.33, 95% CI: 1.05-5.18). The National Institute for Occupational Safety and Health (NIOSH) recommends a daily fluid intake of 5.7 to 9.5 liters for individuals working in hot environments. Inadequate water intake impairs the ability of body to regulate temperature, which increases the risk of HRIs. The finding is nearly supported by research conducted among industrial workers that found individuals consuming less than 3 liters of water per day were five times more likely to experience HRIs compared to those taking 3 liters or more (AOR=5.08, 95%CI: 2.79–9.27) [15]. A study from Malaysia also reported consistent results, reinforcing the importance of adequate fluid intake in preventing HRIs for heat-exposed workers [22].
Among Injera baking workers, neither BMI nor age showed a statistically significant association with HRIs (p-value >0.05). This is supported by a study done in Tanzania [20]. However, other studies have reported that obese individuals have a higher risk of developing HRI than those with normal BMI [23,24], which is contrary to the finding here. This is due to workers with higher BMI in this study may have been less physically active. Similarly, age above 60 years is recognized as a risk factor for HRIs due to diminished thermoregulatory capacity [25]; this association was not observed in the current study. This is likely because individuals over the age of 60 were excluded from this study.
These findings highlight the need for interventions such as adding more work-rest scheduling, water access, and worker education on HRI risks to mitigate them in the workplace.
The study's strengths include the use of WBGT monitoring, robust statistical modeling, and a comparative design enhancing internal validity.
However, reliance on self-reported symptoms introduces potential bias, and the study’s setting limits generalizability to other geographic or industrial contexts.
5. Conclusions
Injera Baking workers were exposed to significantly higher heat levels than Local Market workers. The WBGT values at the baking center often exceed the ACGIH TLV of 28.5°C for moderate work, particularly between 10:00 AM and 4:00 PM. Of baking workers, 46.1% had reported HRI, and 9.7% among the Market Center workers. Some variables were significantly associated with HRI, including: work group, access to drinking water, sufficient rest breaks, and daily water intake (P-value <0.05). The findings highlight the immediate need for targeted interventions to minimize heat exposure and improve workplace safety in baking environments.
Author Contributions
Conceptualization, B.G.C, S.W.A; methodology, B.G.C; software, B.G.C; validation, B.G.C, M.G.S, and A.K.T; formal analysis, B.G.C, S.W.A; investigation, B.G.C; resources, A.K.T; data curation, A.K.T and W.E.K; writing, original draft preparation, B.G.C; writing, review and editing, W.E.K, A.K.T, and M.G.S; funding acquisition, A.K.T. All authors have read and agreed to the published version of the manuscript.
Funding
This research was funded by Addis Ababa University, GEOHealth for Research and Training in East Africa, and Columbia University through the Fogarty International Center of the National Institutes of Health, grant number U01TW010094.
Institutional Review Board Statement
The study was approved by the Institutional Review Board (or Ethics Committee) of Addis Ababa University (protocol code SPH/452/2025 and Jan 22, 2025).
Informed Consent Statement
Verbal informed consent was obtained from all subjects involved in the study.
Data Availability Statement
Research data are available from the corresponding author based on a reasonable request.
Conflicts of Interest
The authors declare they have no conflict of interest.
References
- Rasoul, H., Z. Sajad, B.H. Akbar, H. Abdollah and G. Hossin Investigation of Heat Stress in Workplace for Different Work Groups According to ISO 7243 Standard in Mehr Petrochemical Complex, Assaluyeh, Iran. 2013, 4, ISSN 2008-4978.
- Badi W, S.S.; Zhang X; Adnan M; Di Luca A. Weather and Climate Extreme Events in a Changing Climate 2021.
- NOAA (2018a) National Centers for Environmental Information;
- Kyung, M.; Lee, S.-J.; Dancu, C.; Hong, O. Underreporting of Workers’ Injuries or Illnesses and Contributing Factors: A Systematic Review. BMC Public Health 2023, 23, 558. [CrossRef]
- Kishor, P.B., G.L. Ashok, P.Z. Sanjay, K.B. Vaishali, M.K. Gautman, B.T. Subhash and C.G. Vivekanand Heat Stress and Its Effect in Glass Factory Workers of Central India. International Journal of Engineering Research & Technology (IJERT). 2012, 1, ISSN: 2278-0181.
- Romanovsky, A.A. Chapter 1 - The Thermoregulation System and How It Works. In Thermoregulation: From Basic Neuroscience to Clinical Neurology Part I; Romanovsky, A.A., Ed.; Handbook of Clinical Neurology; Elsevier, 2018; Vol. 156, pp. 3–43.
- ILO Occupational Heat Stress: What Do We Know and What Do We Need to Do? Considerations from an OSH Perspective; 2023;
- Cooney, C.M. Managing the Risks of Extreme Weather: IPCC Special Report. Environ Health Perspect 2012, 120. [CrossRef]
- Melaku, C.; Abere, G.; Zele, Y.T.; Mamaye, Y.; Mekonen, T.A.; Bezie, A.E.; Tesfaye, A.H.; Worede, E.A. The Occupational Heat Exposure-Related Symptoms Prevalence and Associated Factors Among Hospitality Industry Kitchen Workers in Ethiopia: Wet Bulb Globe Temperature. Safety and Health at Work 2024. [CrossRef]
- Tesfay, A.H.; Kahsay, M.B.; Nydal, O.J. Solar Powered Heat Storage for Injera Baking in Ethiopia. Energy Procedia 2014, 57, 1603–1612. [CrossRef]
- Simane, B.; Kumie, A.; Berhane, K.; Samet, J.; Kjellstrom, T.; Patz, J. Occupational Heat Stress in the Floriculture Industry of Ethiopia: Health Risks and Productivity Losses. Health 2022, 14, 254–271. [CrossRef]
- Alemu, Z.A.; Dioha, M.O. Climate Change and Trend Analysis of Temperature: The Case of Addis Ababa, Ethiopia. Environ Syst Res 2020, 9, 27. [CrossRef]
- C40 Cities Addis Ababa [Internet]. London: C40 Cities; C40 Cities, 2023;
- Kjellstrom, T.; Gabrysch, S.; Lemke, B.; Dear, K. The ‘Hothaps’ Programme for Assessing Climate Change Impacts on Occupational Health and Productivity: An Invitation to Carry out Field Studies. Global Health Action 2009, 2, 2082. [CrossRef]
- Genet W, K.A. Assessment of Occupational Heat Stress-Related Illness and Associated Factors among Workers in Secondary Aluminium Production Factory and Water Bottling Factory, Addis Ababa University: Addis Ababa, Ethiopia, 2023, Unpublished.
- Teklu Hailu (BSc.) Assessment of the Prevalence of Heat Stress Related Illness among Outdoor Sugar Factories Workers in Ethiopia., 2018, Unpublished.
- Elilie Asmamaw Assessment of Heat Stress and Heat Related Illness Among Steel Mill Industry Workers in Addis Ababa, Ethiopia, Addis Ababa University: Addis Ababa, 2021, Unpublished.
- ACGIH (2018) TLVs and BEIs Based on the Documentation of the Threshold Limit Values for Chemical Substances and Physical Agents & Biological Exposure Indices.
- Bethel, J.W.; Harger, R. Heat-Related Illness among Oregon Farmworkers. Int J Environ Res Public Health 2014, 11, 9273–9285. [CrossRef]
- Meshi, E.B.; Kishinhi, S.S.; Mamuya, S.H.; Rusibamayila, M.G. Thermal Exposure and Heat Illness Symptoms among Workers in Mara Gold Mine, Tanzania. Ann Glob Health 2018, 84, 360–368. [CrossRef]
- Kawakami R, Hasebe H, Takeuchi G, Yamamoto Y, Yoda S, Abe R, et al. Cooler Break Areas: Reducing Heat Stress Among Construction Workers in Japan. 2024.
- Mansor, Z.; Rosnah, I.; Ismail, N.H.; Hashim, J.H. Effects of Hydration Practices on the Severity of Heat-Related Illness among Municipal Workers during a Heat Wave Phenomenon. Med J Malaysia 2019, 74, 275–280.
- Mohammad Yusof NAD, K.K., Tamrin SBM. Heat Related Illness in Palm Oil Mill Workers under Heat Stress. Adv Environ Biol 2014, 8, 171-6.
- Chung, N.K.; Pin, C.H. Obesity and the Occurrence of Heat Disorders. Mil Med 1996, 161, 739–742. [CrossRef]
- Fouillet, A.; Rey, G.; Laurent, F.; Pavillon, G.; Bellec, S.; Guihenneuc-Jouyaux, C.; Clavel, J.; Jougla, E.; Hémon, D. Excess Mortality Related to the August 2003 Heat Wave in France. Int Arch Occup Environ Health 2006, 80, 16–24. [CrossRef]
Figure 1.
Study area: Map of Baking and Local Market, Lemi Kura, Addis Ababa, Ethiopia.
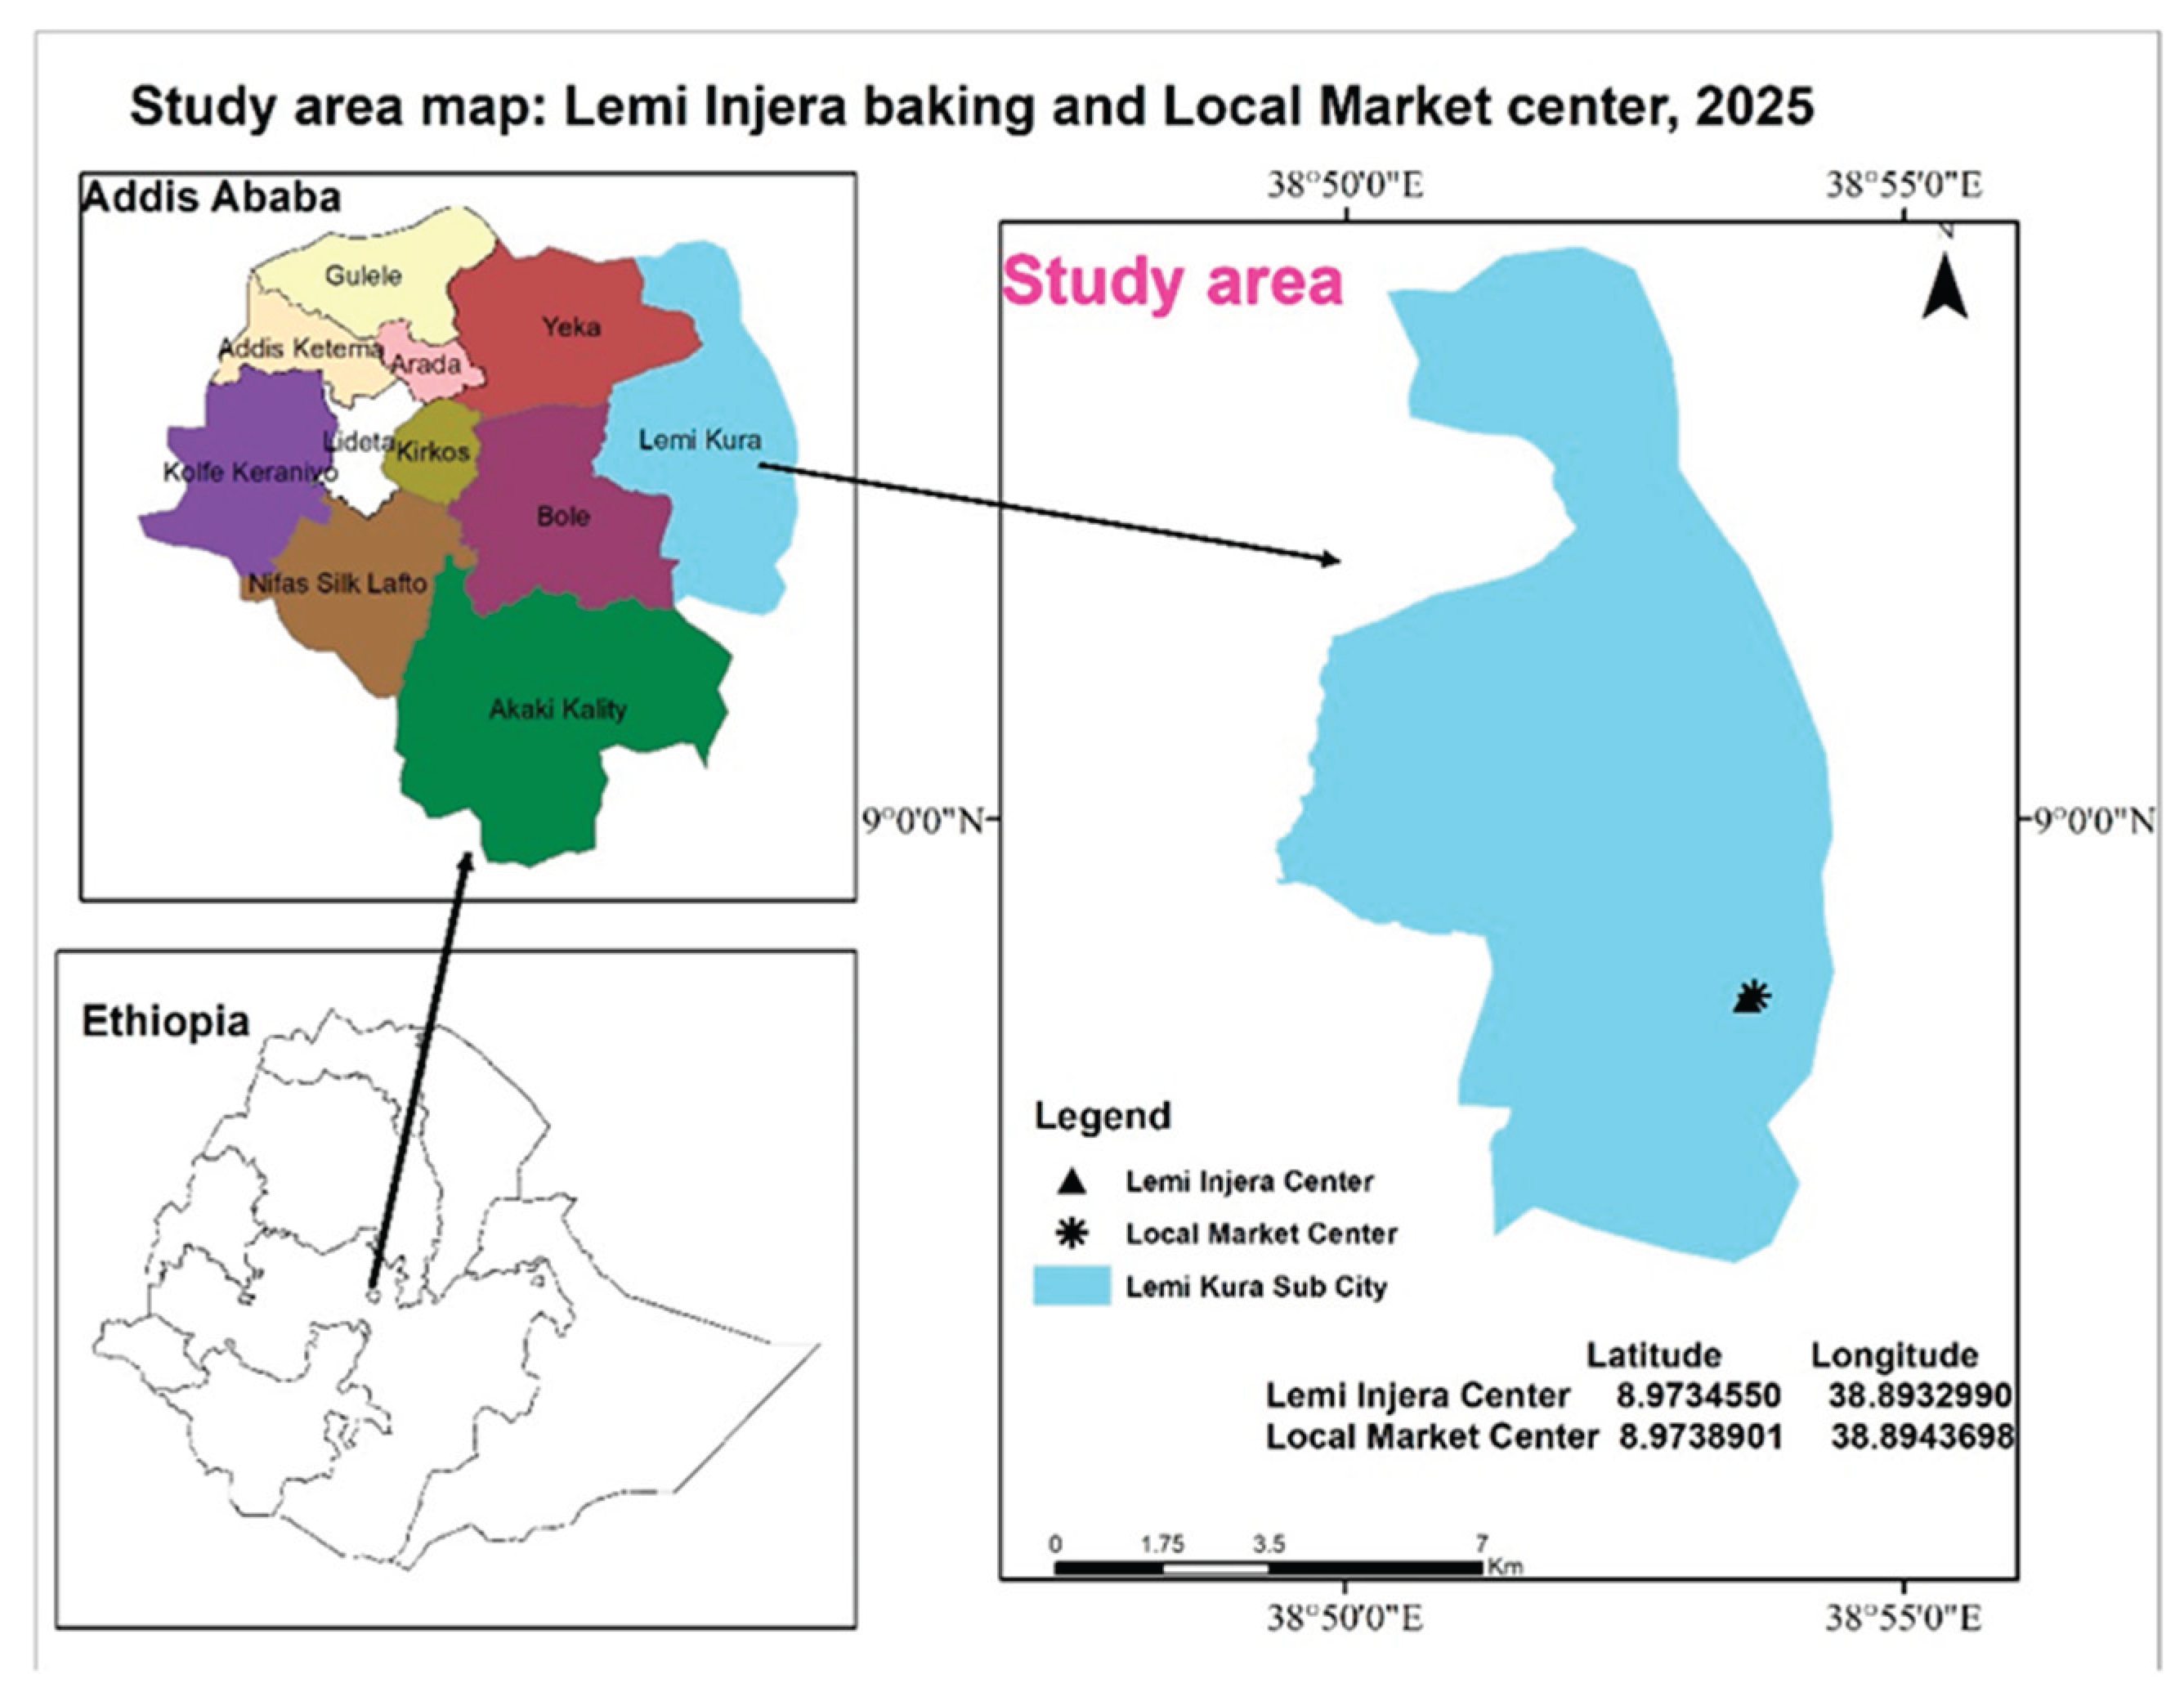
Figure 2.
Box Plot of WBGTIn During Working Hours at Baking Center and comparative area.
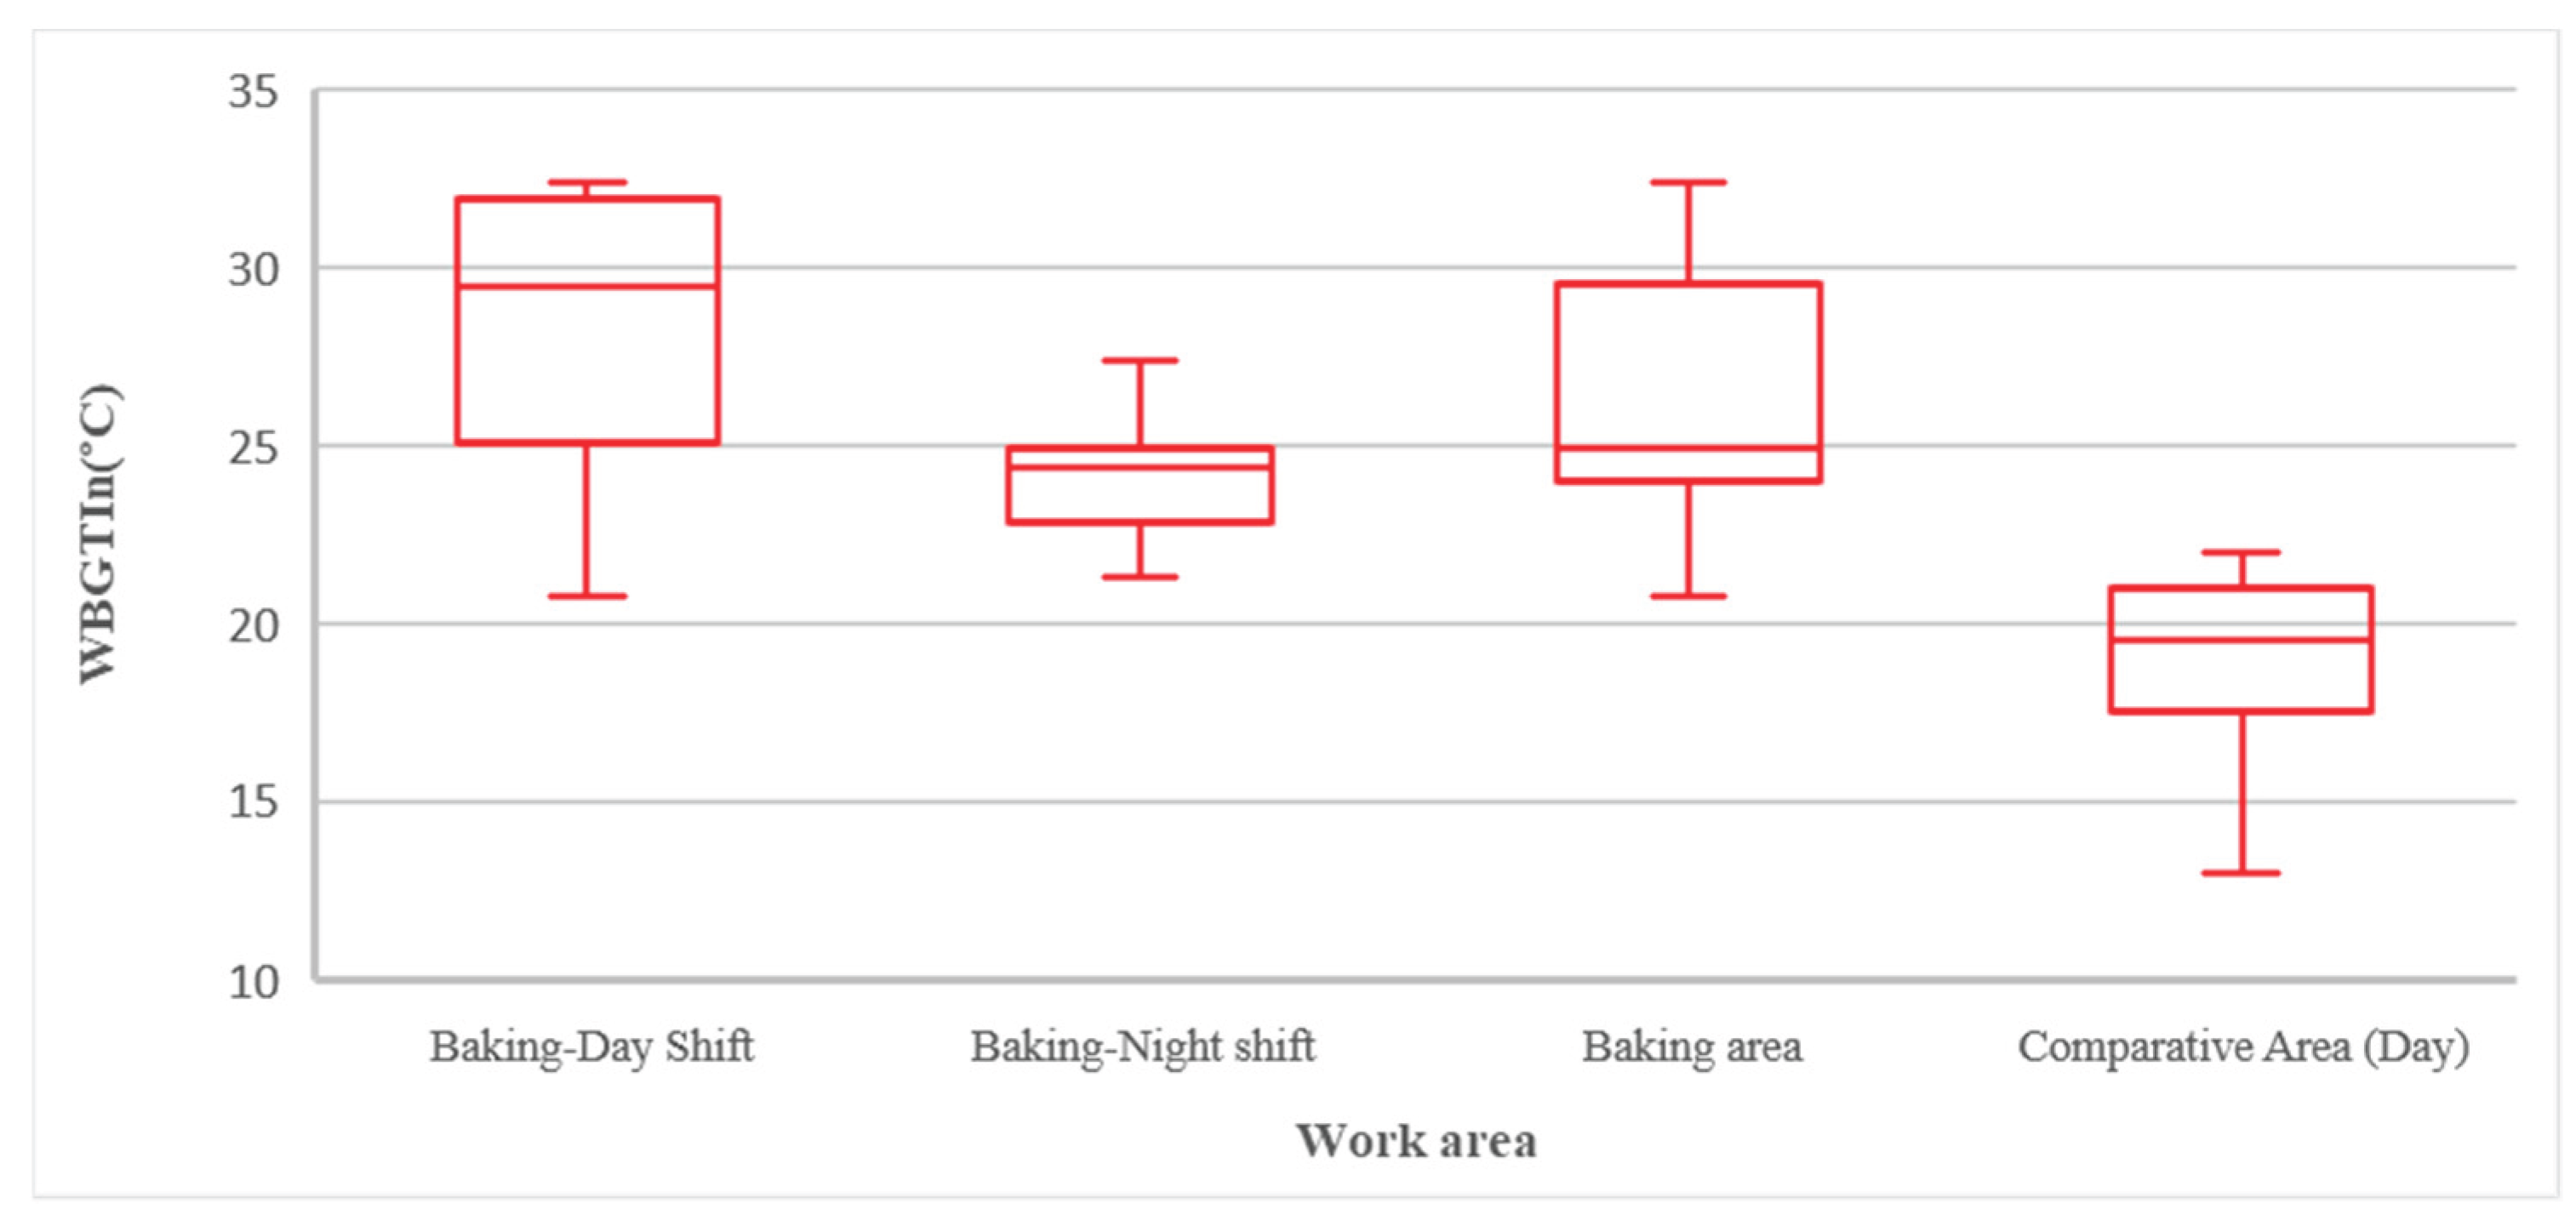
Figure 3.
Hourly average WBGT in both work centers (TLV: Threshold limit value).
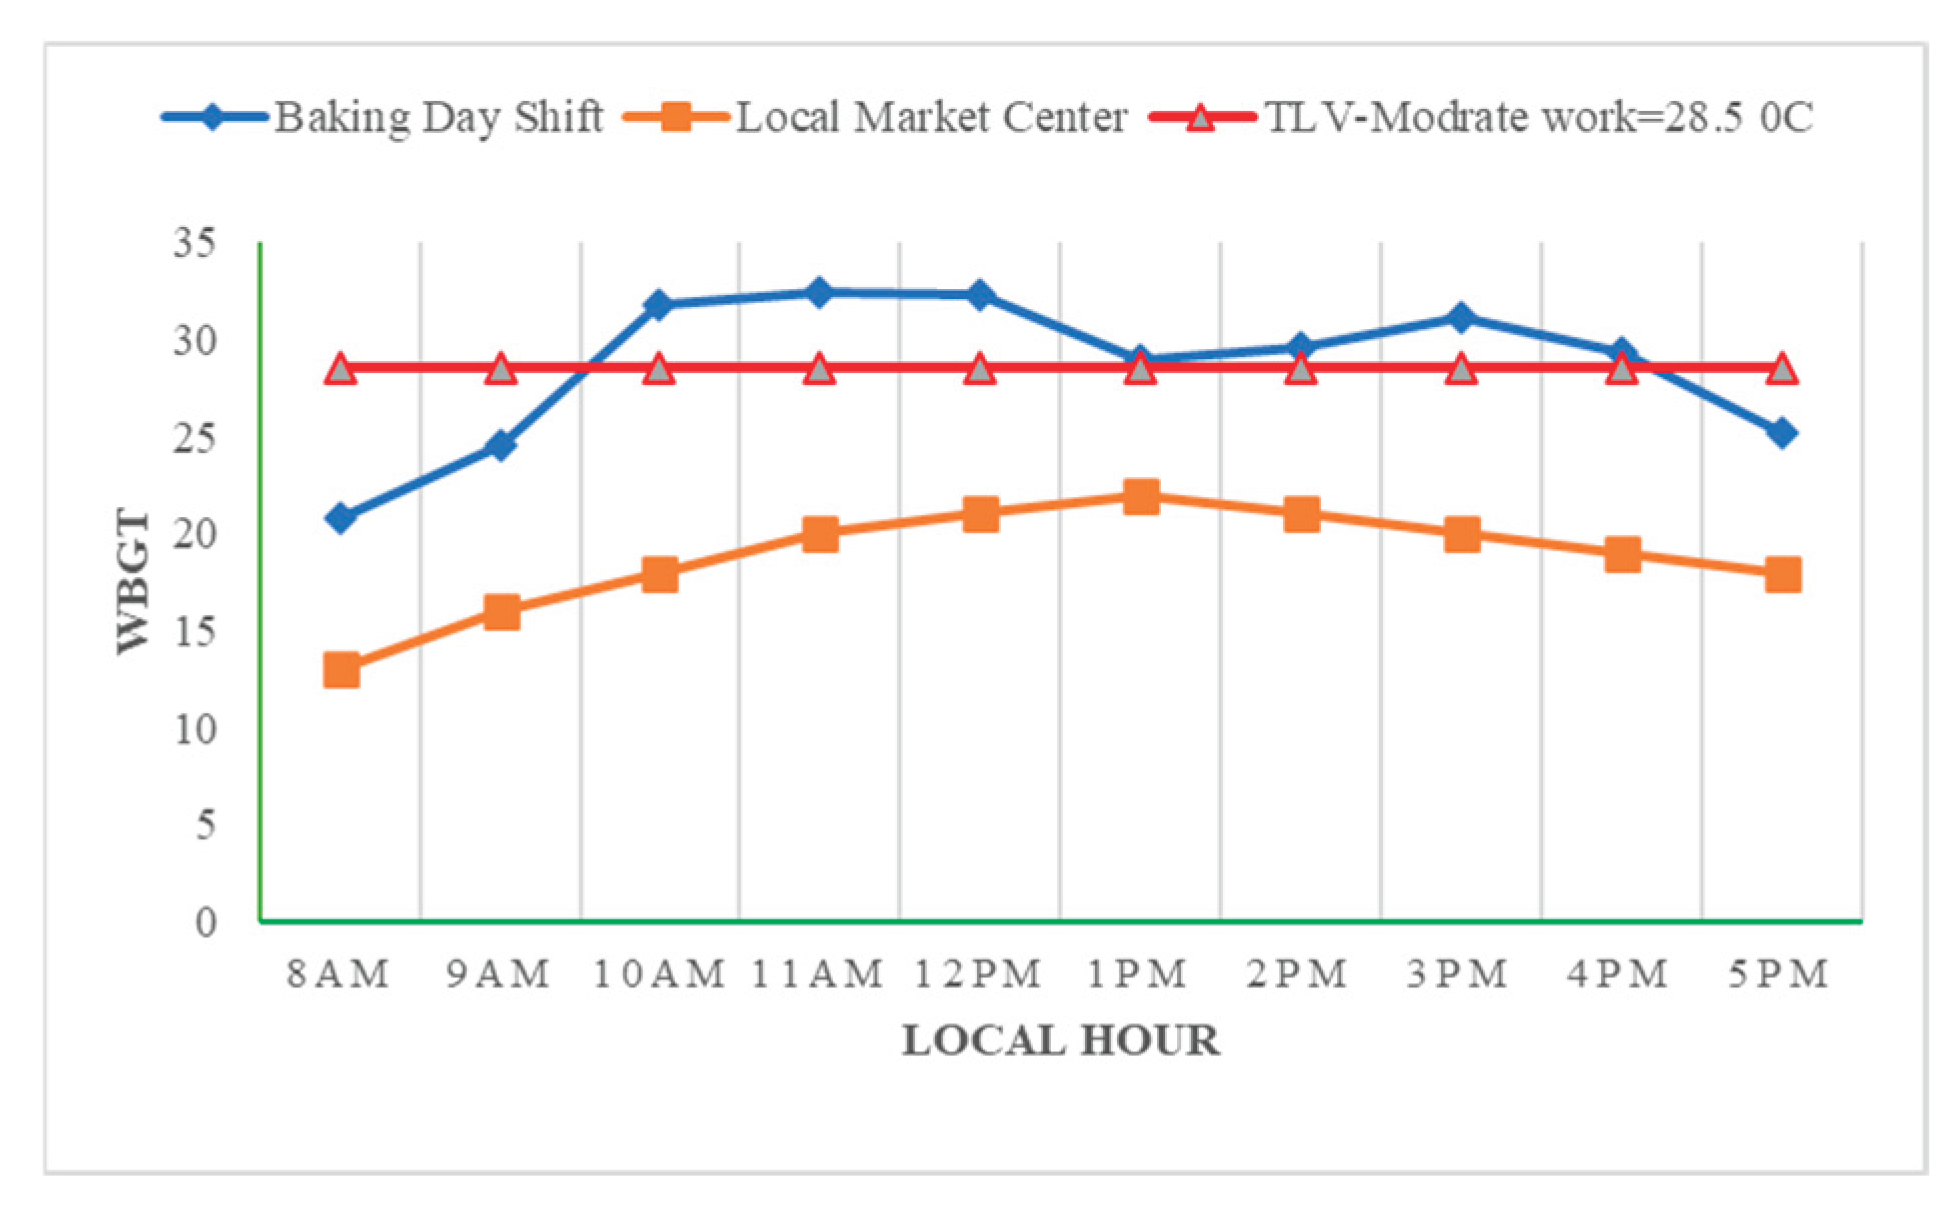
Figure 4.
Hourly trend of WBGT in Baking Center (TLV: Threshold limit value).
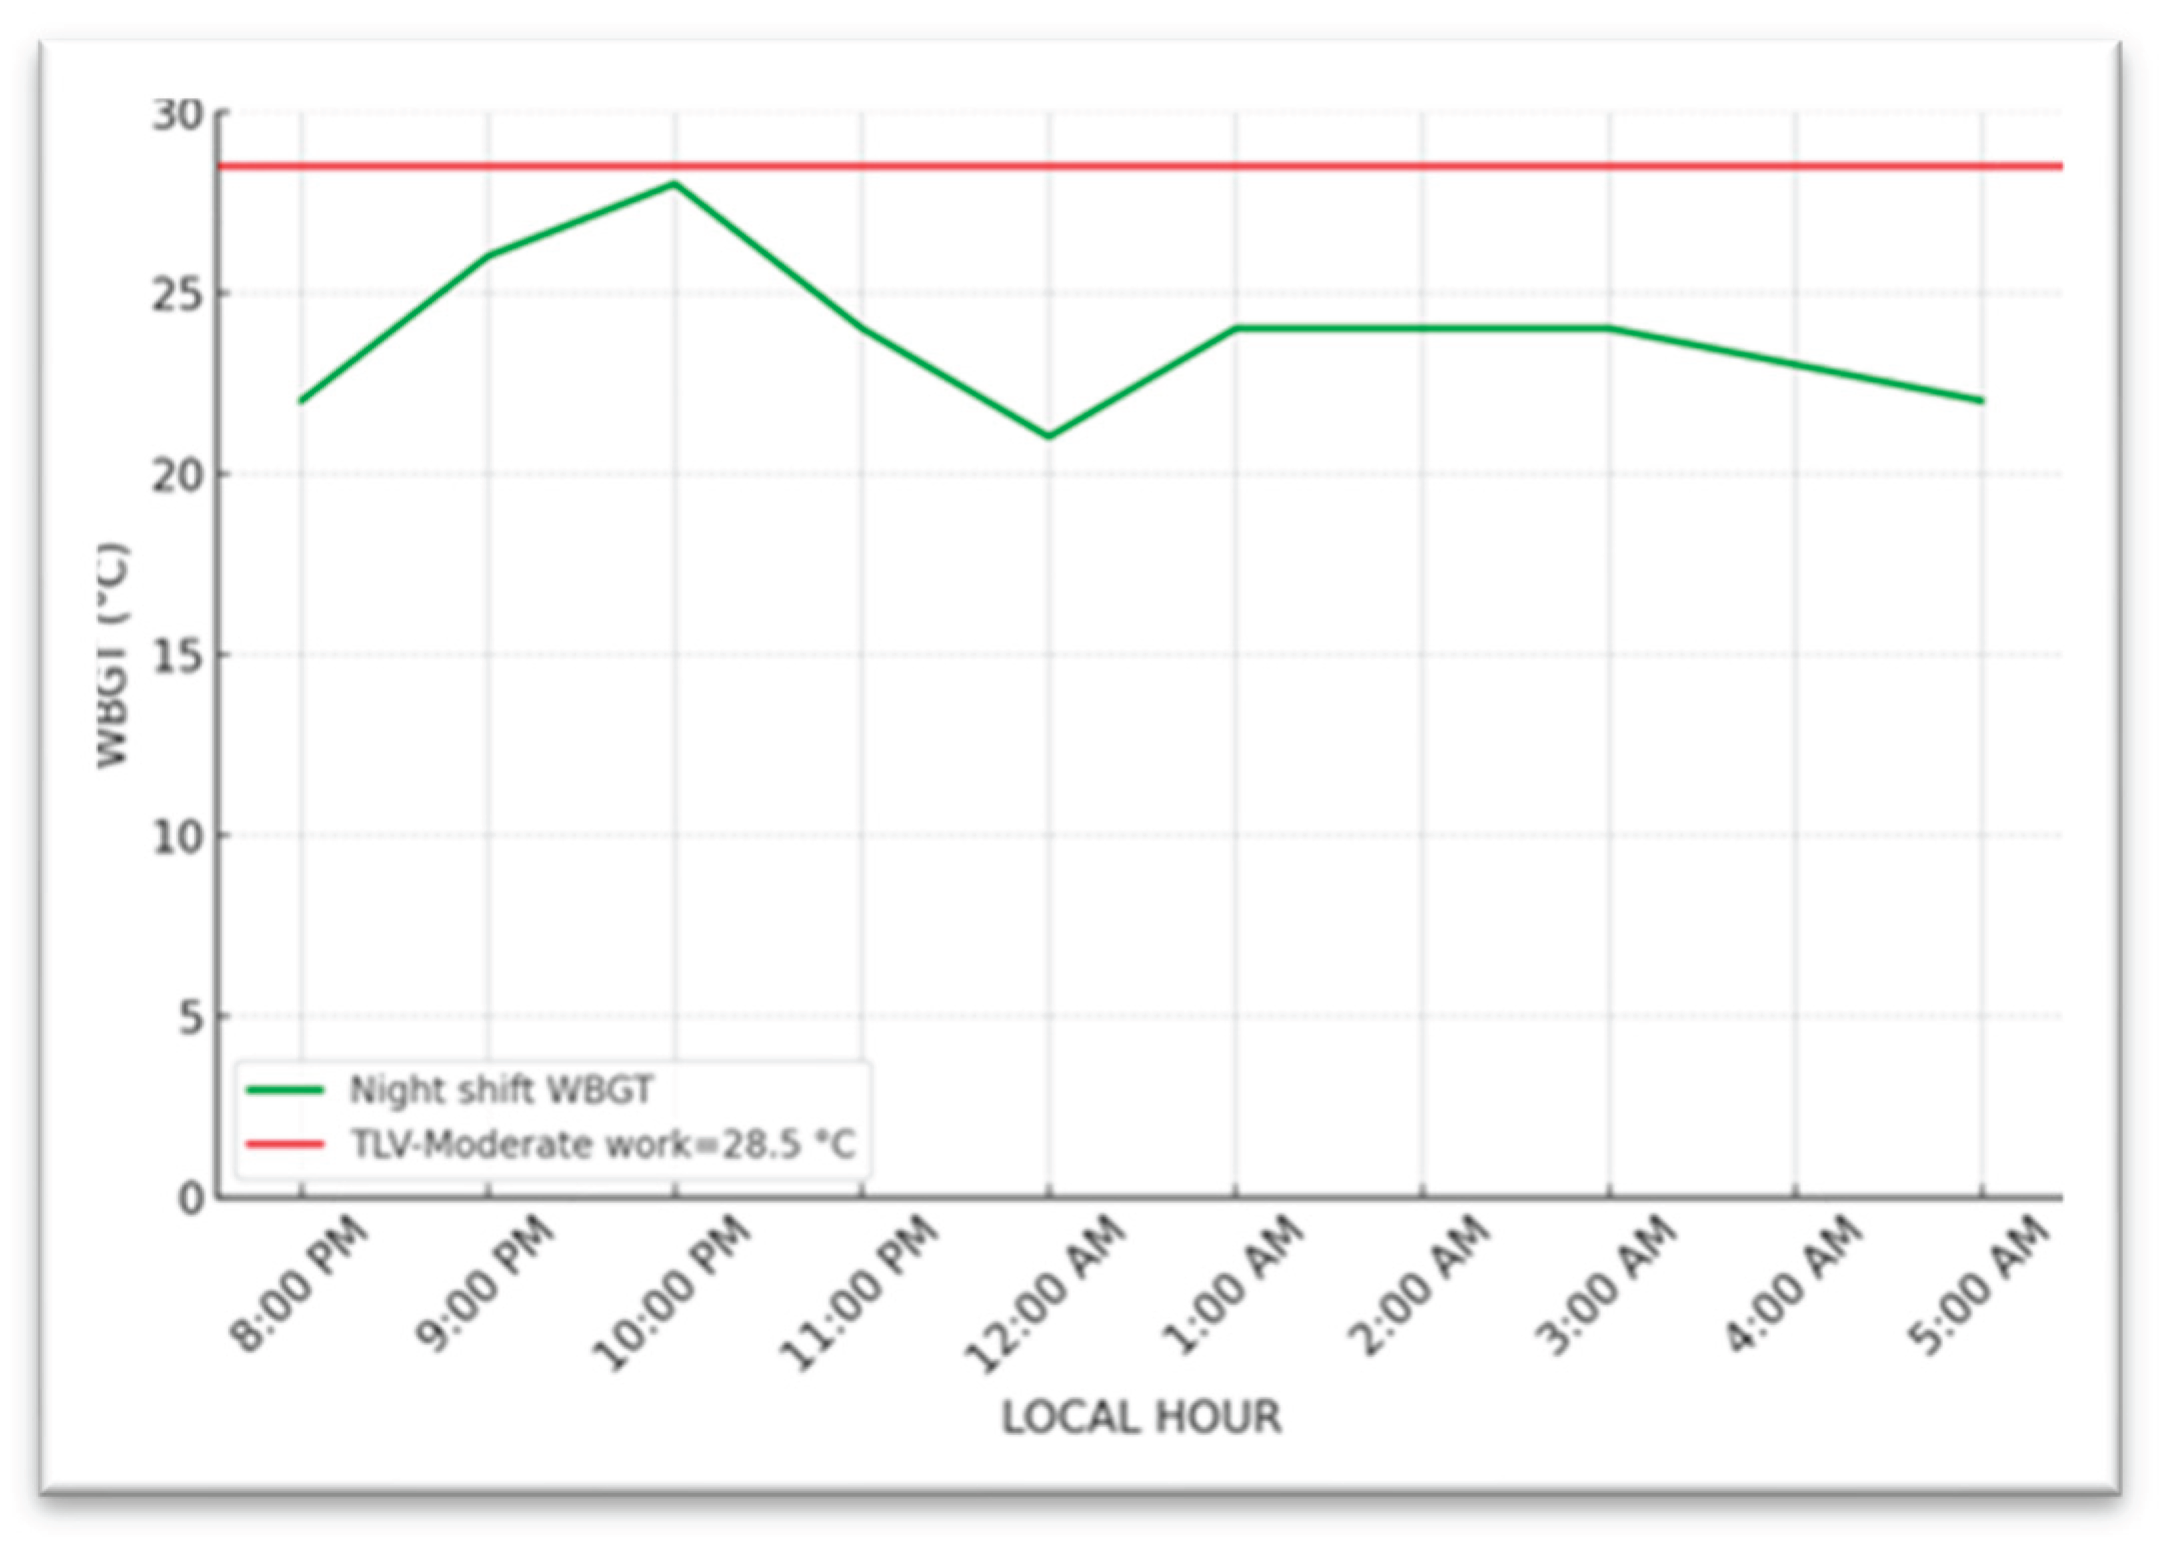

Table 1.
Sociodemographic characteristics of respondents.
|
Variables |
Categories |
Work centers |
P-value |
|
|---|---|---|---|---|
| Injera baking N(%) |
Local market |
|||
| Age category | 20-34 | 55 (35.7%) | 55 (35.5%) |
0.3 |
| 35-44 | 69 (44.8%) | 59 (38%) | ||
| 45-60 | 30 (19.5%) | 41 (26.5%) | ||
| Educational Level | No formal education | 42 (27.3%) | 40 (25.8%) |
0.05 |
| Primary education | 110 (55.2%) | 70 (45.2%) | ||
| Secondary and above | 27 (17.5%) | 45 (29.0%) | ||
| Marital Status | Single | 9 (5.8%) | 17 (11%) |
0.11 |
| Married | 120 (77.9%) | 106 (68.4%) | ||
| Divorced | 17 (11%) | 16 (10.3%) | ||
| Widowed | 8 (5.2%) | 16 (10.3%) | ||
Table 2.
Prevalence of self-reported Heat-Related Symptoms among study participants.
| Symptoms | Injera Baking | Local Market |
|---|---|---|
| Excessive Sweating | 132 (85.7%) | 44 (28.4%) |
| Fatigue/Exhaustion | 124 (80.5%) | 77 (49.7%) |
| Muscle Cramps | 66 (42.9%) | 11 (7.1%) |
| Headache | 71 (46.1%) | 19 (12.3%) |
| Nausea/Vomiting | 53 (34.4%) | 13 (8.4%) |
| Dizziness | 24 (15.6%) | 15 (9.7%) |
| Rapid Heartbeat | 41 (26.6%) | 10 (6.5%) |
| Confusion | 21 (13.6%) | 2 (1.3%) |
| Fainting | 10 (6.5%) | - |
Table 3.
Summary of Multivariable Logistic Regression analysis of HRI among study participants.1Ethiopian Birr; *statistically significant at p < 0.05; in multivariable analysis. 1.00 = reference value.
Table 3.
Summary of Multivariable Logistic Regression analysis of HRI among study participants.1Ethiopian Birr; *statistically significant at p < 0.05; in multivariable analysis. 1.00 = reference value.
|
Variables |
Category |
HRIs (%) |
COR (95% CI) |
AOR (CI=95%) |
P-value | |
|---|---|---|---|---|---|---|
| Yes | No | |||||
| Work group | Injera Baking Center | 71 (46.1%) | 83 (53.9%) | 7.98 (4.30-14.84) | 13.2 (3.4-50.7) |
<0.01* |
| Local Market Center | 15 (9.7%) | 140 (90.3%) | 1.00 | 1.00 | ||
| Educational level | No formal education | 24 (29.3%) | 58 (70.7%) | 2.30 (1.03-5.10) | 1.4 (0.5-3.8) |
0.24 |
| Primary education | 51 (32.9%) | 104 (67.1%) | 2.72 (1.318-5.610) | 2.1 (0.85-5.00) | ||
| Secondary education and above | 11 (15.3%) | 61 (84.7% | 1.00 | 1.00 | ||
| Monthly income (ETB1) | <=2,000 | 5 (10.4%) | 43 (89.6%) | 1.07 (0.305-3.73) | 1.5 (0.4-5.5) |
0.83 |
| 2,001-3,000 | 75 (37.5%) | 125 (62.5%) | 5.50 (2.26-13.39) | 1.3 (0.33-5.38) | ||
| >=3,000 | 6 (9.8%) | 55 (90.2%) | 1.00 | 1.00 | ||
| Type of work | Moderate work | 27 (15.4%) | 148 (84.6%) | 1.00 | 1.00 | 0.11 |
| Heavy work | 59 (44.0%) | 75 (56.0%) | 5.91 (3.32-10.54) | 1.9 (0.867-4.2) | ||
| Working hours per day | <=8hr | 17 (18.5%) | 75 (81.5%) | 1.00 | 1.00 |
0.53 |
| >8hr | 69 (31.8%) | 148 (68.2%) | 2.06 (1.13-3.74) | 0.8 (0.35-1.7) | ||
| Availability of Cooling fans | Yes | 14 (19.7%) | 57 (80.3%) | 1.00 | 1.00 |
0.47 |
| No | 72 (30.3%) | 166 (69.7%) | 1.77 (0.93-3.37) | 1.5 (0.51-4.30) | ||
| drinking water access | Yes | 15 (12.4%) | 106 (87.6%) | 1.00 |
0.002* |
|
| No | 71(37.8%) | 117 (62.2%) | 4.29 (2.32-7.94) | 4.3 (1.69-10.9) | ||
| Availability of sufficient break time | Yes | 16 (14.2%) | 97 (85.8%) | 1.00 | 1.00 |
0.003* |
| No | 70 (35.7%) | 126 (64.3%) | 3.37 (1.84-6.16) | 3.5 (1.5-8.13) | ||
| Availability of a cooler work site | Yes | 8 (10.0%) | 72 (90.0%) | 1.00 | 1.00 |
0.156 |
| No | 78 (34.1%) | 151 (65.9%) | 4.65 (2.13-10.14) | 0.5 (0.17-1.33) | ||
| Work Clothing | Thin breathable cloth | 57 (22.1%) | 201 (77.9%) | 1.00 | 1.00 |
0.65 |
| Thick cloth | 29 (56.9%) | 22 (43.1%) | 4.65 (2.48-8.71) | 1.2 (0.51-2.98) | ||
| Water intake per day | <3 Liter | 8 (15.7%) | 43 (84.3%) | 2.33 (1.05-5.18) | 3.9 (1.55-9.73) |
0.004* |
| >=3 Liter | 78 (30.2%) | 180 (69.8%) | 1.00 | 1.00 | ||
Disclaimer/Publisher’s Note: The statements, opinions and data contained in all publications are solely those of the individual author(s) and contributor(s) and not of MDPI and/or the editor(s). MDPI and/or the editor(s) disclaim responsibility for any injury to people or property resulting from any ideas, methods, instructions or products referred to in the content. |
© 2025 by the authors. Licensee MDPI, Basel, Switzerland. This article is an open access article distributed under the terms and conditions of the Creative Commons Attribution (CC BY) license (http://creativecommons.org/licenses/by/4.0/).
Copyright: This open access article is published under a Creative Commons CC BY 4.0 license, which permit the free download, distribution, and reuse, provided that the author and preprint are cited in any reuse.


